Liberty, UT Map & Demographics
Liberty Map
Liberty Overview
$35,450
PER CAPITA INCOME
$125,429
AVG FAMILY INCOME
$114,423
AVG HOUSEHOLD INCOME
0.42
INEQUALITY / GINI INDEX
1,216
TOTAL POPULATION
588
MALE POPULATION
628
FEMALE POPULATION
93.63
MALES / 100 FEMALES
106.80
FEMALES / 100 MALES
37.4
MEDIAN AGE
3.8
AVG FAMILY SIZE
3.2
AVG HOUSEHOLD SIZE
589
LABOR FORCE [ PEOPLE ]
72.6%
PERCENT IN LABOR FORCE
Liberty Area Codes
Income in Liberty
Income Overview in Liberty
Per Capita Income in Liberty is $35,450, while median incomes of families and households are $125,429 and $114,423 respectively.
| Characteristic | Number | Measure |
| Per Capita Income | 1,216 | $35,450 |
| Median Family Income | 296 | $125,429 |
| Mean Family Income | 296 | $136,230 |
| Median Household Income | 368 | $114,423 |
| Mean Household Income | 368 | $114,363 |
| Income Deficit | 296 | $0 |
| Wage / Income Gap (%) | 1,216 | 0.00% |
| Wage / Income Gap ($) | 1,216 | 100.00¢ per $1 |
| Gini / Inequality Index | 1,216 | 0.42 |
Earnings by Sex in Liberty
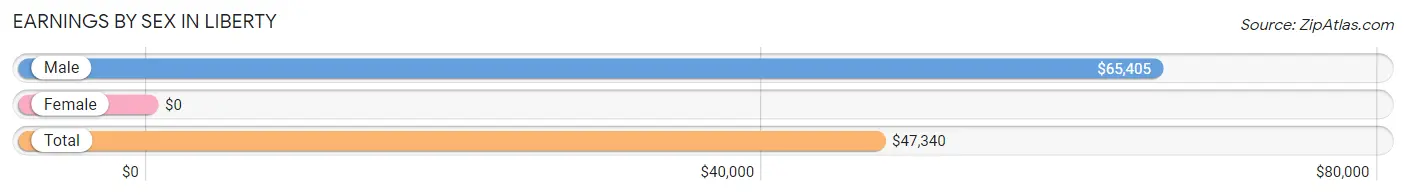
| Sex | Number | Average Earnings |
| Male | 378 (61.7%) | $65,405 |
| Female | 235 (38.3%) | $0 |
| Total | 613 (100.0%) | $47,340 |
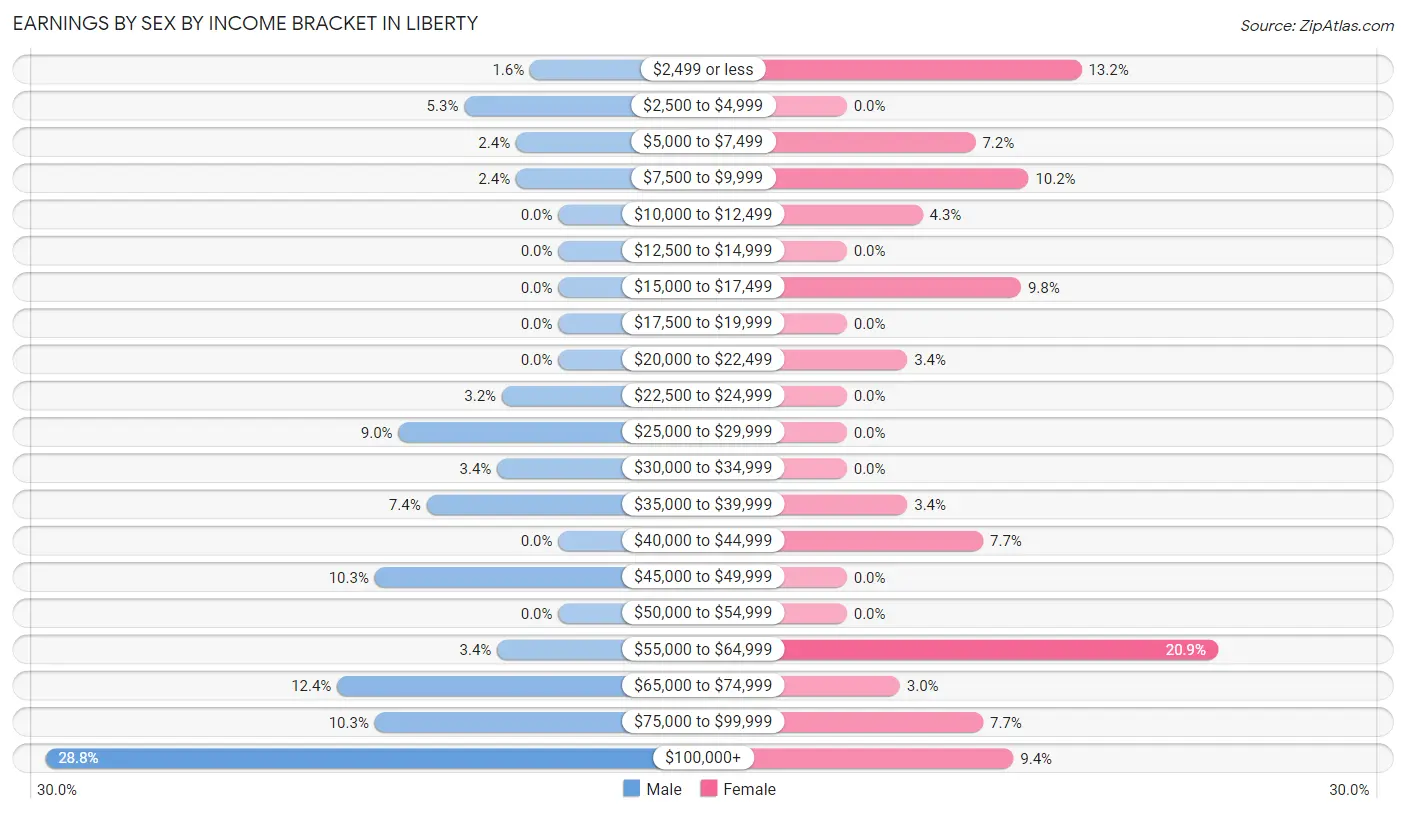
Earnings by Sex by Income Bracket in Liberty
The most common earnings brackets in Liberty are $100,000+ for men (109 | 28.8%) and $55,000 to $64,999 for women (49 | 20.8%).
| Income | Male | Female |
| $2,499 or less | 6 (1.6%) | 31 (13.2%) |
| $2,500 to $4,999 | 20 (5.3%) | 0 (0.0%) |
| $5,000 to $7,499 | 9 (2.4%) | 17 (7.2%) |
| $7,500 to $9,999 | 9 (2.4%) | 24 (10.2%) |
| $10,000 to $12,499 | 0 (0.0%) | 10 (4.3%) |
| $12,500 to $14,999 | 0 (0.0%) | 0 (0.0%) |
| $15,000 to $17,499 | 0 (0.0%) | 23 (9.8%) |
| $17,500 to $19,999 | 0 (0.0%) | 0 (0.0%) |
| $20,000 to $22,499 | 0 (0.0%) | 8 (3.4%) |
| $22,500 to $24,999 | 12 (3.2%) | 0 (0.0%) |
| $25,000 to $29,999 | 34 (9.0%) | 0 (0.0%) |
| $30,000 to $34,999 | 13 (3.4%) | 0 (0.0%) |
| $35,000 to $39,999 | 28 (7.4%) | 8 (3.4%) |
| $40,000 to $44,999 | 0 (0.0%) | 18 (7.7%) |
| $45,000 to $49,999 | 39 (10.3%) | 0 (0.0%) |
| $50,000 to $54,999 | 0 (0.0%) | 0 (0.0%) |
| $55,000 to $64,999 | 13 (3.4%) | 49 (20.8%) |
| $65,000 to $74,999 | 47 (12.4%) | 7 (3.0%) |
| $75,000 to $99,999 | 39 (10.3%) | 18 (7.7%) |
| $100,000+ | 109 (28.8%) | 22 (9.4%) |
| Total | 378 (100.0%) | 235 (100.0%) |
Earnings by Sex by Educational Attainment in Liberty
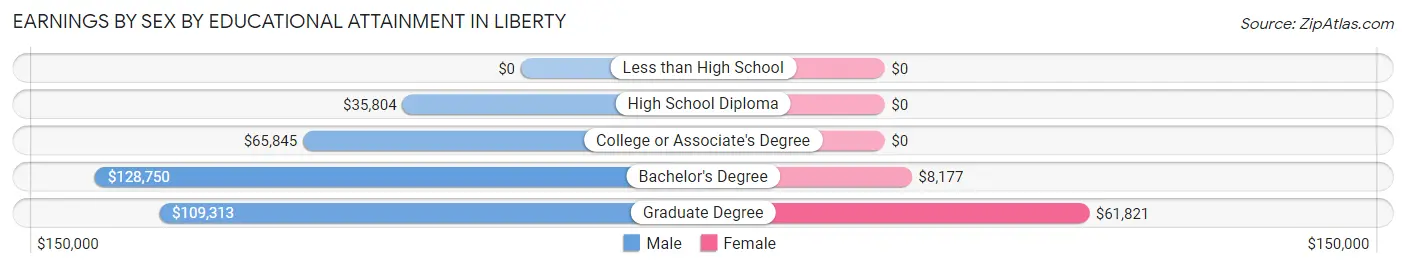
| Educational Attainment | Male Income | Female Income |
| Less than High School | - | - |
| High School Diploma | $35,804 | $0 |
| College or Associate's Degree | $65,845 | $0 |
| Bachelor's Degree | $128,750 | $8,177 |
| Graduate Degree | $109,313 | $61,821 |
| Total | $66,149 | $0 |
Family Income in Liberty
Family Income Brackets in Liberty
According to the Liberty family income data, there are 128 families falling into the $100,000 to $149,999 income range, which is the most common income bracket and makes up 43.2% of all families.
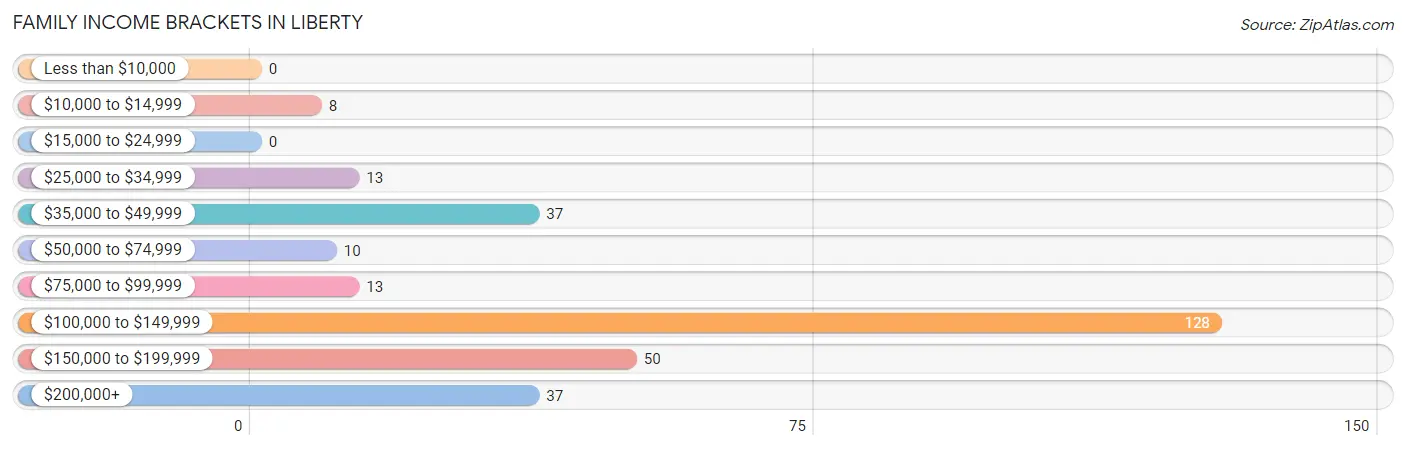
| Income Bracket | # Families | % Families |
| Less than $10,000 | 0 | 0.0% |
| $10,000 to $14,999 | 8 | 2.7% |
| $15,000 to $24,999 | 0 | 0.0% |
| $25,000 to $34,999 | 13 | 4.4% |
| $35,000 to $49,999 | 37 | 12.5% |
| $50,000 to $74,999 | 10 | 3.4% |
| $75,000 to $99,999 | 13 | 4.4% |
| $100,000 to $149,999 | 128 | 43.2% |
| $150,000 to $199,999 | 50 | 16.9% |
| $200,000+ | 37 | 12.5% |
Family Income by Famaliy Size in Liberty
3-person families (36 | 12.2%) account for the highest median family income in Liberty with $217,500 per family, while 3-person families (36 | 12.2%) have the highest median income of $72,500 per family member.
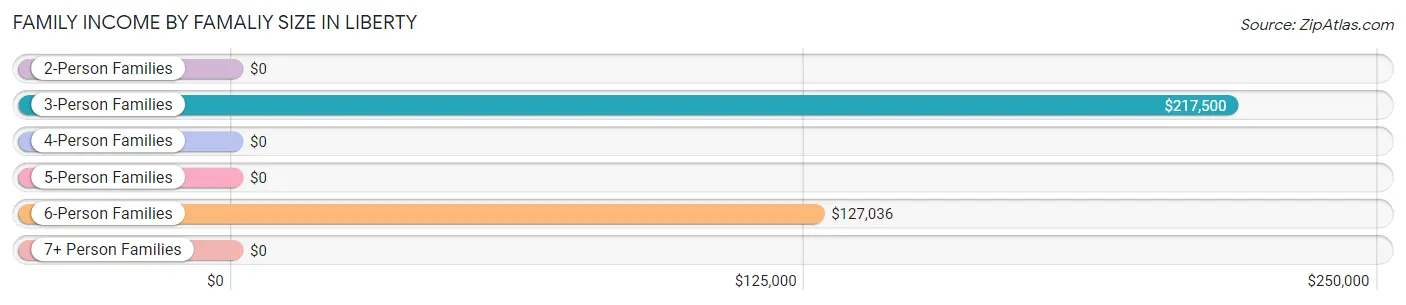
| Income Bracket | # Families | Median Income |
| 2-Person Families | 134 (45.3%) | $0 |
| 3-Person Families | 36 (12.2%) | $217,500 |
| 4-Person Families | 14 (4.7%) | $0 |
| 5-Person Families | 22 (7.4%) | $0 |
| 6-Person Families | 57 (19.3%) | $127,036 |
| 7+ Person Families | 33 (11.2%) | $0 |
| Total | 296 (100.0%) | $125,429 |
Family Income by Number of Earners in Liberty
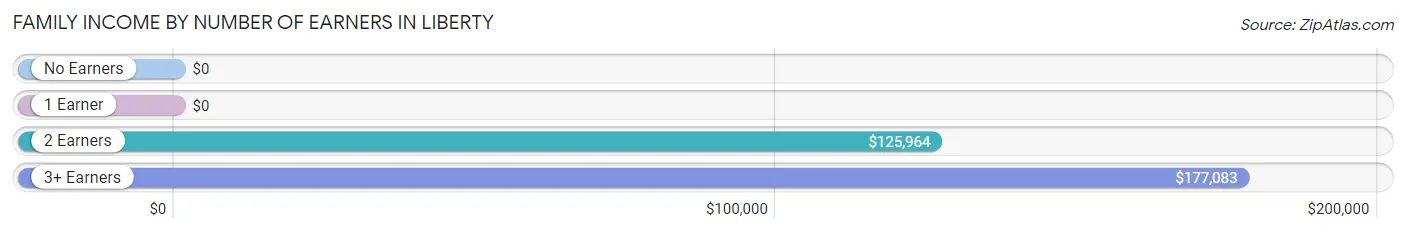
| Number of Earners | # Families | Median Income |
| No Earners | 8 (2.7%) | $0 |
| 1 Earner | 92 (31.1%) | $0 |
| 2 Earners | 153 (51.7%) | $125,964 |
| 3+ Earners | 43 (14.5%) | $177,083 |
| Total | 296 (100.0%) | $125,429 |
Household Income in Liberty
Household Income Brackets in Liberty
With 128 households falling in the category, the $100,000 to $149,999 income range is the most frequent in Liberty, accounting for 34.8% of all households.
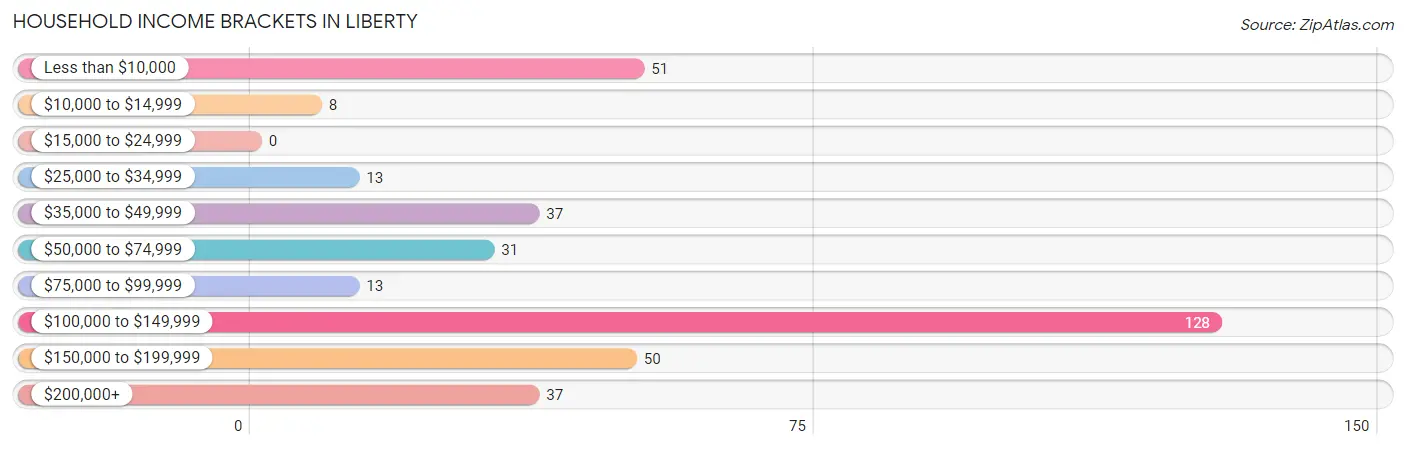
| Income Bracket | # Households | % Households |
| Less than $10,000 | 51 | 13.9% |
| $10,000 to $14,999 | 8 | 2.2% |
| $15,000 to $24,999 | 0 | 0.0% |
| $25,000 to $34,999 | 13 | 3.5% |
| $35,000 to $49,999 | 37 | 10.1% |
| $50,000 to $74,999 | 31 | 8.4% |
| $75,000 to $99,999 | 13 | 3.5% |
| $100,000 to $149,999 | 128 | 34.8% |
| $150,000 to $199,999 | 50 | 13.6% |
| $200,000+ | 37 | 10.1% |
Household Income by Householder Age in Liberty
The median household income in Liberty is $114,423, with the highest median household income of $141,518 found in the 45 to 64 years age bracket for the primary householder. A total of 177 households (48.1%) fall into this category.
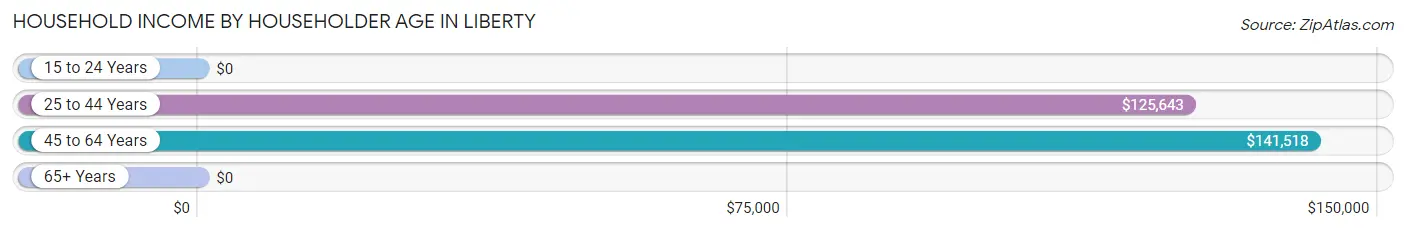
| Income Bracket | # Households | Median Income |
| 15 to 24 Years | 0 (0.0%) | $0 |
| 25 to 44 Years | 110 (29.9%) | $125,643 |
| 45 to 64 Years | 177 (48.1%) | $141,518 |
| 65+ Years | 81 (22.0%) | $0 |
| Total | 368 (100.0%) | $114,423 |
Poverty in Liberty
Income Below Poverty by Sex and Age in Liberty
With 4.8% poverty level for males and 9.5% for females among the residents of Liberty, 65 to 74 year old males and 65 to 74 year old females are the most vulnerable to poverty, with 8 males (100.0%) and 59 females (70.2%) in their respective age groups living below the poverty level.
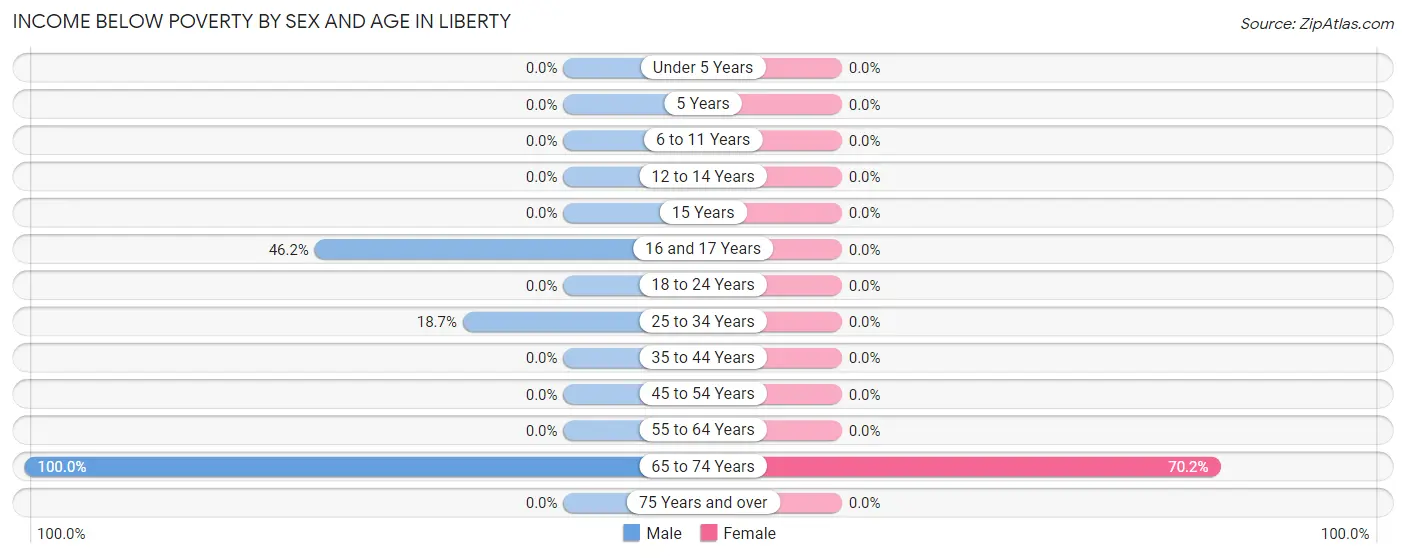
| Age Bracket | Male | Female |
| Under 5 Years | 0 (0.0%) | 0 (0.0%) |
| 5 Years | 0 (0.0%) | 0 (0.0%) |
| 6 to 11 Years | 0 (0.0%) | 0 (0.0%) |
| 12 to 14 Years | 0 (0.0%) | 0 (0.0%) |
| 15 Years | 0 (0.0%) | 0 (0.0%) |
| 16 and 17 Years | 6 (46.2%) | 0 (0.0%) |
| 18 to 24 Years | 0 (0.0%) | 0 (0.0%) |
| 25 to 34 Years | 14 (18.7%) | 0 (0.0%) |
| 35 to 44 Years | 0 (0.0%) | 0 (0.0%) |
| 45 to 54 Years | 0 (0.0%) | 0 (0.0%) |
| 55 to 64 Years | 0 (0.0%) | 0 (0.0%) |
| 65 to 74 Years | 8 (100.0%) | 59 (70.2%) |
| 75 Years and over | 0 (0.0%) | 0 (0.0%) |
| Total | 28 (4.8%) | 59 (9.5%) |
Income Above Poverty by Sex and Age in Liberty
According to the poverty statistics in Liberty, males aged under 5 years and females aged under 5 years are the age groups that are most secure financially, with 100.0% of males and 100.0% of females in these age groups living above the poverty line.
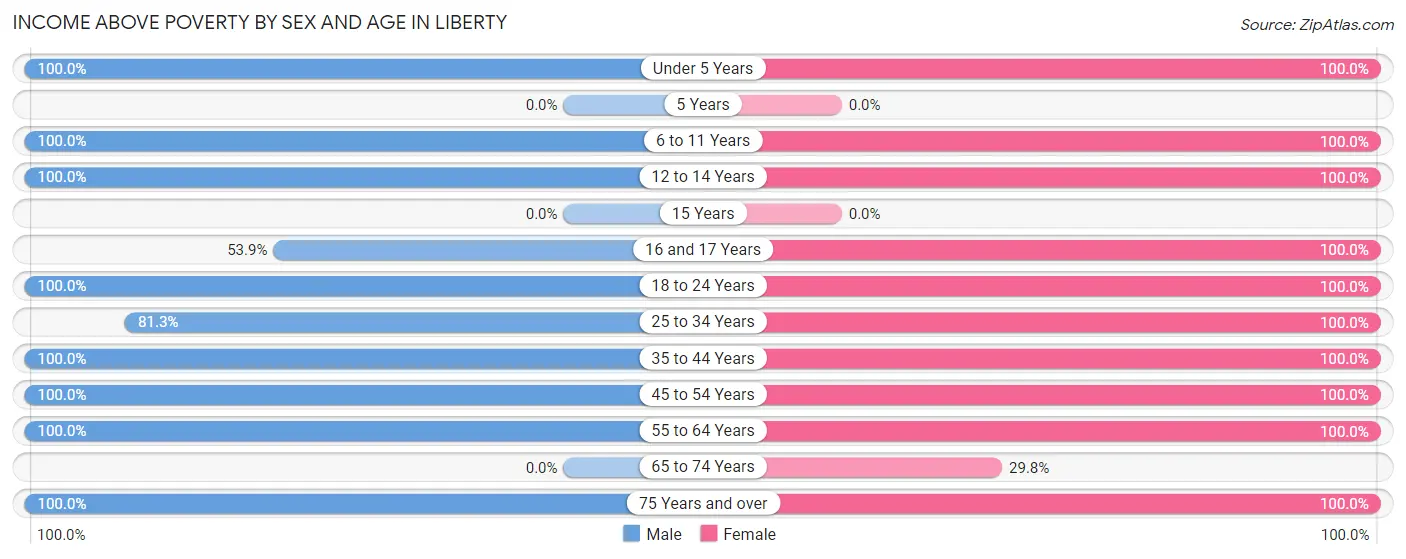
| Age Bracket | Male | Female |
| Under 5 Years | 46 (100.0%) | 31 (100.0%) |
| 5 Years | 0 (0.0%) | 0 (0.0%) |
| 6 to 11 Years | 88 (100.0%) | 153 (100.0%) |
| 12 to 14 Years | 42 (100.0%) | 39 (100.0%) |
| 15 Years | 0 (0.0%) | 0 (0.0%) |
| 16 and 17 Years | 7 (53.8%) | 10 (100.0%) |
| 18 to 24 Years | 9 (100.0%) | 16 (100.0%) |
| 25 to 34 Years | 61 (81.3%) | 21 (100.0%) |
| 35 to 44 Years | 109 (100.0%) | 143 (100.0%) |
| 45 to 54 Years | 65 (100.0%) | 25 (100.0%) |
| 55 to 64 Years | 120 (100.0%) | 86 (100.0%) |
| 65 to 74 Years | 0 (0.0%) | 25 (29.8%) |
| 75 Years and over | 13 (100.0%) | 14 (100.0%) |
| Total | 560 (95.2%) | 563 (90.5%) |
Income Below Poverty Among Married-Couple Families in Liberty
The poverty statistics for married-couple families in Liberty show that 2.8% or 8 of the total 283 families live below the poverty line. Families with no children have the highest poverty rate of 5.4%, comprising of 8 families. On the other hand, families with 1 or 2 children have the lowest poverty rate of 0.0%, which includes 0 families.
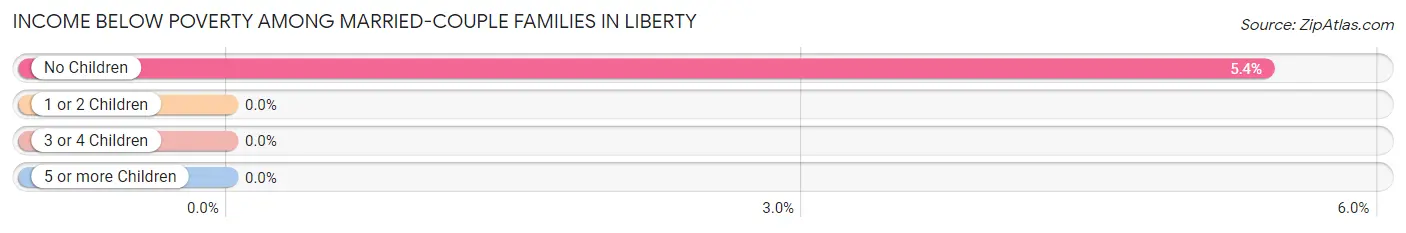
| Children | Above Poverty | Below Poverty |
| No Children | 140 (94.6%) | 8 (5.4%) |
| 1 or 2 Children | 32 (100.0%) | 0 (0.0%) |
| 3 or 4 Children | 70 (100.0%) | 0 (0.0%) |
| 5 or more Children | 33 (100.0%) | 0 (0.0%) |
| Total | 275 (97.2%) | 8 (2.8%) |
Income Below Poverty Among Single-Parent Households in Liberty
| Children | Single Father | Single Mother |
| No Children | 0 (0.0%) | 0 (0.0%) |
| 1 or 2 Children | 0 (0.0%) | 0 (0.0%) |
| 3 or 4 Children | 0 (0.0%) | 0 (0.0%) |
| 5 or more Children | 0 (0.0%) | 0 (0.0%) |
| Total | 0 (0.0%) | 0 (0.0%) |
Income Below Poverty Among Married-Couple vs Single-Parent Households in Liberty
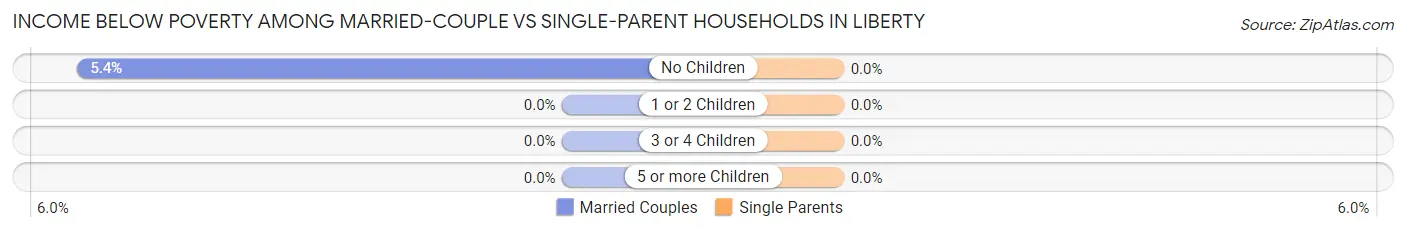
| Children | Married-Couple Families | Single-Parent Households |
| No Children | 8 (5.4%) | 0 (0.0%) |
| 1 or 2 Children | 0 (0.0%) | 0 (0.0%) |
| 3 or 4 Children | 0 (0.0%) | 0 (0.0%) |
| 5 or more Children | 0 (0.0%) | 0 (0.0%) |
| Total | 8 (2.8%) | 0 (0.0%) |
Race in Liberty
The most populous races in Liberty are White / Caucasian (1,172 | 96.4%), Hispanic or Latino (57 | 4.7%), and Asian (37 | 3.0%).
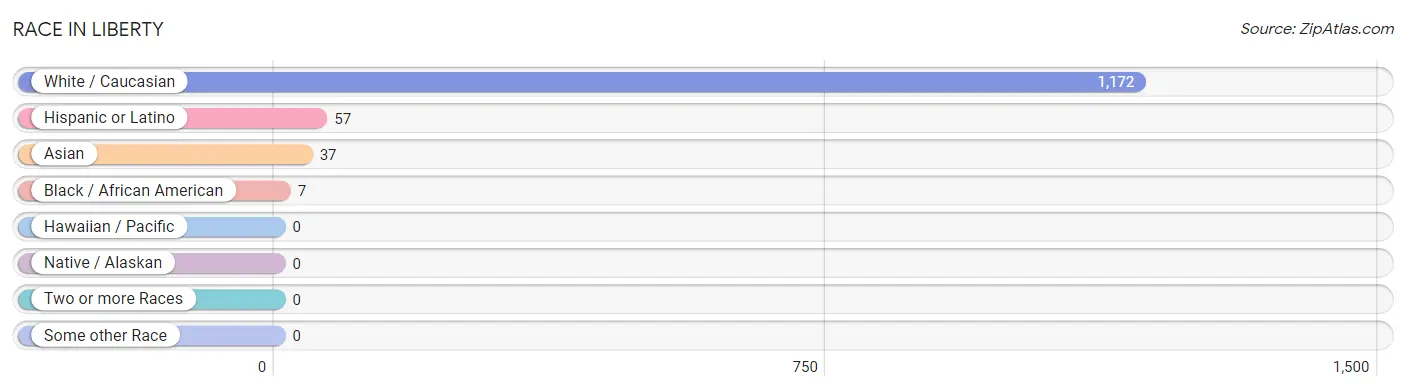
| Race | # Population | % Population |
| Asian | 37 | 3.0% |
| Black / African American | 7 | 0.6% |
| Hawaiian / Pacific | 0 | 0.0% |
| Hispanic or Latino | 57 | 4.7% |
| Native / Alaskan | 0 | 0.0% |
| White / Caucasian | 1,172 | 96.4% |
| Two or more Races | 0 | 0.0% |
| Some other Race | 0 | 0.0% |
| Total | 1,216 | 100.0% |
Ancestry in Liberty
The most populous ancestries reported in Liberty are English (579 | 47.6%), German (284 | 23.4%), Irish (245 | 20.2%), Italian (146 | 12.0%), and European (94 | 7.7%), together accounting for 110.9% of all Liberty residents.
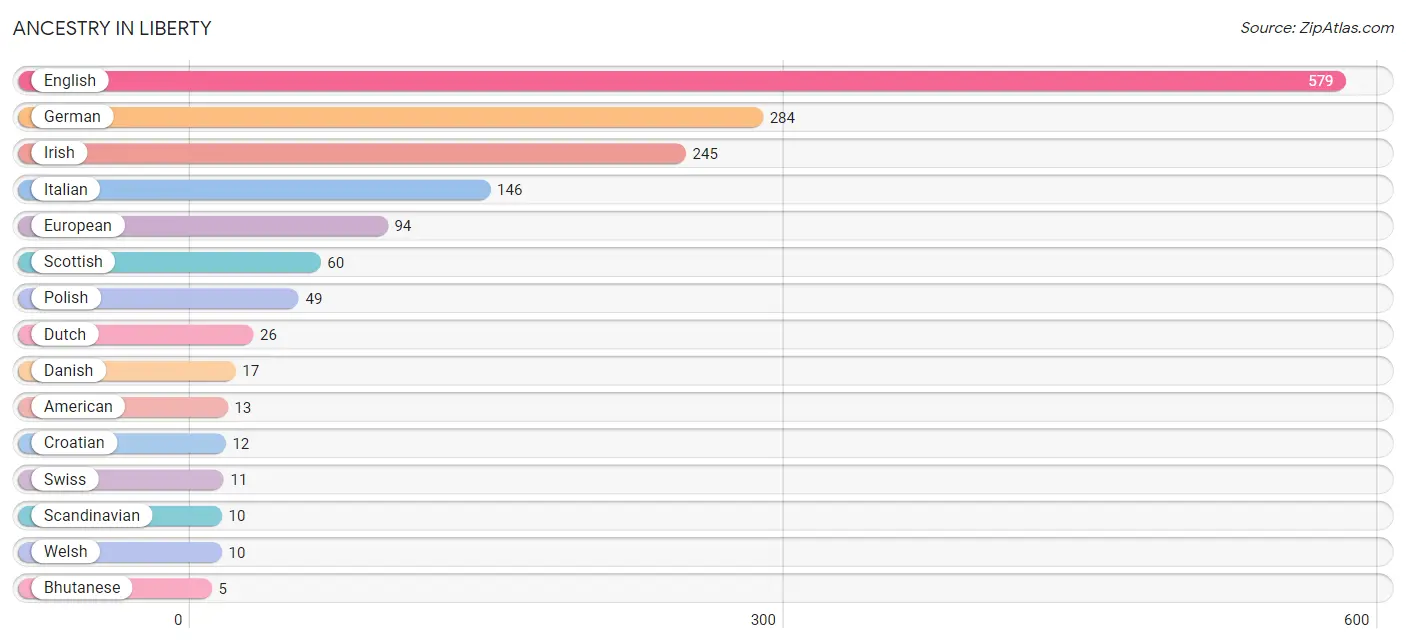
| Ancestry | # Population | % Population |
| American | 13 | 1.1% |
| Bhutanese | 5 | 0.4% |
| Croatian | 12 | 1.0% |
| Danish | 17 | 1.4% |
| Dutch | 26 | 2.1% |
| English | 579 | 47.6% |
| European | 94 | 7.7% |
| German | 284 | 23.4% |
| Irish | 245 | 20.2% |
| Italian | 146 | 12.0% |
| Polish | 49 | 4.0% |
| Scandinavian | 10 | 0.8% |
| Scottish | 60 | 4.9% |
| Swiss | 11 | 0.9% |
| Welsh | 10 | 0.8% | View All 15 Rows |
Immigrants in Liberty
The most numerous immigrant groups reported in Liberty came from Asia (32 | 2.6%), Kazakhstan (32 | 2.6%), and South Central Asia (32 | 2.6%), together accounting for 7.9% of all Liberty residents.
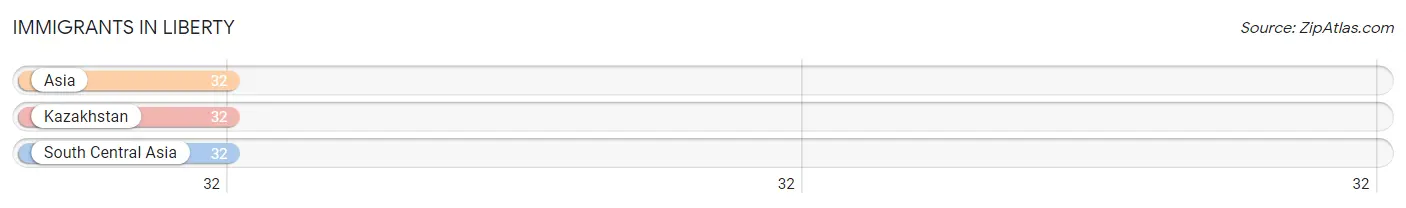
| Immigration Origin | # Population | % Population |
| Asia | 32 | 2.6% |
| Kazakhstan | 32 | 2.6% |
| South Central Asia | 32 | 2.6% | View All 3 Rows |
Sex and Age in Liberty
Sex and Age in Liberty
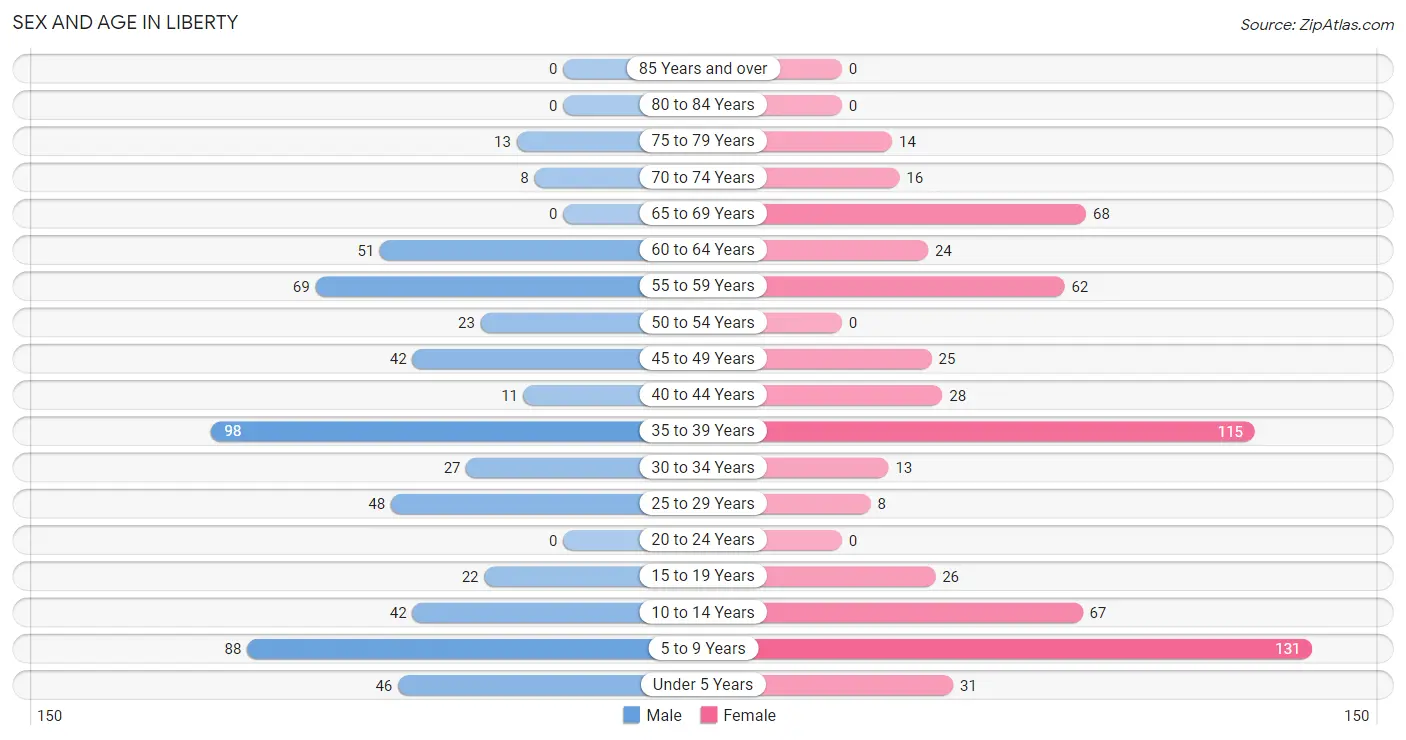
The most populous age groups in Liberty are 35 to 39 Years (98 | 16.7%) for men and 5 to 9 Years (131 | 20.9%) for women.
| Age Bracket | Male | Female |
| Under 5 Years | 46 (7.8%) | 31 (4.9%) |
| 5 to 9 Years | 88 (15.0%) | 131 (20.9%) |
| 10 to 14 Years | 42 (7.1%) | 67 (10.7%) |
| 15 to 19 Years | 22 (3.7%) | 26 (4.1%) |
| 20 to 24 Years | 0 (0.0%) | 0 (0.0%) |
| 25 to 29 Years | 48 (8.2%) | 8 (1.3%) |
| 30 to 34 Years | 27 (4.6%) | 13 (2.1%) |
| 35 to 39 Years | 98 (16.7%) | 115 (18.3%) |
| 40 to 44 Years | 11 (1.9%) | 28 (4.5%) |
| 45 to 49 Years | 42 (7.1%) | 25 (4.0%) |
| 50 to 54 Years | 23 (3.9%) | 0 (0.0%) |
| 55 to 59 Years | 69 (11.7%) | 62 (9.9%) |
| 60 to 64 Years | 51 (8.7%) | 24 (3.8%) |
| 65 to 69 Years | 0 (0.0%) | 68 (10.8%) |
| 70 to 74 Years | 8 (1.4%) | 16 (2.5%) |
| 75 to 79 Years | 13 (2.2%) | 14 (2.2%) |
| 80 to 84 Years | 0 (0.0%) | 0 (0.0%) |
| 85 Years and over | 0 (0.0%) | 0 (0.0%) |
| Total | 588 (100.0%) | 628 (100.0%) |
Families and Households in Liberty
Median Family Size in Liberty
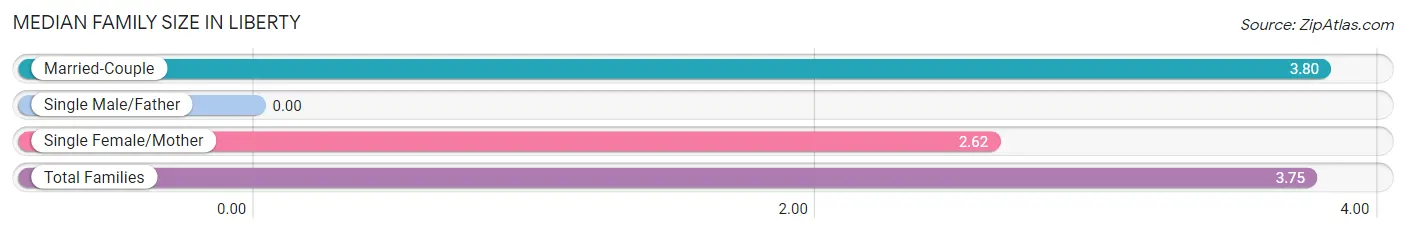
| Family Type | # Families | Family Size |
| Married-Couple | 283 (95.6%) | 3.80 |
| Single Male/Father | 0 (0.0%) | - |
| Single Female/Mother | 13 (4.4%) | 2.62 |
| Total Families | 296 (100.0%) | 3.75 |
Median Household Size in Liberty
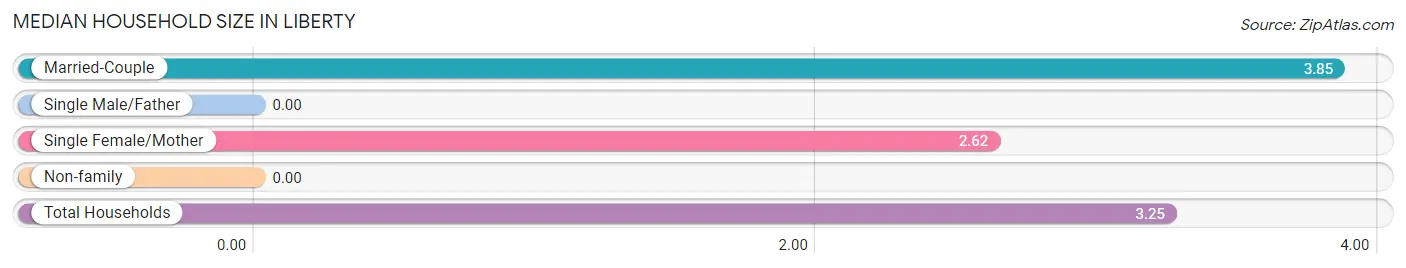
| Household Type | # Households | Household Size |
| Married-Couple | 283 (76.9%) | 3.85 |
| Single Male/Father | 0 (0.0%) | - |
| Single Female/Mother | 13 (3.5%) | 2.62 |
| Non-family | 72 (19.6%) | - |
| Total Households | 368 (100.0%) | 3.25 |
Household Size by Marriage Status in Liberty
Out of a total of 368 households in Liberty, 296 (80.4%) are family households, while 72 (19.6%) are nonfamily households. The most numerous type of family households are 2-person households, comprising 127, and the most common type of nonfamily households are 1-person households, comprising 72.
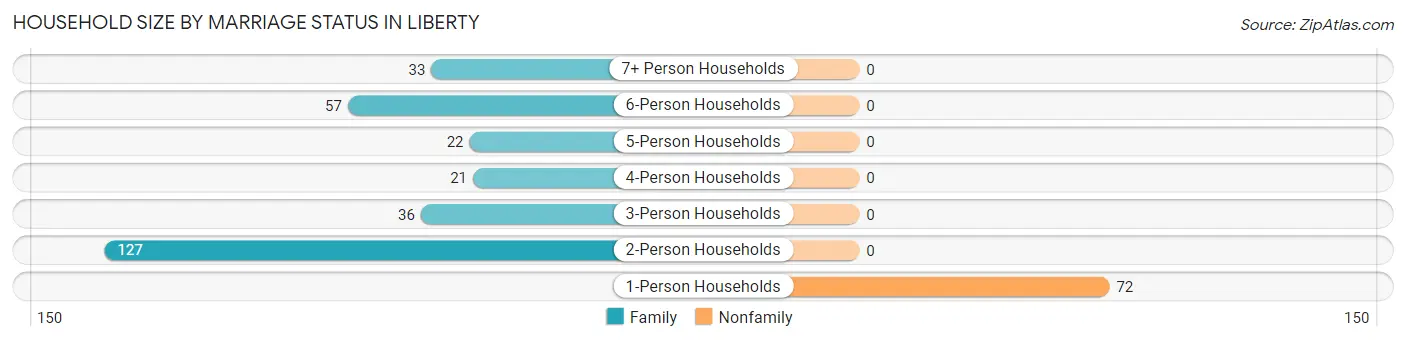
| Household Size | Family Households | Nonfamily Households |
| 1-Person Households | - | 72 (19.6%) |
| 2-Person Households | 127 (34.5%) | 0 (0.0%) |
| 3-Person Households | 36 (9.8%) | 0 (0.0%) |
| 4-Person Households | 21 (5.7%) | 0 (0.0%) |
| 5-Person Households | 22 (6.0%) | 0 (0.0%) |
| 6-Person Households | 57 (15.5%) | 0 (0.0%) |
| 7+ Person Households | 33 (9.0%) | 0 (0.0%) |
| Total | 296 (80.4%) | 72 (19.6%) |
Female Fertility in Liberty
Fertility by Age in Liberty
| Age Bracket | Women with Births | Births / 1,000 Women |
| 15 to 19 years | 0 (0.0%) | 0.0 |
| 20 to 34 years | 0 (0.0%) | 0.0 |
| 35 to 50 years | 0 (0.0%) | 0.0 |
| Total | 0 (0.0%) | 0.0 |
Fertility by Age by Marriage Status in Liberty
| Age Bracket | Married | Unmarried |
| 15 to 19 years | 0 (0.0%) | 0 (0.0%) |
| 20 to 34 years | 0 (0.0%) | 0 (0.0%) |
| 35 to 50 years | 0 (0.0%) | 0 (0.0%) |
| Total | 0 (0.0%) | 0 (0.0%) |
Fertility by Education in Liberty
| Educational Attainment | Women with Births | Births / 1,000 Women |
| Less than High School | 0 (0.0%) | 0.0 |
| High School Diploma | 0 (0.0%) | 0.0 |
| College or Associate's Degree | 0 (0.0%) | 0.0 |
| Bachelor's Degree | 0 (0.0%) | 0.0 |
| Graduate Degree | 0 (0.0%) | 0.0 |
| Total | 0 (0.0%) | 0.0 |
Fertility by Education by Marriage Status in Liberty
| Educational Attainment | Married | Unmarried |
| Less than High School | 0 (0.0%) | 0 (0.0%) |
| High School Diploma | 0 (0.0%) | 0 (0.0%) |
| College or Associate's Degree | 0 (0.0%) | 0 (0.0%) |
| Bachelor's Degree | 0 (0.0%) | 0 (0.0%) |
| Graduate Degree | 0 (0.0%) | 0 (0.0%) |
| Total | 0 (0.0%) | 0 (0.0%) |
Employment Characteristics in Liberty
Employment by Class of Employer in Liberty
Among the 544 employed individuals in Liberty, private company employees (251 | 46.1%), self-employed (not incorporated) (117 | 21.5%), and self-employed (incorporated) (50 | 9.2%) make up the most common classes of employment.
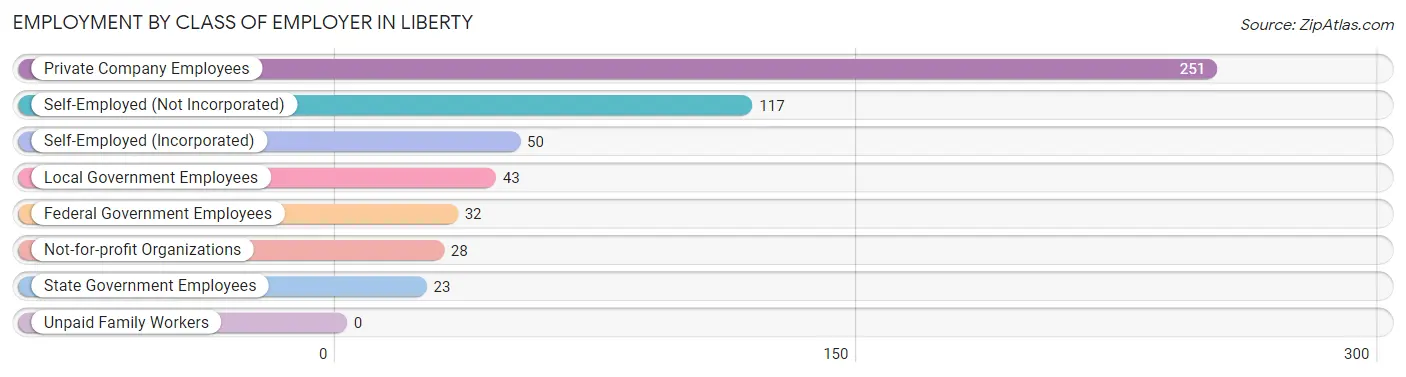
| Employer Class | # Employees | % Employees |
| Private Company Employees | 251 | 46.1% |
| Self-Employed (Incorporated) | 50 | 9.2% |
| Self-Employed (Not Incorporated) | 117 | 21.5% |
| Not-for-profit Organizations | 28 | 5.1% |
| Local Government Employees | 43 | 7.9% |
| State Government Employees | 23 | 4.2% |
| Federal Government Employees | 32 | 5.9% |
| Unpaid Family Workers | 0 | 0.0% |
| Total | 544 | 100.0% |
Employment Status by Age in Liberty
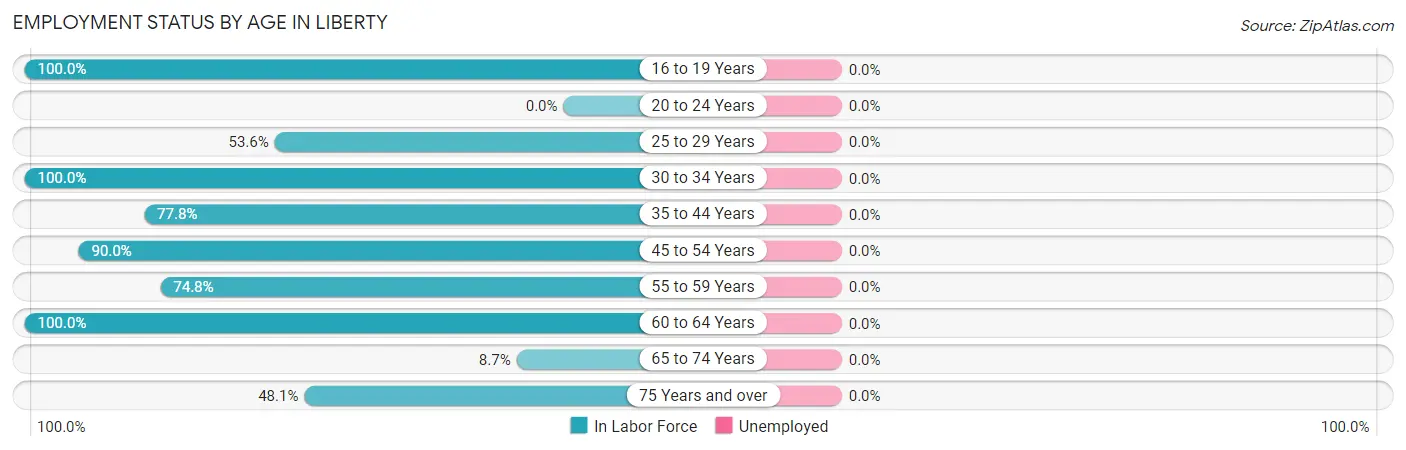
| Age Bracket | In Labor Force | Unemployed |
| 16 to 19 Years | 48 (100.0%) | 0 (0.0%) |
| 20 to 24 Years | 0 (0.0%) | 0 (0.0%) |
| 25 to 29 Years | 30 (53.6%) | 0 (0.0%) |
| 30 to 34 Years | 40 (100.0%) | 0 (0.0%) |
| 35 to 44 Years | 196 (77.8%) | 0 (0.0%) |
| 45 to 54 Years | 81 (90.0%) | 0 (0.0%) |
| 55 to 59 Years | 98 (74.8%) | 0 (0.0%) |
| 60 to 64 Years | 75 (100.0%) | 0 (0.0%) |
| 65 to 74 Years | 8 (8.7%) | 0 (0.0%) |
| 75 Years and over | 13 (48.1%) | 0 (0.0%) |
| Total | 589 (72.6%) | 0 (0.0%) |
Employment Status by Educational Attainment in Liberty
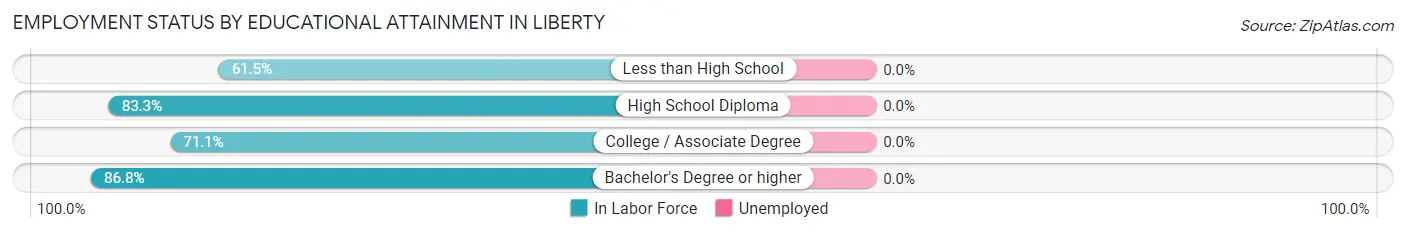
| Educational Attainment | In Labor Force | Unemployed |
| Less than High School | 24 (61.5%) | 0 (0.0%) |
| High School Diploma | 165 (83.3%) | 0 (0.0%) |
| College / Associate Degree | 101 (71.1%) | 0 (0.0%) |
| Bachelor's Degree or higher | 230 (86.8%) | 0 (0.0%) |
| Total | 520 (80.7%) | 0 (0.0%) |
Employment Occupations by Sex in Liberty
Management, Business, Science and Arts Occupations
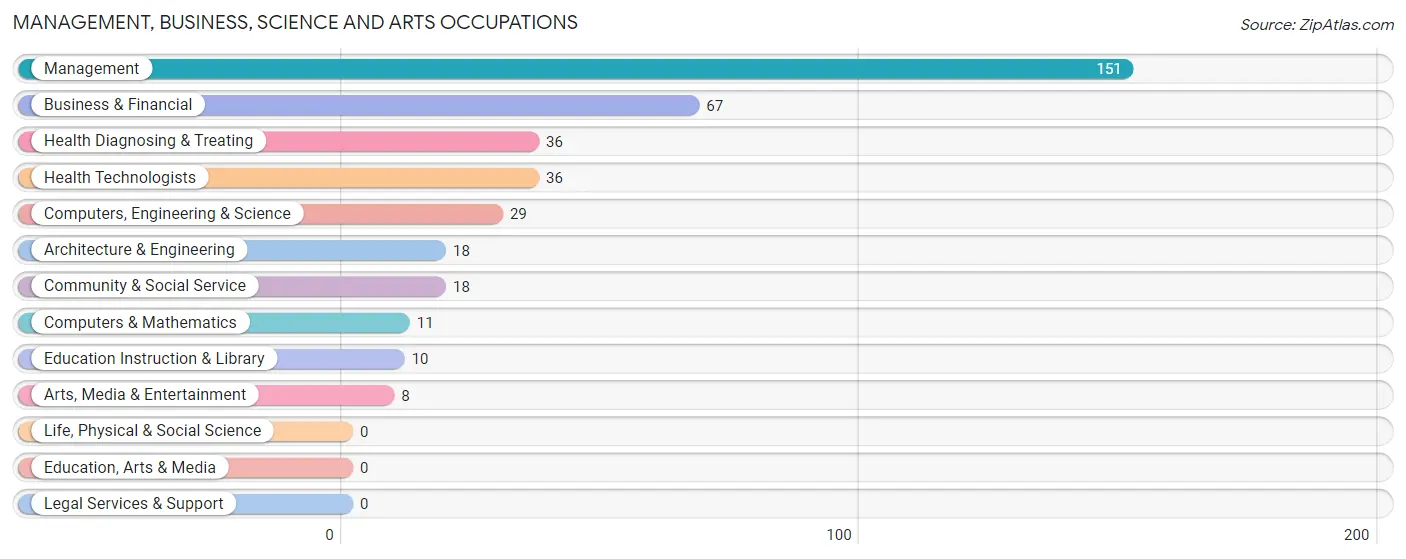
The most common Management, Business, Science and Arts occupations in Liberty are Management (151 | 25.6%), Business & Financial (67 | 11.4%), Health Diagnosing & Treating (36 | 6.1%), Health Technologists (36 | 6.1%), and Computers, Engineering & Science (29 | 4.9%).
Management, Business, Science and Arts Occupations by Sex
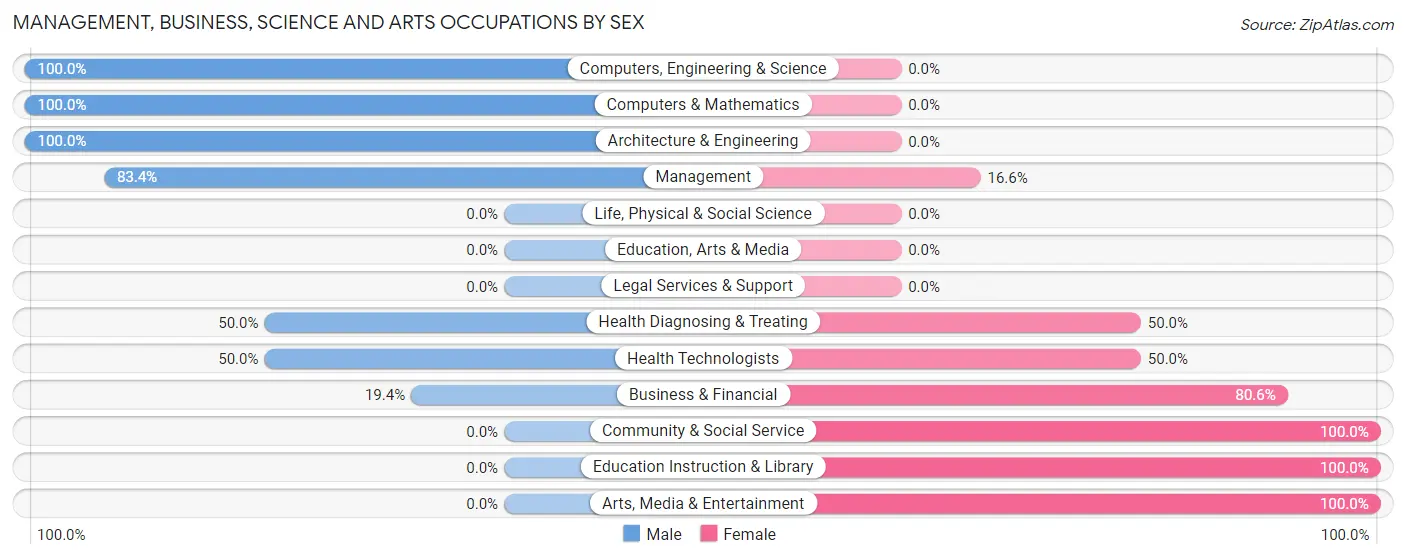
Within the Management, Business, Science and Arts occupations in Liberty, the most male-oriented occupations are Computers, Engineering & Science (100.0%), Computers & Mathematics (100.0%), and Architecture & Engineering (100.0%), while the most female-oriented occupations are Community & Social Service (100.0%), Education Instruction & Library (100.0%), and Arts, Media & Entertainment (100.0%).
| Occupation | Male | Female |
| Management | 126 (83.4%) | 25 (16.6%) |
| Business & Financial | 13 (19.4%) | 54 (80.6%) |
| Computers, Engineering & Science | 29 (100.0%) | 0 (0.0%) |
| Computers & Mathematics | 11 (100.0%) | 0 (0.0%) |
| Architecture & Engineering | 18 (100.0%) | 0 (0.0%) |
| Life, Physical & Social Science | 0 (0.0%) | 0 (0.0%) |
| Community & Social Service | 0 (0.0%) | 18 (100.0%) |
| Education, Arts & Media | 0 (0.0%) | 0 (0.0%) |
| Legal Services & Support | 0 (0.0%) | 0 (0.0%) |
| Education Instruction & Library | 0 (0.0%) | 10 (100.0%) |
| Arts, Media & Entertainment | 0 (0.0%) | 8 (100.0%) |
| Health Diagnosing & Treating | 18 (50.0%) | 18 (50.0%) |
| Health Technologists | 18 (50.0%) | 18 (50.0%) |
| Total (Category) | 186 (61.8%) | 115 (38.2%) |
| Total (Overall) | 378 (64.2%) | 211 (35.8%) |
Services Occupations
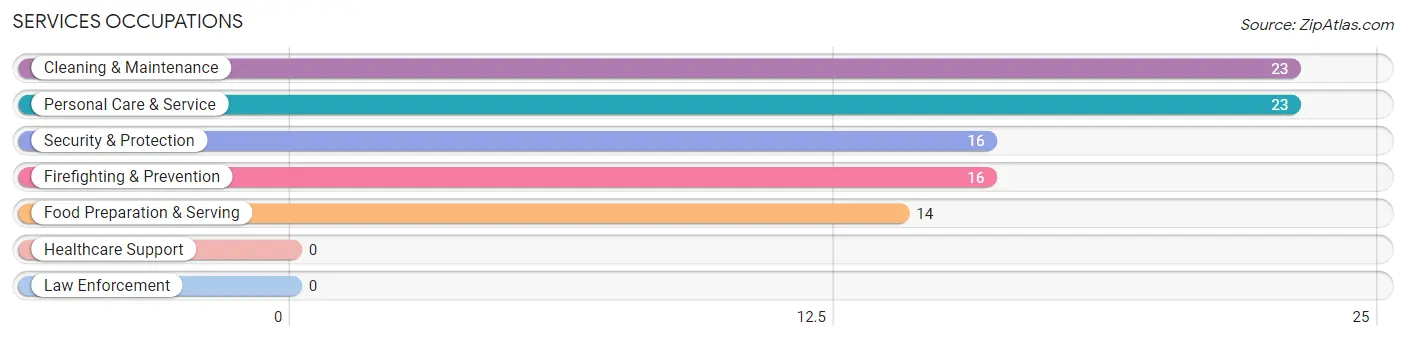
The most common Services occupations in Liberty are Cleaning & Maintenance (23 | 3.9%), Personal Care & Service (23 | 3.9%), Security & Protection (16 | 2.7%), Firefighting & Prevention (16 | 2.7%), and Food Preparation & Serving (14 | 2.4%).
Services Occupations by Sex
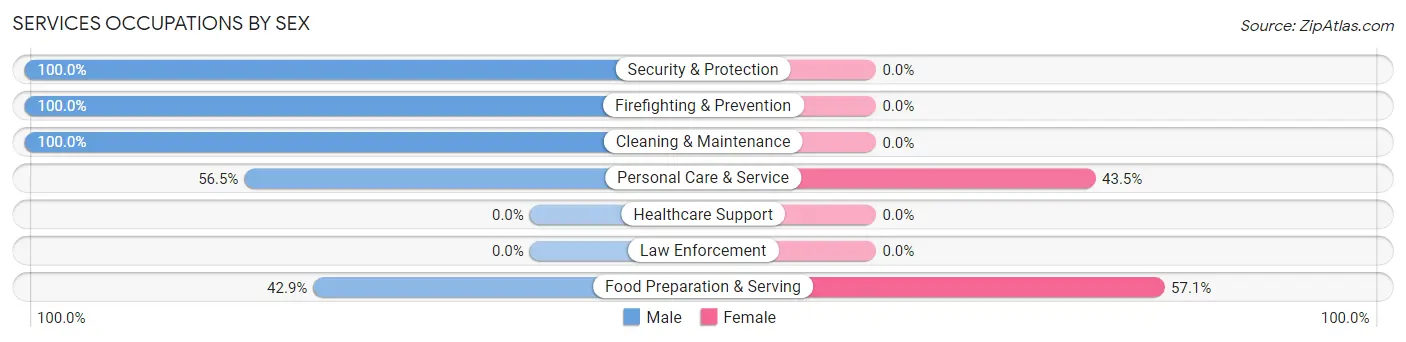
Within the Services occupations in Liberty, the most male-oriented occupations are Security & Protection (100.0%), Firefighting & Prevention (100.0%), and Cleaning & Maintenance (100.0%), while the most female-oriented occupations are Food Preparation & Serving (57.1%), and Personal Care & Service (43.5%).
| Occupation | Male | Female |
| Healthcare Support | 0 (0.0%) | 0 (0.0%) |
| Security & Protection | 16 (100.0%) | 0 (0.0%) |
| Firefighting & Prevention | 16 (100.0%) | 0 (0.0%) |
| Law Enforcement | 0 (0.0%) | 0 (0.0%) |
| Food Preparation & Serving | 6 (42.9%) | 8 (57.1%) |
| Cleaning & Maintenance | 23 (100.0%) | 0 (0.0%) |
| Personal Care & Service | 13 (56.5%) | 10 (43.5%) |
| Total (Category) | 58 (76.3%) | 18 (23.7%) |
| Total (Overall) | 378 (64.2%) | 211 (35.8%) |
Sales and Office Occupations
The most common Sales and Office occupations in Liberty are Office & Administration (36 | 6.1%), and Sales & Related (32 | 5.4%).
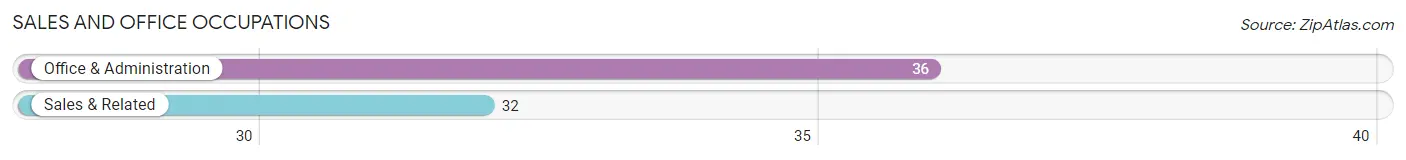
Sales and Office Occupations by Sex
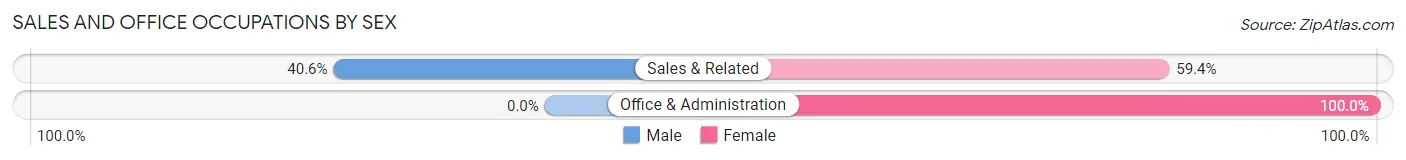
| Occupation | Male | Female |
| Sales & Related | 13 (40.6%) | 19 (59.4%) |
| Office & Administration | 0 (0.0%) | 36 (100.0%) |
| Total (Category) | 13 (19.1%) | 55 (80.9%) |
| Total (Overall) | 378 (64.2%) | 211 (35.8%) |
Natural Resources, Construction and Maintenance Occupations
The most common Natural Resources, Construction and Maintenance occupations in Liberty are , and Construction & Extraction (30 | 5.1%).
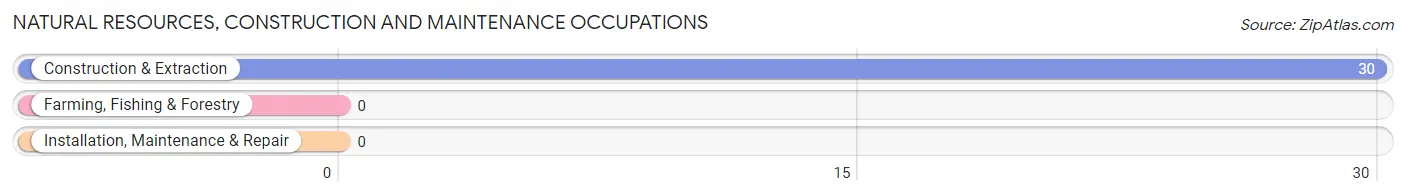
Natural Resources, Construction and Maintenance Occupations by Sex
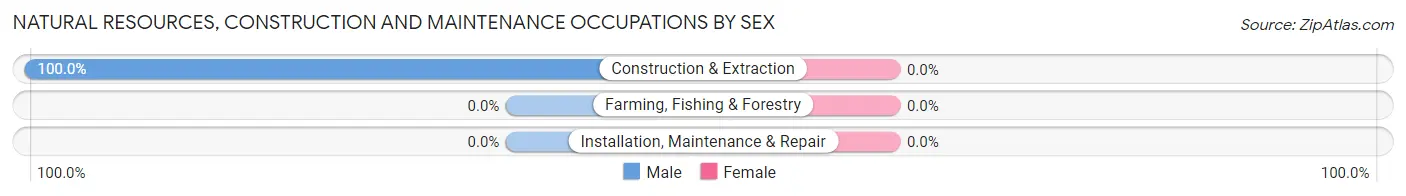
| Occupation | Male | Female |
| Farming, Fishing & Forestry | 0 (0.0%) | 0 (0.0%) |
| Construction & Extraction | 30 (100.0%) | 0 (0.0%) |
| Installation, Maintenance & Repair | 0 (0.0%) | 0 (0.0%) |
| Total (Category) | 30 (100.0%) | 0 (0.0%) |
| Total (Overall) | 378 (64.2%) | 211 (35.8%) |
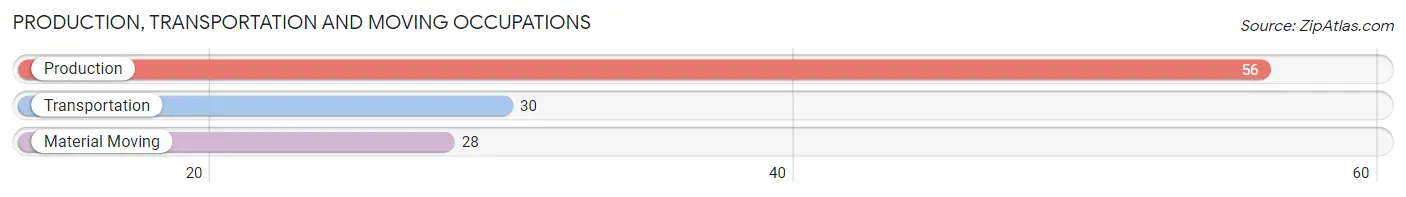
Production, Transportation and Moving Occupations
The most common Production, Transportation and Moving occupations in Liberty are Production (56 | 9.5%), Transportation (30 | 5.1%), and Material Moving (28 | 4.8%).
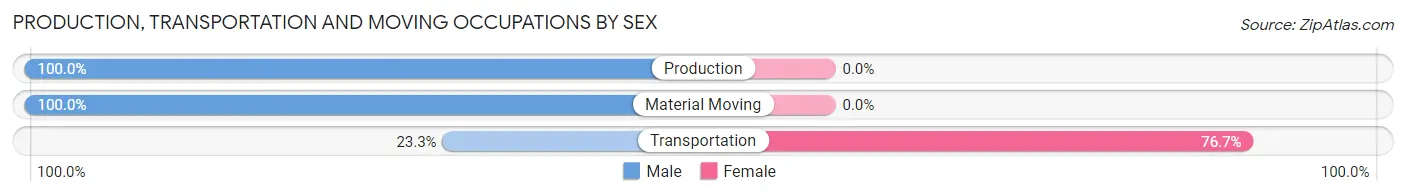
Production, Transportation and Moving Occupations by Sex
| Occupation | Male | Female |
| Production | 56 (100.0%) | 0 (0.0%) |
| Transportation | 7 (23.3%) | 23 (76.7%) |
| Material Moving | 28 (100.0%) | 0 (0.0%) |
| Total (Category) | 91 (79.8%) | 23 (20.2%) |
| Total (Overall) | 378 (64.2%) | 211 (35.8%) |
Employment Industries by Sex in Liberty
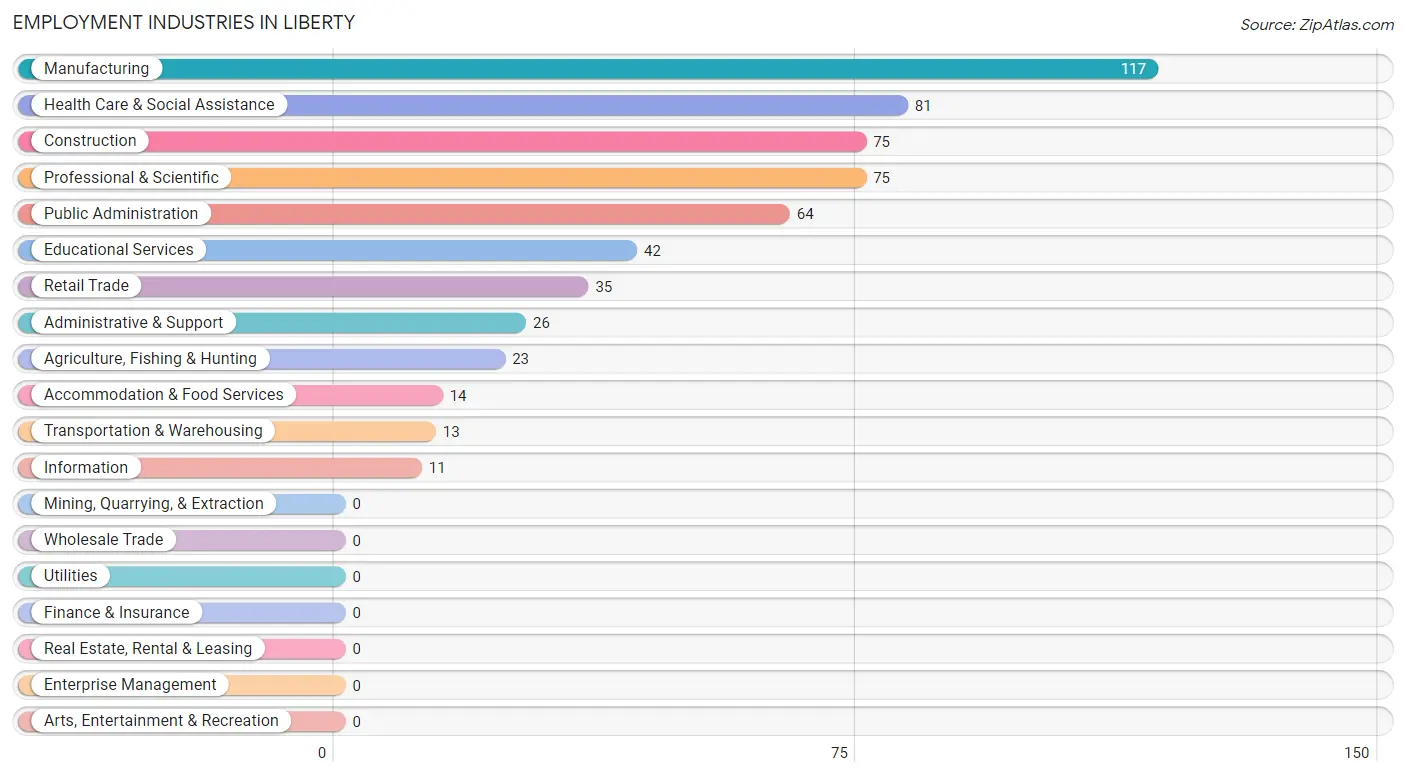
Employment Industries in Liberty
The major employment industries in Liberty include Manufacturing (117 | 19.9%), Health Care & Social Assistance (81 | 13.8%), Construction (75 | 12.7%), Professional & Scientific (75 | 12.7%), and Public Administration (64 | 10.9%).
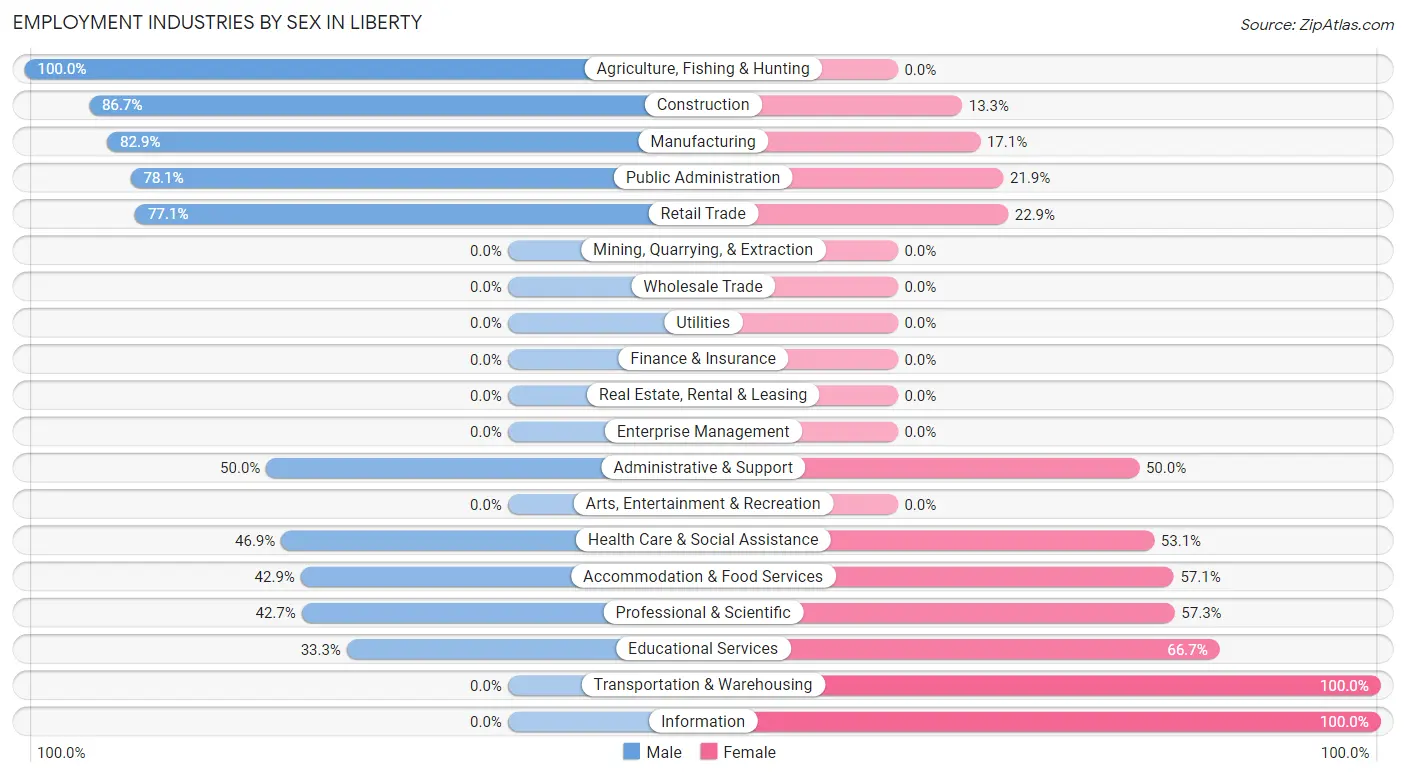
Employment Industries by Sex in Liberty
The Liberty industries that see more men than women are Agriculture, Fishing & Hunting (100.0%), Construction (86.7%), and Manufacturing (82.9%), whereas the industries that tend to have a higher number of women are Transportation & Warehousing (100.0%), Information (100.0%), and Educational Services (66.7%).
| Industry | Male | Female |
| Agriculture, Fishing & Hunting | 23 (100.0%) | 0 (0.0%) |
| Mining, Quarrying, & Extraction | 0 (0.0%) | 0 (0.0%) |
| Construction | 65 (86.7%) | 10 (13.3%) |
| Manufacturing | 97 (82.9%) | 20 (17.1%) |
| Wholesale Trade | 0 (0.0%) | 0 (0.0%) |
| Retail Trade | 27 (77.1%) | 8 (22.9%) |
| Transportation & Warehousing | 0 (0.0%) | 13 (100.0%) |
| Utilities | 0 (0.0%) | 0 (0.0%) |
| Information | 0 (0.0%) | 11 (100.0%) |
| Finance & Insurance | 0 (0.0%) | 0 (0.0%) |
| Real Estate, Rental & Leasing | 0 (0.0%) | 0 (0.0%) |
| Professional & Scientific | 32 (42.7%) | 43 (57.3%) |
| Enterprise Management | 0 (0.0%) | 0 (0.0%) |
| Administrative & Support | 13 (50.0%) | 13 (50.0%) |
| Educational Services | 14 (33.3%) | 28 (66.7%) |
| Health Care & Social Assistance | 38 (46.9%) | 43 (53.1%) |
| Arts, Entertainment & Recreation | 0 (0.0%) | 0 (0.0%) |
| Accommodation & Food Services | 6 (42.9%) | 8 (57.1%) |
| Public Administration | 50 (78.1%) | 14 (21.9%) |
| Total | 378 (64.2%) | 211 (35.8%) |
Education in Liberty
School Enrollment in Liberty
The most common levels of schooling among the 425 students in Liberty are elementary school (179 | 42.1%), middle school (88 | 20.7%), and nursery / preschool (54 | 12.7%).
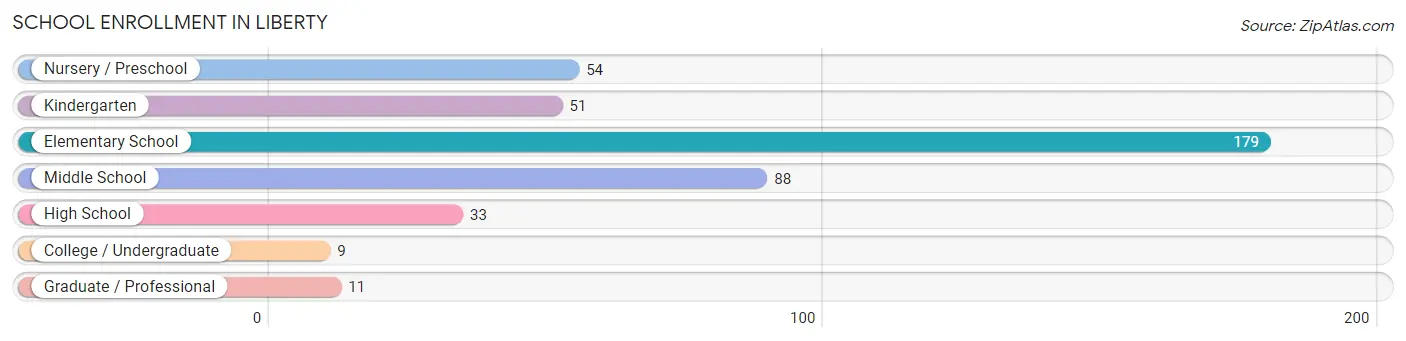
| School Level | # Students | % Students |
| Nursery / Preschool | 54 | 12.7% |
| Kindergarten | 51 | 12.0% |
| Elementary School | 179 | 42.1% |
| Middle School | 88 | 20.7% |
| High School | 33 | 7.8% |
| College / Undergraduate | 9 | 2.1% |
| Graduate / Professional | 11 | 2.6% |
| Total | 425 | 100.0% |
School Enrollment by Age by Funding Source in Liberty
Out of a total of 425 students who are enrolled in schools in Liberty, 20 (4.7%) attend a private institution, while the remaining 405 (95.3%) are enrolled in public schools. The age group of 3 to 4 year olds has the highest likelihood of being enrolled in private schools, with 20 (37.0% in the age bracket) enrolled. Conversely, the age group of 5 to 9 year old has the lowest likelihood of being enrolled in a private school, with 219 (100.0% in the age bracket) attending a public institution.
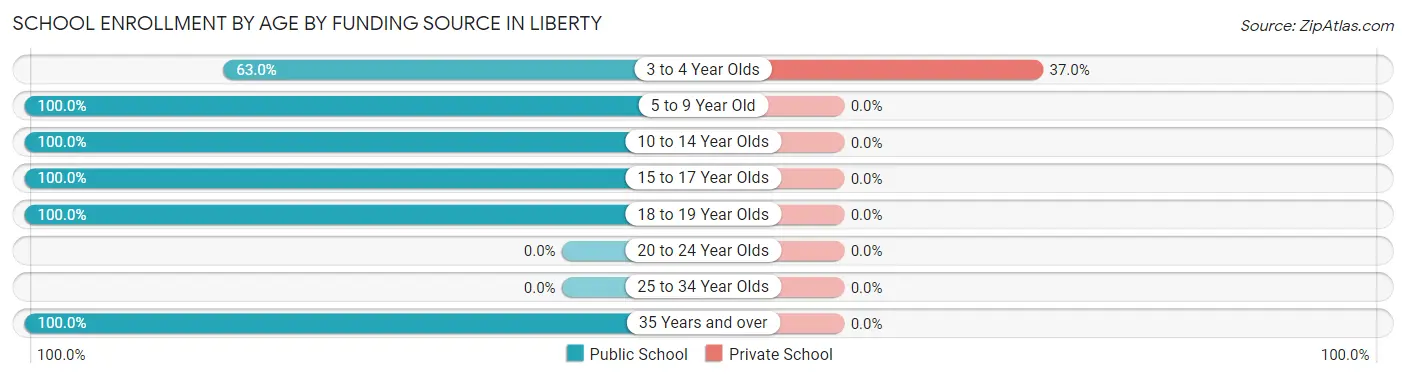
| Age Bracket | Public School | Private School |
| 3 to 4 Year Olds | 34 (63.0%) | 20 (37.0%) |
| 5 to 9 Year Old | 219 (100.0%) | 0 (0.0%) |
| 10 to 14 Year Olds | 109 (100.0%) | 0 (0.0%) |
| 15 to 17 Year Olds | 23 (100.0%) | 0 (0.0%) |
| 18 to 19 Year Olds | 9 (100.0%) | 0 (0.0%) |
| 20 to 24 Year Olds | 0 (0.0%) | 0 (0.0%) |
| 25 to 34 Year Olds | 0 (0.0%) | 0 (0.0%) |
| 35 Years and over | 11 (100.0%) | 0 (0.0%) |
| Total | 405 (95.3%) | 20 (4.7%) |
Educational Attainment by Field of Study in Liberty
Business (111 | 34.8%), education (49 | 15.4%), psychology (43 | 13.5%), bio, nature & agricultural (36 | 11.3%), and arts & humanities (25 | 7.8%) are the most common fields of study among 319 individuals in Liberty who have obtained a bachelor's degree or higher.
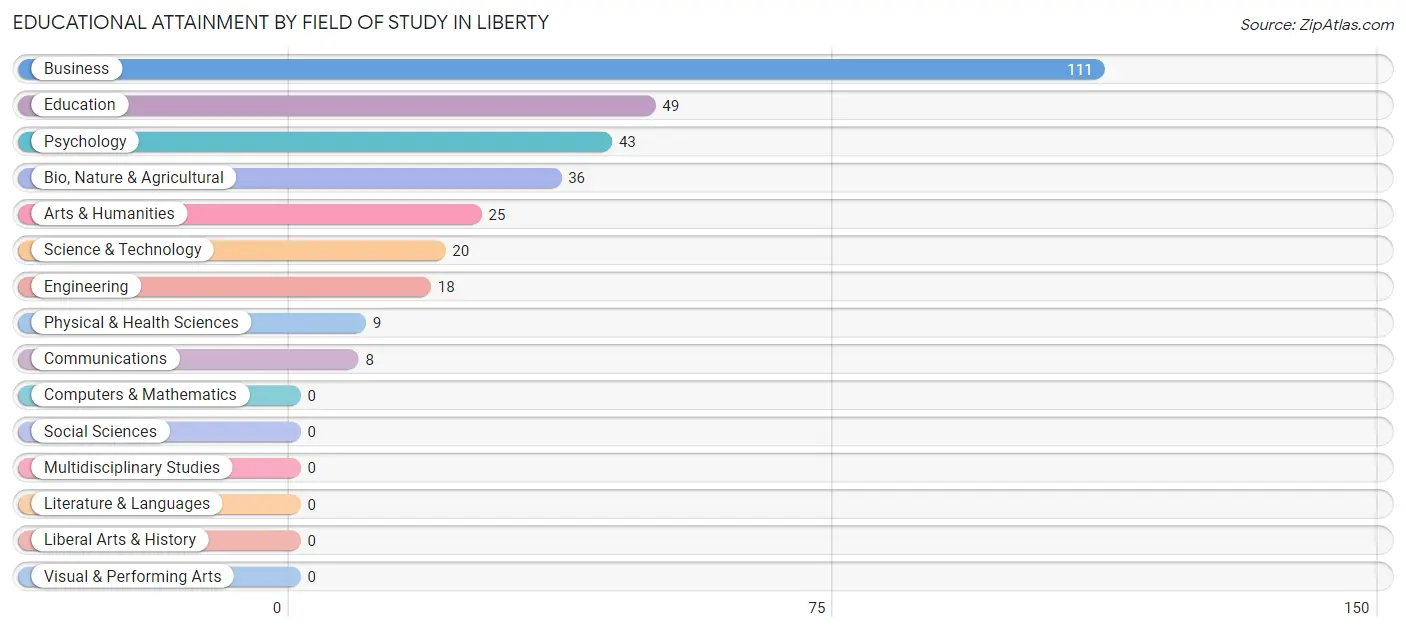
| Field of Study | # Graduates | % Graduates |
| Computers & Mathematics | 0 | 0.0% |
| Bio, Nature & Agricultural | 36 | 11.3% |
| Physical & Health Sciences | 9 | 2.8% |
| Psychology | 43 | 13.5% |
| Social Sciences | 0 | 0.0% |
| Engineering | 18 | 5.6% |
| Multidisciplinary Studies | 0 | 0.0% |
| Science & Technology | 20 | 6.3% |
| Business | 111 | 34.8% |
| Education | 49 | 15.4% |
| Literature & Languages | 0 | 0.0% |
| Liberal Arts & History | 0 | 0.0% |
| Visual & Performing Arts | 0 | 0.0% |
| Communications | 8 | 2.5% |
| Arts & Humanities | 25 | 7.8% |
| Total | 319 | 100.0% |
Transportation & Commute in Liberty
Vehicle Availability by Sex in Liberty
The most prevalent vehicle ownership categories in Liberty are males with 3 vehicles (126, accounting for 38.5%) and females with 3 vehicles (54, making up 59.7%).
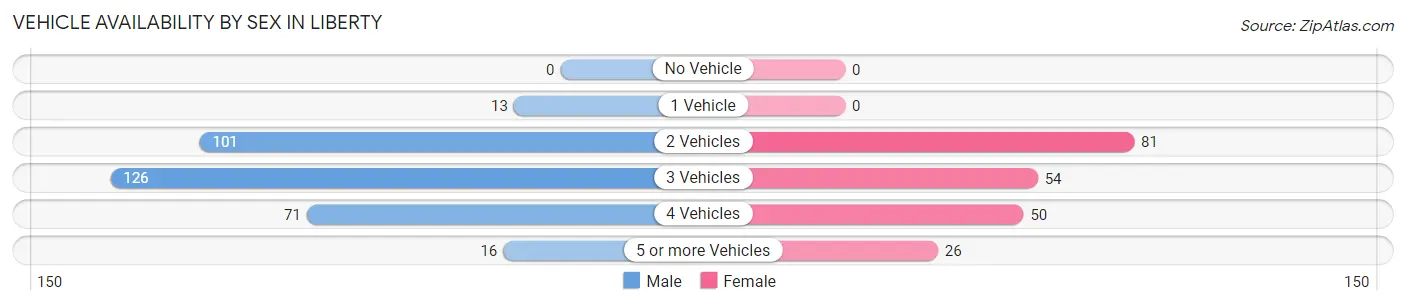
| Vehicles Available | Male | Female |
| No Vehicle | 0 (0.0%) | 0 (0.0%) |
| 1 Vehicle | 13 (4.0%) | 0 (0.0%) |
| 2 Vehicles | 101 (30.9%) | 81 (38.4%) |
| 3 Vehicles | 126 (38.5%) | 54 (25.6%) |
| 4 Vehicles | 71 (21.7%) | 50 (23.7%) |
| 5 or more Vehicles | 16 (4.9%) | 26 (12.3%) |
| Total | 327 (100.0%) | 211 (100.0%) |
Commute Time in Liberty
The most frequently occuring commute durations in Liberty are 35 to 39 minutes (112 commuters, 26.5%), 30 to 34 minutes (74 commuters, 17.5%), and 40 to 44 minutes (64 commuters, 15.2%).
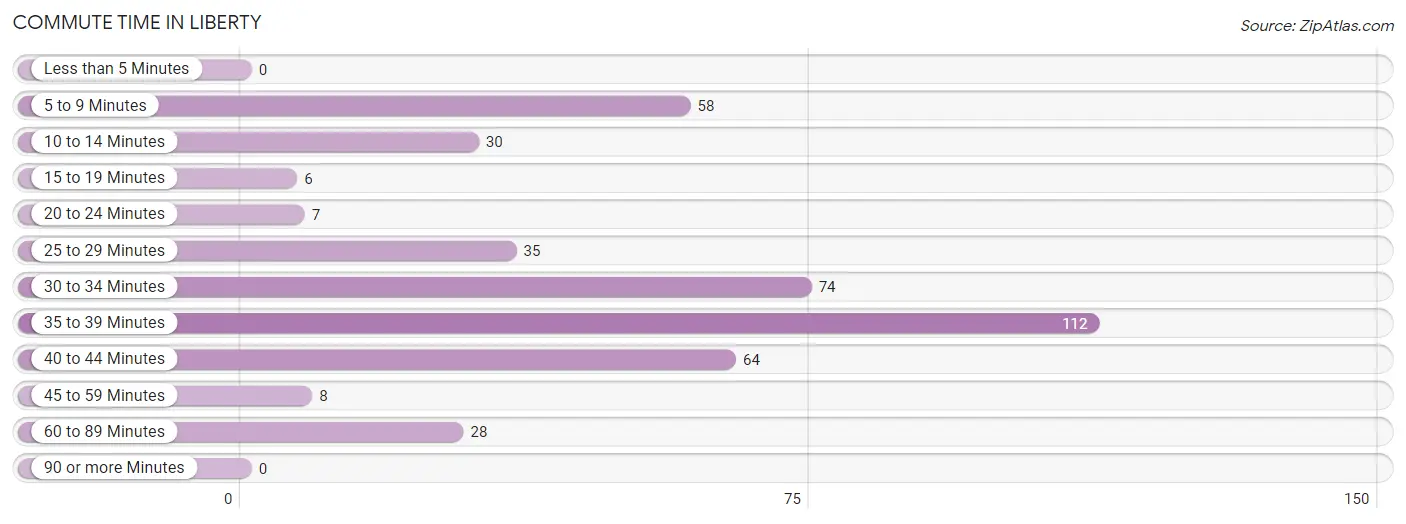
| Commute Time | # Commuters | % Commuters |
| Less than 5 Minutes | 0 | 0.0% |
| 5 to 9 Minutes | 58 | 13.7% |
| 10 to 14 Minutes | 30 | 7.1% |
| 15 to 19 Minutes | 6 | 1.4% |
| 20 to 24 Minutes | 7 | 1.7% |
| 25 to 29 Minutes | 35 | 8.3% |
| 30 to 34 Minutes | 74 | 17.5% |
| 35 to 39 Minutes | 112 | 26.5% |
| 40 to 44 Minutes | 64 | 15.2% |
| 45 to 59 Minutes | 8 | 1.9% |
| 60 to 89 Minutes | 28 | 6.6% |
| 90 or more Minutes | 0 | 0.0% |
Commute Time by Sex in Liberty
The most common commute times in Liberty are 35 to 39 minutes (67 commuters, 23.8%) for males and 35 to 39 minutes (45 commuters, 31.9%) for females.
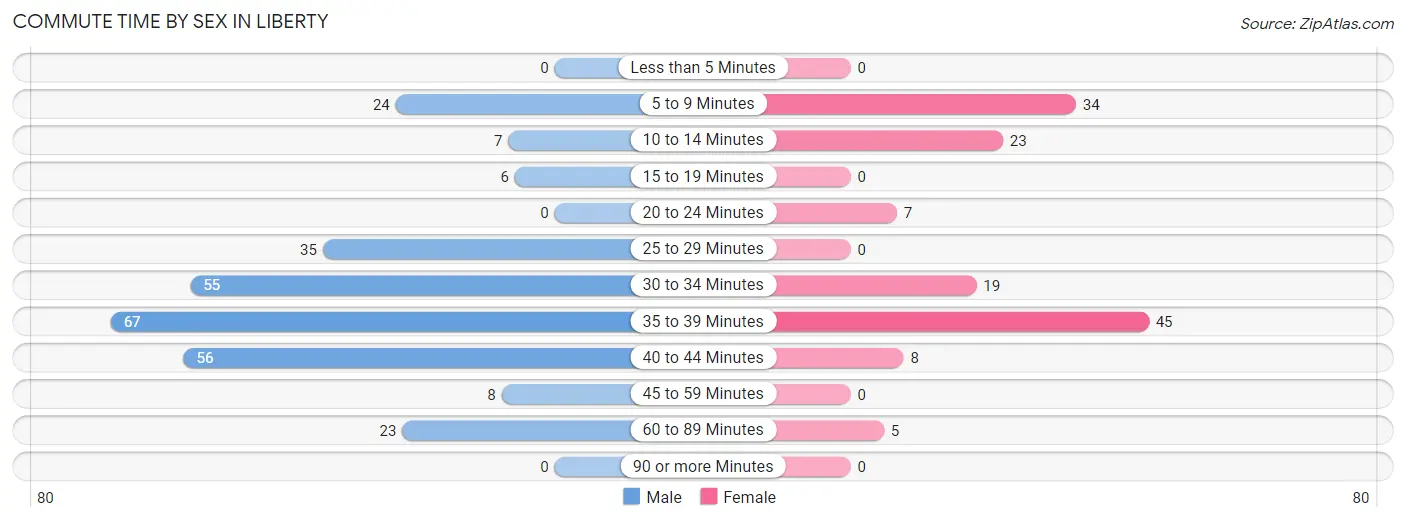
| Commute Time | Male | Female |
| Less than 5 Minutes | 0 (0.0%) | 0 (0.0%) |
| 5 to 9 Minutes | 24 (8.5%) | 34 (24.1%) |
| 10 to 14 Minutes | 7 (2.5%) | 23 (16.3%) |
| 15 to 19 Minutes | 6 (2.1%) | 0 (0.0%) |
| 20 to 24 Minutes | 0 (0.0%) | 7 (5.0%) |
| 25 to 29 Minutes | 35 (12.5%) | 0 (0.0%) |
| 30 to 34 Minutes | 55 (19.6%) | 19 (13.5%) |
| 35 to 39 Minutes | 67 (23.8%) | 45 (31.9%) |
| 40 to 44 Minutes | 56 (19.9%) | 8 (5.7%) |
| 45 to 59 Minutes | 8 (2.9%) | 0 (0.0%) |
| 60 to 89 Minutes | 23 (8.2%) | 5 (3.5%) |
| 90 or more Minutes | 0 (0.0%) | 0 (0.0%) |
Time of Departure to Work by Sex in Liberty
The most frequent times of departure to work in Liberty are 9:00 AM to 9:59 AM (59, 21.0%) for males and 6:00 AM to 6:29 AM (38, 27.0%) for females.
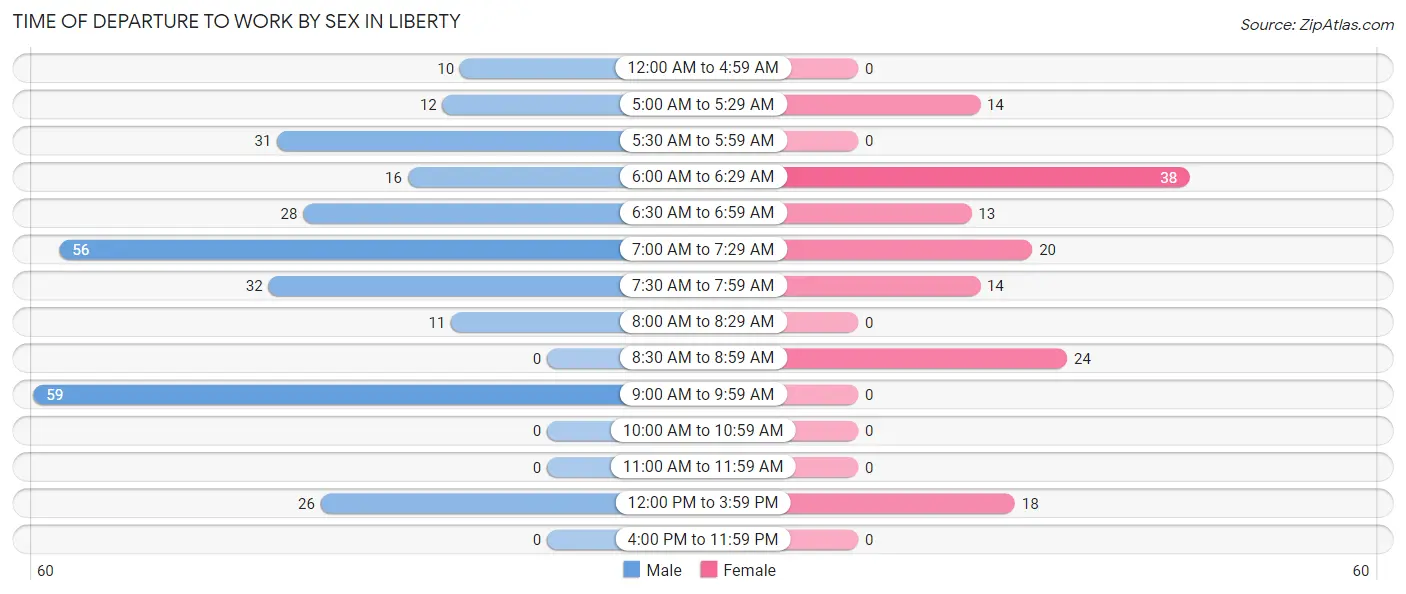
| Time of Departure | Male | Female |
| 12:00 AM to 4:59 AM | 10 (3.6%) | 0 (0.0%) |
| 5:00 AM to 5:29 AM | 12 (4.3%) | 14 (9.9%) |
| 5:30 AM to 5:59 AM | 31 (11.0%) | 0 (0.0%) |
| 6:00 AM to 6:29 AM | 16 (5.7%) | 38 (27.0%) |
| 6:30 AM to 6:59 AM | 28 (10.0%) | 13 (9.2%) |
| 7:00 AM to 7:29 AM | 56 (19.9%) | 20 (14.2%) |
| 7:30 AM to 7:59 AM | 32 (11.4%) | 14 (9.9%) |
| 8:00 AM to 8:29 AM | 11 (3.9%) | 0 (0.0%) |
| 8:30 AM to 8:59 AM | 0 (0.0%) | 24 (17.0%) |
| 9:00 AM to 9:59 AM | 59 (21.0%) | 0 (0.0%) |
| 10:00 AM to 10:59 AM | 0 (0.0%) | 0 (0.0%) |
| 11:00 AM to 11:59 AM | 0 (0.0%) | 0 (0.0%) |
| 12:00 PM to 3:59 PM | 26 (9.2%) | 18 (12.8%) |
| 4:00 PM to 11:59 PM | 0 (0.0%) | 0 (0.0%) |
| Total | 281 (100.0%) | 141 (100.0%) |
Housing Occupancy in Liberty
Occupancy by Ownership in Liberty
Of the total 368 dwellings in Liberty, owner-occupied units account for 368 (100.0%), while renter-occupied units make up 0 (0.0%).
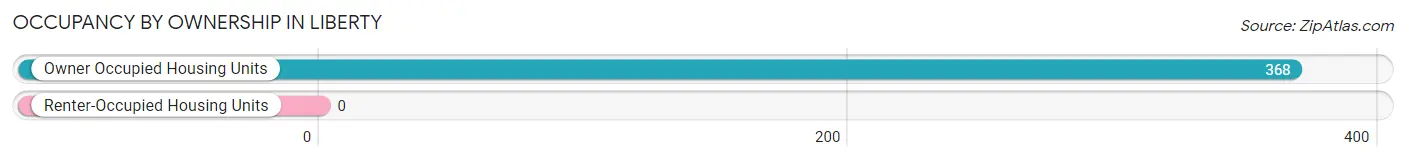
| Occupancy | # Housing Units | % Housing Units |
| Owner Occupied Housing Units | 368 | 100.0% |
| Renter-Occupied Housing Units | 0 | 0.0% |
| Total Occupied Housing Units | 368 | 100.0% |
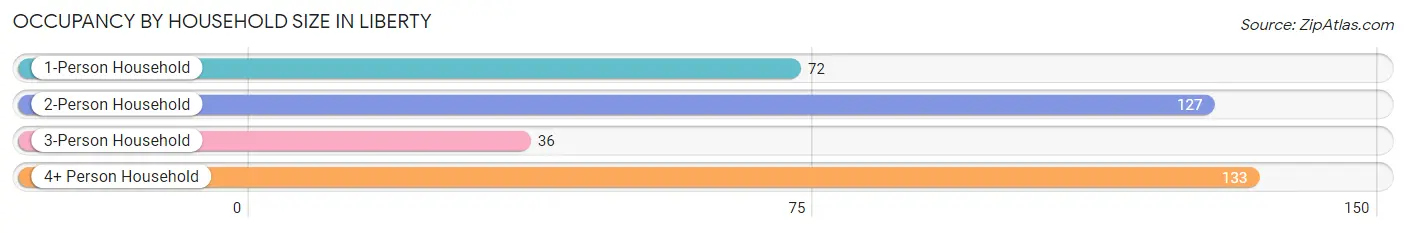
Occupancy by Household Size in Liberty
| Household Size | # Housing Units | % Housing Units |
| 1-Person Household | 72 | 19.6% |
| 2-Person Household | 127 | 34.5% |
| 3-Person Household | 36 | 9.8% |
| 4+ Person Household | 133 | 36.1% |
| Total Housing Units | 368 | 100.0% |
Occupancy by Ownership by Household Size in Liberty
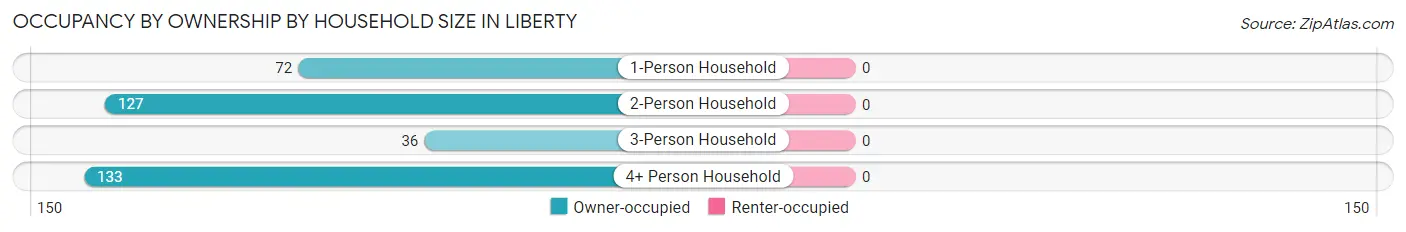
| Household Size | Owner-occupied | Renter-occupied |
| 1-Person Household | 72 (100.0%) | 0 (0.0%) |
| 2-Person Household | 127 (100.0%) | 0 (0.0%) |
| 3-Person Household | 36 (100.0%) | 0 (0.0%) |
| 4+ Person Household | 133 (100.0%) | 0 (0.0%) |
| Total Housing Units | 368 (100.0%) | 0 (0.0%) |
Occupancy by Educational Attainment in Liberty
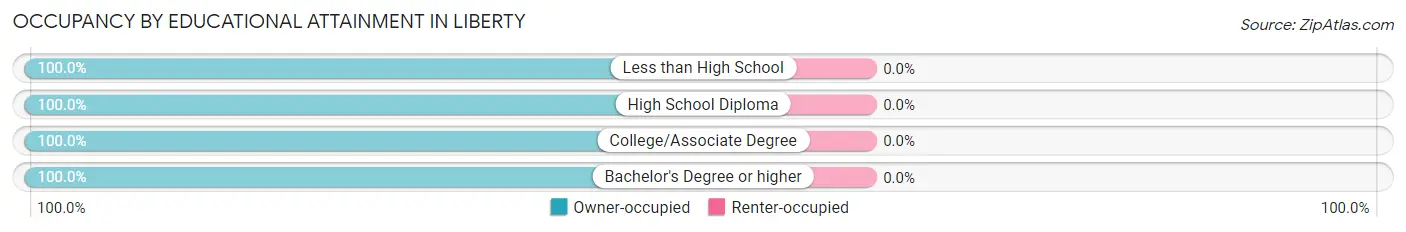
| Household Size | Owner-occupied | Renter-occupied |
| Less than High School | 24 (100.0%) | 0 (0.0%) |
| High School Diploma | 105 (100.0%) | 0 (0.0%) |
| College/Associate Degree | 39 (100.0%) | 0 (0.0%) |
| Bachelor's Degree or higher | 200 (100.0%) | 0 (0.0%) |
Occupancy by Age of Householder in Liberty
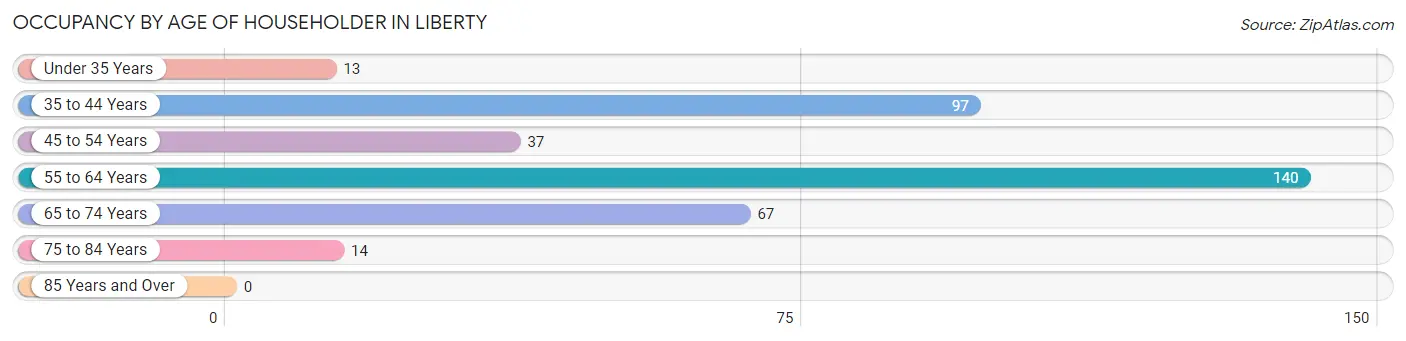
| Age Bracket | # Households | % Households |
| Under 35 Years | 13 | 3.5% |
| 35 to 44 Years | 97 | 26.4% |
| 45 to 54 Years | 37 | 10.1% |
| 55 to 64 Years | 140 | 38.0% |
| 65 to 74 Years | 67 | 18.2% |
| 75 to 84 Years | 14 | 3.8% |
| 85 Years and Over | 0 | 0.0% |
| Total | 368 | 100.0% |
Housing Finances in Liberty
Median Income by Occupancy in Liberty
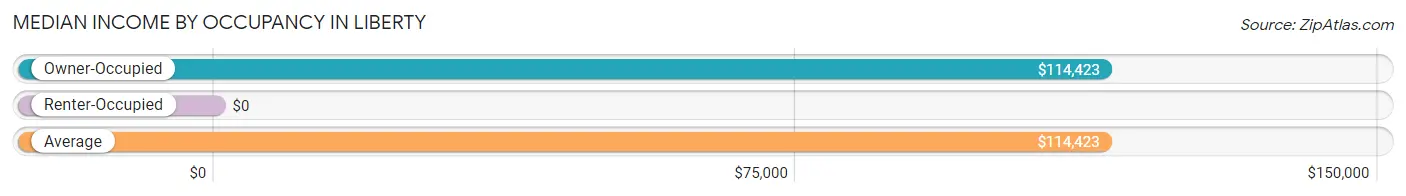
| Occupancy Type | # Households | Median Income |
| Owner-Occupied | 368 (100.0%) | $114,423 |
| Renter-Occupied | 0 (0.0%) | $0 |
| Average | 368 (100.0%) | $114,423 |
Occupancy by Householder Income Bracket in Liberty
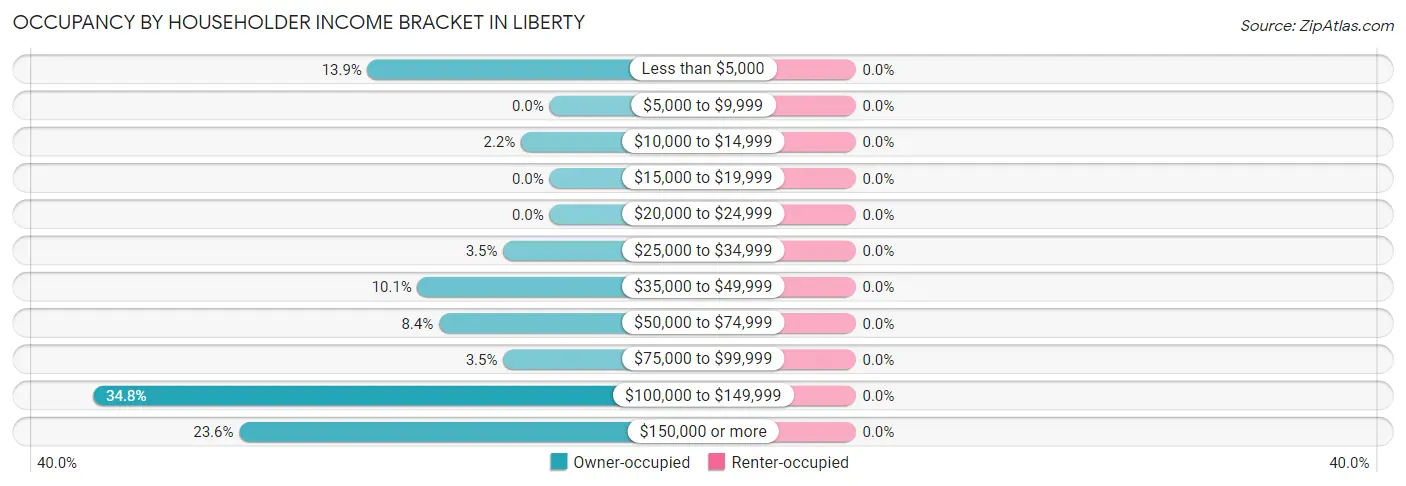
| Income Bracket | Owner-occupied | Renter-occupied |
| Less than $5,000 | 51 (13.9%) | 0 (0.0%) |
| $5,000 to $9,999 | 0 (0.0%) | 0 (0.0%) |
| $10,000 to $14,999 | 8 (2.2%) | 0 (0.0%) |
| $15,000 to $19,999 | 0 (0.0%) | 0 (0.0%) |
| $20,000 to $24,999 | 0 (0.0%) | 0 (0.0%) |
| $25,000 to $34,999 | 13 (3.5%) | 0 (0.0%) |
| $35,000 to $49,999 | 37 (10.1%) | 0 (0.0%) |
| $50,000 to $74,999 | 31 (8.4%) | 0 (0.0%) |
| $75,000 to $99,999 | 13 (3.5%) | 0 (0.0%) |
| $100,000 to $149,999 | 128 (34.8%) | 0 (0.0%) |
| $150,000 or more | 87 (23.6%) | 0 (0.0%) |
| Total | 368 (100.0%) | 0 (0.0%) |
Monthly Housing Cost Tiers in Liberty
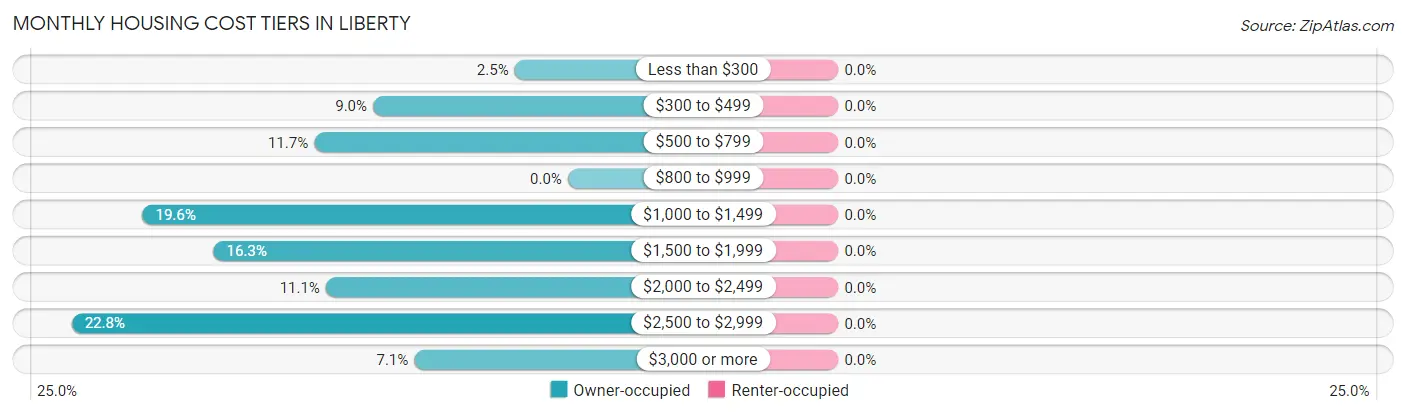
| Monthly Cost | Owner-occupied | Renter-occupied |
| Less than $300 | 9 (2.5%) | 0 (0.0%) |
| $300 to $499 | 33 (9.0%) | 0 (0.0%) |
| $500 to $799 | 43 (11.7%) | 0 (0.0%) |
| $800 to $999 | 0 (0.0%) | 0 (0.0%) |
| $1,000 to $1,499 | 72 (19.6%) | 0 (0.0%) |
| $1,500 to $1,999 | 60 (16.3%) | 0 (0.0%) |
| $2,000 to $2,499 | 41 (11.1%) | 0 (0.0%) |
| $2,500 to $2,999 | 84 (22.8%) | 0 (0.0%) |
| $3,000 or more | 26 (7.1%) | 0 (0.0%) |
| Total | 368 (100.0%) | 0 (0.0%) |
Physical Housing Characteristics in Liberty
Housing Structures in Liberty
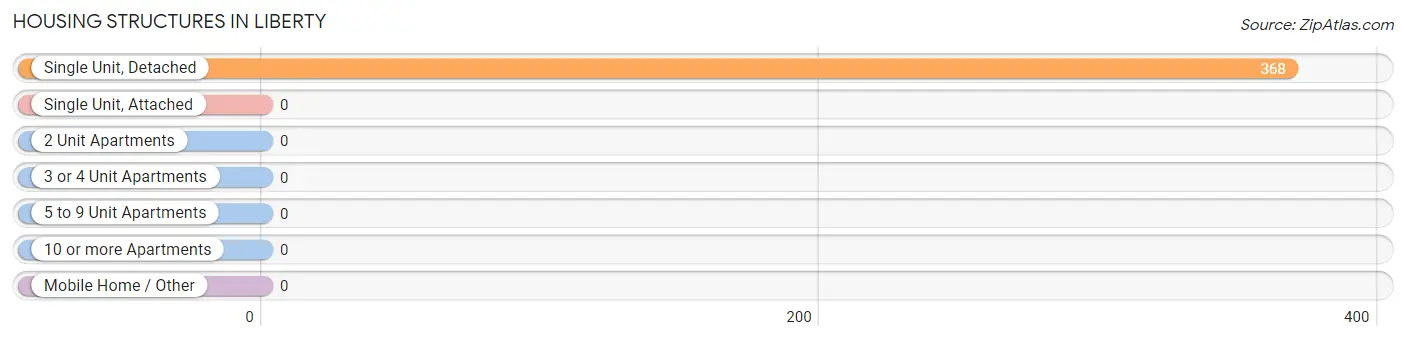
| Structure Type | # Housing Units | % Housing Units |
| Single Unit, Detached | 368 | 100.0% |
| Single Unit, Attached | 0 | 0.0% |
| 2 Unit Apartments | 0 | 0.0% |
| 3 or 4 Unit Apartments | 0 | 0.0% |
| 5 to 9 Unit Apartments | 0 | 0.0% |
| 10 or more Apartments | 0 | 0.0% |
| Mobile Home / Other | 0 | 0.0% |
| Total | 368 | 100.0% |
Housing Structures by Occupancy in Liberty
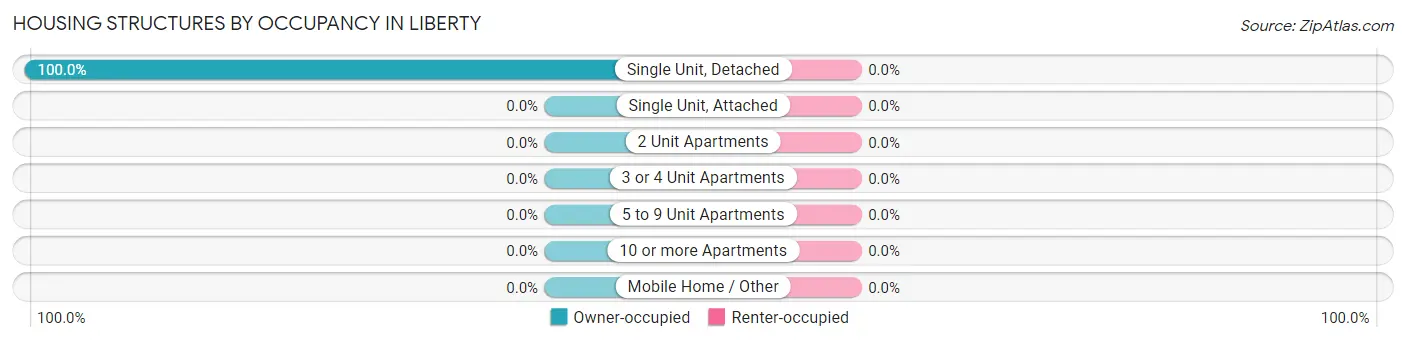
| Structure Type | Owner-occupied | Renter-occupied |
| Single Unit, Detached | 368 (100.0%) | 0 (0.0%) |
| Single Unit, Attached | 0 (0.0%) | 0 (0.0%) |
| 2 Unit Apartments | 0 (0.0%) | 0 (0.0%) |
| 3 or 4 Unit Apartments | 0 (0.0%) | 0 (0.0%) |
| 5 to 9 Unit Apartments | 0 (0.0%) | 0 (0.0%) |
| 10 or more Apartments | 0 (0.0%) | 0 (0.0%) |
| Mobile Home / Other | 0 (0.0%) | 0 (0.0%) |
| Total | 368 (100.0%) | 0 (0.0%) |
Housing Structures by Number of Rooms in Liberty
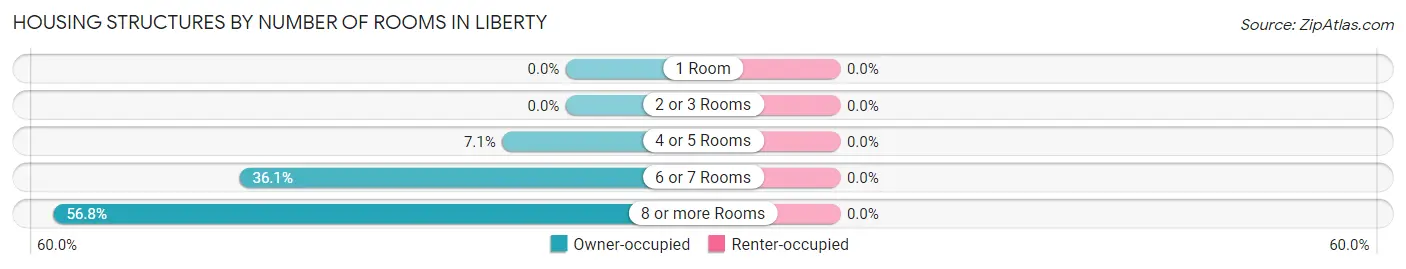
| Number of Rooms | Owner-occupied | Renter-occupied |
| 1 Room | 0 (0.0%) | 0 (0.0%) |
| 2 or 3 Rooms | 0 (0.0%) | 0 (0.0%) |
| 4 or 5 Rooms | 26 (7.1%) | 0 (0.0%) |
| 6 or 7 Rooms | 133 (36.1%) | 0 (0.0%) |
| 8 or more Rooms | 209 (56.8%) | 0 (0.0%) |
| Total | 368 (100.0%) | 0 (0.0%) |
Housing Structure by Heating Type in Liberty
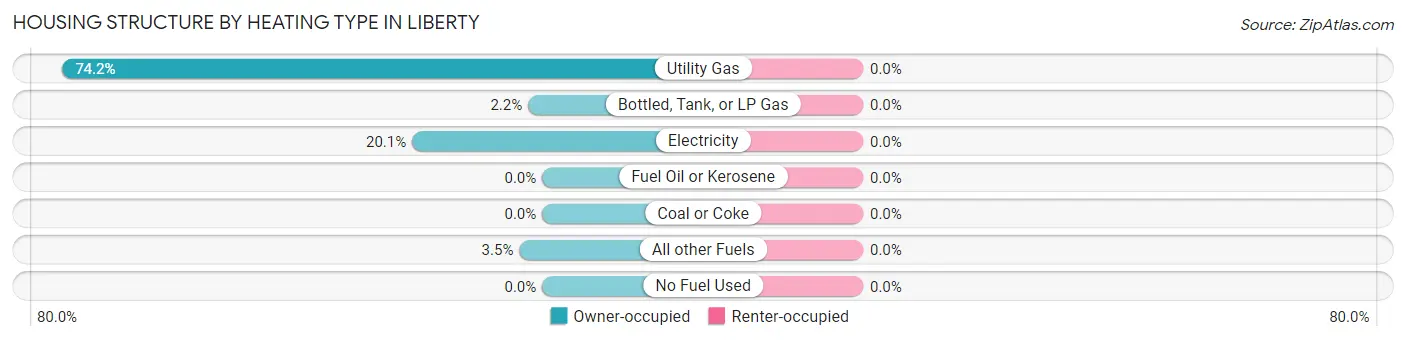
| Heating Type | Owner-occupied | Renter-occupied |
| Utility Gas | 273 (74.2%) | 0 (0.0%) |
| Bottled, Tank, or LP Gas | 8 (2.2%) | 0 (0.0%) |
| Electricity | 74 (20.1%) | 0 (0.0%) |
| Fuel Oil or Kerosene | 0 (0.0%) | 0 (0.0%) |
| Coal or Coke | 0 (0.0%) | 0 (0.0%) |
| All other Fuels | 13 (3.5%) | 0 (0.0%) |
| No Fuel Used | 0 (0.0%) | 0 (0.0%) |
| Total | 368 (100.0%) | 0 (0.0%) |
Household Vehicle Usage in Liberty
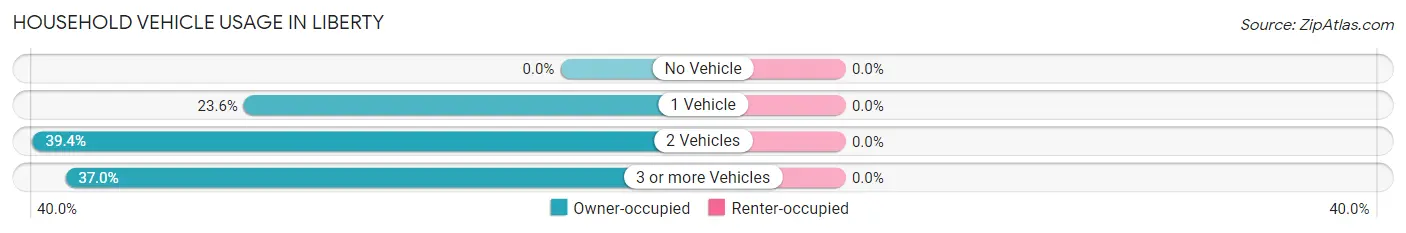
| Vehicles per Household | Owner-occupied | Renter-occupied |
| No Vehicle | 0 (0.0%) | 0 (0.0%) |
| 1 Vehicle | 87 (23.6%) | 0 (0.0%) |
| 2 Vehicles | 145 (39.4%) | 0 (0.0%) |
| 3 or more Vehicles | 136 (37.0%) | 0 (0.0%) |
| Total | 368 (100.0%) | 0 (0.0%) |
Real Estate & Mortgages in Liberty
Real Estate and Mortgage Overview in Liberty
| Characteristic | Without Mortgage | With Mortgage |
| Housing Units | 85 | 283 |
| Median Property Value | $412,500 | $640,300 |
| Median Household Income | - | - |
| Monthly Housing Costs | $502 | $26 |
| Real Estate Taxes | $2,213 | $0 |
Property Value by Mortgage Status in Liberty
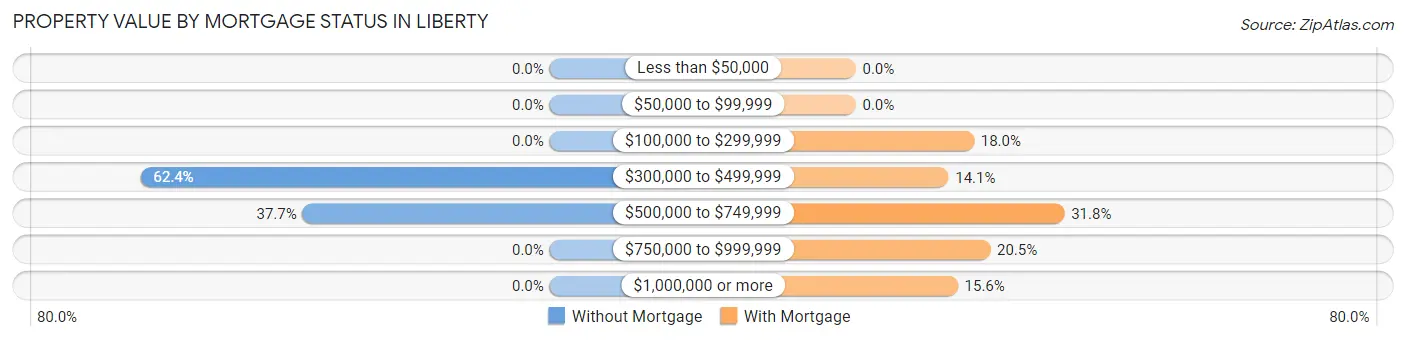
| Property Value | Without Mortgage | With Mortgage |
| Less than $50,000 | 0 (0.0%) | 0 (0.0%) |
| $50,000 to $99,999 | 0 (0.0%) | 0 (0.0%) |
| $100,000 to $299,999 | 0 (0.0%) | 51 (18.0%) |
| $300,000 to $499,999 | 53 (62.4%) | 40 (14.1%) |
| $500,000 to $749,999 | 32 (37.7%) | 90 (31.8%) |
| $750,000 to $999,999 | 0 (0.0%) | 58 (20.5%) |
| $1,000,000 or more | 0 (0.0%) | 44 (15.5%) |
| Total | 85 (100.0%) | 283 (100.0%) |
Household Income by Mortgage Status in Liberty
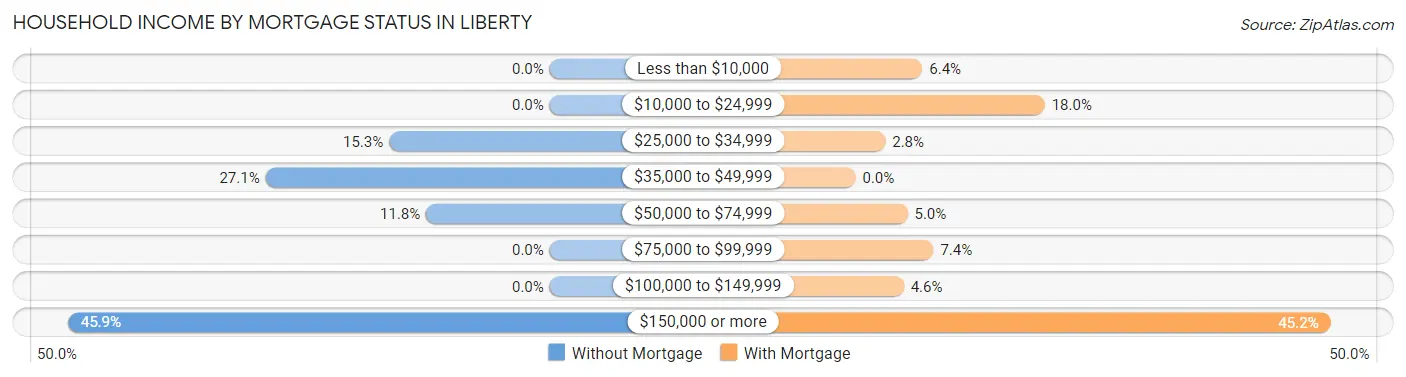
| Household Income | Without Mortgage | With Mortgage |
| Less than $10,000 | 0 (0.0%) | 18 (6.4%) |
| $10,000 to $24,999 | 0 (0.0%) | 51 (18.0%) |
| $25,000 to $34,999 | 13 (15.3%) | 8 (2.8%) |
| $35,000 to $49,999 | 23 (27.1%) | 0 (0.0%) |
| $50,000 to $74,999 | 10 (11.8%) | 14 (5.0%) |
| $75,000 to $99,999 | 0 (0.0%) | 21 (7.4%) |
| $100,000 to $149,999 | 0 (0.0%) | 13 (4.6%) |
| $150,000 or more | 39 (45.9%) | 128 (45.2%) |
| Total | 85 (100.0%) | 283 (100.0%) |
Property Value to Household Income Ratio in Liberty
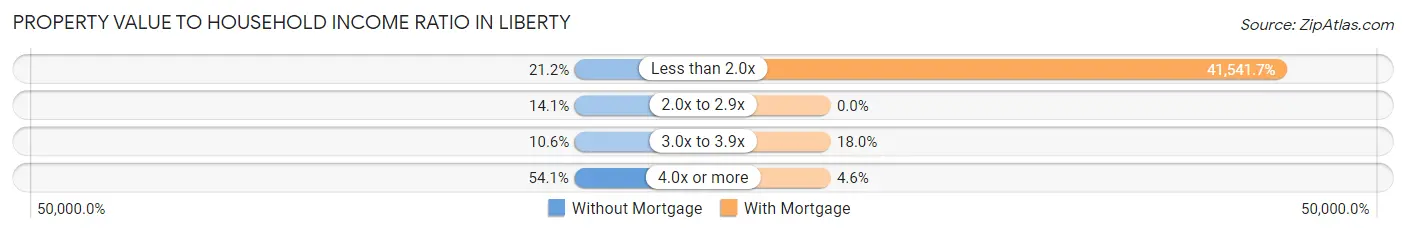
| Value-to-Income Ratio | Without Mortgage | With Mortgage |
| Less than 2.0x | 18 (21.2%) | 117,563 (41,541.7%) |
| 2.0x to 2.9x | 12 (14.1%) | 0 (0.0%) |
| 3.0x to 3.9x | 9 (10.6%) | 51 (18.0%) |
| 4.0x or more | 46 (54.1%) | 13 (4.6%) |
| Total | 85 (100.0%) | 283 (100.0%) |
Real Estate Taxes by Mortgage Status in Liberty
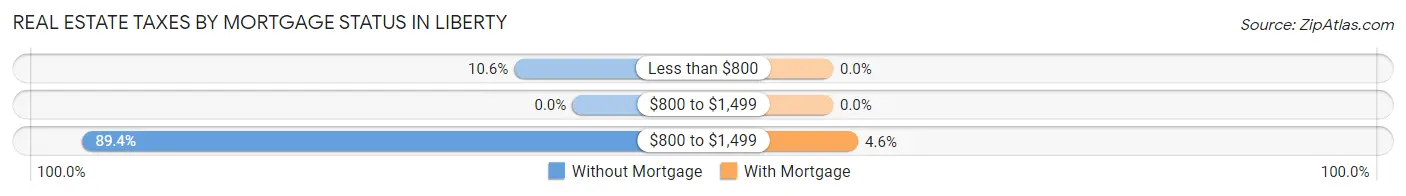
| Property Taxes | Without Mortgage | With Mortgage |
| Less than $800 | 9 (10.6%) | 0 (0.0%) |
| $800 to $1,499 | 0 (0.0%) | 0 (0.0%) |
| $800 to $1,499 | 76 (89.4%) | 13 (4.6%) |
| Total | 85 (100.0%) | 283 (100.0%) |
Health & Disability in Liberty
Health Insurance Coverage by Age in Liberty
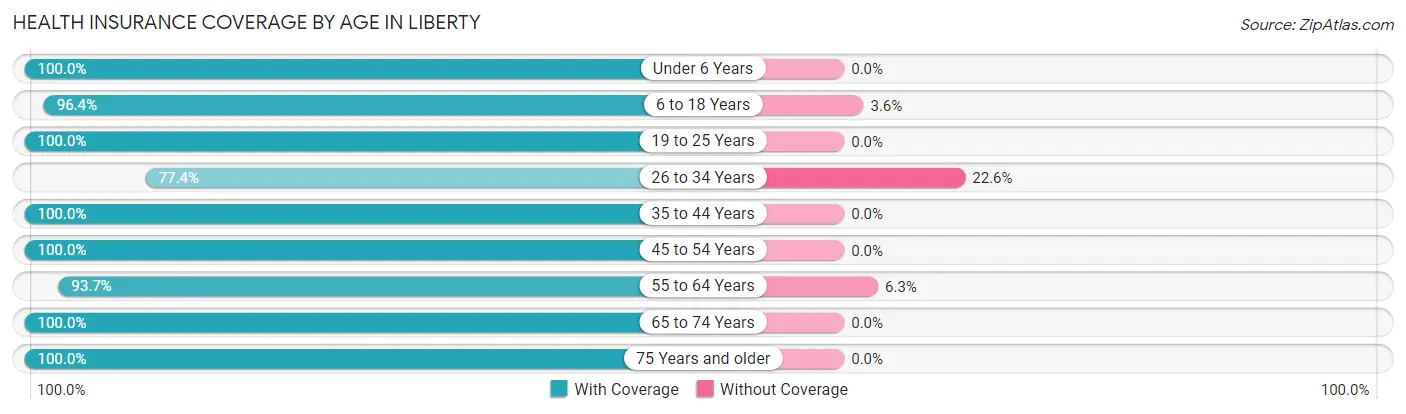
| Age Bracket | With Coverage | Without Coverage |
| Under 6 Years | 83 (100.0%) | 0 (0.0%) |
| 6 to 18 Years | 349 (96.4%) | 13 (3.6%) |
| 19 to 25 Years | 42 (100.0%) | 0 (0.0%) |
| 26 to 34 Years | 48 (77.4%) | 14 (22.6%) |
| 35 to 44 Years | 252 (100.0%) | 0 (0.0%) |
| 45 to 54 Years | 90 (100.0%) | 0 (0.0%) |
| 55 to 64 Years | 193 (93.7%) | 13 (6.3%) |
| 65 to 74 Years | 92 (100.0%) | 0 (0.0%) |
| 75 Years and older | 27 (100.0%) | 0 (0.0%) |
| Total | 1,176 (96.7%) | 40 (3.3%) |
Health Insurance Coverage by Citizenship Status in Liberty
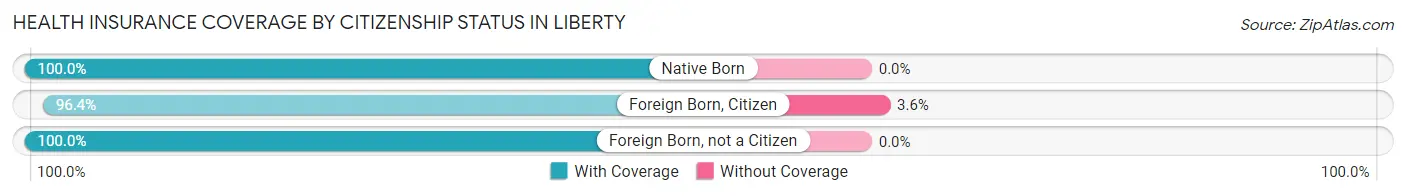
| Citizenship Status | With Coverage | Without Coverage |
| Native Born | 83 (100.0%) | 0 (0.0%) |
| Foreign Born, Citizen | 349 (96.4%) | 13 (3.6%) |
| Foreign Born, not a Citizen | 42 (100.0%) | 0 (0.0%) |
Health Insurance Coverage by Household Income in Liberty
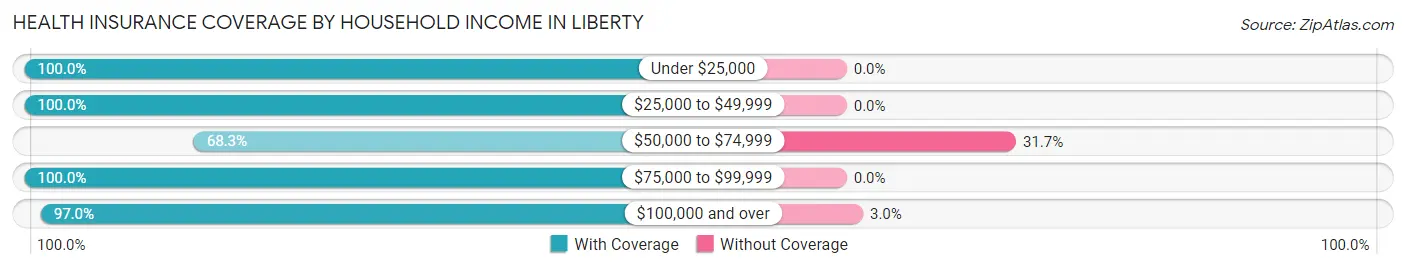
| Household Income | With Coverage | Without Coverage |
| Under $25,000 | 67 (100.0%) | 0 (0.0%) |
| $25,000 to $49,999 | 116 (100.0%) | 0 (0.0%) |
| $50,000 to $74,999 | 28 (68.3%) | 13 (31.7%) |
| $75,000 to $99,999 | 84 (100.0%) | 0 (0.0%) |
| $100,000 and over | 861 (97.0%) | 27 (3.0%) |
Public vs Private Health Insurance Coverage by Age in Liberty
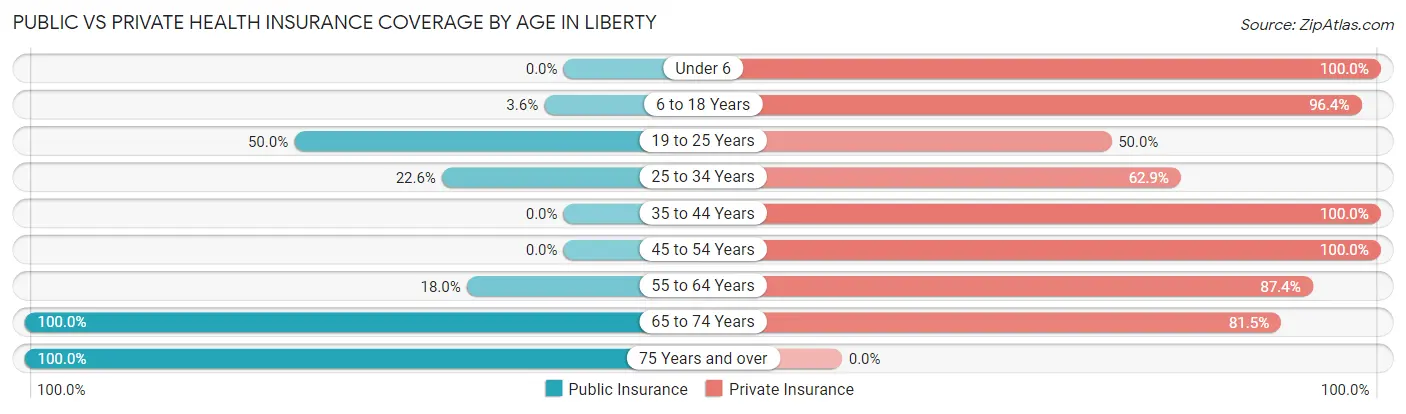
| Age Bracket | Public Insurance | Private Insurance |
| Under 6 | 0 (0.0%) | 83 (100.0%) |
| 6 to 18 Years | 13 (3.6%) | 349 (96.4%) |
| 19 to 25 Years | 21 (50.0%) | 21 (50.0%) |
| 25 to 34 Years | 14 (22.6%) | 39 (62.9%) |
| 35 to 44 Years | 0 (0.0%) | 252 (100.0%) |
| 45 to 54 Years | 0 (0.0%) | 90 (100.0%) |
| 55 to 64 Years | 37 (18.0%) | 180 (87.4%) |
| 65 to 74 Years | 92 (100.0%) | 75 (81.5%) |
| 75 Years and over | 27 (100.0%) | 0 (0.0%) |
| Total | 204 (16.8%) | 1,089 (89.6%) |
Disability Status by Sex by Age in Liberty
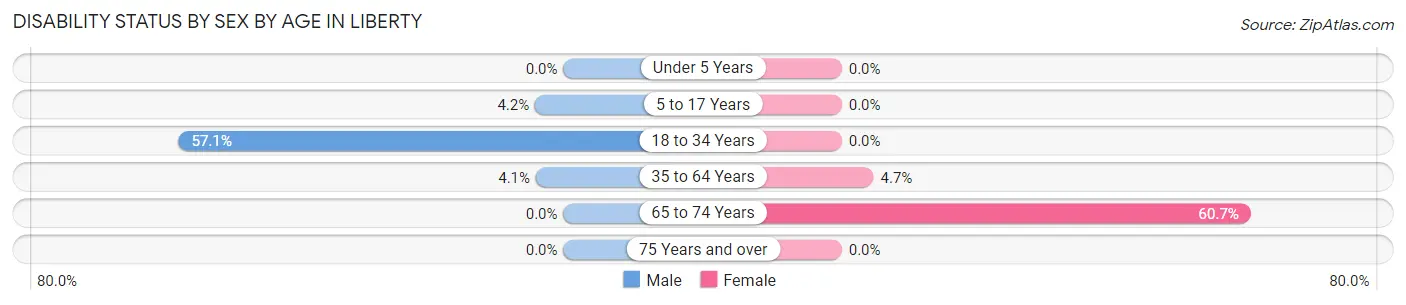
| Age Bracket | Male | Female |
| Under 5 Years | 0 (0.0%) | 0 (0.0%) |
| 5 to 17 Years | 6 (4.2%) | 0 (0.0%) |
| 18 to 34 Years | 48 (57.1%) | 0 (0.0%) |
| 35 to 64 Years | 12 (4.1%) | 12 (4.7%) |
| 65 to 74 Years | 0 (0.0%) | 51 (60.7%) |
| 75 Years and over | 0 (0.0%) | 0 (0.0%) |
Disability Class by Sex by Age in Liberty
Disability Class: Hearing Difficulty
| Age Bracket | Male | Female |
| Under 5 Years | 0 (0.0%) | 0 (0.0%) |
| 5 to 17 Years | 0 (0.0%) | 0 (0.0%) |
| 18 to 34 Years | 0 (0.0%) | 0 (0.0%) |
| 35 to 64 Years | 0 (0.0%) | 0 (0.0%) |
| 65 to 74 Years | 0 (0.0%) | 0 (0.0%) |
| 75 Years and over | 0 (0.0%) | 0 (0.0%) |
Disability Class: Vision Difficulty
| Age Bracket | Male | Female |
| Under 5 Years | 0 (0.0%) | 0 (0.0%) |
| 5 to 17 Years | 0 (0.0%) | 0 (0.0%) |
| 18 to 34 Years | 0 (0.0%) | 0 (0.0%) |
| 35 to 64 Years | 0 (0.0%) | 0 (0.0%) |
| 65 to 74 Years | 0 (0.0%) | 0 (0.0%) |
| 75 Years and over | 0 (0.0%) | 0 (0.0%) |
Disability Class: Cognitive Difficulty
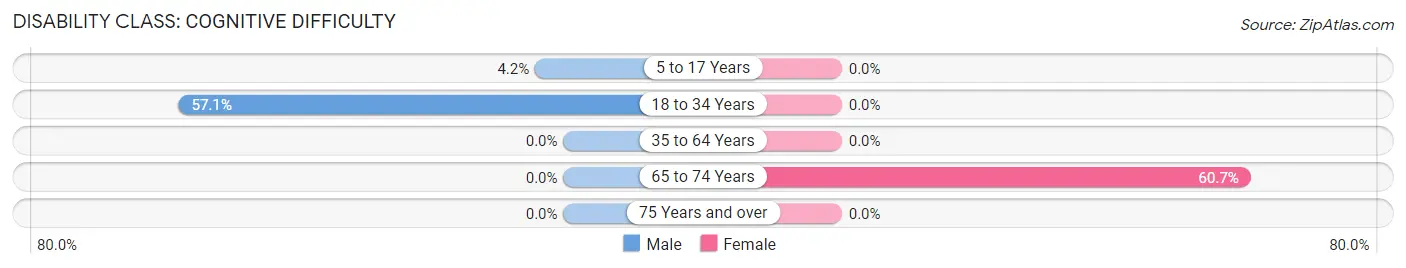
| Age Bracket | Male | Female |
| 5 to 17 Years | 6 (4.2%) | 0 (0.0%) |
| 18 to 34 Years | 48 (57.1%) | 0 (0.0%) |
| 35 to 64 Years | 0 (0.0%) | 0 (0.0%) |
| 65 to 74 Years | 0 (0.0%) | 51 (60.7%) |
| 75 Years and over | 0 (0.0%) | 0 (0.0%) |
Disability Class: Ambulatory Difficulty
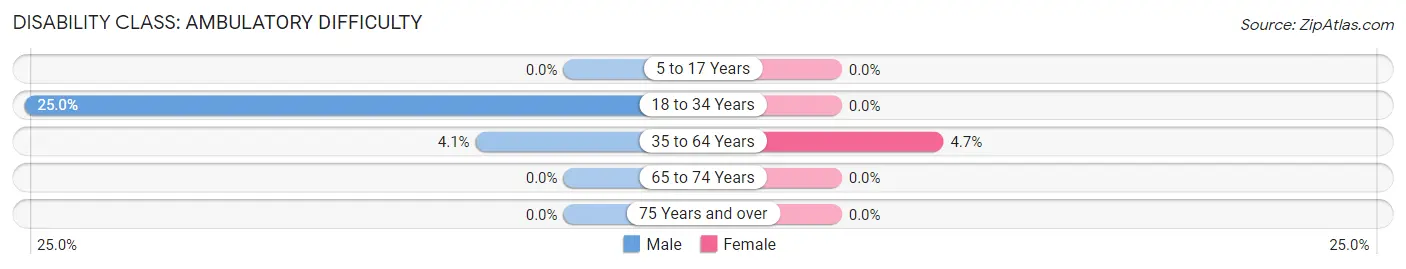
| Age Bracket | Male | Female |
| 5 to 17 Years | 0 (0.0%) | 0 (0.0%) |
| 18 to 34 Years | 21 (25.0%) | 0 (0.0%) |
| 35 to 64 Years | 12 (4.1%) | 12 (4.7%) |
| 65 to 74 Years | 0 (0.0%) | 0 (0.0%) |
| 75 Years and over | 0 (0.0%) | 0 (0.0%) |
Disability Class: Self-Care Difficulty
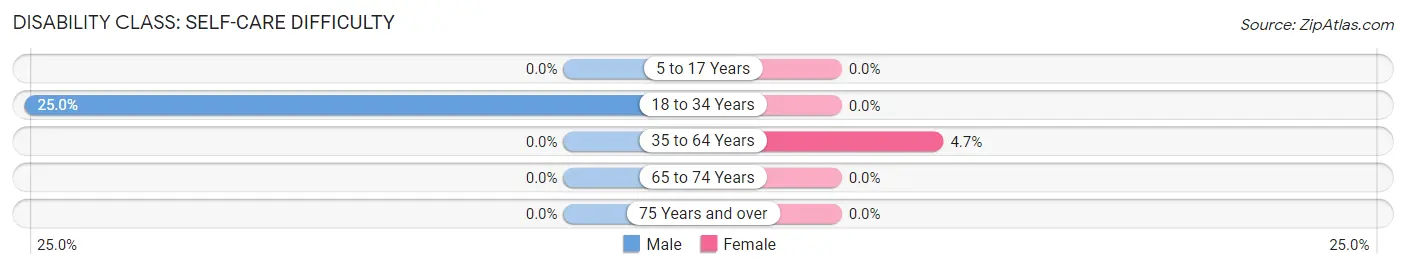
| Age Bracket | Male | Female |
| 5 to 17 Years | 0 (0.0%) | 0 (0.0%) |
| 18 to 34 Years | 21 (25.0%) | 0 (0.0%) |
| 35 to 64 Years | 0 (0.0%) | 12 (4.7%) |
| 65 to 74 Years | 0 (0.0%) | 0 (0.0%) |
| 75 Years and over | 0 (0.0%) | 0 (0.0%) |
Technology Access in Liberty
Computing Device Access in Liberty
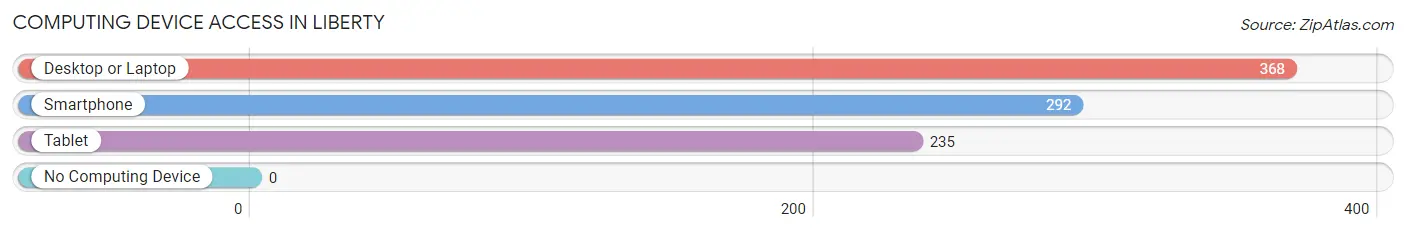
| Device Type | # Households | % Households |
| Desktop or Laptop | 368 | 100.0% |
| Smartphone | 292 | 79.3% |
| Tablet | 235 | 63.9% |
| No Computing Device | 0 | 0.0% |
| Total | 368 | 100.0% |
Internet Access in Liberty
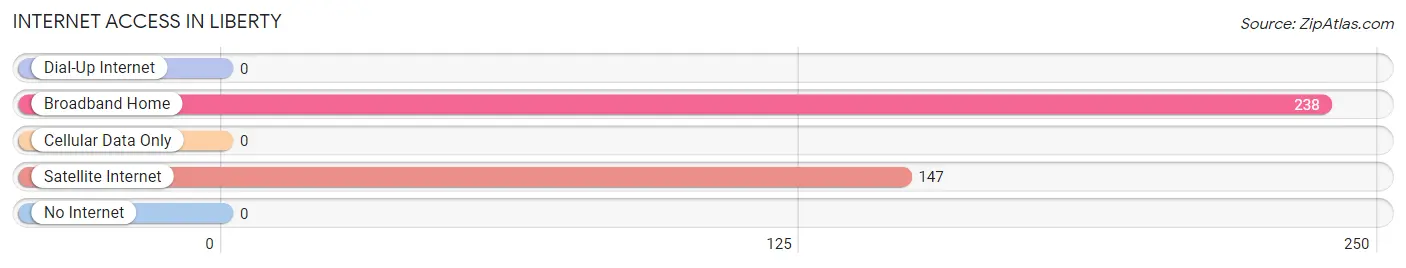
| Internet Type | # Households | % Households |
| Dial-Up Internet | 0 | 0.0% |
| Broadband Home | 238 | 64.7% |
| Cellular Data Only | 0 | 0.0% |
| Satellite Internet | 147 | 40.0% |
| No Internet | 0 | 0.0% |
| Total | 368 | 100.0% |
Liberty Summary
Liberty, Utah is a small town located in the northern part of Utah County, Utah. It is situated in the foothills of the Wasatch Mountains, about 20 miles south of Salt Lake City. The town was founded in 1877 by a group of Mormon settlers who were looking for a place to settle and build a community. The town was named after the Liberty Bell, which was a symbol of freedom and independence for the settlers.
Geography
Liberty is located in the northern part of Utah County, Utah. It is situated in the foothills of the Wasatch Mountains, about 20 miles south of Salt Lake City. The town is located at an elevation of 4,890 feet above sea level. The town is surrounded by mountains and hills, and is located in a valley. The climate in Liberty is semi-arid, with hot summers and cold winters.
Economy
The economy of Liberty is largely based on agriculture and tourism. The town is home to several farms and ranches, which produce a variety of crops and livestock. The town is also home to several tourist attractions, including the Liberty Bell Museum, the Liberty Bell Memorial Park, and the Liberty Bell Trail.
Demographics
As of the 2010 census, the population of Liberty was 1,945. The racial makeup of the town was 95.3% White, 0.3% African American, 0.2% Native American, 0.2% Asian, 0.1% Pacific Islander, 0.7% from other races, and 2.4% from two or more races. Hispanic or Latino of any race were 2.7% of the population.
The median income for a household in Liberty was $45,938, and the median income for a family was $50,938. The per capita income for the town was $20,938. About 8.3% of families and 10.2% of the population were below the poverty line, including 11.7% of those under age 18 and 8.3% of those age 65 or over.
Conclusion
Liberty, Utah is a small town located in the northern part of Utah County, Utah. It is situated in the foothills of the Wasatch Mountains, about 20 miles south of Salt Lake City. The town was founded in 1877 by a group of Mormon settlers who were looking for a place to settle and build a community. The town is surrounded by mountains and hills, and is located in a valley. The economy of Liberty is largely based on agriculture and tourism. As of the 2010 census, the population of Liberty was 1,945. The median income for a household in Liberty was $45,938, and the median income for a family was $50,938. Liberty is a small town with a rich history and a vibrant economy.
Common Questions
What is Per Capita Income in Liberty?
Per Capita income in Liberty is $35,450.
What is the Median Family Income in Liberty?
Median Family Income in Liberty is $125,429.
What is the Median Household income in Liberty?
Median Household Income in Liberty is $114,423.
What is Inequality or Gini Index in Liberty?
Inequality or Gini Index in Liberty is 0.42.
What is the Total Population of Liberty?
Total Population of Liberty is 1,216.
What is the Total Male Population of Liberty?
Total Male Population of Liberty is 588.
What is the Total Female Population of Liberty?
Total Female Population of Liberty is 628.
What is the Ratio of Males per 100 Females in Liberty?
There are 93.63 Males per 100 Females in Liberty.
What is the Ratio of Females per 100 Males in Liberty?
There are 106.80 Females per 100 Males in Liberty.
What is the Median Population Age in Liberty?
Median Population Age in Liberty is 37.4 Years.
What is the Average Family Size in Liberty
Average Family Size in Liberty is 3.8 People.
What is the Average Household Size in Liberty
Average Household Size in Liberty is 3.2 People.
How Large is the Labor Force in Liberty?
There are 589 People in the Labor Forcein in Liberty.
What is the Percentage of People in the Labor Force in Liberty?
72.6% of People are in the Labor Force in Liberty.