Zip Codes with the Highest Percentage of Population Employed in Security & Protection in West Jordan, UT
RELATED REPORTS & OPTIONS
Security & Protection
West Jordan
Compare Zip Codes
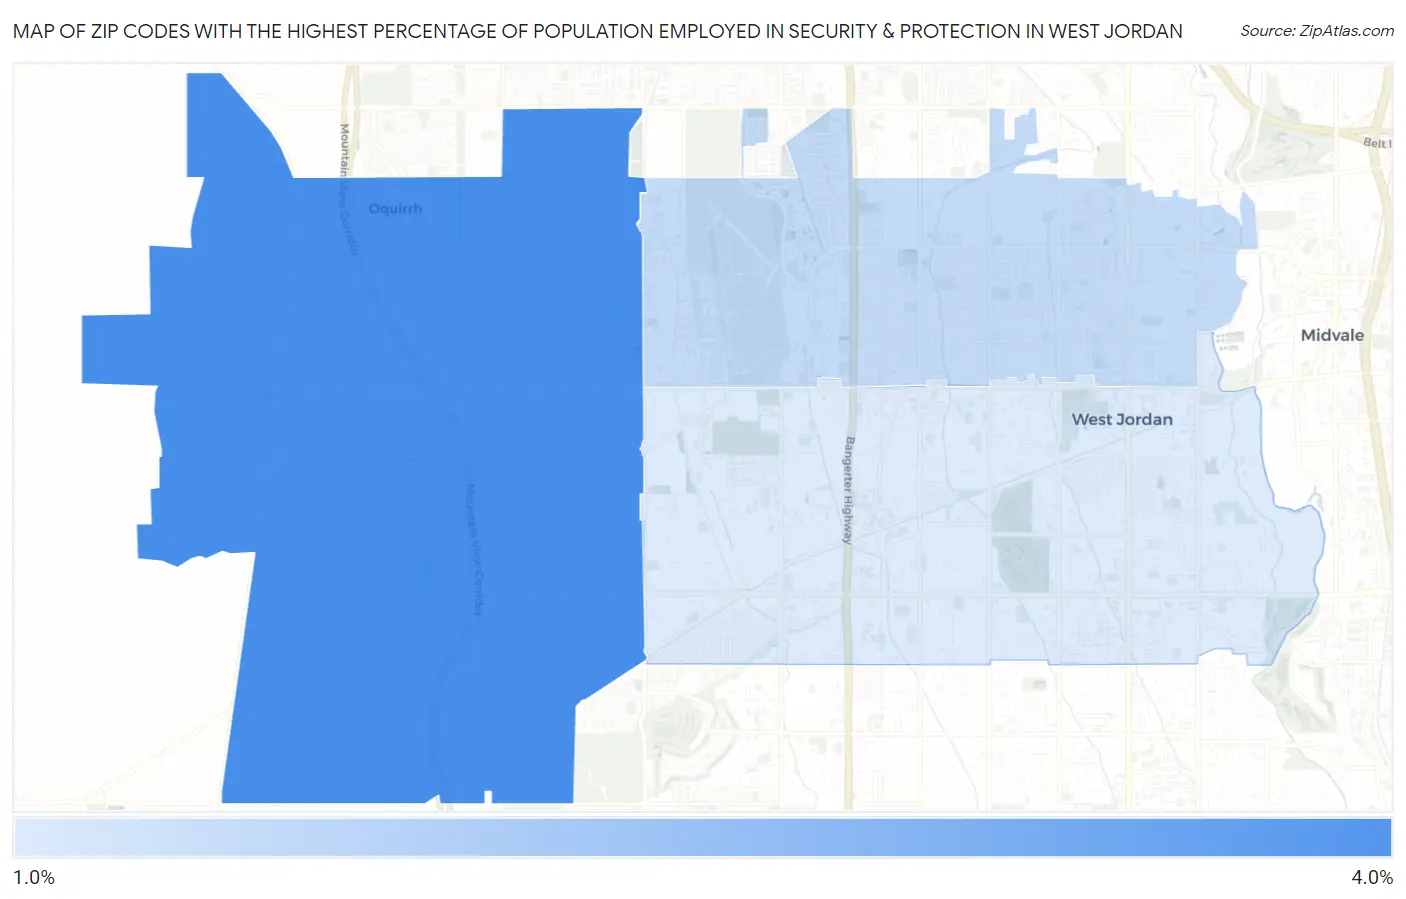
Map of Zip Codes with the Highest Percentage of Population Employed in Security & Protection in West Jordan
1.6%
3.1%
Zip Codes with the Highest Percentage of Population Employed in Security & Protection in West Jordan, UT
| Zip Code | % Employed | vs State | vs National | |
| 1. | 84081 | 3.1% | 1.6%(+1.47)#46 | 2.1%(+0.936)#6,938 |
| 2. | 84084 | 1.9% | 1.6%(+0.259)#91 | 2.1%(-0.275)#13,420 |
| 3. | 84088 | 1.6% | 1.6%(+0.009)#117 | 2.1%(-0.525)#15,236 |
1
Common Questions
What are the Top Zip Codes with the Highest Percentage of Population Employed in Security & Protection in West Jordan, UT?
Top Zip Codes with the Highest Percentage of Population Employed in Security & Protection in West Jordan, UT are:
What zip code has the Highest Percentage of Population Employed in Security & Protection in West Jordan, UT?
84081 has the Highest Percentage of Population Employed in Security & Protection in West Jordan, UT with 3.1%.
What is the Percentage of Population Employed in Security & Protection in West Jordan, UT?
Percentage of Population Employed in Security & Protection in West Jordan is 2.3%.
What is the Percentage of Population Employed in Security & Protection in Utah?
Percentage of Population Employed in Security & Protection in Utah is 1.6%.
What is the Percentage of Population Employed in Security & Protection in the United States?
Percentage of Population Employed in Security & Protection in the United States is 2.1%.