Mountain Green, UT Map & Demographics
Mountain Green Map
Mountain Green Overview
$46,454
PER CAPITA INCOME
$140,000
AVG FAMILY INCOME
$140,192
AVG HOUSEHOLD INCOME
78.6%
WAGE / INCOME GAP [ % ]
21.4¢/ $1
WAGE / INCOME GAP [ $ ]
0.32
INEQUALITY / GINI INDEX
3,646
TOTAL POPULATION
1,873
MALE POPULATION
1,773
FEMALE POPULATION
105.64
MALES / 100 FEMALES
94.66
FEMALES / 100 MALES
36.7
MEDIAN AGE
3.6
AVG FAMILY SIZE
3.4
AVG HOUSEHOLD SIZE
1,571
LABOR FORCE [ PEOPLE ]
61.4%
PERCENT IN LABOR FORCE
1.0%
UNEMPLOYMENT RATE
Mountain Green Area Codes
Income in Mountain Green
Income Overview in Mountain Green
Per Capita Income in Mountain Green is $46,454, while median incomes of families and households are $140,000 and $140,192 respectively.
| Characteristic | Number | Measure |
| Per Capita Income | 3,646 | $46,454 |
| Median Family Income | 992 | $140,000 |
| Mean Family Income | 992 | $158,741 |
| Median Household Income | 1,068 | $140,192 |
| Mean Household Income | 1,068 | $159,990 |
| Income Deficit | 992 | $0 |
| Wage / Income Gap (%) | 3,646 | 78.62% |
| Wage / Income Gap ($) | 3,646 | 21.38¢ per $1 |
| Gini / Inequality Index | 3,646 | 0.32 |
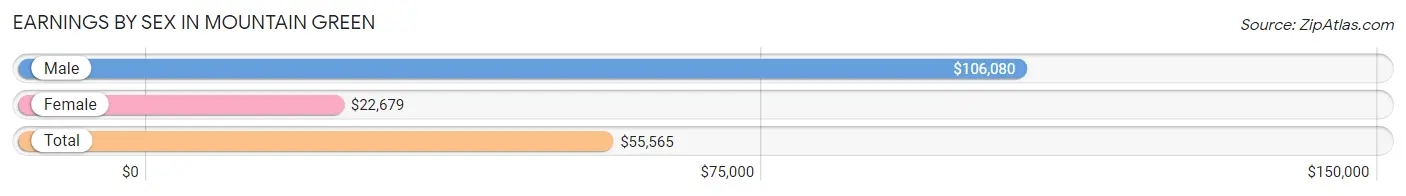
Earnings by Sex in Mountain Green
Average Earnings in Mountain Green are $55,565, $106,080 for men and $22,679 for women, a difference of 78.6%.
| Sex | Number | Average Earnings |
| Male | 959 (56.3%) | $106,080 |
| Female | 744 (43.7%) | $22,679 |
| Total | 1,703 (100.0%) | $55,565 |
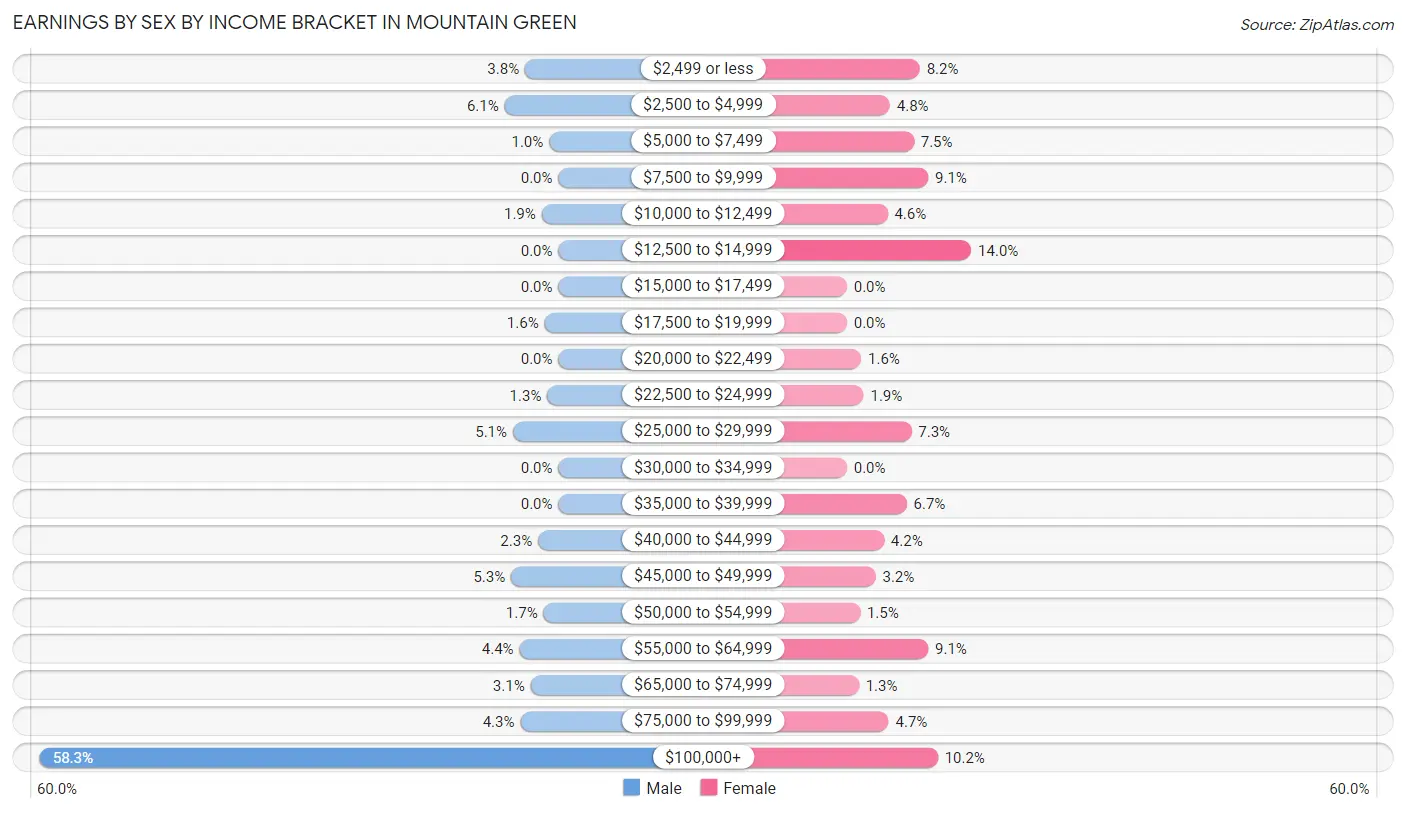
Earnings by Sex by Income Bracket in Mountain Green
The most common earnings brackets in Mountain Green are $100,000+ for men (559 | 58.3%) and $12,500 to $14,999 for women (104 | 14.0%).
| Income | Male | Female |
| $2,499 or less | 36 (3.7%) | 61 (8.2%) |
| $2,500 to $4,999 | 58 (6.0%) | 36 (4.8%) |
| $5,000 to $7,499 | 10 (1.0%) | 56 (7.5%) |
| $7,500 to $9,999 | 0 (0.0%) | 68 (9.1%) |
| $10,000 to $12,499 | 18 (1.9%) | 34 (4.6%) |
| $12,500 to $14,999 | 0 (0.0%) | 104 (14.0%) |
| $15,000 to $17,499 | 0 (0.0%) | 0 (0.0%) |
| $17,500 to $19,999 | 15 (1.6%) | 0 (0.0%) |
| $20,000 to $22,499 | 0 (0.0%) | 12 (1.6%) |
| $22,500 to $24,999 | 12 (1.3%) | 14 (1.9%) |
| $25,000 to $29,999 | 49 (5.1%) | 54 (7.3%) |
| $30,000 to $34,999 | 0 (0.0%) | 0 (0.0%) |
| $35,000 to $39,999 | 0 (0.0%) | 50 (6.7%) |
| $40,000 to $44,999 | 22 (2.3%) | 31 (4.2%) |
| $45,000 to $49,999 | 51 (5.3%) | 24 (3.2%) |
| $50,000 to $54,999 | 16 (1.7%) | 11 (1.5%) |
| $55,000 to $64,999 | 42 (4.4%) | 68 (9.1%) |
| $65,000 to $74,999 | 30 (3.1%) | 10 (1.3%) |
| $75,000 to $99,999 | 41 (4.3%) | 35 (4.7%) |
| $100,000+ | 559 (58.3%) | 76 (10.2%) |
| Total | 959 (100.0%) | 744 (100.0%) |
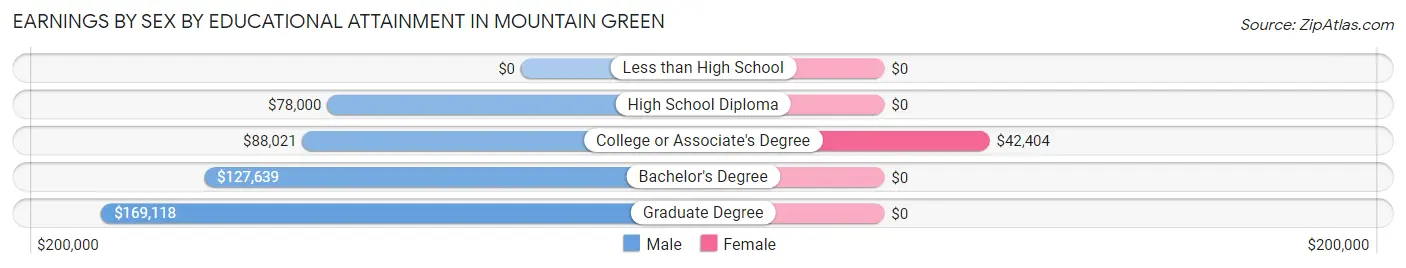
Earnings by Sex by Educational Attainment in Mountain Green
| Educational Attainment | Male Income | Female Income |
| Less than High School | - | - |
| High School Diploma | $78,000 | $0 |
| College or Associate's Degree | $88,021 | $42,404 |
| Bachelor's Degree | $127,639 | $0 |
| Graduate Degree | $169,118 | $0 |
| Total | $120,263 | $0 |
Family Income in Mountain Green
Family Income Brackets in Mountain Green
According to the Mountain Green family income data, there are 363 families falling into the $100,000 to $149,999 income range, which is the most common income bracket and makes up 36.6% of all families.
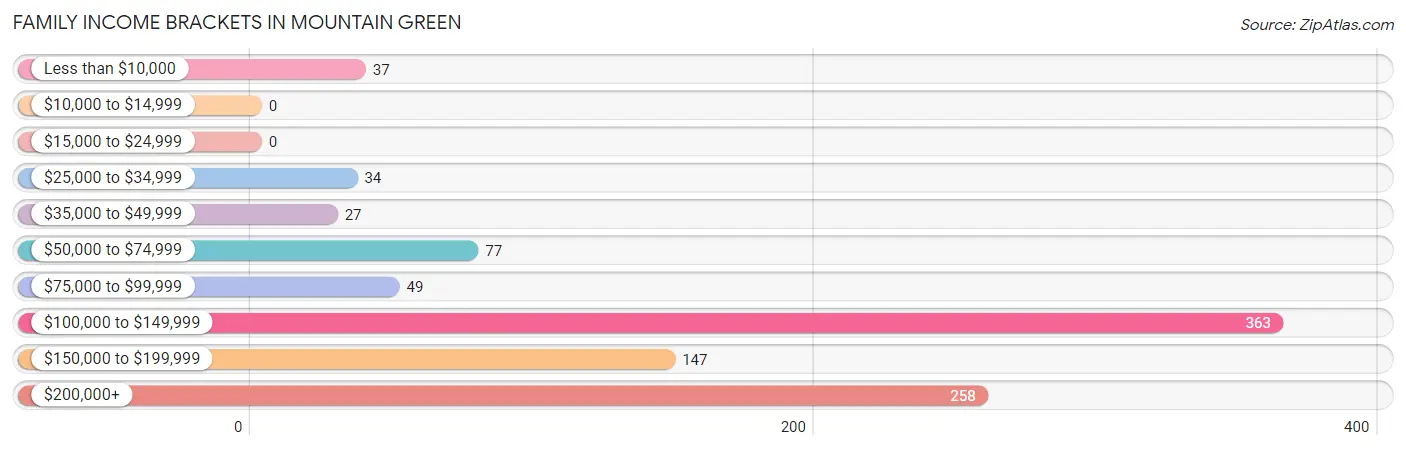
| Income Bracket | # Families | % Families |
| Less than $10,000 | 37 | 3.7% |
| $10,000 to $14,999 | 0 | 0.0% |
| $15,000 to $24,999 | 0 | 0.0% |
| $25,000 to $34,999 | 34 | 3.4% |
| $35,000 to $49,999 | 27 | 2.7% |
| $50,000 to $74,999 | 77 | 7.8% |
| $75,000 to $99,999 | 49 | 4.9% |
| $100,000 to $149,999 | 363 | 36.6% |
| $150,000 to $199,999 | 147 | 14.8% |
| $200,000+ | 258 | 26.0% |
Family Income by Famaliy Size in Mountain Green
4-person families (95 | 9.6%) account for the highest median family income in Mountain Green with $250,001 per family, while 4-person families (95 | 9.6%) have the highest median income of $62,500 per family member.
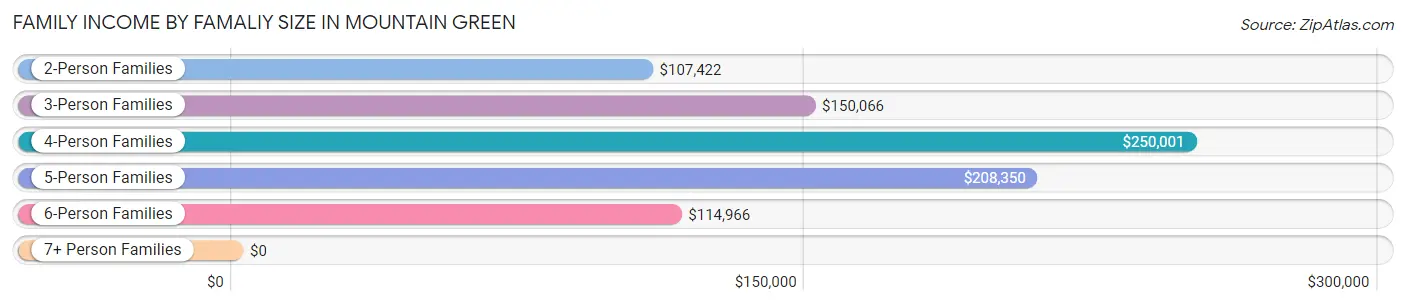
| Income Bracket | # Families | Median Income |
| 2-Person Families | 445 (44.9%) | $107,422 |
| 3-Person Families | 113 (11.4%) | $150,066 |
| 4-Person Families | 95 (9.6%) | $250,001 |
| 5-Person Families | 243 (24.5%) | $208,350 |
| 6-Person Families | 73 (7.4%) | $114,966 |
| 7+ Person Families | 23 (2.3%) | $0 |
| Total | 992 (100.0%) | $140,000 |
Family Income by Number of Earners in Mountain Green
The median family income in Mountain Green is $140,000, with families comprising 3+ earners (187) having the highest median family income of $198,984, while families with no earners (165) have the lowest median family income of $93,438, accounting for 18.9% and 16.6% of families, respectively.
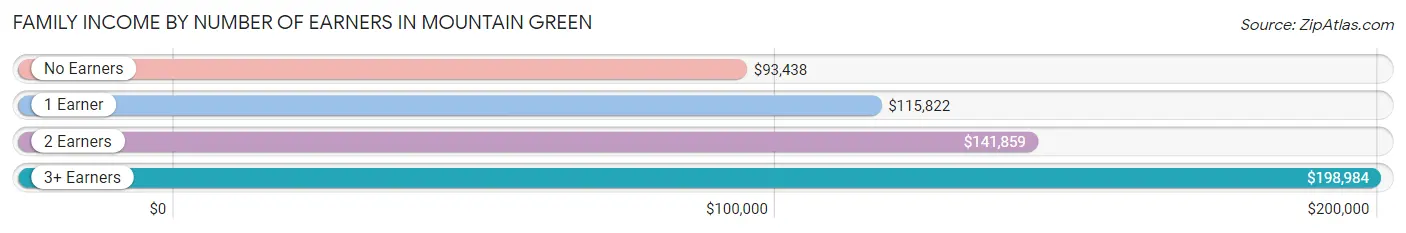
| Number of Earners | # Families | Median Income |
| No Earners | 165 (16.6%) | $93,438 |
| 1 Earner | 323 (32.6%) | $115,822 |
| 2 Earners | 317 (32.0%) | $141,859 |
| 3+ Earners | 187 (18.9%) | $198,984 |
| Total | 992 (100.0%) | $140,000 |
Household Income in Mountain Green
Household Income Brackets in Mountain Green
With 384 households falling in the category, the $100,000 to $149,999 income range is the most frequent in Mountain Green, accounting for 36.0% of all households.
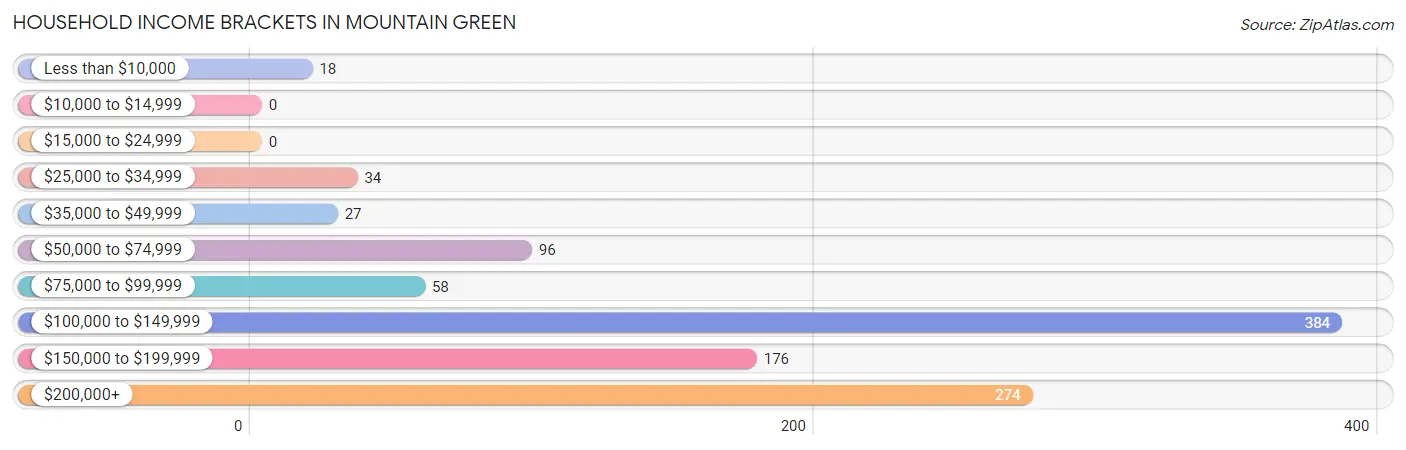
| Income Bracket | # Households | % Households |
| Less than $10,000 | 18 | 1.7% |
| $10,000 to $14,999 | 0 | 0.0% |
| $15,000 to $24,999 | 0 | 0.0% |
| $25,000 to $34,999 | 34 | 3.2% |
| $35,000 to $49,999 | 27 | 2.5% |
| $50,000 to $74,999 | 96 | 9.0% |
| $75,000 to $99,999 | 58 | 5.4% |
| $100,000 to $149,999 | 384 | 36.0% |
| $150,000 to $199,999 | 176 | 16.5% |
| $200,000+ | 274 | 25.7% |
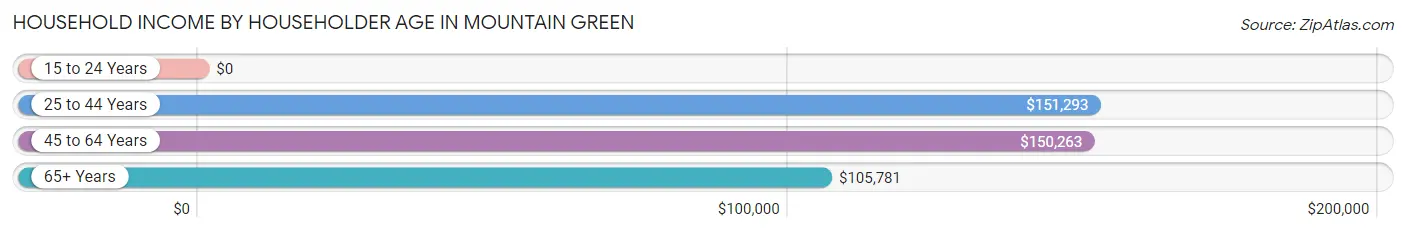
Household Income by Householder Age in Mountain Green
The median household income in Mountain Green is $140,192, with the highest median household income of $151,293 found in the 25 to 44 years age bracket for the primary householder. A total of 336 households (31.5%) fall into this category. Meanwhile, the 15 to 24 years age bracket for the primary householder has the lowest median household income of $0, with 22 households (2.1%) in this group.
| Income Bracket | # Households | Median Income |
| 15 to 24 Years | 22 (2.1%) | $0 |
| 25 to 44 Years | 336 (31.5%) | $151,293 |
| 45 to 64 Years | 486 (45.5%) | $150,263 |
| 65+ Years | 224 (21.0%) | $105,781 |
| Total | 1,068 (100.0%) | $140,192 |
Poverty in Mountain Green
Income Below Poverty by Sex and Age in Mountain Green
With 2.9% poverty level for males and 2.1% for females among the residents of Mountain Green, under 5 year old males and 65 to 74 year old females are the most vulnerable to poverty, with 36 males (30.2%) and 18 females (9.8%) in their respective age groups living below the poverty level.
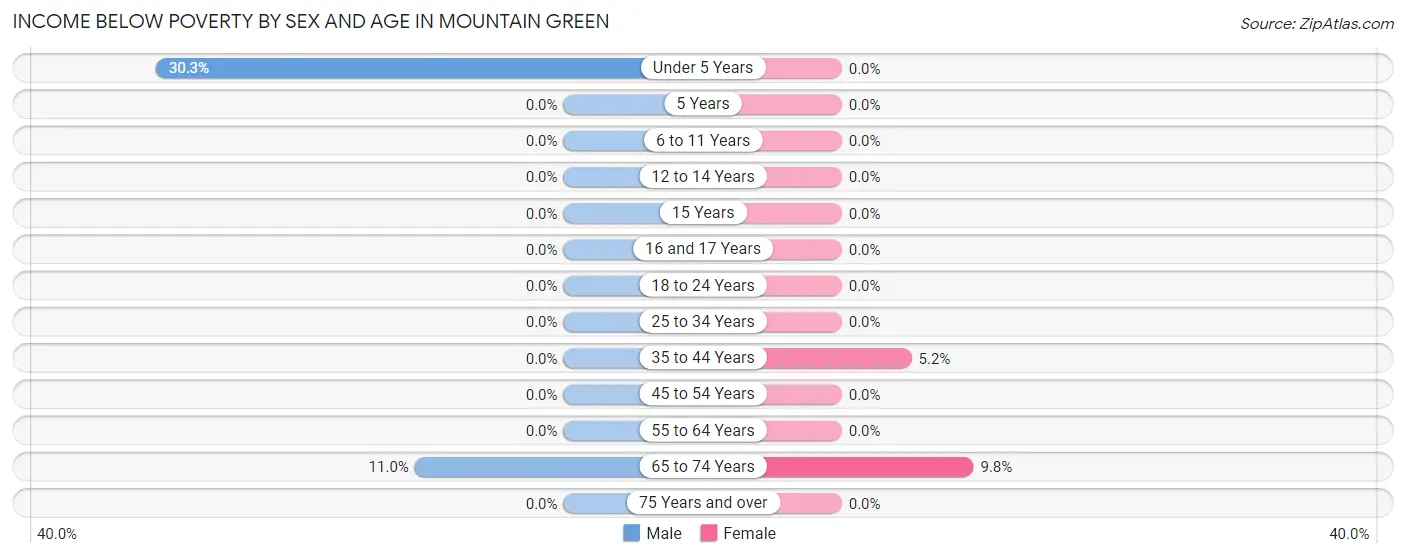
| Age Bracket | Male | Female |
| Under 5 Years | 36 (30.2%) | 0 (0.0%) |
| 5 Years | 0 (0.0%) | 0 (0.0%) |
| 6 to 11 Years | 0 (0.0%) | 0 (0.0%) |
| 12 to 14 Years | 0 (0.0%) | 0 (0.0%) |
| 15 Years | 0 (0.0%) | 0 (0.0%) |
| 16 and 17 Years | 0 (0.0%) | 0 (0.0%) |
| 18 to 24 Years | 0 (0.0%) | 0 (0.0%) |
| 25 to 34 Years | 0 (0.0%) | 0 (0.0%) |
| 35 to 44 Years | 0 (0.0%) | 19 (5.2%) |
| 45 to 54 Years | 0 (0.0%) | 0 (0.0%) |
| 55 to 64 Years | 0 (0.0%) | 0 (0.0%) |
| 65 to 74 Years | 18 (11.0%) | 18 (9.8%) |
| 75 Years and over | 0 (0.0%) | 0 (0.0%) |
| Total | 54 (2.9%) | 37 (2.1%) |
Income Above Poverty by Sex and Age in Mountain Green
According to the poverty statistics in Mountain Green, males aged 5 years and females aged under 5 years are the age groups that are most secure financially, with 100.0% of males and 100.0% of females in these age groups living above the poverty line.
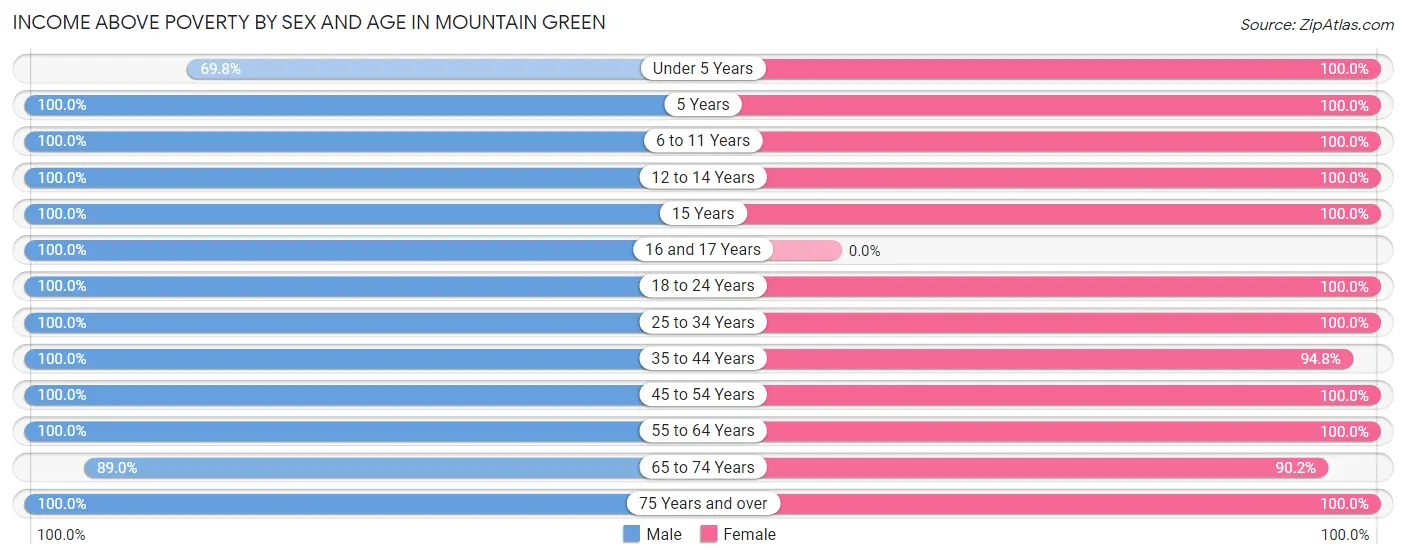
| Age Bracket | Male | Female |
| Under 5 Years | 83 (69.8%) | 51 (100.0%) |
| 5 Years | 77 (100.0%) | 9 (100.0%) |
| 6 to 11 Years | 243 (100.0%) | 168 (100.0%) |
| 12 to 14 Years | 54 (100.0%) | 261 (100.0%) |
| 15 Years | 78 (100.0%) | 27 (100.0%) |
| 16 and 17 Years | 59 (100.0%) | 0 (0.0%) |
| 18 to 24 Years | 222 (100.0%) | 185 (100.0%) |
| 25 to 34 Years | 57 (100.0%) | 55 (100.0%) |
| 35 to 44 Years | 270 (100.0%) | 348 (94.8%) |
| 45 to 54 Years | 295 (100.0%) | 278 (100.0%) |
| 55 to 64 Years | 160 (100.0%) | 98 (100.0%) |
| 65 to 74 Years | 145 (89.0%) | 166 (90.2%) |
| 75 Years and over | 76 (100.0%) | 90 (100.0%) |
| Total | 1,819 (97.1%) | 1,736 (97.9%) |
Income Below Poverty Among Married-Couple Families in Mountain Green
The poverty statistics for married-couple families in Mountain Green show that 2.0% or 18 of the total 910 families live below the poverty line. Families with no children have the highest poverty rate of 3.8%, comprising of 18 families. On the other hand, families with 1 or 2 children have the lowest poverty rate of 0.0%, which includes 0 families.
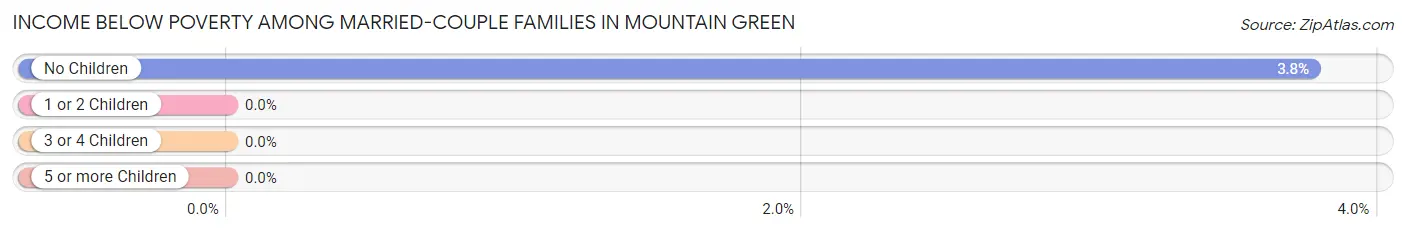
| Children | Above Poverty | Below Poverty |
| No Children | 460 (96.2%) | 18 (3.8%) |
| 1 or 2 Children | 216 (100.0%) | 0 (0.0%) |
| 3 or 4 Children | 216 (100.0%) | 0 (0.0%) |
| 5 or more Children | 0 (0.0%) | 0 (0.0%) |
| Total | 892 (98.0%) | 18 (2.0%) |
Income Below Poverty Among Single-Parent Households in Mountain Green
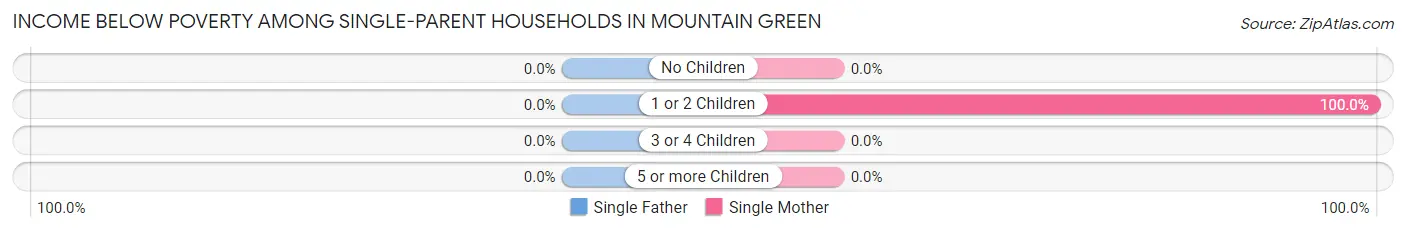
| Children | Single Father | Single Mother |
| No Children | 0 (0.0%) | 0 (0.0%) |
| 1 or 2 Children | 0 (0.0%) | 19 (100.0%) |
| 3 or 4 Children | 0 (0.0%) | 0 (0.0%) |
| 5 or more Children | 0 (0.0%) | 0 (0.0%) |
| Total | 0 (0.0%) | 19 (46.3%) |
Income Below Poverty Among Married-Couple vs Single-Parent Households in Mountain Green
The poverty data for Mountain Green shows that 18 of the married-couple family households (2.0%) and 19 of the single-parent households (23.2%) are living below the poverty level. Within the married-couple family households, those with no children have the highest poverty rate, with 18 households (3.8%) falling below the poverty line. Among the single-parent households, those with 1 or 2 children have the highest poverty rate, with 19 household (38.8%) living below poverty.
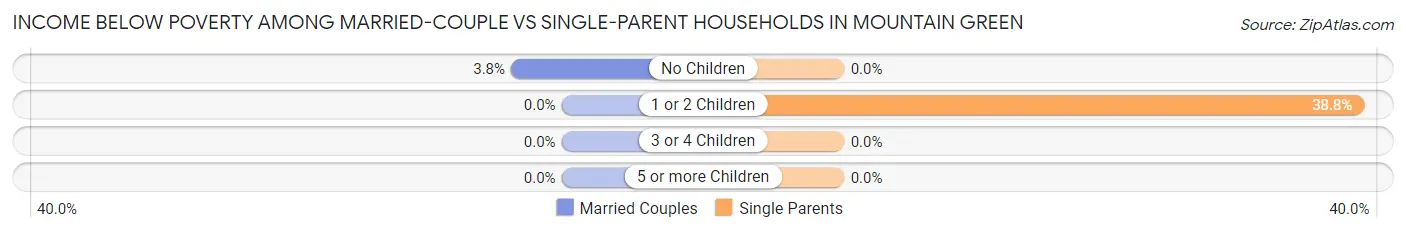
| Children | Married-Couple Families | Single-Parent Households |
| No Children | 18 (3.8%) | 0 (0.0%) |
| 1 or 2 Children | 0 (0.0%) | 19 (38.8%) |
| 3 or 4 Children | 0 (0.0%) | 0 (0.0%) |
| 5 or more Children | 0 (0.0%) | 0 (0.0%) |
| Total | 18 (2.0%) | 19 (23.2%) |
Race in Mountain Green
The most populous races in Mountain Green are White / Caucasian (3,344 | 91.7%), Two or more Races (215 | 5.9%), and Hispanic or Latino (138 | 3.8%).
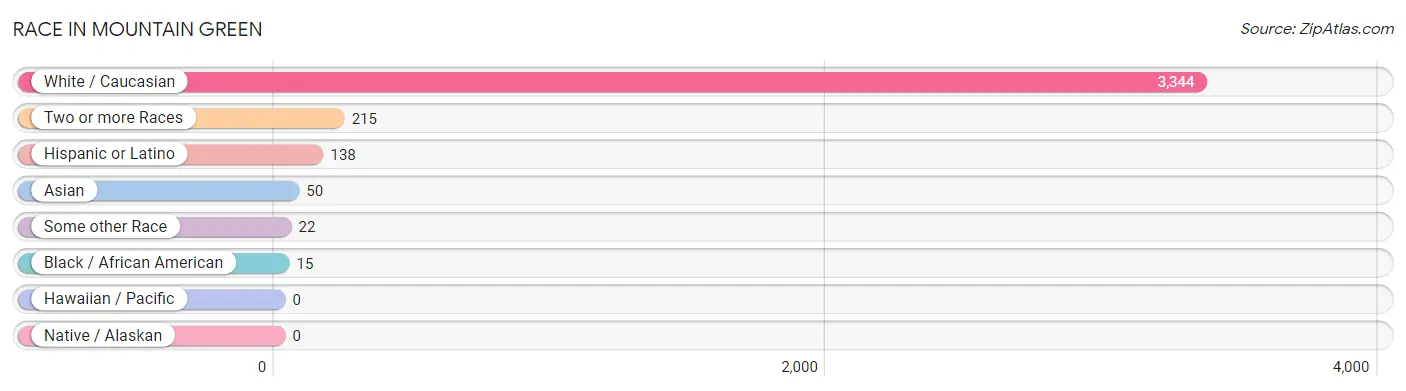
| Race | # Population | % Population |
| Asian | 50 | 1.4% |
| Black / African American | 15 | 0.4% |
| Hawaiian / Pacific | 0 | 0.0% |
| Hispanic or Latino | 138 | 3.8% |
| Native / Alaskan | 0 | 0.0% |
| White / Caucasian | 3,344 | 91.7% |
| Two or more Races | 215 | 5.9% |
| Some other Race | 22 | 0.6% |
| Total | 3,646 | 100.0% |
Ancestry in Mountain Green
The most populous ancestries reported in Mountain Green are English (1,371 | 37.6%), European (380 | 10.4%), German (329 | 9.0%), Danish (257 | 7.0%), and Swiss (193 | 5.3%), together accounting for 69.4% of all Mountain Green residents.
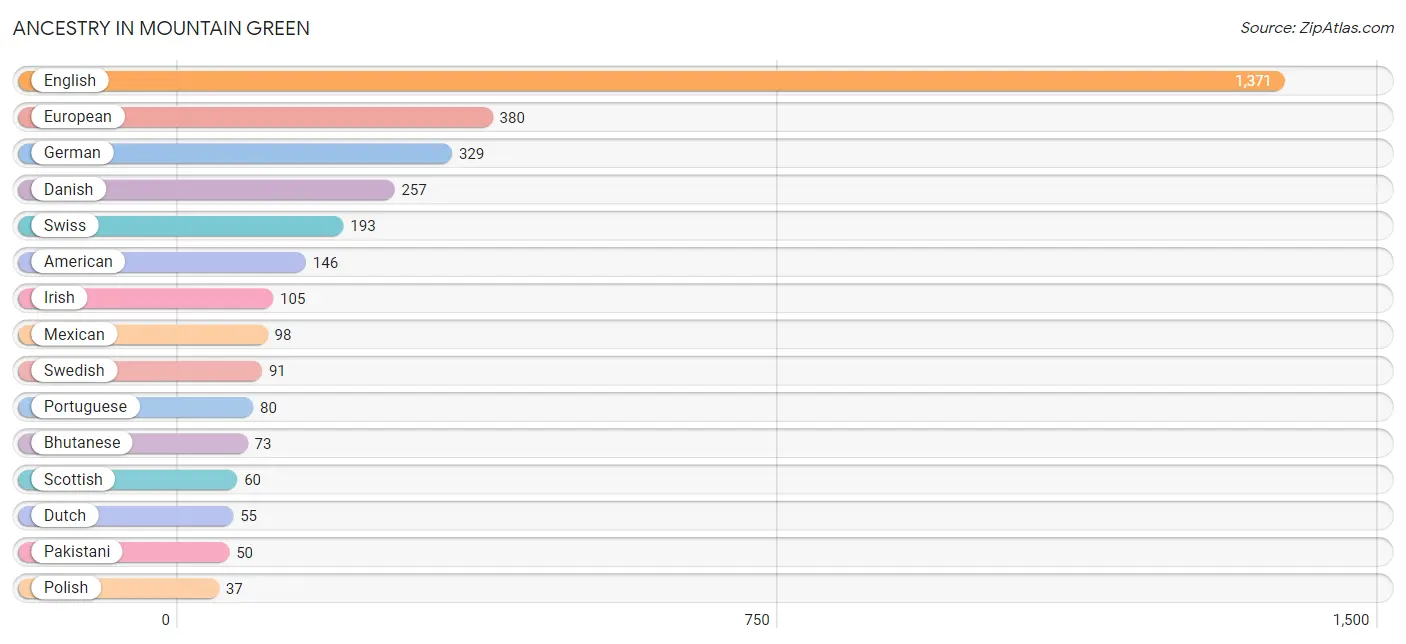
| Ancestry | # Population | % Population |
| American | 146 | 4.0% |
| Bhutanese | 73 | 2.0% |
| British | 34 | 0.9% |
| Cuban | 9 | 0.3% |
| Danish | 257 | 7.0% |
| Dutch | 55 | 1.5% |
| English | 1,371 | 37.6% |
| Estonian | 17 | 0.5% |
| European | 380 | 10.4% |
| Finnish | 32 | 0.9% |
| French | 32 | 0.9% |
| French Canadian | 18 | 0.5% |
| German | 329 | 9.0% |
| Irish | 105 | 2.9% |
| Italian | 22 | 0.6% |
| Lithuanian | 8 | 0.2% |
| Mexican | 98 | 2.7% |
| Norwegian | 16 | 0.4% |
| Pakistani | 50 | 1.4% |
| Polish | 37 | 1.0% |
| Portuguese | 80 | 2.2% |
| Puerto Rican | 9 | 0.3% |
| Scandinavian | 29 | 0.8% |
| Scottish | 60 | 1.7% |
| Slovak | 8 | 0.2% |
| South American | 22 | 0.6% |
| Swedish | 91 | 2.5% |
| Swiss | 193 | 5.3% |
| Ukrainian | 16 | 0.4% |
| Uruguayan | 22 | 0.6% |
| Welsh | 28 | 0.8% | View All 31 Rows |
Immigrants in Mountain Green
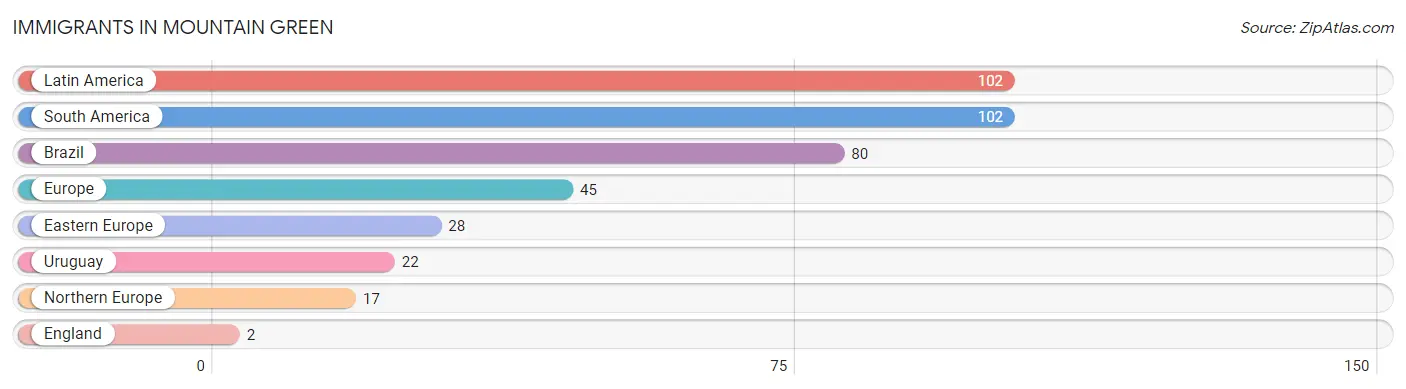
The most numerous immigrant groups reported in Mountain Green came from Latin America (102 | 2.8%), South America (102 | 2.8%), Brazil (80 | 2.2%), Europe (45 | 1.2%), and Eastern Europe (28 | 0.8%), together accounting for 9.8% of all Mountain Green residents.
| Immigration Origin | # Population | % Population |
| Brazil | 80 | 2.2% |
| Eastern Europe | 28 | 0.8% |
| England | 2 | 0.1% |
| Europe | 45 | 1.2% |
| Latin America | 102 | 2.8% |
| Northern Europe | 17 | 0.5% |
| South America | 102 | 2.8% |
| Uruguay | 22 | 0.6% | View All 8 Rows |
Sex and Age in Mountain Green
Sex and Age in Mountain Green
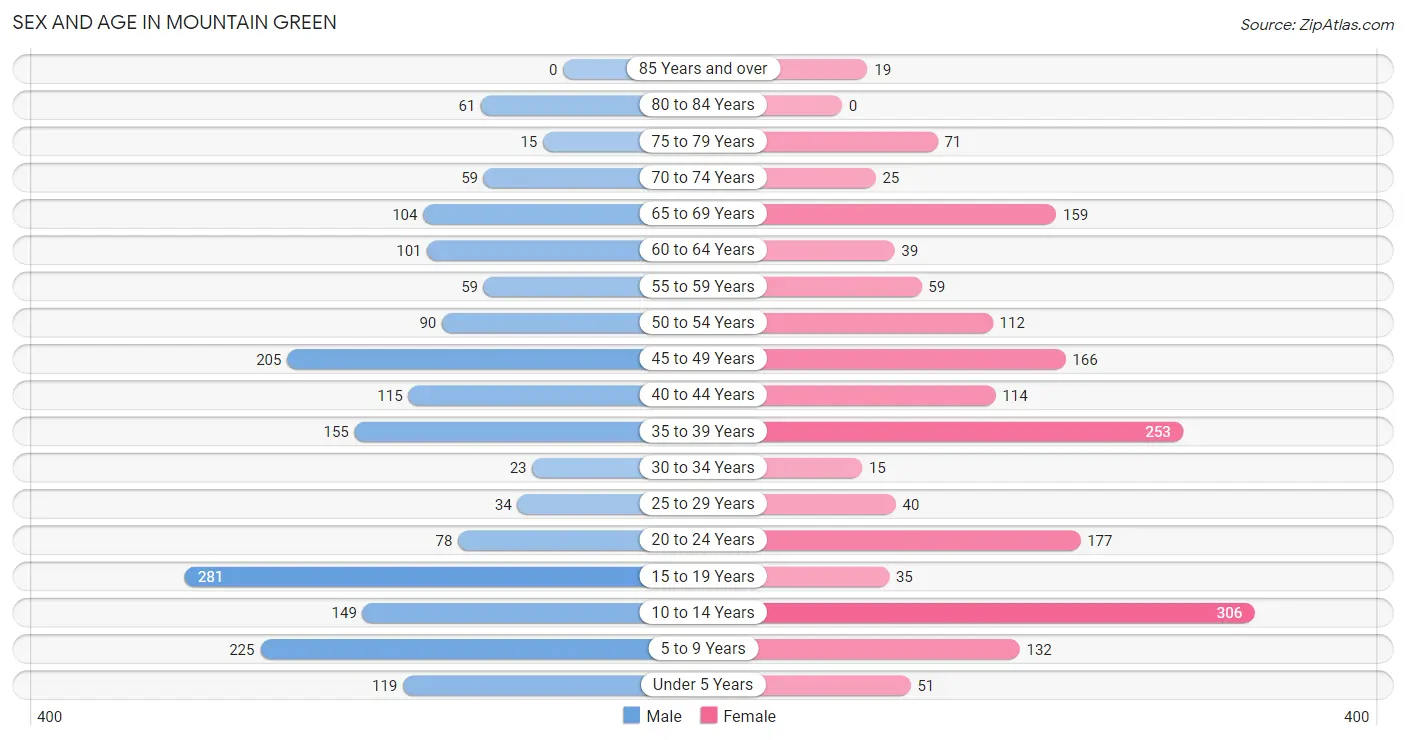
The most populous age groups in Mountain Green are 15 to 19 Years (281 | 15.0%) for men and 10 to 14 Years (306 | 17.3%) for women.
| Age Bracket | Male | Female |
| Under 5 Years | 119 (6.4%) | 51 (2.9%) |
| 5 to 9 Years | 225 (12.0%) | 132 (7.4%) |
| 10 to 14 Years | 149 (8.0%) | 306 (17.3%) |
| 15 to 19 Years | 281 (15.0%) | 35 (2.0%) |
| 20 to 24 Years | 78 (4.2%) | 177 (10.0%) |
| 25 to 29 Years | 34 (1.8%) | 40 (2.3%) |
| 30 to 34 Years | 23 (1.2%) | 15 (0.9%) |
| 35 to 39 Years | 155 (8.3%) | 253 (14.3%) |
| 40 to 44 Years | 115 (6.1%) | 114 (6.4%) |
| 45 to 49 Years | 205 (11.0%) | 166 (9.4%) |
| 50 to 54 Years | 90 (4.8%) | 112 (6.3%) |
| 55 to 59 Years | 59 (3.2%) | 59 (3.3%) |
| 60 to 64 Years | 101 (5.4%) | 39 (2.2%) |
| 65 to 69 Years | 104 (5.6%) | 159 (9.0%) |
| 70 to 74 Years | 59 (3.2%) | 25 (1.4%) |
| 75 to 79 Years | 15 (0.8%) | 71 (4.0%) |
| 80 to 84 Years | 61 (3.3%) | 0 (0.0%) |
| 85 Years and over | 0 (0.0%) | 19 (1.1%) |
| Total | 1,873 (100.0%) | 1,773 (100.0%) |
Families and Households in Mountain Green
Median Family Size in Mountain Green
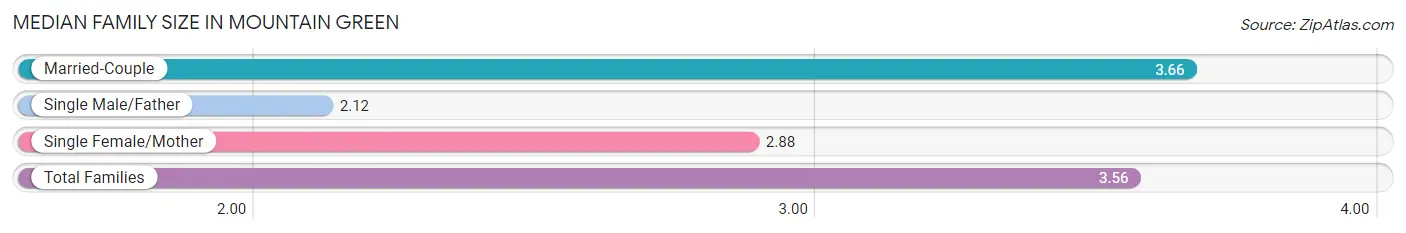
The median family size in Mountain Green is 3.56 persons per family, with married-couple families (910 | 91.7%) accounting for the largest median family size of 3.66 persons per family. On the other hand, single male/father families (41 | 4.1%) represent the smallest median family size with 2.12 persons per family.
| Family Type | # Families | Family Size |
| Married-Couple | 910 (91.7%) | 3.66 |
| Single Male/Father | 41 (4.1%) | 2.12 |
| Single Female/Mother | 41 (4.1%) | 2.88 |
| Total Families | 992 (100.0%) | 3.56 |
Median Household Size in Mountain Green
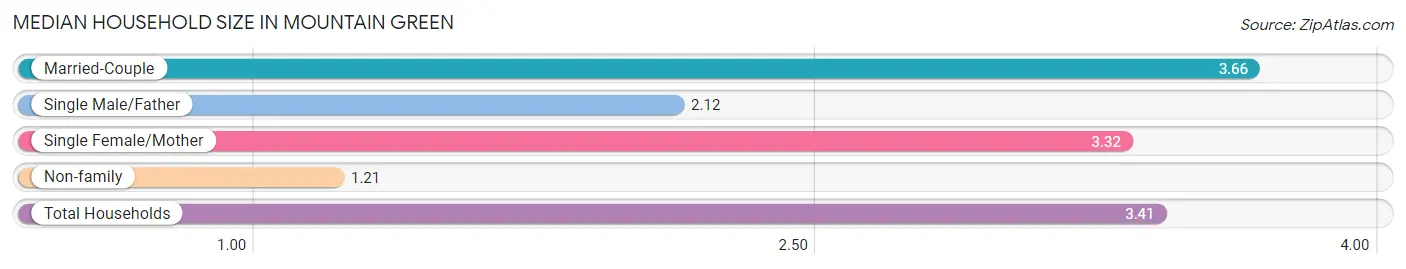
The median household size in Mountain Green is 3.41 persons per household, with married-couple households (910 | 85.2%) accounting for the largest median household size of 3.66 persons per household. non-family households (76 | 7.1%) represent the smallest median household size with 1.21 persons per household.
| Household Type | # Households | Household Size |
| Married-Couple | 910 (85.2%) | 3.66 |
| Single Male/Father | 41 (3.8%) | 2.12 |
| Single Female/Mother | 41 (3.8%) | 3.32 |
| Non-family | 76 (7.1%) | 1.21 |
| Total Households | 1,068 (100.0%) | 3.41 |
Household Size by Marriage Status in Mountain Green
Out of a total of 1,068 households in Mountain Green, 992 (92.9%) are family households, while 76 (7.1%) are nonfamily households. The most numerous type of family households are 2-person households, comprising 445, and the most common type of nonfamily households are 1-person households, comprising 60.
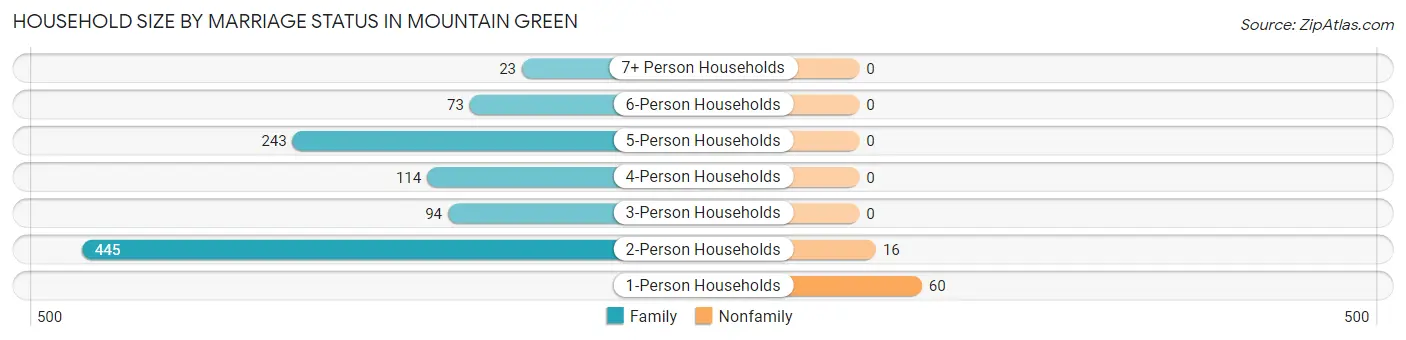
| Household Size | Family Households | Nonfamily Households |
| 1-Person Households | - | 60 (5.6%) |
| 2-Person Households | 445 (41.7%) | 16 (1.5%) |
| 3-Person Households | 94 (8.8%) | 0 (0.0%) |
| 4-Person Households | 114 (10.7%) | 0 (0.0%) |
| 5-Person Households | 243 (22.8%) | 0 (0.0%) |
| 6-Person Households | 73 (6.8%) | 0 (0.0%) |
| 7+ Person Households | 23 (2.1%) | 0 (0.0%) |
| Total | 992 (92.9%) | 76 (7.1%) |
Female Fertility in Mountain Green
Fertility by Age in Mountain Green
Average fertility rate in Mountain Green is 23.0 births per 1,000 women. Women in the age bracket of 20 to 34 years have the highest fertility rate with 86.0 births per 1,000 women. Women in the age bracket of 20 to 34 years acount for 100.0% of all women with births.
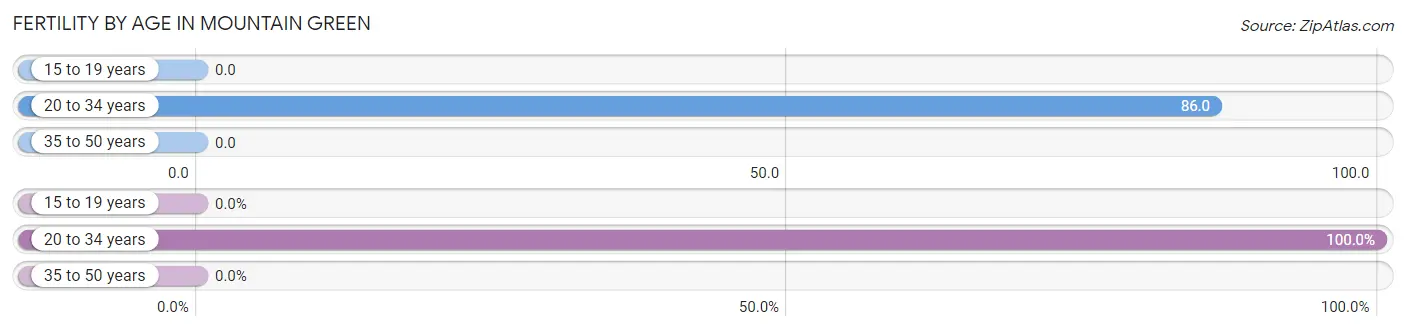
| Age Bracket | Women with Births | Births / 1,000 Women |
| 15 to 19 years | 0 (0.0%) | 0.0 |
| 20 to 34 years | 20 (100.0%) | 86.0 |
| 35 to 50 years | 0 (0.0%) | 0.0 |
| Total | 20 (100.0%) | 23.0 |
Fertility by Age by Marriage Status in Mountain Green
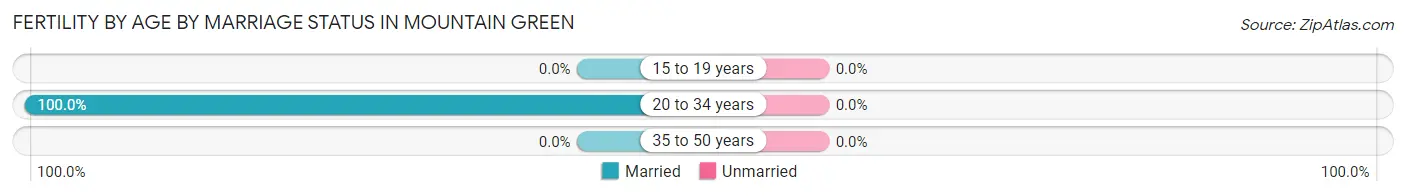
| Age Bracket | Married | Unmarried |
| 15 to 19 years | 0 (0.0%) | 0 (0.0%) |
| 20 to 34 years | 20 (100.0%) | 0 (0.0%) |
| 35 to 50 years | 0 (0.0%) | 0 (0.0%) |
| Total | 20 (100.0%) | 0 (0.0%) |
Fertility by Education in Mountain Green
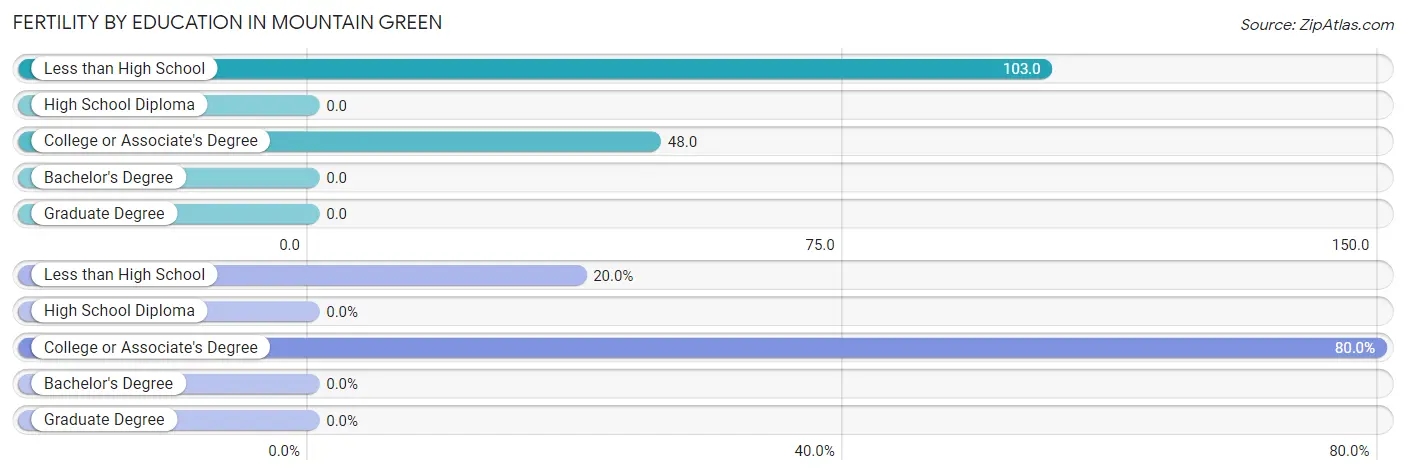
| Educational Attainment | Women with Births | Births / 1,000 Women |
| Less than High School | 4 (20.0%) | 103.0 |
| High School Diploma | 0 (0.0%) | 0.0 |
| College or Associate's Degree | 16 (80.0%) | 48.0 |
| Bachelor's Degree | 0 (0.0%) | 0.0 |
| Graduate Degree | 0 (0.0%) | 0.0 |
| Total | 20 (100.0%) | 23.0 |
Fertility by Education by Marriage Status in Mountain Green
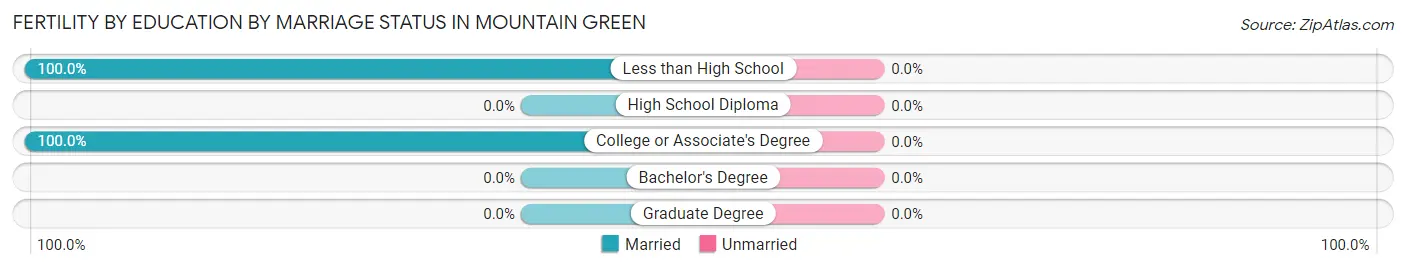
| Educational Attainment | Married | Unmarried |
| Less than High School | 4 (100.0%) | 0 (0.0%) |
| High School Diploma | 0 (0.0%) | 0 (0.0%) |
| College or Associate's Degree | 16 (100.0%) | 0 (0.0%) |
| Bachelor's Degree | 0 (0.0%) | 0 (0.0%) |
| Graduate Degree | 0 (0.0%) | 0 (0.0%) |
| Total | 20 (100.0%) | 0 (0.0%) |
Employment Characteristics in Mountain Green
Employment by Class of Employer in Mountain Green
Among the 1,477 employed individuals in Mountain Green, private company employees (798 | 54.0%), self-employed (incorporated) (199 | 13.5%), and local government employees (170 | 11.5%) make up the most common classes of employment.
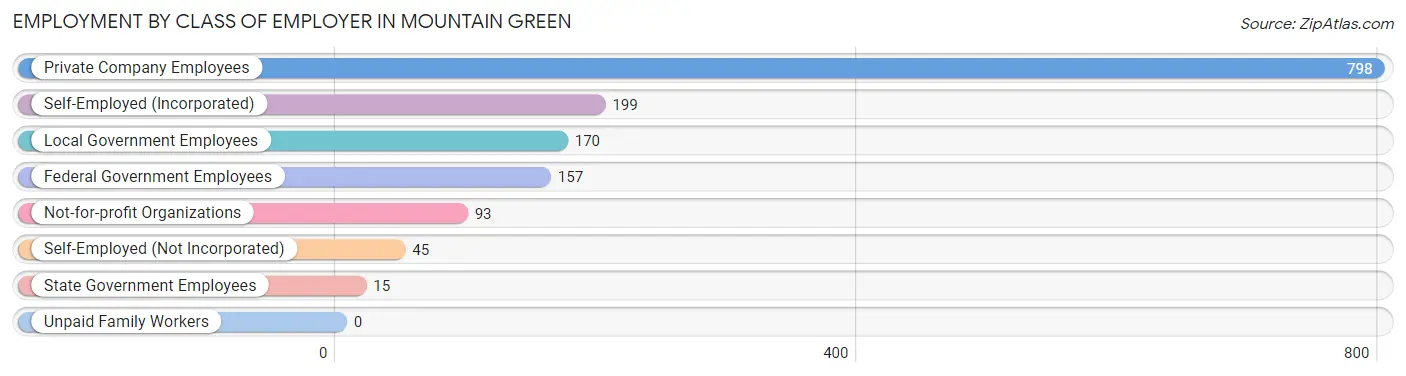
| Employer Class | # Employees | % Employees |
| Private Company Employees | 798 | 54.0% |
| Self-Employed (Incorporated) | 199 | 13.5% |
| Self-Employed (Not Incorporated) | 45 | 3.0% |
| Not-for-profit Organizations | 93 | 6.3% |
| Local Government Employees | 170 | 11.5% |
| State Government Employees | 15 | 1.0% |
| Federal Government Employees | 157 | 10.6% |
| Unpaid Family Workers | 0 | 0.0% |
| Total | 1,477 | 100.0% |
Employment Status by Age in Mountain Green
According to the labor force statistics for Mountain Green, out of the total population over 16 years of age (2,559), 61.4% or 1,571 individuals are in the labor force, with 1.0% or 16 of them unemployed. The age group with the highest labor force participation rate is 55 to 59 years, with 98.3% or 116 individuals in the labor force. Within the labor force, the 16 to 19 years age range has the highest percentage of unemployed individuals, with 18.5% or 15 of them being unemployed.
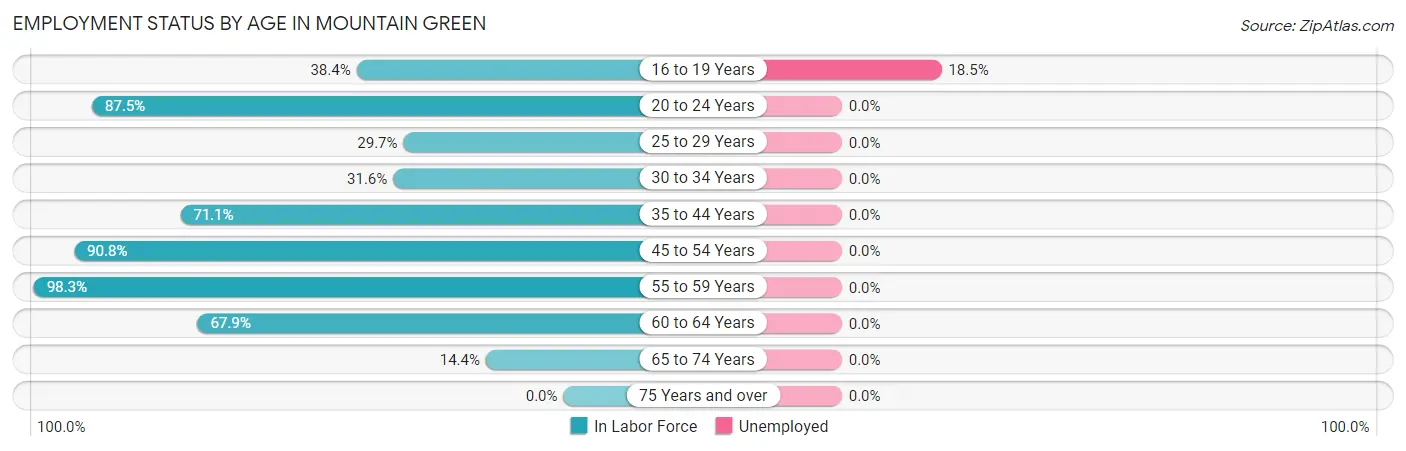
| Age Bracket | In Labor Force | Unemployed |
| 16 to 19 Years | 81 (38.4%) | 15 (18.5%) |
| 20 to 24 Years | 223 (87.5%) | 0 (0.0%) |
| 25 to 29 Years | 22 (29.7%) | 0 (0.0%) |
| 30 to 34 Years | 12 (31.6%) | 0 (0.0%) |
| 35 to 44 Years | 453 (71.1%) | 0 (0.0%) |
| 45 to 54 Years | 520 (90.8%) | 0 (0.0%) |
| 55 to 59 Years | 116 (98.3%) | 0 (0.0%) |
| 60 to 64 Years | 95 (67.9%) | 0 (0.0%) |
| 65 to 74 Years | 50 (14.4%) | 0 (0.0%) |
| 75 Years and over | 0 (0.0%) | 0 (0.0%) |
| Total | 1,571 (61.4%) | 16 (1.0%) |
Employment Status by Educational Attainment in Mountain Green
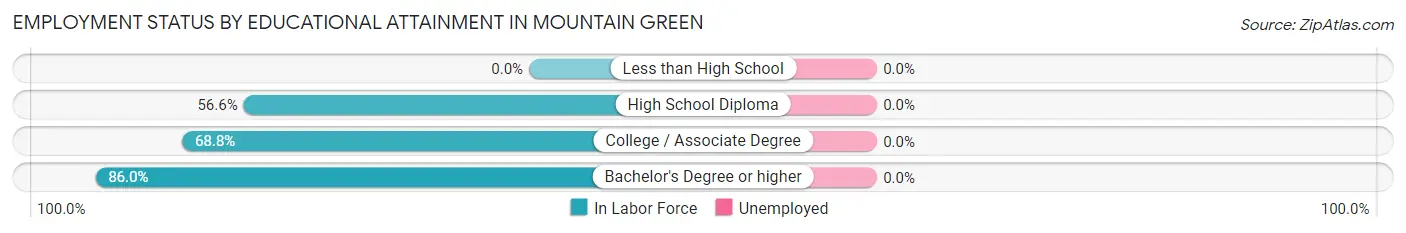
| Educational Attainment | In Labor Force | Unemployed |
| Less than High School | 0 (0.0%) | 0 (0.0%) |
| High School Diploma | 138 (56.6%) | 0 (0.0%) |
| College / Associate Degree | 263 (68.8%) | 0 (0.0%) |
| Bachelor's Degree or higher | 817 (86.0%) | 0 (0.0%) |
| Total | 1,218 (77.1%) | 0 (0.0%) |
Employment Occupations by Sex in Mountain Green
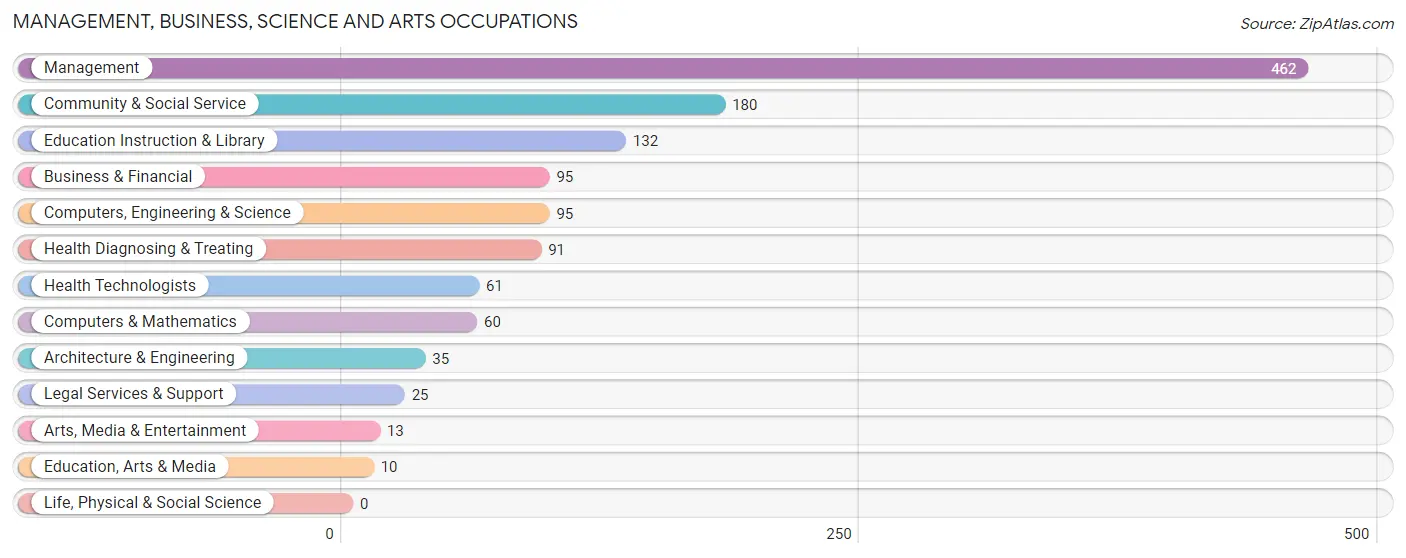
Management, Business, Science and Arts Occupations
The most common Management, Business, Science and Arts occupations in Mountain Green are Management (462 | 29.7%), Community & Social Service (180 | 11.6%), Education Instruction & Library (132 | 8.5%), Business & Financial (95 | 6.1%), and Computers, Engineering & Science (95 | 6.1%).
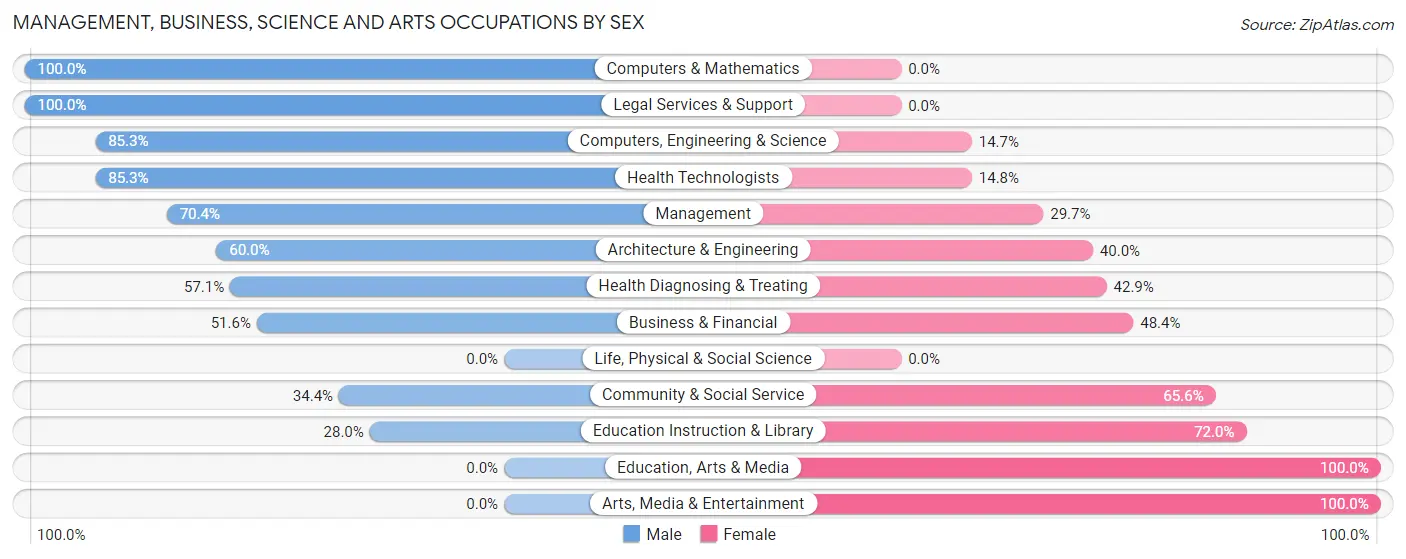
Management, Business, Science and Arts Occupations by Sex
Within the Management, Business, Science and Arts occupations in Mountain Green, the most male-oriented occupations are Computers & Mathematics (100.0%), Legal Services & Support (100.0%), and Computers, Engineering & Science (85.3%), while the most female-oriented occupations are Education, Arts & Media (100.0%), Arts, Media & Entertainment (100.0%), and Education Instruction & Library (72.0%).
| Occupation | Male | Female |
| Management | 325 (70.4%) | 137 (29.6%) |
| Business & Financial | 49 (51.6%) | 46 (48.4%) |
| Computers, Engineering & Science | 81 (85.3%) | 14 (14.7%) |
| Computers & Mathematics | 60 (100.0%) | 0 (0.0%) |
| Architecture & Engineering | 21 (60.0%) | 14 (40.0%) |
| Life, Physical & Social Science | 0 (0.0%) | 0 (0.0%) |
| Community & Social Service | 62 (34.4%) | 118 (65.6%) |
| Education, Arts & Media | 0 (0.0%) | 10 (100.0%) |
| Legal Services & Support | 25 (100.0%) | 0 (0.0%) |
| Education Instruction & Library | 37 (28.0%) | 95 (72.0%) |
| Arts, Media & Entertainment | 0 (0.0%) | 13 (100.0%) |
| Health Diagnosing & Treating | 52 (57.1%) | 39 (42.9%) |
| Health Technologists | 52 (85.3%) | 9 (14.7%) |
| Total (Category) | 569 (61.7%) | 354 (38.4%) |
| Total (Overall) | 890 (57.2%) | 667 (42.8%) |
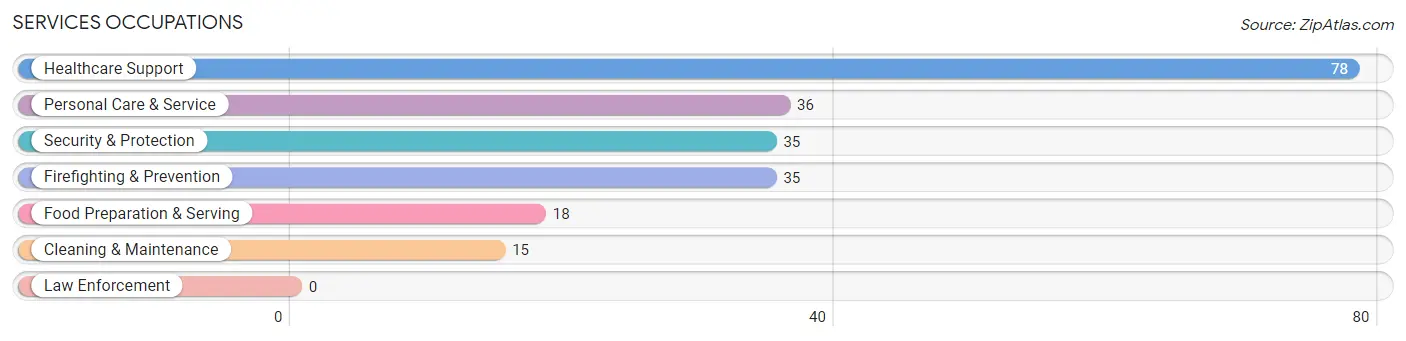
Services Occupations
The most common Services occupations in Mountain Green are Healthcare Support (78 | 5.0%), Personal Care & Service (36 | 2.3%), Security & Protection (35 | 2.2%), Firefighting & Prevention (35 | 2.2%), and Food Preparation & Serving (18 | 1.2%).
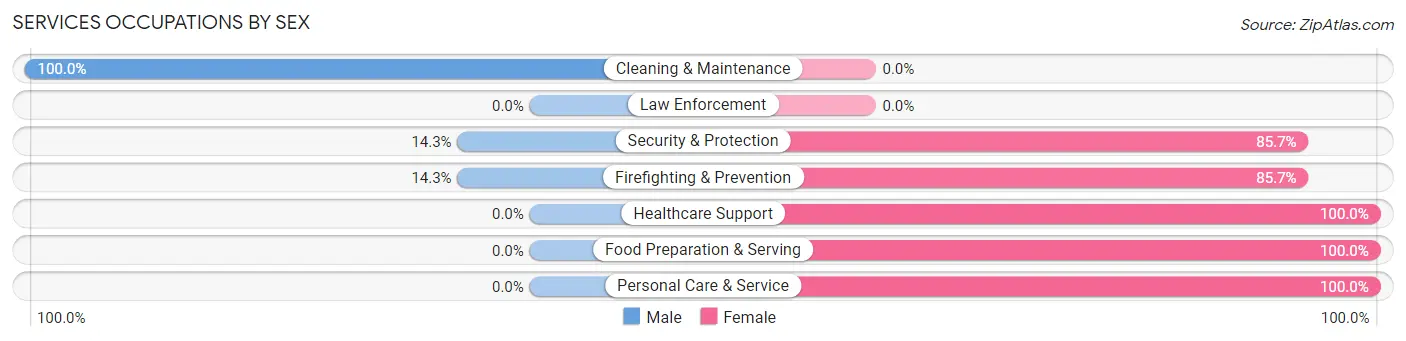
Services Occupations by Sex
Within the Services occupations in Mountain Green, the most male-oriented occupations are Cleaning & Maintenance (100.0%), Security & Protection (14.3%), and Firefighting & Prevention (14.3%), while the most female-oriented occupations are Healthcare Support (100.0%), Food Preparation & Serving (100.0%), and Personal Care & Service (100.0%).
| Occupation | Male | Female |
| Healthcare Support | 0 (0.0%) | 78 (100.0%) |
| Security & Protection | 5 (14.3%) | 30 (85.7%) |
| Firefighting & Prevention | 5 (14.3%) | 30 (85.7%) |
| Law Enforcement | 0 (0.0%) | 0 (0.0%) |
| Food Preparation & Serving | 0 (0.0%) | 18 (100.0%) |
| Cleaning & Maintenance | 15 (100.0%) | 0 (0.0%) |
| Personal Care & Service | 0 (0.0%) | 36 (100.0%) |
| Total (Category) | 20 (11.0%) | 162 (89.0%) |
| Total (Overall) | 890 (57.2%) | 667 (42.8%) |
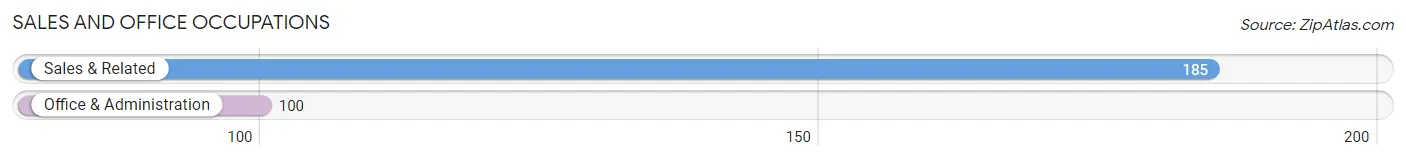
Sales and Office Occupations
The most common Sales and Office occupations in Mountain Green are Sales & Related (185 | 11.9%), and Office & Administration (100 | 6.4%).
Sales and Office Occupations by Sex
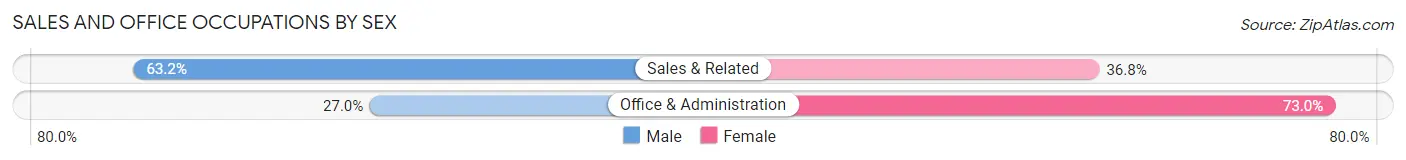
| Occupation | Male | Female |
| Sales & Related | 117 (63.2%) | 68 (36.8%) |
| Office & Administration | 27 (27.0%) | 73 (73.0%) |
| Total (Category) | 144 (50.5%) | 141 (49.5%) |
| Total (Overall) | 890 (57.2%) | 667 (42.8%) |
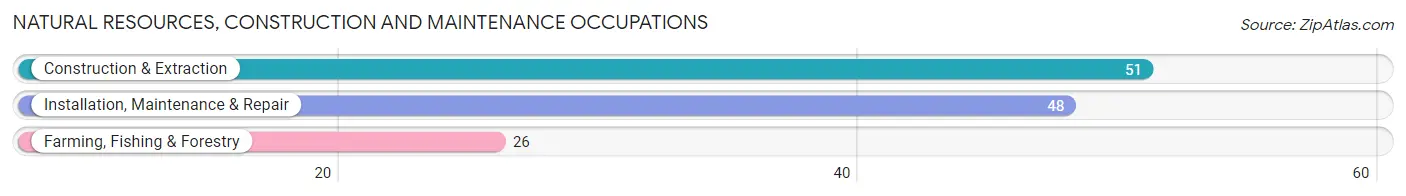
Natural Resources, Construction and Maintenance Occupations
The most common Natural Resources, Construction and Maintenance occupations in Mountain Green are Construction & Extraction (51 | 3.3%), Installation, Maintenance & Repair (48 | 3.1%), and Farming, Fishing & Forestry (26 | 1.7%).
Natural Resources, Construction and Maintenance Occupations by Sex
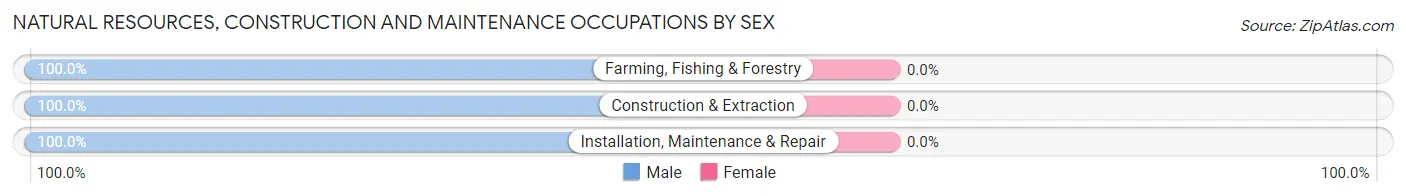
| Occupation | Male | Female |
| Farming, Fishing & Forestry | 26 (100.0%) | 0 (0.0%) |
| Construction & Extraction | 51 (100.0%) | 0 (0.0%) |
| Installation, Maintenance & Repair | 48 (100.0%) | 0 (0.0%) |
| Total (Category) | 125 (100.0%) | 0 (0.0%) |
| Total (Overall) | 890 (57.2%) | 667 (42.8%) |
Production, Transportation and Moving Occupations
The most common Production, Transportation and Moving occupations in Mountain Green are Production (30 | 1.9%), and Transportation (12 | 0.8%).
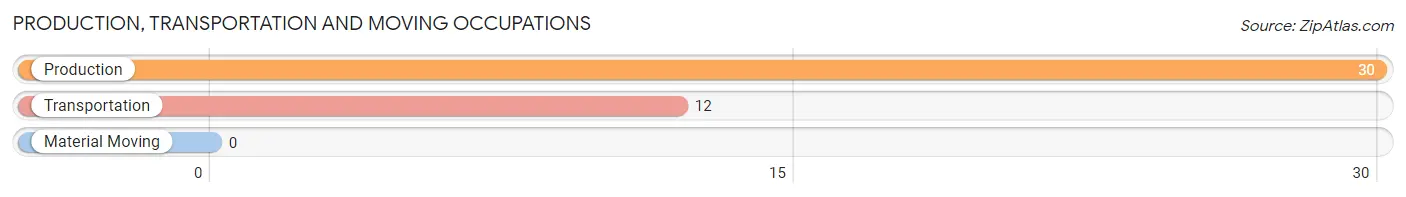
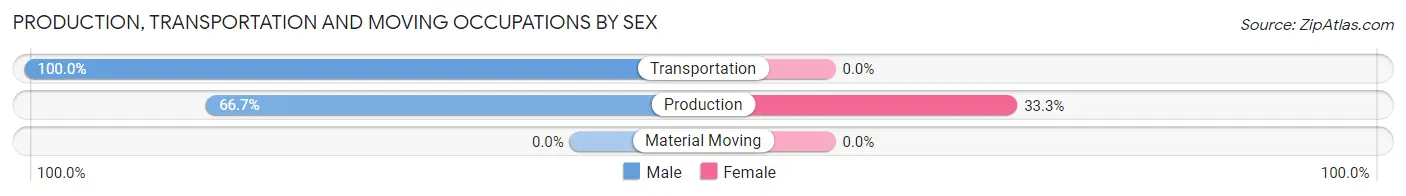
Production, Transportation and Moving Occupations by Sex
| Occupation | Male | Female |
| Production | 20 (66.7%) | 10 (33.3%) |
| Transportation | 12 (100.0%) | 0 (0.0%) |
| Material Moving | 0 (0.0%) | 0 (0.0%) |
| Total (Category) | 32 (76.2%) | 10 (23.8%) |
| Total (Overall) | 890 (57.2%) | 667 (42.8%) |
Employment Industries by Sex in Mountain Green
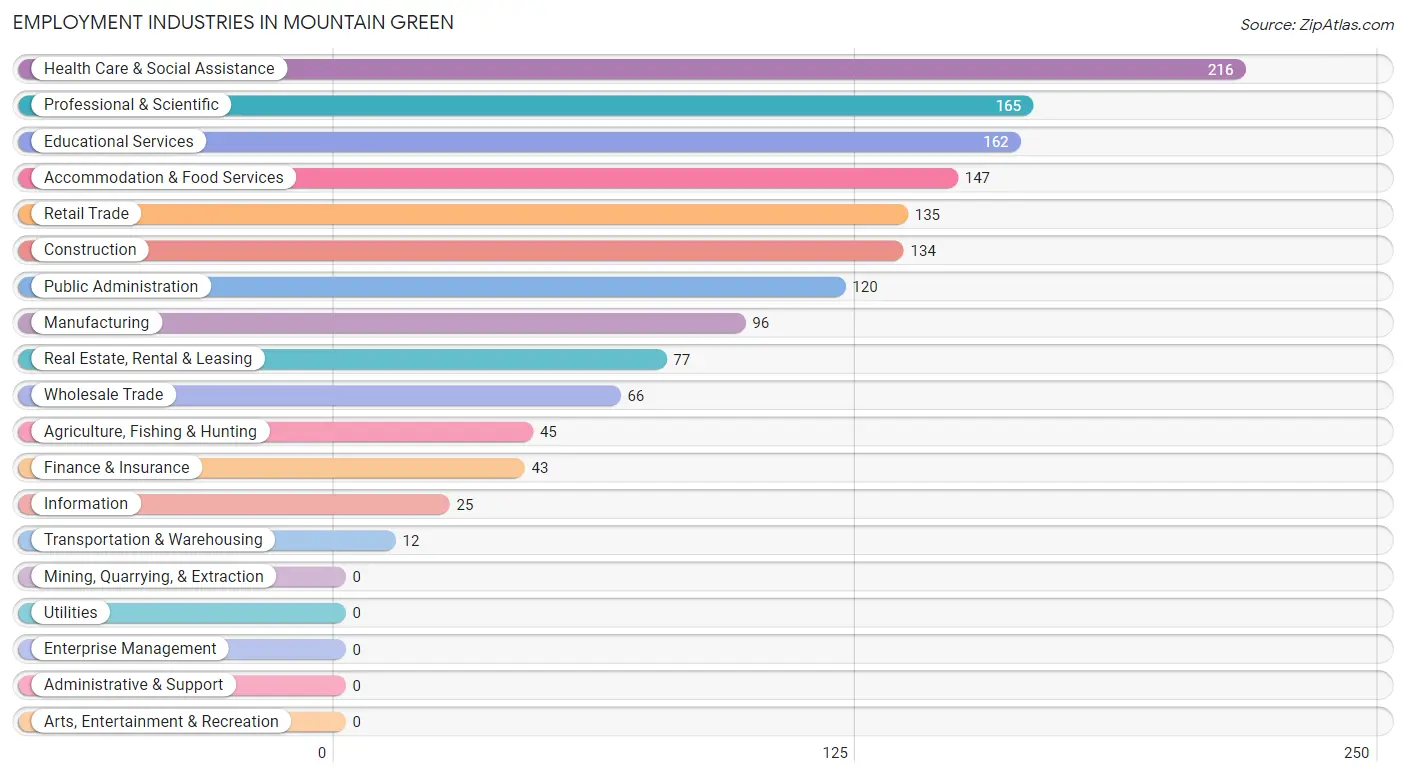
Employment Industries in Mountain Green
The major employment industries in Mountain Green include Health Care & Social Assistance (216 | 13.9%), Professional & Scientific (165 | 10.6%), Educational Services (162 | 10.4%), Accommodation & Food Services (147 | 9.4%), and Retail Trade (135 | 8.7%).
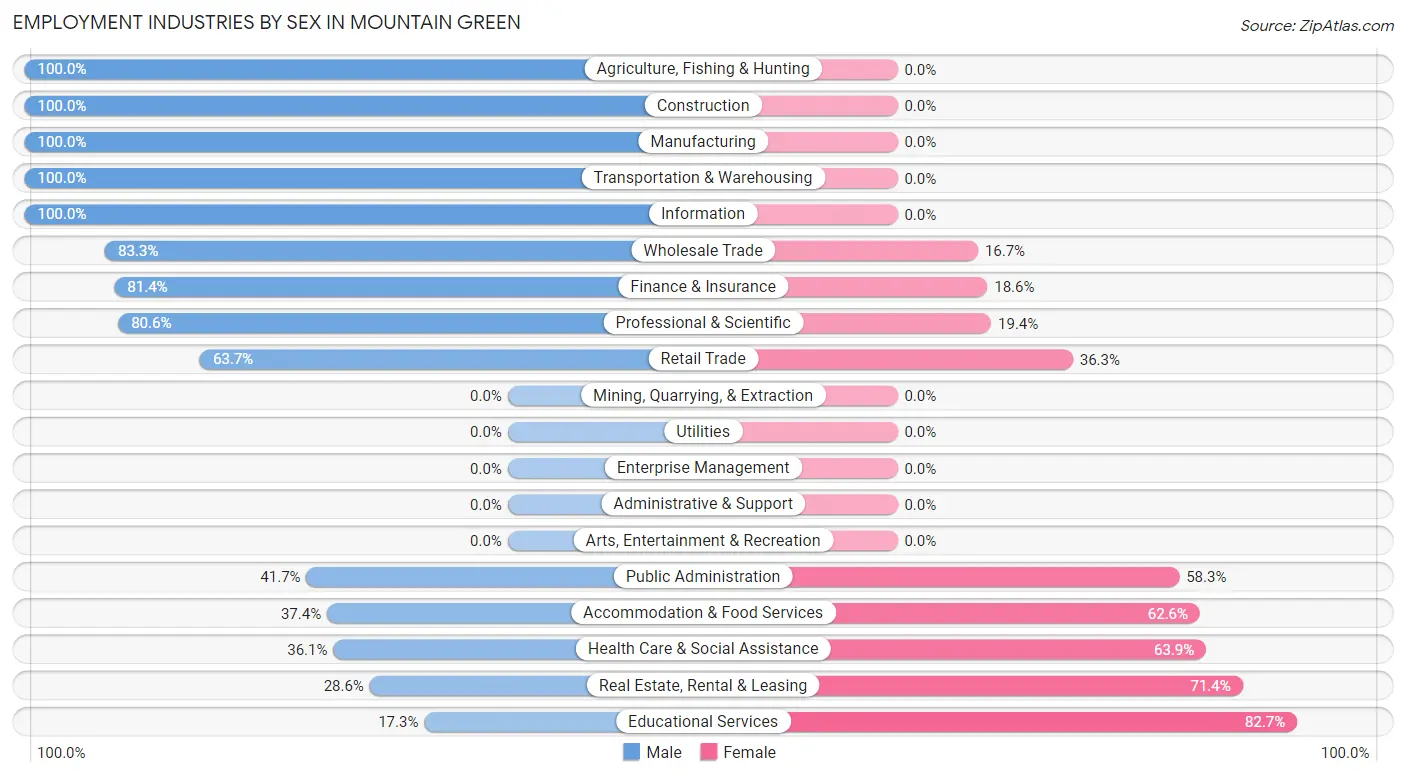
Employment Industries by Sex in Mountain Green
The Mountain Green industries that see more men than women are Agriculture, Fishing & Hunting (100.0%), Construction (100.0%), and Manufacturing (100.0%), whereas the industries that tend to have a higher number of women are Educational Services (82.7%), Real Estate, Rental & Leasing (71.4%), and Health Care & Social Assistance (63.9%).
| Industry | Male | Female |
| Agriculture, Fishing & Hunting | 45 (100.0%) | 0 (0.0%) |
| Mining, Quarrying, & Extraction | 0 (0.0%) | 0 (0.0%) |
| Construction | 134 (100.0%) | 0 (0.0%) |
| Manufacturing | 96 (100.0%) | 0 (0.0%) |
| Wholesale Trade | 55 (83.3%) | 11 (16.7%) |
| Retail Trade | 86 (63.7%) | 49 (36.3%) |
| Transportation & Warehousing | 12 (100.0%) | 0 (0.0%) |
| Utilities | 0 (0.0%) | 0 (0.0%) |
| Information | 25 (100.0%) | 0 (0.0%) |
| Finance & Insurance | 35 (81.4%) | 8 (18.6%) |
| Real Estate, Rental & Leasing | 22 (28.6%) | 55 (71.4%) |
| Professional & Scientific | 133 (80.6%) | 32 (19.4%) |
| Enterprise Management | 0 (0.0%) | 0 (0.0%) |
| Administrative & Support | 0 (0.0%) | 0 (0.0%) |
| Educational Services | 28 (17.3%) | 134 (82.7%) |
| Health Care & Social Assistance | 78 (36.1%) | 138 (63.9%) |
| Arts, Entertainment & Recreation | 0 (0.0%) | 0 (0.0%) |
| Accommodation & Food Services | 55 (37.4%) | 92 (62.6%) |
| Public Administration | 50 (41.7%) | 70 (58.3%) |
| Total | 890 (57.2%) | 667 (42.8%) |
Education in Mountain Green
School Enrollment in Mountain Green
The most common levels of schooling among the 1,339 students in Mountain Green are middle school (405 | 30.2%), elementary school (287 | 21.4%), and college / undergraduate (284 | 21.2%).
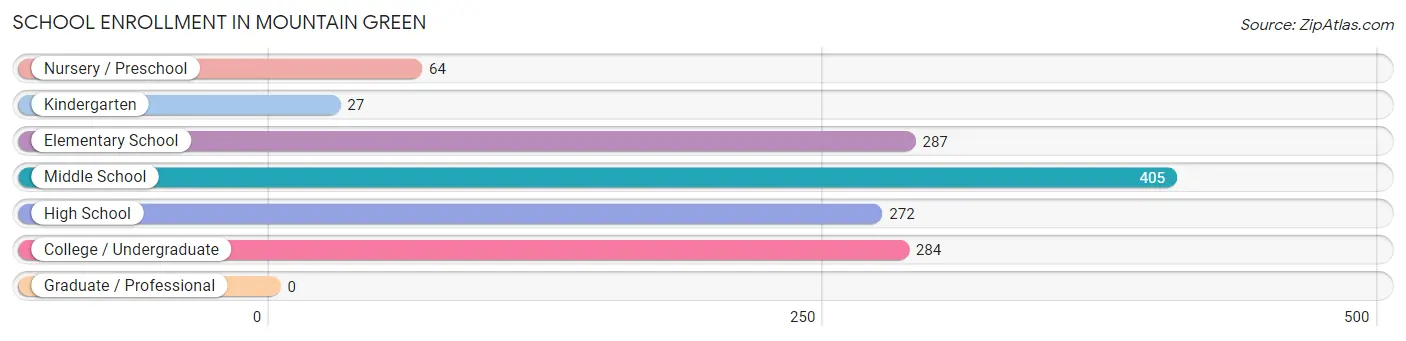
| School Level | # Students | % Students |
| Nursery / Preschool | 64 | 4.8% |
| Kindergarten | 27 | 2.0% |
| Elementary School | 287 | 21.4% |
| Middle School | 405 | 30.2% |
| High School | 272 | 20.3% |
| College / Undergraduate | 284 | 21.2% |
| Graduate / Professional | 0 | 0.0% |
| Total | 1,339 | 100.0% |
School Enrollment by Age by Funding Source in Mountain Green
Out of a total of 1,339 students who are enrolled in schools in Mountain Green, 59 (4.4%) attend a private institution, while the remaining 1,280 (95.6%) are enrolled in public schools. The age group of 3 to 4 year olds has the highest likelihood of being enrolled in private schools, with 33 (62.3% in the age bracket) enrolled. Conversely, the age group of 10 to 14 year olds has the lowest likelihood of being enrolled in a private school, with 448 (100.0% in the age bracket) attending a public institution.
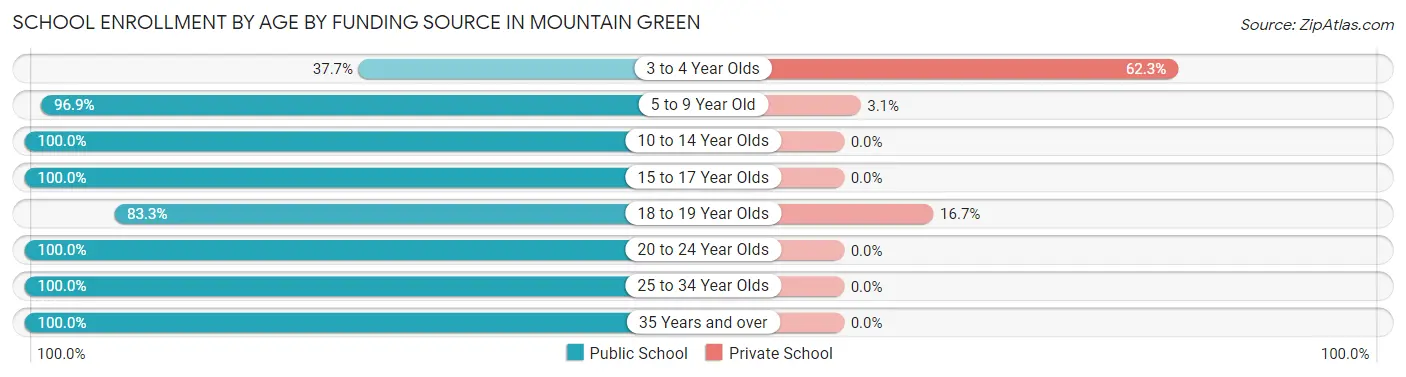
| Age Bracket | Public School | Private School |
| 3 to 4 Year Olds | 20 (37.7%) | 33 (62.3%) |
| 5 to 9 Year Old | 282 (96.9%) | 9 (3.1%) |
| 10 to 14 Year Olds | 448 (100.0%) | 0 (0.0%) |
| 15 to 17 Year Olds | 164 (100.0%) | 0 (0.0%) |
| 18 to 19 Year Olds | 85 (83.3%) | 17 (16.7%) |
| 20 to 24 Year Olds | 228 (100.0%) | 0 (0.0%) |
| 25 to 34 Year Olds | 40 (100.0%) | 0 (0.0%) |
| 35 Years and over | 13 (100.0%) | 0 (0.0%) |
| Total | 1,280 (95.6%) | 59 (4.4%) |
Educational Attainment by Field of Study in Mountain Green
Business (282 | 22.6%), arts & humanities (210 | 16.8%), education (196 | 15.7%), literature & languages (93 | 7.5%), and engineering (92 | 7.4%) are the most common fields of study among 1,247 individuals in Mountain Green who have obtained a bachelor's degree or higher.
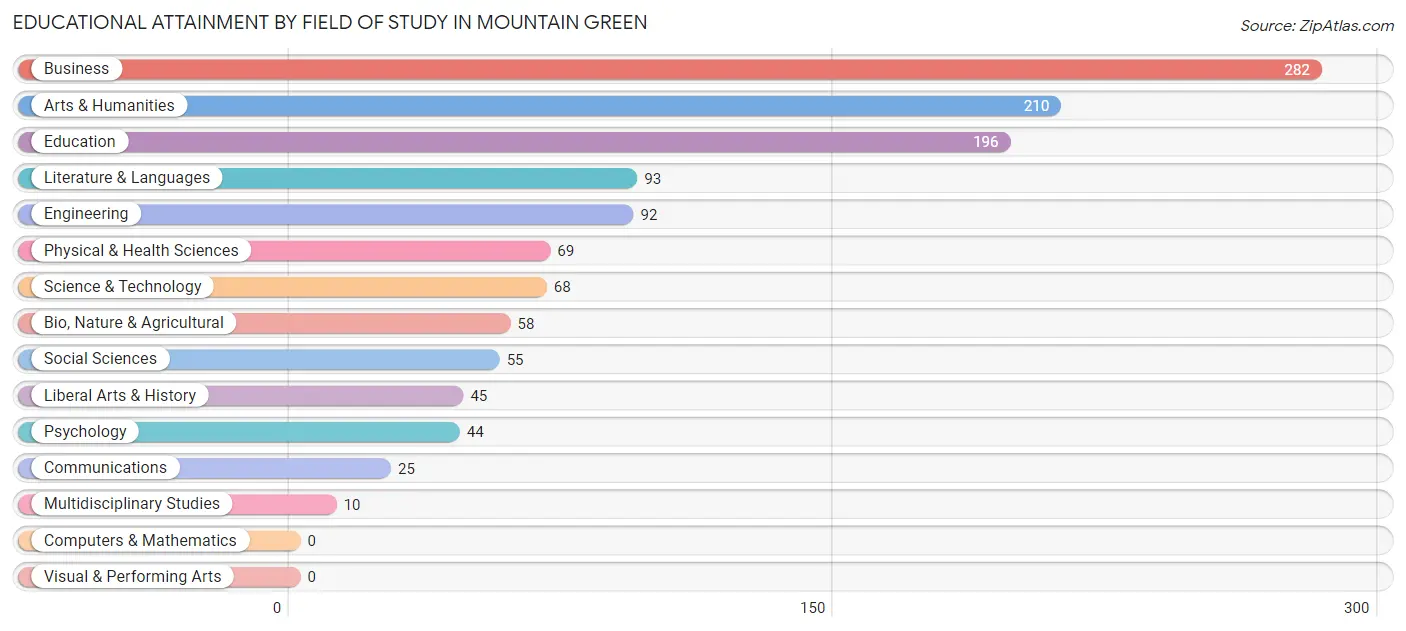
| Field of Study | # Graduates | % Graduates |
| Computers & Mathematics | 0 | 0.0% |
| Bio, Nature & Agricultural | 58 | 4.6% |
| Physical & Health Sciences | 69 | 5.5% |
| Psychology | 44 | 3.5% |
| Social Sciences | 55 | 4.4% |
| Engineering | 92 | 7.4% |
| Multidisciplinary Studies | 10 | 0.8% |
| Science & Technology | 68 | 5.4% |
| Business | 282 | 22.6% |
| Education | 196 | 15.7% |
| Literature & Languages | 93 | 7.5% |
| Liberal Arts & History | 45 | 3.6% |
| Visual & Performing Arts | 0 | 0.0% |
| Communications | 25 | 2.0% |
| Arts & Humanities | 210 | 16.8% |
| Total | 1,247 | 100.0% |
Transportation & Commute in Mountain Green
Vehicle Availability by Sex in Mountain Green
The most prevalent vehicle ownership categories in Mountain Green are males with 3 vehicles (318, accounting for 35.7%) and females with 3 vehicles (148, making up 54.2%).
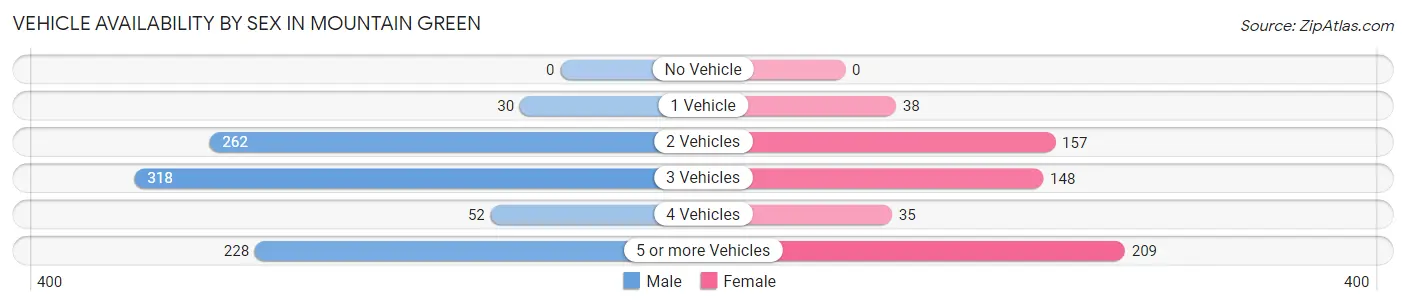
| Vehicles Available | Male | Female |
| No Vehicle | 0 (0.0%) | 0 (0.0%) |
| 1 Vehicle | 30 (3.4%) | 38 (6.5%) |
| 2 Vehicles | 262 (29.4%) | 157 (26.8%) |
| 3 Vehicles | 318 (35.7%) | 148 (25.2%) |
| 4 Vehicles | 52 (5.8%) | 35 (6.0%) |
| 5 or more Vehicles | 228 (25.6%) | 209 (35.6%) |
| Total | 890 (100.0%) | 587 (100.0%) |
Commute Time in Mountain Green
The most frequently occuring commute durations in Mountain Green are 20 to 24 minutes (343 commuters, 27.6%), 30 to 34 minutes (189 commuters, 15.2%), and 25 to 29 minutes (149 commuters, 12.0%).
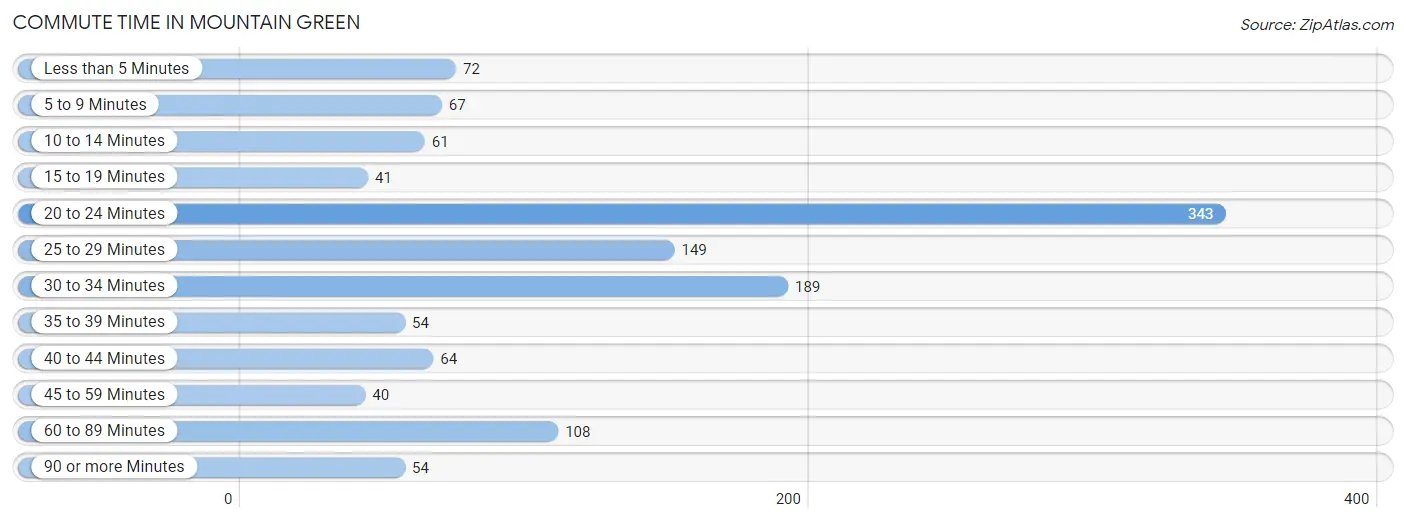
| Commute Time | # Commuters | % Commuters |
| Less than 5 Minutes | 72 | 5.8% |
| 5 to 9 Minutes | 67 | 5.4% |
| 10 to 14 Minutes | 61 | 4.9% |
| 15 to 19 Minutes | 41 | 3.3% |
| 20 to 24 Minutes | 343 | 27.6% |
| 25 to 29 Minutes | 149 | 12.0% |
| 30 to 34 Minutes | 189 | 15.2% |
| 35 to 39 Minutes | 54 | 4.3% |
| 40 to 44 Minutes | 64 | 5.1% |
| 45 to 59 Minutes | 40 | 3.2% |
| 60 to 89 Minutes | 108 | 8.7% |
| 90 or more Minutes | 54 | 4.3% |
Commute Time by Sex in Mountain Green
The most common commute times in Mountain Green are 20 to 24 minutes (183 commuters, 23.5%) for males and 20 to 24 minutes (160 commuters, 34.4%) for females.
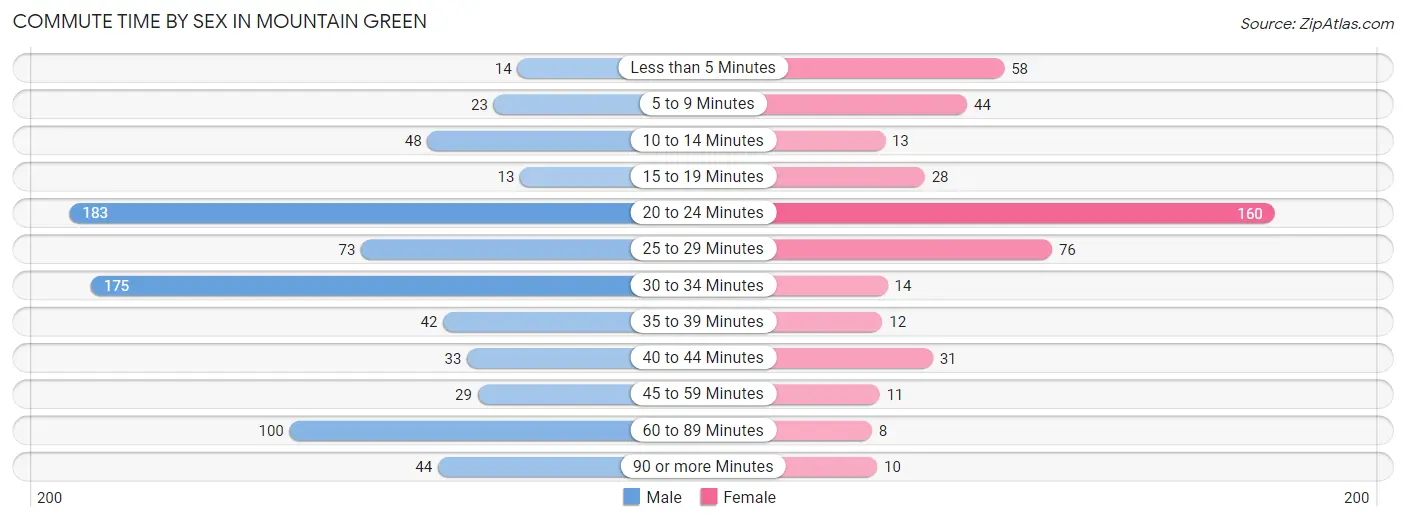
| Commute Time | Male | Female |
| Less than 5 Minutes | 14 (1.8%) | 58 (12.5%) |
| 5 to 9 Minutes | 23 (3.0%) | 44 (9.5%) |
| 10 to 14 Minutes | 48 (6.2%) | 13 (2.8%) |
| 15 to 19 Minutes | 13 (1.7%) | 28 (6.0%) |
| 20 to 24 Minutes | 183 (23.5%) | 160 (34.4%) |
| 25 to 29 Minutes | 73 (9.4%) | 76 (16.3%) |
| 30 to 34 Minutes | 175 (22.5%) | 14 (3.0%) |
| 35 to 39 Minutes | 42 (5.4%) | 12 (2.6%) |
| 40 to 44 Minutes | 33 (4.3%) | 31 (6.7%) |
| 45 to 59 Minutes | 29 (3.7%) | 11 (2.4%) |
| 60 to 89 Minutes | 100 (12.9%) | 8 (1.7%) |
| 90 or more Minutes | 44 (5.7%) | 10 (2.1%) |
Time of Departure to Work by Sex in Mountain Green
The most frequent times of departure to work in Mountain Green are 7:00 AM to 7:29 AM (188, 24.2%) for males and 8:00 AM to 8:29 AM (116, 24.9%) for females.
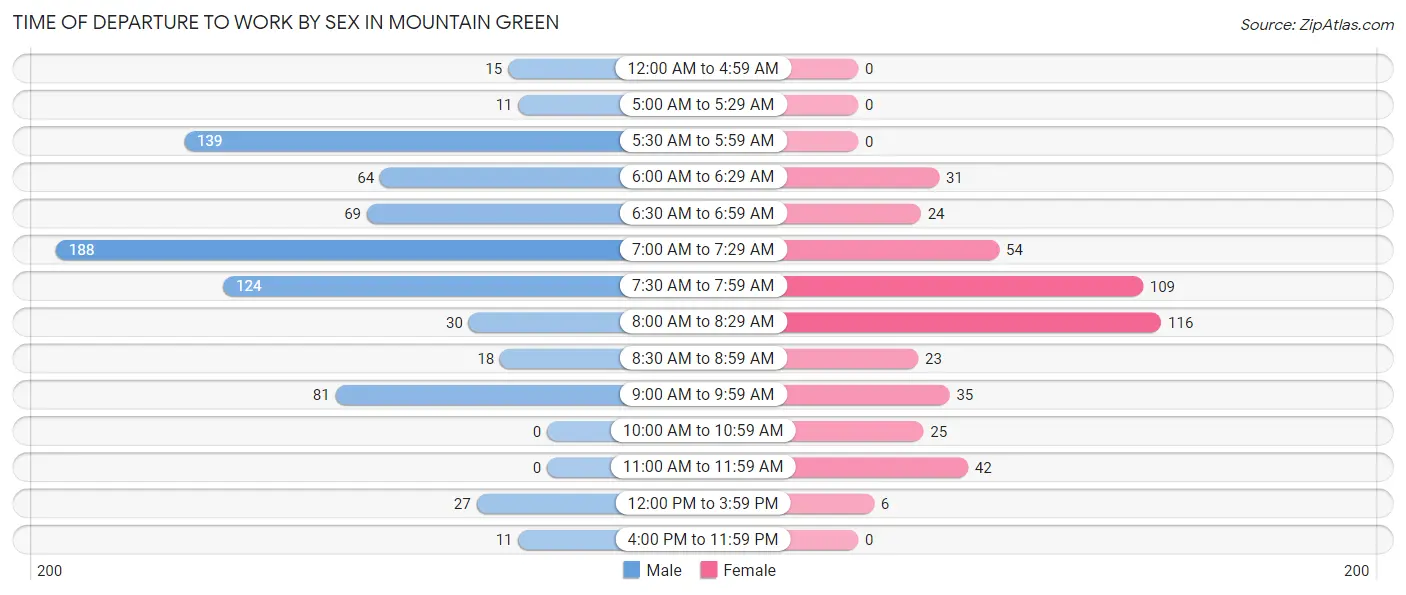
| Time of Departure | Male | Female |
| 12:00 AM to 4:59 AM | 15 (1.9%) | 0 (0.0%) |
| 5:00 AM to 5:29 AM | 11 (1.4%) | 0 (0.0%) |
| 5:30 AM to 5:59 AM | 139 (17.9%) | 0 (0.0%) |
| 6:00 AM to 6:29 AM | 64 (8.2%) | 31 (6.7%) |
| 6:30 AM to 6:59 AM | 69 (8.9%) | 24 (5.2%) |
| 7:00 AM to 7:29 AM | 188 (24.2%) | 54 (11.6%) |
| 7:30 AM to 7:59 AM | 124 (16.0%) | 109 (23.4%) |
| 8:00 AM to 8:29 AM | 30 (3.9%) | 116 (24.9%) |
| 8:30 AM to 8:59 AM | 18 (2.3%) | 23 (5.0%) |
| 9:00 AM to 9:59 AM | 81 (10.4%) | 35 (7.5%) |
| 10:00 AM to 10:59 AM | 0 (0.0%) | 25 (5.4%) |
| 11:00 AM to 11:59 AM | 0 (0.0%) | 42 (9.0%) |
| 12:00 PM to 3:59 PM | 27 (3.5%) | 6 (1.3%) |
| 4:00 PM to 11:59 PM | 11 (1.4%) | 0 (0.0%) |
| Total | 777 (100.0%) | 465 (100.0%) |
Housing Occupancy in Mountain Green
Occupancy by Ownership in Mountain Green
Of the total 1,068 dwellings in Mountain Green, owner-occupied units account for 993 (93.0%), while renter-occupied units make up 75 (7.0%).

| Occupancy | # Housing Units | % Housing Units |
| Owner Occupied Housing Units | 993 | 93.0% |
| Renter-Occupied Housing Units | 75 | 7.0% |
| Total Occupied Housing Units | 1,068 | 100.0% |
Occupancy by Household Size in Mountain Green
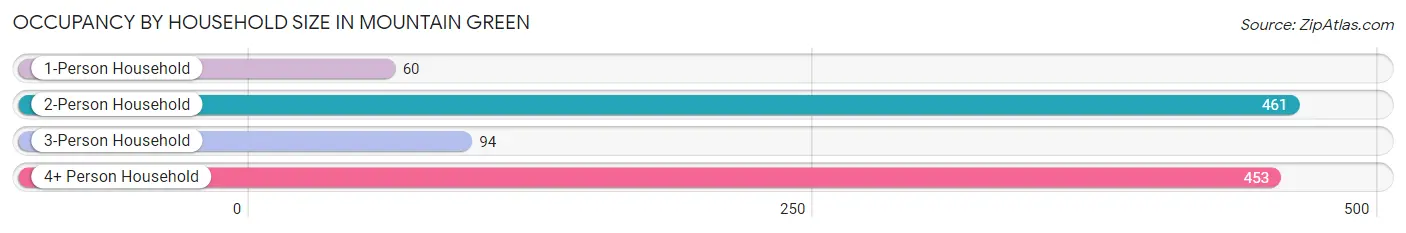
| Household Size | # Housing Units | % Housing Units |
| 1-Person Household | 60 | 5.6% |
| 2-Person Household | 461 | 43.2% |
| 3-Person Household | 94 | 8.8% |
| 4+ Person Household | 453 | 42.4% |
| Total Housing Units | 1,068 | 100.0% |
Occupancy by Ownership by Household Size in Mountain Green
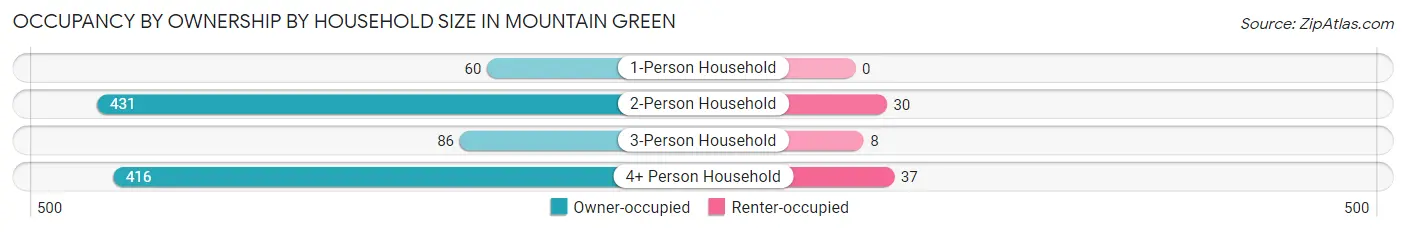
| Household Size | Owner-occupied | Renter-occupied |
| 1-Person Household | 60 (100.0%) | 0 (0.0%) |
| 2-Person Household | 431 (93.5%) | 30 (6.5%) |
| 3-Person Household | 86 (91.5%) | 8 (8.5%) |
| 4+ Person Household | 416 (91.8%) | 37 (8.2%) |
| Total Housing Units | 993 (93.0%) | 75 (7.0%) |
Occupancy by Educational Attainment in Mountain Green
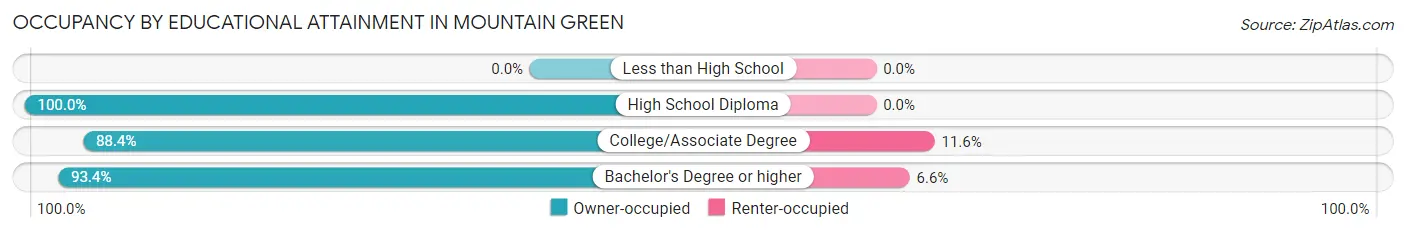
| Household Size | Owner-occupied | Renter-occupied |
| Less than High School | 0 (0.0%) | 0 (0.0%) |
| High School Diploma | 130 (100.0%) | 0 (0.0%) |
| College/Associate Degree | 229 (88.4%) | 30 (11.6%) |
| Bachelor's Degree or higher | 634 (93.4%) | 45 (6.6%) |
Occupancy by Age of Householder in Mountain Green
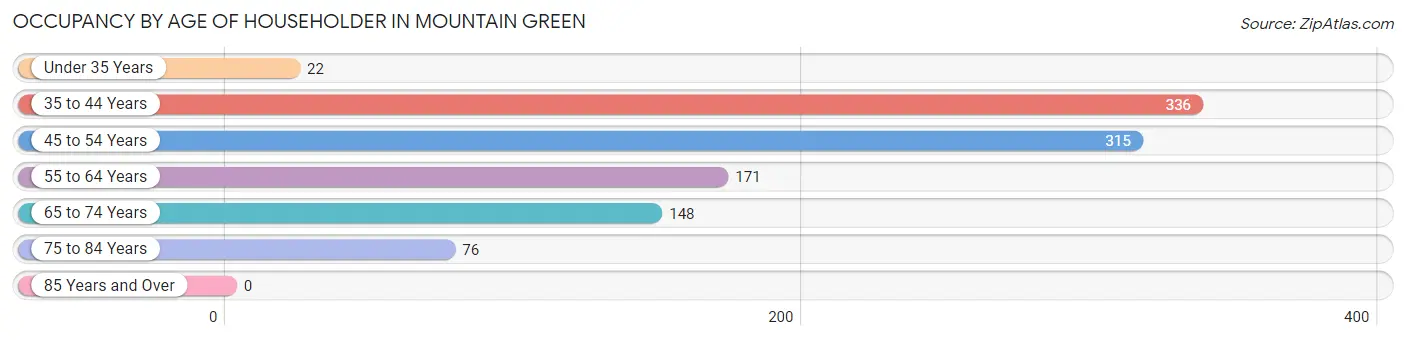
| Age Bracket | # Households | % Households |
| Under 35 Years | 22 | 2.1% |
| 35 to 44 Years | 336 | 31.5% |
| 45 to 54 Years | 315 | 29.5% |
| 55 to 64 Years | 171 | 16.0% |
| 65 to 74 Years | 148 | 13.9% |
| 75 to 84 Years | 76 | 7.1% |
| 85 Years and Over | 0 | 0.0% |
| Total | 1,068 | 100.0% |
Housing Finances in Mountain Green
Median Income by Occupancy in Mountain Green
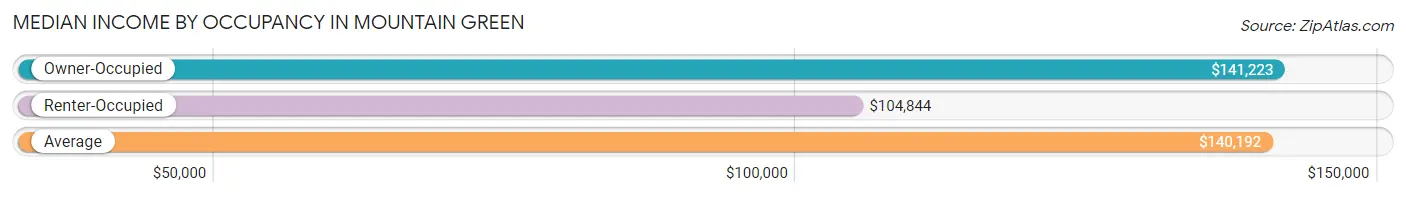
| Occupancy Type | # Households | Median Income |
| Owner-Occupied | 993 (93.0%) | $141,223 |
| Renter-Occupied | 75 (7.0%) | $104,844 |
| Average | 1,068 (100.0%) | $140,192 |
Occupancy by Householder Income Bracket in Mountain Green
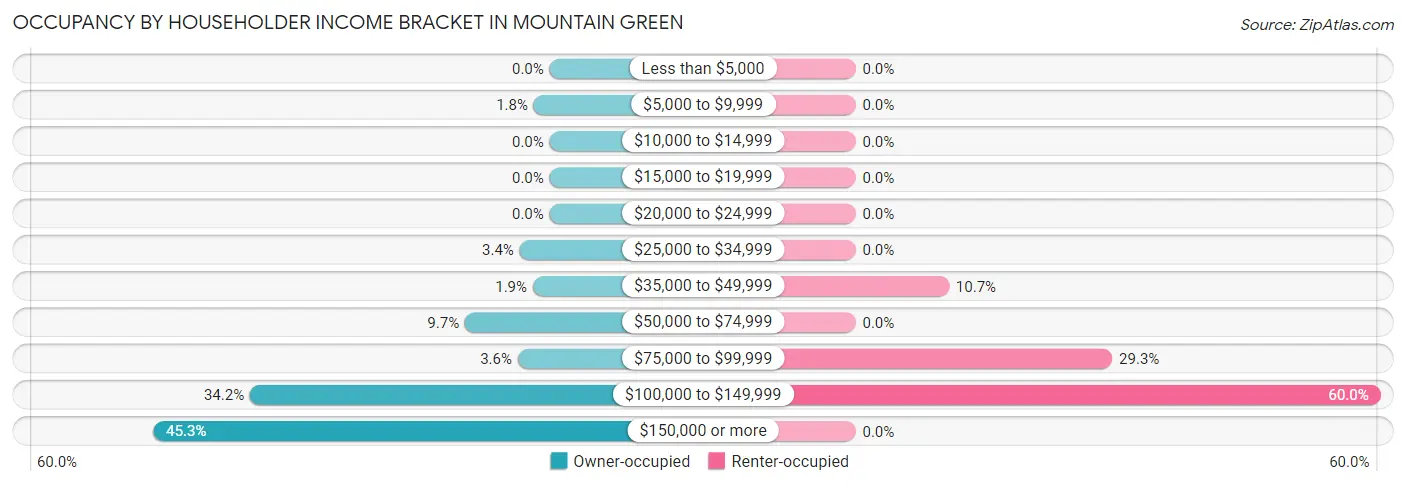
| Income Bracket | Owner-occupied | Renter-occupied |
| Less than $5,000 | 0 (0.0%) | 0 (0.0%) |
| $5,000 to $9,999 | 18 (1.8%) | 0 (0.0%) |
| $10,000 to $14,999 | 0 (0.0%) | 0 (0.0%) |
| $15,000 to $19,999 | 0 (0.0%) | 0 (0.0%) |
| $20,000 to $24,999 | 0 (0.0%) | 0 (0.0%) |
| $25,000 to $34,999 | 34 (3.4%) | 0 (0.0%) |
| $35,000 to $49,999 | 19 (1.9%) | 8 (10.7%) |
| $50,000 to $74,999 | 96 (9.7%) | 0 (0.0%) |
| $75,000 to $99,999 | 36 (3.6%) | 22 (29.3%) |
| $100,000 to $149,999 | 340 (34.2%) | 45 (60.0%) |
| $150,000 or more | 450 (45.3%) | 0 (0.0%) |
| Total | 993 (100.0%) | 75 (100.0%) |
Monthly Housing Cost Tiers in Mountain Green
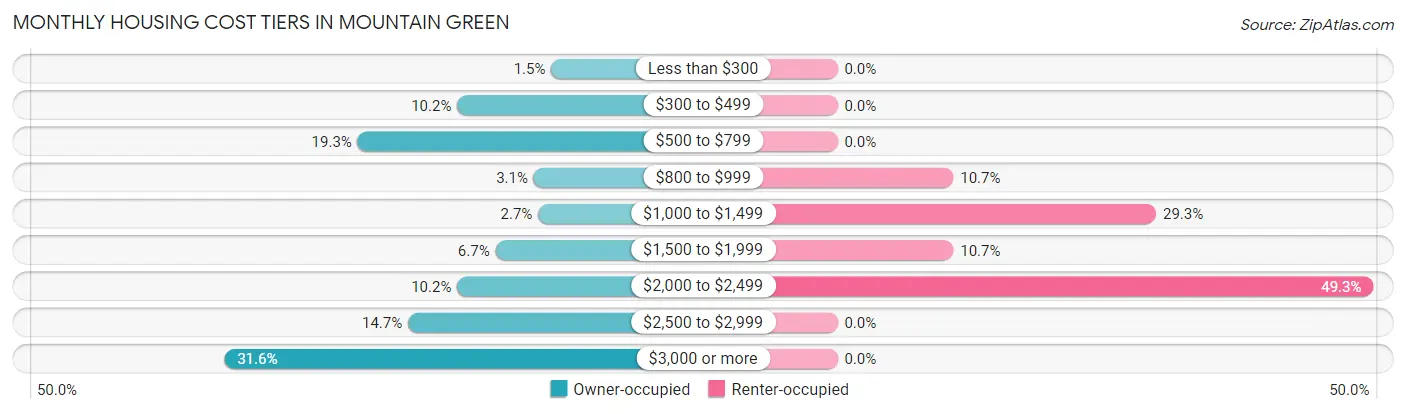
| Monthly Cost | Owner-occupied | Renter-occupied |
| Less than $300 | 15 (1.5%) | 0 (0.0%) |
| $300 to $499 | 101 (10.2%) | 0 (0.0%) |
| $500 to $799 | 192 (19.3%) | 0 (0.0%) |
| $800 to $999 | 31 (3.1%) | 8 (10.7%) |
| $1,000 to $1,499 | 27 (2.7%) | 22 (29.3%) |
| $1,500 to $1,999 | 66 (6.7%) | 8 (10.7%) |
| $2,000 to $2,499 | 101 (10.2%) | 37 (49.3%) |
| $2,500 to $2,999 | 146 (14.7%) | 0 (0.0%) |
| $3,000 or more | 314 (31.6%) | 0 (0.0%) |
| Total | 993 (100.0%) | 75 (100.0%) |
Physical Housing Characteristics in Mountain Green
Housing Structures in Mountain Green
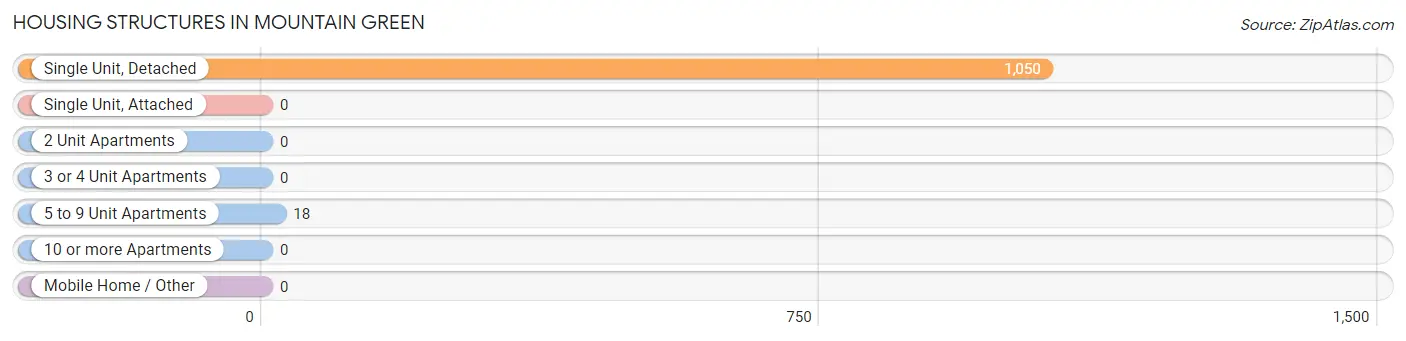
| Structure Type | # Housing Units | % Housing Units |
| Single Unit, Detached | 1,050 | 98.3% |
| Single Unit, Attached | 0 | 0.0% |
| 2 Unit Apartments | 0 | 0.0% |
| 3 or 4 Unit Apartments | 0 | 0.0% |
| 5 to 9 Unit Apartments | 18 | 1.7% |
| 10 or more Apartments | 0 | 0.0% |
| Mobile Home / Other | 0 | 0.0% |
| Total | 1,068 | 100.0% |
Housing Structures by Occupancy in Mountain Green
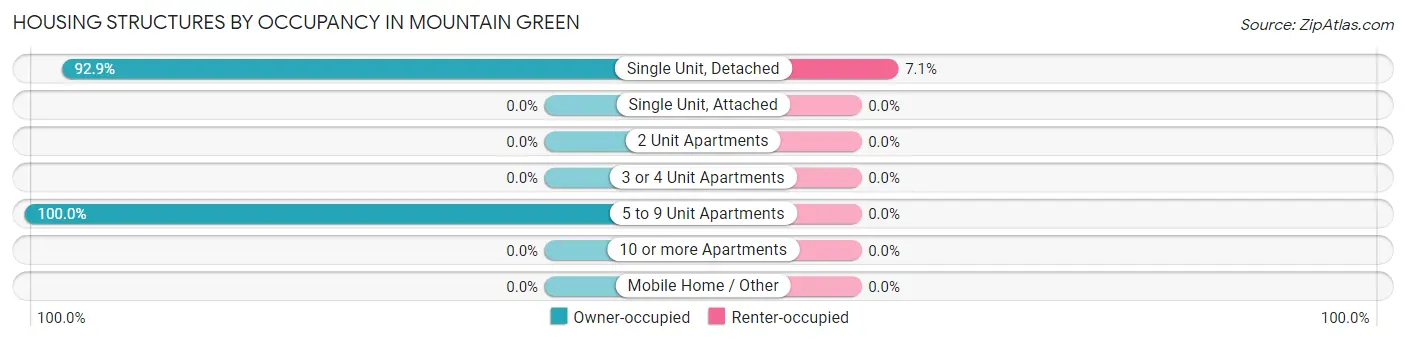
| Structure Type | Owner-occupied | Renter-occupied |
| Single Unit, Detached | 975 (92.9%) | 75 (7.1%) |
| Single Unit, Attached | 0 (0.0%) | 0 (0.0%) |
| 2 Unit Apartments | 0 (0.0%) | 0 (0.0%) |
| 3 or 4 Unit Apartments | 0 (0.0%) | 0 (0.0%) |
| 5 to 9 Unit Apartments | 18 (100.0%) | 0 (0.0%) |
| 10 or more Apartments | 0 (0.0%) | 0 (0.0%) |
| Mobile Home / Other | 0 (0.0%) | 0 (0.0%) |
| Total | 993 (93.0%) | 75 (7.0%) |
Housing Structures by Number of Rooms in Mountain Green
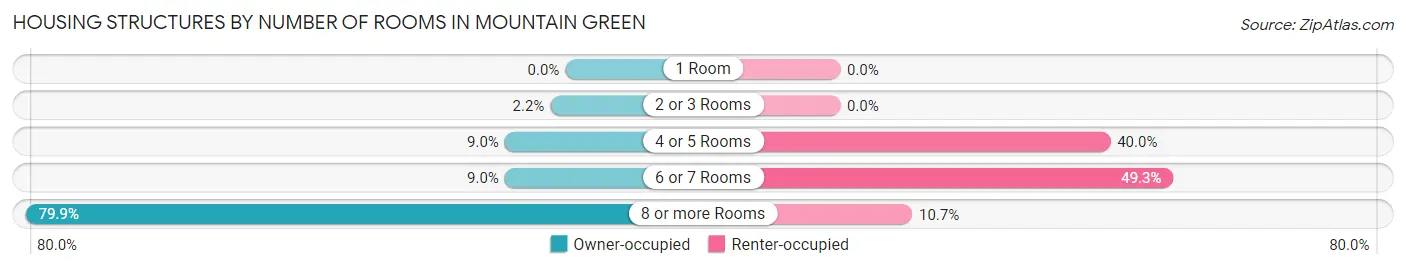
| Number of Rooms | Owner-occupied | Renter-occupied |
| 1 Room | 0 (0.0%) | 0 (0.0%) |
| 2 or 3 Rooms | 22 (2.2%) | 0 (0.0%) |
| 4 or 5 Rooms | 89 (9.0%) | 30 (40.0%) |
| 6 or 7 Rooms | 89 (9.0%) | 37 (49.3%) |
| 8 or more Rooms | 793 (79.9%) | 8 (10.7%) |
| Total | 993 (100.0%) | 75 (100.0%) |
Housing Structure by Heating Type in Mountain Green
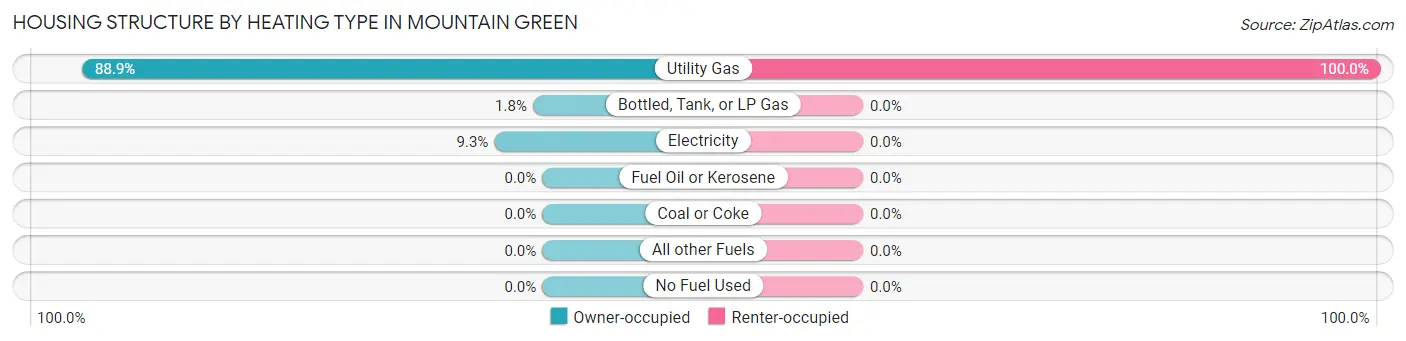
| Heating Type | Owner-occupied | Renter-occupied |
| Utility Gas | 883 (88.9%) | 75 (100.0%) |
| Bottled, Tank, or LP Gas | 18 (1.8%) | 0 (0.0%) |
| Electricity | 92 (9.3%) | 0 (0.0%) |
| Fuel Oil or Kerosene | 0 (0.0%) | 0 (0.0%) |
| Coal or Coke | 0 (0.0%) | 0 (0.0%) |
| All other Fuels | 0 (0.0%) | 0 (0.0%) |
| No Fuel Used | 0 (0.0%) | 0 (0.0%) |
| Total | 993 (100.0%) | 75 (100.0%) |
Household Vehicle Usage in Mountain Green
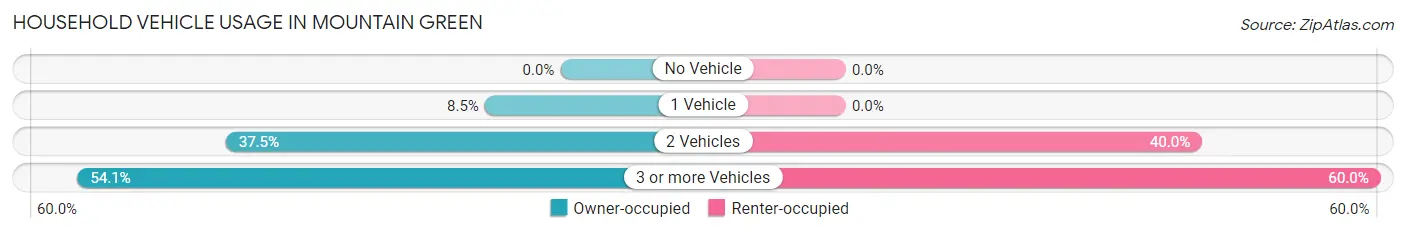
| Vehicles per Household | Owner-occupied | Renter-occupied |
| No Vehicle | 0 (0.0%) | 0 (0.0%) |
| 1 Vehicle | 84 (8.5%) | 0 (0.0%) |
| 2 Vehicles | 372 (37.5%) | 30 (40.0%) |
| 3 or more Vehicles | 537 (54.1%) | 45 (60.0%) |
| Total | 993 (100.0%) | 75 (100.0%) |
Real Estate & Mortgages in Mountain Green
Real Estate and Mortgage Overview in Mountain Green
| Characteristic | Without Mortgage | With Mortgage |
| Housing Units | 338 | 655 |
| Median Property Value | $461,900 | $659,000 |
| Median Household Income | $107,045 | $356 |
| Monthly Housing Costs | $548 | $314 |
| Real Estate Taxes | $2,630 | $0 |
Property Value by Mortgage Status in Mountain Green
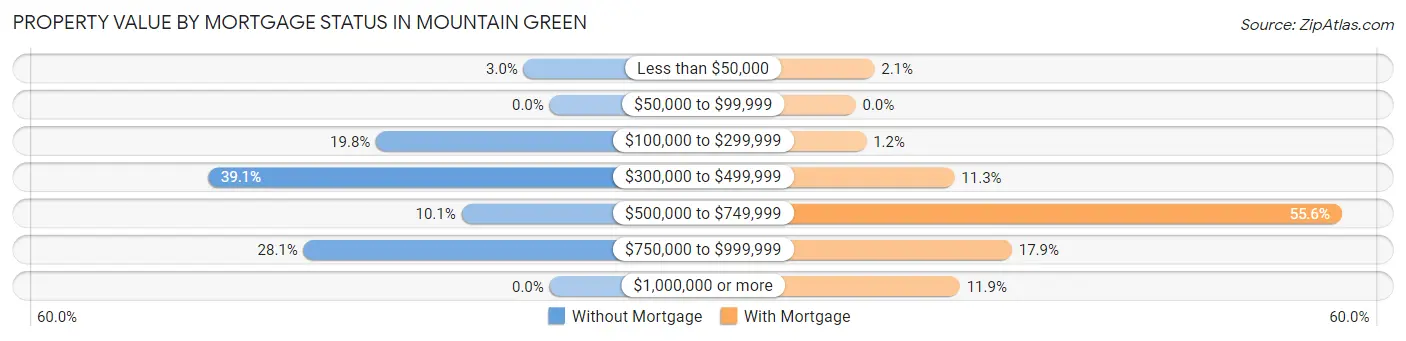
| Property Value | Without Mortgage | With Mortgage |
| Less than $50,000 | 10 (3.0%) | 14 (2.1%) |
| $50,000 to $99,999 | 0 (0.0%) | 0 (0.0%) |
| $100,000 to $299,999 | 67 (19.8%) | 8 (1.2%) |
| $300,000 to $499,999 | 132 (39.1%) | 74 (11.3%) |
| $500,000 to $749,999 | 34 (10.1%) | 364 (55.6%) |
| $750,000 to $999,999 | 95 (28.1%) | 117 (17.9%) |
| $1,000,000 or more | 0 (0.0%) | 78 (11.9%) |
| Total | 338 (100.0%) | 655 (100.0%) |
Household Income by Mortgage Status in Mountain Green
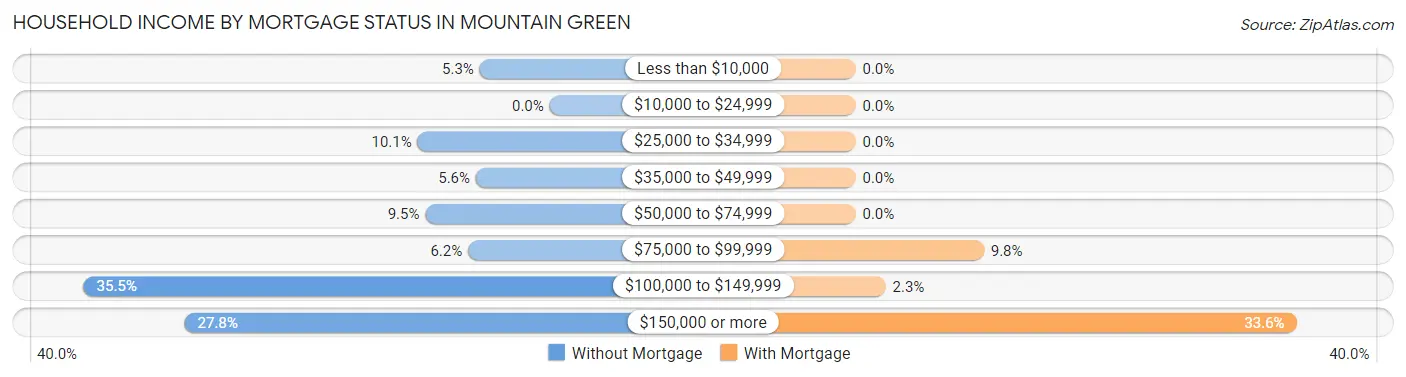
| Household Income | Without Mortgage | With Mortgage |
| Less than $10,000 | 18 (5.3%) | 0 (0.0%) |
| $10,000 to $24,999 | 0 (0.0%) | 0 (0.0%) |
| $25,000 to $34,999 | 34 (10.1%) | 0 (0.0%) |
| $35,000 to $49,999 | 19 (5.6%) | 0 (0.0%) |
| $50,000 to $74,999 | 32 (9.5%) | 0 (0.0%) |
| $75,000 to $99,999 | 21 (6.2%) | 64 (9.8%) |
| $100,000 to $149,999 | 120 (35.5%) | 15 (2.3%) |
| $150,000 or more | 94 (27.8%) | 220 (33.6%) |
| Total | 338 (100.0%) | 655 (100.0%) |
Property Value to Household Income Ratio in Mountain Green
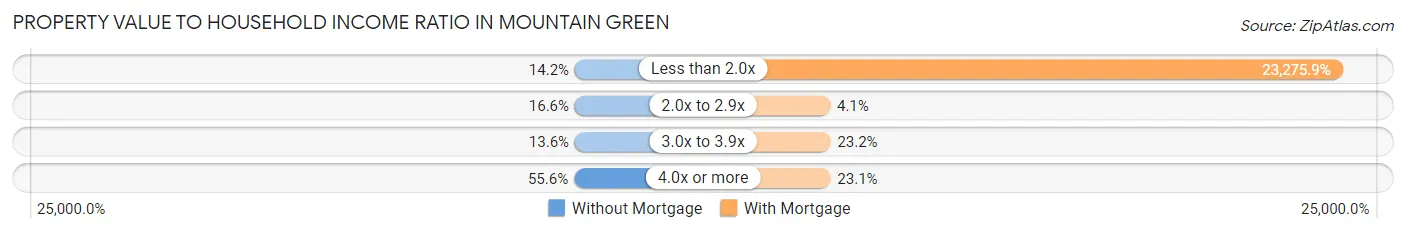
| Value-to-Income Ratio | Without Mortgage | With Mortgage |
| Less than 2.0x | 48 (14.2%) | 152,457 (23,275.9%) |
| 2.0x to 2.9x | 56 (16.6%) | 27 (4.1%) |
| 3.0x to 3.9x | 46 (13.6%) | 152 (23.2%) |
| 4.0x or more | 188 (55.6%) | 151 (23.1%) |
| Total | 338 (100.0%) | 655 (100.0%) |
Real Estate Taxes by Mortgage Status in Mountain Green
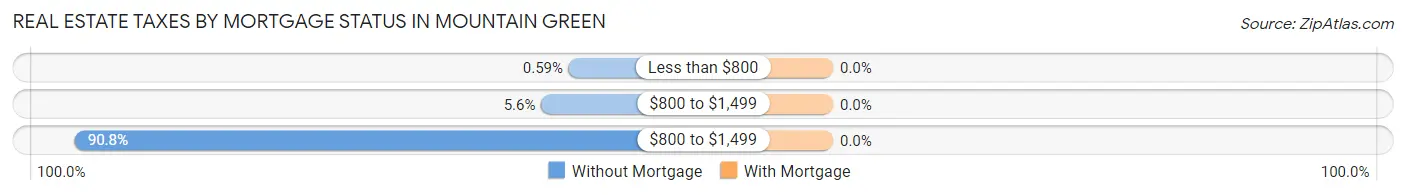
| Property Taxes | Without Mortgage | With Mortgage |
| Less than $800 | 2 (0.6%) | 0 (0.0%) |
| $800 to $1,499 | 19 (5.6%) | 0 (0.0%) |
| $800 to $1,499 | 307 (90.8%) | 0 (0.0%) |
| Total | 338 (100.0%) | 655 (100.0%) |
Health & Disability in Mountain Green
Health Insurance Coverage by Age in Mountain Green
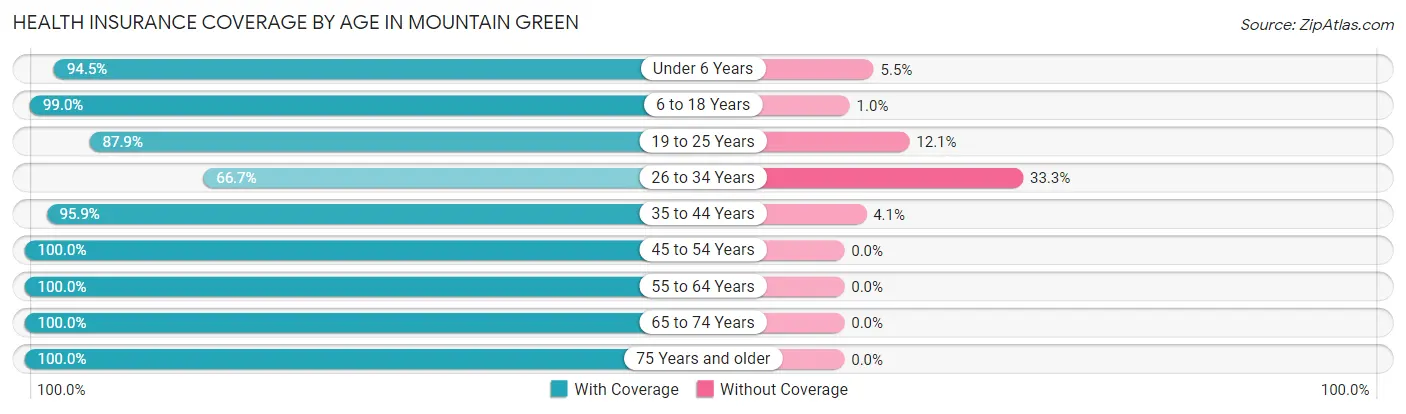
| Age Bracket | With Coverage | Without Coverage |
| Under 6 Years | 242 (94.5%) | 14 (5.5%) |
| 6 to 18 Years | 992 (99.0%) | 10 (1.0%) |
| 19 to 25 Years | 268 (87.9%) | 37 (12.1%) |
| 26 to 34 Years | 68 (66.7%) | 34 (33.3%) |
| 35 to 44 Years | 611 (95.9%) | 26 (4.1%) |
| 45 to 54 Years | 573 (100.0%) | 0 (0.0%) |
| 55 to 64 Years | 258 (100.0%) | 0 (0.0%) |
| 65 to 74 Years | 347 (100.0%) | 0 (0.0%) |
| 75 Years and older | 166 (100.0%) | 0 (0.0%) |
| Total | 3,525 (96.7%) | 121 (3.3%) |
Health Insurance Coverage by Citizenship Status in Mountain Green
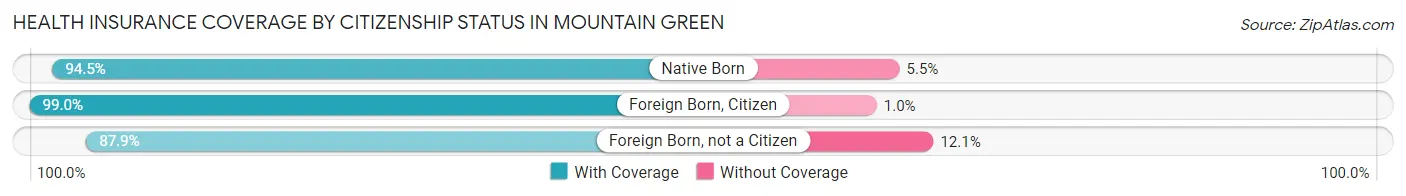
| Citizenship Status | With Coverage | Without Coverage |
| Native Born | 242 (94.5%) | 14 (5.5%) |
| Foreign Born, Citizen | 992 (99.0%) | 10 (1.0%) |
| Foreign Born, not a Citizen | 268 (87.9%) | 37 (12.1%) |
Health Insurance Coverage by Household Income in Mountain Green
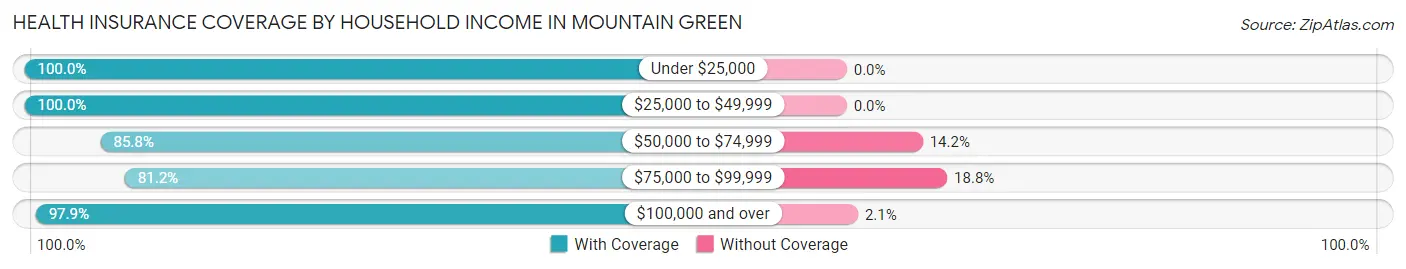
| Household Income | With Coverage | Without Coverage |
| Under $25,000 | 36 (100.0%) | 0 (0.0%) |
| $25,000 to $49,999 | 150 (100.0%) | 0 (0.0%) |
| $50,000 to $74,999 | 205 (85.8%) | 34 (14.2%) |
| $75,000 to $99,999 | 95 (81.2%) | 22 (18.8%) |
| $100,000 and over | 3,039 (97.9%) | 65 (2.1%) |
Public vs Private Health Insurance Coverage by Age in Mountain Green
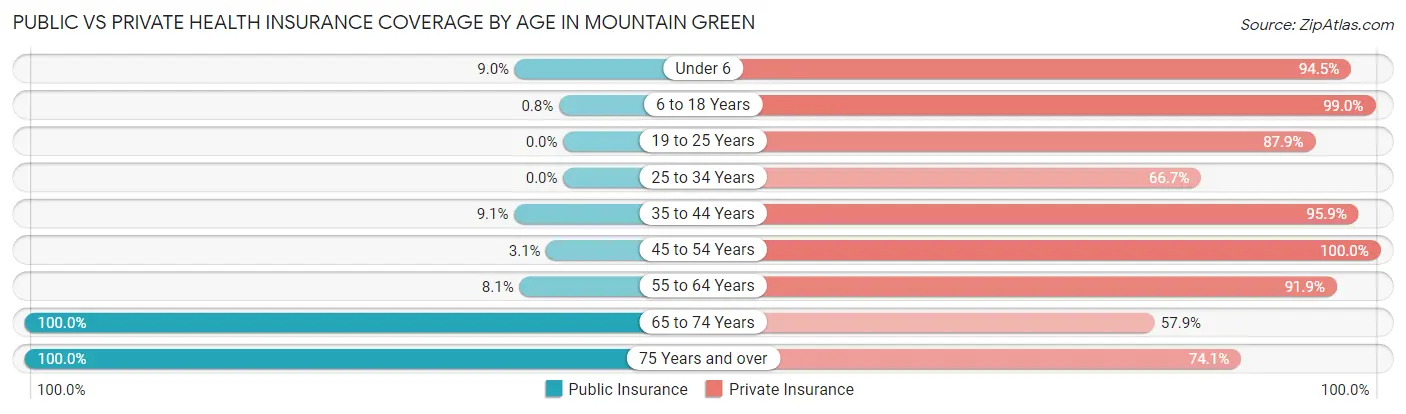
| Age Bracket | Public Insurance | Private Insurance |
| Under 6 | 23 (9.0%) | 242 (94.5%) |
| 6 to 18 Years | 8 (0.8%) | 992 (99.0%) |
| 19 to 25 Years | 0 (0.0%) | 268 (87.9%) |
| 25 to 34 Years | 0 (0.0%) | 68 (66.7%) |
| 35 to 44 Years | 58 (9.1%) | 611 (95.9%) |
| 45 to 54 Years | 18 (3.1%) | 573 (100.0%) |
| 55 to 64 Years | 21 (8.1%) | 237 (91.9%) |
| 65 to 74 Years | 347 (100.0%) | 201 (57.9%) |
| 75 Years and over | 166 (100.0%) | 123 (74.1%) |
| Total | 641 (17.6%) | 3,315 (90.9%) |
Disability Status by Sex by Age in Mountain Green
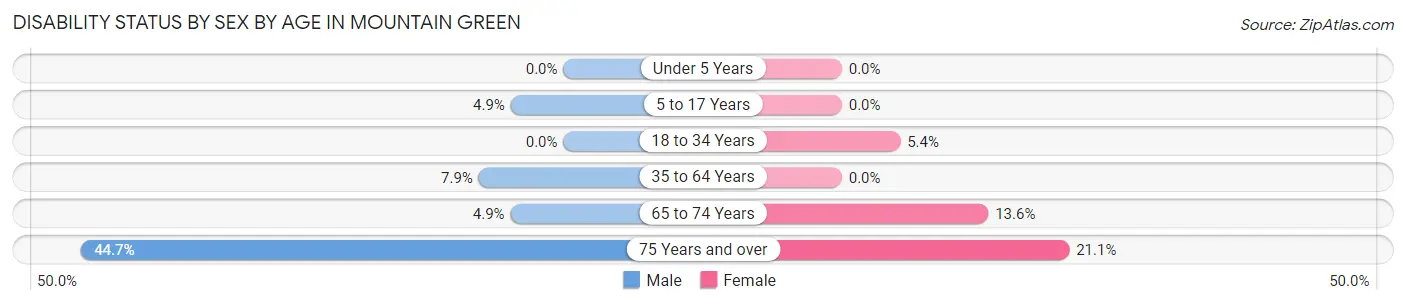
| Age Bracket | Male | Female |
| Under 5 Years | 0 (0.0%) | 0 (0.0%) |
| 5 to 17 Years | 25 (4.9%) | 0 (0.0%) |
| 18 to 34 Years | 0 (0.0%) | 13 (5.4%) |
| 35 to 64 Years | 57 (7.9%) | 0 (0.0%) |
| 65 to 74 Years | 8 (4.9%) | 25 (13.6%) |
| 75 Years and over | 34 (44.7%) | 19 (21.1%) |
Disability Class by Sex by Age in Mountain Green
Disability Class: Hearing Difficulty
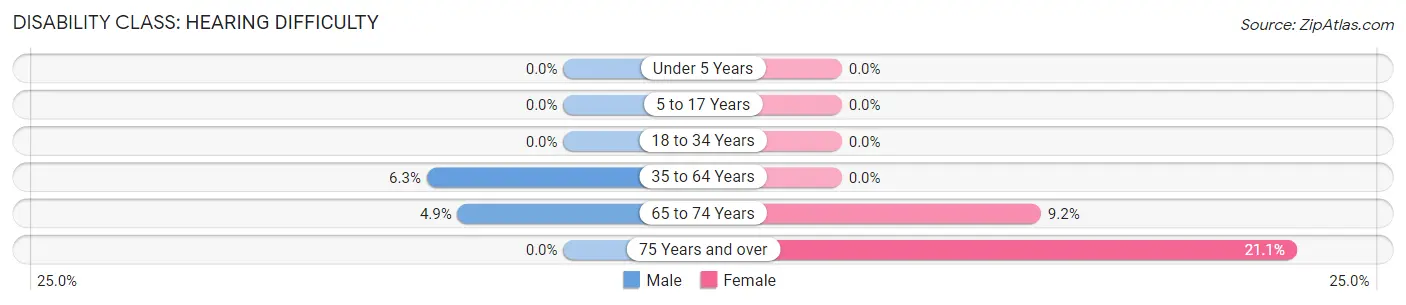
| Age Bracket | Male | Female |
| Under 5 Years | 0 (0.0%) | 0 (0.0%) |
| 5 to 17 Years | 0 (0.0%) | 0 (0.0%) |
| 18 to 34 Years | 0 (0.0%) | 0 (0.0%) |
| 35 to 64 Years | 46 (6.3%) | 0 (0.0%) |
| 65 to 74 Years | 8 (4.9%) | 17 (9.2%) |
| 75 Years and over | 0 (0.0%) | 19 (21.1%) |
Disability Class: Vision Difficulty
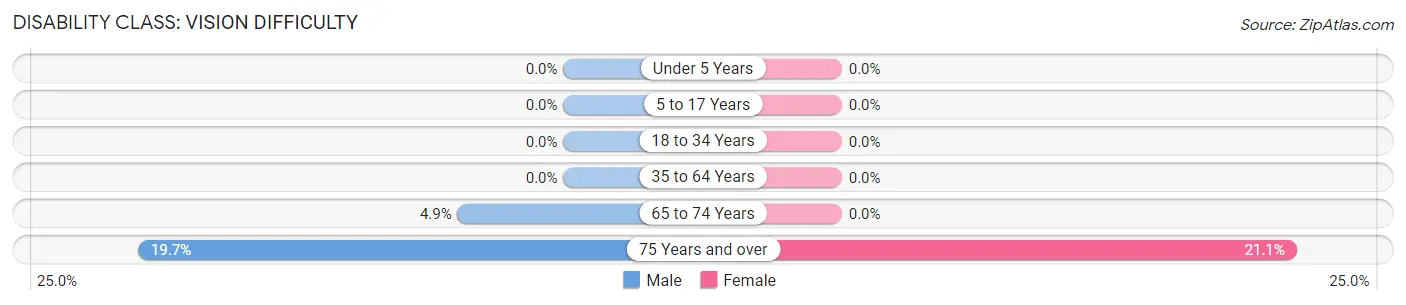
| Age Bracket | Male | Female |
| Under 5 Years | 0 (0.0%) | 0 (0.0%) |
| 5 to 17 Years | 0 (0.0%) | 0 (0.0%) |
| 18 to 34 Years | 0 (0.0%) | 0 (0.0%) |
| 35 to 64 Years | 0 (0.0%) | 0 (0.0%) |
| 65 to 74 Years | 8 (4.9%) | 0 (0.0%) |
| 75 Years and over | 15 (19.7%) | 19 (21.1%) |
Disability Class: Cognitive Difficulty
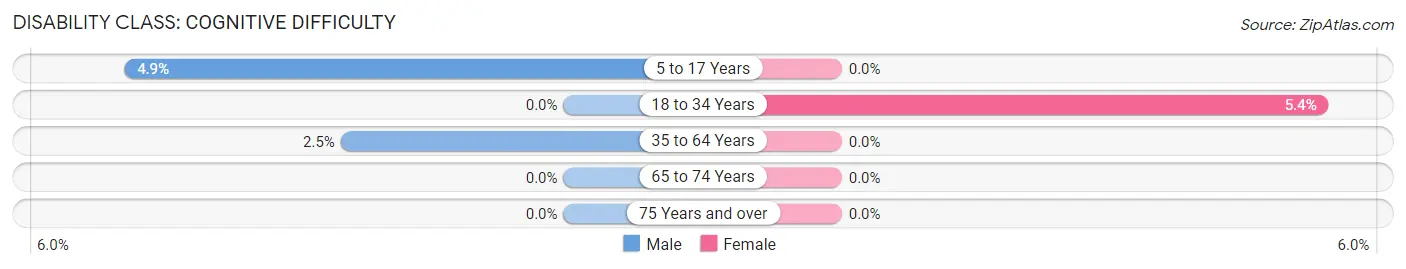
| Age Bracket | Male | Female |
| 5 to 17 Years | 25 (4.9%) | 0 (0.0%) |
| 18 to 34 Years | 0 (0.0%) | 13 (5.4%) |
| 35 to 64 Years | 18 (2.5%) | 0 (0.0%) |
| 65 to 74 Years | 0 (0.0%) | 0 (0.0%) |
| 75 Years and over | 0 (0.0%) | 0 (0.0%) |
Disability Class: Ambulatory Difficulty
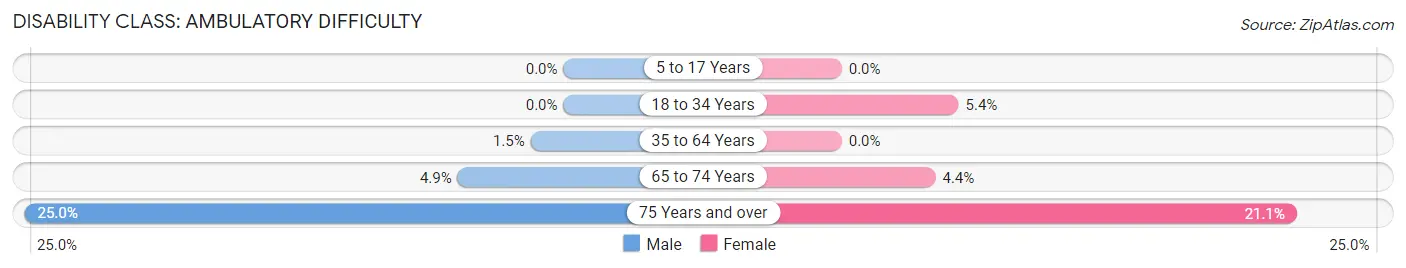
| Age Bracket | Male | Female |
| 5 to 17 Years | 0 (0.0%) | 0 (0.0%) |
| 18 to 34 Years | 0 (0.0%) | 13 (5.4%) |
| 35 to 64 Years | 11 (1.5%) | 0 (0.0%) |
| 65 to 74 Years | 8 (4.9%) | 8 (4.3%) |
| 75 Years and over | 19 (25.0%) | 19 (21.1%) |
Disability Class: Self-Care Difficulty
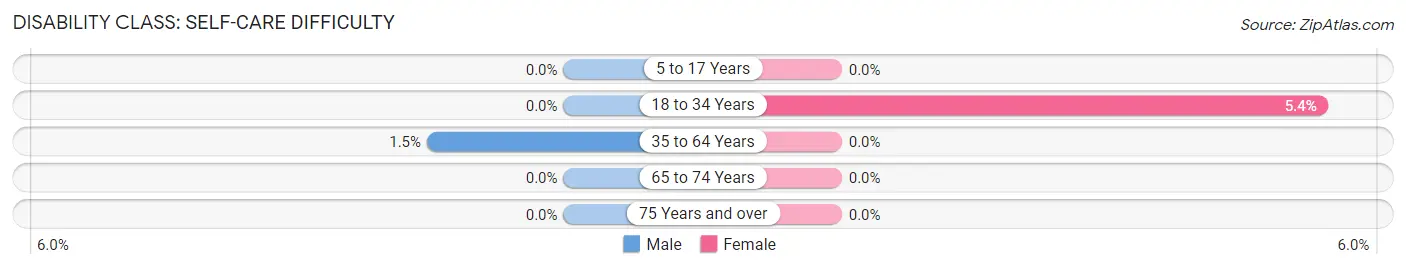
| Age Bracket | Male | Female |
| 5 to 17 Years | 0 (0.0%) | 0 (0.0%) |
| 18 to 34 Years | 0 (0.0%) | 13 (5.4%) |
| 35 to 64 Years | 11 (1.5%) | 0 (0.0%) |
| 65 to 74 Years | 0 (0.0%) | 0 (0.0%) |
| 75 Years and over | 0 (0.0%) | 0 (0.0%) |
Technology Access in Mountain Green
Computing Device Access in Mountain Green
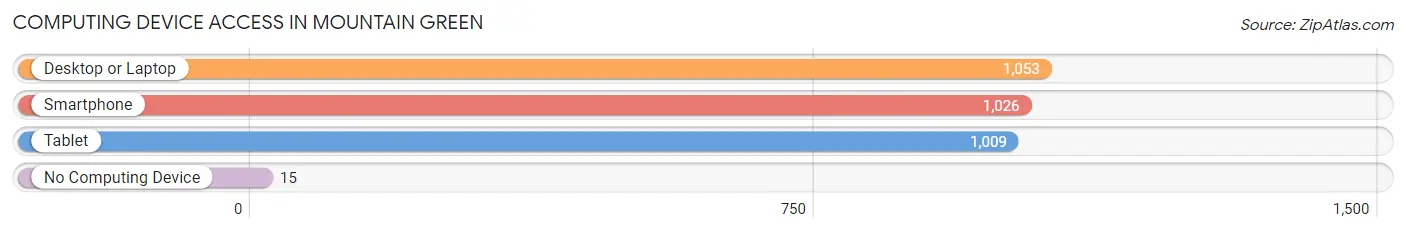
| Device Type | # Households | % Households |
| Desktop or Laptop | 1,053 | 98.6% |
| Smartphone | 1,026 | 96.1% |
| Tablet | 1,009 | 94.5% |
| No Computing Device | 15 | 1.4% |
| Total | 1,068 | 100.0% |
Internet Access in Mountain Green
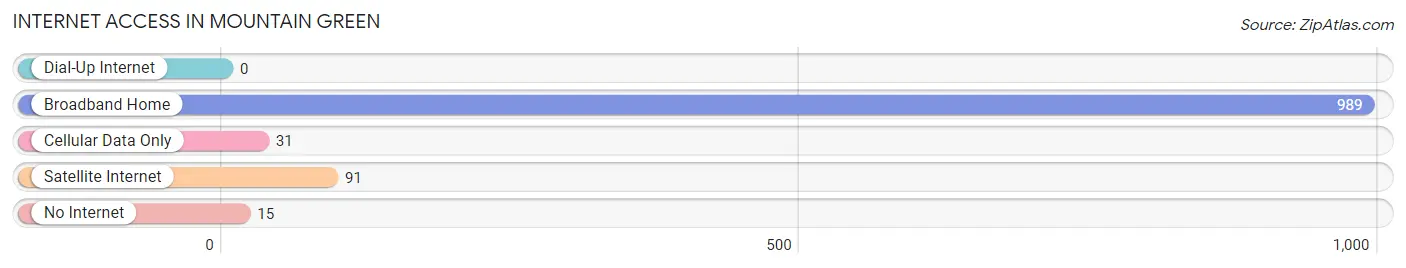
| Internet Type | # Households | % Households |
| Dial-Up Internet | 0 | 0.0% |
| Broadband Home | 989 | 92.6% |
| Cellular Data Only | 31 | 2.9% |
| Satellite Internet | 91 | 8.5% |
| No Internet | 15 | 1.4% |
| Total | 1,068 | 100.0% |
Mountain Green Summary
Mountain Green, Utah is a small unincorporated community located in Morgan County, Utah. It is situated in the foothills of the Wasatch Mountains, approximately 25 miles north of Salt Lake City. The population of Mountain Green was estimated to be 1,845 in 2019.
History
Mountain Green was first settled in 1859 by a group of Mormon pioneers led by John W. Van Cott. The pioneers named the area Mountain Green because of the lush green vegetation that surrounded the area. The first settlers built a fort and a schoolhouse, and the area quickly grew into a small farming community.
In the late 1800s, the area was known for its fruit orchards and dairy farms. The first post office was established in 1891, and the first church was built in 1895. The town was officially incorporated in 1909.
In the early 1900s, the area was known for its coal mining industry. The coal mines provided jobs for many of the town’s residents. The coal industry declined in the 1950s, and the town’s economy shifted to focus on agriculture and tourism.
Geography
Mountain Green is located in the foothills of the Wasatch Mountains, approximately 25 miles north of Salt Lake City. The town is situated at an elevation of 4,890 feet above sea level. The area is known for its lush green vegetation and scenic views of the surrounding mountains.
The town is located in a semi-arid climate zone, with hot summers and cold winters. The average annual temperature is 48°F, and the average annual precipitation is 16.5 inches.
Economy
Mountain Green’s economy is primarily based on agriculture and tourism. The town is home to several farms and orchards, which produce a variety of fruits and vegetables. The town is also a popular destination for outdoor recreation, such as hiking, camping, and fishing.
The town is home to several small businesses, including restaurants, shops, and lodging. The town is also home to a few manufacturing companies, which produce a variety of products, such as furniture and clothing.
Demographics
Mountain Green has a population of 1,845, according to the 2019 estimate. The population is predominantly white (94.3%), with small percentages of other races, including Hispanic (2.2%), African American (1.2%), and Asian (0.7%).
The median household income in Mountain Green is $63,917, and the median home value is $310,000. The town has a low unemployment rate of 3.2%. The town’s poverty rate is 8.2%.
Conclusion
Mountain Green, Utah is a small unincorporated community located in Morgan County, Utah. It is situated in the foothills of the Wasatch Mountains, approximately 25 miles north of Salt Lake City. The population of Mountain Green was estimated to be 1,845 in 2019. The town’s economy is primarily based on agriculture and tourism, and the town is home to several small businesses. The population is predominantly white, with small percentages of other races. The median household income in Mountain Green is $63,917, and the median home value is $310,000. The town has a low unemployment rate of 3.2%.
Common Questions
What is Per Capita Income in Mountain Green?
Per Capita income in Mountain Green is $46,454.
What is the Median Family Income in Mountain Green?
Median Family Income in Mountain Green is $140,000.
What is the Median Household income in Mountain Green?
Median Household Income in Mountain Green is $140,192.
What is Income or Wage Gap in Mountain Green?
Income or Wage Gap in Mountain Green is 78.6%.
Women in Mountain Green earn 21.4 cents for every dollar earned by a man.
What is Inequality or Gini Index in Mountain Green?
Inequality or Gini Index in Mountain Green is 0.32.
What is the Total Population of Mountain Green?
Total Population of Mountain Green is 3,646.
What is the Total Male Population of Mountain Green?
Total Male Population of Mountain Green is 1,873.
What is the Total Female Population of Mountain Green?
Total Female Population of Mountain Green is 1,773.
What is the Ratio of Males per 100 Females in Mountain Green?
There are 105.64 Males per 100 Females in Mountain Green.
What is the Ratio of Females per 100 Males in Mountain Green?
There are 94.66 Females per 100 Males in Mountain Green.
What is the Median Population Age in Mountain Green?
Median Population Age in Mountain Green is 36.7 Years.
What is the Average Family Size in Mountain Green
Average Family Size in Mountain Green is 3.6 People.
What is the Average Household Size in Mountain Green
Average Household Size in Mountain Green is 3.4 People.
How Large is the Labor Force in Mountain Green?
There are 1,571 People in the Labor Forcein in Mountain Green.
What is the Percentage of People in the Labor Force in Mountain Green?
61.4% of People are in the Labor Force in Mountain Green.
What is the Unemployment Rate in Mountain Green?
Unemployment Rate in Mountain Green is 1.0%.