Central Valley, UT Map & Demographics
Central Valley Map
Central Valley Overview
$33,139
PER CAPITA INCOME
$105,833
AVG FAMILY INCOME
$98,750
AVG HOUSEHOLD INCOME
47.9%
WAGE / INCOME GAP [ % ]
52.1¢/ $1
WAGE / INCOME GAP [ $ ]
0.34
INEQUALITY / GINI INDEX
713
TOTAL POPULATION
341
MALE POPULATION
372
FEMALE POPULATION
91.67
MALES / 100 FEMALES
109.09
FEMALES / 100 MALES
33.9
MEDIAN AGE
4.0
AVG FAMILY SIZE
3.5
AVG HOUSEHOLD SIZE
369
LABOR FORCE [ PEOPLE ]
73.4%
PERCENT IN LABOR FORCE
2.7%
UNEMPLOYMENT RATE
Central Valley Area Codes
Income in Central Valley
Income Overview in Central Valley
Per Capita Income in Central Valley is $33,139, while median incomes of families and households are $105,833 and $98,750 respectively.
| Characteristic | Number | Measure |
| Per Capita Income | 713 | $33,139 |
| Median Family Income | 154 | $105,833 |
| Mean Family Income | 154 | $111,446 |
| Median Household Income | 205 | $98,750 |
| Mean Household Income | 205 | $105,097 |
| Income Deficit | 154 | $0 |
| Wage / Income Gap (%) | 713 | 47.88% |
| Wage / Income Gap ($) | 713 | 52.12¢ per $1 |
| Gini / Inequality Index | 713 | 0.34 |
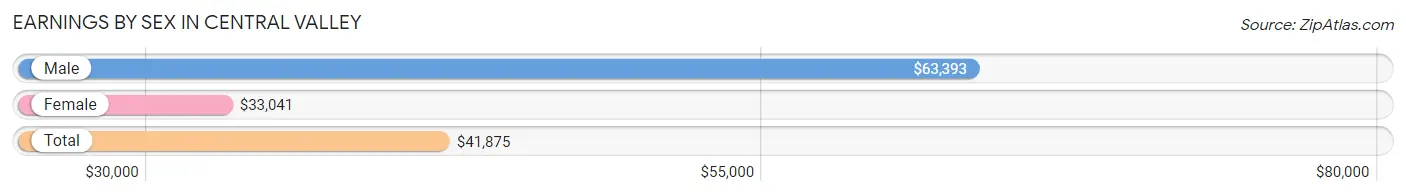
Earnings by Sex in Central Valley
Average Earnings in Central Valley are $41,875, $63,393 for men and $33,041 for women, a difference of 47.9%.
| Sex | Number | Average Earnings |
| Male | 201 (53.5%) | $63,393 |
| Female | 175 (46.5%) | $33,041 |
| Total | 376 (100.0%) | $41,875 |
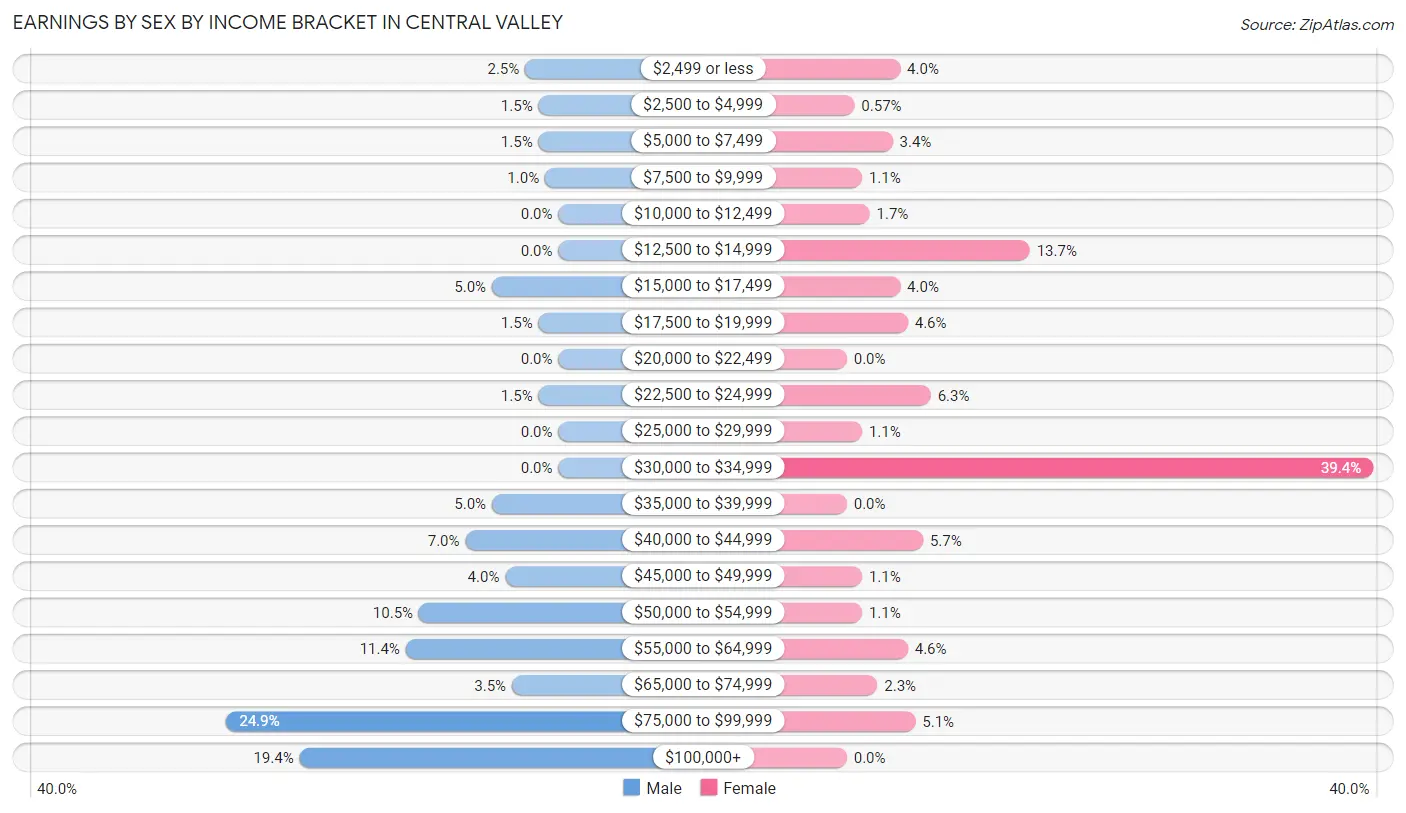
Earnings by Sex by Income Bracket in Central Valley
The most common earnings brackets in Central Valley are $75,000 to $99,999 for men (50 | 24.9%) and $30,000 to $34,999 for women (69 | 39.4%).
| Income | Male | Female |
| $2,499 or less | 5 (2.5%) | 7 (4.0%) |
| $2,500 to $4,999 | 3 (1.5%) | 1 (0.6%) |
| $5,000 to $7,499 | 3 (1.5%) | 6 (3.4%) |
| $7,500 to $9,999 | 2 (1.0%) | 2 (1.1%) |
| $10,000 to $12,499 | 0 (0.0%) | 3 (1.7%) |
| $12,500 to $14,999 | 0 (0.0%) | 24 (13.7%) |
| $15,000 to $17,499 | 10 (5.0%) | 7 (4.0%) |
| $17,500 to $19,999 | 3 (1.5%) | 8 (4.6%) |
| $20,000 to $22,499 | 0 (0.0%) | 0 (0.0%) |
| $22,500 to $24,999 | 3 (1.5%) | 11 (6.3%) |
| $25,000 to $29,999 | 0 (0.0%) | 2 (1.1%) |
| $30,000 to $34,999 | 0 (0.0%) | 69 (39.4%) |
| $35,000 to $39,999 | 10 (5.0%) | 0 (0.0%) |
| $40,000 to $44,999 | 14 (7.0%) | 10 (5.7%) |
| $45,000 to $49,999 | 8 (4.0%) | 2 (1.1%) |
| $50,000 to $54,999 | 21 (10.4%) | 2 (1.1%) |
| $55,000 to $64,999 | 23 (11.4%) | 8 (4.6%) |
| $65,000 to $74,999 | 7 (3.5%) | 4 (2.3%) |
| $75,000 to $99,999 | 50 (24.9%) | 9 (5.1%) |
| $100,000+ | 39 (19.4%) | 0 (0.0%) |
| Total | 201 (100.0%) | 175 (100.0%) |
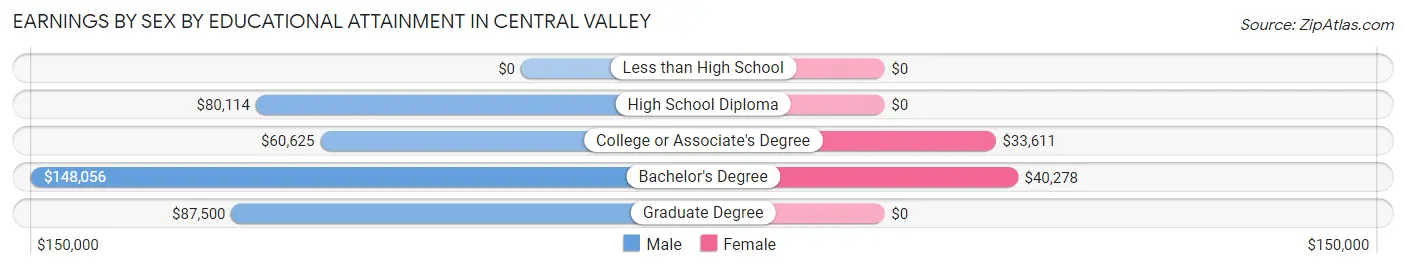
Earnings by Sex by Educational Attainment in Central Valley
Average earnings in Central Valley are $80,069 for men and $33,582 for women, a difference of 58.1%. Men with an educational attainment of bachelor's degree enjoy the highest average annual earnings of $148,056, while those with college or associate's degree education earn the least with $60,625. Women with an educational attainment of bachelor's degree earn the most with the average annual earnings of $40,278, while those with college or associate's degree education have the smallest earnings of $33,611.
| Educational Attainment | Male Income | Female Income |
| Less than High School | - | - |
| High School Diploma | $80,114 | $0 |
| College or Associate's Degree | $60,625 | $33,611 |
| Bachelor's Degree | $148,056 | $40,278 |
| Graduate Degree | $87,500 | $0 |
| Total | $80,069 | $33,582 |
Family Income in Central Valley
Family Income Brackets in Central Valley
According to the Central Valley family income data, there are 47 families falling into the $100,000 to $149,999 income range, which is the most common income bracket and makes up 30.5% of all families.
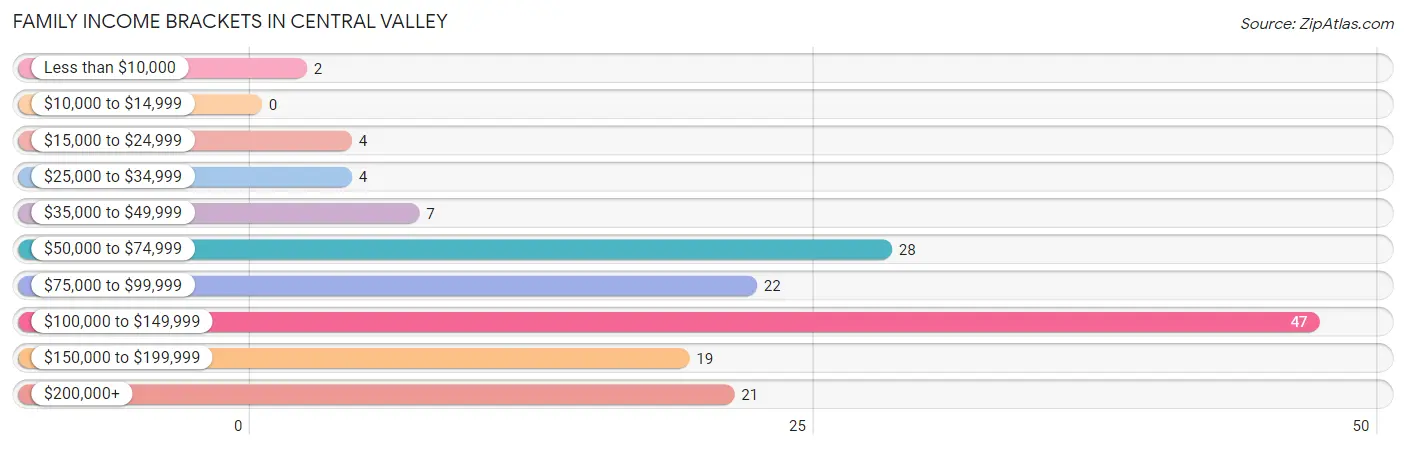
| Income Bracket | # Families | % Families |
| Less than $10,000 | 2 | 1.3% |
| $10,000 to $14,999 | 0 | 0.0% |
| $15,000 to $24,999 | 4 | 2.6% |
| $25,000 to $34,999 | 4 | 2.6% |
| $35,000 to $49,999 | 7 | 4.5% |
| $50,000 to $74,999 | 28 | 18.2% |
| $75,000 to $99,999 | 22 | 14.3% |
| $100,000 to $149,999 | 47 | 30.5% |
| $150,000 to $199,999 | 19 | 12.3% |
| $200,000+ | 21 | 13.6% |
Family Income by Famaliy Size in Central Valley
4-person families (42 | 27.3%) account for the highest median family income in Central Valley with $155,000 per family, while 2-person families (57 | 37.0%) have the highest median income of $39,375 per family member.
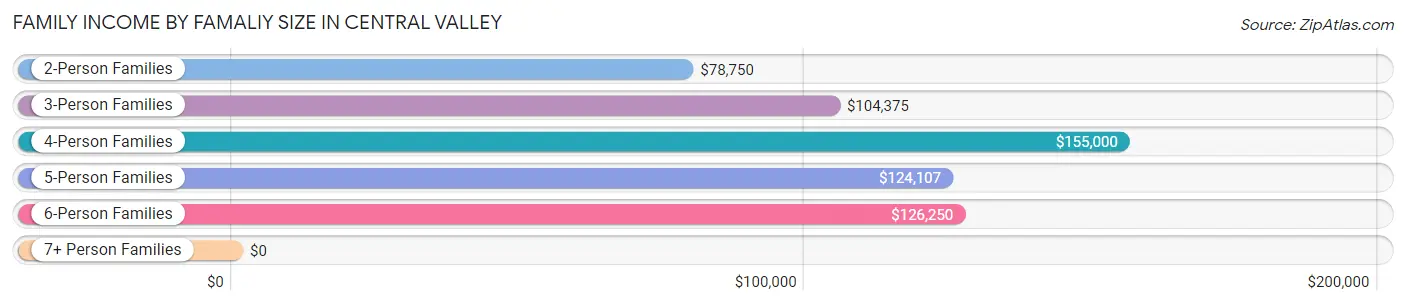
| Income Bracket | # Families | Median Income |
| 2-Person Families | 57 (37.0%) | $78,750 |
| 3-Person Families | 24 (15.6%) | $104,375 |
| 4-Person Families | 42 (27.3%) | $155,000 |
| 5-Person Families | 23 (14.9%) | $124,107 |
| 6-Person Families | 8 (5.2%) | $126,250 |
| 7+ Person Families | 0 (0.0%) | $0 |
| Total | 154 (100.0%) | $105,833 |
Family Income by Number of Earners in Central Valley
The median family income in Central Valley is $105,833, with families comprising 3+ earners (34) having the highest median family income of $200,375, while families with no earners (15) have the lowest median family income of $55,536, accounting for 22.1% and 9.7% of families, respectively.
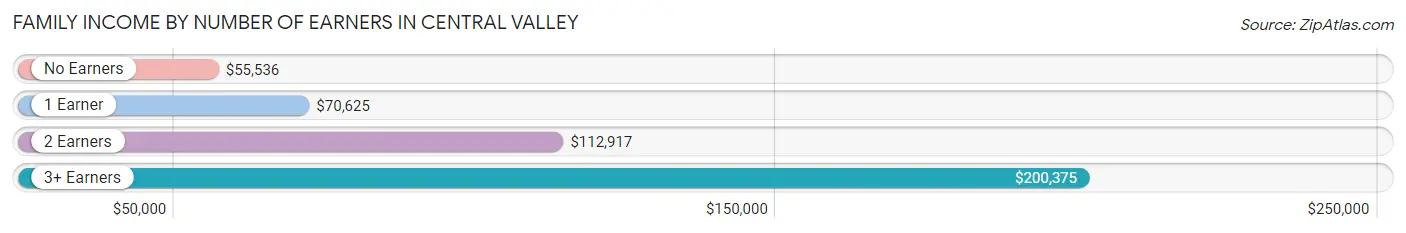
| Number of Earners | # Families | Median Income |
| No Earners | 15 (9.7%) | $55,536 |
| 1 Earner | 46 (29.9%) | $70,625 |
| 2 Earners | 59 (38.3%) | $112,917 |
| 3+ Earners | 34 (22.1%) | $200,375 |
| Total | 154 (100.0%) | $105,833 |
Household Income in Central Valley
Household Income Brackets in Central Valley
With 48 households falling in the category, the $100,000 to $149,999 income range is the most frequent in Central Valley, accounting for 23.4% of all households.
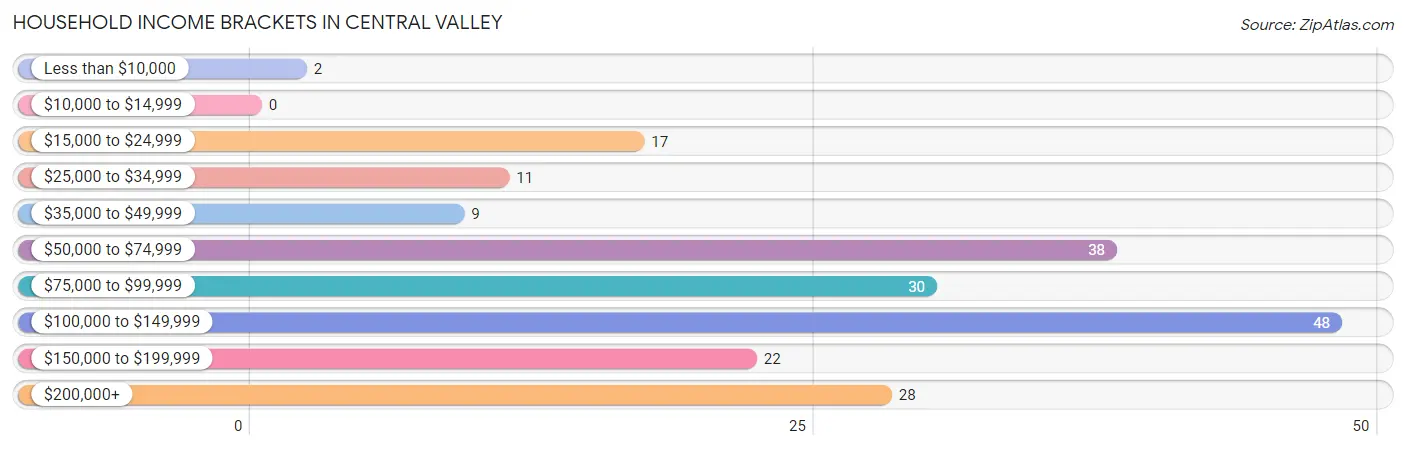
| Income Bracket | # Households | % Households |
| Less than $10,000 | 2 | 1.0% |
| $10,000 to $14,999 | 0 | 0.0% |
| $15,000 to $24,999 | 17 | 8.3% |
| $25,000 to $34,999 | 11 | 5.4% |
| $35,000 to $49,999 | 9 | 4.4% |
| $50,000 to $74,999 | 38 | 18.5% |
| $75,000 to $99,999 | 30 | 14.6% |
| $100,000 to $149,999 | 48 | 23.4% |
| $150,000 to $199,999 | 22 | 10.7% |
| $200,000+ | 28 | 13.7% |
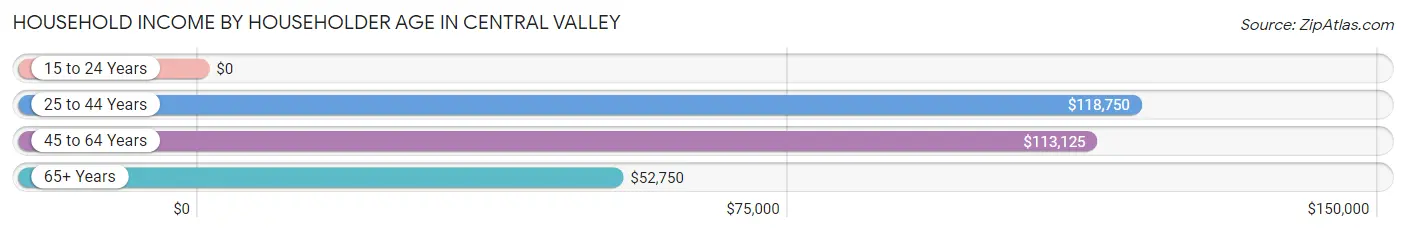
Household Income by Householder Age in Central Valley
The median household income in Central Valley is $98,750, with the highest median household income of $118,750 found in the 25 to 44 years age bracket for the primary householder. A total of 67 households (32.7%) fall into this category.
| Income Bracket | # Households | Median Income |
| 15 to 24 Years | 0 (0.0%) | $0 |
| 25 to 44 Years | 67 (32.7%) | $118,750 |
| 45 to 64 Years | 81 (39.5%) | $113,125 |
| 65+ Years | 57 (27.8%) | $52,750 |
| Total | 205 (100.0%) | $98,750 |
Poverty in Central Valley
Income Below Poverty by Sex and Age in Central Valley
With 4.5% poverty level for males and 3.8% for females among the residents of Central Valley, 6 to 11 year old males and 5 year old females are the most vulnerable to poverty, with 4 males (11.8%) and 2 females (100.0%) in their respective age groups living below the poverty level.
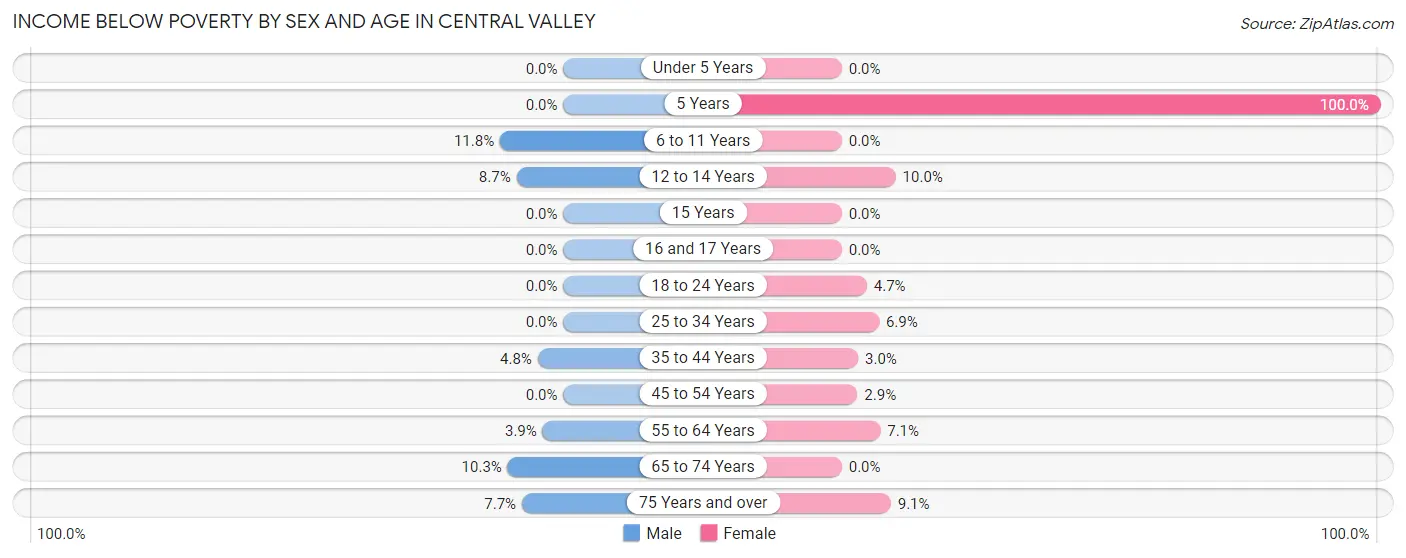
| Age Bracket | Male | Female |
| Under 5 Years | 0 (0.0%) | 0 (0.0%) |
| 5 Years | 0 (0.0%) | 2 (100.0%) |
| 6 to 11 Years | 4 (11.8%) | 0 (0.0%) |
| 12 to 14 Years | 2 (8.7%) | 1 (10.0%) |
| 15 Years | 0 (0.0%) | 0 (0.0%) |
| 16 and 17 Years | 0 (0.0%) | 0 (0.0%) |
| 18 to 24 Years | 0 (0.0%) | 2 (4.6%) |
| 25 to 34 Years | 0 (0.0%) | 2 (6.9%) |
| 35 to 44 Years | 2 (4.8%) | 1 (3.0%) |
| 45 to 54 Years | 0 (0.0%) | 2 (2.9%) |
| 55 to 64 Years | 2 (3.8%) | 2 (7.1%) |
| 65 to 74 Years | 3 (10.3%) | 0 (0.0%) |
| 75 Years and over | 2 (7.7%) | 2 (9.1%) |
| Total | 15 (4.5%) | 14 (3.8%) |
Income Above Poverty by Sex and Age in Central Valley
According to the poverty statistics in Central Valley, males aged under 5 years and females aged under 5 years are the age groups that are most secure financially, with 100.0% of males and 100.0% of females in these age groups living above the poverty line.
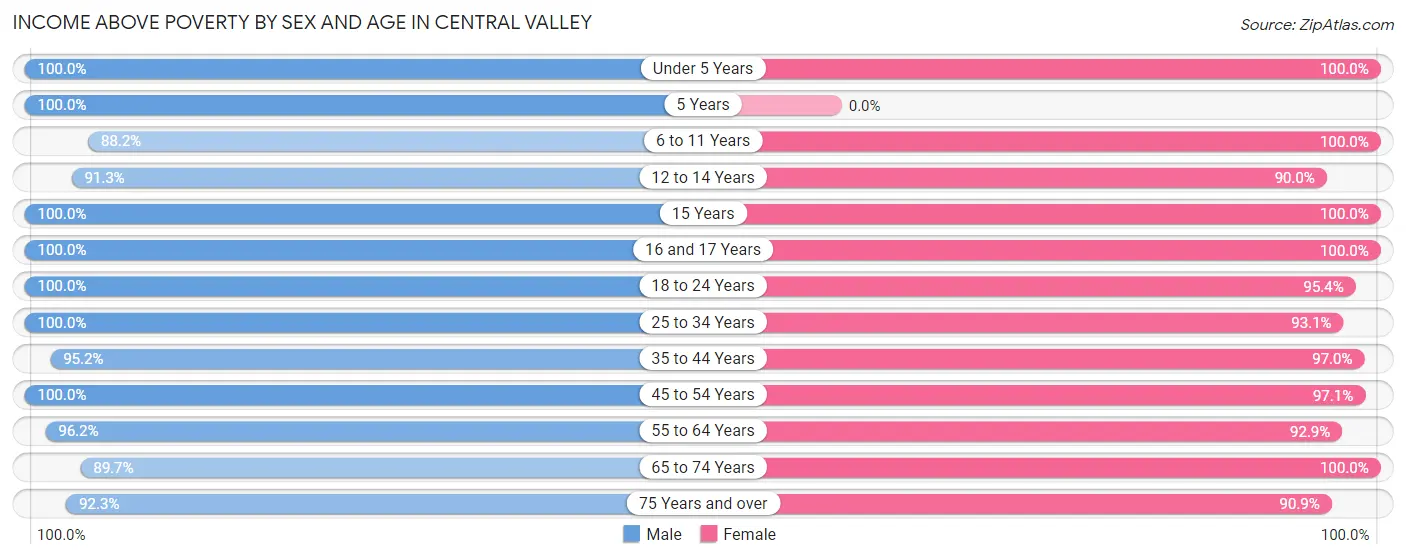
| Age Bracket | Male | Female |
| Under 5 Years | 32 (100.0%) | 19 (100.0%) |
| 5 Years | 2 (100.0%) | 0 (0.0%) |
| 6 to 11 Years | 30 (88.2%) | 22 (100.0%) |
| 12 to 14 Years | 21 (91.3%) | 9 (90.0%) |
| 15 Years | 2 (100.0%) | 58 (100.0%) |
| 16 and 17 Years | 7 (100.0%) | 5 (100.0%) |
| 18 to 24 Years | 39 (100.0%) | 41 (95.4%) |
| 25 to 34 Years | 29 (100.0%) | 27 (93.1%) |
| 35 to 44 Years | 40 (95.2%) | 32 (97.0%) |
| 45 to 54 Years | 18 (100.0%) | 67 (97.1%) |
| 55 to 64 Years | 50 (96.2%) | 26 (92.9%) |
| 65 to 74 Years | 26 (89.7%) | 32 (100.0%) |
| 75 Years and over | 24 (92.3%) | 20 (90.9%) |
| Total | 320 (95.5%) | 358 (96.2%) |
Income Below Poverty Among Married-Couple Families in Central Valley
The poverty statistics for married-couple families in Central Valley show that 3.5% or 5 of the total 144 families live below the poverty line. Families with no children have the highest poverty rate of 6.0%, comprising of 4 families. On the other hand, families with 1 or 2 children have the lowest poverty rate of 0.0%, which includes 0 families.
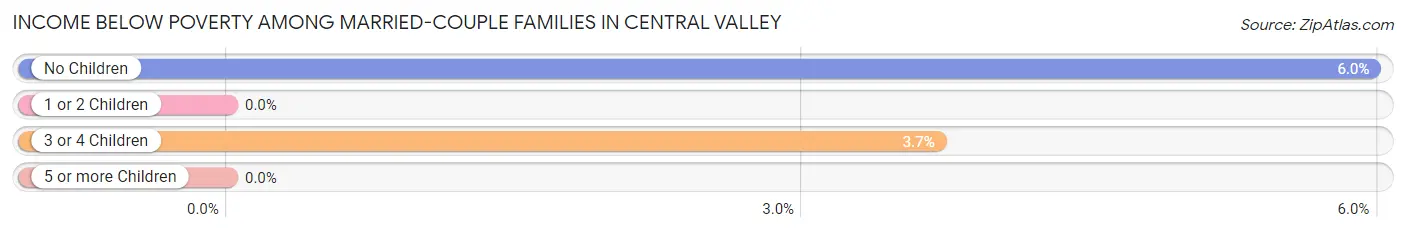
| Children | Above Poverty | Below Poverty |
| No Children | 63 (94.0%) | 4 (6.0%) |
| 1 or 2 Children | 50 (100.0%) | 0 (0.0%) |
| 3 or 4 Children | 26 (96.3%) | 1 (3.7%) |
| 5 or more Children | 0 (0.0%) | 0 (0.0%) |
| Total | 139 (96.5%) | 5 (3.5%) |
Income Below Poverty Among Single-Parent Households in Central Valley
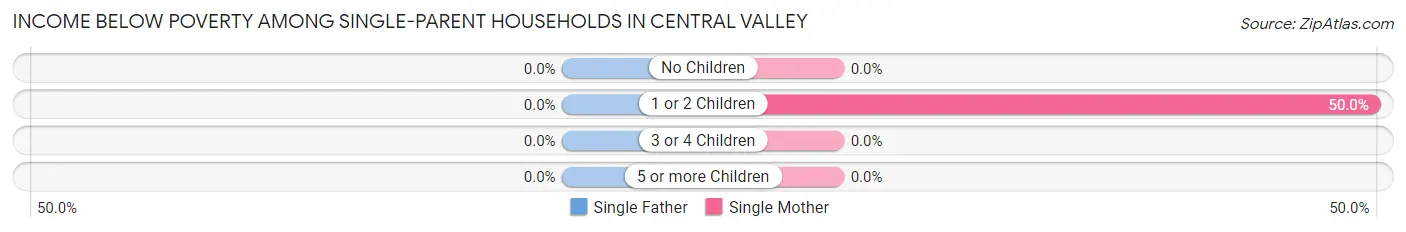
| Children | Single Father | Single Mother |
| No Children | 0 (0.0%) | 0 (0.0%) |
| 1 or 2 Children | 0 (0.0%) | 2 (50.0%) |
| 3 or 4 Children | 0 (0.0%) | 0 (0.0%) |
| 5 or more Children | 0 (0.0%) | 0 (0.0%) |
| Total | 0 (0.0%) | 2 (28.6%) |
Income Below Poverty Among Married-Couple vs Single-Parent Households in Central Valley
The poverty data for Central Valley shows that 5 of the married-couple family households (3.5%) and 2 of the single-parent households (20.0%) are living below the poverty level. Within the married-couple family households, those with no children have the highest poverty rate, with 4 households (6.0%) falling below the poverty line. Among the single-parent households, those with 1 or 2 children have the highest poverty rate, with 2 household (28.6%) living below poverty.
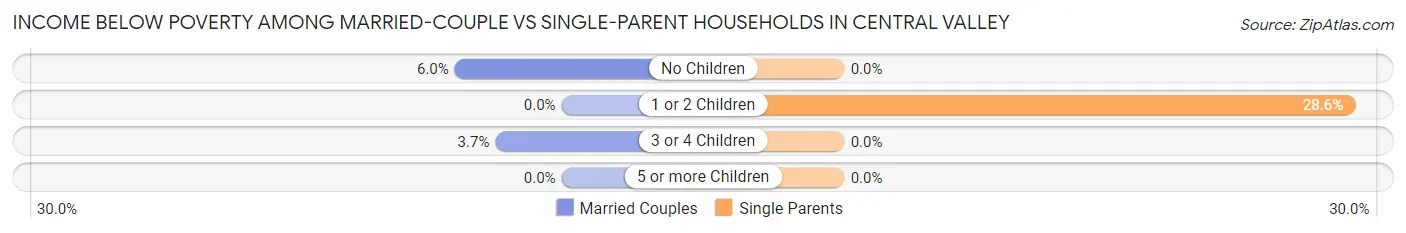
| Children | Married-Couple Families | Single-Parent Households |
| No Children | 4 (6.0%) | 0 (0.0%) |
| 1 or 2 Children | 0 (0.0%) | 2 (28.6%) |
| 3 or 4 Children | 1 (3.7%) | 0 (0.0%) |
| 5 or more Children | 0 (0.0%) | 0 (0.0%) |
| Total | 5 (3.5%) | 2 (20.0%) |
Race in Central Valley
The most populous races in Central Valley are White / Caucasian (693 | 97.2%), Two or more Races (9 | 1.3%), and Native / Alaskan (7 | 1.0%).
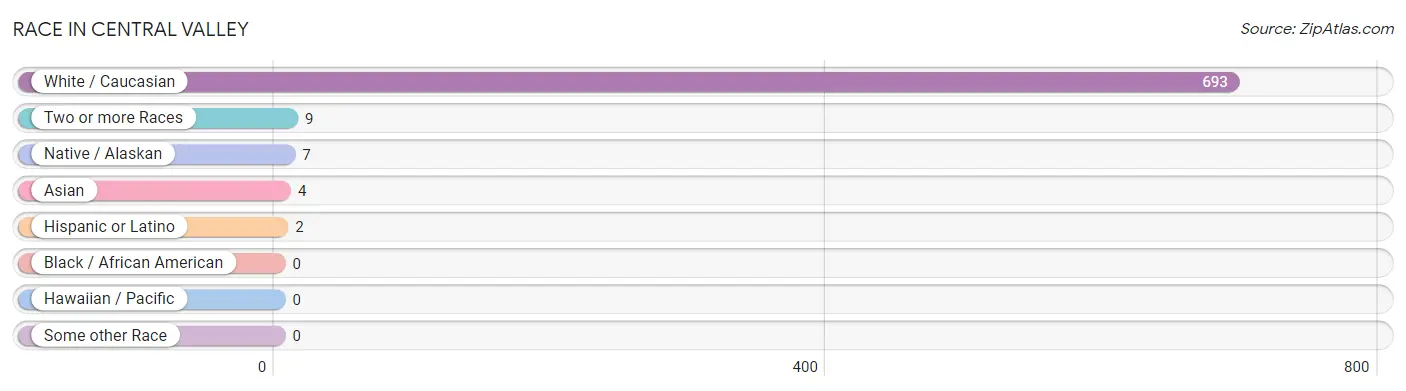
| Race | # Population | % Population |
| Asian | 4 | 0.6% |
| Black / African American | 0 | 0.0% |
| Hawaiian / Pacific | 0 | 0.0% |
| Hispanic or Latino | 2 | 0.3% |
| Native / Alaskan | 7 | 1.0% |
| White / Caucasian | 693 | 97.2% |
| Two or more Races | 9 | 1.3% |
| Some other Race | 0 | 0.0% |
| Total | 713 | 100.0% |
Ancestry in Central Valley
The most populous ancestries reported in Central Valley are English (309 | 43.3%), Danish (54 | 7.6%), German (49 | 6.9%), European (24 | 3.4%), and Swedish (23 | 3.2%), together accounting for 64.4% of all Central Valley residents.
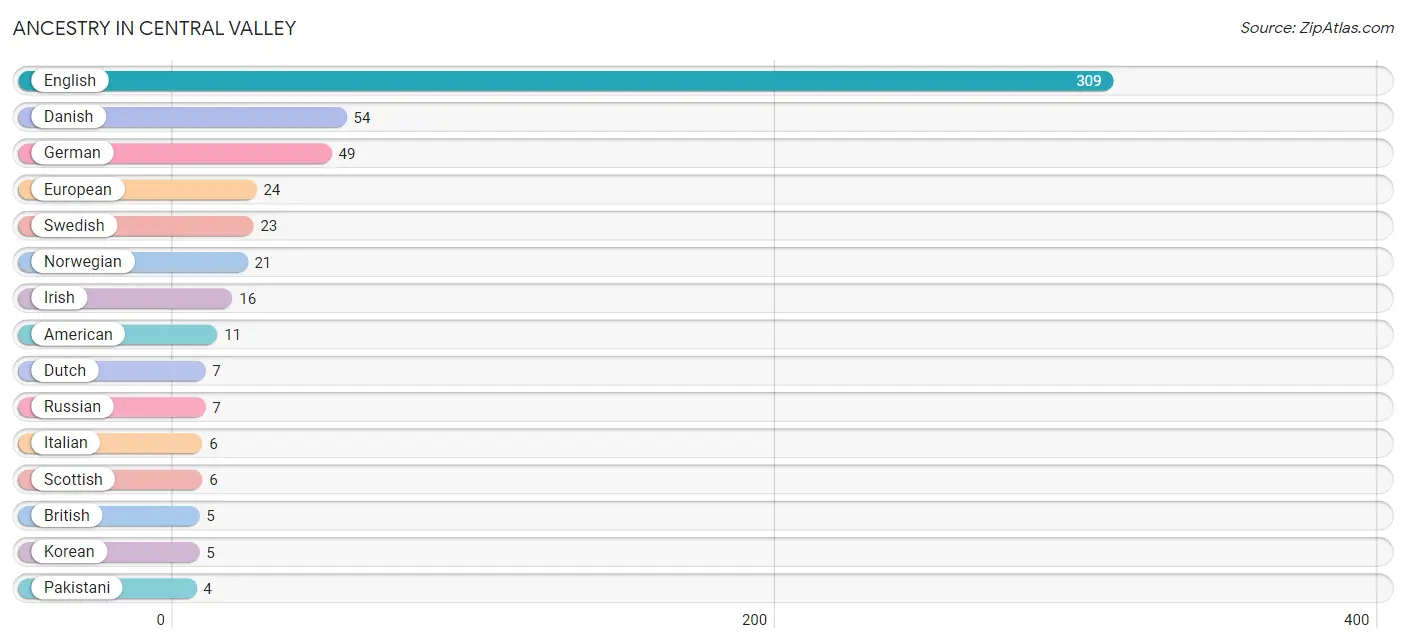
| Ancestry | # Population | % Population |
| American | 11 | 1.5% |
| British | 5 | 0.7% |
| Danish | 54 | 7.6% |
| Dutch | 7 | 1.0% |
| English | 309 | 43.3% |
| European | 24 | 3.4% |
| German | 49 | 6.9% |
| Irish | 16 | 2.2% |
| Italian | 6 | 0.8% |
| Korean | 5 | 0.7% |
| Norwegian | 21 | 2.9% |
| Pakistani | 4 | 0.6% |
| Polish | 2 | 0.3% |
| Russian | 7 | 1.0% |
| Scandinavian | 4 | 0.6% |
| Scottish | 6 | 0.8% |
| Swedish | 23 | 3.2% |
| Ute | 3 | 0.4% |
| Welsh | 2 | 0.3% | View All 19 Rows |
Immigrants in Central Valley
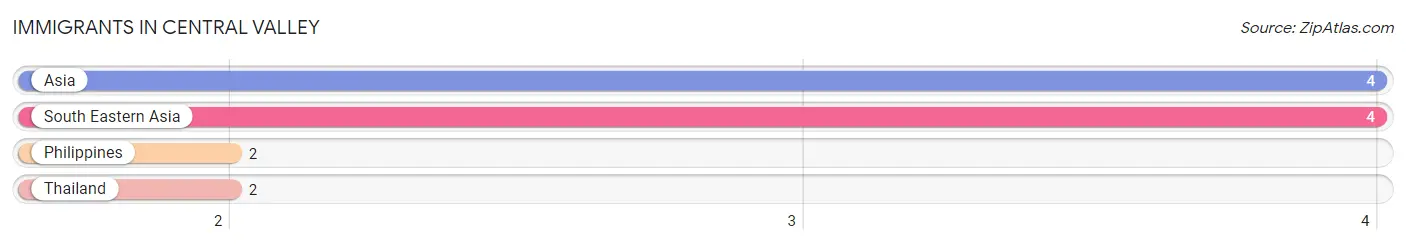
The most numerous immigrant groups reported in Central Valley came from Asia (4 | 0.6%), South Eastern Asia (4 | 0.6%), Philippines (2 | 0.3%), and Thailand (2 | 0.3%), together accounting for 1.7% of all Central Valley residents.
| Immigration Origin | # Population | % Population |
| Asia | 4 | 0.6% |
| Philippines | 2 | 0.3% |
| South Eastern Asia | 4 | 0.6% |
| Thailand | 2 | 0.3% | View All 4 Rows |
Sex and Age in Central Valley
Sex and Age in Central Valley
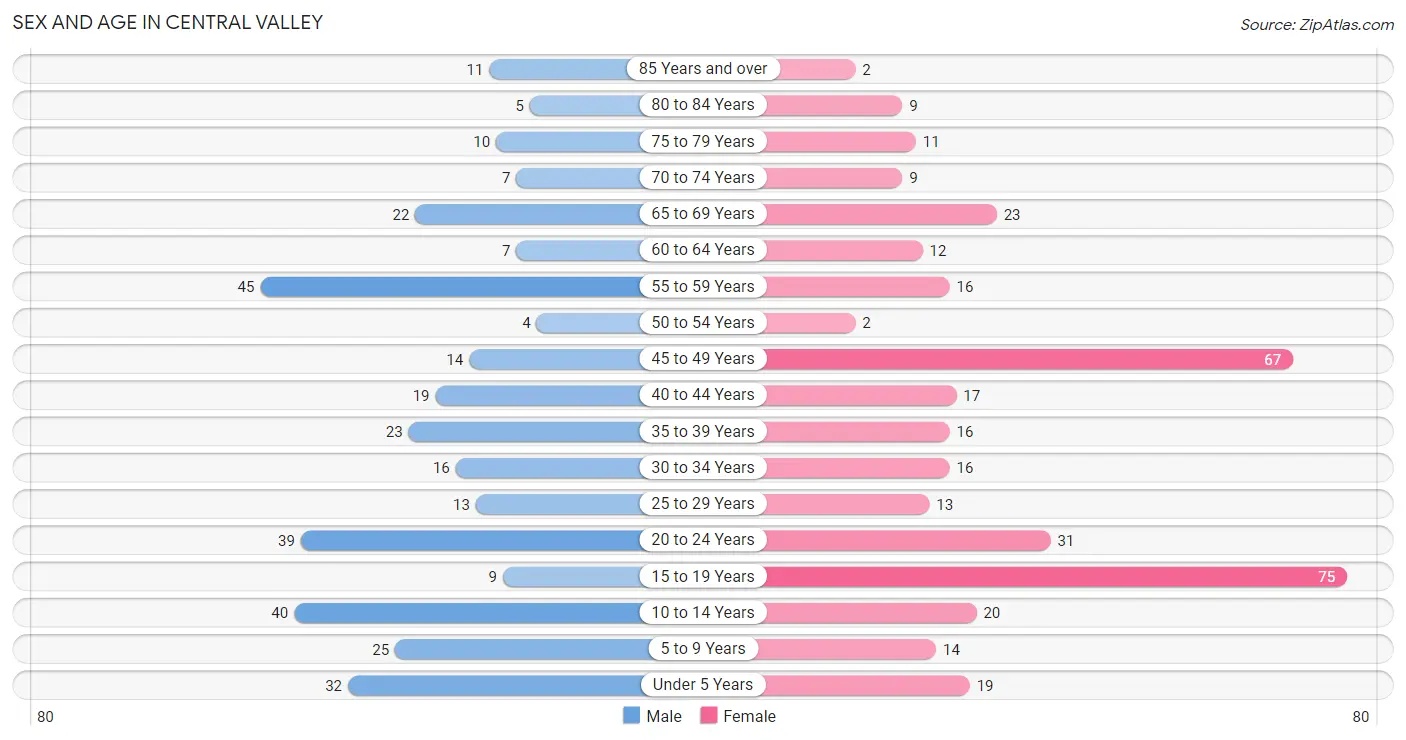
The most populous age groups in Central Valley are 55 to 59 Years (45 | 13.2%) for men and 15 to 19 Years (75 | 20.2%) for women.
| Age Bracket | Male | Female |
| Under 5 Years | 32 (9.4%) | 19 (5.1%) |
| 5 to 9 Years | 25 (7.3%) | 14 (3.8%) |
| 10 to 14 Years | 40 (11.7%) | 20 (5.4%) |
| 15 to 19 Years | 9 (2.6%) | 75 (20.2%) |
| 20 to 24 Years | 39 (11.4%) | 31 (8.3%) |
| 25 to 29 Years | 13 (3.8%) | 13 (3.5%) |
| 30 to 34 Years | 16 (4.7%) | 16 (4.3%) |
| 35 to 39 Years | 23 (6.7%) | 16 (4.3%) |
| 40 to 44 Years | 19 (5.6%) | 17 (4.6%) |
| 45 to 49 Years | 14 (4.1%) | 67 (18.0%) |
| 50 to 54 Years | 4 (1.2%) | 2 (0.5%) |
| 55 to 59 Years | 45 (13.2%) | 16 (4.3%) |
| 60 to 64 Years | 7 (2.1%) | 12 (3.2%) |
| 65 to 69 Years | 22 (6.5%) | 23 (6.2%) |
| 70 to 74 Years | 7 (2.1%) | 9 (2.4%) |
| 75 to 79 Years | 10 (2.9%) | 11 (3.0%) |
| 80 to 84 Years | 5 (1.5%) | 9 (2.4%) |
| 85 Years and over | 11 (3.2%) | 2 (0.5%) |
| Total | 341 (100.0%) | 372 (100.0%) |
Families and Households in Central Valley
Median Family Size in Central Valley
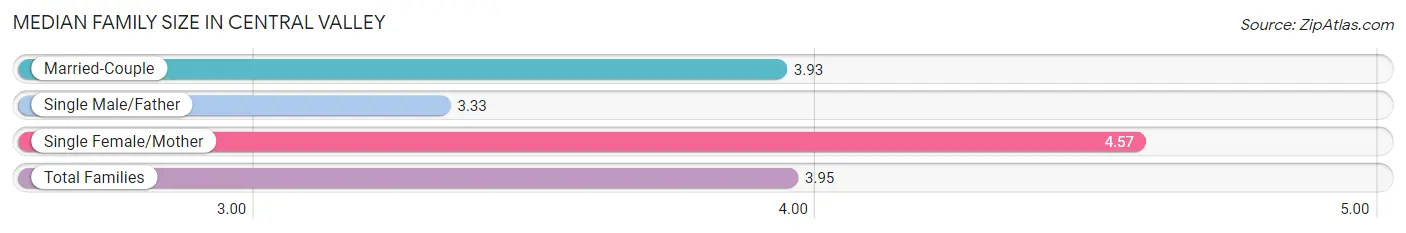
The median family size in Central Valley is 3.95 persons per family, with single female/mother families (7 | 4.5%) accounting for the largest median family size of 4.57 persons per family. On the other hand, single male/father families (3 | 1.9%) represent the smallest median family size with 3.33 persons per family.
| Family Type | # Families | Family Size |
| Married-Couple | 144 (93.5%) | 3.93 |
| Single Male/Father | 3 (1.9%) | 3.33 |
| Single Female/Mother | 7 (4.5%) | 4.57 |
| Total Families | 154 (100.0%) | 3.95 |
Median Household Size in Central Valley
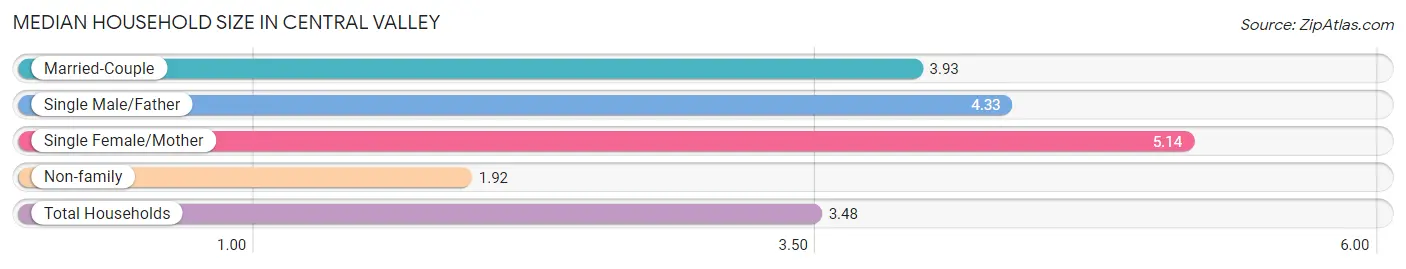
The median household size in Central Valley is 3.48 persons per household, with single female/mother households (7 | 3.4%) accounting for the largest median household size of 5.14 persons per household. non-family households (51 | 24.9%) represent the smallest median household size with 1.92 persons per household.
| Household Type | # Households | Household Size |
| Married-Couple | 144 (70.2%) | 3.93 |
| Single Male/Father | 3 (1.5%) | 4.33 |
| Single Female/Mother | 7 (3.4%) | 5.14 |
| Non-family | 51 (24.9%) | 1.92 |
| Total Households | 205 (100.0%) | 3.48 |
Household Size by Marriage Status in Central Valley
Out of a total of 205 households in Central Valley, 154 (75.1%) are family households, while 51 (24.9%) are nonfamily households. The most numerous type of family households are 2-person households, comprising 52, and the most common type of nonfamily households are 1-person households, comprising 35.
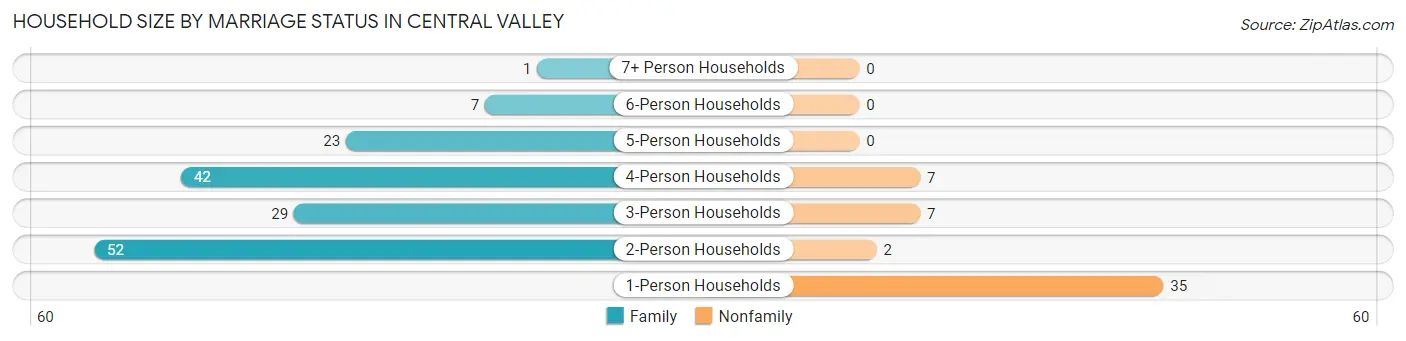
| Household Size | Family Households | Nonfamily Households |
| 1-Person Households | - | 35 (17.1%) |
| 2-Person Households | 52 (25.4%) | 2 (1.0%) |
| 3-Person Households | 29 (14.1%) | 7 (3.4%) |
| 4-Person Households | 42 (20.5%) | 7 (3.4%) |
| 5-Person Households | 23 (11.2%) | 0 (0.0%) |
| 6-Person Households | 7 (3.4%) | 0 (0.0%) |
| 7+ Person Households | 1 (0.5%) | 0 (0.0%) |
| Total | 154 (75.1%) | 51 (24.9%) |
Female Fertility in Central Valley
Fertility by Age in Central Valley
Average fertility rate in Central Valley is 30.0 births per 1,000 women. Women in the age bracket of 20 to 34 years have the highest fertility rate with 117.0 births per 1,000 women. Women in the age bracket of 20 to 34 years acount for 100.0% of all women with births.
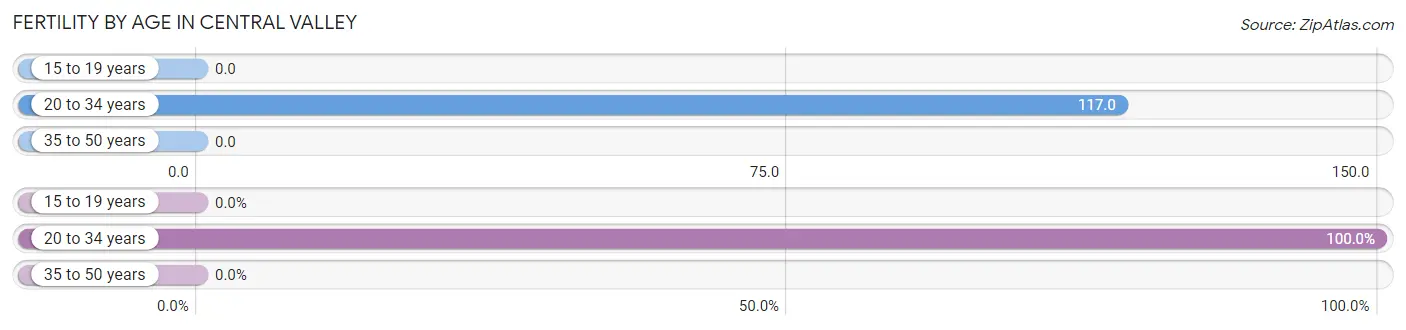
| Age Bracket | Women with Births | Births / 1,000 Women |
| 15 to 19 years | 0 (0.0%) | 0.0 |
| 20 to 34 years | 7 (100.0%) | 117.0 |
| 35 to 50 years | 0 (0.0%) | 0.0 |
| Total | 7 (100.0%) | 30.0 |
Fertility by Age by Marriage Status in Central Valley
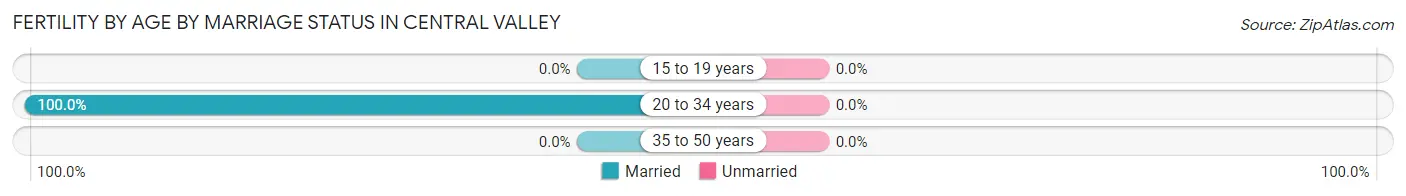
| Age Bracket | Married | Unmarried |
| 15 to 19 years | 0 (0.0%) | 0 (0.0%) |
| 20 to 34 years | 7 (100.0%) | 0 (0.0%) |
| 35 to 50 years | 0 (0.0%) | 0 (0.0%) |
| Total | 7 (100.0%) | 0 (0.0%) |
Fertility by Education in Central Valley
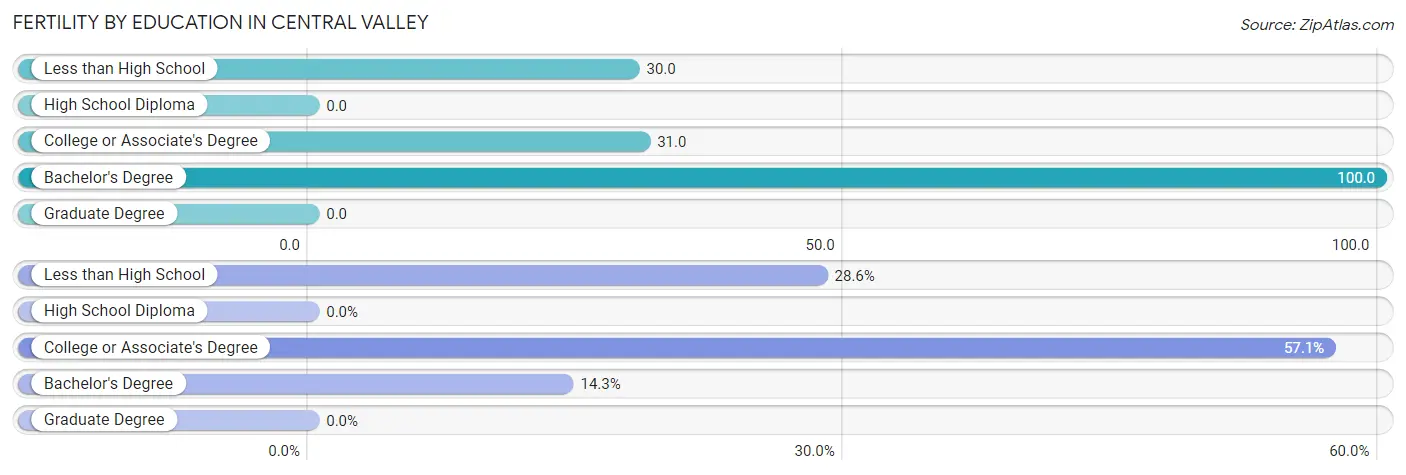
| Educational Attainment | Women with Births | Births / 1,000 Women |
| Less than High School | 2 (28.6%) | 30.0 |
| High School Diploma | 0 (0.0%) | 0.0 |
| College or Associate's Degree | 4 (57.1%) | 31.0 |
| Bachelor's Degree | 1 (14.3%) | 100.0 |
| Graduate Degree | 0 (0.0%) | 0.0 |
| Total | 7 (100.0%) | 30.0 |
Fertility by Education by Marriage Status in Central Valley
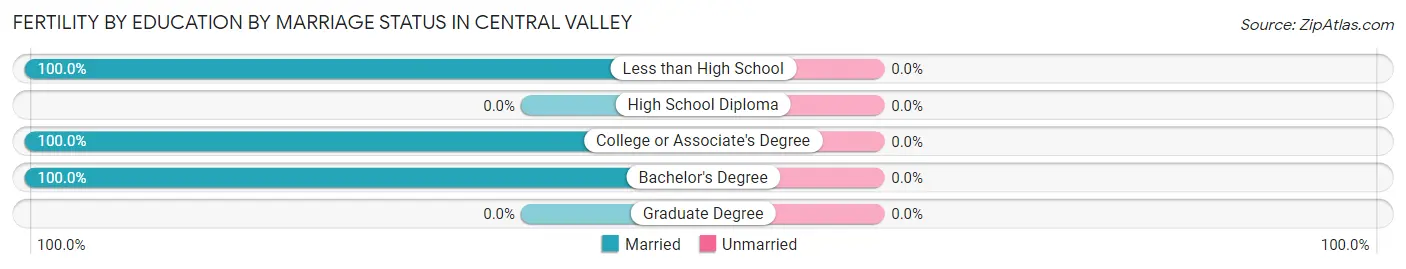
| Educational Attainment | Married | Unmarried |
| Less than High School | 2 (100.0%) | 0 (0.0%) |
| High School Diploma | 0 (0.0%) | 0 (0.0%) |
| College or Associate's Degree | 4 (100.0%) | 0 (0.0%) |
| Bachelor's Degree | 1 (100.0%) | 0 (0.0%) |
| Graduate Degree | 0 (0.0%) | 0 (0.0%) |
| Total | 7 (100.0%) | 0 (0.0%) |
Employment Characteristics in Central Valley
Employment by Class of Employer in Central Valley
Among the 359 employed individuals in Central Valley, private company employees (260 | 72.4%), local government employees (37 | 10.3%), and state government employees (25 | 7.0%) make up the most common classes of employment.
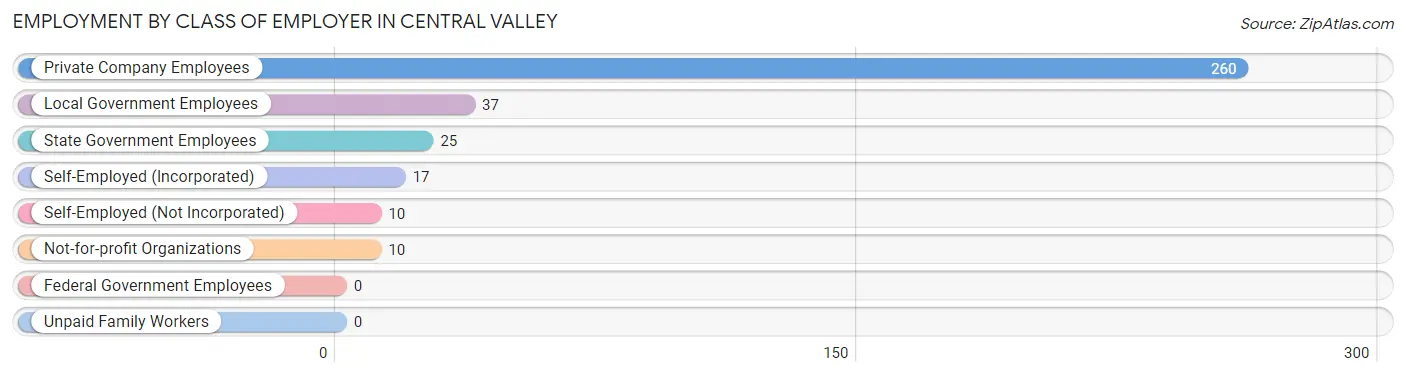
| Employer Class | # Employees | % Employees |
| Private Company Employees | 260 | 72.4% |
| Self-Employed (Incorporated) | 17 | 4.7% |
| Self-Employed (Not Incorporated) | 10 | 2.8% |
| Not-for-profit Organizations | 10 | 2.8% |
| Local Government Employees | 37 | 10.3% |
| State Government Employees | 25 | 7.0% |
| Federal Government Employees | 0 | 0.0% |
| Unpaid Family Workers | 0 | 0.0% |
| Total | 359 | 100.0% |
Employment Status by Age in Central Valley
According to the labor force statistics for Central Valley, out of the total population over 16 years of age (503), 73.4% or 369 individuals are in the labor force, with 2.7% or 10 of them unemployed. The age group with the highest labor force participation rate is 45 to 54 years, with 100.0% or 87 individuals in the labor force. Within the labor force, the 16 to 19 years age range has the highest percentage of unemployed individuals, with 36.4% or 8 of them being unemployed.
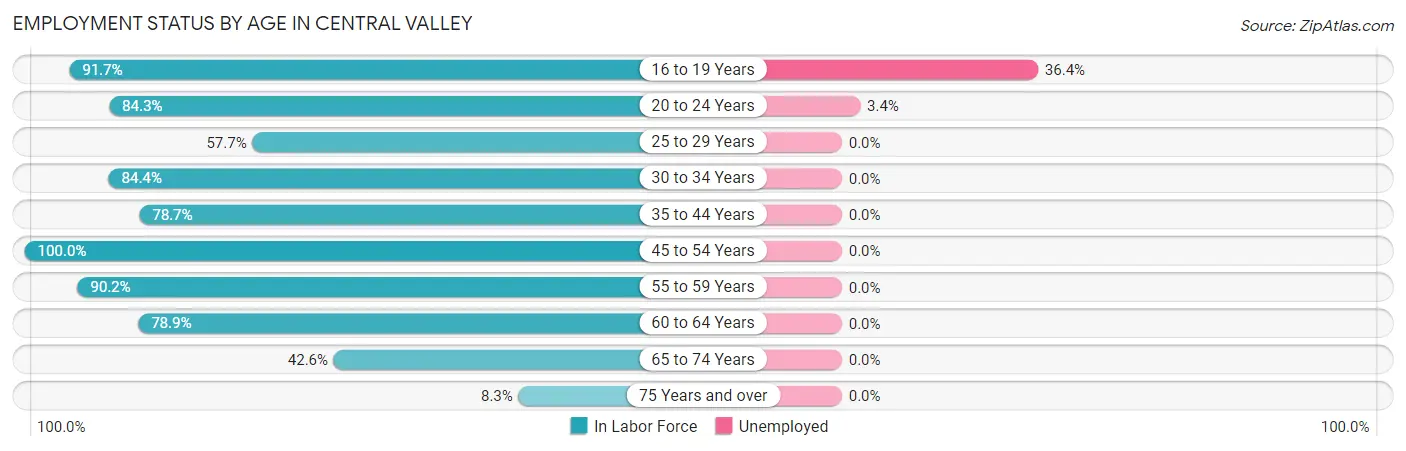
| Age Bracket | In Labor Force | Unemployed |
| 16 to 19 Years | 22 (91.7%) | 8 (36.4%) |
| 20 to 24 Years | 59 (84.3%) | 2 (3.4%) |
| 25 to 29 Years | 15 (57.7%) | 0 (0.0%) |
| 30 to 34 Years | 27 (84.4%) | 0 (0.0%) |
| 35 to 44 Years | 59 (78.7%) | 0 (0.0%) |
| 45 to 54 Years | 87 (100.0%) | 0 (0.0%) |
| 55 to 59 Years | 55 (90.2%) | 0 (0.0%) |
| 60 to 64 Years | 15 (78.9%) | 0 (0.0%) |
| 65 to 74 Years | 26 (42.6%) | 0 (0.0%) |
| 75 Years and over | 4 (8.3%) | 0 (0.0%) |
| Total | 369 (73.4%) | 10 (2.7%) |
Employment Status by Educational Attainment in Central Valley
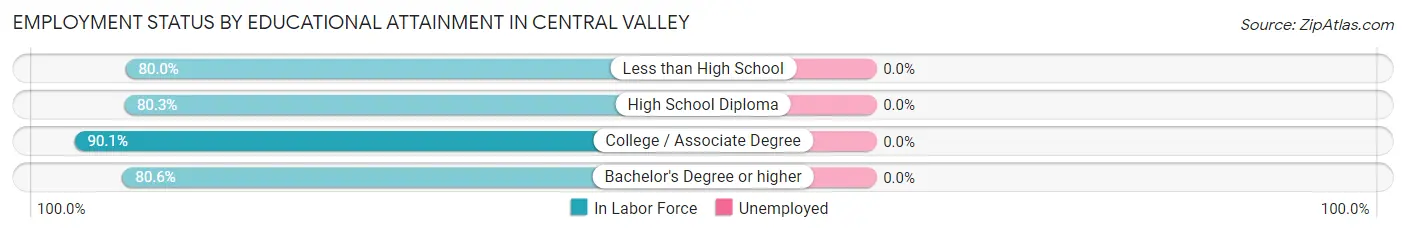
| Educational Attainment | In Labor Force | Unemployed |
| Less than High School | 4 (80.0%) | 0 (0.0%) |
| High School Diploma | 49 (80.3%) | 0 (0.0%) |
| College / Associate Degree | 155 (90.1%) | 0 (0.0%) |
| Bachelor's Degree or higher | 50 (80.6%) | 0 (0.0%) |
| Total | 258 (86.0%) | 0 (0.0%) |
Employment Occupations by Sex in Central Valley
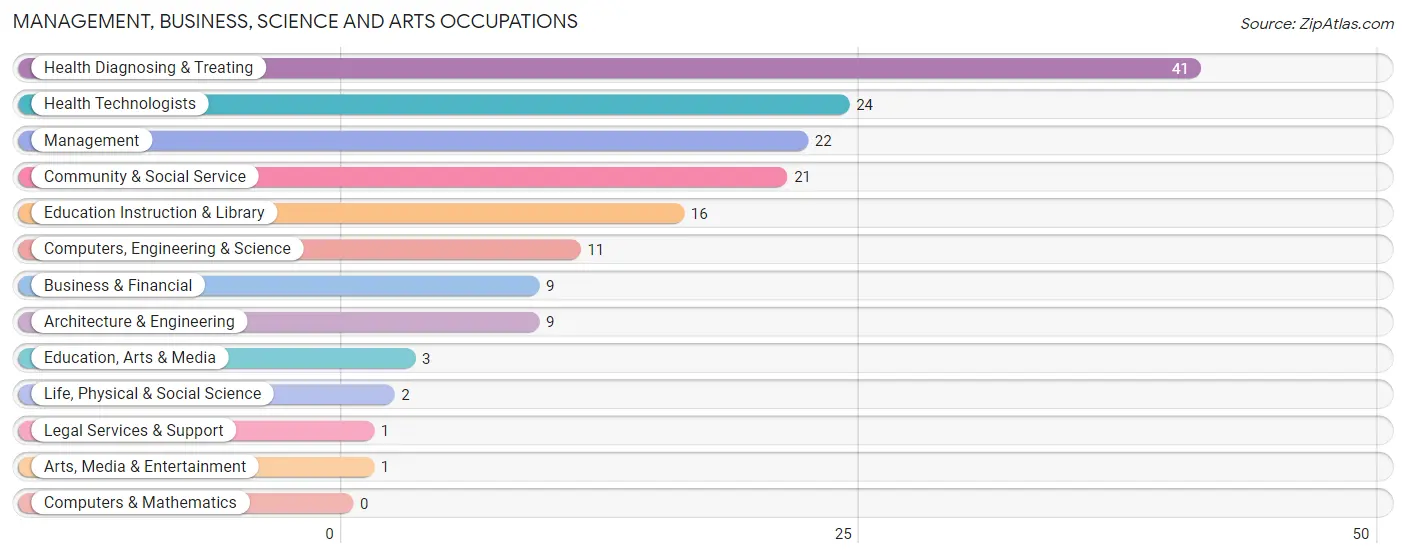
Management, Business, Science and Arts Occupations
The most common Management, Business, Science and Arts occupations in Central Valley are Health Diagnosing & Treating (41 | 11.4%), Health Technologists (24 | 6.7%), Management (22 | 6.1%), Community & Social Service (21 | 5.9%), and Education Instruction & Library (16 | 4.5%).
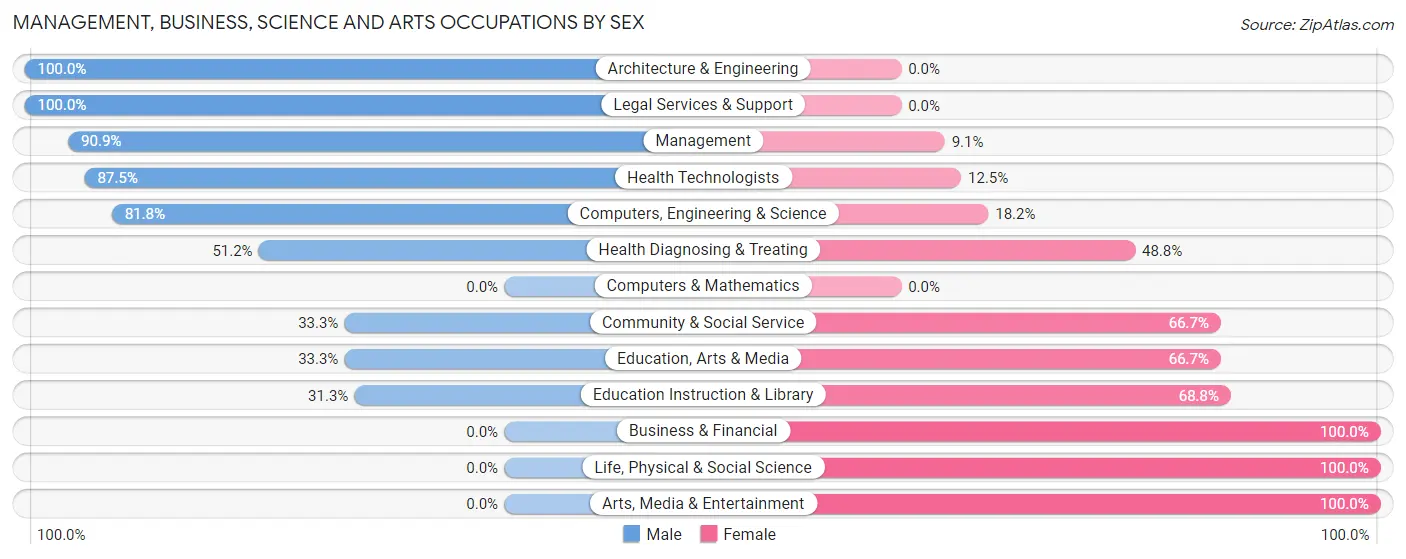
Management, Business, Science and Arts Occupations by Sex
Within the Management, Business, Science and Arts occupations in Central Valley, the most male-oriented occupations are Architecture & Engineering (100.0%), Legal Services & Support (100.0%), and Management (90.9%), while the most female-oriented occupations are Business & Financial (100.0%), Life, Physical & Social Science (100.0%), and Arts, Media & Entertainment (100.0%).
| Occupation | Male | Female |
| Management | 20 (90.9%) | 2 (9.1%) |
| Business & Financial | 0 (0.0%) | 9 (100.0%) |
| Computers, Engineering & Science | 9 (81.8%) | 2 (18.2%) |
| Computers & Mathematics | 0 (0.0%) | 0 (0.0%) |
| Architecture & Engineering | 9 (100.0%) | 0 (0.0%) |
| Life, Physical & Social Science | 0 (0.0%) | 2 (100.0%) |
| Community & Social Service | 7 (33.3%) | 14 (66.7%) |
| Education, Arts & Media | 1 (33.3%) | 2 (66.7%) |
| Legal Services & Support | 1 (100.0%) | 0 (0.0%) |
| Education Instruction & Library | 5 (31.2%) | 11 (68.8%) |
| Arts, Media & Entertainment | 0 (0.0%) | 1 (100.0%) |
| Health Diagnosing & Treating | 21 (51.2%) | 20 (48.8%) |
| Health Technologists | 21 (87.5%) | 3 (12.5%) |
| Total (Category) | 57 (54.8%) | 47 (45.2%) |
| Total (Overall) | 196 (54.6%) | 163 (45.4%) |
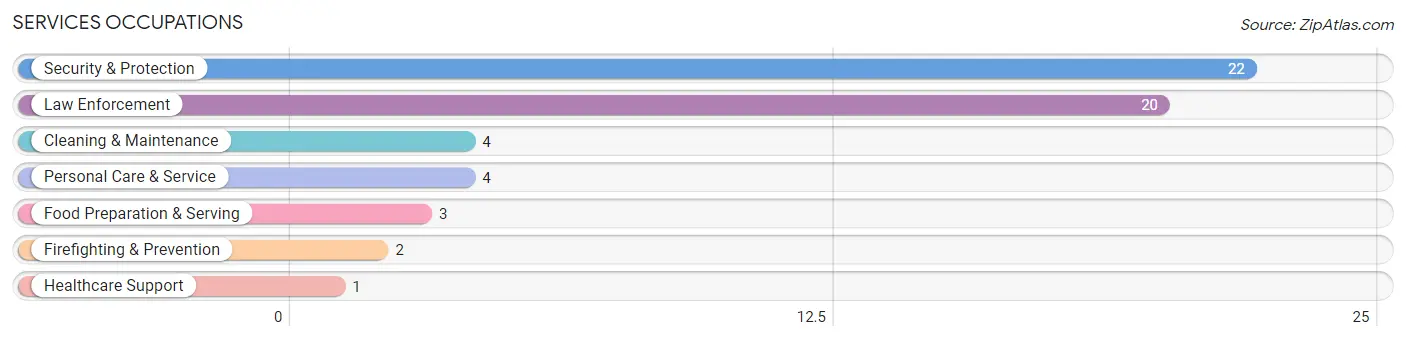
Services Occupations
The most common Services occupations in Central Valley are Security & Protection (22 | 6.1%), Law Enforcement (20 | 5.6%), Cleaning & Maintenance (4 | 1.1%), Personal Care & Service (4 | 1.1%), and Food Preparation & Serving (3 | 0.8%).
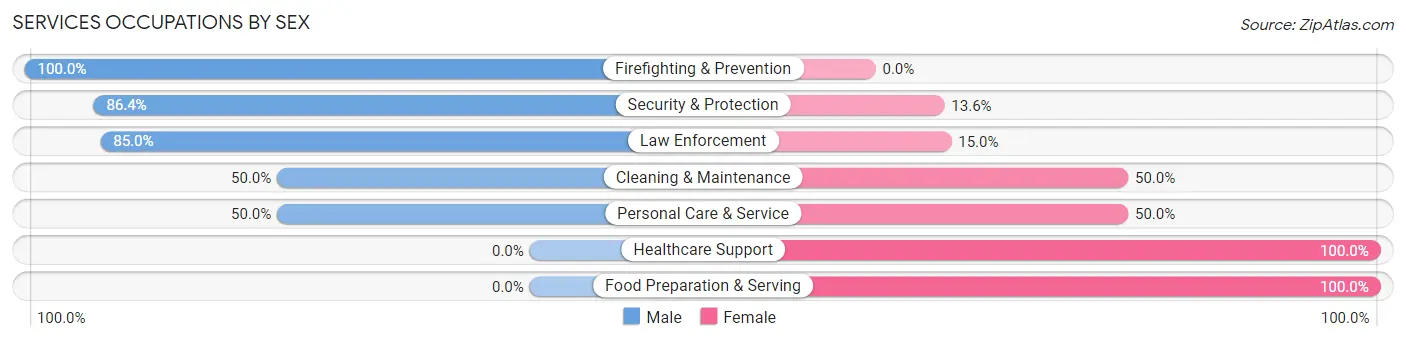
Services Occupations by Sex
Within the Services occupations in Central Valley, the most male-oriented occupations are Firefighting & Prevention (100.0%), Security & Protection (86.4%), and Law Enforcement (85.0%), while the most female-oriented occupations are Healthcare Support (100.0%), Food Preparation & Serving (100.0%), and Cleaning & Maintenance (50.0%).
| Occupation | Male | Female |
| Healthcare Support | 0 (0.0%) | 1 (100.0%) |
| Security & Protection | 19 (86.4%) | 3 (13.6%) |
| Firefighting & Prevention | 2 (100.0%) | 0 (0.0%) |
| Law Enforcement | 17 (85.0%) | 3 (15.0%) |
| Food Preparation & Serving | 0 (0.0%) | 3 (100.0%) |
| Cleaning & Maintenance | 2 (50.0%) | 2 (50.0%) |
| Personal Care & Service | 2 (50.0%) | 2 (50.0%) |
| Total (Category) | 23 (67.6%) | 11 (32.4%) |
| Total (Overall) | 196 (54.6%) | 163 (45.4%) |
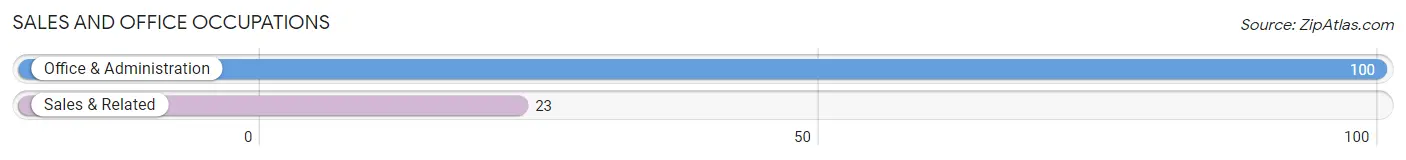
Sales and Office Occupations
The most common Sales and Office occupations in Central Valley are Office & Administration (100 | 27.9%), and Sales & Related (23 | 6.4%).
Sales and Office Occupations by Sex
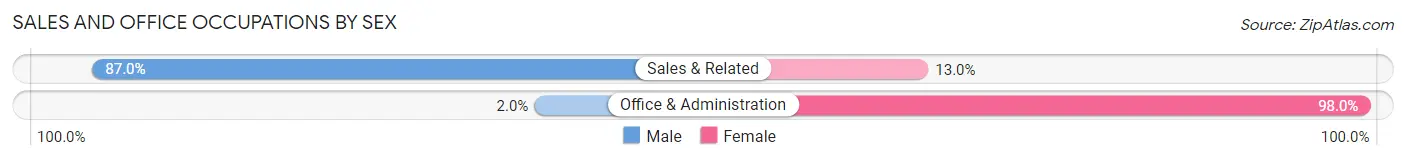
| Occupation | Male | Female |
| Sales & Related | 20 (87.0%) | 3 (13.0%) |
| Office & Administration | 2 (2.0%) | 98 (98.0%) |
| Total (Category) | 22 (17.9%) | 101 (82.1%) |
| Total (Overall) | 196 (54.6%) | 163 (45.4%) |
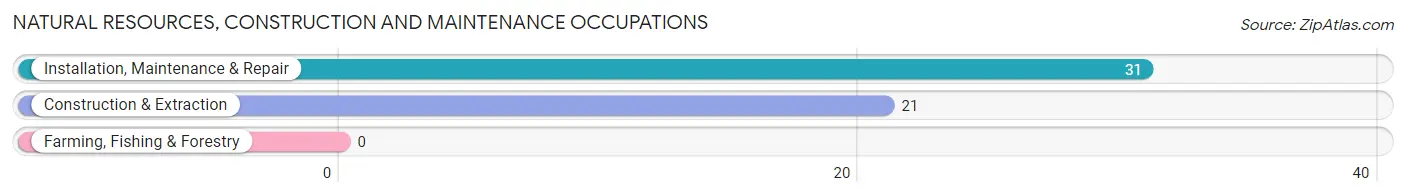
Natural Resources, Construction and Maintenance Occupations
The most common Natural Resources, Construction and Maintenance occupations in Central Valley are Installation, Maintenance & Repair (31 | 8.6%), and Construction & Extraction (21 | 5.9%).
Natural Resources, Construction and Maintenance Occupations by Sex
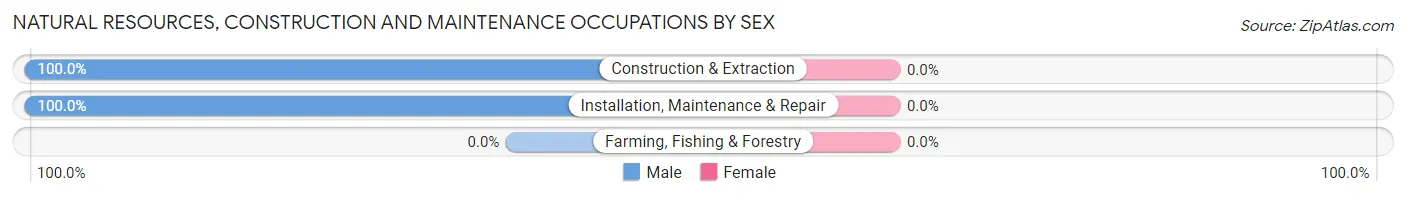
| Occupation | Male | Female |
| Farming, Fishing & Forestry | 0 (0.0%) | 0 (0.0%) |
| Construction & Extraction | 21 (100.0%) | 0 (0.0%) |
| Installation, Maintenance & Repair | 31 (100.0%) | 0 (0.0%) |
| Total (Category) | 52 (100.0%) | 0 (0.0%) |
| Total (Overall) | 196 (54.6%) | 163 (45.4%) |
Production, Transportation and Moving Occupations
The most common Production, Transportation and Moving occupations in Central Valley are Transportation (30 | 8.4%), Production (11 | 3.1%), and Material Moving (5 | 1.4%).
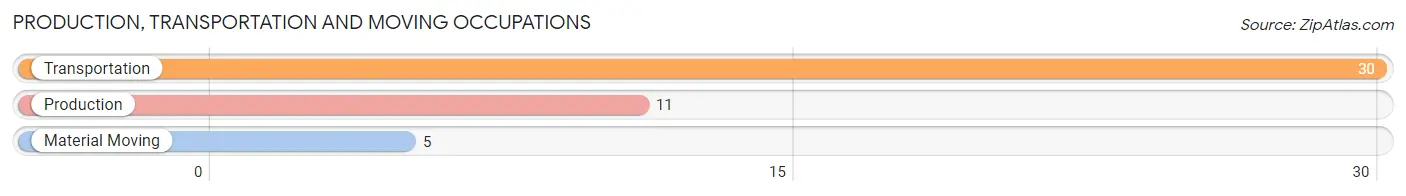
Production, Transportation and Moving Occupations by Sex
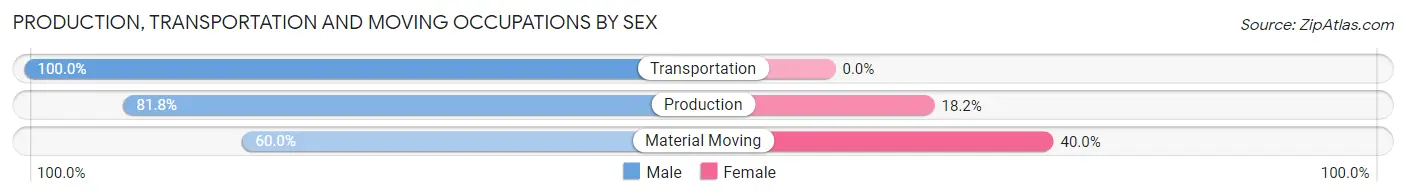
| Occupation | Male | Female |
| Production | 9 (81.8%) | 2 (18.2%) |
| Transportation | 30 (100.0%) | 0 (0.0%) |
| Material Moving | 3 (60.0%) | 2 (40.0%) |
| Total (Category) | 42 (91.3%) | 4 (8.7%) |
| Total (Overall) | 196 (54.6%) | 163 (45.4%) |
Employment Industries by Sex in Central Valley
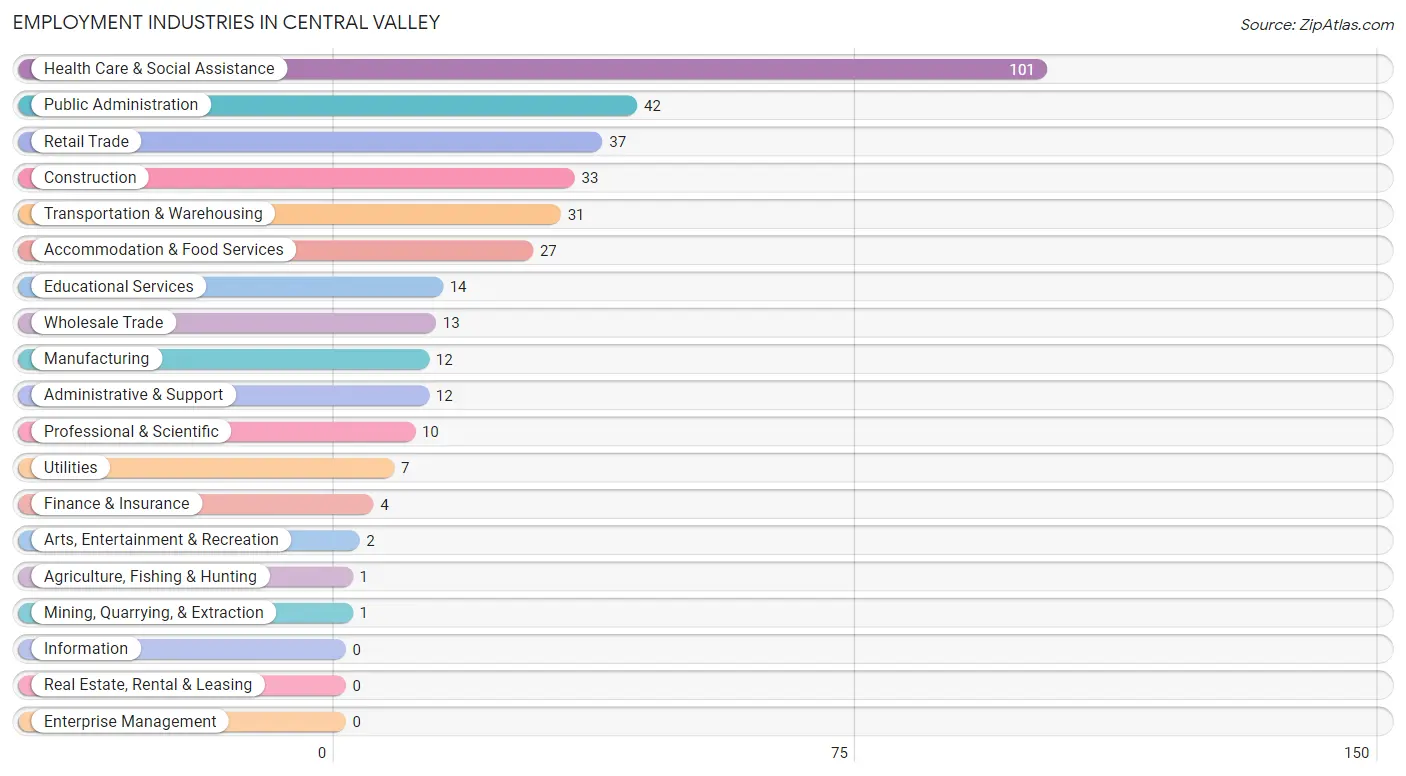
Employment Industries in Central Valley
The major employment industries in Central Valley include Health Care & Social Assistance (101 | 28.1%), Public Administration (42 | 11.7%), Retail Trade (37 | 10.3%), Construction (33 | 9.2%), and Transportation & Warehousing (31 | 8.6%).
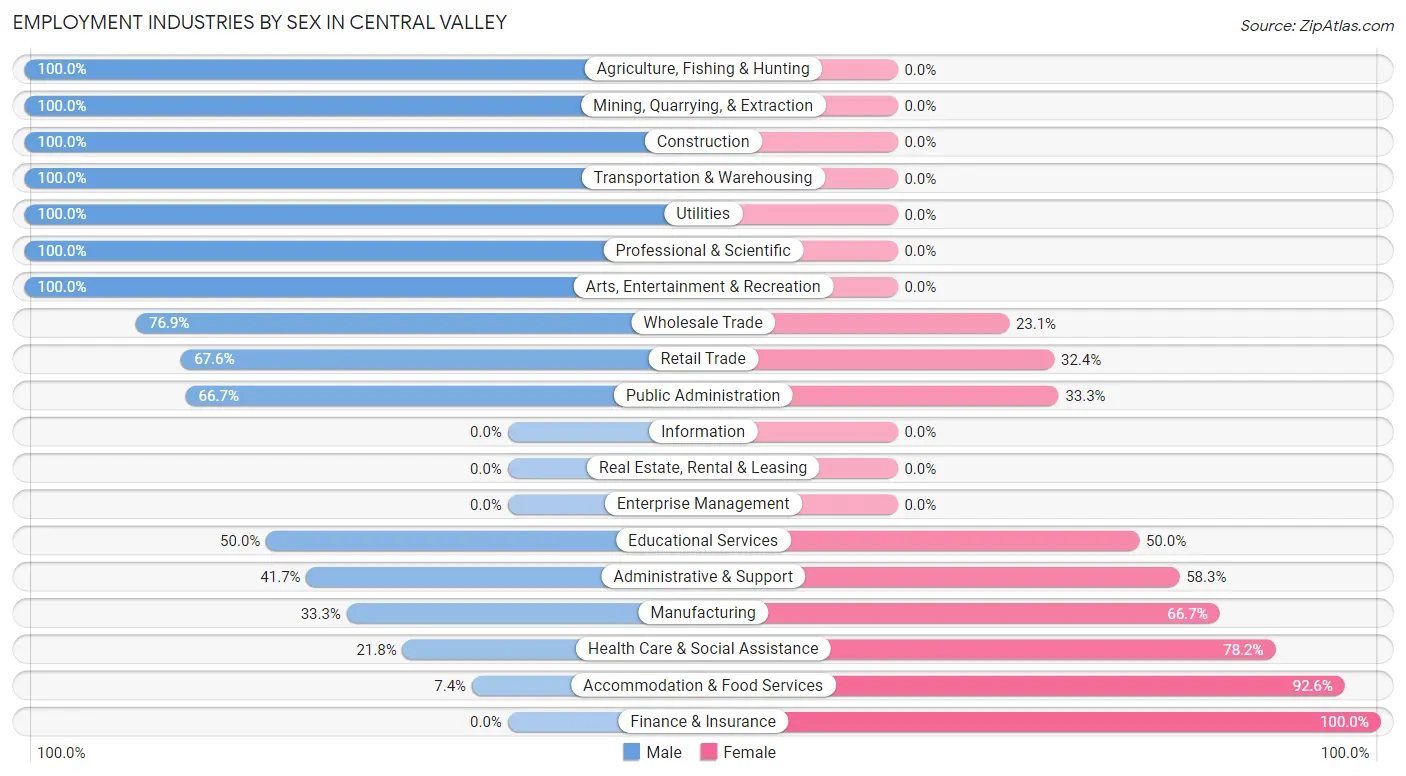
Employment Industries by Sex in Central Valley
The Central Valley industries that see more men than women are Agriculture, Fishing & Hunting (100.0%), Mining, Quarrying, & Extraction (100.0%), and Construction (100.0%), whereas the industries that tend to have a higher number of women are Finance & Insurance (100.0%), Accommodation & Food Services (92.6%), and Health Care & Social Assistance (78.2%).
| Industry | Male | Female |
| Agriculture, Fishing & Hunting | 1 (100.0%) | 0 (0.0%) |
| Mining, Quarrying, & Extraction | 1 (100.0%) | 0 (0.0%) |
| Construction | 33 (100.0%) | 0 (0.0%) |
| Manufacturing | 4 (33.3%) | 8 (66.7%) |
| Wholesale Trade | 10 (76.9%) | 3 (23.1%) |
| Retail Trade | 25 (67.6%) | 12 (32.4%) |
| Transportation & Warehousing | 31 (100.0%) | 0 (0.0%) |
| Utilities | 7 (100.0%) | 0 (0.0%) |
| Information | 0 (0.0%) | 0 (0.0%) |
| Finance & Insurance | 0 (0.0%) | 4 (100.0%) |
| Real Estate, Rental & Leasing | 0 (0.0%) | 0 (0.0%) |
| Professional & Scientific | 10 (100.0%) | 0 (0.0%) |
| Enterprise Management | 0 (0.0%) | 0 (0.0%) |
| Administrative & Support | 5 (41.7%) | 7 (58.3%) |
| Educational Services | 7 (50.0%) | 7 (50.0%) |
| Health Care & Social Assistance | 22 (21.8%) | 79 (78.2%) |
| Arts, Entertainment & Recreation | 2 (100.0%) | 0 (0.0%) |
| Accommodation & Food Services | 2 (7.4%) | 25 (92.6%) |
| Public Administration | 28 (66.7%) | 14 (33.3%) |
| Total | 196 (54.6%) | 163 (45.4%) |
Education in Central Valley
School Enrollment in Central Valley
The most common levels of schooling among the 278 students in Central Valley are college / undergraduate (94 | 33.8%), high school (84 | 30.2%), and elementary school (45 | 16.2%).
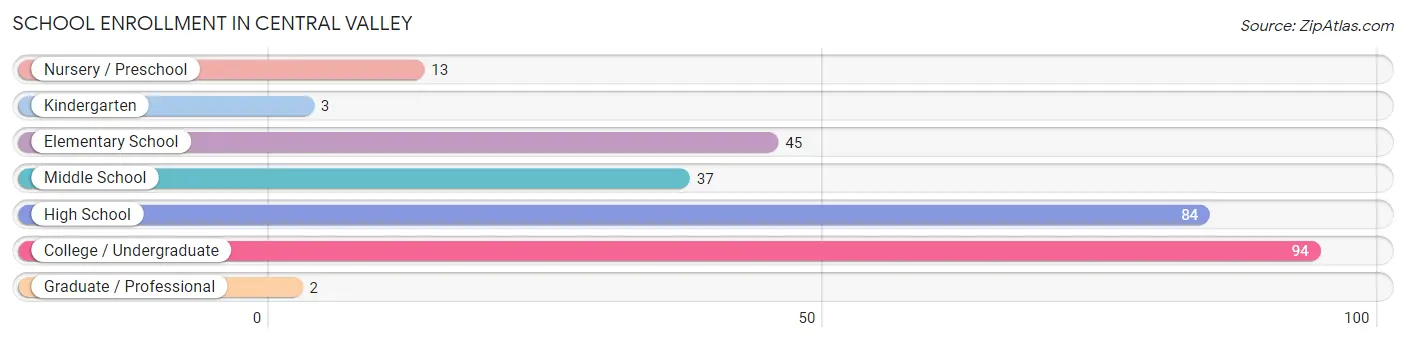
| School Level | # Students | % Students |
| Nursery / Preschool | 13 | 4.7% |
| Kindergarten | 3 | 1.1% |
| Elementary School | 45 | 16.2% |
| Middle School | 37 | 13.3% |
| High School | 84 | 30.2% |
| College / Undergraduate | 94 | 33.8% |
| Graduate / Professional | 2 | 0.7% |
| Total | 278 | 100.0% |
School Enrollment by Age by Funding Source in Central Valley
Out of a total of 278 students who are enrolled in schools in Central Valley, 54 (19.4%) attend a private institution, while the remaining 224 (80.6%) are enrolled in public schools. The age group of 35 years and over has the highest likelihood of being enrolled in private schools, with 51 (91.1% in the age bracket) enrolled. Conversely, the age group of 10 to 14 year olds has the lowest likelihood of being enrolled in a private school, with 60 (100.0% in the age bracket) attending a public institution.
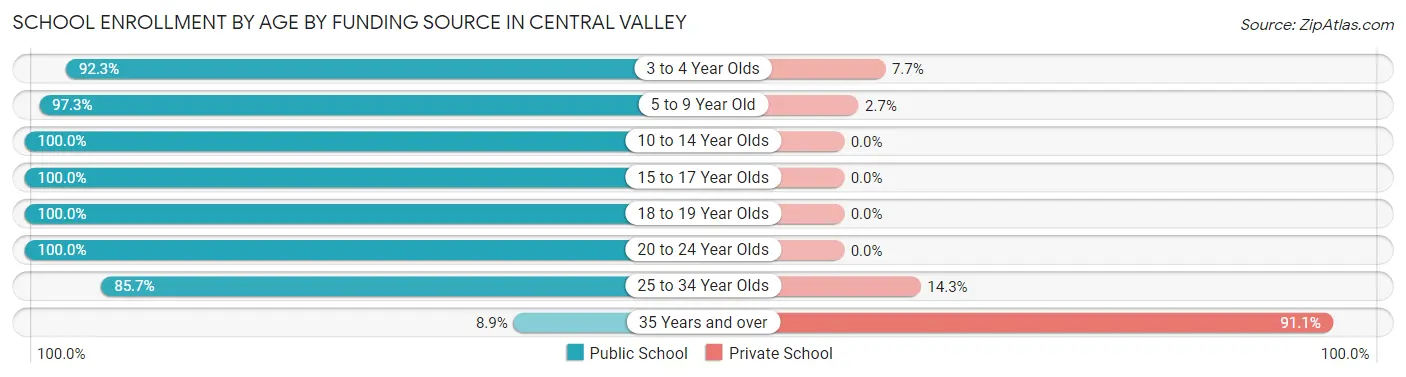
| Age Bracket | Public School | Private School |
| 3 to 4 Year Olds | 12 (92.3%) | 1 (7.7%) |
| 5 to 9 Year Old | 36 (97.3%) | 1 (2.7%) |
| 10 to 14 Year Olds | 60 (100.0%) | 0 (0.0%) |
| 15 to 17 Year Olds | 70 (100.0%) | 0 (0.0%) |
| 18 to 19 Year Olds | 4 (100.0%) | 0 (0.0%) |
| 20 to 24 Year Olds | 31 (100.0%) | 0 (0.0%) |
| 25 to 34 Year Olds | 6 (85.7%) | 1 (14.3%) |
| 35 Years and over | 5 (8.9%) | 51 (91.1%) |
| Total | 224 (80.6%) | 54 (19.4%) |
Educational Attainment by Field of Study in Central Valley
Science & technology (32 | 37.2%), education (19 | 22.1%), arts & humanities (9 | 10.5%), business (8 | 9.3%), and bio, nature & agricultural (5 | 5.8%) are the most common fields of study among 86 individuals in Central Valley who have obtained a bachelor's degree or higher.
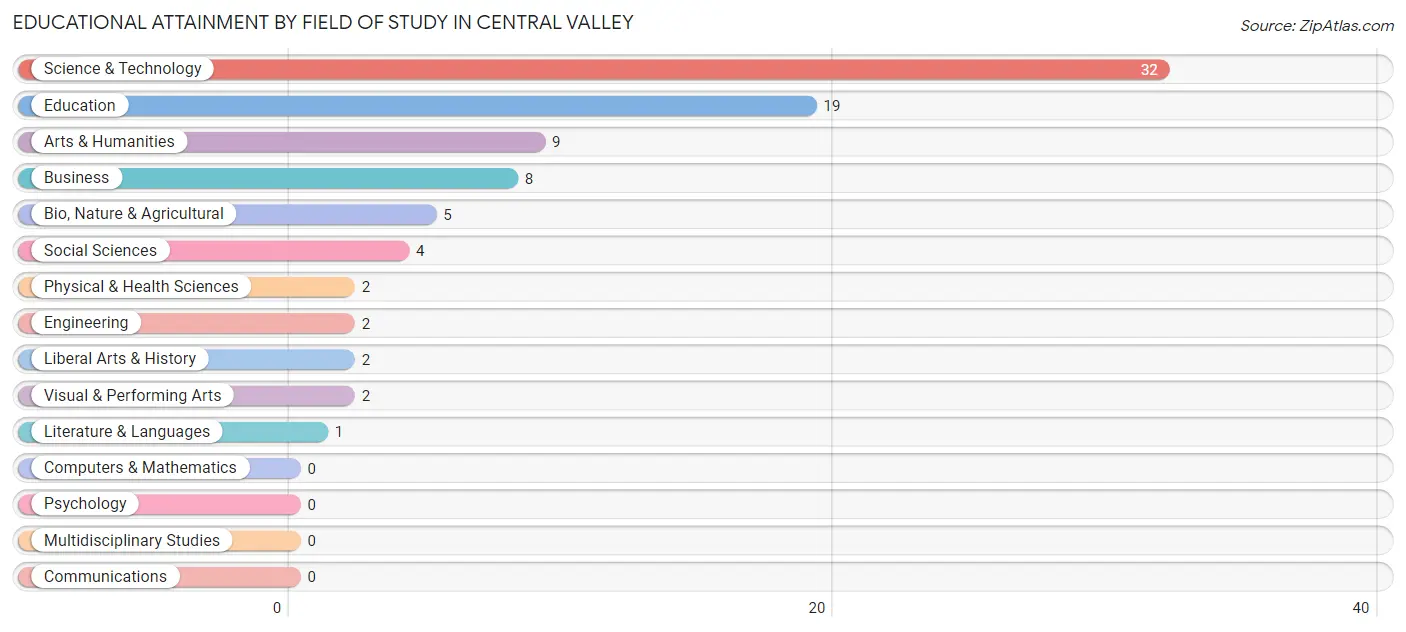
| Field of Study | # Graduates | % Graduates |
| Computers & Mathematics | 0 | 0.0% |
| Bio, Nature & Agricultural | 5 | 5.8% |
| Physical & Health Sciences | 2 | 2.3% |
| Psychology | 0 | 0.0% |
| Social Sciences | 4 | 4.6% |
| Engineering | 2 | 2.3% |
| Multidisciplinary Studies | 0 | 0.0% |
| Science & Technology | 32 | 37.2% |
| Business | 8 | 9.3% |
| Education | 19 | 22.1% |
| Literature & Languages | 1 | 1.2% |
| Liberal Arts & History | 2 | 2.3% |
| Visual & Performing Arts | 2 | 2.3% |
| Communications | 0 | 0.0% |
| Arts & Humanities | 9 | 10.5% |
| Total | 86 | 100.0% |
Transportation & Commute in Central Valley
Vehicle Availability by Sex in Central Valley
The most prevalent vehicle ownership categories in Central Valley are males with 2 vehicles (62, accounting for 31.6%) and females with 2 vehicles (36, making up 38.0%).
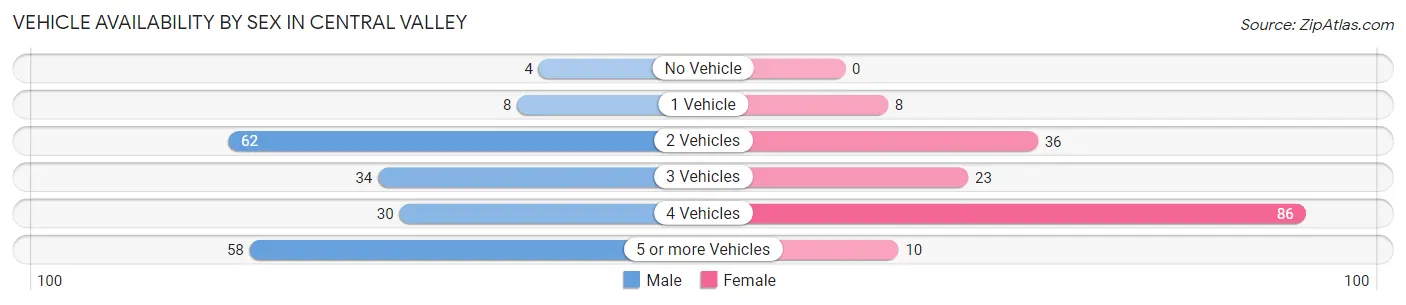
| Vehicles Available | Male | Female |
| No Vehicle | 4 (2.0%) | 0 (0.0%) |
| 1 Vehicle | 8 (4.1%) | 8 (4.9%) |
| 2 Vehicles | 62 (31.6%) | 36 (22.1%) |
| 3 Vehicles | 34 (17.3%) | 23 (14.1%) |
| 4 Vehicles | 30 (15.3%) | 86 (52.8%) |
| 5 or more Vehicles | 58 (29.6%) | 10 (6.1%) |
| Total | 196 (100.0%) | 163 (100.0%) |
Commute Time in Central Valley
The most frequently occuring commute durations in Central Valley are 10 to 14 minutes (89 commuters, 29.9%), 15 to 19 minutes (49 commuters, 16.4%), and 5 to 9 minutes (40 commuters, 13.4%).
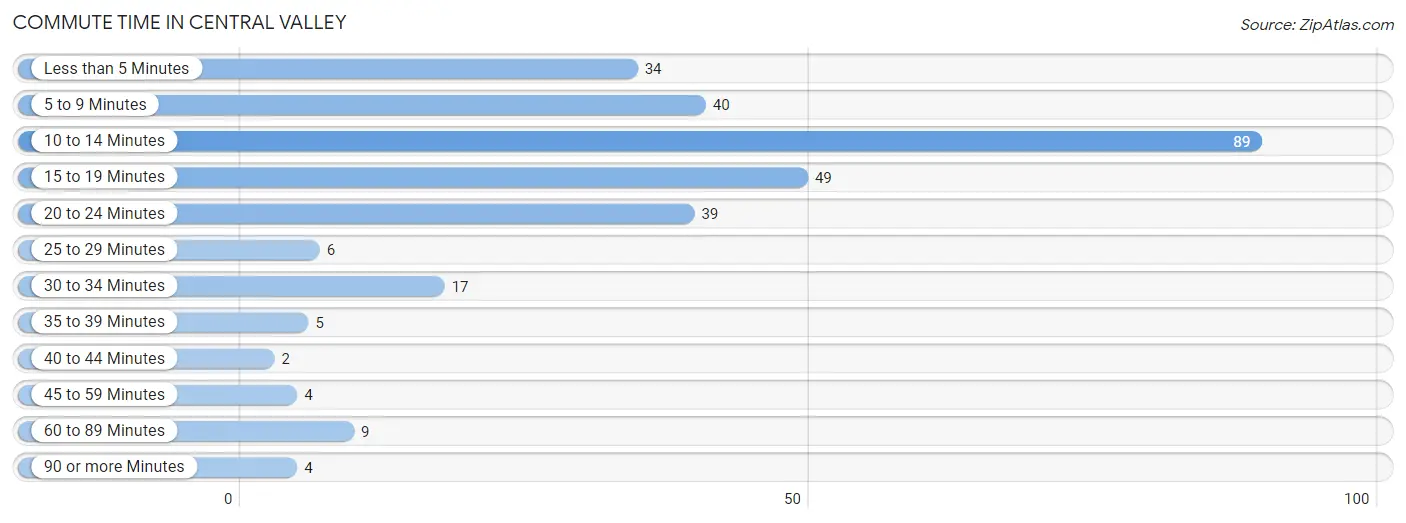
| Commute Time | # Commuters | % Commuters |
| Less than 5 Minutes | 34 | 11.4% |
| 5 to 9 Minutes | 40 | 13.4% |
| 10 to 14 Minutes | 89 | 29.9% |
| 15 to 19 Minutes | 49 | 16.4% |
| 20 to 24 Minutes | 39 | 13.1% |
| 25 to 29 Minutes | 6 | 2.0% |
| 30 to 34 Minutes | 17 | 5.7% |
| 35 to 39 Minutes | 5 | 1.7% |
| 40 to 44 Minutes | 2 | 0.7% |
| 45 to 59 Minutes | 4 | 1.3% |
| 60 to 89 Minutes | 9 | 3.0% |
| 90 or more Minutes | 4 | 1.3% |
Commute Time by Sex in Central Valley
The most common commute times in Central Valley are 15 to 19 minutes (44 commuters, 23.0%) for males and 10 to 14 minutes (53 commuters, 49.5%) for females.
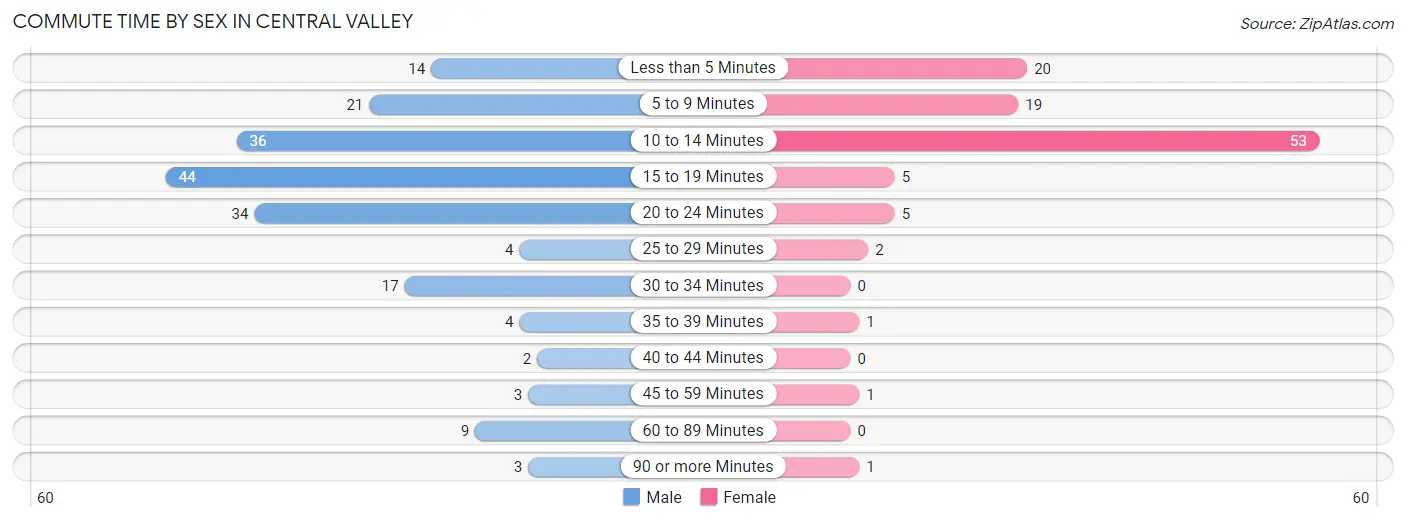
| Commute Time | Male | Female |
| Less than 5 Minutes | 14 (7.3%) | 20 (18.7%) |
| 5 to 9 Minutes | 21 (11.0%) | 19 (17.8%) |
| 10 to 14 Minutes | 36 (18.9%) | 53 (49.5%) |
| 15 to 19 Minutes | 44 (23.0%) | 5 (4.7%) |
| 20 to 24 Minutes | 34 (17.8%) | 5 (4.7%) |
| 25 to 29 Minutes | 4 (2.1%) | 2 (1.9%) |
| 30 to 34 Minutes | 17 (8.9%) | 0 (0.0%) |
| 35 to 39 Minutes | 4 (2.1%) | 1 (0.9%) |
| 40 to 44 Minutes | 2 (1.1%) | 0 (0.0%) |
| 45 to 59 Minutes | 3 (1.6%) | 1 (0.9%) |
| 60 to 89 Minutes | 9 (4.7%) | 0 (0.0%) |
| 90 or more Minutes | 3 (1.6%) | 1 (0.9%) |
Time of Departure to Work by Sex in Central Valley
The most frequent times of departure to work in Central Valley are 8:00 AM to 8:29 AM (47, 24.6%) for males and 7:30 AM to 7:59 AM (25, 23.4%) for females.
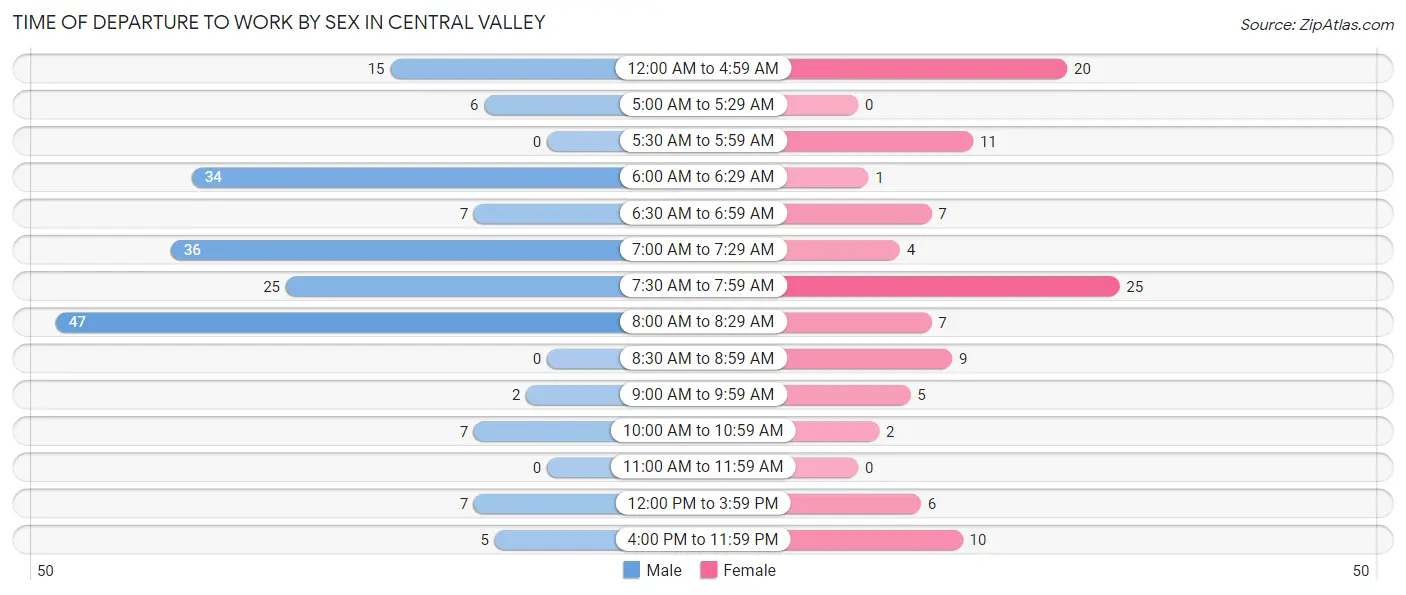
| Time of Departure | Male | Female |
| 12:00 AM to 4:59 AM | 15 (7.9%) | 20 (18.7%) |
| 5:00 AM to 5:29 AM | 6 (3.1%) | 0 (0.0%) |
| 5:30 AM to 5:59 AM | 0 (0.0%) | 11 (10.3%) |
| 6:00 AM to 6:29 AM | 34 (17.8%) | 1 (0.9%) |
| 6:30 AM to 6:59 AM | 7 (3.7%) | 7 (6.5%) |
| 7:00 AM to 7:29 AM | 36 (18.9%) | 4 (3.7%) |
| 7:30 AM to 7:59 AM | 25 (13.1%) | 25 (23.4%) |
| 8:00 AM to 8:29 AM | 47 (24.6%) | 7 (6.5%) |
| 8:30 AM to 8:59 AM | 0 (0.0%) | 9 (8.4%) |
| 9:00 AM to 9:59 AM | 2 (1.1%) | 5 (4.7%) |
| 10:00 AM to 10:59 AM | 7 (3.7%) | 2 (1.9%) |
| 11:00 AM to 11:59 AM | 0 (0.0%) | 0 (0.0%) |
| 12:00 PM to 3:59 PM | 7 (3.7%) | 6 (5.6%) |
| 4:00 PM to 11:59 PM | 5 (2.6%) | 10 (9.3%) |
| Total | 191 (100.0%) | 107 (100.0%) |
Housing Occupancy in Central Valley
Occupancy by Ownership in Central Valley
Of the total 205 dwellings in Central Valley, owner-occupied units account for 187 (91.2%), while renter-occupied units make up 18 (8.8%).
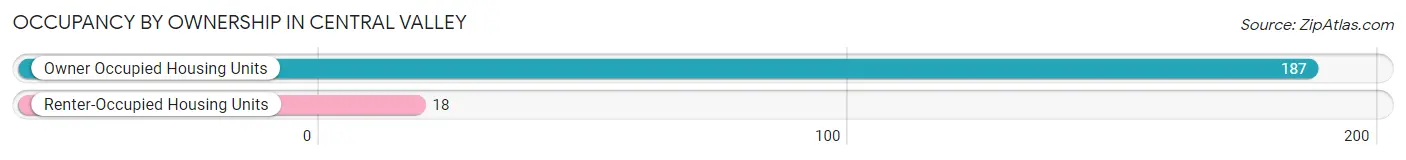
| Occupancy | # Housing Units | % Housing Units |
| Owner Occupied Housing Units | 187 | 91.2% |
| Renter-Occupied Housing Units | 18 | 8.8% |
| Total Occupied Housing Units | 205 | 100.0% |
Occupancy by Household Size in Central Valley
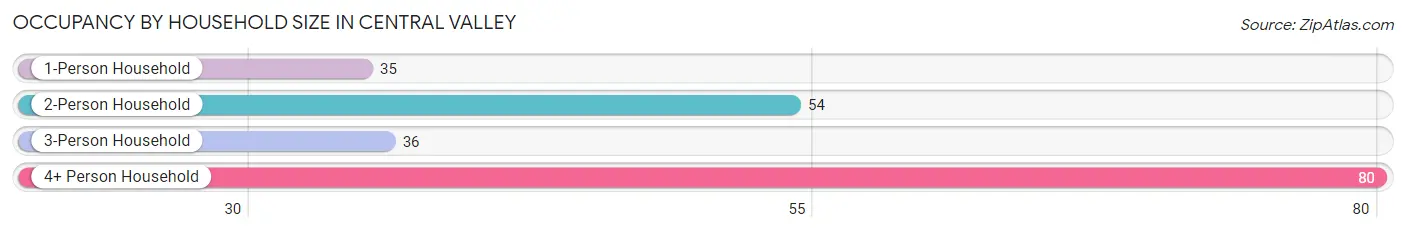
| Household Size | # Housing Units | % Housing Units |
| 1-Person Household | 35 | 17.1% |
| 2-Person Household | 54 | 26.3% |
| 3-Person Household | 36 | 17.6% |
| 4+ Person Household | 80 | 39.0% |
| Total Housing Units | 205 | 100.0% |
Occupancy by Ownership by Household Size in Central Valley
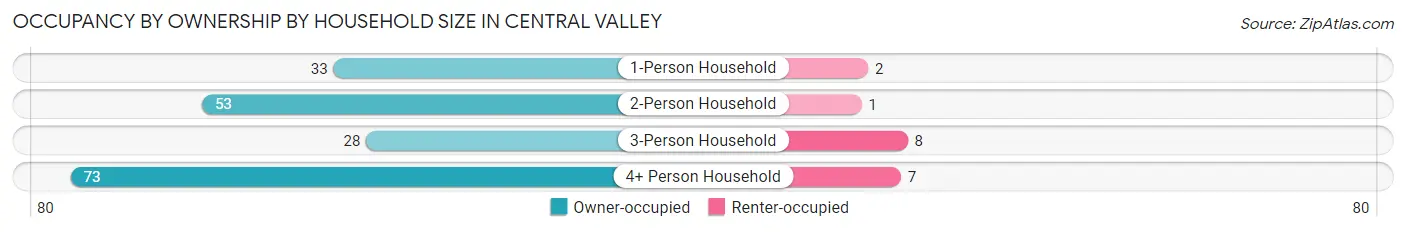
| Household Size | Owner-occupied | Renter-occupied |
| 1-Person Household | 33 (94.3%) | 2 (5.7%) |
| 2-Person Household | 53 (98.2%) | 1 (1.8%) |
| 3-Person Household | 28 (77.8%) | 8 (22.2%) |
| 4+ Person Household | 73 (91.2%) | 7 (8.7%) |
| Total Housing Units | 187 (91.2%) | 18 (8.8%) |
Occupancy by Educational Attainment in Central Valley
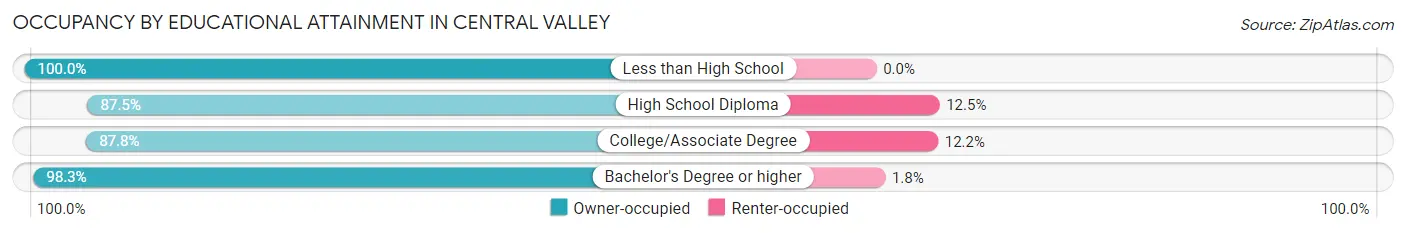
| Household Size | Owner-occupied | Renter-occupied |
| Less than High School | 10 (100.0%) | 0 (0.0%) |
| High School Diploma | 42 (87.5%) | 6 (12.5%) |
| College/Associate Degree | 79 (87.8%) | 11 (12.2%) |
| Bachelor's Degree or higher | 56 (98.3%) | 1 (1.8%) |
Occupancy by Age of Householder in Central Valley
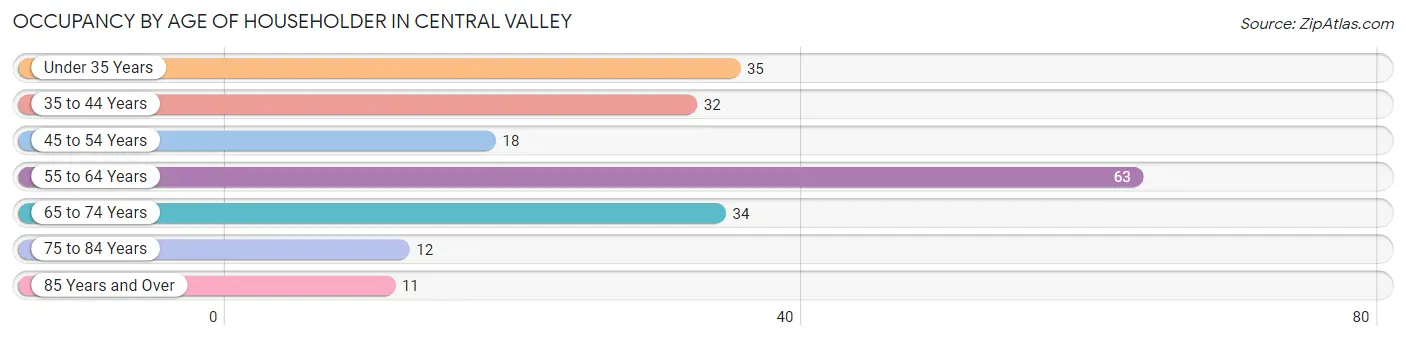
| Age Bracket | # Households | % Households |
| Under 35 Years | 35 | 17.1% |
| 35 to 44 Years | 32 | 15.6% |
| 45 to 54 Years | 18 | 8.8% |
| 55 to 64 Years | 63 | 30.7% |
| 65 to 74 Years | 34 | 16.6% |
| 75 to 84 Years | 12 | 5.9% |
| 85 Years and Over | 11 | 5.4% |
| Total | 205 | 100.0% |
Housing Finances in Central Valley
Median Income by Occupancy in Central Valley
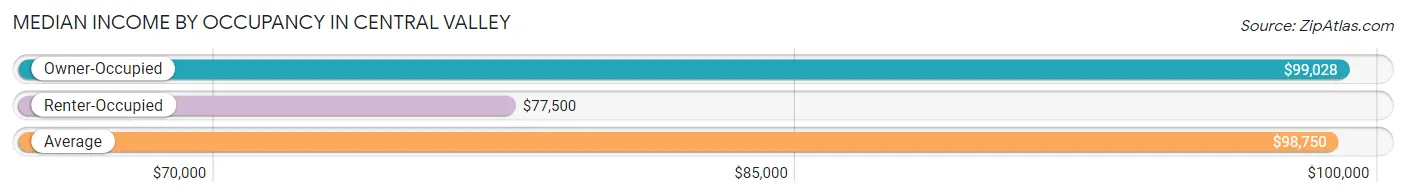
| Occupancy Type | # Households | Median Income |
| Owner-Occupied | 187 (91.2%) | $99,028 |
| Renter-Occupied | 18 (8.8%) | $77,500 |
| Average | 205 (100.0%) | $98,750 |
Occupancy by Householder Income Bracket in Central Valley
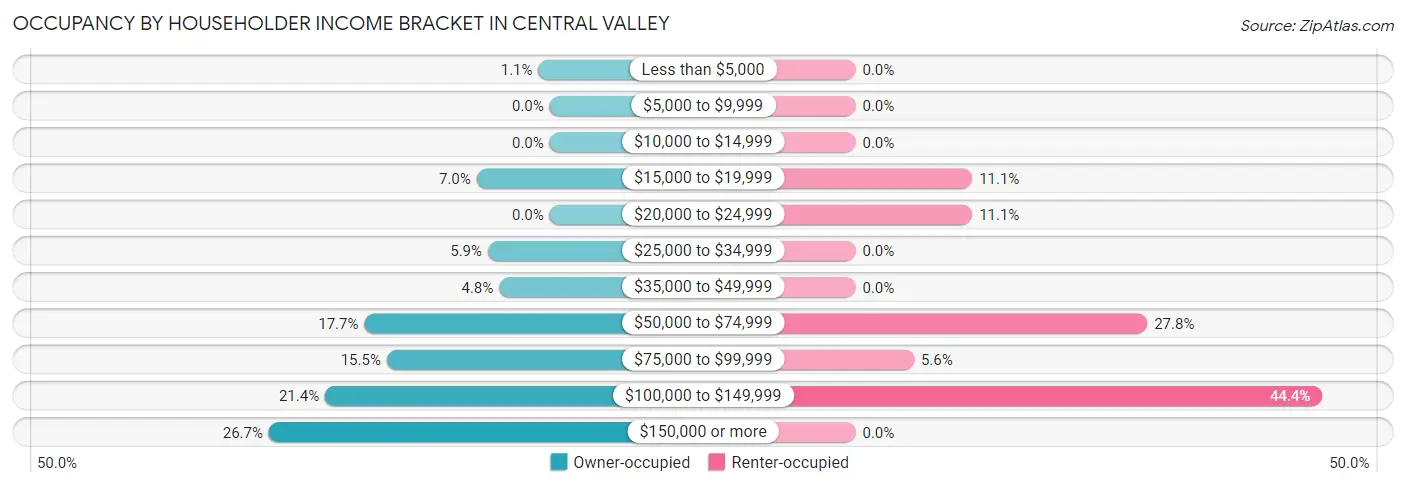
| Income Bracket | Owner-occupied | Renter-occupied |
| Less than $5,000 | 2 (1.1%) | 0 (0.0%) |
| $5,000 to $9,999 | 0 (0.0%) | 0 (0.0%) |
| $10,000 to $14,999 | 0 (0.0%) | 0 (0.0%) |
| $15,000 to $19,999 | 13 (7.0%) | 2 (11.1%) |
| $20,000 to $24,999 | 0 (0.0%) | 2 (11.1%) |
| $25,000 to $34,999 | 11 (5.9%) | 0 (0.0%) |
| $35,000 to $49,999 | 9 (4.8%) | 0 (0.0%) |
| $50,000 to $74,999 | 33 (17.6%) | 5 (27.8%) |
| $75,000 to $99,999 | 29 (15.5%) | 1 (5.6%) |
| $100,000 to $149,999 | 40 (21.4%) | 8 (44.4%) |
| $150,000 or more | 50 (26.7%) | 0 (0.0%) |
| Total | 187 (100.0%) | 18 (100.0%) |
Monthly Housing Cost Tiers in Central Valley
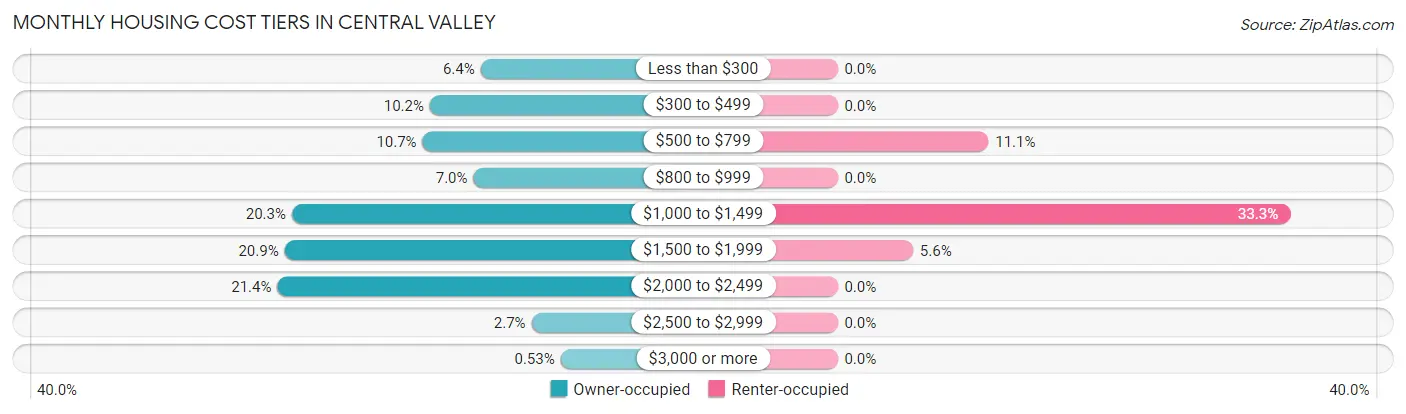
| Monthly Cost | Owner-occupied | Renter-occupied |
| Less than $300 | 12 (6.4%) | 0 (0.0%) |
| $300 to $499 | 19 (10.2%) | 0 (0.0%) |
| $500 to $799 | 20 (10.7%) | 2 (11.1%) |
| $800 to $999 | 13 (7.0%) | 0 (0.0%) |
| $1,000 to $1,499 | 38 (20.3%) | 6 (33.3%) |
| $1,500 to $1,999 | 39 (20.9%) | 1 (5.6%) |
| $2,000 to $2,499 | 40 (21.4%) | 0 (0.0%) |
| $2,500 to $2,999 | 5 (2.7%) | 0 (0.0%) |
| $3,000 or more | 1 (0.5%) | 0 (0.0%) |
| Total | 187 (100.0%) | 18 (100.0%) |
Physical Housing Characteristics in Central Valley
Housing Structures in Central Valley
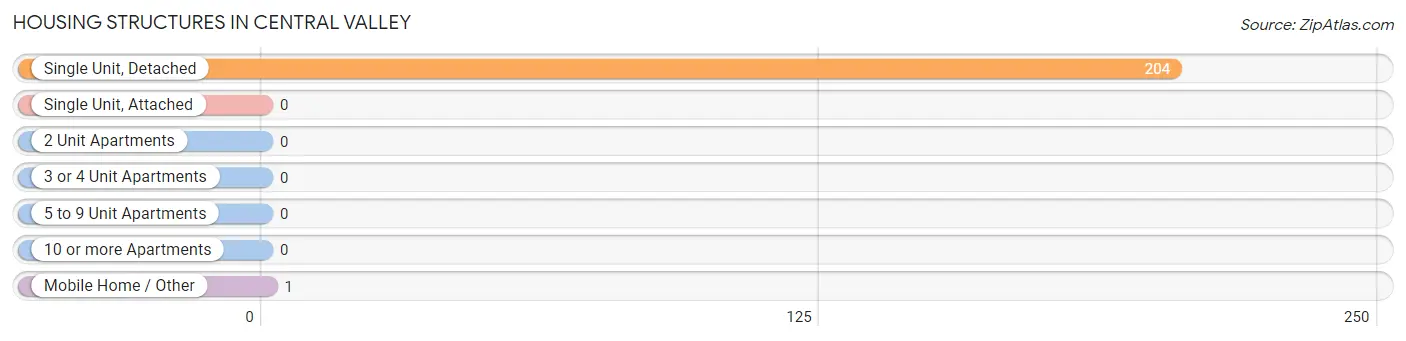
| Structure Type | # Housing Units | % Housing Units |
| Single Unit, Detached | 204 | 99.5% |
| Single Unit, Attached | 0 | 0.0% |
| 2 Unit Apartments | 0 | 0.0% |
| 3 or 4 Unit Apartments | 0 | 0.0% |
| 5 to 9 Unit Apartments | 0 | 0.0% |
| 10 or more Apartments | 0 | 0.0% |
| Mobile Home / Other | 1 | 0.5% |
| Total | 205 | 100.0% |
Housing Structures by Occupancy in Central Valley
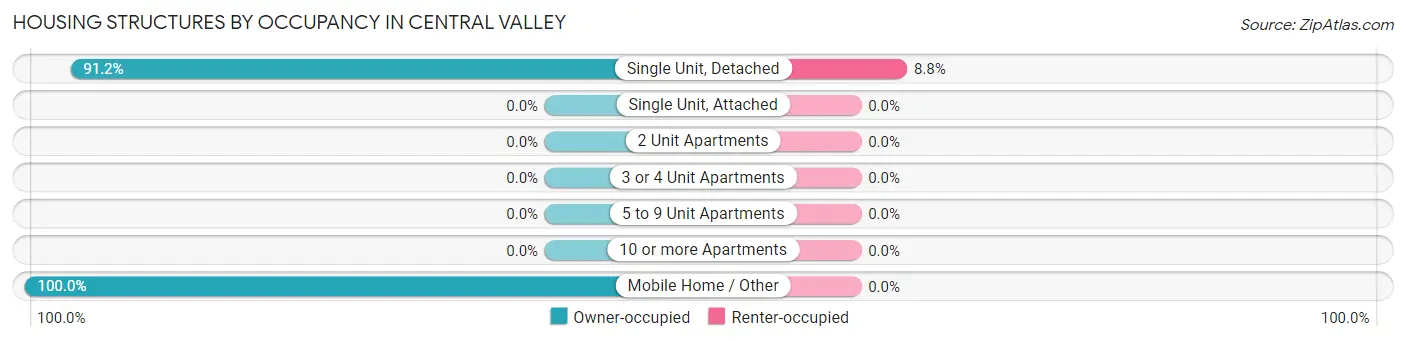
| Structure Type | Owner-occupied | Renter-occupied |
| Single Unit, Detached | 186 (91.2%) | 18 (8.8%) |
| Single Unit, Attached | 0 (0.0%) | 0 (0.0%) |
| 2 Unit Apartments | 0 (0.0%) | 0 (0.0%) |
| 3 or 4 Unit Apartments | 0 (0.0%) | 0 (0.0%) |
| 5 to 9 Unit Apartments | 0 (0.0%) | 0 (0.0%) |
| 10 or more Apartments | 0 (0.0%) | 0 (0.0%) |
| Mobile Home / Other | 1 (100.0%) | 0 (0.0%) |
| Total | 187 (91.2%) | 18 (8.8%) |
Housing Structures by Number of Rooms in Central Valley
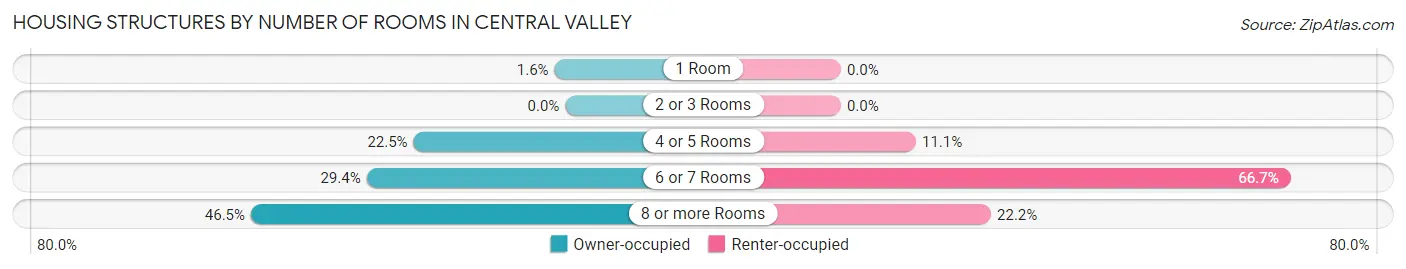
| Number of Rooms | Owner-occupied | Renter-occupied |
| 1 Room | 3 (1.6%) | 0 (0.0%) |
| 2 or 3 Rooms | 0 (0.0%) | 0 (0.0%) |
| 4 or 5 Rooms | 42 (22.5%) | 2 (11.1%) |
| 6 or 7 Rooms | 55 (29.4%) | 12 (66.7%) |
| 8 or more Rooms | 87 (46.5%) | 4 (22.2%) |
| Total | 187 (100.0%) | 18 (100.0%) |
Housing Structure by Heating Type in Central Valley
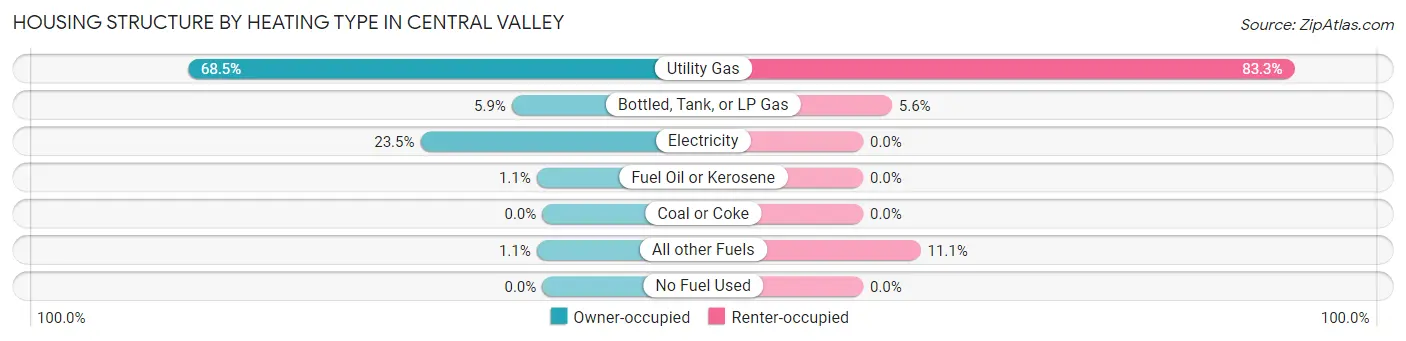
| Heating Type | Owner-occupied | Renter-occupied |
| Utility Gas | 128 (68.4%) | 15 (83.3%) |
| Bottled, Tank, or LP Gas | 11 (5.9%) | 1 (5.6%) |
| Electricity | 44 (23.5%) | 0 (0.0%) |
| Fuel Oil or Kerosene | 2 (1.1%) | 0 (0.0%) |
| Coal or Coke | 0 (0.0%) | 0 (0.0%) |
| All other Fuels | 2 (1.1%) | 2 (11.1%) |
| No Fuel Used | 0 (0.0%) | 0 (0.0%) |
| Total | 187 (100.0%) | 18 (100.0%) |
Household Vehicle Usage in Central Valley
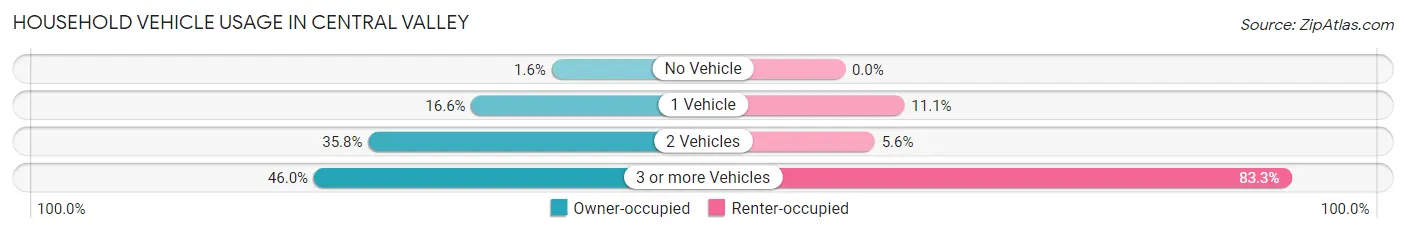
| Vehicles per Household | Owner-occupied | Renter-occupied |
| No Vehicle | 3 (1.6%) | 0 (0.0%) |
| 1 Vehicle | 31 (16.6%) | 2 (11.1%) |
| 2 Vehicles | 67 (35.8%) | 1 (5.6%) |
| 3 or more Vehicles | 86 (46.0%) | 15 (83.3%) |
| Total | 187 (100.0%) | 18 (100.0%) |
Real Estate & Mortgages in Central Valley
Real Estate and Mortgage Overview in Central Valley
| Characteristic | Without Mortgage | With Mortgage |
| Housing Units | 48 | 139 |
| Median Property Value | $272,700 | $303,800 |
| Median Household Income | $61,250 | $43 |
| Monthly Housing Costs | $380 | $1 |
| Real Estate Taxes | $1,659 | $0 |
Property Value by Mortgage Status in Central Valley
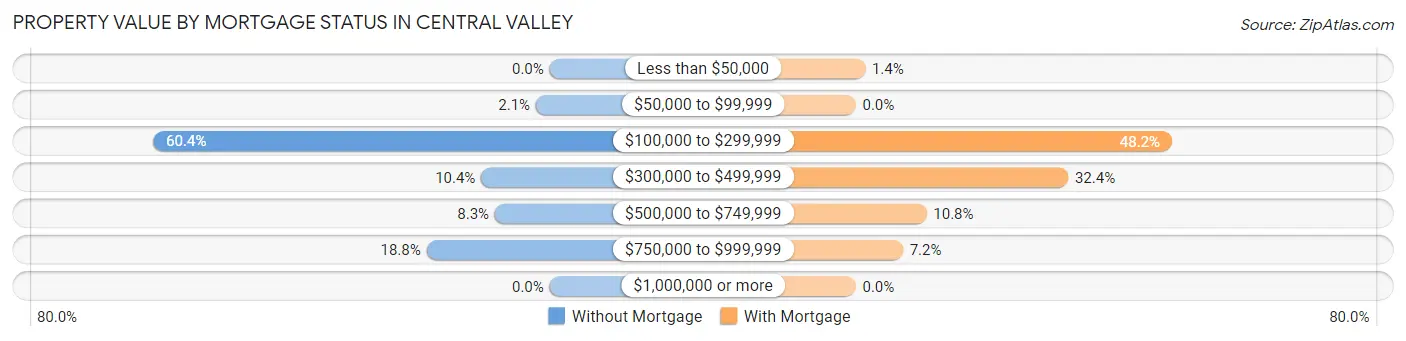
| Property Value | Without Mortgage | With Mortgage |
| Less than $50,000 | 0 (0.0%) | 2 (1.4%) |
| $50,000 to $99,999 | 1 (2.1%) | 0 (0.0%) |
| $100,000 to $299,999 | 29 (60.4%) | 67 (48.2%) |
| $300,000 to $499,999 | 5 (10.4%) | 45 (32.4%) |
| $500,000 to $749,999 | 4 (8.3%) | 15 (10.8%) |
| $750,000 to $999,999 | 9 (18.8%) | 10 (7.2%) |
| $1,000,000 or more | 0 (0.0%) | 0 (0.0%) |
| Total | 48 (100.0%) | 139 (100.0%) |
Household Income by Mortgage Status in Central Valley
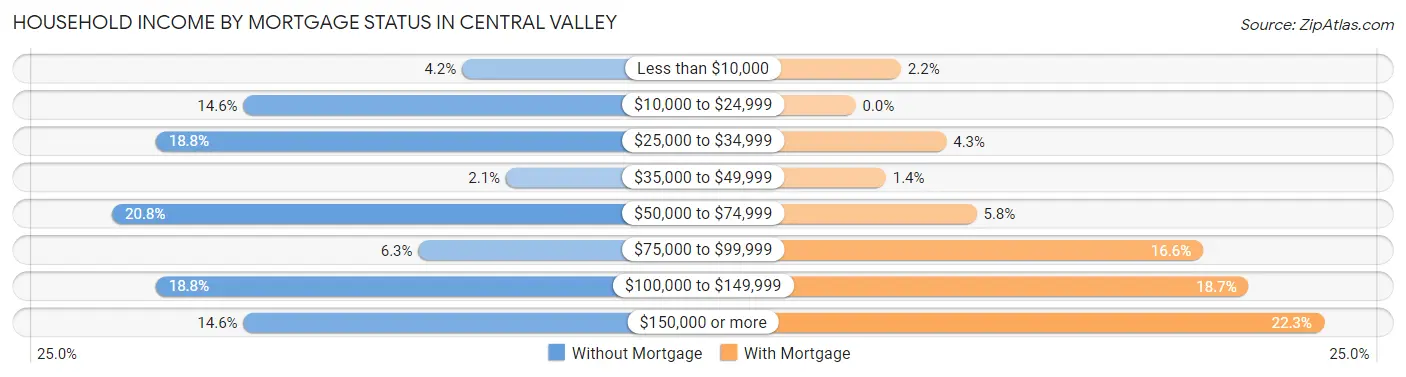
| Household Income | Without Mortgage | With Mortgage |
| Less than $10,000 | 2 (4.2%) | 3 (2.2%) |
| $10,000 to $24,999 | 7 (14.6%) | 0 (0.0%) |
| $25,000 to $34,999 | 9 (18.8%) | 6 (4.3%) |
| $35,000 to $49,999 | 1 (2.1%) | 2 (1.4%) |
| $50,000 to $74,999 | 10 (20.8%) | 8 (5.8%) |
| $75,000 to $99,999 | 3 (6.2%) | 23 (16.6%) |
| $100,000 to $149,999 | 9 (18.8%) | 26 (18.7%) |
| $150,000 or more | 7 (14.6%) | 31 (22.3%) |
| Total | 48 (100.0%) | 139 (100.0%) |
Property Value to Household Income Ratio in Central Valley
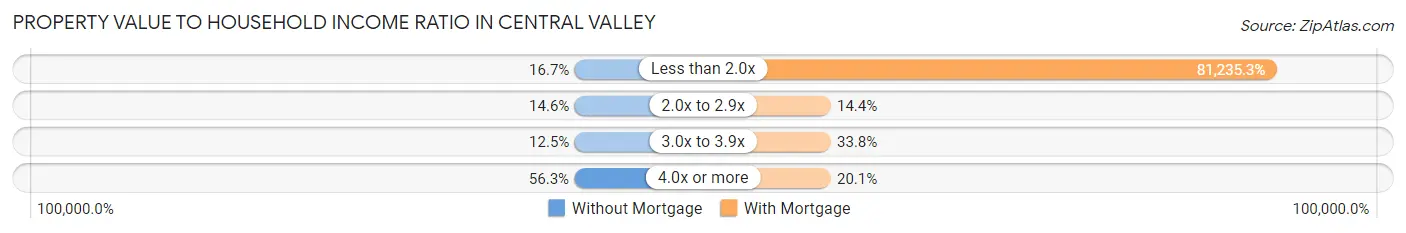
| Value-to-Income Ratio | Without Mortgage | With Mortgage |
| Less than 2.0x | 8 (16.7%) | 112,917 (81,235.2%) |
| 2.0x to 2.9x | 7 (14.6%) | 20 (14.4%) |
| 3.0x to 3.9x | 6 (12.5%) | 47 (33.8%) |
| 4.0x or more | 27 (56.2%) | 28 (20.1%) |
| Total | 48 (100.0%) | 139 (100.0%) |
Real Estate Taxes by Mortgage Status in Central Valley
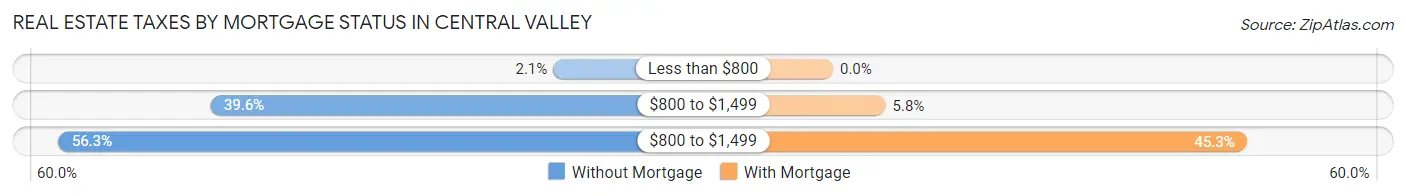
| Property Taxes | Without Mortgage | With Mortgage |
| Less than $800 | 1 (2.1%) | 0 (0.0%) |
| $800 to $1,499 | 19 (39.6%) | 8 (5.8%) |
| $800 to $1,499 | 27 (56.2%) | 63 (45.3%) |
| Total | 48 (100.0%) | 139 (100.0%) |
Health & Disability in Central Valley
Health Insurance Coverage by Age in Central Valley
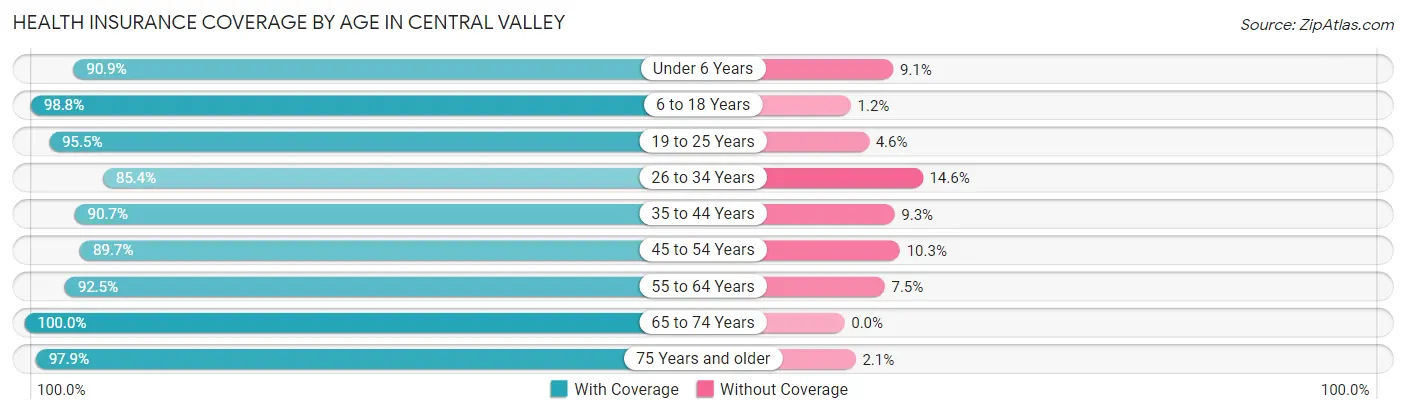
| Age Bracket | With Coverage | Without Coverage |
| Under 6 Years | 50 (90.9%) | 5 (9.1%) |
| 6 to 18 Years | 169 (98.8%) | 2 (1.2%) |
| 19 to 25 Years | 84 (95.5%) | 4 (4.5%) |
| 26 to 34 Years | 41 (85.4%) | 7 (14.6%) |
| 35 to 44 Years | 68 (90.7%) | 7 (9.3%) |
| 45 to 54 Years | 78 (89.7%) | 9 (10.3%) |
| 55 to 64 Years | 74 (92.5%) | 6 (7.5%) |
| 65 to 74 Years | 61 (100.0%) | 0 (0.0%) |
| 75 Years and older | 47 (97.9%) | 1 (2.1%) |
| Total | 672 (94.3%) | 41 (5.8%) |
Health Insurance Coverage by Citizenship Status in Central Valley
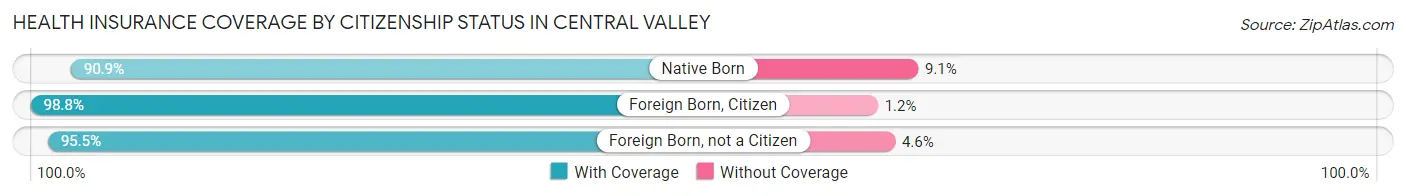
| Citizenship Status | With Coverage | Without Coverage |
| Native Born | 50 (90.9%) | 5 (9.1%) |
| Foreign Born, Citizen | 169 (98.8%) | 2 (1.2%) |
| Foreign Born, not a Citizen | 84 (95.5%) | 4 (4.5%) |
Health Insurance Coverage by Household Income in Central Valley
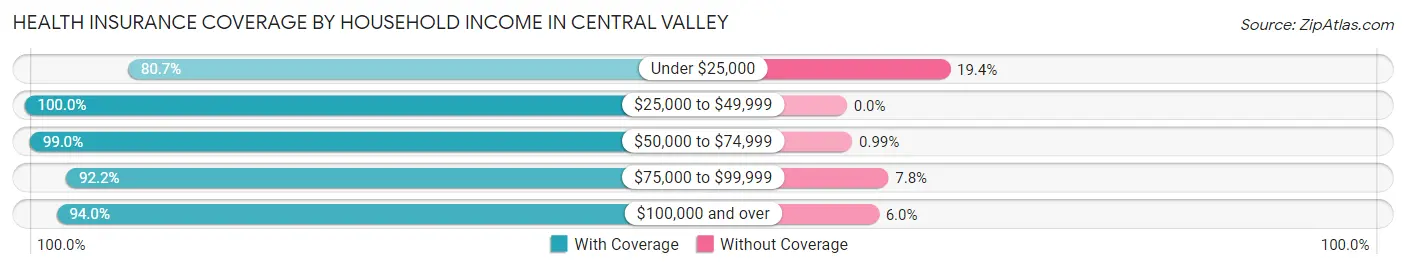
| Household Income | With Coverage | Without Coverage |
| Under $25,000 | 25 (80.6%) | 6 (19.4%) |
| $25,000 to $49,999 | 36 (100.0%) | 0 (0.0%) |
| $50,000 to $74,999 | 100 (99.0%) | 1 (1.0%) |
| $75,000 to $99,999 | 71 (92.2%) | 6 (7.8%) |
| $100,000 and over | 440 (94.0%) | 28 (6.0%) |
Public vs Private Health Insurance Coverage by Age in Central Valley
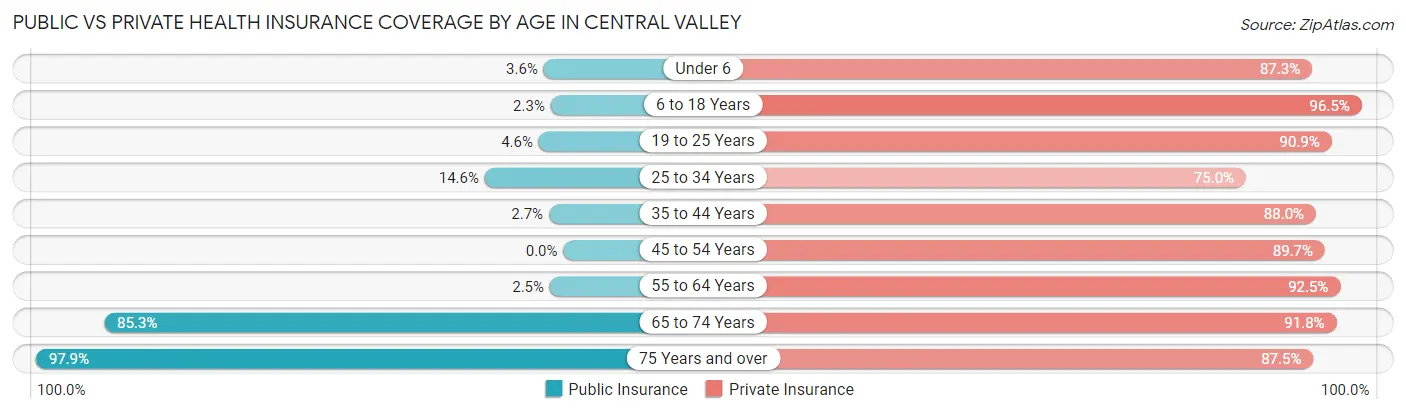
| Age Bracket | Public Insurance | Private Insurance |
| Under 6 | 2 (3.6%) | 48 (87.3%) |
| 6 to 18 Years | 4 (2.3%) | 165 (96.5%) |
| 19 to 25 Years | 4 (4.5%) | 80 (90.9%) |
| 25 to 34 Years | 7 (14.6%) | 36 (75.0%) |
| 35 to 44 Years | 2 (2.7%) | 66 (88.0%) |
| 45 to 54 Years | 0 (0.0%) | 78 (89.7%) |
| 55 to 64 Years | 2 (2.5%) | 74 (92.5%) |
| 65 to 74 Years | 52 (85.3%) | 56 (91.8%) |
| 75 Years and over | 47 (97.9%) | 42 (87.5%) |
| Total | 120 (16.8%) | 645 (90.5%) |
Disability Status by Sex by Age in Central Valley
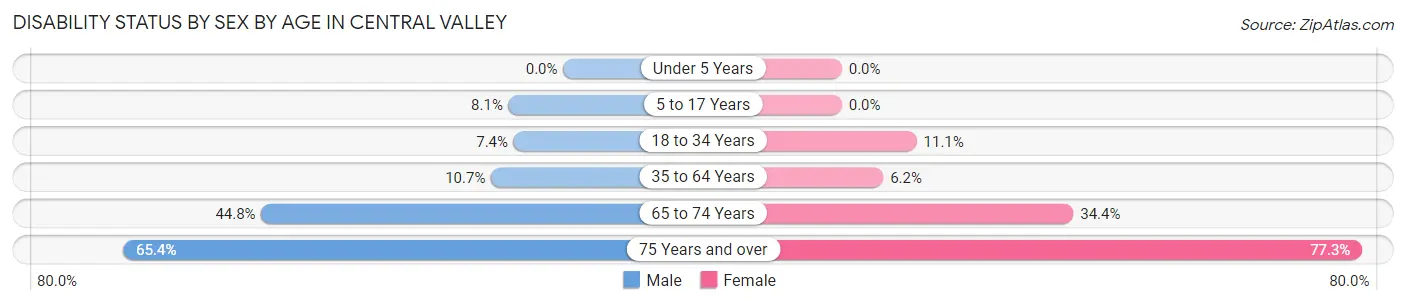
| Age Bracket | Male | Female |
| Under 5 Years | 0 (0.0%) | 0 (0.0%) |
| 5 to 17 Years | 6 (8.1%) | 0 (0.0%) |
| 18 to 34 Years | 5 (7.3%) | 8 (11.1%) |
| 35 to 64 Years | 12 (10.7%) | 8 (6.1%) |
| 65 to 74 Years | 13 (44.8%) | 11 (34.4%) |
| 75 Years and over | 17 (65.4%) | 17 (77.3%) |
Disability Class by Sex by Age in Central Valley
Disability Class: Hearing Difficulty
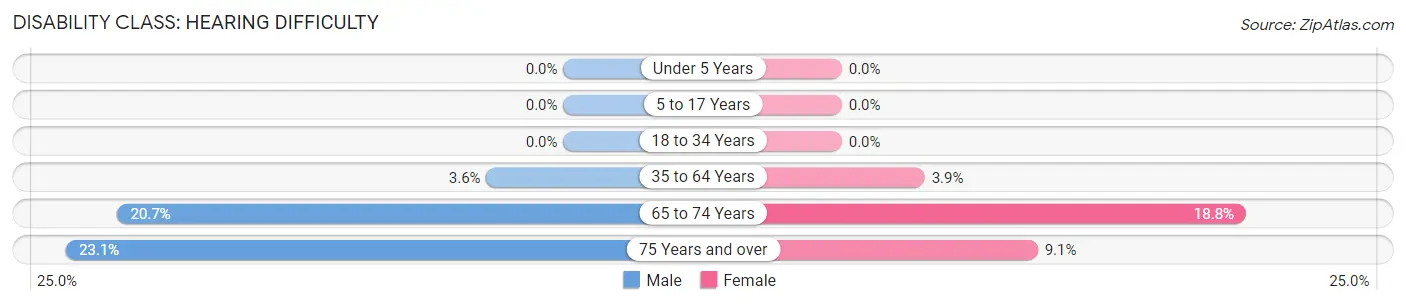
| Age Bracket | Male | Female |
| Under 5 Years | 0 (0.0%) | 0 (0.0%) |
| 5 to 17 Years | 0 (0.0%) | 0 (0.0%) |
| 18 to 34 Years | 0 (0.0%) | 0 (0.0%) |
| 35 to 64 Years | 4 (3.6%) | 5 (3.8%) |
| 65 to 74 Years | 6 (20.7%) | 6 (18.8%) |
| 75 Years and over | 6 (23.1%) | 2 (9.1%) |
Disability Class: Vision Difficulty
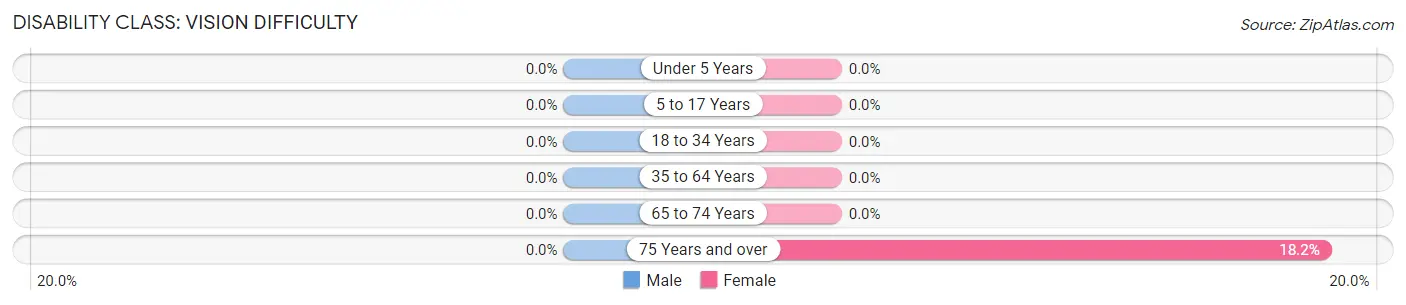
| Age Bracket | Male | Female |
| Under 5 Years | 0 (0.0%) | 0 (0.0%) |
| 5 to 17 Years | 0 (0.0%) | 0 (0.0%) |
| 18 to 34 Years | 0 (0.0%) | 0 (0.0%) |
| 35 to 64 Years | 0 (0.0%) | 0 (0.0%) |
| 65 to 74 Years | 0 (0.0%) | 0 (0.0%) |
| 75 Years and over | 0 (0.0%) | 4 (18.2%) |
Disability Class: Cognitive Difficulty
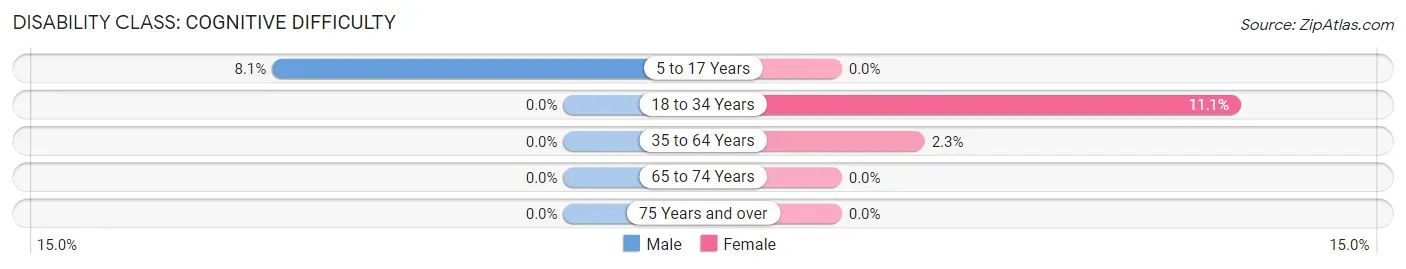
| Age Bracket | Male | Female |
| 5 to 17 Years | 6 (8.1%) | 0 (0.0%) |
| 18 to 34 Years | 0 (0.0%) | 8 (11.1%) |
| 35 to 64 Years | 0 (0.0%) | 3 (2.3%) |
| 65 to 74 Years | 0 (0.0%) | 0 (0.0%) |
| 75 Years and over | 0 (0.0%) | 0 (0.0%) |
Disability Class: Ambulatory Difficulty
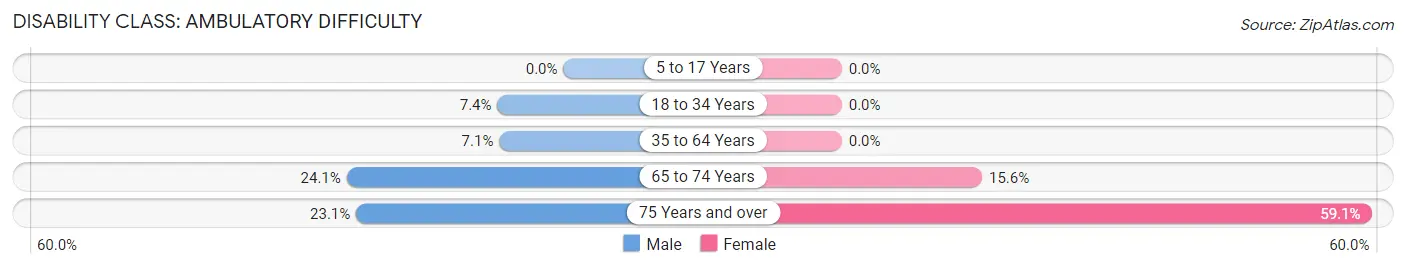
| Age Bracket | Male | Female |
| 5 to 17 Years | 0 (0.0%) | 0 (0.0%) |
| 18 to 34 Years | 5 (7.3%) | 0 (0.0%) |
| 35 to 64 Years | 8 (7.1%) | 0 (0.0%) |
| 65 to 74 Years | 7 (24.1%) | 5 (15.6%) |
| 75 Years and over | 6 (23.1%) | 13 (59.1%) |
Disability Class: Self-Care Difficulty
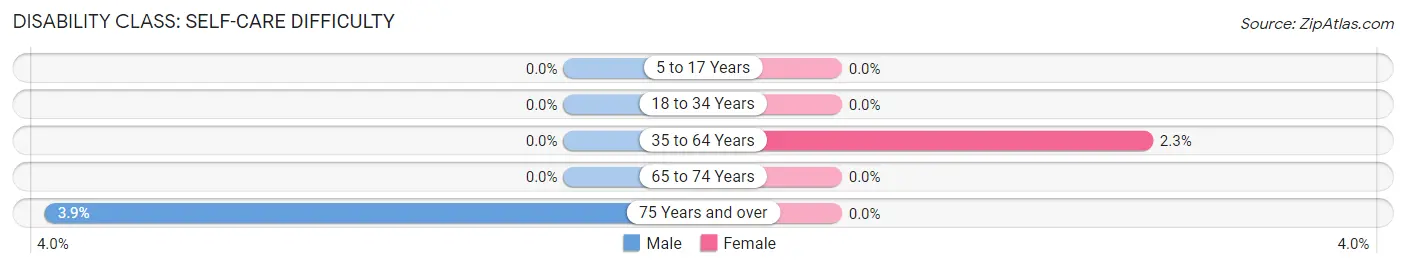
| Age Bracket | Male | Female |
| 5 to 17 Years | 0 (0.0%) | 0 (0.0%) |
| 18 to 34 Years | 0 (0.0%) | 0 (0.0%) |
| 35 to 64 Years | 0 (0.0%) | 3 (2.3%) |
| 65 to 74 Years | 0 (0.0%) | 0 (0.0%) |
| 75 Years and over | 1 (3.8%) | 0 (0.0%) |
Technology Access in Central Valley
Computing Device Access in Central Valley
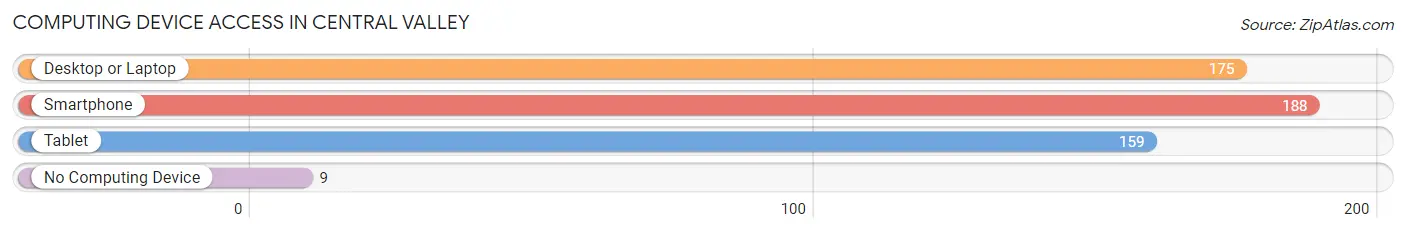
| Device Type | # Households | % Households |
| Desktop or Laptop | 175 | 85.4% |
| Smartphone | 188 | 91.7% |
| Tablet | 159 | 77.6% |
| No Computing Device | 9 | 4.4% |
| Total | 205 | 100.0% |
Internet Access in Central Valley
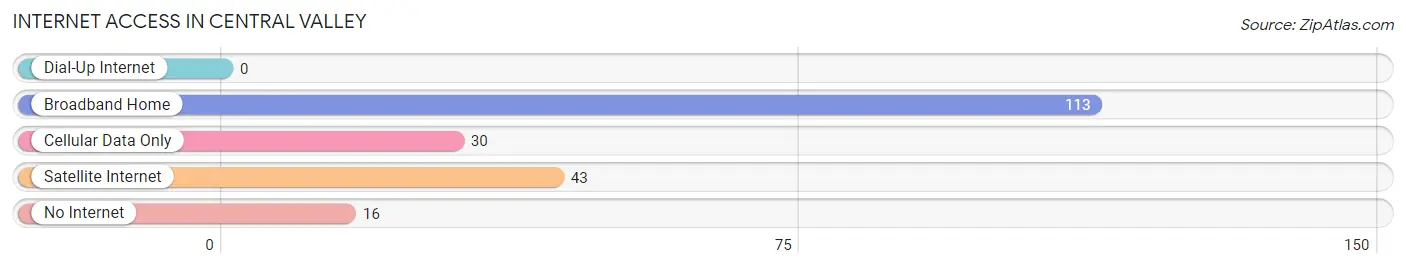
| Internet Type | # Households | % Households |
| Dial-Up Internet | 0 | 0.0% |
| Broadband Home | 113 | 55.1% |
| Cellular Data Only | 30 | 14.6% |
| Satellite Internet | 43 | 21.0% |
| No Internet | 16 | 7.8% |
| Total | 205 | 100.0% |
Central Valley Summary
Central Valley is a small city located in the northern part of Utah, in the Cache Valley. It is situated in the foothills of the Wasatch Mountains, and is surrounded by the cities of Logan, Smithfield, and Richmond. The city has a population of approximately 1,500 people, and is the smallest incorporated city in the state of Utah.
History
Central Valley was first settled in 1864 by a group of Mormon pioneers led by John W. Young. The pioneers were sent to the area by Brigham Young, who had been instructed by the Church of Jesus Christ of Latter-day Saints to establish a settlement in the Cache Valley. The pioneers named the settlement Central Valley, as it was located in the center of the valley.
The settlers quickly established a thriving community, and the town grew rapidly. By 1868, the population had grown to over 500 people. The town was incorporated in 1872, and the first mayor was elected in 1873.
In the late 1800s, the town was a major center for the production of wool and other agricultural products. The town also had a number of businesses, including a bank, a hotel, and a newspaper.
Geography
Central Valley is located in the northern part of Utah, in the Cache Valley. The city is situated in the foothills of the Wasatch Mountains, and is surrounded by the cities of Logan, Smithfield, and Richmond. The city has a total area of 1.2 square miles, all of which is land.
The city is located at an elevation of 4,890 feet above sea level. The climate is semi-arid, with hot summers and cold winters. The average annual precipitation is 16.5 inches, and the average annual snowfall is 33.5 inches.
Economy
The economy of Central Valley is largely based on agriculture and tourism. The city is home to a number of farms, which produce a variety of crops, including hay, wheat, corn, and potatoes. The city also has a number of businesses, including restaurants, retail stores, and a bank.
The city is also a popular tourist destination, as it is located near several ski resorts, including Beaver Mountain, Powder Mountain, and Snowbasin. The city also has a number of recreational activities, including hiking, fishing, and camping.
Demographics
As of the 2010 census, the population of Central Valley was 1,500 people. The racial makeup of the city was 97.3% White, 0.7% Native American, 0.3% Asian, 0.2% from other races, and 1.5% from two or more races. The median household income was $45,000, and the median family income was $50,000.
Conclusion
Central Valley is a small city located in the northern part of Utah, in the Cache Valley. It is situated in the foothills of the Wasatch Mountains, and is surrounded by the cities of Logan, Smithfield, and Richmond. The city has a population of approximately 1,500 people, and is the smallest incorporated city in the state of Utah. The economy of Central Valley is largely based on agriculture and tourism, and the city is a popular tourist destination due to its proximity to ski resorts and recreational activities. The population of Central Valley is predominantly White, with a median household income of $45,000 and a median family income of $50,000.
Common Questions
What is Per Capita Income in Central Valley?
Per Capita income in Central Valley is $33,139.
What is the Median Family Income in Central Valley?
Median Family Income in Central Valley is $105,833.
What is the Median Household income in Central Valley?
Median Household Income in Central Valley is $98,750.
What is Income or Wage Gap in Central Valley?
Income or Wage Gap in Central Valley is 47.9%.
Women in Central Valley earn 52.1 cents for every dollar earned by a man.
What is Inequality or Gini Index in Central Valley?
Inequality or Gini Index in Central Valley is 0.34.
What is the Total Population of Central Valley?
Total Population of Central Valley is 713.
What is the Total Male Population of Central Valley?
Total Male Population of Central Valley is 341.
What is the Total Female Population of Central Valley?
Total Female Population of Central Valley is 372.
What is the Ratio of Males per 100 Females in Central Valley?
There are 91.67 Males per 100 Females in Central Valley.
What is the Ratio of Females per 100 Males in Central Valley?
There are 109.09 Females per 100 Males in Central Valley.
What is the Median Population Age in Central Valley?
Median Population Age in Central Valley is 33.9 Years.
What is the Average Family Size in Central Valley
Average Family Size in Central Valley is 4.0 People.
What is the Average Household Size in Central Valley
Average Household Size in Central Valley is 3.5 People.
How Large is the Labor Force in Central Valley?
There are 369 People in the Labor Forcein in Central Valley.
What is the Percentage of People in the Labor Force in Central Valley?
73.4% of People are in the Labor Force in Central Valley.
What is the Unemployment Rate in Central Valley?
Unemployment Rate in Central Valley is 2.7%.