Charleston, UT Map & Demographics
Charleston Map
Charleston Overview
$69,714
PER CAPITA INCOME
$130,833
AVG FAMILY INCOME
$107,500
AVG HOUSEHOLD INCOME
1.0%
WAGE / INCOME GAP [ % ]
99.0¢/ $1
WAGE / INCOME GAP [ $ ]
0.57
INEQUALITY / GINI INDEX
438
TOTAL POPULATION
199
MALE POPULATION
239
FEMALE POPULATION
83.26
MALES / 100 FEMALES
120.10
FEMALES / 100 MALES
46.1
MEDIAN AGE
3.3
AVG FAMILY SIZE
2.6
AVG HOUSEHOLD SIZE
250
LABOR FORCE [ PEOPLE ]
67.8%
PERCENT IN LABOR FORCE
0.8%
UNEMPLOYMENT RATE
Income in Charleston
Income Overview in Charleston
Per Capita Income in Charleston is $69,714, while median incomes of families and households are $130,833 and $107,500 respectively.
| Characteristic | Number | Measure |
| Per Capita Income | 438 | $69,714 |
| Median Family Income | 106 | $130,833 |
| Mean Family Income | 106 | $247,248 |
| Median Household Income | 168 | $107,500 |
| Mean Household Income | 168 | $191,373 |
| Income Deficit | 106 | $0 |
| Wage / Income Gap (%) | 438 | 0.95% |
| Wage / Income Gap ($) | 438 | 99.05¢ per $1 |
| Gini / Inequality Index | 438 | 0.57 |
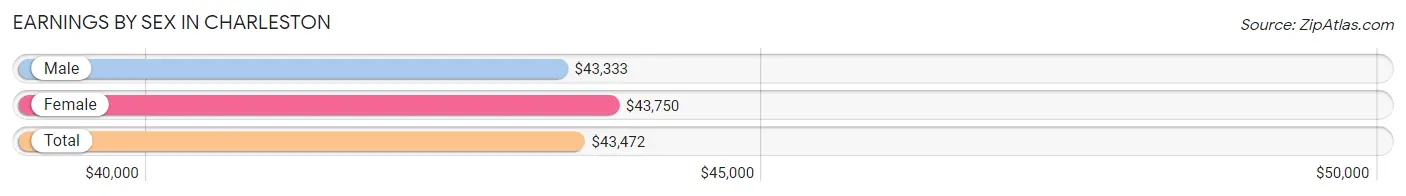
Earnings by Sex in Charleston
Average Earnings in Charleston are $43,472, $43,333 for men and $43,750 for women, a difference of 0.9%.
| Sex | Number | Average Earnings |
| Male | 136 (52.1%) | $43,333 |
| Female | 125 (47.9%) | $43,750 |
| Total | 261 (100.0%) | $43,472 |
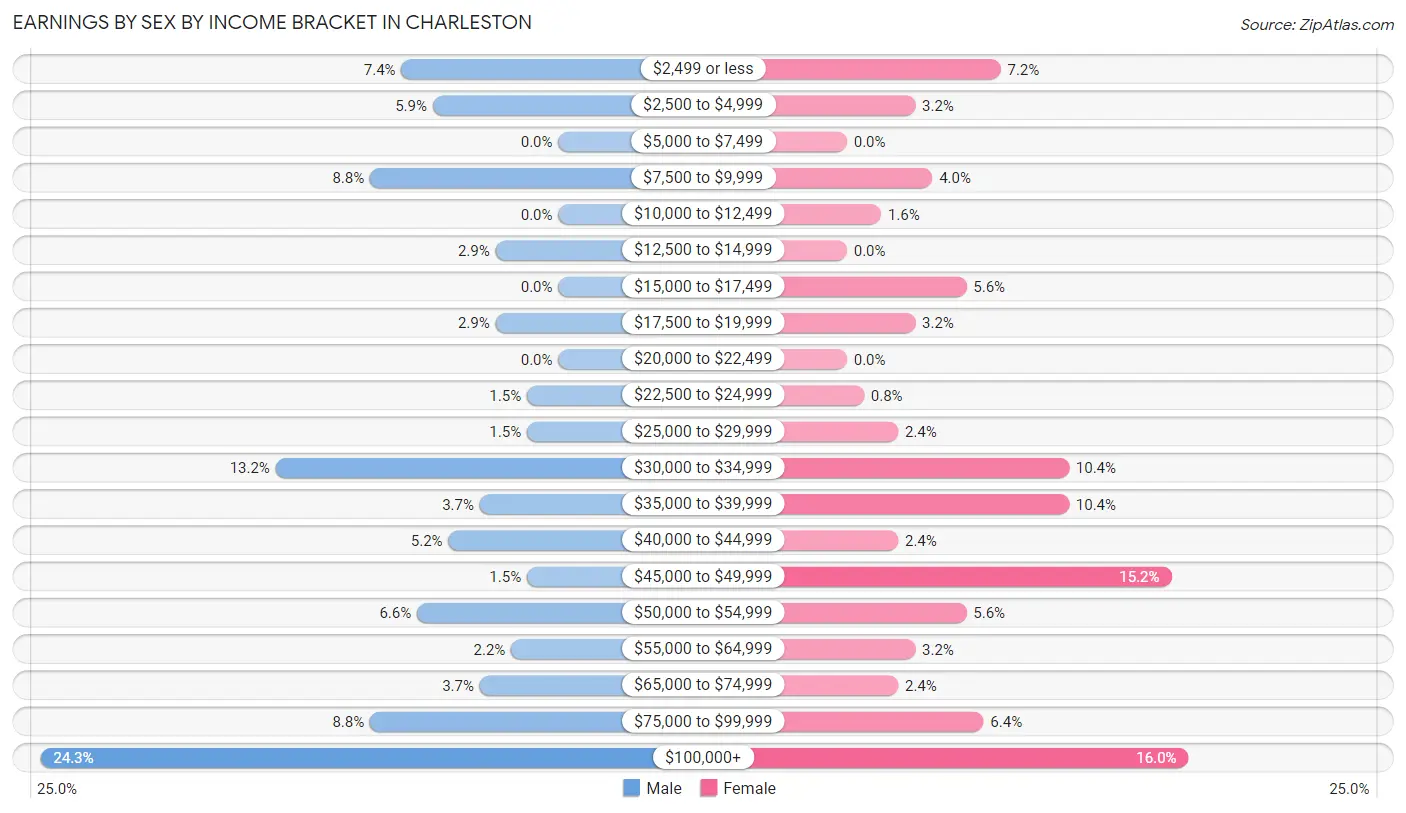
Earnings by Sex by Income Bracket in Charleston
The most common earnings brackets in Charleston are $100,000+ for men (33 | 24.3%) and $100,000+ for women (20 | 16.0%).
| Income | Male | Female |
| $2,499 or less | 10 (7.3%) | 9 (7.2%) |
| $2,500 to $4,999 | 8 (5.9%) | 4 (3.2%) |
| $5,000 to $7,499 | 0 (0.0%) | 0 (0.0%) |
| $7,500 to $9,999 | 12 (8.8%) | 5 (4.0%) |
| $10,000 to $12,499 | 0 (0.0%) | 2 (1.6%) |
| $12,500 to $14,999 | 4 (2.9%) | 0 (0.0%) |
| $15,000 to $17,499 | 0 (0.0%) | 7 (5.6%) |
| $17,500 to $19,999 | 4 (2.9%) | 4 (3.2%) |
| $20,000 to $22,499 | 0 (0.0%) | 0 (0.0%) |
| $22,500 to $24,999 | 2 (1.5%) | 1 (0.8%) |
| $25,000 to $29,999 | 2 (1.5%) | 3 (2.4%) |
| $30,000 to $34,999 | 18 (13.2%) | 13 (10.4%) |
| $35,000 to $39,999 | 5 (3.7%) | 13 (10.4%) |
| $40,000 to $44,999 | 7 (5.1%) | 3 (2.4%) |
| $45,000 to $49,999 | 2 (1.5%) | 19 (15.2%) |
| $50,000 to $54,999 | 9 (6.6%) | 7 (5.6%) |
| $55,000 to $64,999 | 3 (2.2%) | 4 (3.2%) |
| $65,000 to $74,999 | 5 (3.7%) | 3 (2.4%) |
| $75,000 to $99,999 | 12 (8.8%) | 8 (6.4%) |
| $100,000+ | 33 (24.3%) | 20 (16.0%) |
| Total | 136 (100.0%) | 125 (100.0%) |
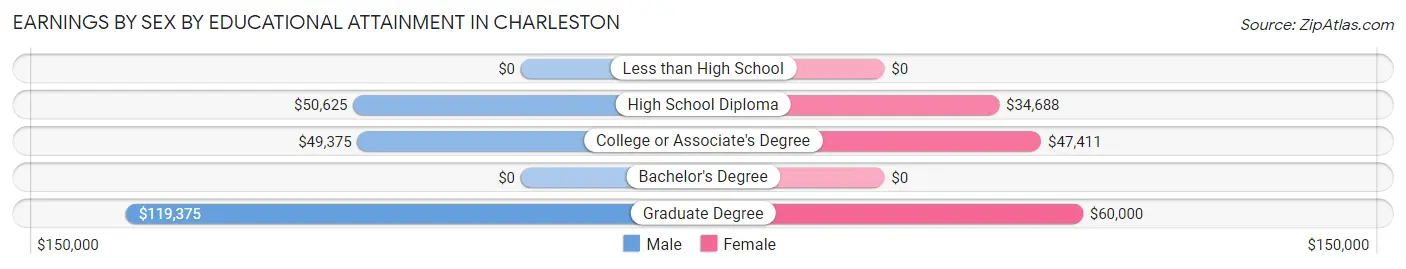
Earnings by Sex by Educational Attainment in Charleston
Average earnings in Charleston are $51,667 for men and $46,071 for women, a difference of 10.8%. Men with an educational attainment of graduate degree enjoy the highest average annual earnings of $119,375, while those with college or associate's degree education earn the least with $49,375. Women with an educational attainment of graduate degree earn the most with the average annual earnings of $60,000, while those with high school diploma education have the smallest earnings of $34,688.
| Educational Attainment | Male Income | Female Income |
| Less than High School | - | - |
| High School Diploma | $50,625 | $34,688 |
| College or Associate's Degree | $49,375 | $47,411 |
| Bachelor's Degree | - | - |
| Graduate Degree | $119,375 | $60,000 |
| Total | $51,667 | $46,071 |
Family Income in Charleston
Family Income Brackets in Charleston
According to the Charleston family income data, there are 29 families falling into the $200,000+ income range, which is the most common income bracket and makes up 27.4% of all families.
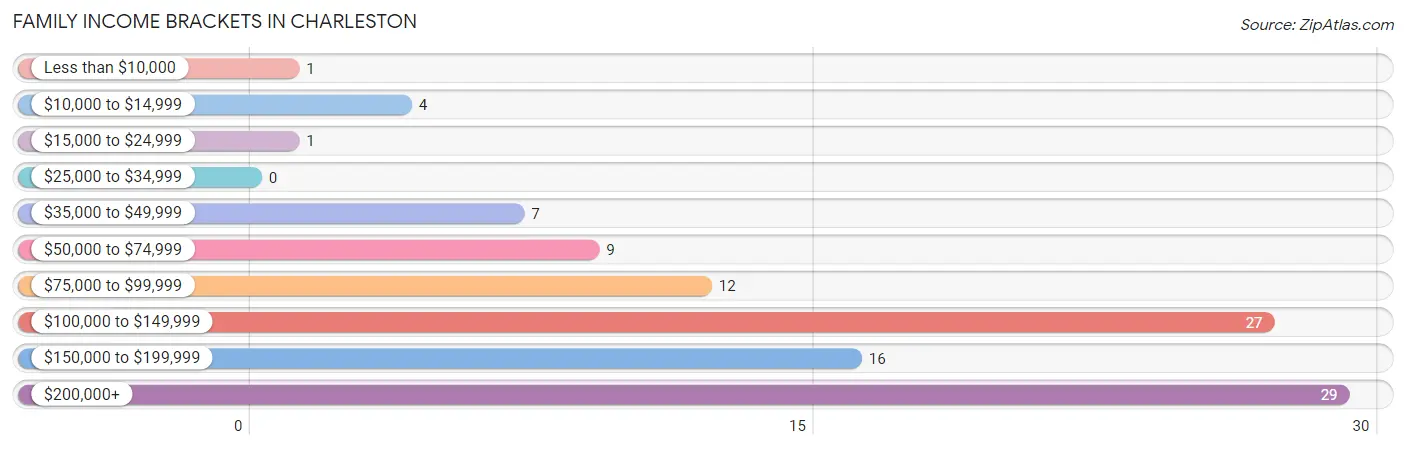
| Income Bracket | # Families | % Families |
| Less than $10,000 | 1 | 0.9% |
| $10,000 to $14,999 | 4 | 3.8% |
| $15,000 to $24,999 | 1 | 0.9% |
| $25,000 to $34,999 | 0 | 0.0% |
| $35,000 to $49,999 | 7 | 6.6% |
| $50,000 to $74,999 | 9 | 8.5% |
| $75,000 to $99,999 | 12 | 11.3% |
| $100,000 to $149,999 | 27 | 25.5% |
| $150,000 to $199,999 | 16 | 15.1% |
| $200,000+ | 29 | 27.4% |
Family Income by Famaliy Size in Charleston
7+ person families (4 | 3.8%) account for the highest median family income in Charleston with $242,500 per family, while 3-person families (21 | 19.8%) have the highest median income of $62,917 per family member.
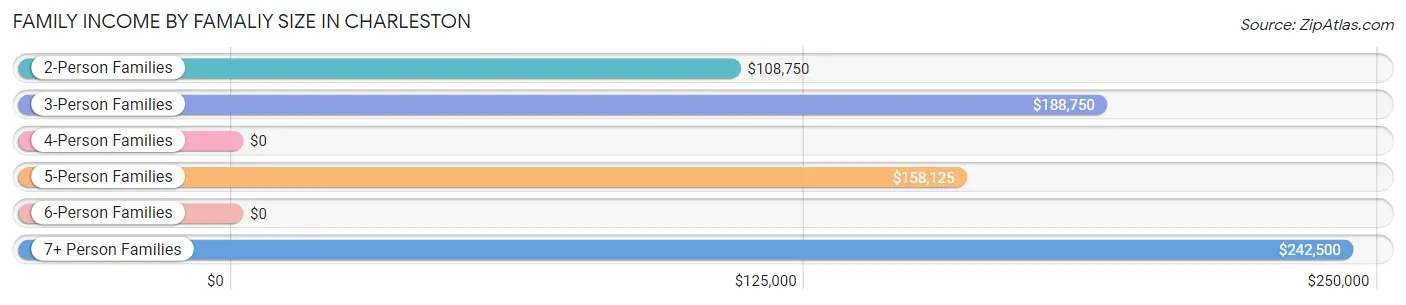
| Income Bracket | # Families | Median Income |
| 2-Person Families | 58 (54.7%) | $108,750 |
| 3-Person Families | 21 (19.8%) | $188,750 |
| 4-Person Families | 12 (11.3%) | $0 |
| 5-Person Families | 8 (7.5%) | $158,125 |
| 6-Person Families | 3 (2.8%) | $0 |
| 7+ Person Families | 4 (3.8%) | $242,500 |
| Total | 106 (100.0%) | $130,833 |
Family Income by Number of Earners in Charleston
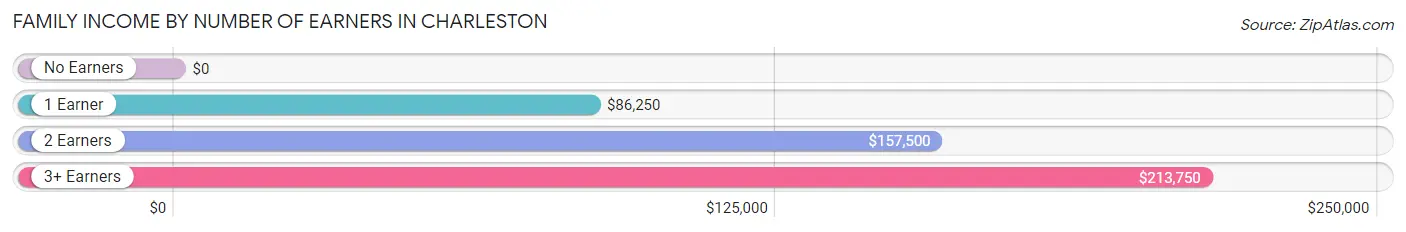
| Number of Earners | # Families | Median Income |
| No Earners | 14 (13.2%) | $0 |
| 1 Earner | 27 (25.5%) | $86,250 |
| 2 Earners | 54 (50.9%) | $157,500 |
| 3+ Earners | 11 (10.4%) | $213,750 |
| Total | 106 (100.0%) | $130,833 |
Household Income in Charleston
Household Income Brackets in Charleston
With 39 households falling in the category, the $200,000+ income range is the most frequent in Charleston, accounting for 23.2% of all households. In contrast, only 2 households (1.2%) fall into the less than $10,000 income bracket, making it the least populous group.
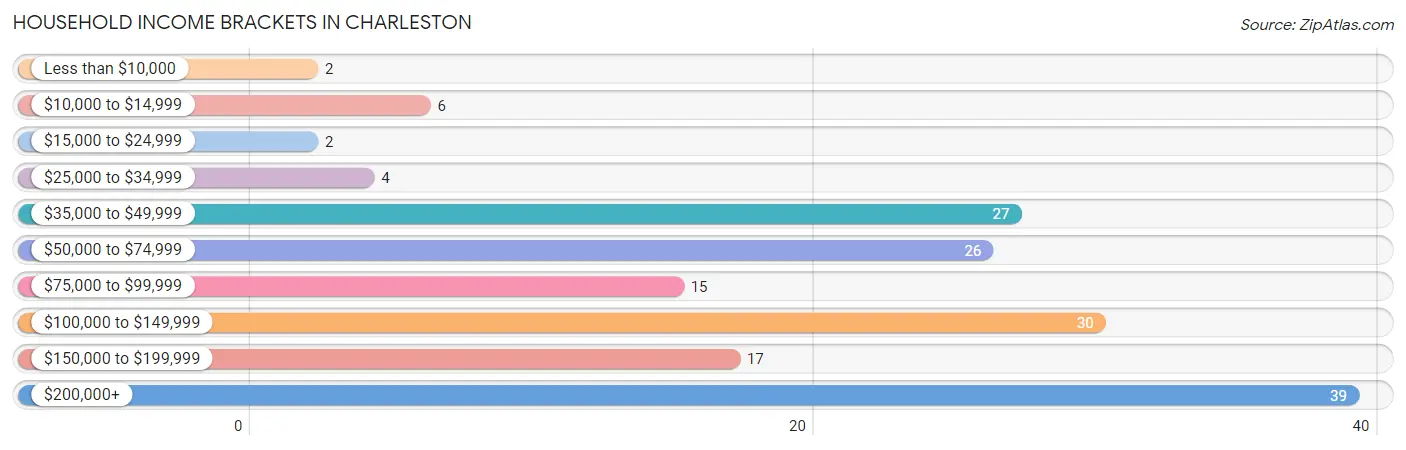
| Income Bracket | # Households | % Households |
| Less than $10,000 | 2 | 1.2% |
| $10,000 to $14,999 | 6 | 3.6% |
| $15,000 to $24,999 | 2 | 1.2% |
| $25,000 to $34,999 | 4 | 2.4% |
| $35,000 to $49,999 | 27 | 16.1% |
| $50,000 to $74,999 | 26 | 15.5% |
| $75,000 to $99,999 | 15 | 8.9% |
| $100,000 to $149,999 | 30 | 17.9% |
| $150,000 to $199,999 | 17 | 10.1% |
| $200,000+ | 39 | 23.2% |
Household Income by Householder Age in Charleston
The median household income in Charleston is $107,500, with the highest median household income of $83,750 found in the 45 to 64 years age bracket for the primary householder. A total of 78 households (46.4%) fall into this category.
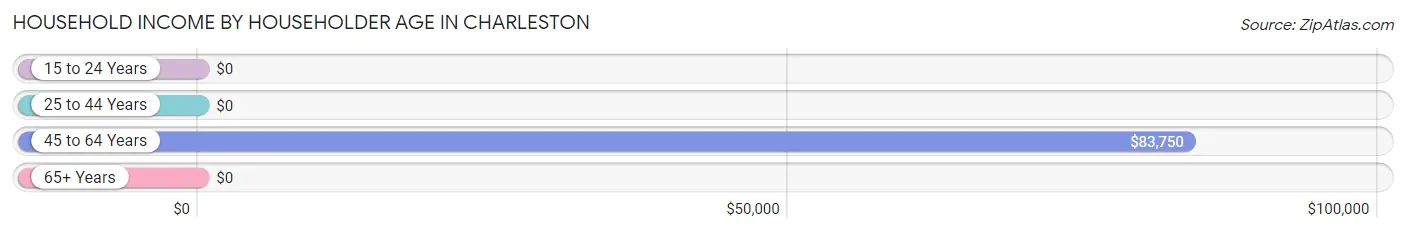
| Income Bracket | # Households | Median Income |
| 15 to 24 Years | 0 (0.0%) | $0 |
| 25 to 44 Years | 35 (20.8%) | $0 |
| 45 to 64 Years | 78 (46.4%) | $83,750 |
| 65+ Years | 55 (32.7%) | $0 |
| Total | 168 (100.0%) | $107,500 |
Poverty in Charleston
Income Below Poverty by Sex and Age in Charleston
With 6.6% poverty level for males and 2.1% for females among the residents of Charleston, 12 to 14 year old males and 75 year old and over females are the most vulnerable to poverty, with 4 males (66.7%) and 1 females (7.7%) in their respective age groups living below the poverty level.
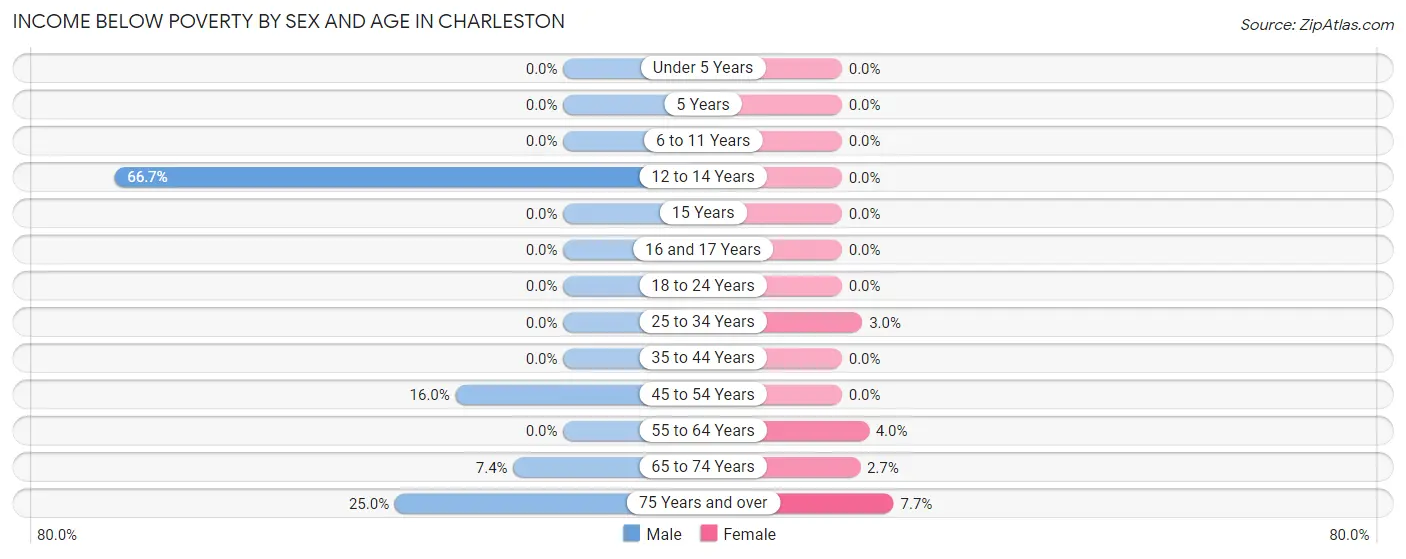
| Age Bracket | Male | Female |
| Under 5 Years | 0 (0.0%) | 0 (0.0%) |
| 5 Years | 0 (0.0%) | 0 (0.0%) |
| 6 to 11 Years | 0 (0.0%) | 0 (0.0%) |
| 12 to 14 Years | 4 (66.7%) | 0 (0.0%) |
| 15 Years | 0 (0.0%) | 0 (0.0%) |
| 16 and 17 Years | 0 (0.0%) | 0 (0.0%) |
| 18 to 24 Years | 0 (0.0%) | 0 (0.0%) |
| 25 to 34 Years | 0 (0.0%) | 1 (3.0%) |
| 35 to 44 Years | 0 (0.0%) | 0 (0.0%) |
| 45 to 54 Years | 4 (16.0%) | 0 (0.0%) |
| 55 to 64 Years | 0 (0.0%) | 2 (4.0%) |
| 65 to 74 Years | 2 (7.4%) | 1 (2.7%) |
| 75 Years and over | 3 (25.0%) | 1 (7.7%) |
| Total | 13 (6.6%) | 5 (2.1%) |
Income Above Poverty by Sex and Age in Charleston
According to the poverty statistics in Charleston, males aged under 5 years and females aged under 5 years are the age groups that are most secure financially, with 100.0% of males and 100.0% of females in these age groups living above the poverty line.
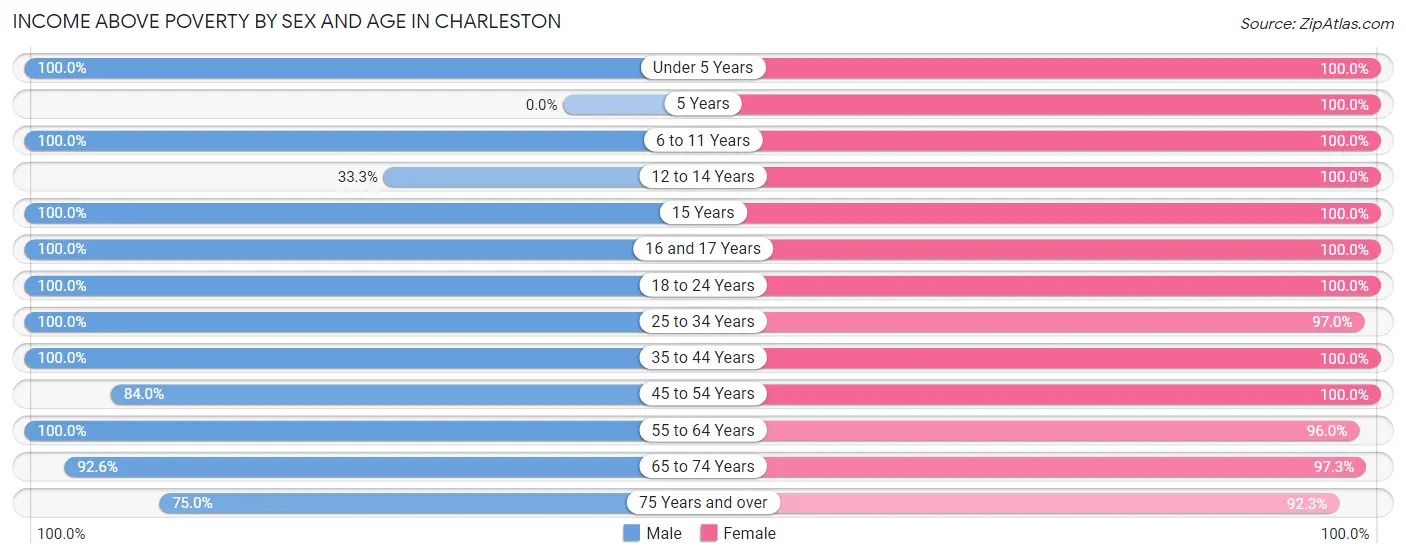
| Age Bracket | Male | Female |
| Under 5 Years | 14 (100.0%) | 13 (100.0%) |
| 5 Years | 0 (0.0%) | 5 (100.0%) |
| 6 to 11 Years | 11 (100.0%) | 7 (100.0%) |
| 12 to 14 Years | 2 (33.3%) | 4 (100.0%) |
| 15 Years | 1 (100.0%) | 3 (100.0%) |
| 16 and 17 Years | 10 (100.0%) | 8 (100.0%) |
| 18 to 24 Years | 10 (100.0%) | 16 (100.0%) |
| 25 to 34 Years | 30 (100.0%) | 32 (97.0%) |
| 35 to 44 Years | 18 (100.0%) | 24 (100.0%) |
| 45 to 54 Years | 21 (84.0%) | 24 (100.0%) |
| 55 to 64 Years | 32 (100.0%) | 48 (96.0%) |
| 65 to 74 Years | 25 (92.6%) | 36 (97.3%) |
| 75 Years and over | 9 (75.0%) | 12 (92.3%) |
| Total | 183 (93.4%) | 232 (97.9%) |
Income Below Poverty Among Married-Couple Families in Charleston
The poverty statistics for married-couple families in Charleston show that 2.1% or 2 of the total 97 families live below the poverty line. Families with no children have the highest poverty rate of 3.4%, comprising of 2 families. On the other hand, families with 1 or 2 children have the lowest poverty rate of 0.0%, which includes 0 families.
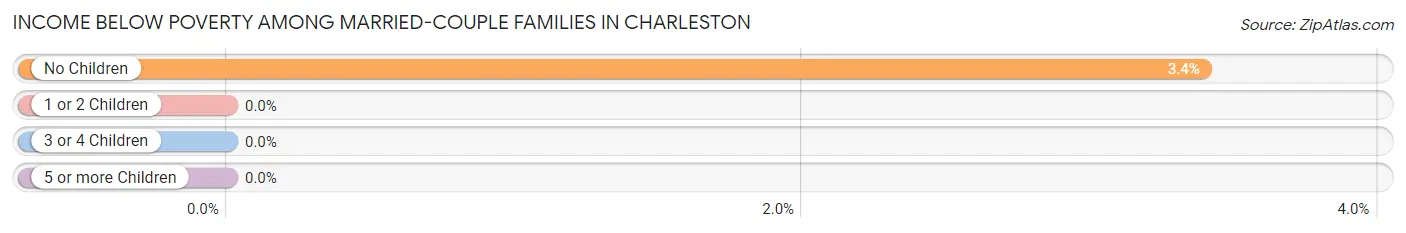
| Children | Above Poverty | Below Poverty |
| No Children | 57 (96.6%) | 2 (3.4%) |
| 1 or 2 Children | 28 (100.0%) | 0 (0.0%) |
| 3 or 4 Children | 10 (100.0%) | 0 (0.0%) |
| 5 or more Children | 0 (0.0%) | 0 (0.0%) |
| Total | 95 (97.9%) | 2 (2.1%) |
Income Below Poverty Among Single-Parent Households in Charleston
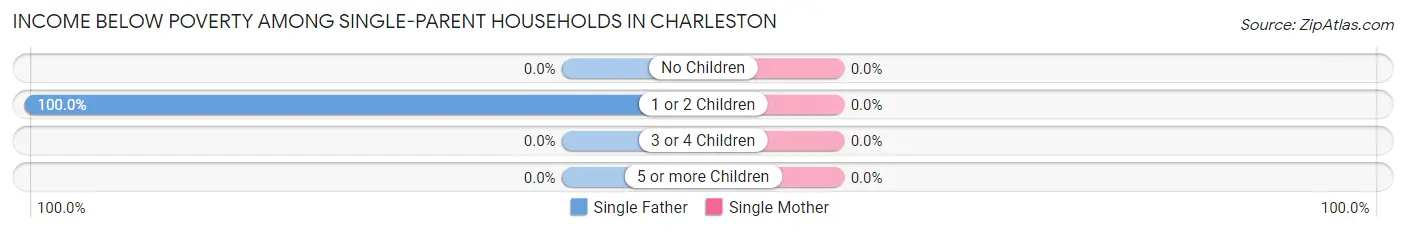
| Children | Single Father | Single Mother |
| No Children | 0 (0.0%) | 0 (0.0%) |
| 1 or 2 Children | 4 (100.0%) | 0 (0.0%) |
| 3 or 4 Children | 0 (0.0%) | 0 (0.0%) |
| 5 or more Children | 0 (0.0%) | 0 (0.0%) |
| Total | 4 (80.0%) | 0 (0.0%) |
Income Below Poverty Among Married-Couple vs Single-Parent Households in Charleston
The poverty data for Charleston shows that 2 of the married-couple family households (2.1%) and 4 of the single-parent households (44.4%) are living below the poverty level. Within the married-couple family households, those with no children have the highest poverty rate, with 2 households (3.4%) falling below the poverty line. Among the single-parent households, those with 1 or 2 children have the highest poverty rate, with 4 household (50.0%) living below poverty.
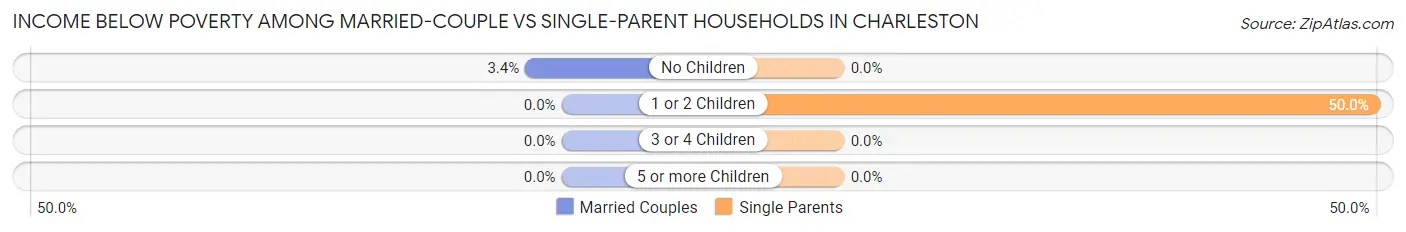
| Children | Married-Couple Families | Single-Parent Households |
| No Children | 2 (3.4%) | 0 (0.0%) |
| 1 or 2 Children | 0 (0.0%) | 4 (50.0%) |
| 3 or 4 Children | 0 (0.0%) | 0 (0.0%) |
| 5 or more Children | 0 (0.0%) | 0 (0.0%) |
| Total | 2 (2.1%) | 4 (44.4%) |
Race in Charleston
The most populous races in Charleston are White / Caucasian (403 | 92.0%), Two or more Races (22 | 5.0%), and Hispanic or Latino (11 | 2.5%).
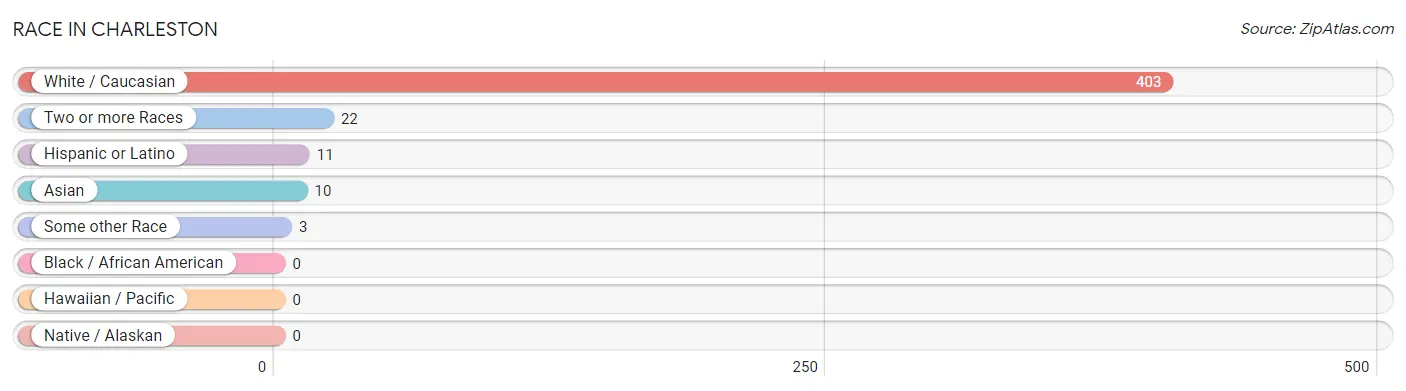
| Race | # Population | % Population |
| Asian | 10 | 2.3% |
| Black / African American | 0 | 0.0% |
| Hawaiian / Pacific | 0 | 0.0% |
| Hispanic or Latino | 11 | 2.5% |
| Native / Alaskan | 0 | 0.0% |
| White / Caucasian | 403 | 92.0% |
| Two or more Races | 22 | 5.0% |
| Some other Race | 3 | 0.7% |
| Total | 438 | 100.0% |
Ancestry in Charleston
The most populous ancestries reported in Charleston are English (118 | 26.9%), German (65 | 14.8%), Scotch-Irish (29 | 6.6%), Swiss (26 | 5.9%), and American (22 | 5.0%), together accounting for 59.4% of all Charleston residents.
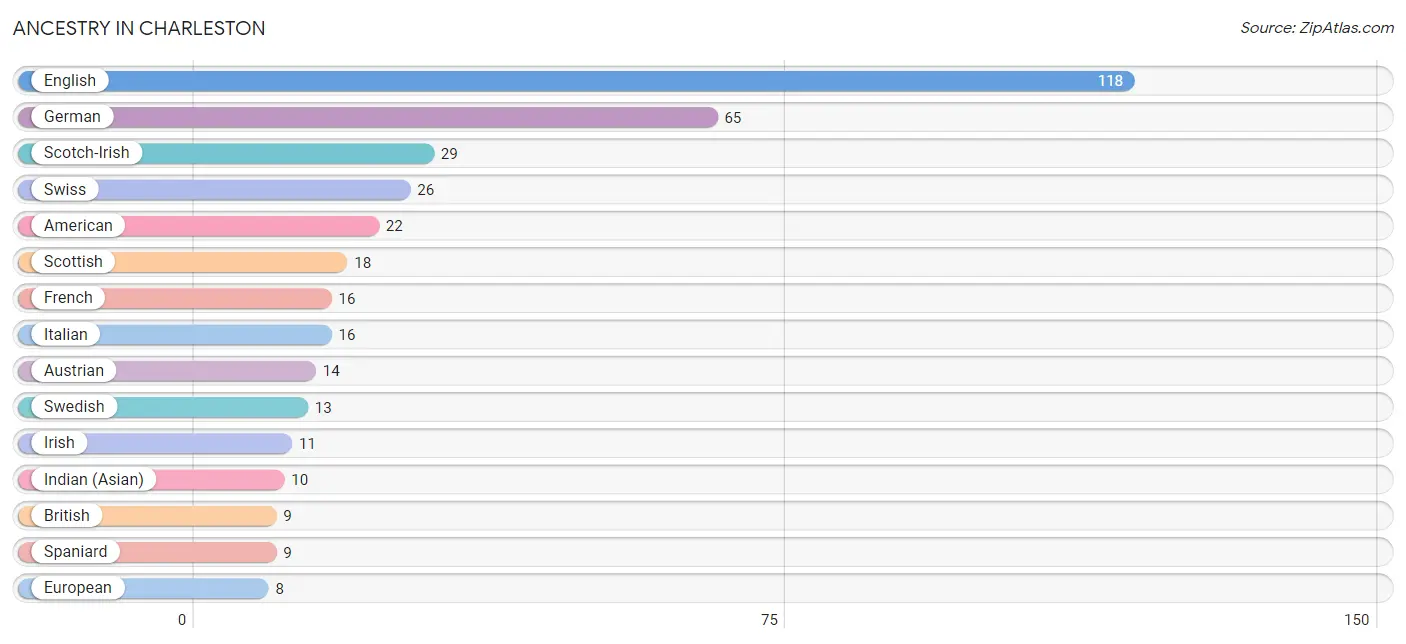
| Ancestry | # Population | % Population |
| American | 22 | 5.0% |
| Austrian | 14 | 3.2% |
| British | 9 | 2.1% |
| Canadian | 2 | 0.5% |
| Cherokee | 2 | 0.5% |
| Danish | 5 | 1.1% |
| Eastern European | 3 | 0.7% |
| English | 118 | 26.9% |
| European | 8 | 1.8% |
| French | 16 | 3.6% |
| German | 65 | 14.8% |
| Greek | 1 | 0.2% |
| Indian (Asian) | 10 | 2.3% |
| Irish | 11 | 2.5% |
| Italian | 16 | 3.6% |
| Mexican | 1 | 0.2% |
| Nigerian | 5 | 1.1% |
| Northern European | 2 | 0.5% |
| Norwegian | 4 | 0.9% |
| Polish | 1 | 0.2% |
| Portuguese | 1 | 0.2% |
| Russian | 1 | 0.2% |
| Scandinavian | 2 | 0.5% |
| Scotch-Irish | 29 | 6.6% |
| Scottish | 18 | 4.1% |
| Spaniard | 9 | 2.1% |
| Spanish | 1 | 0.2% |
| Subsaharan African | 5 | 1.1% |
| Swedish | 13 | 3.0% |
| Swiss | 26 | 5.9% |
| Welsh | 8 | 1.8% | View All 31 Rows |
Immigrants in Charleston
The most numerous immigrant groups reported in Charleston came from , and Canada (2 | 0.5%), together accounting for 0.5% of all Charleston residents.

| Immigration Origin | # Population | % Population |
| Canada | 2 | 0.5% | View All 1 Rows |
Sex and Age in Charleston
Sex and Age in Charleston
The most populous age groups in Charleston are 60 to 64 Years (21 | 10.5%) for men and 60 to 64 Years (28 | 11.7%) for women.
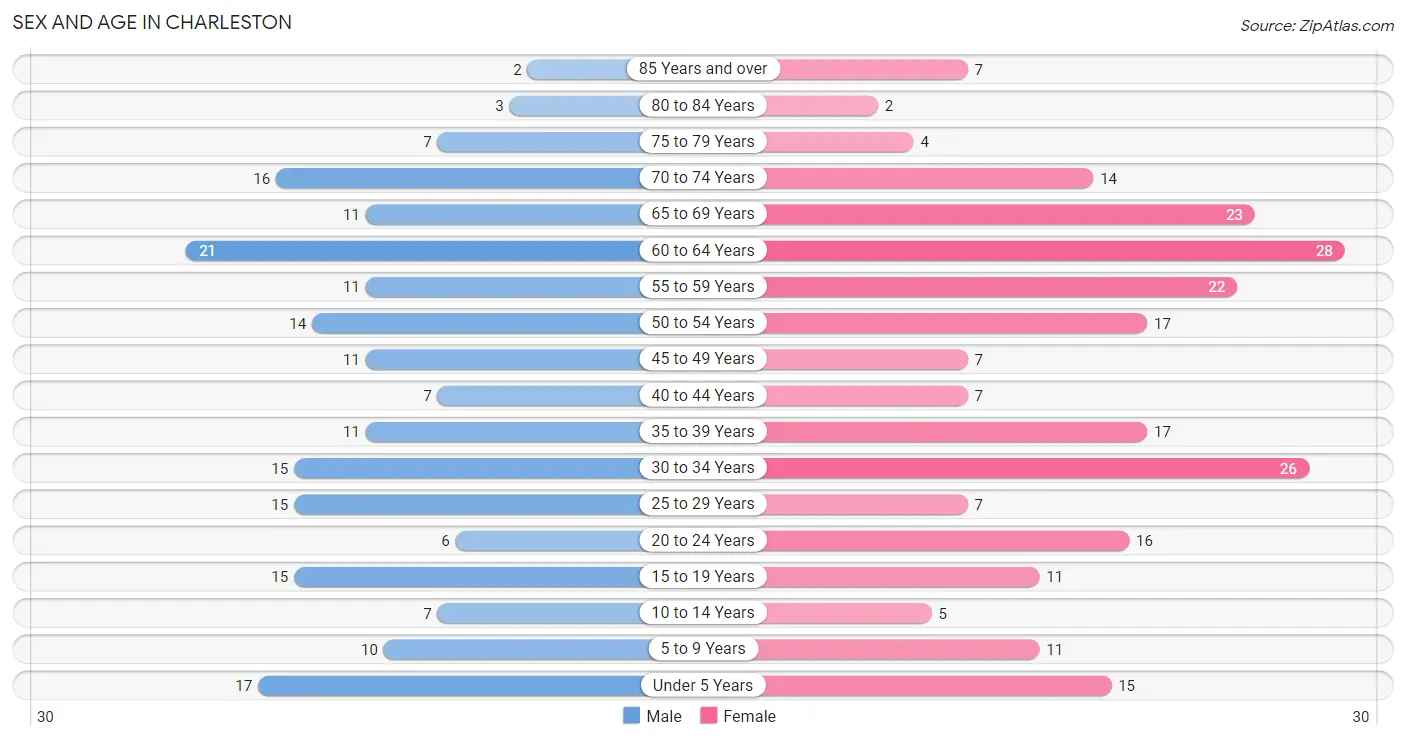
| Age Bracket | Male | Female |
| Under 5 Years | 17 (8.5%) | 15 (6.3%) |
| 5 to 9 Years | 10 (5.0%) | 11 (4.6%) |
| 10 to 14 Years | 7 (3.5%) | 5 (2.1%) |
| 15 to 19 Years | 15 (7.5%) | 11 (4.6%) |
| 20 to 24 Years | 6 (3.0%) | 16 (6.7%) |
| 25 to 29 Years | 15 (7.5%) | 7 (2.9%) |
| 30 to 34 Years | 15 (7.5%) | 26 (10.9%) |
| 35 to 39 Years | 11 (5.5%) | 17 (7.1%) |
| 40 to 44 Years | 7 (3.5%) | 7 (2.9%) |
| 45 to 49 Years | 11 (5.5%) | 7 (2.9%) |
| 50 to 54 Years | 14 (7.0%) | 17 (7.1%) |
| 55 to 59 Years | 11 (5.5%) | 22 (9.2%) |
| 60 to 64 Years | 21 (10.5%) | 28 (11.7%) |
| 65 to 69 Years | 11 (5.5%) | 23 (9.6%) |
| 70 to 74 Years | 16 (8.0%) | 14 (5.9%) |
| 75 to 79 Years | 7 (3.5%) | 4 (1.7%) |
| 80 to 84 Years | 3 (1.5%) | 2 (0.8%) |
| 85 Years and over | 2 (1.0%) | 7 (2.9%) |
| Total | 199 (100.0%) | 239 (100.0%) |
Families and Households in Charleston
Median Family Size in Charleston
The median family size in Charleston is 3.30 persons per family, with single female/mother families (4 | 3.8%) accounting for the largest median family size of 3.75 persons per family. On the other hand, single male/father families (5 | 4.7%) represent the smallest median family size with 2.60 persons per family.
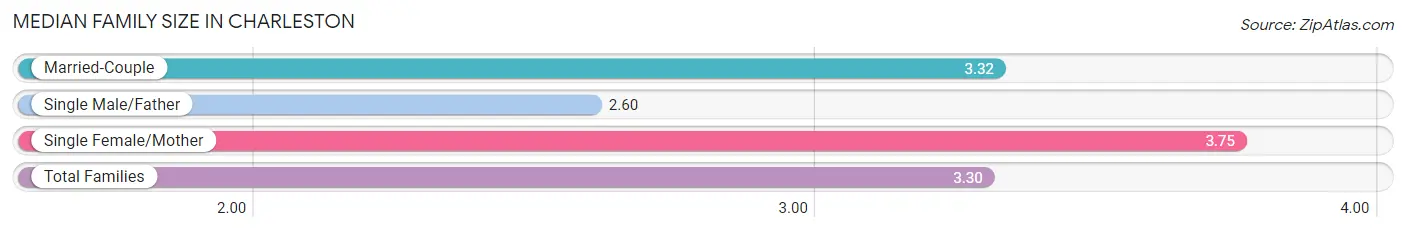
| Family Type | # Families | Family Size |
| Married-Couple | 97 (91.5%) | 3.32 |
| Single Male/Father | 5 (4.7%) | 2.60 |
| Single Female/Mother | 4 (3.8%) | 3.75 |
| Total Families | 106 (100.0%) | 3.30 |
Median Household Size in Charleston
The median household size in Charleston is 2.61 persons per household, with single female/mother households (4 | 2.4%) accounting for the largest median household size of 3.75 persons per household. non-family households (62 | 36.9%) represent the smallest median household size with 1.32 persons per household.
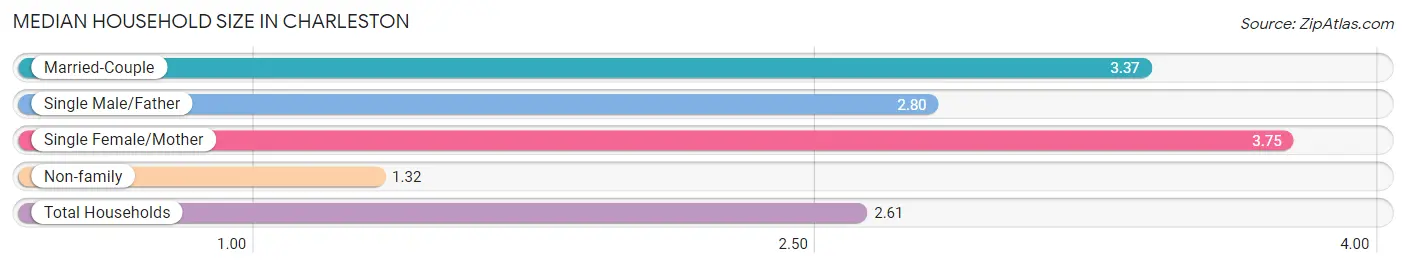
| Household Type | # Households | Household Size |
| Married-Couple | 97 (57.7%) | 3.37 |
| Single Male/Father | 5 (3.0%) | 2.80 |
| Single Female/Mother | 4 (2.4%) | 3.75 |
| Non-family | 62 (36.9%) | 1.32 |
| Total Households | 168 (100.0%) | 2.61 |
Household Size by Marriage Status in Charleston
Out of a total of 168 households in Charleston, 106 (63.1%) are family households, while 62 (36.9%) are nonfamily households. The most numerous type of family households are 2-person households, comprising 57, and the most common type of nonfamily households are 1-person households, comprising 52.
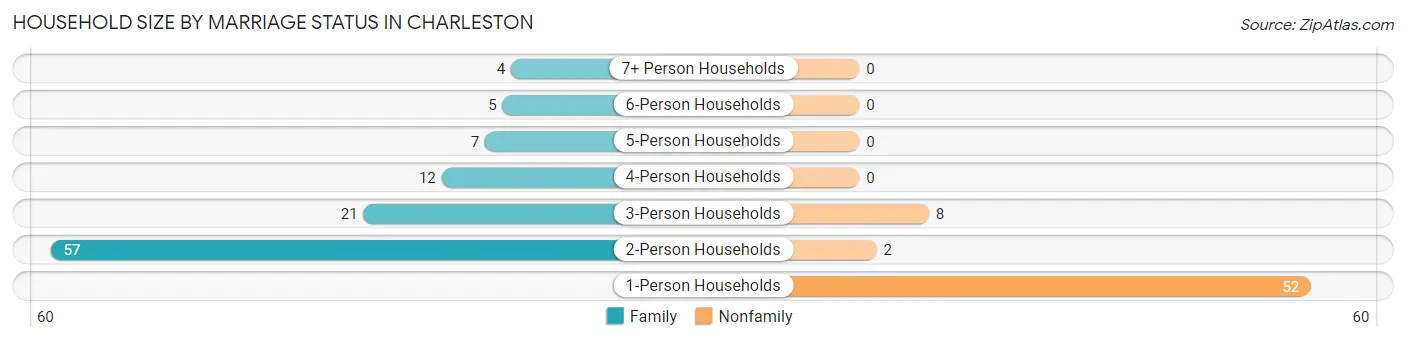
| Household Size | Family Households | Nonfamily Households |
| 1-Person Households | - | 52 (30.9%) |
| 2-Person Households | 57 (33.9%) | 2 (1.2%) |
| 3-Person Households | 21 (12.5%) | 8 (4.8%) |
| 4-Person Households | 12 (7.1%) | 0 (0.0%) |
| 5-Person Households | 7 (4.2%) | 0 (0.0%) |
| 6-Person Households | 5 (3.0%) | 0 (0.0%) |
| 7+ Person Households | 4 (2.4%) | 0 (0.0%) |
| Total | 106 (63.1%) | 62 (36.9%) |
Female Fertility in Charleston
Fertility by Age in Charleston
Average fertility rate in Charleston is 118.0 births per 1,000 women. Women in the age bracket of 20 to 34 years have the highest fertility rate with 204.0 births per 1,000 women. Women in the age bracket of 20 to 34 years acount for 90.9% of all women with births.
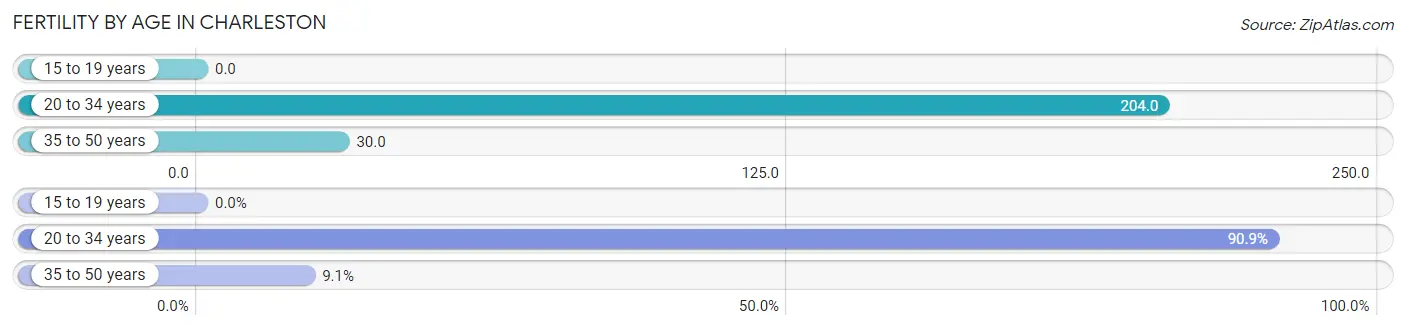
| Age Bracket | Women with Births | Births / 1,000 Women |
| 15 to 19 years | 0 (0.0%) | 0.0 |
| 20 to 34 years | 10 (90.9%) | 204.0 |
| 35 to 50 years | 1 (9.1%) | 30.0 |
| Total | 11 (100.0%) | 118.0 |
Fertility by Age by Marriage Status in Charleston
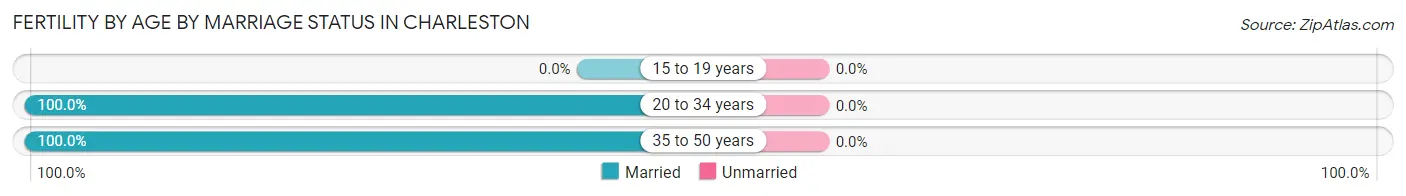
| Age Bracket | Married | Unmarried |
| 15 to 19 years | 0 (0.0%) | 0 (0.0%) |
| 20 to 34 years | 10 (100.0%) | 0 (0.0%) |
| 35 to 50 years | 1 (100.0%) | 0 (0.0%) |
| Total | 11 (100.0%) | 0 (0.0%) |
Fertility by Education in Charleston
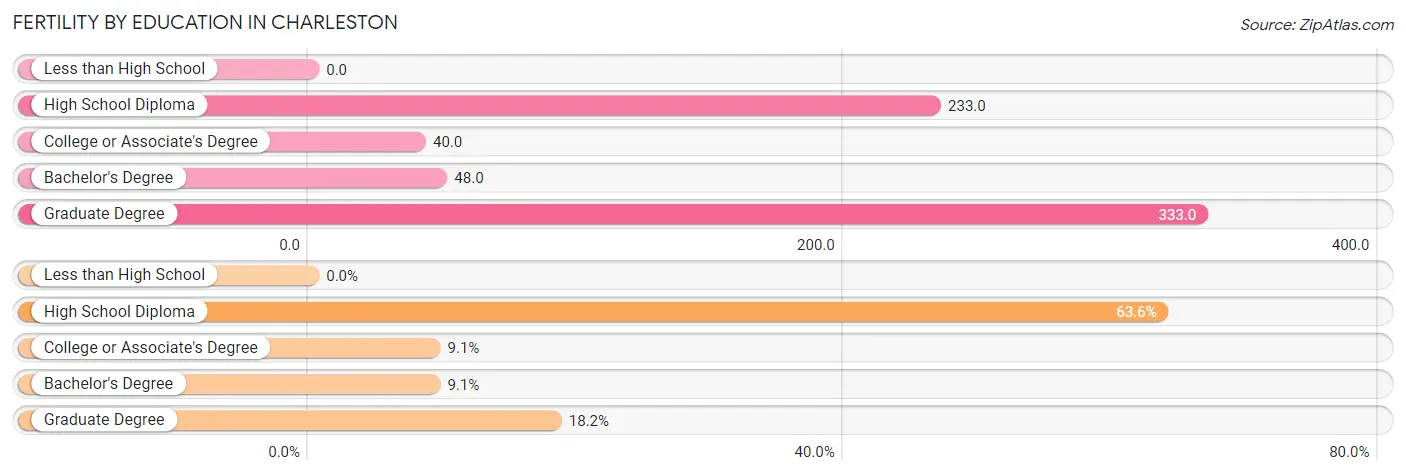
| Educational Attainment | Women with Births | Births / 1,000 Women |
| Less than High School | 0 (0.0%) | 0.0 |
| High School Diploma | 7 (63.6%) | 233.0 |
| College or Associate's Degree | 1 (9.1%) | 40.0 |
| Bachelor's Degree | 1 (9.1%) | 48.0 |
| Graduate Degree | 2 (18.2%) | 333.0 |
| Total | 11 (100.0%) | 118.0 |
Fertility by Education by Marriage Status in Charleston
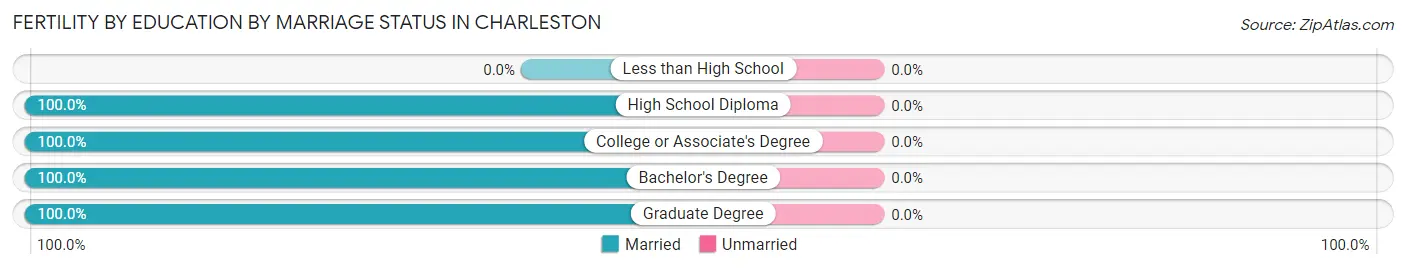
| Educational Attainment | Married | Unmarried |
| Less than High School | 0 (0.0%) | 0 (0.0%) |
| High School Diploma | 7 (100.0%) | 0 (0.0%) |
| College or Associate's Degree | 1 (100.0%) | 0 (0.0%) |
| Bachelor's Degree | 1 (100.0%) | 0 (0.0%) |
| Graduate Degree | 2 (100.0%) | 0 (0.0%) |
| Total | 11 (100.0%) | 0 (0.0%) |
Employment Characteristics in Charleston
Employment by Class of Employer in Charleston
Among the 241 employed individuals in Charleston, private company employees (158 | 65.6%), self-employed (incorporated) (32 | 13.3%), and local government employees (21 | 8.7%) make up the most common classes of employment.
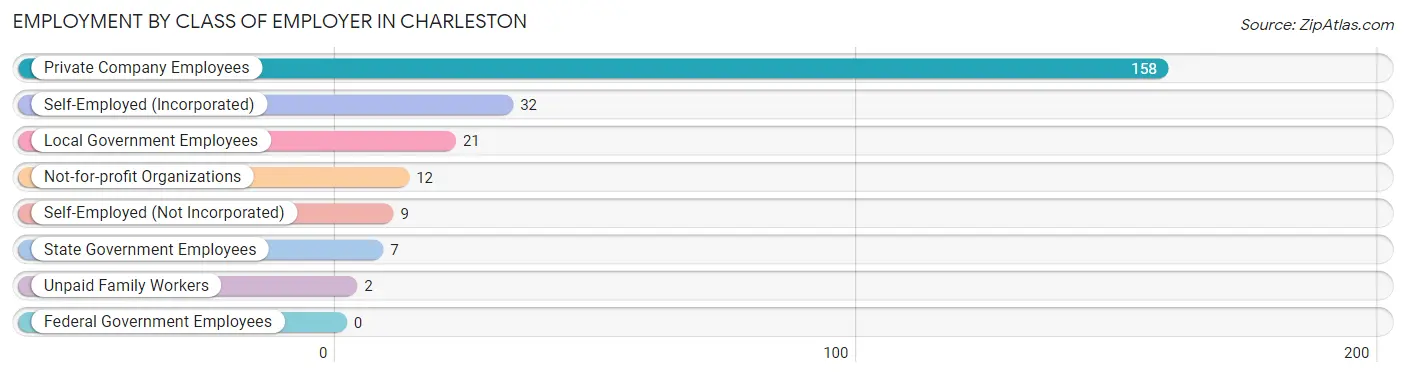
| Employer Class | # Employees | % Employees |
| Private Company Employees | 158 | 65.6% |
| Self-Employed (Incorporated) | 32 | 13.3% |
| Self-Employed (Not Incorporated) | 9 | 3.7% |
| Not-for-profit Organizations | 12 | 5.0% |
| Local Government Employees | 21 | 8.7% |
| State Government Employees | 7 | 2.9% |
| Federal Government Employees | 0 | 0.0% |
| Unpaid Family Workers | 2 | 0.8% |
| Total | 241 | 100.0% |
Employment Status by Age in Charleston
According to the labor force statistics for Charleston, out of the total population over 16 years of age (369), 67.8% or 250 individuals are in the labor force, with 0.8% or 2 of them unemployed. The age group with the highest labor force participation rate is 30 to 34 years, with 95.1% or 39 individuals in the labor force. Within the labor force, the 65 to 74 years age range has the highest percentage of unemployed individuals, with 9.1% or 2 of them being unemployed.
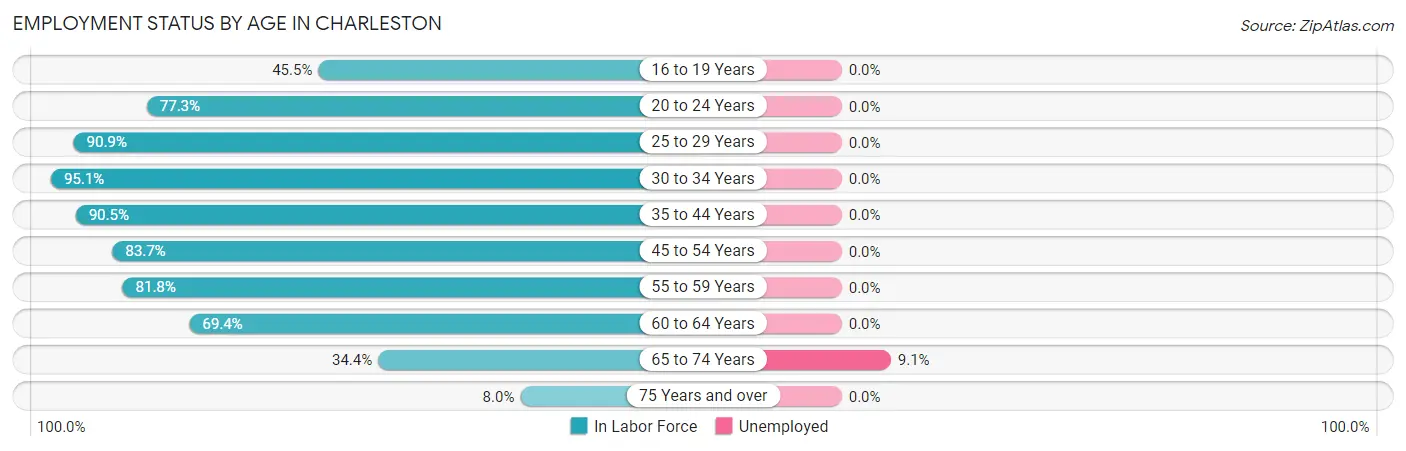
| Age Bracket | In Labor Force | Unemployed |
| 16 to 19 Years | 10 (45.5%) | 0 (0.0%) |
| 20 to 24 Years | 17 (77.3%) | 0 (0.0%) |
| 25 to 29 Years | 20 (90.9%) | 0 (0.0%) |
| 30 to 34 Years | 39 (95.1%) | 0 (0.0%) |
| 35 to 44 Years | 38 (90.5%) | 0 (0.0%) |
| 45 to 54 Years | 41 (83.7%) | 0 (0.0%) |
| 55 to 59 Years | 27 (81.8%) | 0 (0.0%) |
| 60 to 64 Years | 34 (69.4%) | 0 (0.0%) |
| 65 to 74 Years | 22 (34.4%) | 2 (9.1%) |
| 75 Years and over | 2 (8.0%) | 0 (0.0%) |
| Total | 250 (67.8%) | 2 (0.8%) |
Employment Status by Educational Attainment in Charleston
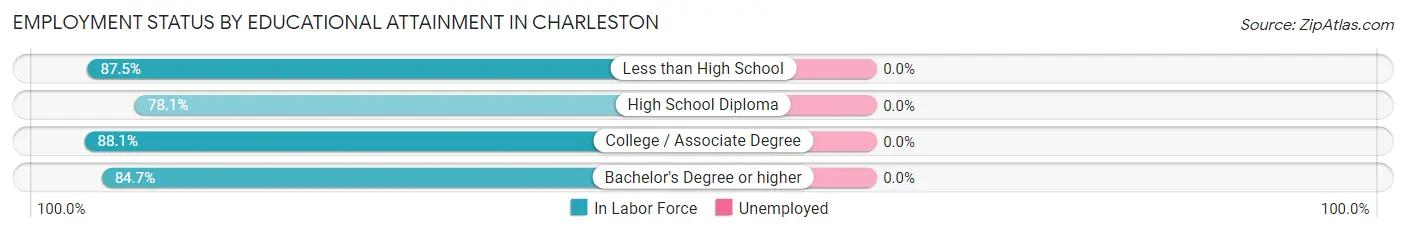
| Educational Attainment | In Labor Force | Unemployed |
| Less than High School | 14 (87.5%) | 0 (0.0%) |
| High School Diploma | 50 (78.1%) | 0 (0.0%) |
| College / Associate Degree | 74 (88.1%) | 0 (0.0%) |
| Bachelor's Degree or higher | 61 (84.7%) | 0 (0.0%) |
| Total | 199 (84.3%) | 0 (0.0%) |
Employment Occupations by Sex in Charleston
Management, Business, Science and Arts Occupations
The most common Management, Business, Science and Arts occupations in Charleston are Health Diagnosing & Treating (37 | 14.9%), Management (33 | 13.3%), Community & Social Service (21 | 8.5%), Health Technologists (21 | 8.5%), and Business & Financial (13 | 5.2%).
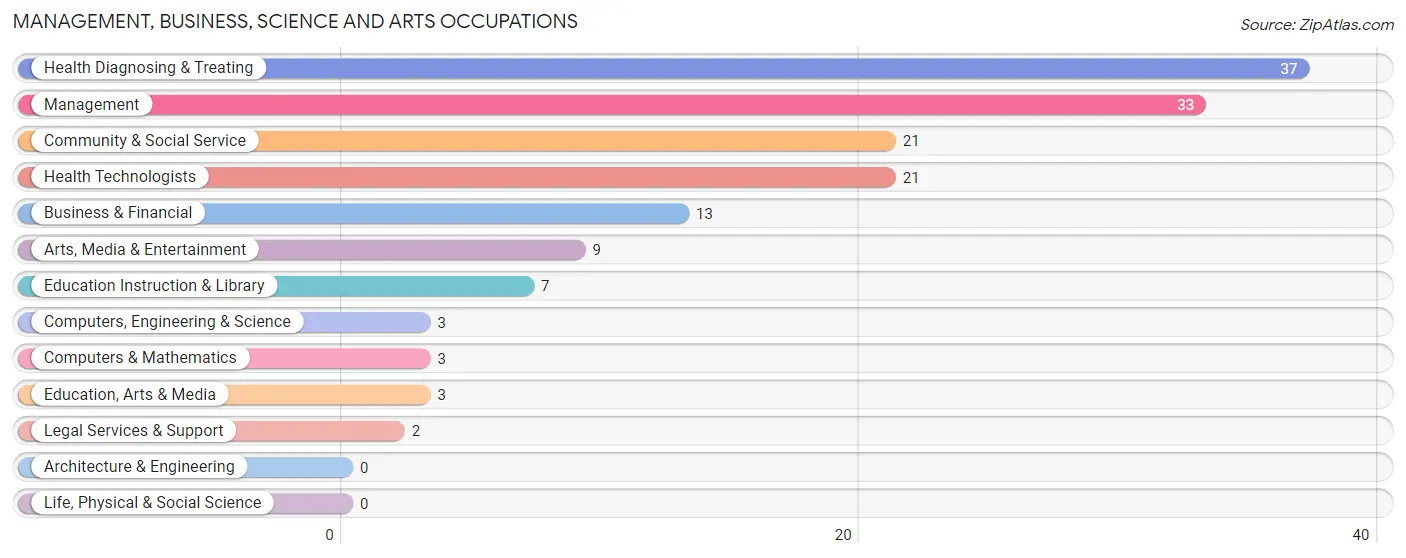
Management, Business, Science and Arts Occupations by Sex
Within the Management, Business, Science and Arts occupations in Charleston, the most male-oriented occupations are Legal Services & Support (100.0%), Computers, Engineering & Science (66.7%), and Computers & Mathematics (66.7%), while the most female-oriented occupations are Education, Arts & Media (100.0%), Education Instruction & Library (100.0%), and Health Diagnosing & Treating (78.4%).
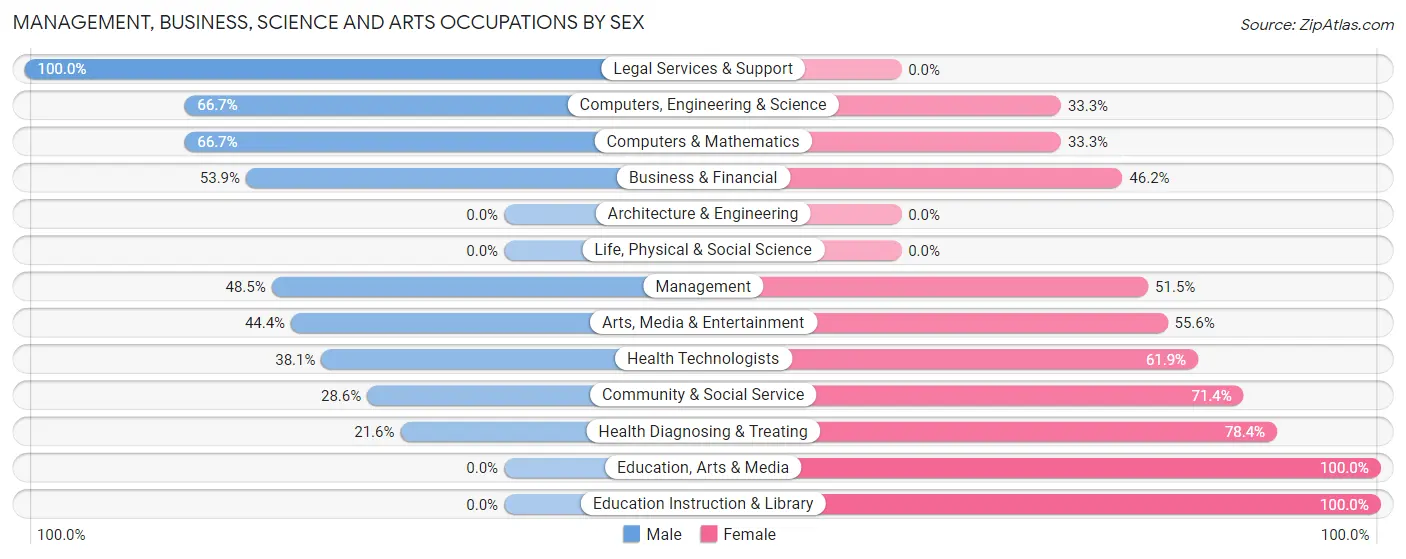
| Occupation | Male | Female |
| Management | 16 (48.5%) | 17 (51.5%) |
| Business & Financial | 7 (53.8%) | 6 (46.2%) |
| Computers, Engineering & Science | 2 (66.7%) | 1 (33.3%) |
| Computers & Mathematics | 2 (66.7%) | 1 (33.3%) |
| Architecture & Engineering | 0 (0.0%) | 0 (0.0%) |
| Life, Physical & Social Science | 0 (0.0%) | 0 (0.0%) |
| Community & Social Service | 6 (28.6%) | 15 (71.4%) |
| Education, Arts & Media | 0 (0.0%) | 3 (100.0%) |
| Legal Services & Support | 2 (100.0%) | 0 (0.0%) |
| Education Instruction & Library | 0 (0.0%) | 7 (100.0%) |
| Arts, Media & Entertainment | 4 (44.4%) | 5 (55.6%) |
| Health Diagnosing & Treating | 8 (21.6%) | 29 (78.4%) |
| Health Technologists | 8 (38.1%) | 13 (61.9%) |
| Total (Category) | 39 (36.4%) | 68 (63.5%) |
| Total (Overall) | 127 (51.2%) | 121 (48.8%) |
Services Occupations
The most common Services occupations in Charleston are Security & Protection (12 | 4.8%), Firefighting & Prevention (12 | 4.8%), Healthcare Support (6 | 2.4%), Food Preparation & Serving (4 | 1.6%), and Cleaning & Maintenance (4 | 1.6%).
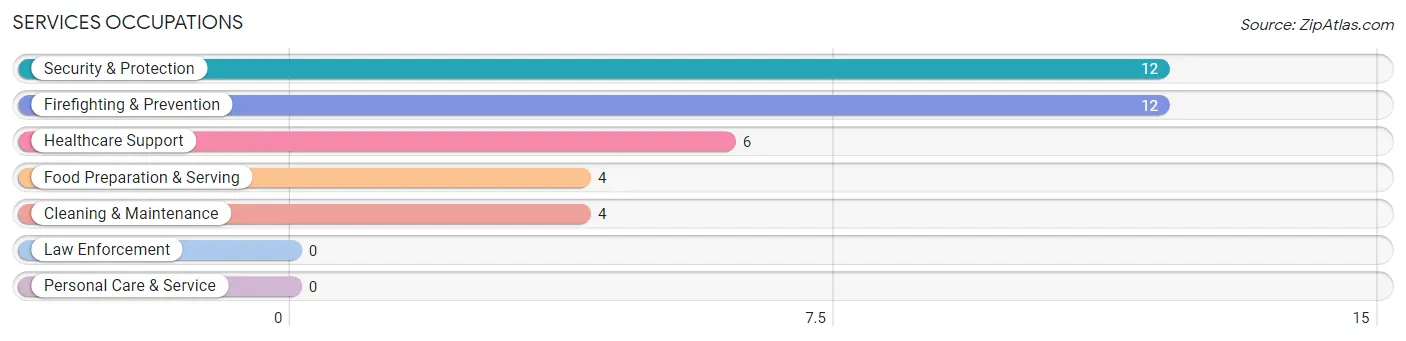
Services Occupations by Sex
Within the Services occupations in Charleston, the most male-oriented occupations are Cleaning & Maintenance (100.0%), Healthcare Support (66.7%), and Security & Protection (50.0%), while the most female-oriented occupations are Food Preparation & Serving (75.0%), Security & Protection (50.0%), and Firefighting & Prevention (50.0%).

| Occupation | Male | Female |
| Healthcare Support | 4 (66.7%) | 2 (33.3%) |
| Security & Protection | 6 (50.0%) | 6 (50.0%) |
| Firefighting & Prevention | 6 (50.0%) | 6 (50.0%) |
| Law Enforcement | 0 (0.0%) | 0 (0.0%) |
| Food Preparation & Serving | 1 (25.0%) | 3 (75.0%) |
| Cleaning & Maintenance | 4 (100.0%) | 0 (0.0%) |
| Personal Care & Service | 0 (0.0%) | 0 (0.0%) |
| Total (Category) | 15 (57.7%) | 11 (42.3%) |
| Total (Overall) | 127 (51.2%) | 121 (48.8%) |
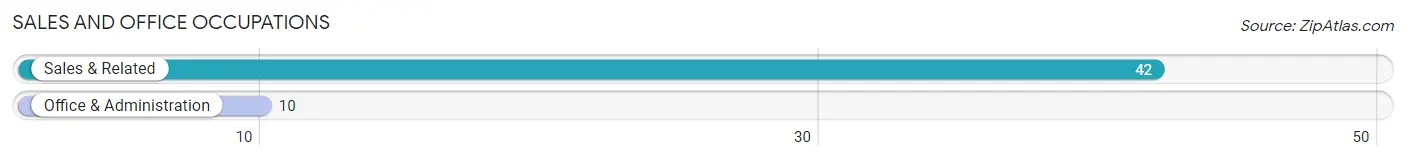
Sales and Office Occupations
The most common Sales and Office occupations in Charleston are Sales & Related (42 | 16.9%), and Office & Administration (10 | 4.0%).
Sales and Office Occupations by Sex
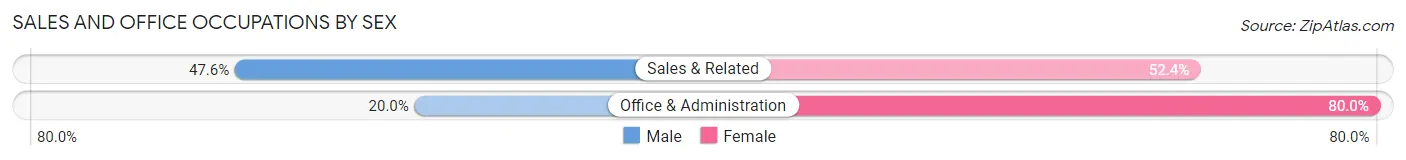
| Occupation | Male | Female |
| Sales & Related | 20 (47.6%) | 22 (52.4%) |
| Office & Administration | 2 (20.0%) | 8 (80.0%) |
| Total (Category) | 22 (42.3%) | 30 (57.7%) |
| Total (Overall) | 127 (51.2%) | 121 (48.8%) |
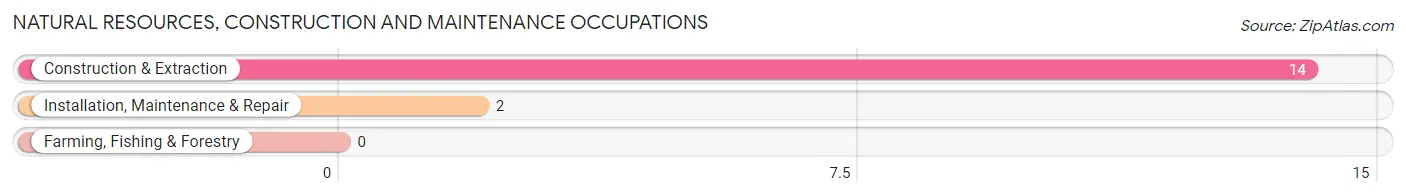
Natural Resources, Construction and Maintenance Occupations
The most common Natural Resources, Construction and Maintenance occupations in Charleston are Construction & Extraction (14 | 5.7%), and Installation, Maintenance & Repair (2 | 0.8%).
Natural Resources, Construction and Maintenance Occupations by Sex
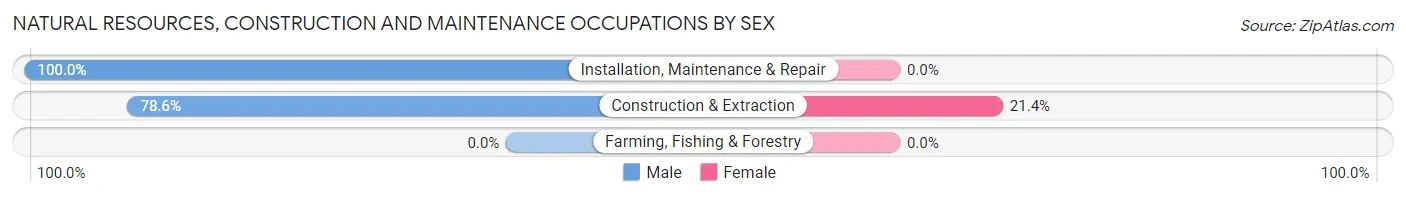
| Occupation | Male | Female |
| Farming, Fishing & Forestry | 0 (0.0%) | 0 (0.0%) |
| Construction & Extraction | 11 (78.6%) | 3 (21.4%) |
| Installation, Maintenance & Repair | 2 (100.0%) | 0 (0.0%) |
| Total (Category) | 13 (81.2%) | 3 (18.8%) |
| Total (Overall) | 127 (51.2%) | 121 (48.8%) |
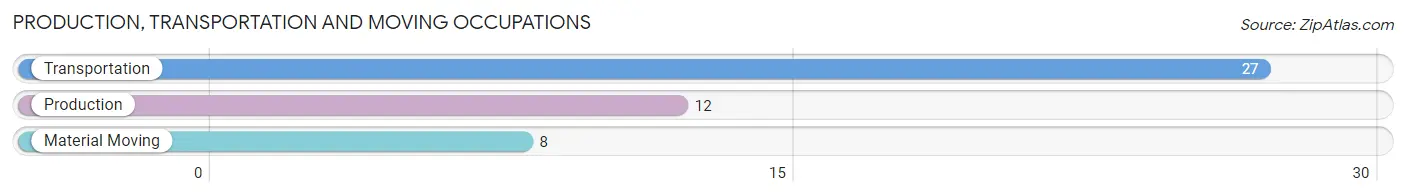
Production, Transportation and Moving Occupations
The most common Production, Transportation and Moving occupations in Charleston are Transportation (27 | 10.9%), Production (12 | 4.8%), and Material Moving (8 | 3.2%).
Production, Transportation and Moving Occupations by Sex
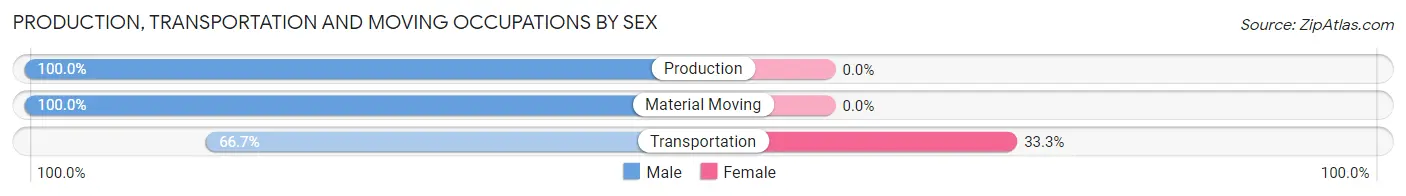
| Occupation | Male | Female |
| Production | 12 (100.0%) | 0 (0.0%) |
| Transportation | 18 (66.7%) | 9 (33.3%) |
| Material Moving | 8 (100.0%) | 0 (0.0%) |
| Total (Category) | 38 (80.8%) | 9 (19.2%) |
| Total (Overall) | 127 (51.2%) | 121 (48.8%) |
Employment Industries by Sex in Charleston
Employment Industries in Charleston
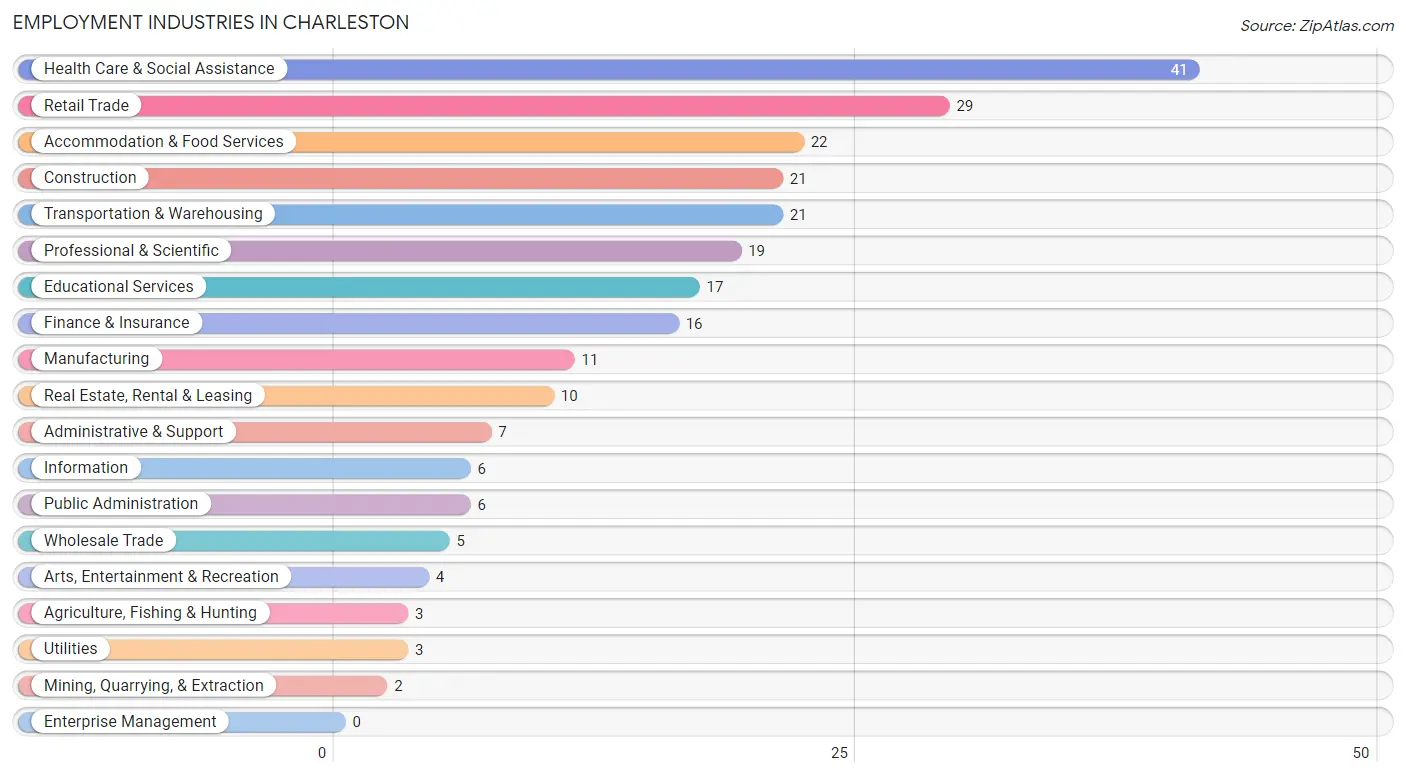
The major employment industries in Charleston include Health Care & Social Assistance (41 | 16.5%), Retail Trade (29 | 11.7%), Accommodation & Food Services (22 | 8.9%), Construction (21 | 8.5%), and Transportation & Warehousing (21 | 8.5%).
Employment Industries by Sex in Charleston
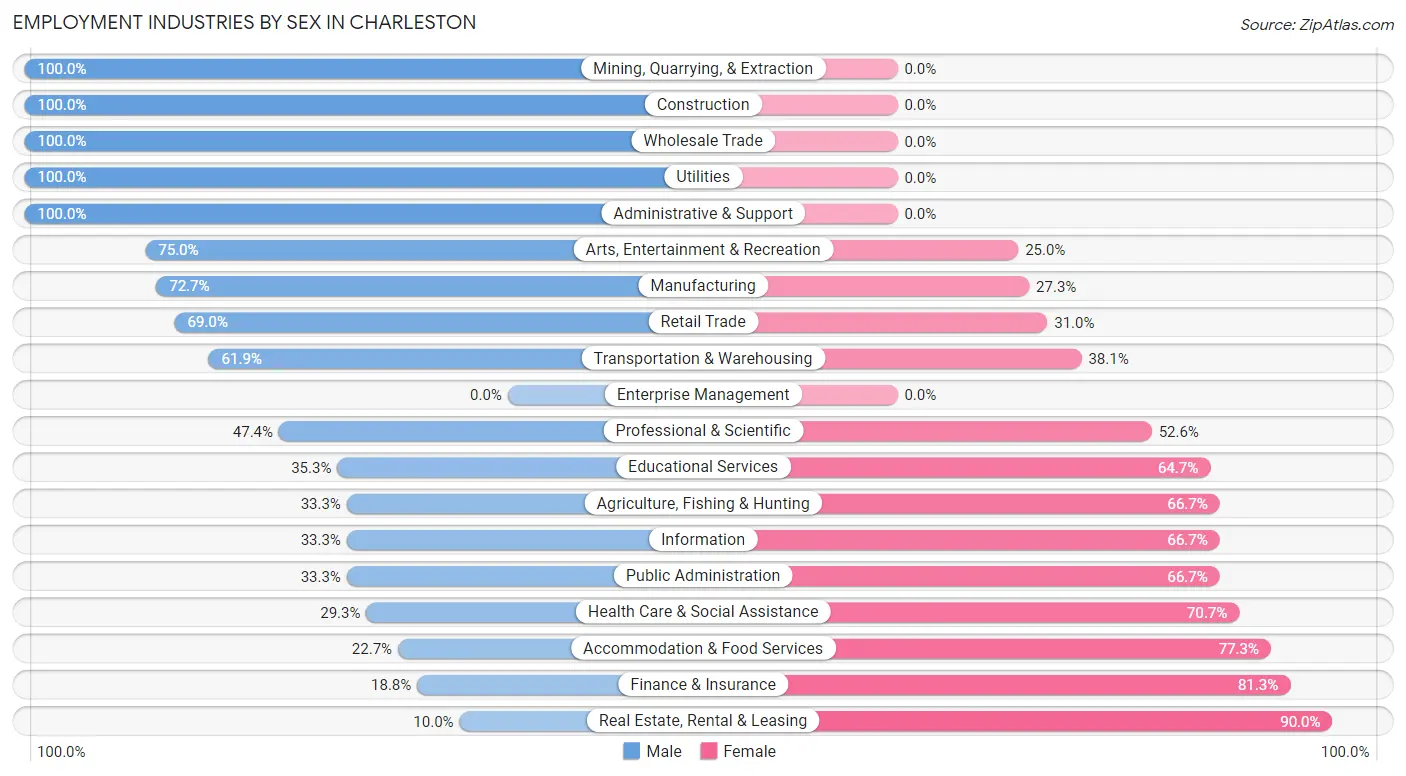
The Charleston industries that see more men than women are Mining, Quarrying, & Extraction (100.0%), Construction (100.0%), and Wholesale Trade (100.0%), whereas the industries that tend to have a higher number of women are Real Estate, Rental & Leasing (90.0%), Finance & Insurance (81.2%), and Accommodation & Food Services (77.3%).
| Industry | Male | Female |
| Agriculture, Fishing & Hunting | 1 (33.3%) | 2 (66.7%) |
| Mining, Quarrying, & Extraction | 2 (100.0%) | 0 (0.0%) |
| Construction | 21 (100.0%) | 0 (0.0%) |
| Manufacturing | 8 (72.7%) | 3 (27.3%) |
| Wholesale Trade | 5 (100.0%) | 0 (0.0%) |
| Retail Trade | 20 (69.0%) | 9 (31.0%) |
| Transportation & Warehousing | 13 (61.9%) | 8 (38.1%) |
| Utilities | 3 (100.0%) | 0 (0.0%) |
| Information | 2 (33.3%) | 4 (66.7%) |
| Finance & Insurance | 3 (18.8%) | 13 (81.2%) |
| Real Estate, Rental & Leasing | 1 (10.0%) | 9 (90.0%) |
| Professional & Scientific | 9 (47.4%) | 10 (52.6%) |
| Enterprise Management | 0 (0.0%) | 0 (0.0%) |
| Administrative & Support | 7 (100.0%) | 0 (0.0%) |
| Educational Services | 6 (35.3%) | 11 (64.7%) |
| Health Care & Social Assistance | 12 (29.3%) | 29 (70.7%) |
| Arts, Entertainment & Recreation | 3 (75.0%) | 1 (25.0%) |
| Accommodation & Food Services | 5 (22.7%) | 17 (77.3%) |
| Public Administration | 2 (33.3%) | 4 (66.7%) |
| Total | 127 (51.2%) | 121 (48.8%) |
Education in Charleston
School Enrollment in Charleston
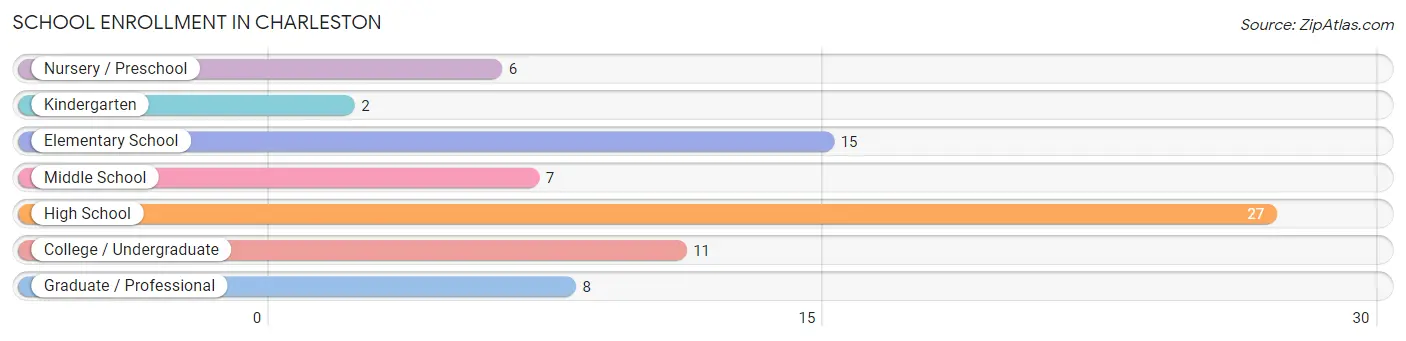
The most common levels of schooling among the 76 students in Charleston are high school (27 | 35.5%), elementary school (15 | 19.7%), and college / undergraduate (11 | 14.5%).
| School Level | # Students | % Students |
| Nursery / Preschool | 6 | 7.9% |
| Kindergarten | 2 | 2.6% |
| Elementary School | 15 | 19.7% |
| Middle School | 7 | 9.2% |
| High School | 27 | 35.5% |
| College / Undergraduate | 11 | 14.5% |
| Graduate / Professional | 8 | 10.5% |
| Total | 76 | 100.0% |
School Enrollment by Age by Funding Source in Charleston
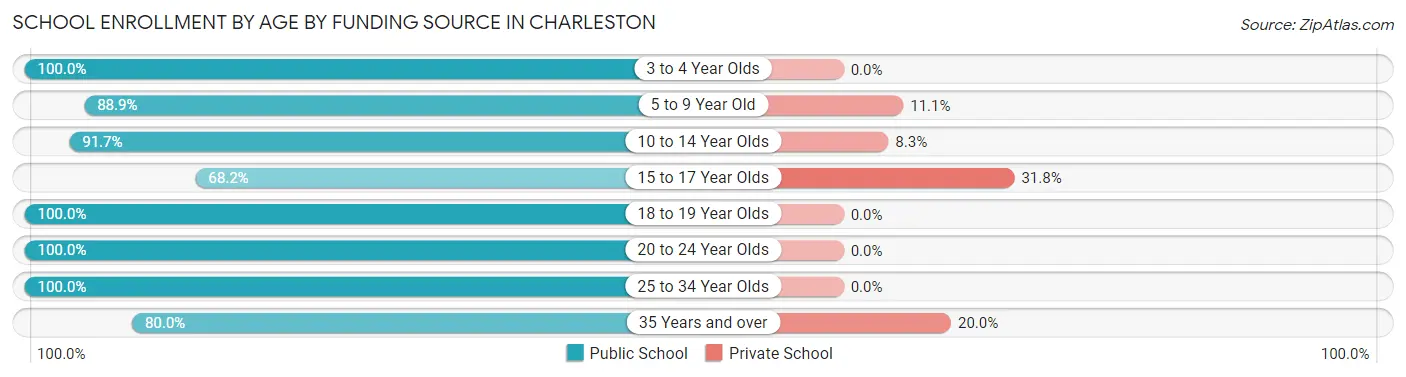
Out of a total of 76 students who are enrolled in schools in Charleston, 11 (14.5%) attend a private institution, while the remaining 65 (85.5%) are enrolled in public schools. The age group of 15 to 17 year olds has the highest likelihood of being enrolled in private schools, with 7 (31.8% in the age bracket) enrolled. Conversely, the age group of 3 to 4 year olds has the lowest likelihood of being enrolled in a private school, with 5 (100.0% in the age bracket) attending a public institution.
| Age Bracket | Public School | Private School |
| 3 to 4 Year Olds | 5 (100.0%) | 0 (0.0%) |
| 5 to 9 Year Old | 16 (88.9%) | 2 (11.1%) |
| 10 to 14 Year Olds | 11 (91.7%) | 1 (8.3%) |
| 15 to 17 Year Olds | 15 (68.2%) | 7 (31.8%) |
| 18 to 19 Year Olds | 2 (100.0%) | 0 (0.0%) |
| 20 to 24 Year Olds | 6 (100.0%) | 0 (0.0%) |
| 25 to 34 Year Olds | 6 (100.0%) | 0 (0.0%) |
| 35 Years and over | 4 (80.0%) | 1 (20.0%) |
| Total | 65 (85.5%) | 11 (14.5%) |
Educational Attainment by Field of Study in Charleston
Education (19 | 17.6%), bio, nature & agricultural (18 | 16.7%), science & technology (17 | 15.7%), business (10 | 9.3%), and literature & languages (9 | 8.3%) are the most common fields of study among 108 individuals in Charleston who have obtained a bachelor's degree or higher.
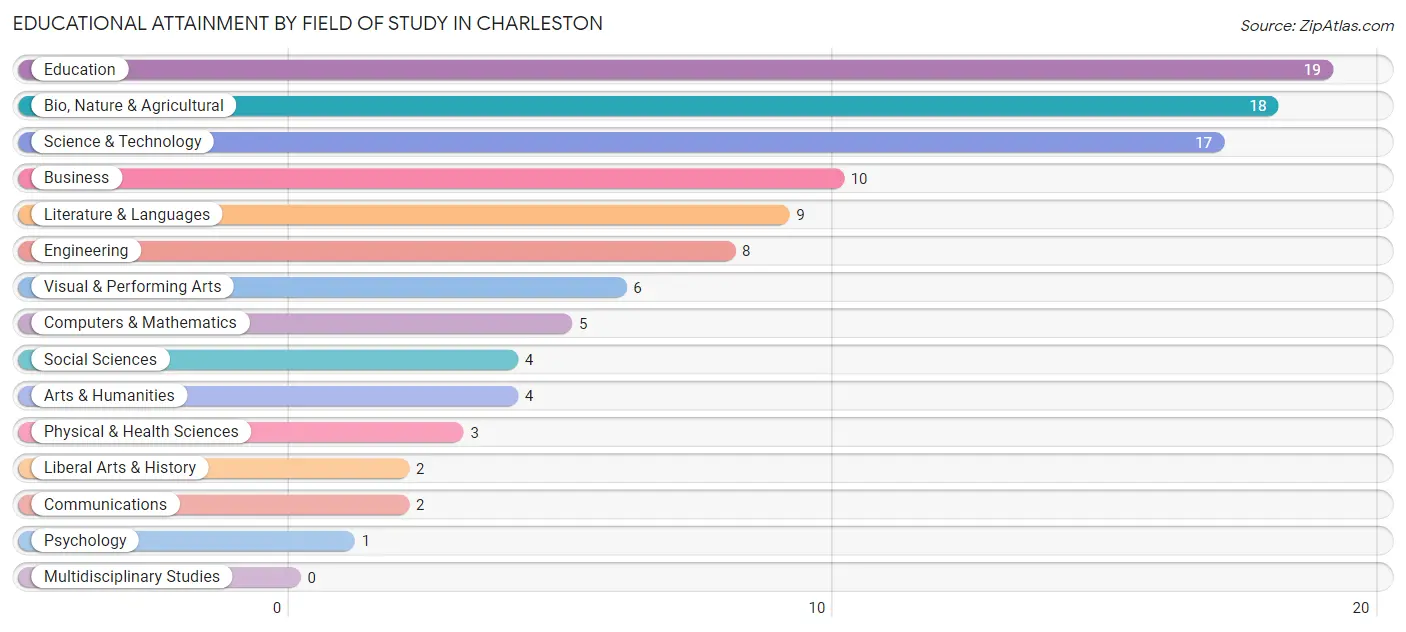
| Field of Study | # Graduates | % Graduates |
| Computers & Mathematics | 5 | 4.6% |
| Bio, Nature & Agricultural | 18 | 16.7% |
| Physical & Health Sciences | 3 | 2.8% |
| Psychology | 1 | 0.9% |
| Social Sciences | 4 | 3.7% |
| Engineering | 8 | 7.4% |
| Multidisciplinary Studies | 0 | 0.0% |
| Science & Technology | 17 | 15.7% |
| Business | 10 | 9.3% |
| Education | 19 | 17.6% |
| Literature & Languages | 9 | 8.3% |
| Liberal Arts & History | 2 | 1.8% |
| Visual & Performing Arts | 6 | 5.6% |
| Communications | 2 | 1.8% |
| Arts & Humanities | 4 | 3.7% |
| Total | 108 | 100.0% |
Transportation & Commute in Charleston
Vehicle Availability by Sex in Charleston
The most prevalent vehicle ownership categories in Charleston are males with 3 vehicles (39, accounting for 32.0%) and females with 3 vehicles (39, making up 32.8%).
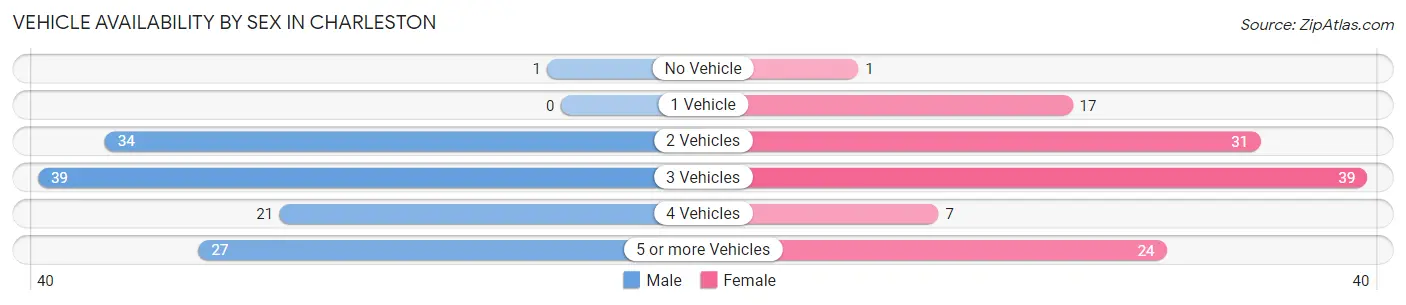
| Vehicles Available | Male | Female |
| No Vehicle | 1 (0.8%) | 1 (0.8%) |
| 1 Vehicle | 0 (0.0%) | 17 (14.3%) |
| 2 Vehicles | 34 (27.9%) | 31 (26.1%) |
| 3 Vehicles | 39 (32.0%) | 39 (32.8%) |
| 4 Vehicles | 21 (17.2%) | 7 (5.9%) |
| 5 or more Vehicles | 27 (22.1%) | 24 (20.2%) |
| Total | 122 (100.0%) | 119 (100.0%) |
Commute Time in Charleston
The most frequently occuring commute durations in Charleston are 30 to 34 minutes (58 commuters, 28.9%), 5 to 9 minutes (34 commuters, 16.9%), and 20 to 24 minutes (20 commuters, 10.0%).
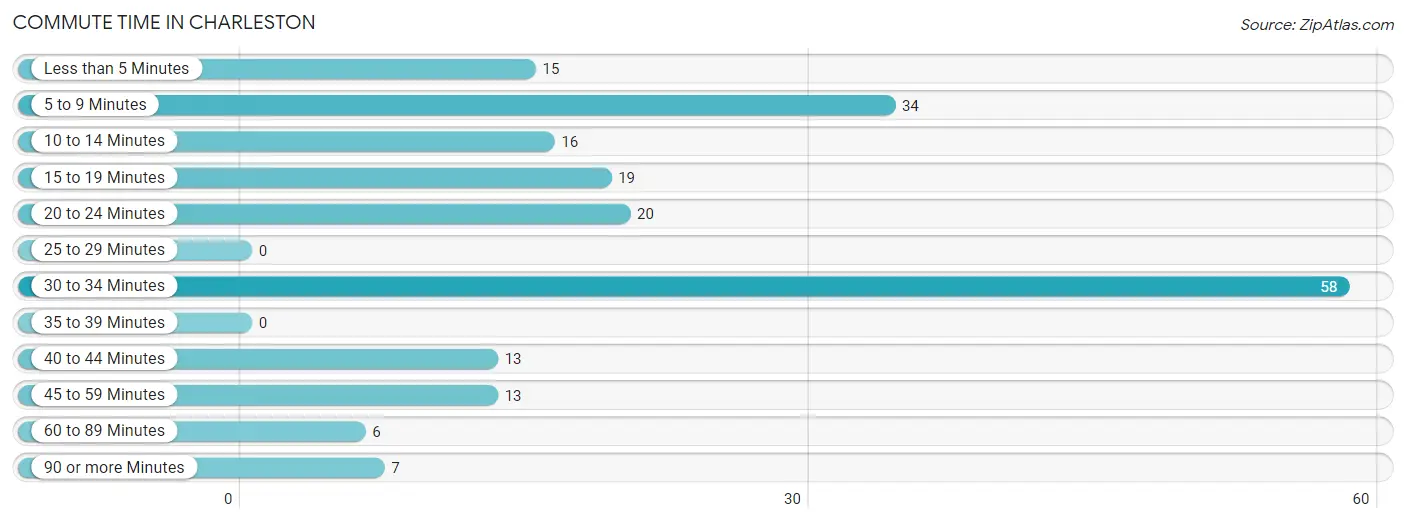
| Commute Time | # Commuters | % Commuters |
| Less than 5 Minutes | 15 | 7.5% |
| 5 to 9 Minutes | 34 | 16.9% |
| 10 to 14 Minutes | 16 | 8.0% |
| 15 to 19 Minutes | 19 | 9.5% |
| 20 to 24 Minutes | 20 | 10.0% |
| 25 to 29 Minutes | 0 | 0.0% |
| 30 to 34 Minutes | 58 | 28.9% |
| 35 to 39 Minutes | 0 | 0.0% |
| 40 to 44 Minutes | 13 | 6.5% |
| 45 to 59 Minutes | 13 | 6.5% |
| 60 to 89 Minutes | 6 | 3.0% |
| 90 or more Minutes | 7 | 3.5% |
Commute Time by Sex in Charleston
The most common commute times in Charleston are 30 to 34 minutes (38 commuters, 35.8%) for males and 30 to 34 minutes (20 commuters, 21.0%) for females.
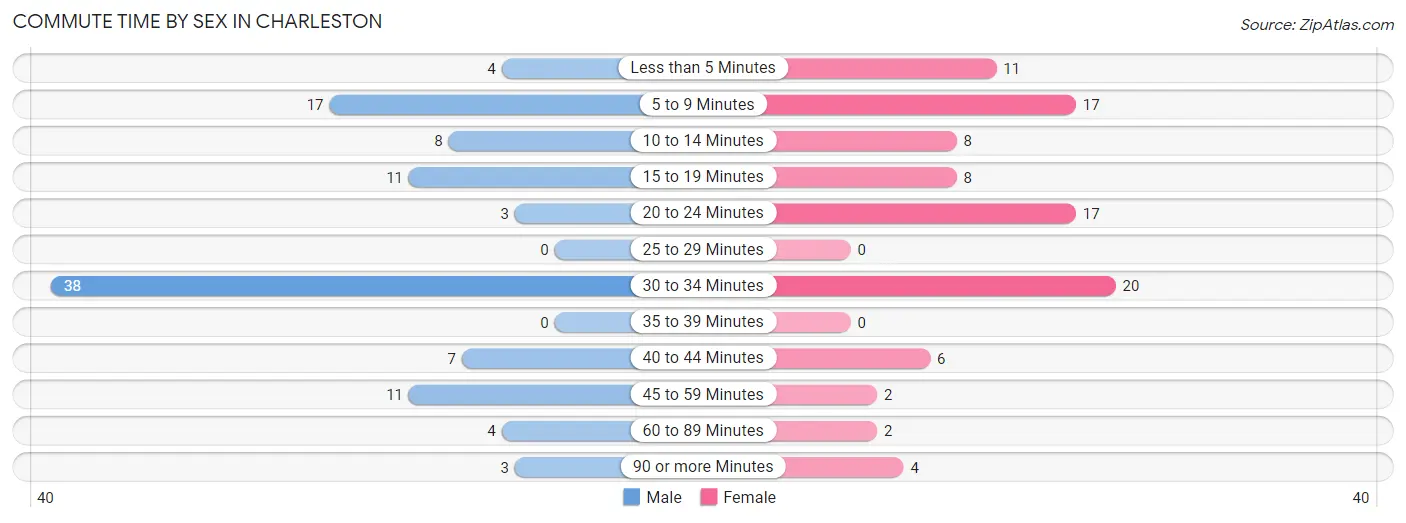
| Commute Time | Male | Female |
| Less than 5 Minutes | 4 (3.8%) | 11 (11.6%) |
| 5 to 9 Minutes | 17 (16.0%) | 17 (17.9%) |
| 10 to 14 Minutes | 8 (7.5%) | 8 (8.4%) |
| 15 to 19 Minutes | 11 (10.4%) | 8 (8.4%) |
| 20 to 24 Minutes | 3 (2.8%) | 17 (17.9%) |
| 25 to 29 Minutes | 0 (0.0%) | 0 (0.0%) |
| 30 to 34 Minutes | 38 (35.8%) | 20 (21.0%) |
| 35 to 39 Minutes | 0 (0.0%) | 0 (0.0%) |
| 40 to 44 Minutes | 7 (6.6%) | 6 (6.3%) |
| 45 to 59 Minutes | 11 (10.4%) | 2 (2.1%) |
| 60 to 89 Minutes | 4 (3.8%) | 2 (2.1%) |
| 90 or more Minutes | 3 (2.8%) | 4 (4.2%) |
Time of Departure to Work by Sex in Charleston
The most frequent times of departure to work in Charleston are 8:00 AM to 8:29 AM (24, 22.6%) for males and 12:00 AM to 4:59 AM (22, 23.2%) for females.
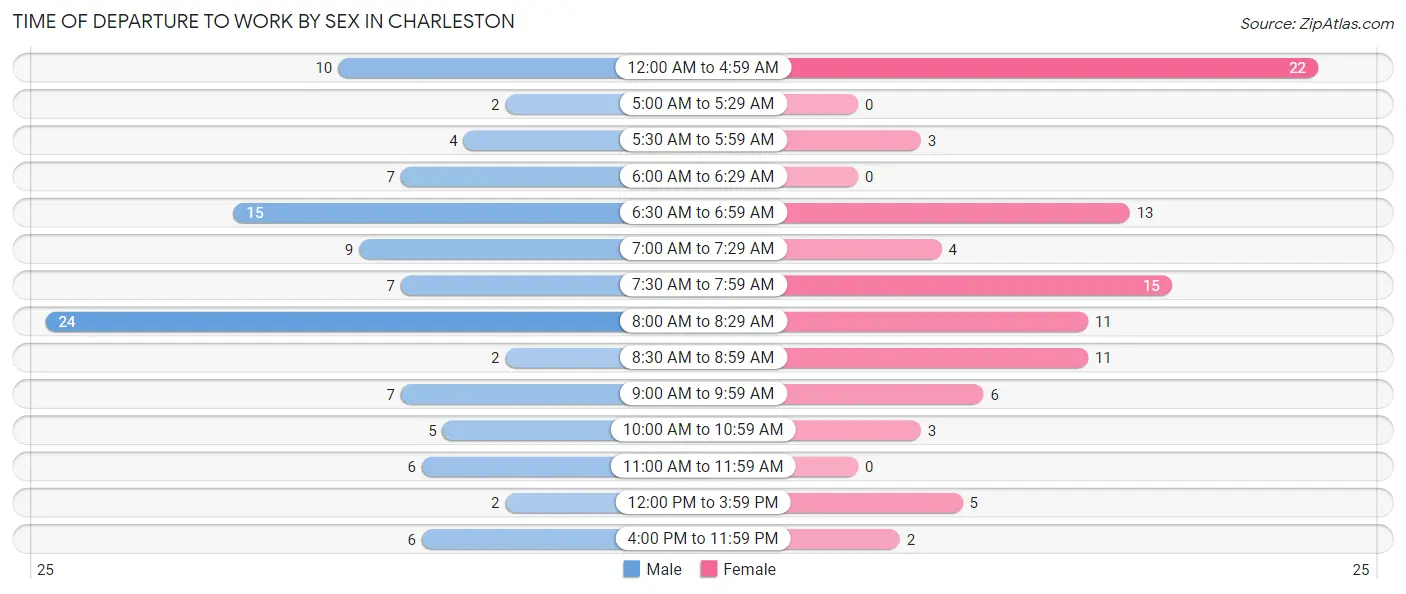
| Time of Departure | Male | Female |
| 12:00 AM to 4:59 AM | 10 (9.4%) | 22 (23.2%) |
| 5:00 AM to 5:29 AM | 2 (1.9%) | 0 (0.0%) |
| 5:30 AM to 5:59 AM | 4 (3.8%) | 3 (3.2%) |
| 6:00 AM to 6:29 AM | 7 (6.6%) | 0 (0.0%) |
| 6:30 AM to 6:59 AM | 15 (14.1%) | 13 (13.7%) |
| 7:00 AM to 7:29 AM | 9 (8.5%) | 4 (4.2%) |
| 7:30 AM to 7:59 AM | 7 (6.6%) | 15 (15.8%) |
| 8:00 AM to 8:29 AM | 24 (22.6%) | 11 (11.6%) |
| 8:30 AM to 8:59 AM | 2 (1.9%) | 11 (11.6%) |
| 9:00 AM to 9:59 AM | 7 (6.6%) | 6 (6.3%) |
| 10:00 AM to 10:59 AM | 5 (4.7%) | 3 (3.2%) |
| 11:00 AM to 11:59 AM | 6 (5.7%) | 0 (0.0%) |
| 12:00 PM to 3:59 PM | 2 (1.9%) | 5 (5.3%) |
| 4:00 PM to 11:59 PM | 6 (5.7%) | 2 (2.1%) |
| Total | 106 (100.0%) | 95 (100.0%) |
Housing Occupancy in Charleston
Occupancy by Ownership in Charleston
Of the total 168 dwellings in Charleston, owner-occupied units account for 134 (79.8%), while renter-occupied units make up 34 (20.2%).
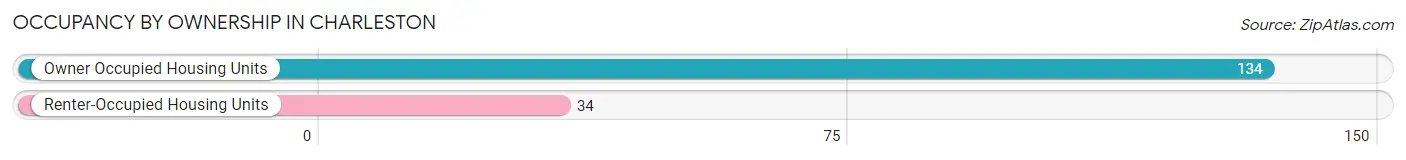
| Occupancy | # Housing Units | % Housing Units |
| Owner Occupied Housing Units | 134 | 79.8% |
| Renter-Occupied Housing Units | 34 | 20.2% |
| Total Occupied Housing Units | 168 | 100.0% |
Occupancy by Household Size in Charleston
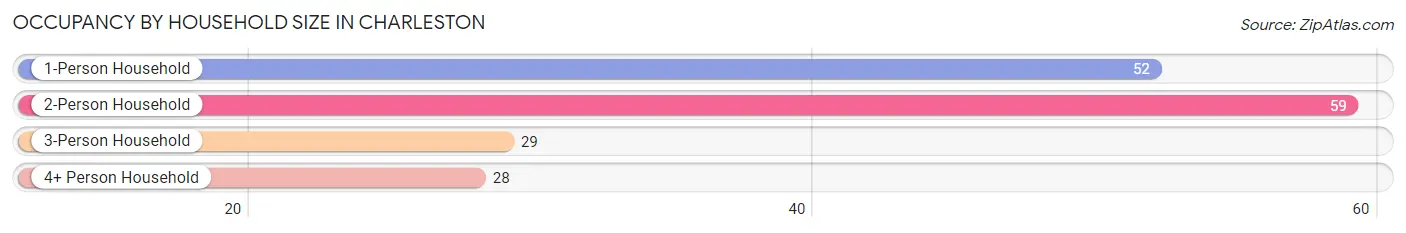
| Household Size | # Housing Units | % Housing Units |
| 1-Person Household | 52 | 30.9% |
| 2-Person Household | 59 | 35.1% |
| 3-Person Household | 29 | 17.3% |
| 4+ Person Household | 28 | 16.7% |
| Total Housing Units | 168 | 100.0% |
Occupancy by Ownership by Household Size in Charleston
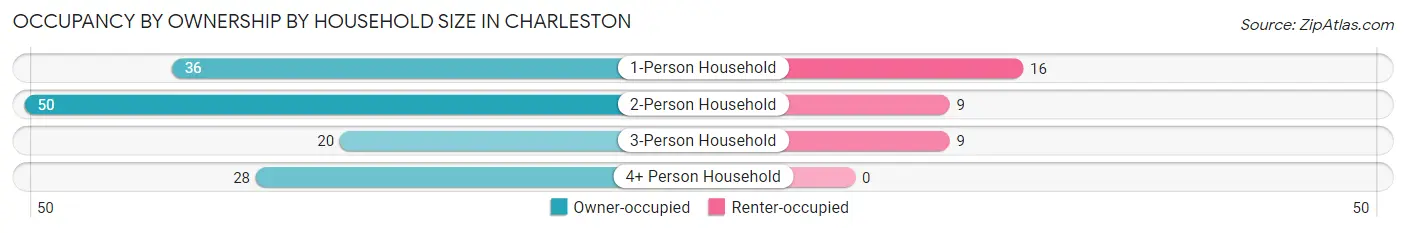
| Household Size | Owner-occupied | Renter-occupied |
| 1-Person Household | 36 (69.2%) | 16 (30.8%) |
| 2-Person Household | 50 (84.8%) | 9 (15.2%) |
| 3-Person Household | 20 (69.0%) | 9 (31.0%) |
| 4+ Person Household | 28 (100.0%) | 0 (0.0%) |
| Total Housing Units | 134 (79.8%) | 34 (20.2%) |
Occupancy by Educational Attainment in Charleston
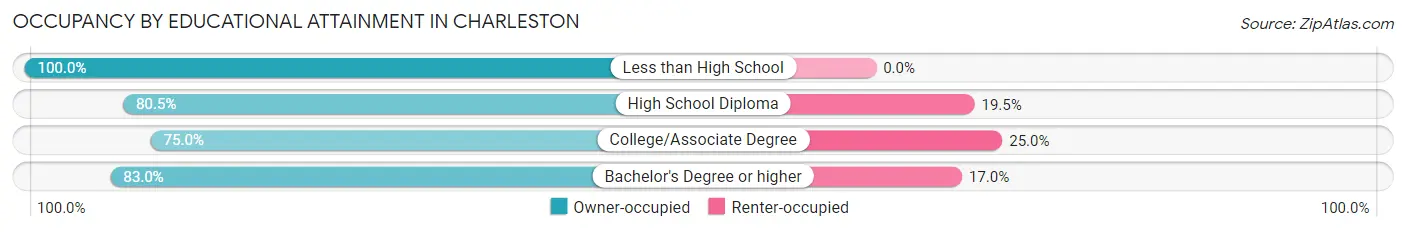
| Household Size | Owner-occupied | Renter-occupied |
| Less than High School | 8 (100.0%) | 0 (0.0%) |
| High School Diploma | 33 (80.5%) | 8 (19.5%) |
| College/Associate Degree | 54 (75.0%) | 18 (25.0%) |
| Bachelor's Degree or higher | 39 (83.0%) | 8 (17.0%) |
Occupancy by Age of Householder in Charleston
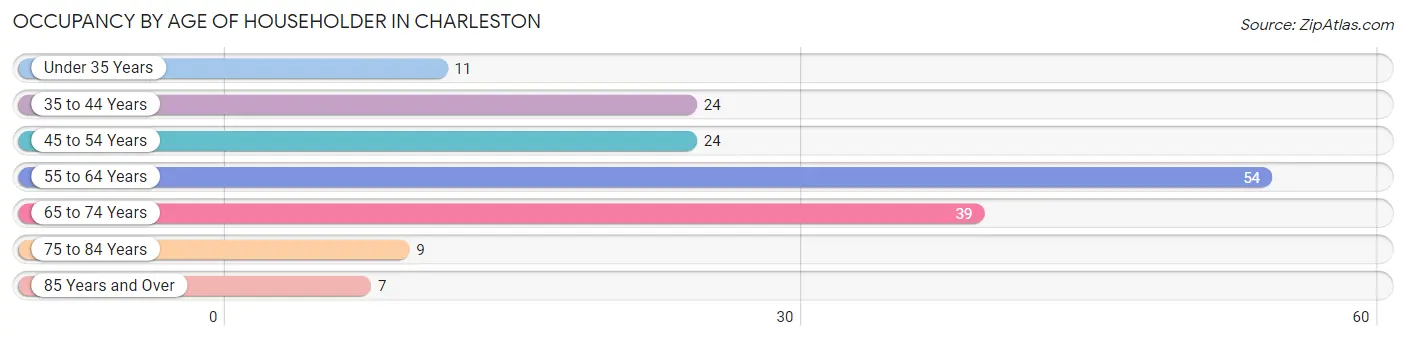
| Age Bracket | # Households | % Households |
| Under 35 Years | 11 | 6.6% |
| 35 to 44 Years | 24 | 14.3% |
| 45 to 54 Years | 24 | 14.3% |
| 55 to 64 Years | 54 | 32.1% |
| 65 to 74 Years | 39 | 23.2% |
| 75 to 84 Years | 9 | 5.4% |
| 85 Years and Over | 7 | 4.2% |
| Total | 168 | 100.0% |
Housing Finances in Charleston
Median Income by Occupancy in Charleston
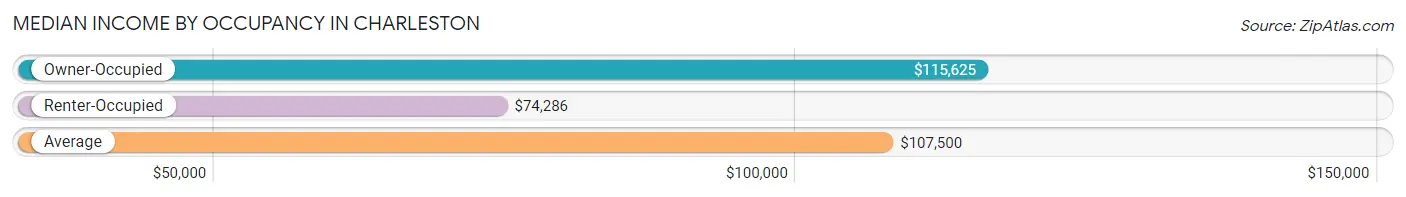
| Occupancy Type | # Households | Median Income |
| Owner-Occupied | 134 (79.8%) | $115,625 |
| Renter-Occupied | 34 (20.2%) | $74,286 |
| Average | 168 (100.0%) | $107,500 |
Occupancy by Householder Income Bracket in Charleston
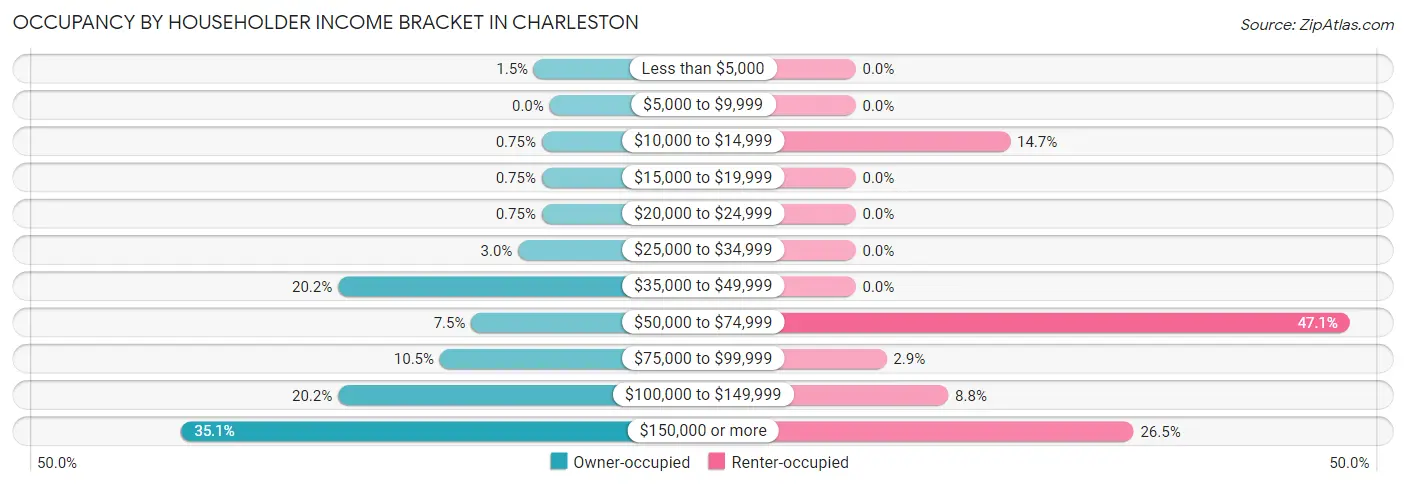
| Income Bracket | Owner-occupied | Renter-occupied |
| Less than $5,000 | 2 (1.5%) | 0 (0.0%) |
| $5,000 to $9,999 | 0 (0.0%) | 0 (0.0%) |
| $10,000 to $14,999 | 1 (0.7%) | 5 (14.7%) |
| $15,000 to $19,999 | 1 (0.7%) | 0 (0.0%) |
| $20,000 to $24,999 | 1 (0.7%) | 0 (0.0%) |
| $25,000 to $34,999 | 4 (3.0%) | 0 (0.0%) |
| $35,000 to $49,999 | 27 (20.2%) | 0 (0.0%) |
| $50,000 to $74,999 | 10 (7.5%) | 16 (47.1%) |
| $75,000 to $99,999 | 14 (10.4%) | 1 (2.9%) |
| $100,000 to $149,999 | 27 (20.2%) | 3 (8.8%) |
| $150,000 or more | 47 (35.1%) | 9 (26.5%) |
| Total | 134 (100.0%) | 34 (100.0%) |
Monthly Housing Cost Tiers in Charleston
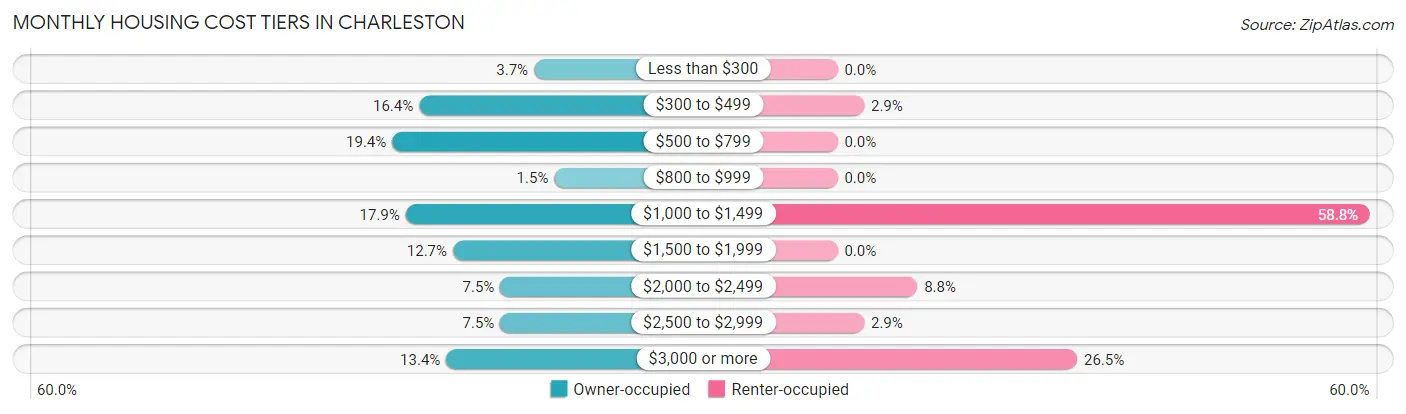
| Monthly Cost | Owner-occupied | Renter-occupied |
| Less than $300 | 5 (3.7%) | 0 (0.0%) |
| $300 to $499 | 22 (16.4%) | 1 (2.9%) |
| $500 to $799 | 26 (19.4%) | 0 (0.0%) |
| $800 to $999 | 2 (1.5%) | 0 (0.0%) |
| $1,000 to $1,499 | 24 (17.9%) | 20 (58.8%) |
| $1,500 to $1,999 | 17 (12.7%) | 0 (0.0%) |
| $2,000 to $2,499 | 10 (7.5%) | 3 (8.8%) |
| $2,500 to $2,999 | 10 (7.5%) | 1 (2.9%) |
| $3,000 or more | 18 (13.4%) | 9 (26.5%) |
| Total | 134 (100.0%) | 34 (100.0%) |
Physical Housing Characteristics in Charleston
Housing Structures in Charleston
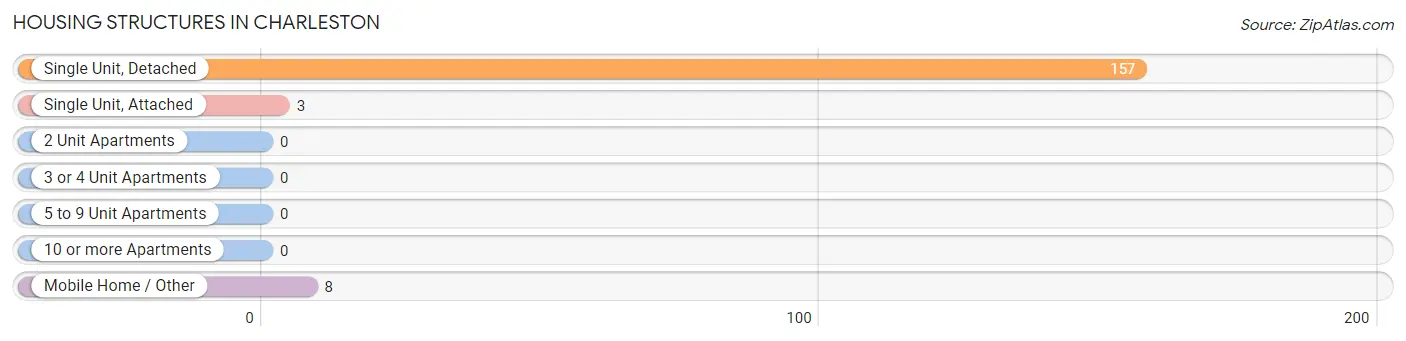
| Structure Type | # Housing Units | % Housing Units |
| Single Unit, Detached | 157 | 93.4% |
| Single Unit, Attached | 3 | 1.8% |
| 2 Unit Apartments | 0 | 0.0% |
| 3 or 4 Unit Apartments | 0 | 0.0% |
| 5 to 9 Unit Apartments | 0 | 0.0% |
| 10 or more Apartments | 0 | 0.0% |
| Mobile Home / Other | 8 | 4.8% |
| Total | 168 | 100.0% |
Housing Structures by Occupancy in Charleston
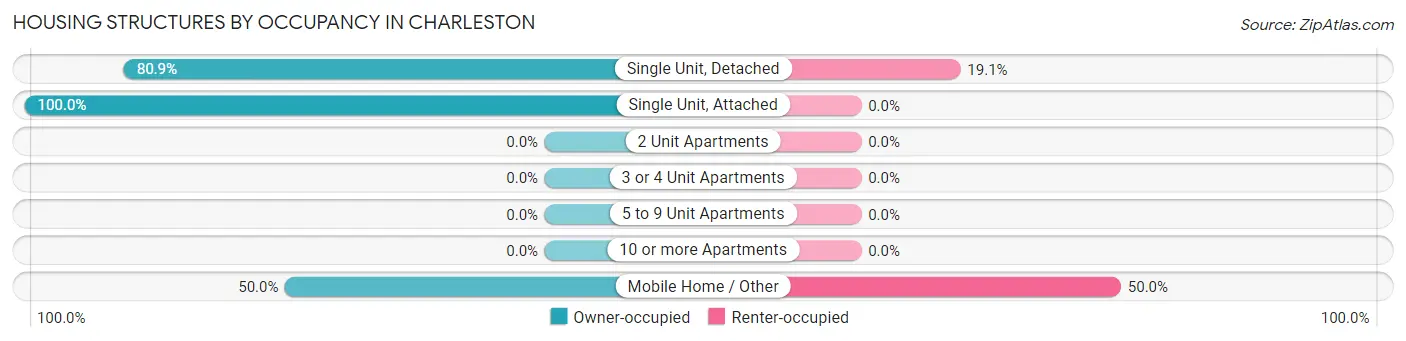
| Structure Type | Owner-occupied | Renter-occupied |
| Single Unit, Detached | 127 (80.9%) | 30 (19.1%) |
| Single Unit, Attached | 3 (100.0%) | 0 (0.0%) |
| 2 Unit Apartments | 0 (0.0%) | 0 (0.0%) |
| 3 or 4 Unit Apartments | 0 (0.0%) | 0 (0.0%) |
| 5 to 9 Unit Apartments | 0 (0.0%) | 0 (0.0%) |
| 10 or more Apartments | 0 (0.0%) | 0 (0.0%) |
| Mobile Home / Other | 4 (50.0%) | 4 (50.0%) |
| Total | 134 (79.8%) | 34 (20.2%) |
Housing Structures by Number of Rooms in Charleston
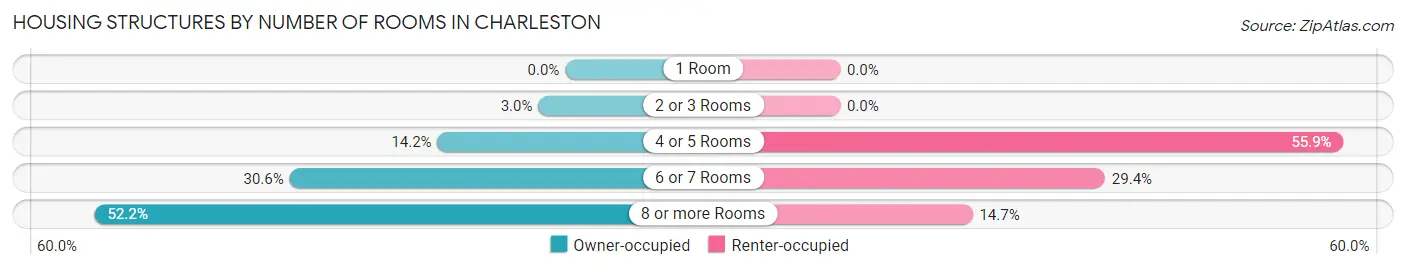
| Number of Rooms | Owner-occupied | Renter-occupied |
| 1 Room | 0 (0.0%) | 0 (0.0%) |
| 2 or 3 Rooms | 4 (3.0%) | 0 (0.0%) |
| 4 or 5 Rooms | 19 (14.2%) | 19 (55.9%) |
| 6 or 7 Rooms | 41 (30.6%) | 10 (29.4%) |
| 8 or more Rooms | 70 (52.2%) | 5 (14.7%) |
| Total | 134 (100.0%) | 34 (100.0%) |
Housing Structure by Heating Type in Charleston
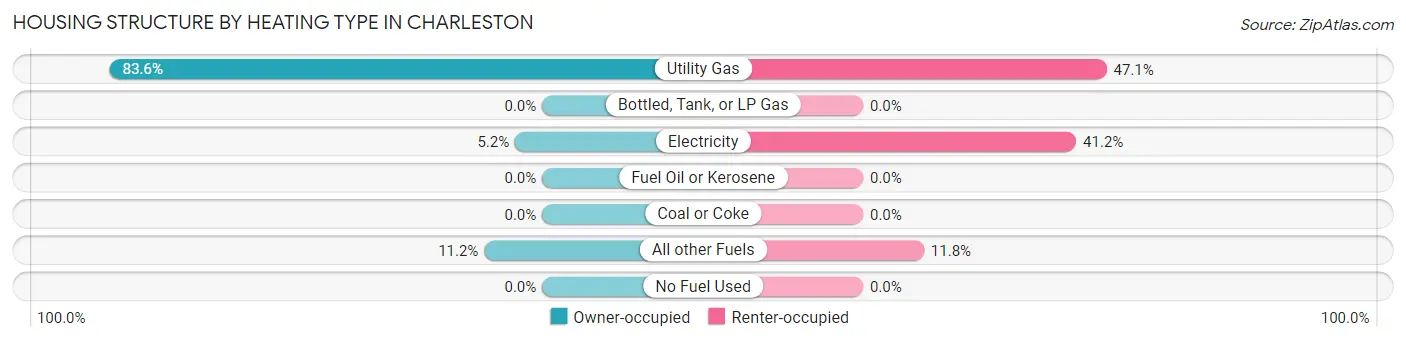
| Heating Type | Owner-occupied | Renter-occupied |
| Utility Gas | 112 (83.6%) | 16 (47.1%) |
| Bottled, Tank, or LP Gas | 0 (0.0%) | 0 (0.0%) |
| Electricity | 7 (5.2%) | 14 (41.2%) |
| Fuel Oil or Kerosene | 0 (0.0%) | 0 (0.0%) |
| Coal or Coke | 0 (0.0%) | 0 (0.0%) |
| All other Fuels | 15 (11.2%) | 4 (11.8%) |
| No Fuel Used | 0 (0.0%) | 0 (0.0%) |
| Total | 134 (100.0%) | 34 (100.0%) |
Household Vehicle Usage in Charleston
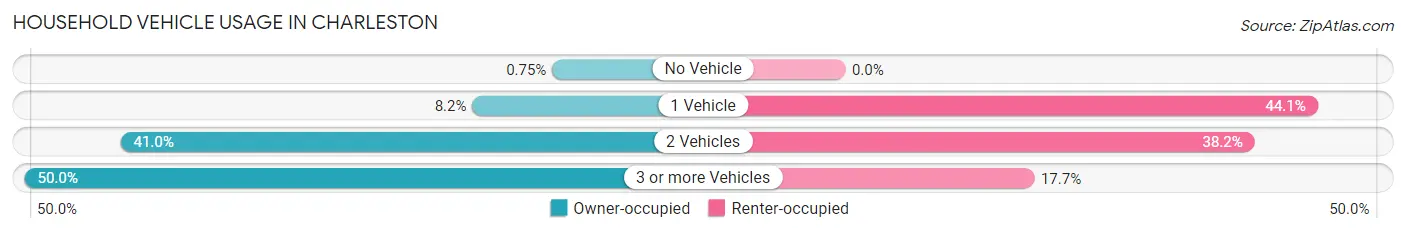
| Vehicles per Household | Owner-occupied | Renter-occupied |
| No Vehicle | 1 (0.7%) | 0 (0.0%) |
| 1 Vehicle | 11 (8.2%) | 15 (44.1%) |
| 2 Vehicles | 55 (41.0%) | 13 (38.2%) |
| 3 or more Vehicles | 67 (50.0%) | 6 (17.6%) |
| Total | 134 (100.0%) | 34 (100.0%) |
Real Estate & Mortgages in Charleston
Real Estate and Mortgage Overview in Charleston
| Characteristic | Without Mortgage | With Mortgage |
| Housing Units | 59 | 75 |
| Median Property Value | $741,100 | $541,700 |
| Median Household Income | $81,875 | $34 |
| Monthly Housing Costs | $603 | $18 |
| Real Estate Taxes | $3,227 | $0 |
Property Value by Mortgage Status in Charleston
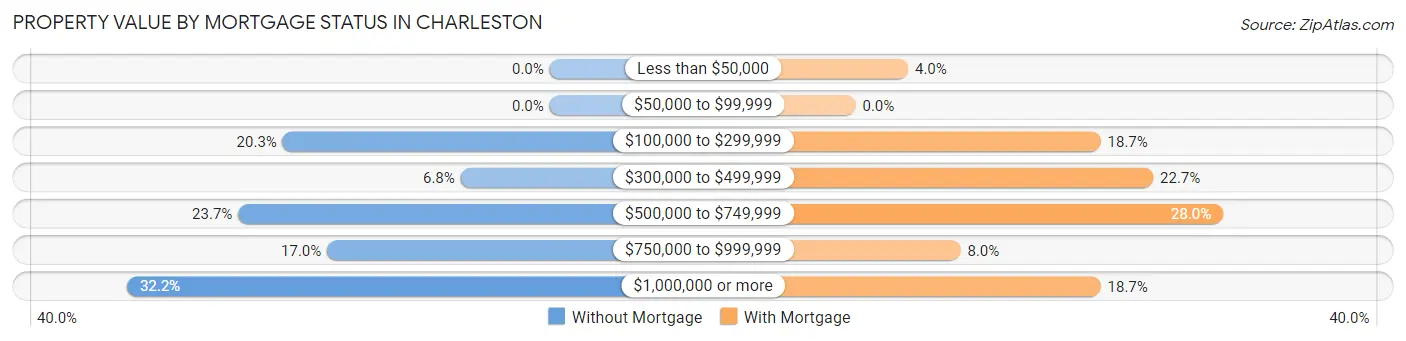
| Property Value | Without Mortgage | With Mortgage |
| Less than $50,000 | 0 (0.0%) | 3 (4.0%) |
| $50,000 to $99,999 | 0 (0.0%) | 0 (0.0%) |
| $100,000 to $299,999 | 12 (20.3%) | 14 (18.7%) |
| $300,000 to $499,999 | 4 (6.8%) | 17 (22.7%) |
| $500,000 to $749,999 | 14 (23.7%) | 21 (28.0%) |
| $750,000 to $999,999 | 10 (17.0%) | 6 (8.0%) |
| $1,000,000 or more | 19 (32.2%) | 14 (18.7%) |
| Total | 59 (100.0%) | 75 (100.0%) |
Household Income by Mortgage Status in Charleston
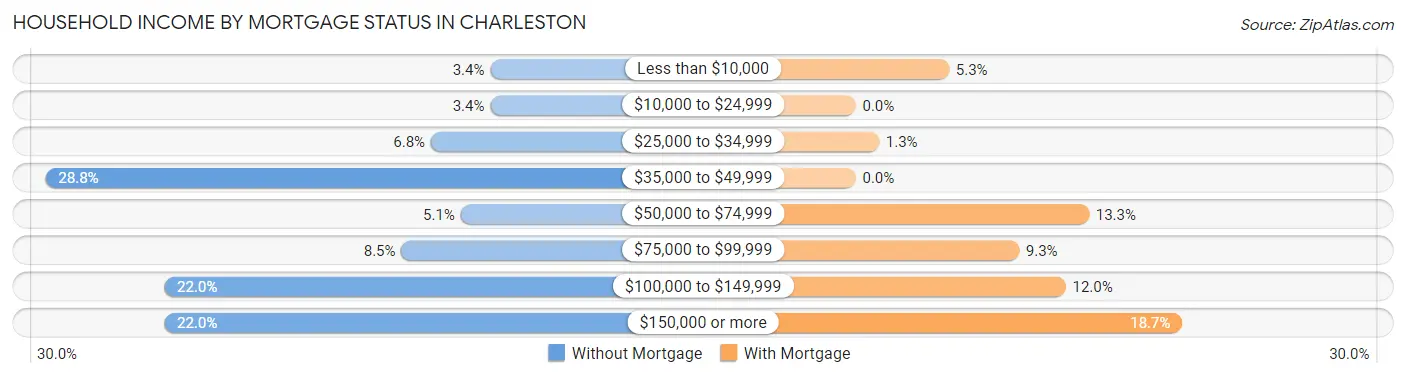
| Household Income | Without Mortgage | With Mortgage |
| Less than $10,000 | 2 (3.4%) | 4 (5.3%) |
| $10,000 to $24,999 | 2 (3.4%) | 0 (0.0%) |
| $25,000 to $34,999 | 4 (6.8%) | 1 (1.3%) |
| $35,000 to $49,999 | 17 (28.8%) | 0 (0.0%) |
| $50,000 to $74,999 | 3 (5.1%) | 10 (13.3%) |
| $75,000 to $99,999 | 5 (8.5%) | 7 (9.3%) |
| $100,000 to $149,999 | 13 (22.0%) | 9 (12.0%) |
| $150,000 or more | 13 (22.0%) | 14 (18.7%) |
| Total | 59 (100.0%) | 75 (100.0%) |
Property Value to Household Income Ratio in Charleston
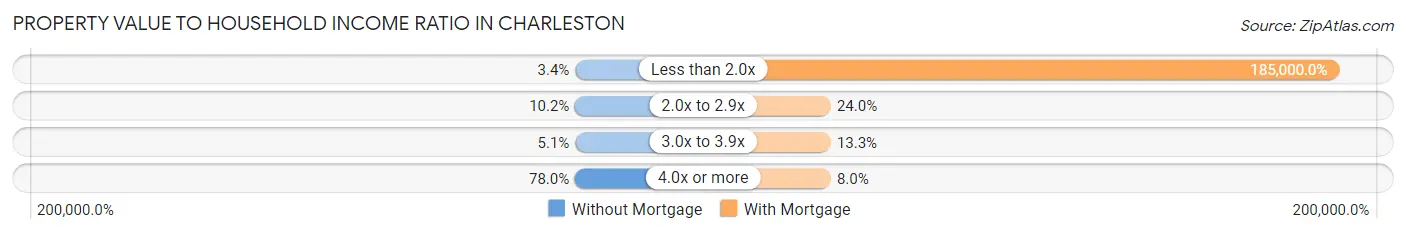
| Value-to-Income Ratio | Without Mortgage | With Mortgage |
| Less than 2.0x | 2 (3.4%) | 138,750 (185,000.0%) |
| 2.0x to 2.9x | 6 (10.2%) | 18 (24.0%) |
| 3.0x to 3.9x | 3 (5.1%) | 10 (13.3%) |
| 4.0x or more | 46 (78.0%) | 6 (8.0%) |
| Total | 59 (100.0%) | 75 (100.0%) |
Real Estate Taxes by Mortgage Status in Charleston
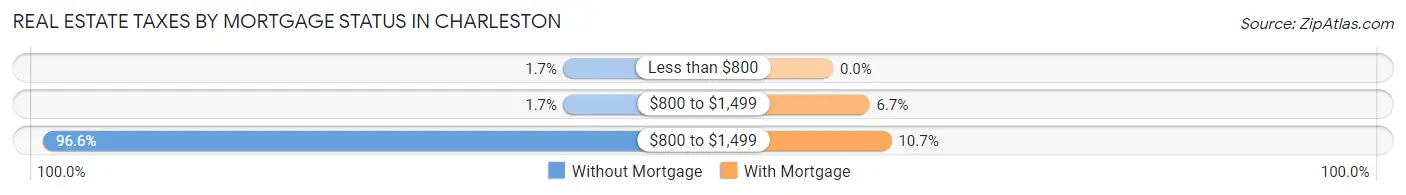
| Property Taxes | Without Mortgage | With Mortgage |
| Less than $800 | 1 (1.7%) | 0 (0.0%) |
| $800 to $1,499 | 1 (1.7%) | 5 (6.7%) |
| $800 to $1,499 | 57 (96.6%) | 8 (10.7%) |
| Total | 59 (100.0%) | 75 (100.0%) |
Health & Disability in Charleston
Health Insurance Coverage by Age in Charleston
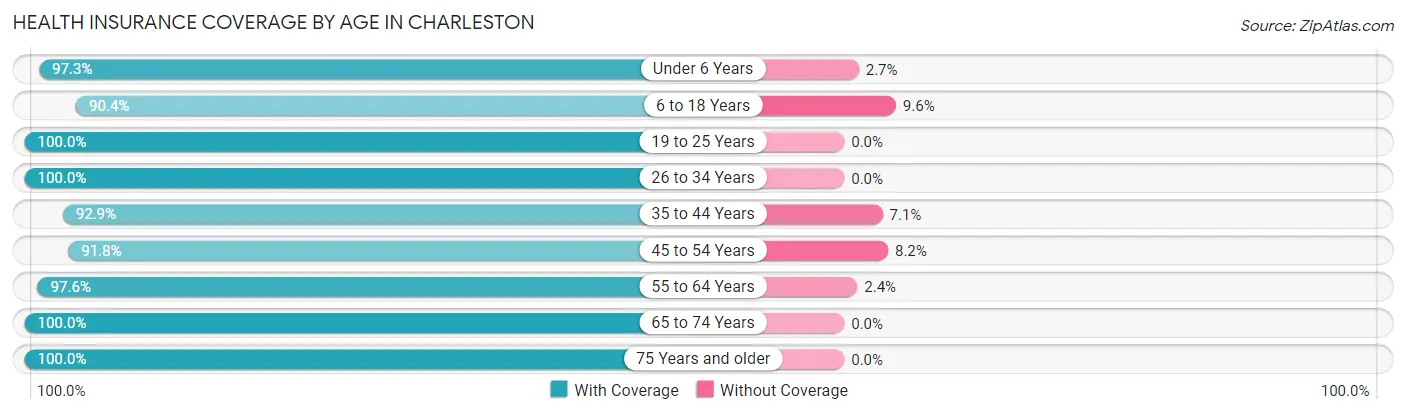
| Age Bracket | With Coverage | Without Coverage |
| Under 6 Years | 36 (97.3%) | 1 (2.7%) |
| 6 to 18 Years | 47 (90.4%) | 5 (9.6%) |
| 19 to 25 Years | 27 (100.0%) | 0 (0.0%) |
| 26 to 34 Years | 60 (100.0%) | 0 (0.0%) |
| 35 to 44 Years | 39 (92.9%) | 3 (7.1%) |
| 45 to 54 Years | 45 (91.8%) | 4 (8.2%) |
| 55 to 64 Years | 80 (97.6%) | 2 (2.4%) |
| 65 to 74 Years | 64 (100.0%) | 0 (0.0%) |
| 75 Years and older | 25 (100.0%) | 0 (0.0%) |
| Total | 423 (96.6%) | 15 (3.4%) |
Health Insurance Coverage by Citizenship Status in Charleston
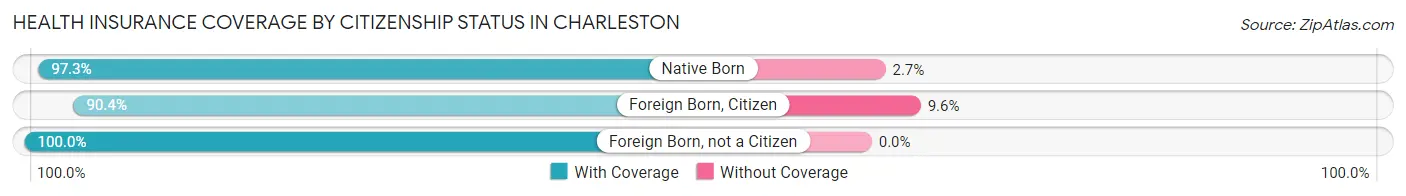
| Citizenship Status | With Coverage | Without Coverage |
| Native Born | 36 (97.3%) | 1 (2.7%) |
| Foreign Born, Citizen | 47 (90.4%) | 5 (9.6%) |
| Foreign Born, not a Citizen | 27 (100.0%) | 0 (0.0%) |
Health Insurance Coverage by Household Income in Charleston
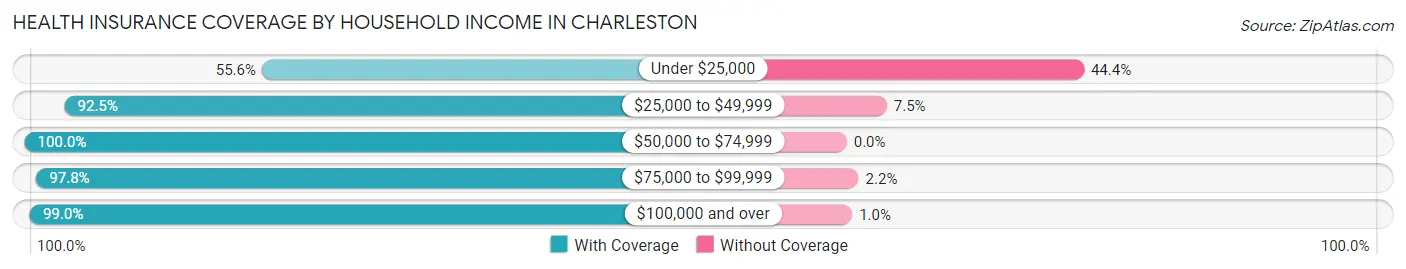
| Household Income | With Coverage | Without Coverage |
| Under $25,000 | 10 (55.6%) | 8 (44.4%) |
| $25,000 to $49,999 | 37 (92.5%) | 3 (7.5%) |
| $50,000 to $74,999 | 42 (100.0%) | 0 (0.0%) |
| $75,000 to $99,999 | 44 (97.8%) | 1 (2.2%) |
| $100,000 and over | 290 (99.0%) | 3 (1.0%) |
Public vs Private Health Insurance Coverage by Age in Charleston
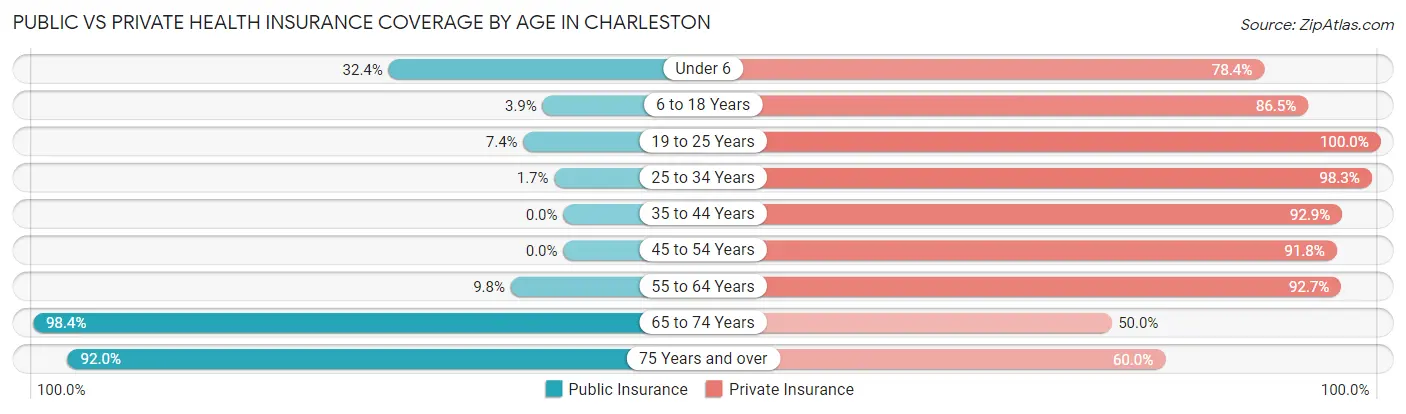
| Age Bracket | Public Insurance | Private Insurance |
| Under 6 | 12 (32.4%) | 29 (78.4%) |
| 6 to 18 Years | 2 (3.8%) | 45 (86.5%) |
| 19 to 25 Years | 2 (7.4%) | 27 (100.0%) |
| 25 to 34 Years | 1 (1.7%) | 59 (98.3%) |
| 35 to 44 Years | 0 (0.0%) | 39 (92.9%) |
| 45 to 54 Years | 0 (0.0%) | 45 (91.8%) |
| 55 to 64 Years | 8 (9.8%) | 76 (92.7%) |
| 65 to 74 Years | 63 (98.4%) | 32 (50.0%) |
| 75 Years and over | 23 (92.0%) | 15 (60.0%) |
| Total | 111 (25.3%) | 367 (83.8%) |
Disability Status by Sex by Age in Charleston
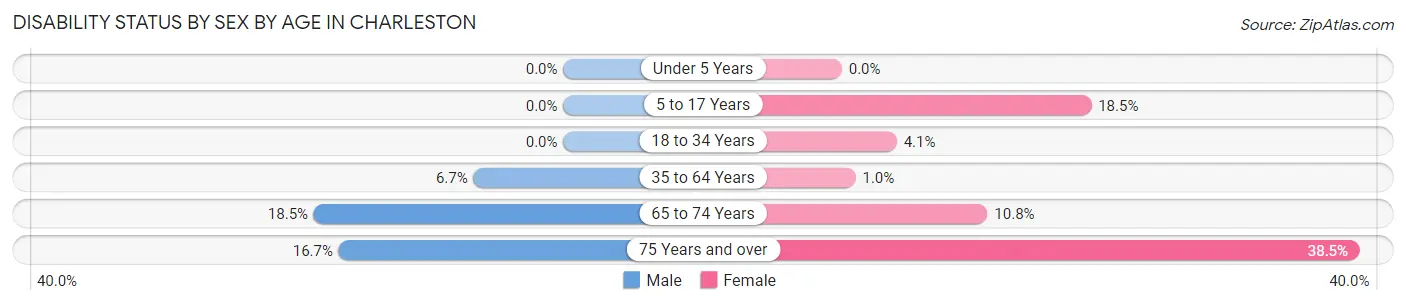
| Age Bracket | Male | Female |
| Under 5 Years | 0 (0.0%) | 0 (0.0%) |
| 5 to 17 Years | 0 (0.0%) | 5 (18.5%) |
| 18 to 34 Years | 0 (0.0%) | 2 (4.1%) |
| 35 to 64 Years | 5 (6.7%) | 1 (1.0%) |
| 65 to 74 Years | 5 (18.5%) | 4 (10.8%) |
| 75 Years and over | 2 (16.7%) | 5 (38.5%) |
Disability Class by Sex by Age in Charleston
Disability Class: Hearing Difficulty
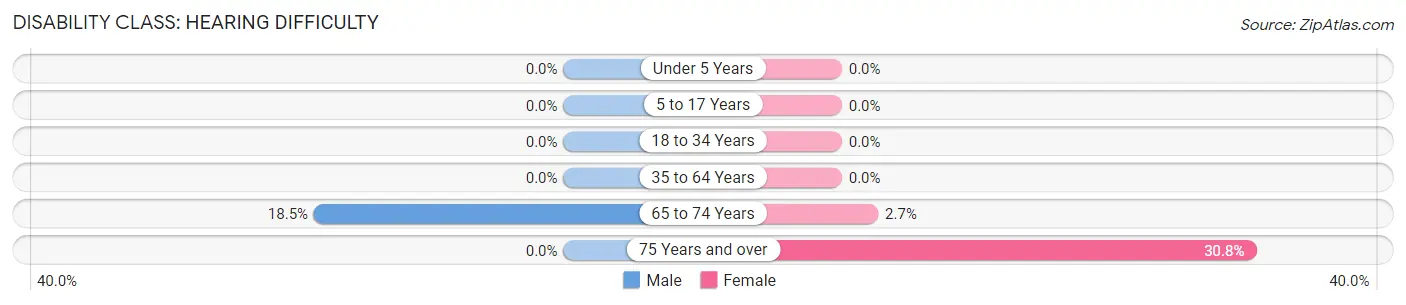
| Age Bracket | Male | Female |
| Under 5 Years | 0 (0.0%) | 0 (0.0%) |
| 5 to 17 Years | 0 (0.0%) | 0 (0.0%) |
| 18 to 34 Years | 0 (0.0%) | 0 (0.0%) |
| 35 to 64 Years | 0 (0.0%) | 0 (0.0%) |
| 65 to 74 Years | 5 (18.5%) | 1 (2.7%) |
| 75 Years and over | 0 (0.0%) | 4 (30.8%) |
Disability Class: Vision Difficulty
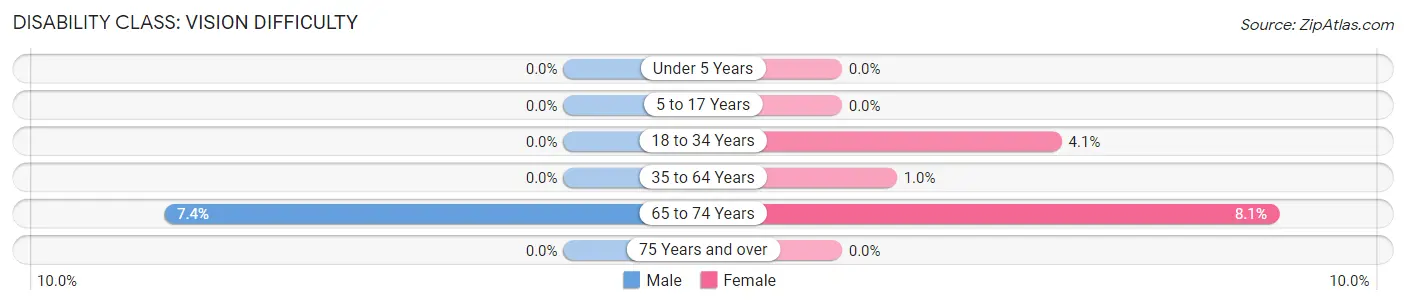
| Age Bracket | Male | Female |
| Under 5 Years | 0 (0.0%) | 0 (0.0%) |
| 5 to 17 Years | 0 (0.0%) | 0 (0.0%) |
| 18 to 34 Years | 0 (0.0%) | 2 (4.1%) |
| 35 to 64 Years | 0 (0.0%) | 1 (1.0%) |
| 65 to 74 Years | 2 (7.4%) | 3 (8.1%) |
| 75 Years and over | 0 (0.0%) | 0 (0.0%) |
Disability Class: Cognitive Difficulty
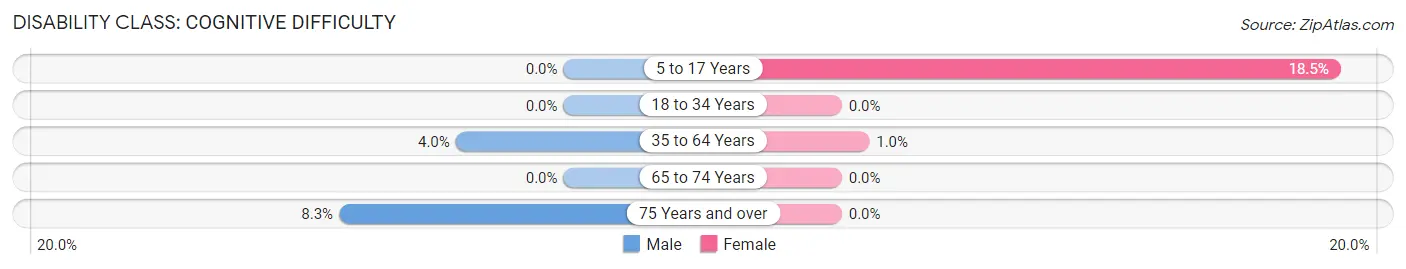
| Age Bracket | Male | Female |
| 5 to 17 Years | 0 (0.0%) | 5 (18.5%) |
| 18 to 34 Years | 0 (0.0%) | 0 (0.0%) |
| 35 to 64 Years | 3 (4.0%) | 1 (1.0%) |
| 65 to 74 Years | 0 (0.0%) | 0 (0.0%) |
| 75 Years and over | 1 (8.3%) | 0 (0.0%) |
Disability Class: Ambulatory Difficulty
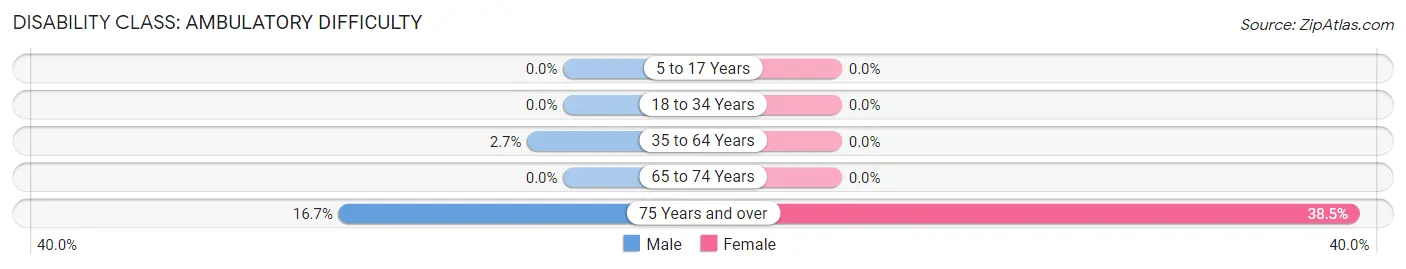
| Age Bracket | Male | Female |
| 5 to 17 Years | 0 (0.0%) | 0 (0.0%) |
| 18 to 34 Years | 0 (0.0%) | 0 (0.0%) |
| 35 to 64 Years | 2 (2.7%) | 0 (0.0%) |
| 65 to 74 Years | 0 (0.0%) | 0 (0.0%) |
| 75 Years and over | 2 (16.7%) | 5 (38.5%) |
Disability Class: Self-Care Difficulty
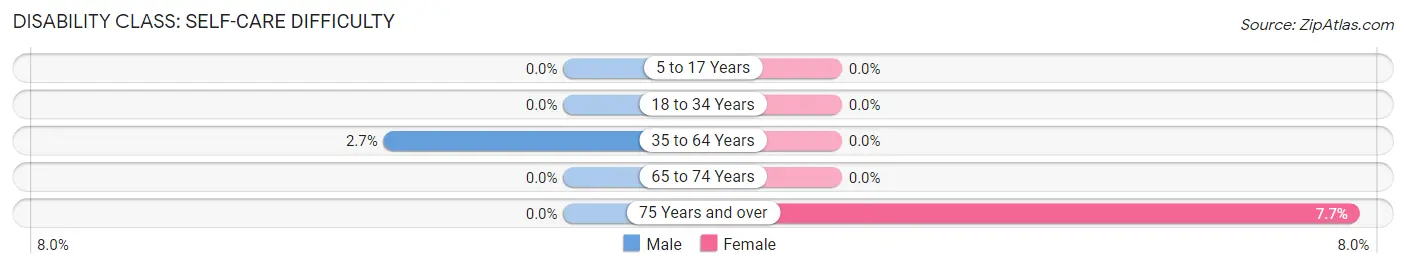
| Age Bracket | Male | Female |
| 5 to 17 Years | 0 (0.0%) | 0 (0.0%) |
| 18 to 34 Years | 0 (0.0%) | 0 (0.0%) |
| 35 to 64 Years | 2 (2.7%) | 0 (0.0%) |
| 65 to 74 Years | 0 (0.0%) | 0 (0.0%) |
| 75 Years and over | 0 (0.0%) | 1 (7.7%) |
Technology Access in Charleston
Computing Device Access in Charleston
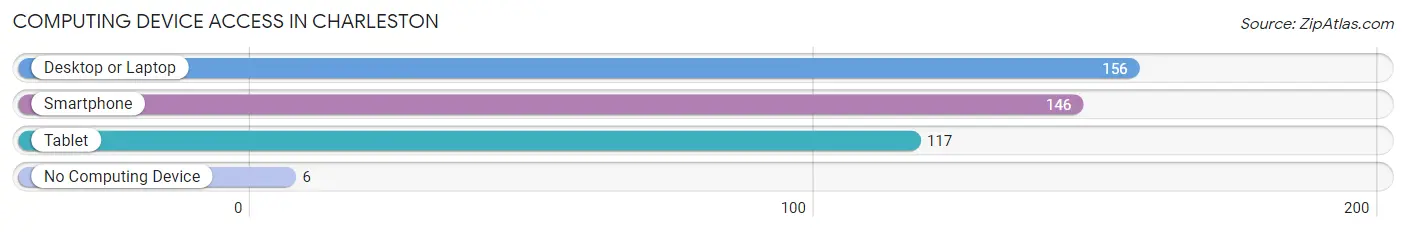
| Device Type | # Households | % Households |
| Desktop or Laptop | 156 | 92.9% |
| Smartphone | 146 | 86.9% |
| Tablet | 117 | 69.6% |
| No Computing Device | 6 | 3.6% |
| Total | 168 | 100.0% |
Internet Access in Charleston
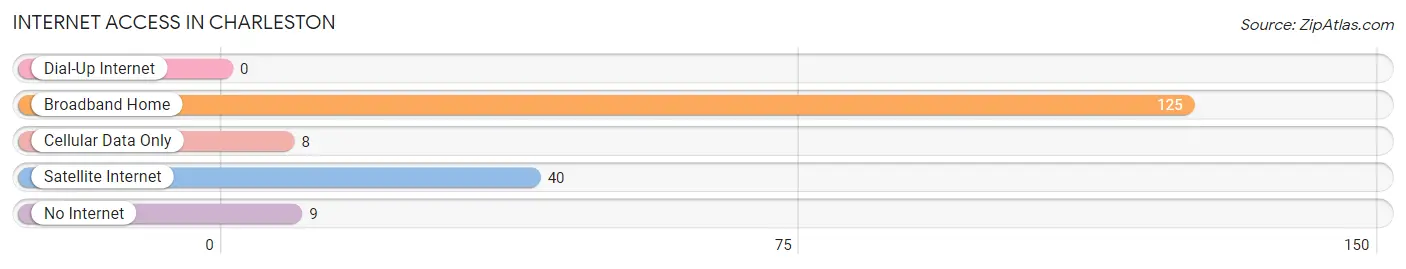
| Internet Type | # Households | % Households |
| Dial-Up Internet | 0 | 0.0% |
| Broadband Home | 125 | 74.4% |
| Cellular Data Only | 8 | 4.8% |
| Satellite Internet | 40 | 23.8% |
| No Internet | 9 | 5.4% |
| Total | 168 | 100.0% |
Charleston Summary
Charleston, Utah is a small town located in the southwestern corner of the state, near the Arizona border. It is part of the Iron County School District and is home to approximately 1,000 people. The town is situated in a beautiful valley surrounded by red sandstone cliffs and is known for its outdoor recreation opportunities.
History
Charleston was first settled in 1871 by a group of Mormon pioneers led by John D. Lee. The town was named after Lee's hometown of Charleston, South Carolina. The settlers built a fort and a small community, and the town grew slowly over the years. In 1876, the town was incorporated and the first post office was established.
In the early 1900s, the town began to grow rapidly as the mining industry in the area expanded. The town was home to several mines, including the Iron King Mine, which was the largest in the area. The town also had a large lumber mill and several other businesses.
Geography
Charleston is located in the southwestern corner of Utah, near the Arizona border. It is situated in a beautiful valley surrounded by red sandstone cliffs. The town is located at an elevation of 4,890 feet and has a total area of 1.2 square miles. The climate is semi-arid, with hot summers and mild winters.
Economy
The economy of Charleston is largely based on tourism and outdoor recreation. The town is home to several national parks and monuments, including Zion National Park, Cedar Breaks National Monument, and Pipe Spring National Monument. The town is also home to several ski resorts, including Brian Head Ski Resort and Eagle Point Ski Resort.
The town also has a few small businesses, including a grocery store, a hardware store, and a few restaurants. The town is also home to a few small manufacturing companies.
Demographics
As of the 2010 census, the population of Charleston was 1,000. The racial makeup of the town was 95.2% White, 0.7% Native American, 0.3% Asian, 0.2% Pacific Islander, 0.2% from other races, and 3.6% from two or more races. The median household income was $37,500 and the median family income was $41,250.
Conclusion
Charleston, Utah is a small town located in the southwestern corner of the state, near the Arizona border. It is part of the Iron County School District and is home to approximately 1,000 people. The town is situated in a beautiful valley surrounded by red sandstone cliffs and is known for its outdoor recreation opportunities. The economy of Charleston is largely based on tourism and outdoor recreation, and the town is home to several national parks and monuments, ski resorts, and small businesses. The population of Charleston is mostly White, with a median household income of $37,500 and a median family income of $41,250.
Common Questions
What is Per Capita Income in Charleston?
Per Capita income in Charleston is $69,714.
What is the Median Family Income in Charleston?
Median Family Income in Charleston is $130,833.
What is the Median Household income in Charleston?
Median Household Income in Charleston is $107,500.
What is Income or Wage Gap in Charleston?
Income or Wage Gap in Charleston is 1.0%.
Women in Charleston earn 99.0 cents for every dollar earned by a man.
What is Inequality or Gini Index in Charleston?
Inequality or Gini Index in Charleston is 0.57.
What is the Total Population of Charleston?
Total Population of Charleston is 438.
What is the Total Male Population of Charleston?
Total Male Population of Charleston is 199.
What is the Total Female Population of Charleston?
Total Female Population of Charleston is 239.
What is the Ratio of Males per 100 Females in Charleston?
There are 83.26 Males per 100 Females in Charleston.
What is the Ratio of Females per 100 Males in Charleston?
There are 120.10 Females per 100 Males in Charleston.
What is the Median Population Age in Charleston?
Median Population Age in Charleston is 46.1 Years.
What is the Average Family Size in Charleston
Average Family Size in Charleston is 3.3 People.
What is the Average Household Size in Charleston
Average Household Size in Charleston is 2.6 People.
How Large is the Labor Force in Charleston?
There are 250 People in the Labor Forcein in Charleston.
What is the Percentage of People in the Labor Force in Charleston?
67.8% of People are in the Labor Force in Charleston.
What is the Unemployment Rate in Charleston?
Unemployment Rate in Charleston is 0.8%.