Timber Lakes, UT Map & Demographics
Timber Lakes Map
Timber Lakes Overview
$29,886
PER CAPITA INCOME
$135,075
AVG FAMILY INCOME
$46,268
AVG HOUSEHOLD INCOME
0.39
INEQUALITY / GINI INDEX
710
TOTAL POPULATION
480
MALE POPULATION
230
FEMALE POPULATION
208.70
MALES / 100 FEMALES
47.92
FEMALES / 100 MALES
31.1
MEDIAN AGE
3.5
AVG FAMILY SIZE
2.1
AVG HOUSEHOLD SIZE
281
LABOR FORCE [ PEOPLE ]
56.5%
PERCENT IN LABOR FORCE
Income in Timber Lakes
Income Overview in Timber Lakes
Per Capita Income in Timber Lakes is $29,886, while median incomes of families and households are $135,075 and $46,268 respectively.
| Characteristic | Number | Measure |
| Per Capita Income | 710 | $29,886 |
| Median Family Income | 150 | $135,075 |
| Mean Family Income | 150 | $108,043 |
| Median Household Income | 337 | $46,268 |
| Mean Household Income | 337 | $67,096 |
| Income Deficit | 150 | $0 |
| Wage / Income Gap (%) | 710 | 0.00% |
| Wage / Income Gap ($) | 710 | 100.00¢ per $1 |
| Gini / Inequality Index | 710 | 0.39 |
Earnings by Sex in Timber Lakes
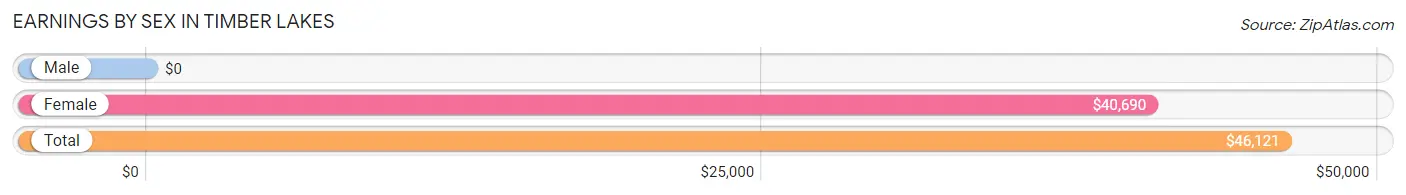
| Sex | Number | Average Earnings |
| Male | 184 (65.5%) | $0 |
| Female | 97 (34.5%) | $40,690 |
| Total | 281 (100.0%) | $46,121 |
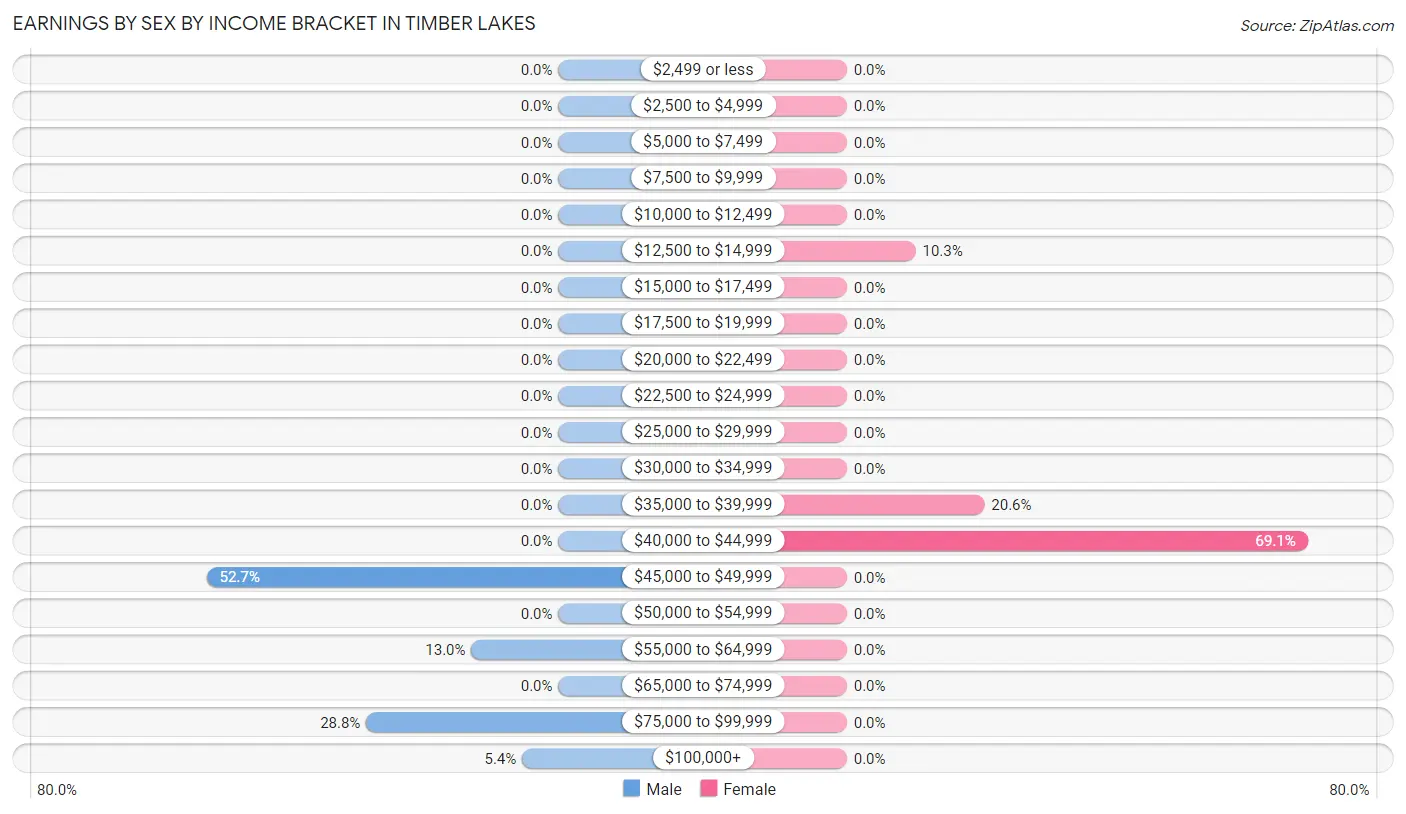
Earnings by Sex by Income Bracket in Timber Lakes
The most common earnings brackets in Timber Lakes are $45,000 to $49,999 for men (97 | 52.7%) and $40,000 to $44,999 for women (67 | 69.1%).
| Income | Male | Female |
| $2,499 or less | 0 (0.0%) | 0 (0.0%) |
| $2,500 to $4,999 | 0 (0.0%) | 0 (0.0%) |
| $5,000 to $7,499 | 0 (0.0%) | 0 (0.0%) |
| $7,500 to $9,999 | 0 (0.0%) | 0 (0.0%) |
| $10,000 to $12,499 | 0 (0.0%) | 0 (0.0%) |
| $12,500 to $14,999 | 0 (0.0%) | 10 (10.3%) |
| $15,000 to $17,499 | 0 (0.0%) | 0 (0.0%) |
| $17,500 to $19,999 | 0 (0.0%) | 0 (0.0%) |
| $20,000 to $22,499 | 0 (0.0%) | 0 (0.0%) |
| $22,500 to $24,999 | 0 (0.0%) | 0 (0.0%) |
| $25,000 to $29,999 | 0 (0.0%) | 0 (0.0%) |
| $30,000 to $34,999 | 0 (0.0%) | 0 (0.0%) |
| $35,000 to $39,999 | 0 (0.0%) | 20 (20.6%) |
| $40,000 to $44,999 | 0 (0.0%) | 67 (69.1%) |
| $45,000 to $49,999 | 97 (52.7%) | 0 (0.0%) |
| $50,000 to $54,999 | 0 (0.0%) | 0 (0.0%) |
| $55,000 to $64,999 | 24 (13.0%) | 0 (0.0%) |
| $65,000 to $74,999 | 0 (0.0%) | 0 (0.0%) |
| $75,000 to $99,999 | 53 (28.8%) | 0 (0.0%) |
| $100,000+ | 10 (5.4%) | 0 (0.0%) |
| Total | 184 (100.0%) | 97 (100.0%) |
Earnings by Sex by Educational Attainment in Timber Lakes
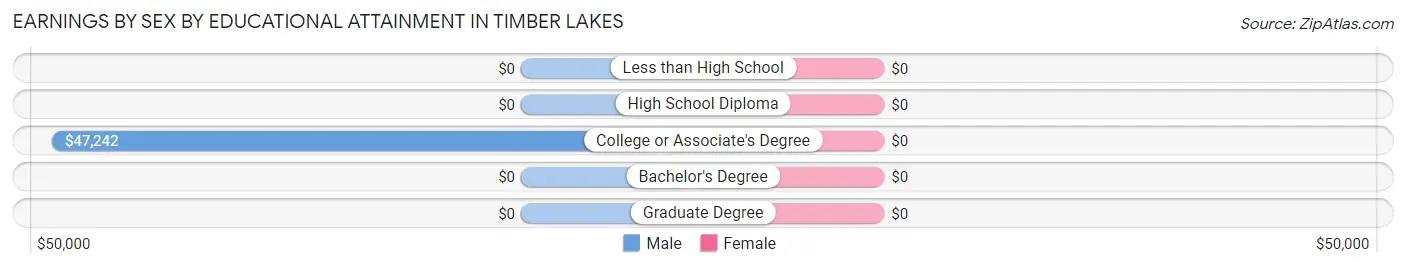
| Educational Attainment | Male Income | Female Income |
| Less than High School | - | - |
| High School Diploma | - | - |
| College or Associate's Degree | $47,242 | $0 |
| Bachelor's Degree | - | - |
| Graduate Degree | - | - |
| Total | - | - |
Family Income in Timber Lakes
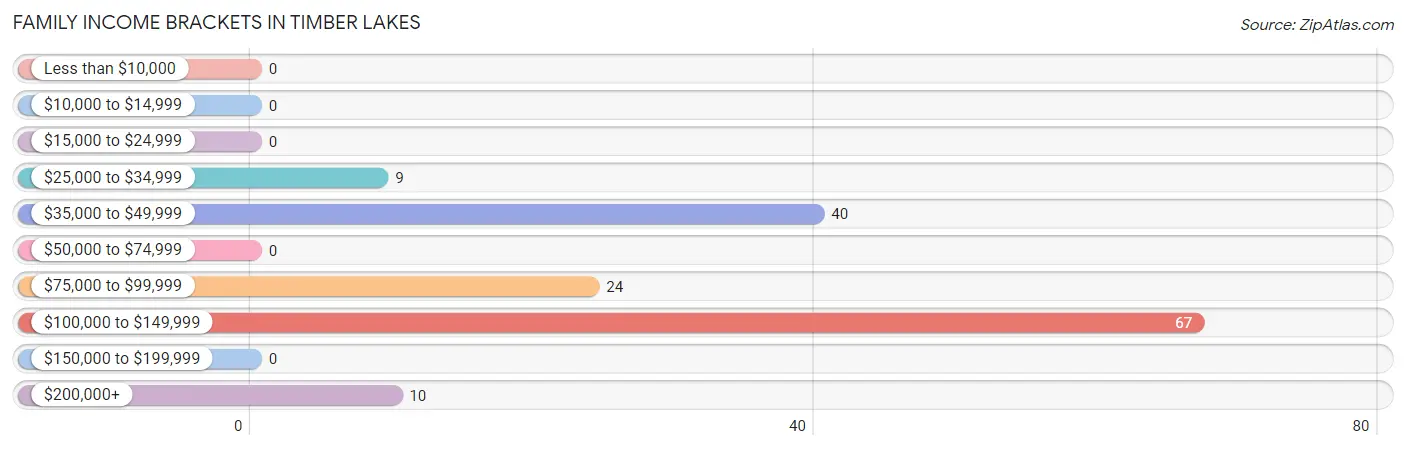
Family Income Brackets in Timber Lakes
According to the Timber Lakes family income data, there are 67 families falling into the $100,000 to $149,999 income range, which is the most common income bracket and makes up 44.7% of all families.
| Income Bracket | # Families | % Families |
| Less than $10,000 | 0 | 0.0% |
| $10,000 to $14,999 | 0 | 0.0% |
| $15,000 to $24,999 | 0 | 0.0% |
| $25,000 to $34,999 | 9 | 6.0% |
| $35,000 to $49,999 | 40 | 26.7% |
| $50,000 to $74,999 | 0 | 0.0% |
| $75,000 to $99,999 | 24 | 16.0% |
| $100,000 to $149,999 | 67 | 44.7% |
| $150,000 to $199,999 | 0 | 0.0% |
| $200,000+ | 10 | 6.7% |
Family Income by Famaliy Size in Timber Lakes
| Income Bracket | # Families | Median Income |
| 2-Person Families | 40 (26.7%) | $0 |
| 3-Person Families | 9 (6.0%) | $0 |
| 4-Person Families | 0 (0.0%) | $0 |
| 5-Person Families | 91 (60.7%) | $0 |
| 6-Person Families | 10 (6.7%) | $0 |
| 7+ Person Families | 0 (0.0%) | $0 |
| Total | 150 (100.0%) | $135,075 |
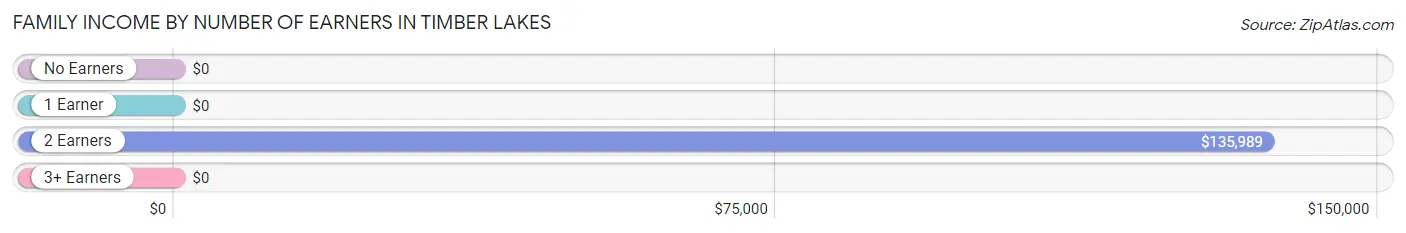
Family Income by Number of Earners in Timber Lakes
| Number of Earners | # Families | Median Income |
| No Earners | 49 (32.7%) | $0 |
| 1 Earner | 0 (0.0%) | $0 |
| 2 Earners | 101 (67.3%) | $135,989 |
| 3+ Earners | 0 (0.0%) | $0 |
| Total | 150 (100.0%) | $135,075 |
Household Income in Timber Lakes
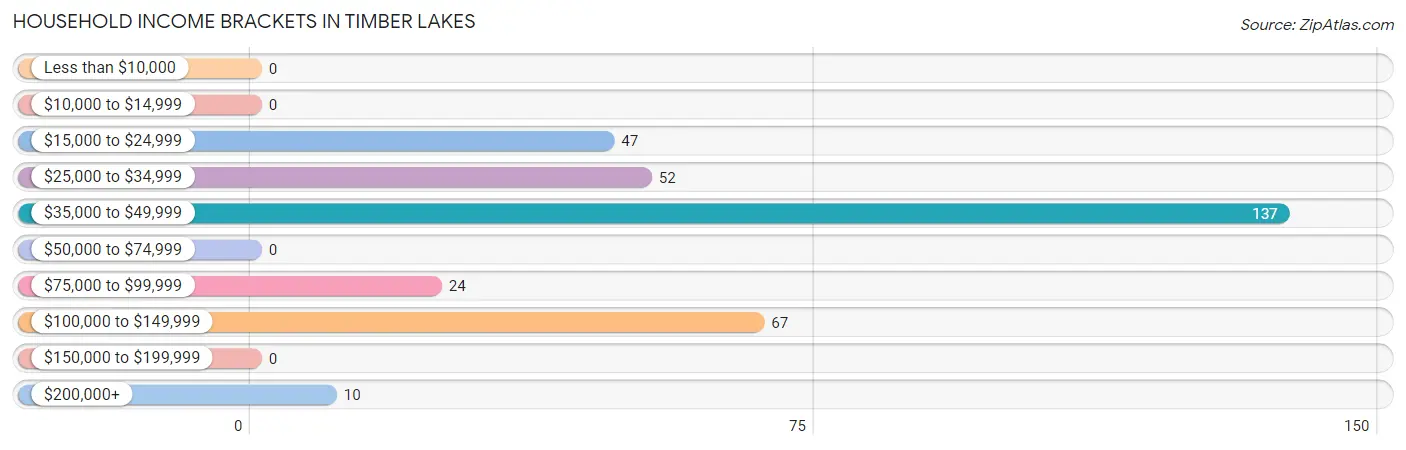
Household Income Brackets in Timber Lakes
With 137 households falling in the category, the $35,000 to $49,999 income range is the most frequent in Timber Lakes, accounting for 40.6% of all households.
| Income Bracket | # Households | % Households |
| Less than $10,000 | 0 | 0.0% |
| $10,000 to $14,999 | 0 | 0.0% |
| $15,000 to $24,999 | 47 | 13.9% |
| $25,000 to $34,999 | 52 | 15.4% |
| $35,000 to $49,999 | 137 | 40.7% |
| $50,000 to $74,999 | 0 | 0.0% |
| $75,000 to $99,999 | 24 | 7.1% |
| $100,000 to $149,999 | 67 | 19.9% |
| $150,000 to $199,999 | 0 | 0.0% |
| $200,000+ | 10 | 3.0% |
Household Income by Householder Age in Timber Lakes
The median household income in Timber Lakes is $46,268, with the highest median household income of $135,989 found in the 25 to 44 years age bracket for the primary householder. A total of 101 households (30.0%) fall into this category.
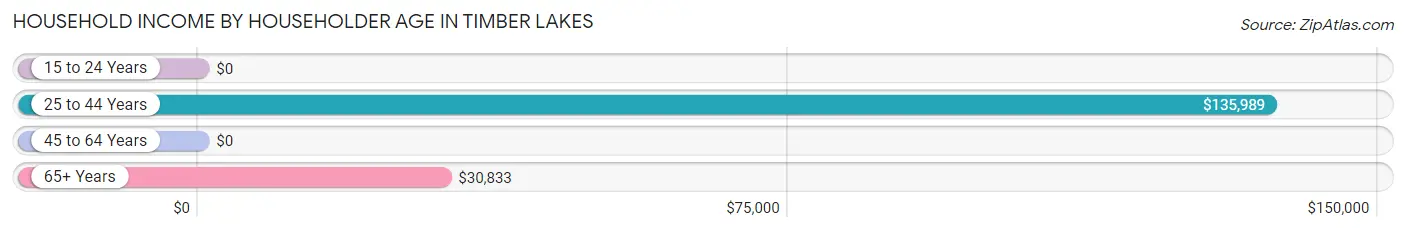
| Income Bracket | # Households | Median Income |
| 15 to 24 Years | 0 (0.0%) | $0 |
| 25 to 44 Years | 101 (30.0%) | $135,989 |
| 45 to 64 Years | 144 (42.7%) | $0 |
| 65+ Years | 92 (27.3%) | $30,833 |
| Total | 337 (100.0%) | $46,268 |
Poverty in Timber Lakes
Income Below Poverty by Sex and Age in Timber Lakes
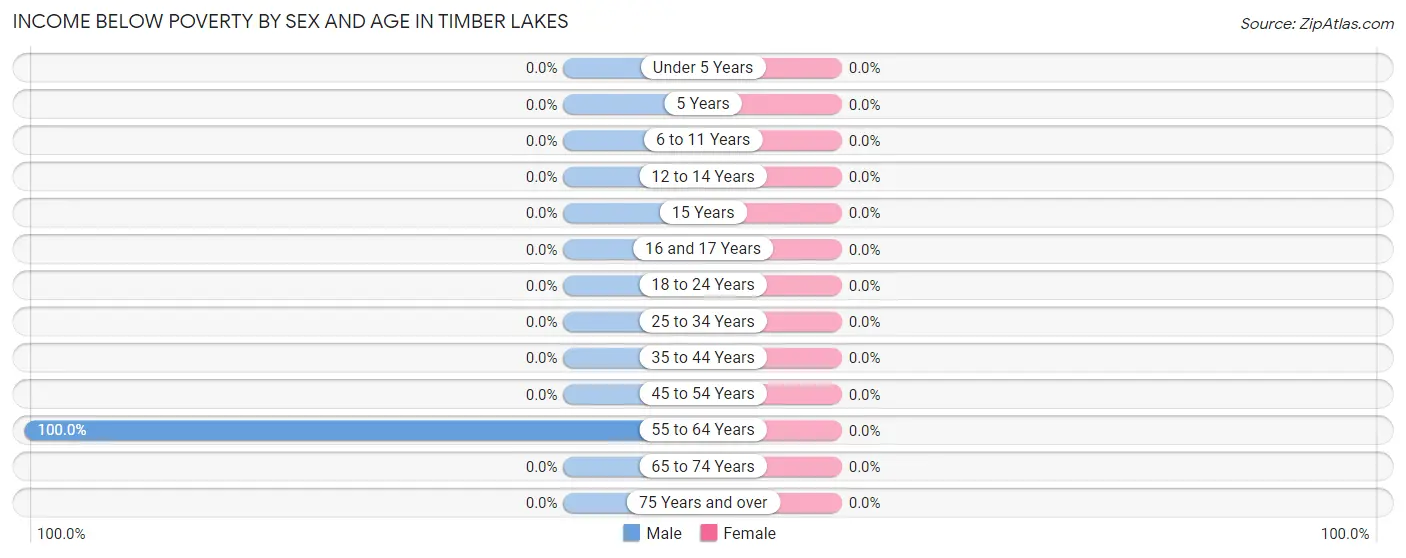
| Age Bracket | Male | Female |
| Under 5 Years | 0 (0.0%) | 0 (0.0%) |
| 5 Years | 0 (0.0%) | 0 (0.0%) |
| 6 to 11 Years | 0 (0.0%) | 0 (0.0%) |
| 12 to 14 Years | 0 (0.0%) | 0 (0.0%) |
| 15 Years | 0 (0.0%) | 0 (0.0%) |
| 16 and 17 Years | 0 (0.0%) | 0 (0.0%) |
| 18 to 24 Years | 0 (0.0%) | 0 (0.0%) |
| 25 to 34 Years | 0 (0.0%) | 0 (0.0%) |
| 35 to 44 Years | 0 (0.0%) | 0 (0.0%) |
| 45 to 54 Years | 0 (0.0%) | 0 (0.0%) |
| 55 to 64 Years | 47 (100.0%) | 0 (0.0%) |
| 65 to 74 Years | 0 (0.0%) | 0 (0.0%) |
| 75 Years and over | 0 (0.0%) | 0 (0.0%) |
| Total | 47 (9.8%) | 0 (0.0%) |
Income Above Poverty by Sex and Age in Timber Lakes
According to the poverty statistics in Timber Lakes, males aged under 5 years and females aged under 5 years are the age groups that are most secure financially, with 100.0% of males and 100.0% of females in these age groups living above the poverty line.
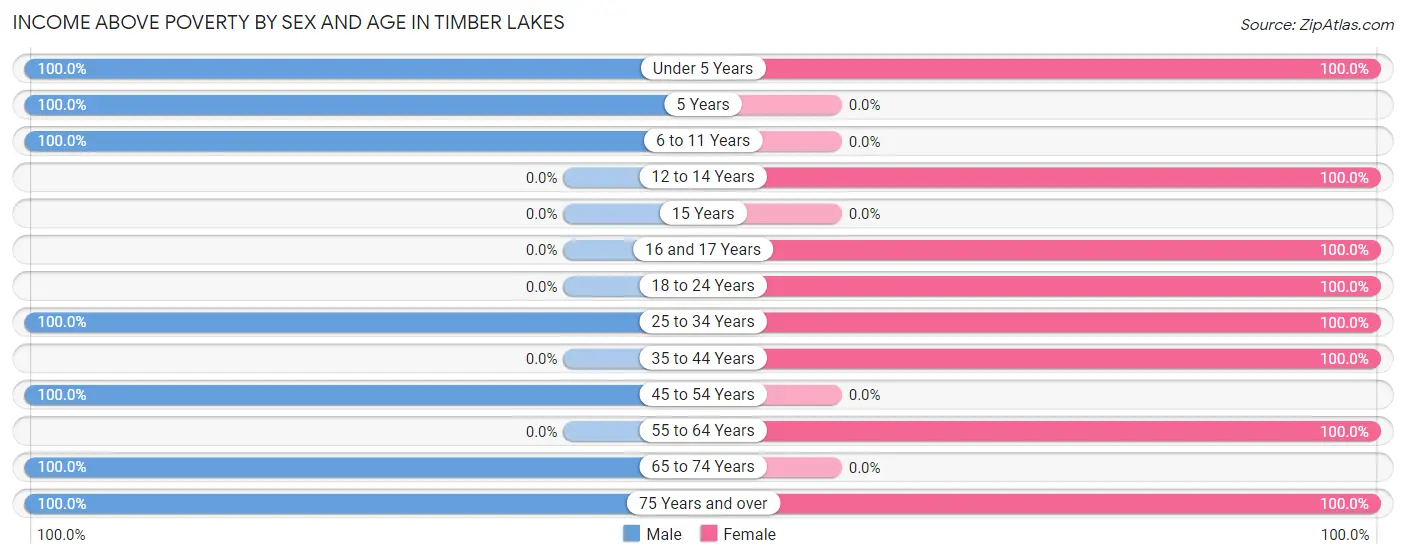
| Age Bracket | Male | Female |
| Under 5 Years | 74 (100.0%) | 50 (100.0%) |
| 5 Years | 11 (100.0%) | 0 (0.0%) |
| 6 to 11 Years | 72 (100.0%) | 0 (0.0%) |
| 12 to 14 Years | 0 (0.0%) | 6 (100.0%) |
| 15 Years | 0 (0.0%) | 0 (0.0%) |
| 16 and 17 Years | 0 (0.0%) | 10 (100.0%) |
| 18 to 24 Years | 0 (0.0%) | 18 (100.0%) |
| 25 to 34 Years | 77 (100.0%) | 87 (100.0%) |
| 35 to 44 Years | 0 (0.0%) | 10 (100.0%) |
| 45 to 54 Years | 107 (100.0%) | 0 (0.0%) |
| 55 to 64 Years | 0 (0.0%) | 7 (100.0%) |
| 65 to 74 Years | 52 (100.0%) | 0 (0.0%) |
| 75 Years and over | 40 (100.0%) | 42 (100.0%) |
| Total | 433 (90.2%) | 230 (100.0%) |
Income Below Poverty Among Married-Couple Families in Timber Lakes
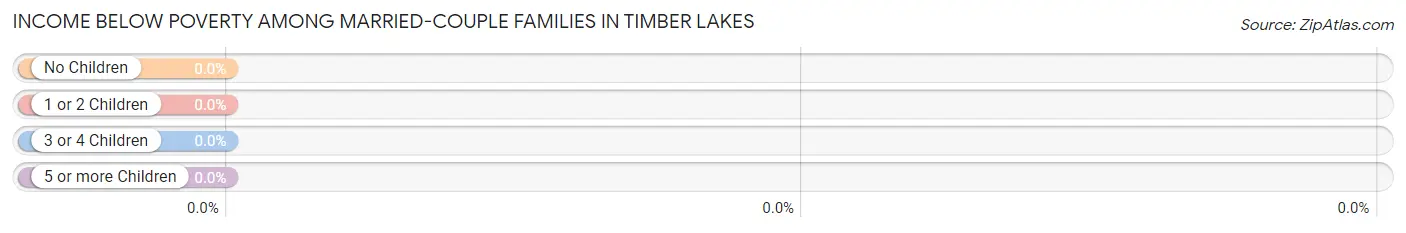
| Children | Above Poverty | Below Poverty |
| No Children | 49 (100.0%) | 0 (0.0%) |
| 1 or 2 Children | 0 (0.0%) | 0 (0.0%) |
| 3 or 4 Children | 101 (100.0%) | 0 (0.0%) |
| 5 or more Children | 0 (0.0%) | 0 (0.0%) |
| Total | 150 (100.0%) | 0 (0.0%) |
Income Below Poverty Among Single-Parent Households in Timber Lakes
| Children | Single Father | Single Mother |
| No Children | 0 (0.0%) | 0 (0.0%) |
| 1 or 2 Children | 0 (0.0%) | 0 (0.0%) |
| 3 or 4 Children | 0 (0.0%) | 0 (0.0%) |
| 5 or more Children | 0 (0.0%) | 0 (0.0%) |
| Total | 0 (0.0%) | 0 (0.0%) |
Income Below Poverty Among Married-Couple vs Single-Parent Households in Timber Lakes
| Children | Married-Couple Families | Single-Parent Households |
| No Children | 0 (0.0%) | 0 (0.0%) |
| 1 or 2 Children | 0 (0.0%) | 0 (0.0%) |
| 3 or 4 Children | 0 (0.0%) | 0 (0.0%) |
| 5 or more Children | 0 (0.0%) | 0 (0.0%) |
| Total | 0 (0.0%) | 0 (0.0%) |
Race in Timber Lakes
The most populous races in Timber Lakes are White / Caucasian (688 | 96.9%), and Hawaiian / Pacific (22 | 3.1%).
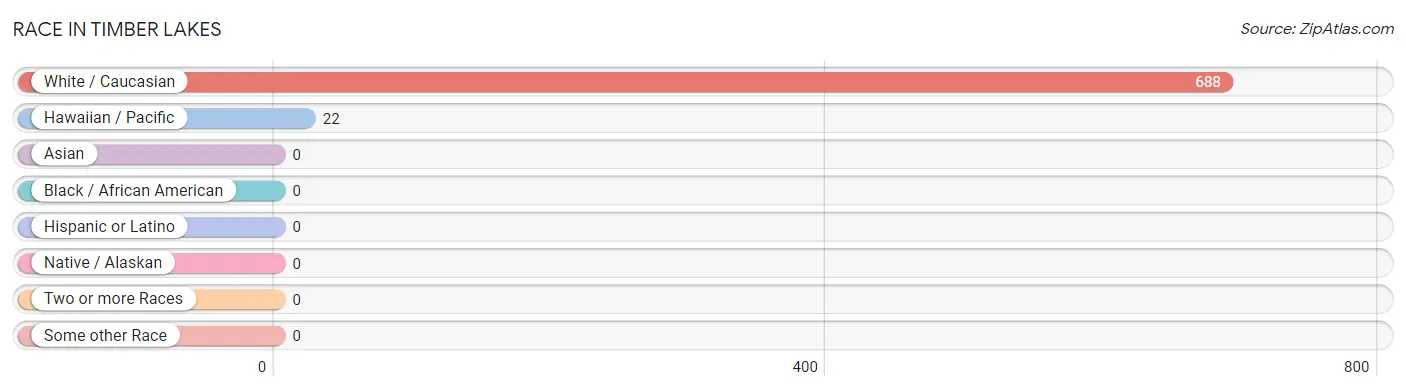
| Race | # Population | % Population |
| Asian | 0 | 0.0% |
| Black / African American | 0 | 0.0% |
| Hawaiian / Pacific | 22 | 3.1% |
| Hispanic or Latino | 0 | 0.0% |
| Native / Alaskan | 0 | 0.0% |
| White / Caucasian | 688 | 96.9% |
| Two or more Races | 0 | 0.0% |
| Some other Race | 0 | 0.0% |
| Total | 710 | 100.0% |
Ancestry in Timber Lakes
The most populous ancestries reported in Timber Lakes are English (121 | 17.0%), German (121 | 17.0%), Scottish (87 | 12.2%), Swedish (47 | 6.6%), and Australian (42 | 5.9%), together accounting for 58.9% of all Timber Lakes residents.
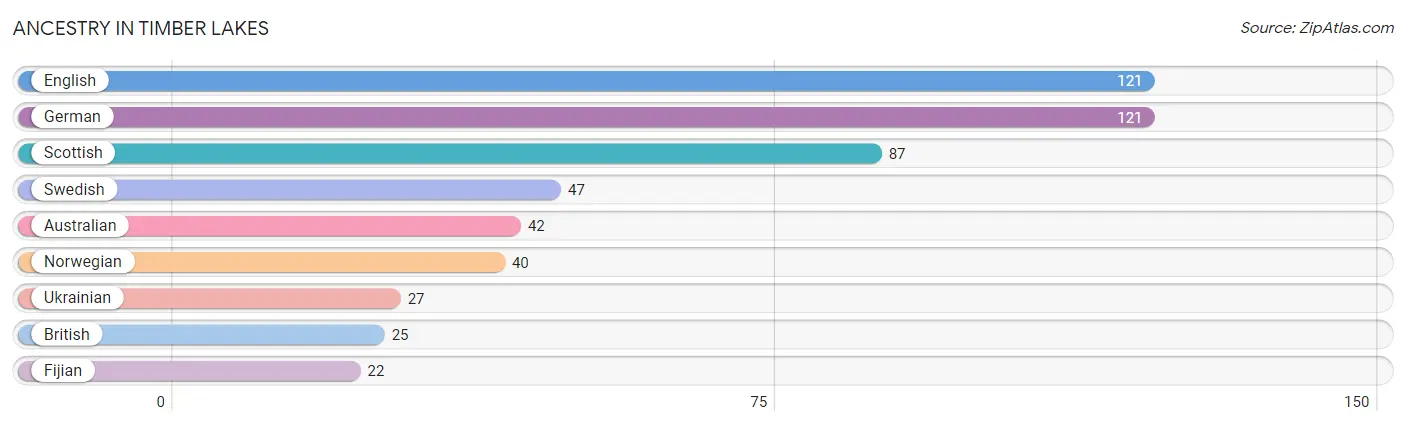
| Ancestry | # Population | % Population |
| Australian | 42 | 5.9% |
| British | 25 | 3.5% |
| English | 121 | 17.0% |
| Fijian | 22 | 3.1% |
| German | 121 | 17.0% |
| Norwegian | 40 | 5.6% |
| Scottish | 87 | 12.2% |
| Swedish | 47 | 6.6% |
| Ukrainian | 27 | 3.8% | View All 9 Rows |
Immigrants in Timber Lakes

| Immigration Origin | # Population | % Population | View All 0 Rows |
Sex and Age in Timber Lakes
Sex and Age in Timber Lakes
The most populous age groups in Timber Lakes are 45 to 49 Years (107 | 22.3%) for men and 25 to 29 Years (67 | 29.1%) for women.
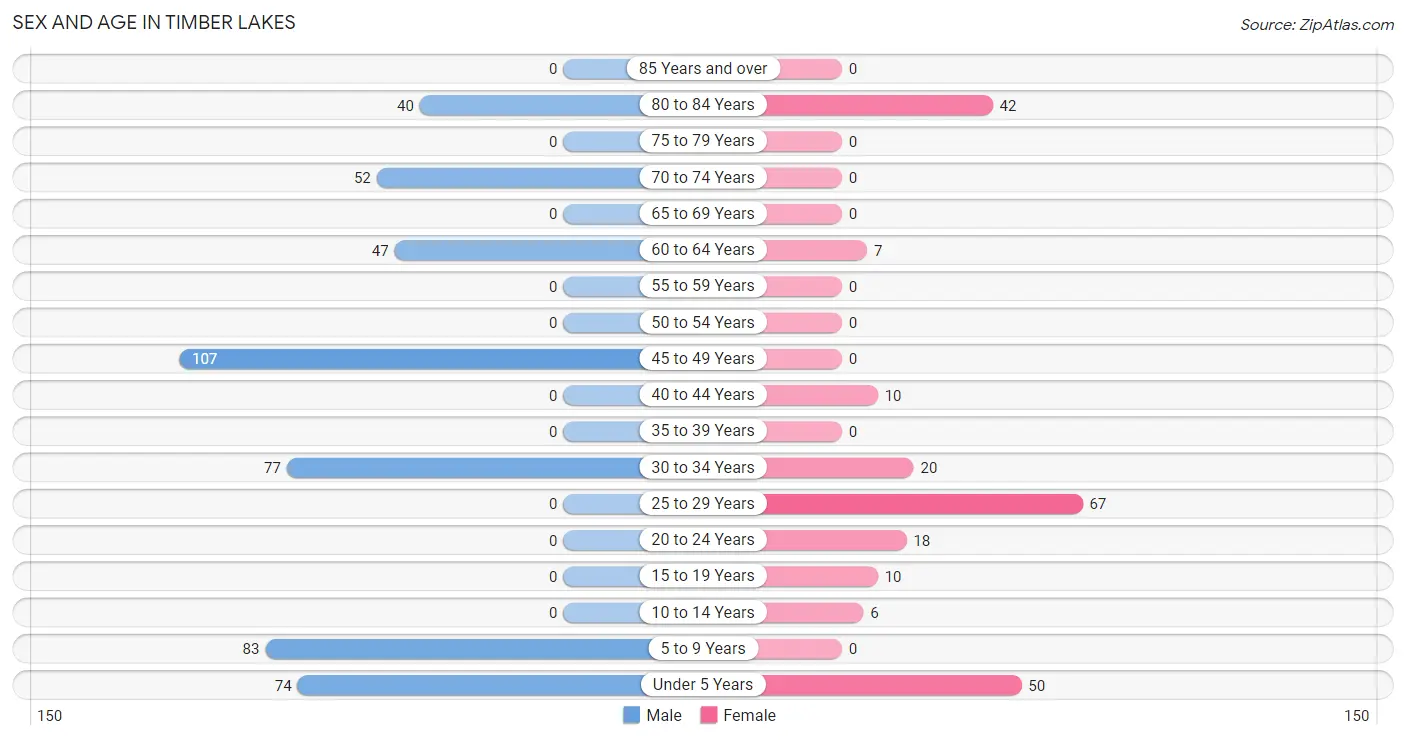
| Age Bracket | Male | Female |
| Under 5 Years | 74 (15.4%) | 50 (21.7%) |
| 5 to 9 Years | 83 (17.3%) | 0 (0.0%) |
| 10 to 14 Years | 0 (0.0%) | 6 (2.6%) |
| 15 to 19 Years | 0 (0.0%) | 10 (4.3%) |
| 20 to 24 Years | 0 (0.0%) | 18 (7.8%) |
| 25 to 29 Years | 0 (0.0%) | 67 (29.1%) |
| 30 to 34 Years | 77 (16.0%) | 20 (8.7%) |
| 35 to 39 Years | 0 (0.0%) | 0 (0.0%) |
| 40 to 44 Years | 0 (0.0%) | 10 (4.3%) |
| 45 to 49 Years | 107 (22.3%) | 0 (0.0%) |
| 50 to 54 Years | 0 (0.0%) | 0 (0.0%) |
| 55 to 59 Years | 0 (0.0%) | 0 (0.0%) |
| 60 to 64 Years | 47 (9.8%) | 7 (3.0%) |
| 65 to 69 Years | 0 (0.0%) | 0 (0.0%) |
| 70 to 74 Years | 52 (10.8%) | 0 (0.0%) |
| 75 to 79 Years | 0 (0.0%) | 0 (0.0%) |
| 80 to 84 Years | 40 (8.3%) | 42 (18.3%) |
| 85 Years and over | 0 (0.0%) | 0 (0.0%) |
| Total | 480 (100.0%) | 230 (100.0%) |
Families and Households in Timber Lakes
Median Family Size in Timber Lakes
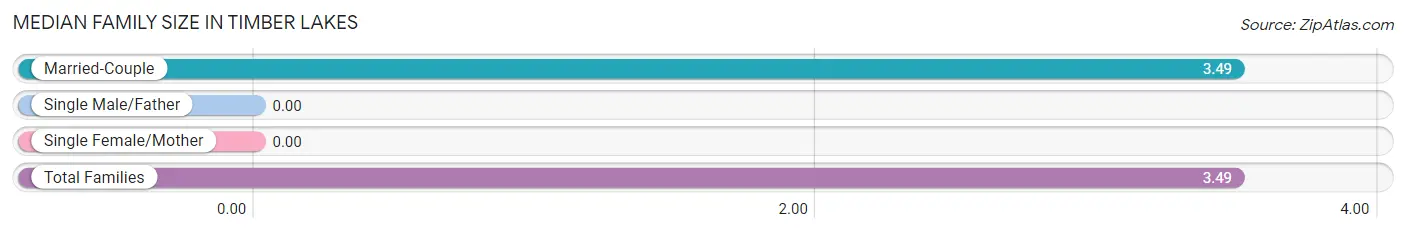
| Family Type | # Families | Family Size |
| Married-Couple | 150 (100.0%) | 3.49 |
| Single Male/Father | 0 (0.0%) | - |
| Single Female/Mother | 0 (0.0%) | - |
| Total Families | 150 (100.0%) | 3.49 |
Median Household Size in Timber Lakes
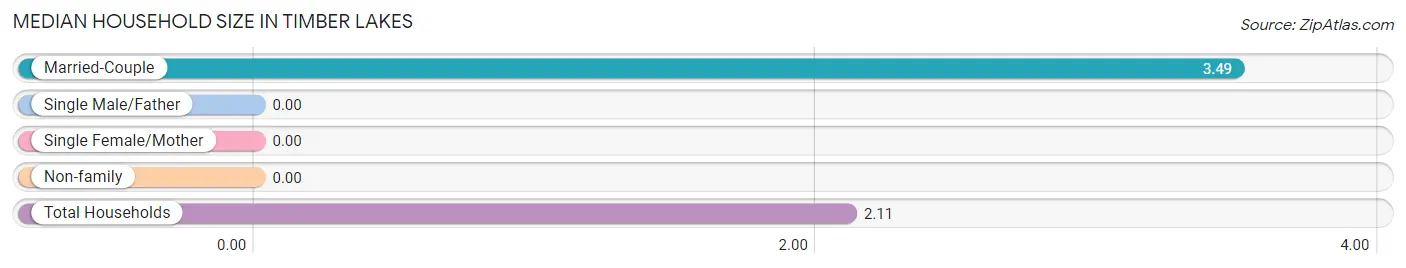
| Household Type | # Households | Household Size |
| Married-Couple | 150 (44.5%) | 3.49 |
| Single Male/Father | 0 (0.0%) | - |
| Single Female/Mother | 0 (0.0%) | - |
| Non-family | 187 (55.5%) | - |
| Total Households | 337 (100.0%) | 2.11 |
Household Size by Marriage Status in Timber Lakes
Out of a total of 337 households in Timber Lakes, 150 (44.5%) are family households, while 187 (55.5%) are nonfamily households. The most numerous type of family households are 5-person households, comprising 91, and the most common type of nonfamily households are 1-person households, comprising 187.
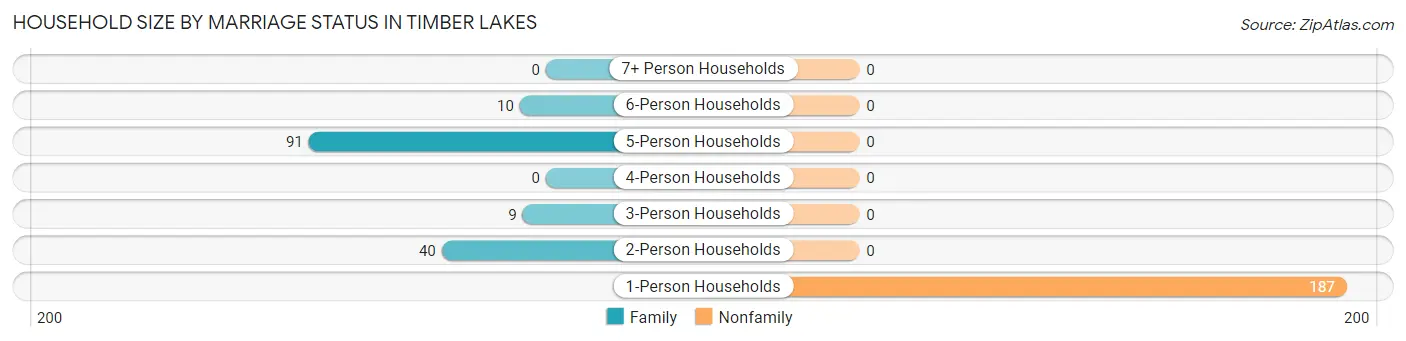
| Household Size | Family Households | Nonfamily Households |
| 1-Person Households | - | 187 (55.5%) |
| 2-Person Households | 40 (11.9%) | 0 (0.0%) |
| 3-Person Households | 9 (2.7%) | 0 (0.0%) |
| 4-Person Households | 0 (0.0%) | 0 (0.0%) |
| 5-Person Households | 91 (27.0%) | 0 (0.0%) |
| 6-Person Households | 10 (3.0%) | 0 (0.0%) |
| 7+ Person Households | 0 (0.0%) | 0 (0.0%) |
| Total | 150 (44.5%) | 187 (55.5%) |
Female Fertility in Timber Lakes
Fertility by Age in Timber Lakes
| Age Bracket | Women with Births | Births / 1,000 Women |
| 15 to 19 years | 0 (0.0%) | 0.0 |
| 20 to 34 years | 0 (0.0%) | 0.0 |
| 35 to 50 years | 0 (0.0%) | 0.0 |
| Total | 0 (0.0%) | 0.0 |
Fertility by Age by Marriage Status in Timber Lakes
| Age Bracket | Married | Unmarried |
| 15 to 19 years | 0 (0.0%) | 0 (0.0%) |
| 20 to 34 years | 0 (0.0%) | 0 (0.0%) |
| 35 to 50 years | 0 (0.0%) | 0 (0.0%) |
| Total | 0 (0.0%) | 0 (0.0%) |
Fertility by Education in Timber Lakes
| Educational Attainment | Women with Births | Births / 1,000 Women |
| Less than High School | 0 (0.0%) | 0.0 |
| High School Diploma | 0 (0.0%) | 0.0 |
| College or Associate's Degree | 0 (0.0%) | 0.0 |
| Bachelor's Degree | 0 (0.0%) | 0.0 |
| Graduate Degree | 0 (0.0%) | 0.0 |
| Total | 0 (0.0%) | 0.0 |
Fertility by Education by Marriage Status in Timber Lakes
| Educational Attainment | Married | Unmarried |
| Less than High School | 0 (0.0%) | 0 (0.0%) |
| High School Diploma | 0 (0.0%) | 0 (0.0%) |
| College or Associate's Degree | 0 (0.0%) | 0 (0.0%) |
| Bachelor's Degree | 0 (0.0%) | 0 (0.0%) |
| Graduate Degree | 0 (0.0%) | 0 (0.0%) |
| Total | 0 (0.0%) | 0 (0.0%) |
Employment Characteristics in Timber Lakes
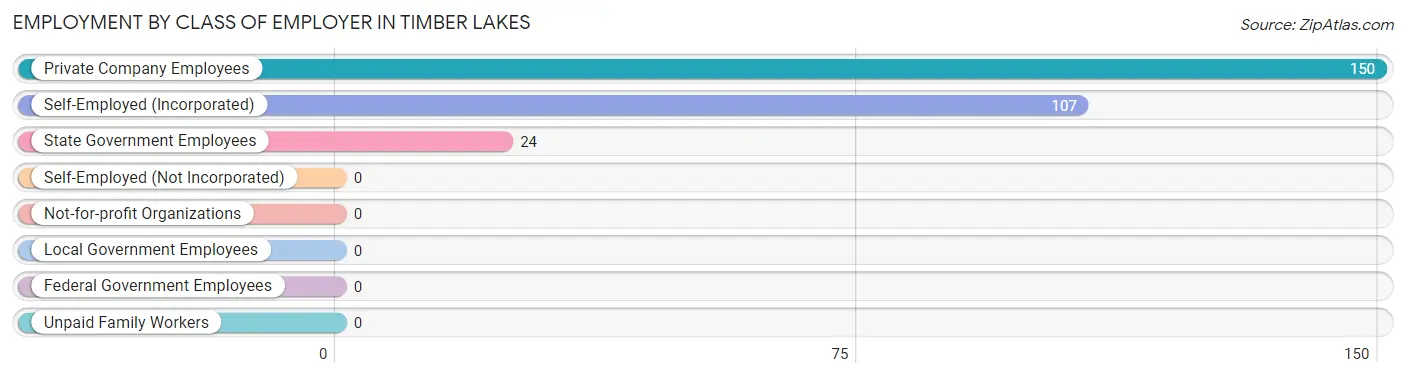
Employment by Class of Employer in Timber Lakes
Among the 281 employed individuals in Timber Lakes, private company employees (150 | 53.4%), self-employed (incorporated) (107 | 38.1%), and state government employees (24 | 8.5%) make up the most common classes of employment.
| Employer Class | # Employees | % Employees |
| Private Company Employees | 150 | 53.4% |
| Self-Employed (Incorporated) | 107 | 38.1% |
| Self-Employed (Not Incorporated) | 0 | 0.0% |
| Not-for-profit Organizations | 0 | 0.0% |
| Local Government Employees | 0 | 0.0% |
| State Government Employees | 24 | 8.5% |
| Federal Government Employees | 0 | 0.0% |
| Unpaid Family Workers | 0 | 0.0% |
| Total | 281 | 100.0% |
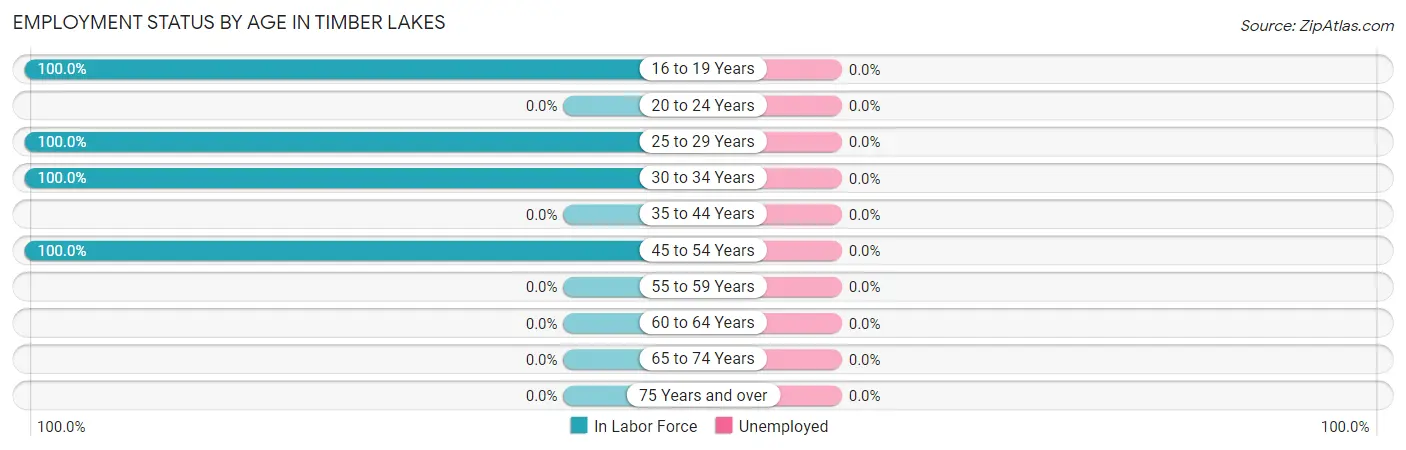
Employment Status by Age in Timber Lakes
| Age Bracket | In Labor Force | Unemployed |
| 16 to 19 Years | 10 (100.0%) | 0 (0.0%) |
| 20 to 24 Years | 0 (0.0%) | 0 (0.0%) |
| 25 to 29 Years | 67 (100.0%) | 0 (0.0%) |
| 30 to 34 Years | 97 (100.0%) | 0 (0.0%) |
| 35 to 44 Years | 0 (0.0%) | 0 (0.0%) |
| 45 to 54 Years | 107 (100.0%) | 0 (0.0%) |
| 55 to 59 Years | 0 (0.0%) | 0 (0.0%) |
| 60 to 64 Years | 0 (0.0%) | 0 (0.0%) |
| 65 to 74 Years | 0 (0.0%) | 0 (0.0%) |
| 75 Years and over | 0 (0.0%) | 0 (0.0%) |
| Total | 281 (56.5%) | 0 (0.0%) |
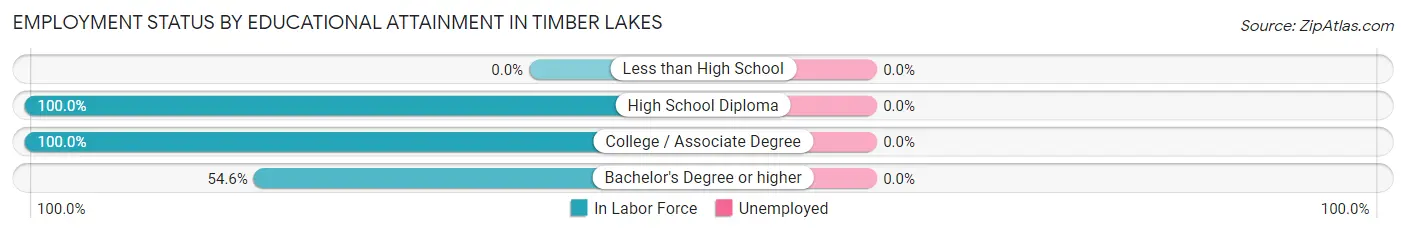
Employment Status by Educational Attainment in Timber Lakes
| Educational Attainment | In Labor Force | Unemployed |
| Less than High School | 0 (0.0%) | 0 (0.0%) |
| High School Diploma | 20 (100.0%) | 0 (0.0%) |
| College / Associate Degree | 174 (100.0%) | 0 (0.0%) |
| Bachelor's Degree or higher | 77 (54.6%) | 0 (0.0%) |
| Total | 271 (80.9%) | 0 (0.0%) |
Employment Occupations by Sex in Timber Lakes
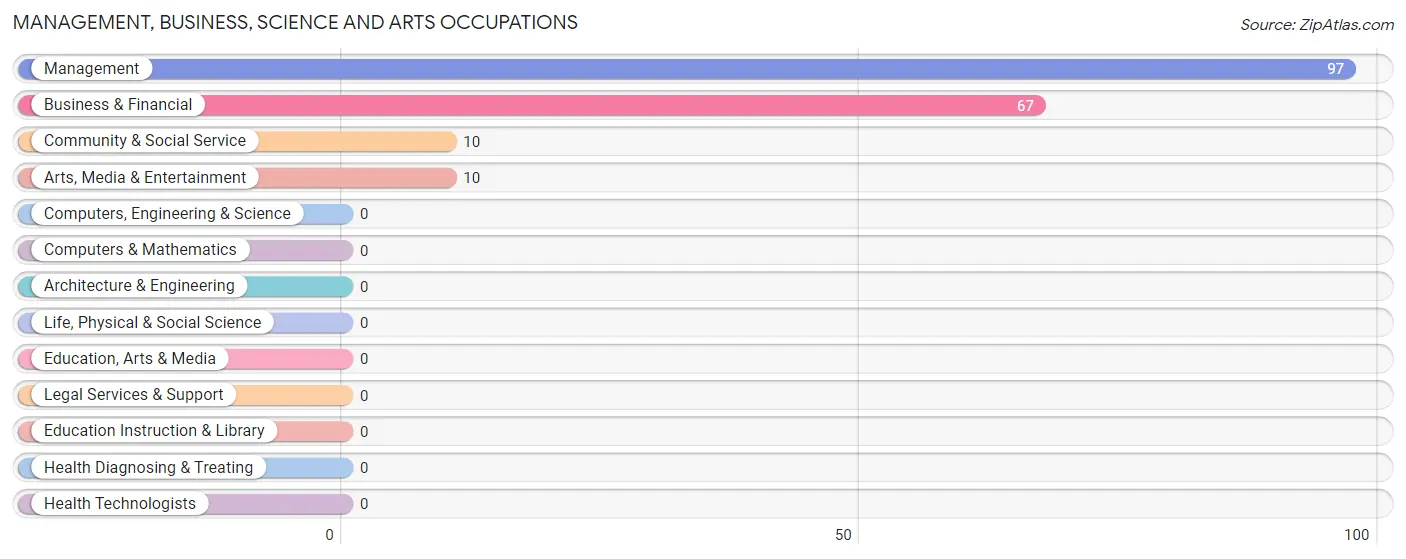
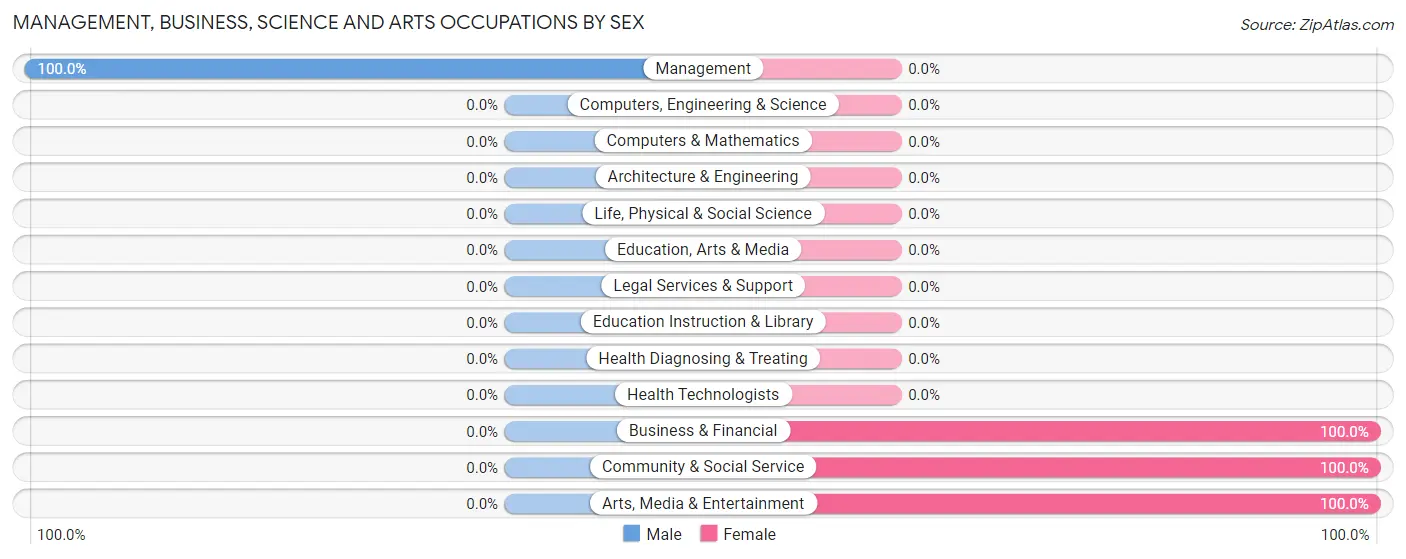
Management, Business, Science and Arts Occupations
The most common Management, Business, Science and Arts occupations in Timber Lakes are Management (97 | 34.5%), Business & Financial (67 | 23.8%), Community & Social Service (10 | 3.6%), and Arts, Media & Entertainment (10 | 3.6%).
Management, Business, Science and Arts Occupations by Sex
| Occupation | Male | Female |
| Management | 97 (100.0%) | 0 (0.0%) |
| Business & Financial | 0 (0.0%) | 67 (100.0%) |
| Computers, Engineering & Science | 0 (0.0%) | 0 (0.0%) |
| Computers & Mathematics | 0 (0.0%) | 0 (0.0%) |
| Architecture & Engineering | 0 (0.0%) | 0 (0.0%) |
| Life, Physical & Social Science | 0 (0.0%) | 0 (0.0%) |
| Community & Social Service | 0 (0.0%) | 10 (100.0%) |
| Education, Arts & Media | 0 (0.0%) | 0 (0.0%) |
| Legal Services & Support | 0 (0.0%) | 0 (0.0%) |
| Education Instruction & Library | 0 (0.0%) | 0 (0.0%) |
| Arts, Media & Entertainment | 0 (0.0%) | 10 (100.0%) |
| Health Diagnosing & Treating | 0 (0.0%) | 0 (0.0%) |
| Health Technologists | 0 (0.0%) | 0 (0.0%) |
| Total (Category) | 97 (55.7%) | 77 (44.3%) |
| Total (Overall) | 184 (65.5%) | 97 (34.5%) |
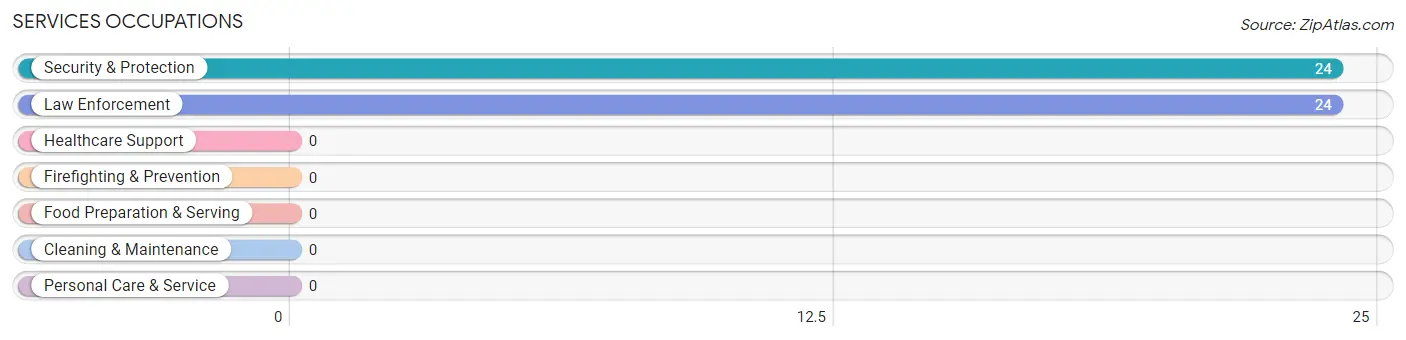
Services Occupations
The most common Services occupations in Timber Lakes are Security & Protection (24 | 8.5%), and Law Enforcement (24 | 8.5%).
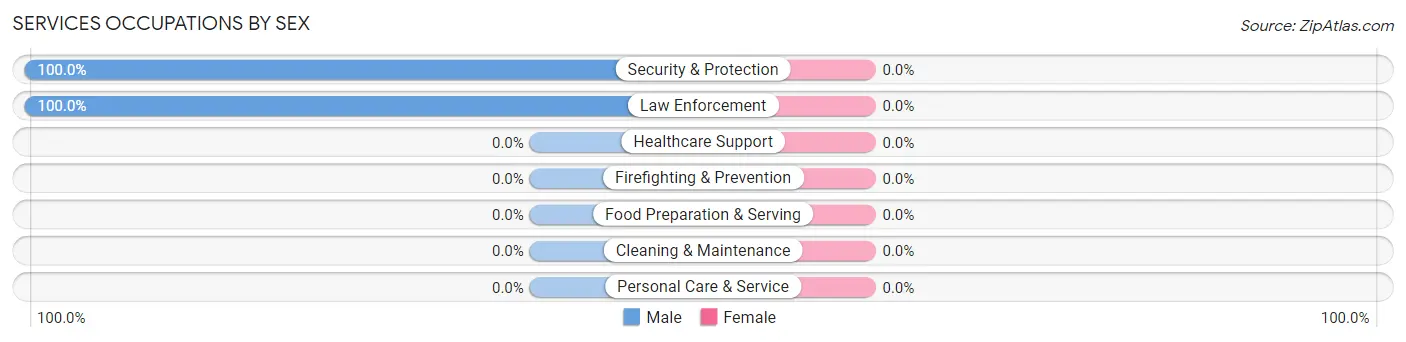
Services Occupations by Sex
| Occupation | Male | Female |
| Healthcare Support | 0 (0.0%) | 0 (0.0%) |
| Security & Protection | 24 (100.0%) | 0 (0.0%) |
| Firefighting & Prevention | 0 (0.0%) | 0 (0.0%) |
| Law Enforcement | 24 (100.0%) | 0 (0.0%) |
| Food Preparation & Serving | 0 (0.0%) | 0 (0.0%) |
| Cleaning & Maintenance | 0 (0.0%) | 0 (0.0%) |
| Personal Care & Service | 0 (0.0%) | 0 (0.0%) |
| Total (Category) | 24 (100.0%) | 0 (0.0%) |
| Total (Overall) | 184 (65.5%) | 97 (34.5%) |
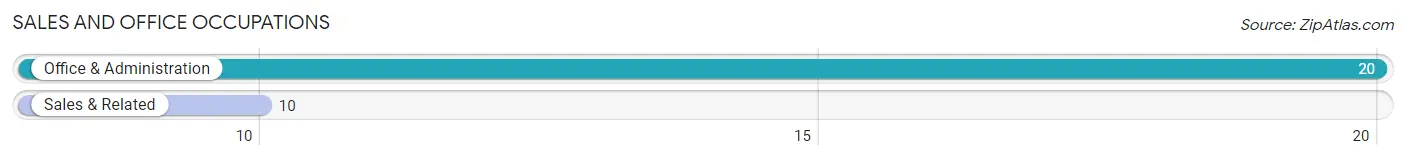
Sales and Office Occupations
The most common Sales and Office occupations in Timber Lakes are Office & Administration (20 | 7.1%), and Sales & Related (10 | 3.6%).
Sales and Office Occupations by Sex
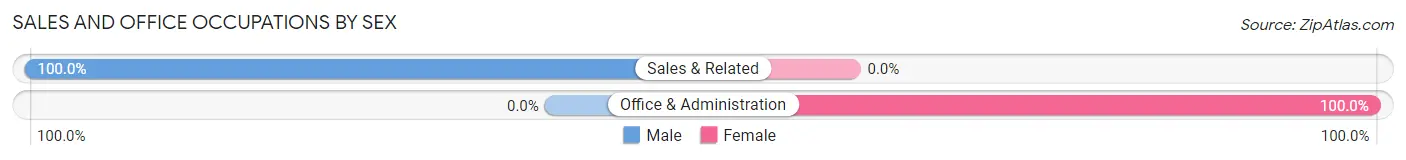
| Occupation | Male | Female |
| Sales & Related | 10 (100.0%) | 0 (0.0%) |
| Office & Administration | 0 (0.0%) | 20 (100.0%) |
| Total (Category) | 10 (33.3%) | 20 (66.7%) |
| Total (Overall) | 184 (65.5%) | 97 (34.5%) |
Natural Resources, Construction and Maintenance Occupations
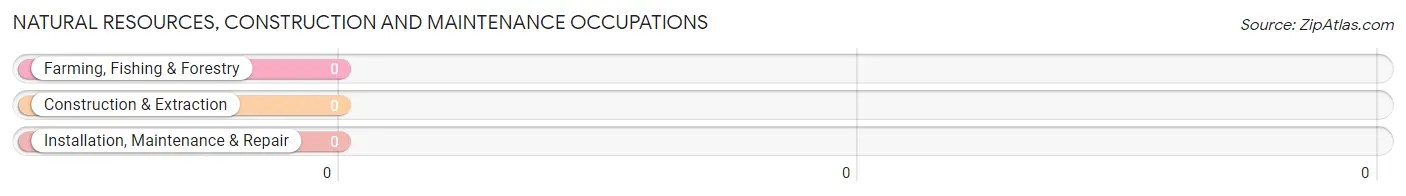
Natural Resources, Construction and Maintenance Occupations by Sex
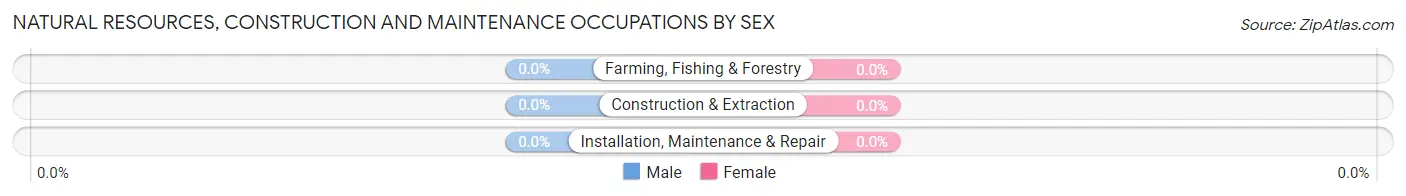
| Occupation | Male | Female |
| Farming, Fishing & Forestry | 0 (0.0%) | 0 (0.0%) |
| Construction & Extraction | 0 (0.0%) | 0 (0.0%) |
| Installation, Maintenance & Repair | 0 (0.0%) | 0 (0.0%) |
| Total (Category) | 0 (0.0%) | 0 (0.0%) |
| Total (Overall) | 184 (65.5%) | 97 (34.5%) |
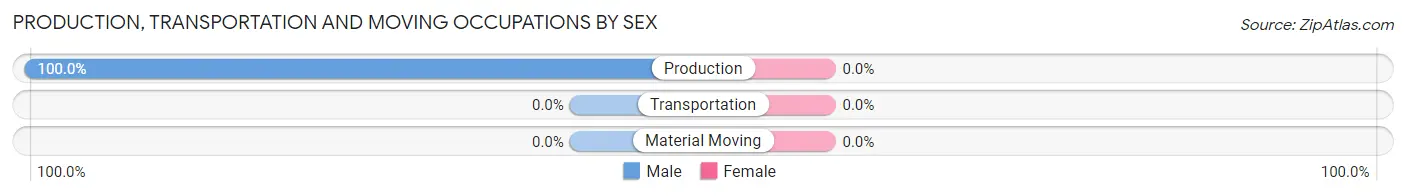
Production, Transportation and Moving Occupations
The most common Production, Transportation and Moving occupations in Timber Lakes are , and Production (53 | 18.9%).
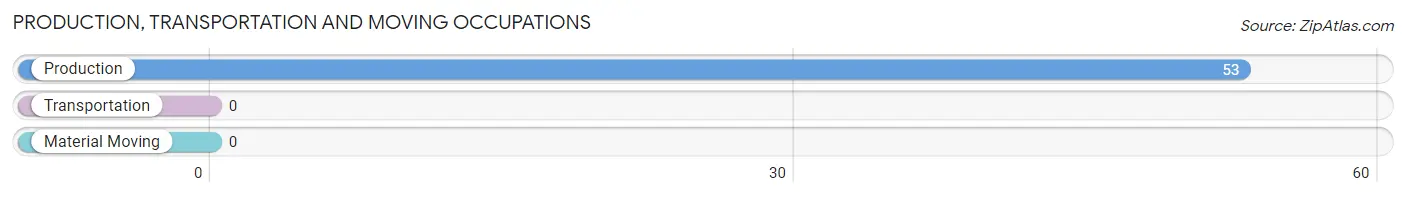
Production, Transportation and Moving Occupations by Sex
| Occupation | Male | Female |
| Production | 53 (100.0%) | 0 (0.0%) |
| Transportation | 0 (0.0%) | 0 (0.0%) |
| Material Moving | 0 (0.0%) | 0 (0.0%) |
| Total (Category) | 53 (100.0%) | 0 (0.0%) |
| Total (Overall) | 184 (65.5%) | 97 (34.5%) |
Employment Industries by Sex in Timber Lakes
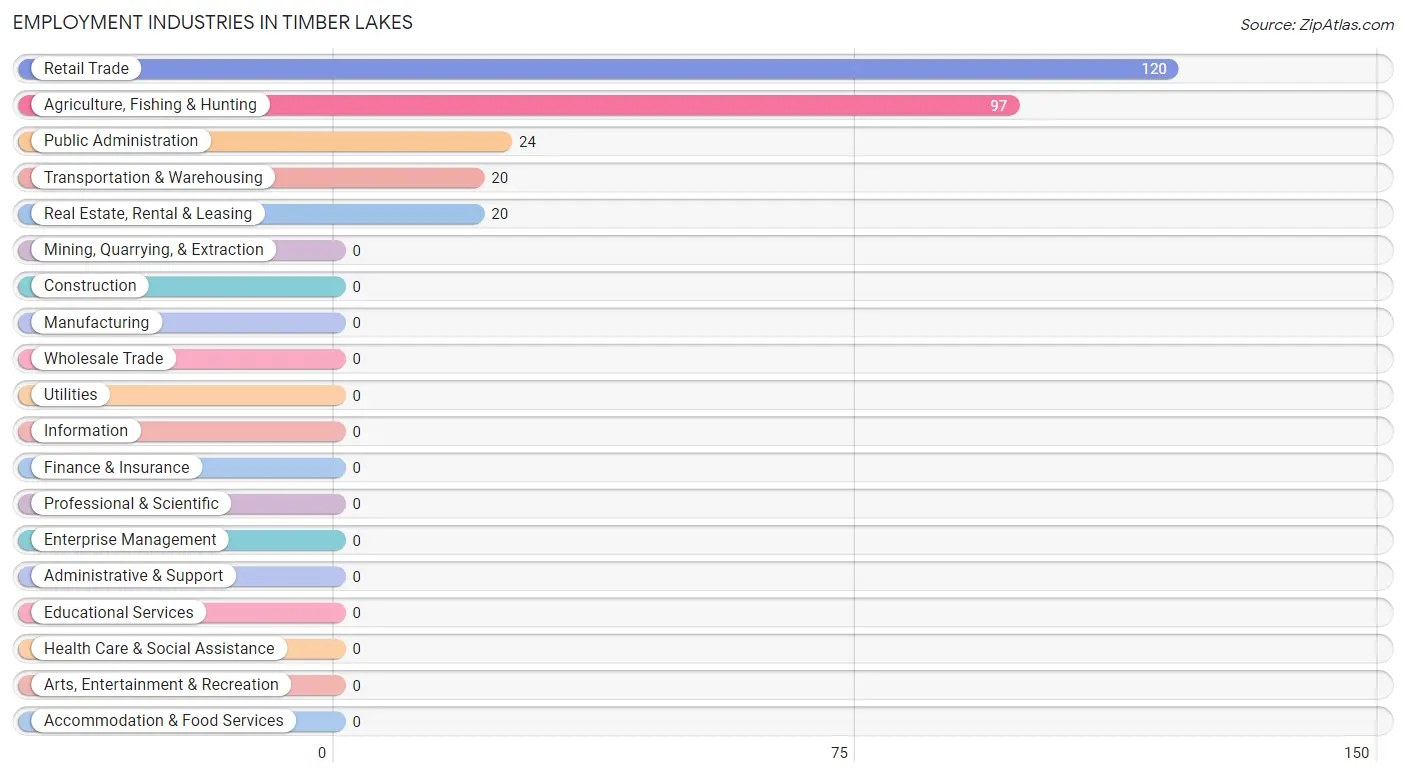
Employment Industries in Timber Lakes
The major employment industries in Timber Lakes include Retail Trade (120 | 42.7%), Agriculture, Fishing & Hunting (97 | 34.5%), Public Administration (24 | 8.5%), Transportation & Warehousing (20 | 7.1%), and Real Estate, Rental & Leasing (20 | 7.1%).
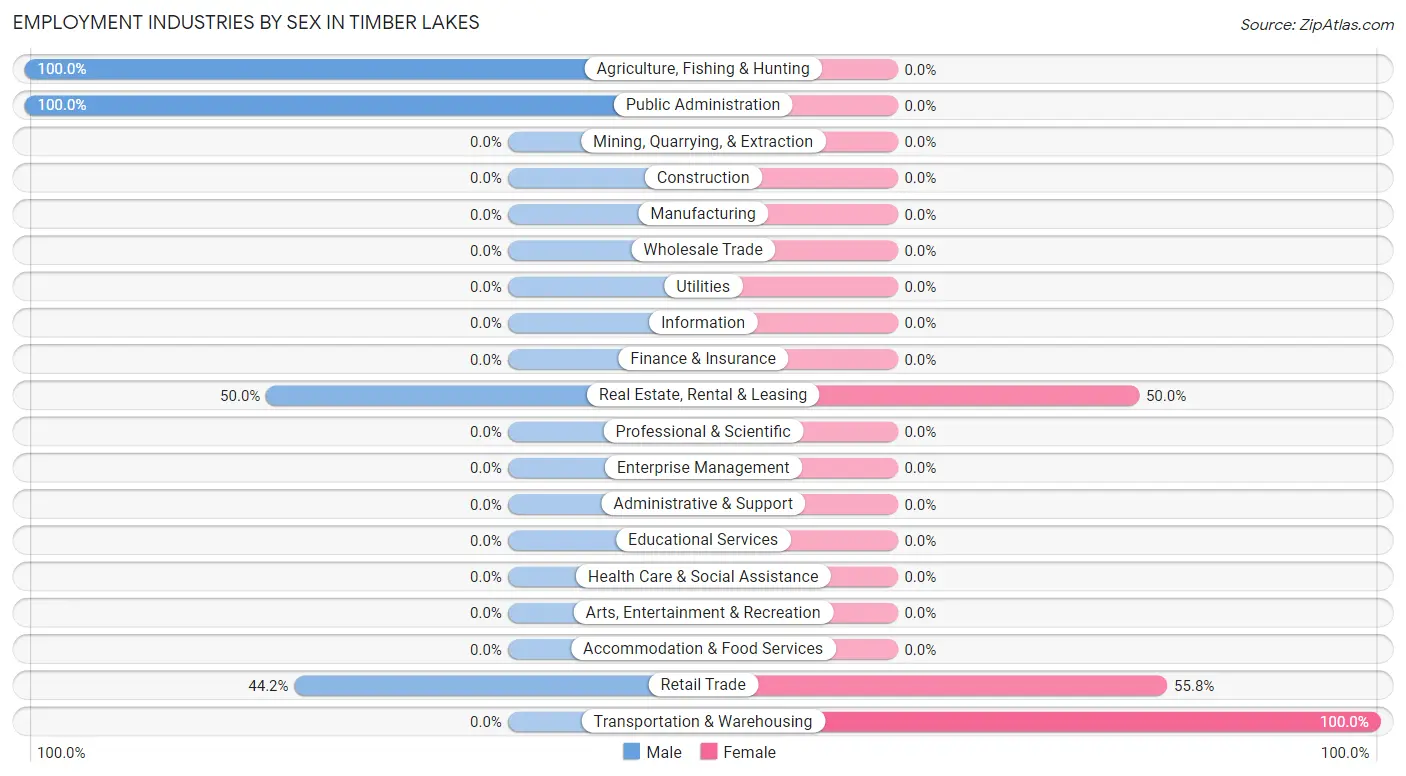
Employment Industries by Sex in Timber Lakes
The Timber Lakes industries that see more men than women are Agriculture, Fishing & Hunting (100.0%), Public Administration (100.0%), and Real Estate, Rental & Leasing (50.0%), whereas the industries that tend to have a higher number of women are Transportation & Warehousing (100.0%), Retail Trade (55.8%), and Real Estate, Rental & Leasing (50.0%).
| Industry | Male | Female |
| Agriculture, Fishing & Hunting | 97 (100.0%) | 0 (0.0%) |
| Mining, Quarrying, & Extraction | 0 (0.0%) | 0 (0.0%) |
| Construction | 0 (0.0%) | 0 (0.0%) |
| Manufacturing | 0 (0.0%) | 0 (0.0%) |
| Wholesale Trade | 0 (0.0%) | 0 (0.0%) |
| Retail Trade | 53 (44.2%) | 67 (55.8%) |
| Transportation & Warehousing | 0 (0.0%) | 20 (100.0%) |
| Utilities | 0 (0.0%) | 0 (0.0%) |
| Information | 0 (0.0%) | 0 (0.0%) |
| Finance & Insurance | 0 (0.0%) | 0 (0.0%) |
| Real Estate, Rental & Leasing | 10 (50.0%) | 10 (50.0%) |
| Professional & Scientific | 0 (0.0%) | 0 (0.0%) |
| Enterprise Management | 0 (0.0%) | 0 (0.0%) |
| Administrative & Support | 0 (0.0%) | 0 (0.0%) |
| Educational Services | 0 (0.0%) | 0 (0.0%) |
| Health Care & Social Assistance | 0 (0.0%) | 0 (0.0%) |
| Arts, Entertainment & Recreation | 0 (0.0%) | 0 (0.0%) |
| Accommodation & Food Services | 0 (0.0%) | 0 (0.0%) |
| Public Administration | 24 (100.0%) | 0 (0.0%) |
| Total | 184 (65.5%) | 97 (34.5%) |
Education in Timber Lakes
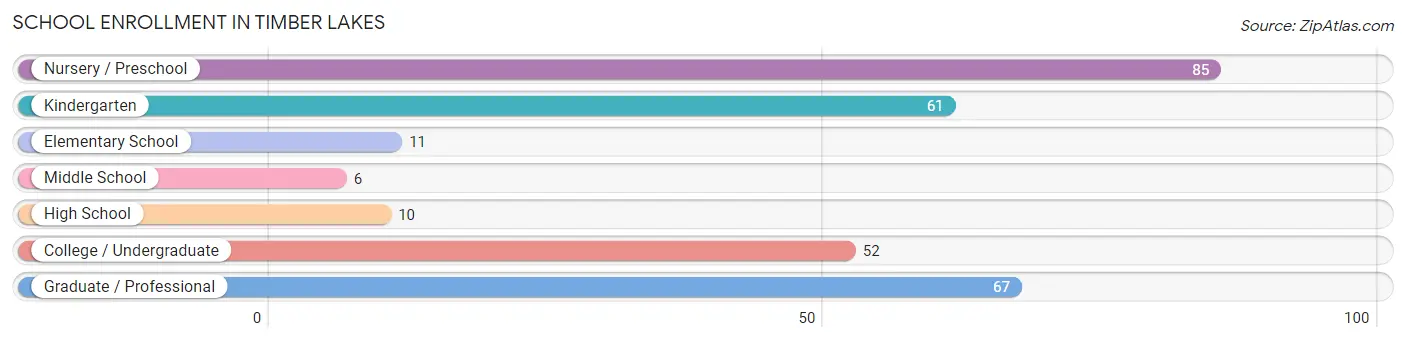
School Enrollment in Timber Lakes
The most common levels of schooling among the 292 students in Timber Lakes are nursery / preschool (85 | 29.1%), graduate / professional (67 | 23.0%), and kindergarten (61 | 20.9%).
| School Level | # Students | % Students |
| Nursery / Preschool | 85 | 29.1% |
| Kindergarten | 61 | 20.9% |
| Elementary School | 11 | 3.8% |
| Middle School | 6 | 2.1% |
| High School | 10 | 3.4% |
| College / Undergraduate | 52 | 17.8% |
| Graduate / Professional | 67 | 23.0% |
| Total | 292 | 100.0% |
School Enrollment by Age by Funding Source in Timber Lakes
Out of a total of 292 students who are enrolled in schools in Timber Lakes, 85 (29.1%) attend a private institution, while the remaining 207 (70.9%) are enrolled in public schools. The age group of 20 to 24 year olds has the highest likelihood of being enrolled in private schools, with 18 (100.0% in the age bracket) enrolled. Conversely, the age group of 3 to 4 year olds has the lowest likelihood of being enrolled in a private school, with 74 (100.0% in the age bracket) attending a public institution.
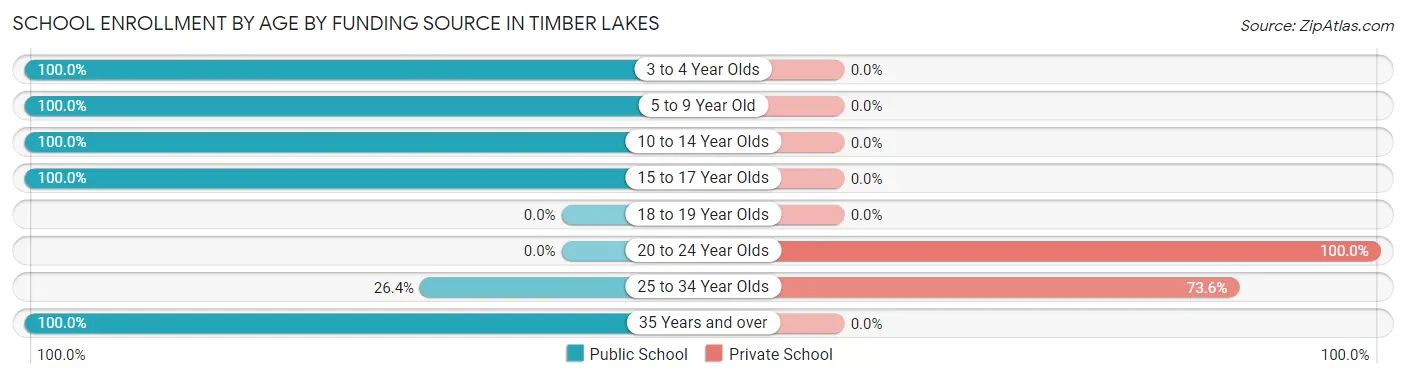
| Age Bracket | Public School | Private School |
| 3 to 4 Year Olds | 74 (100.0%) | 0 (0.0%) |
| 5 to 9 Year Old | 83 (100.0%) | 0 (0.0%) |
| 10 to 14 Year Olds | 6 (100.0%) | 0 (0.0%) |
| 15 to 17 Year Olds | 10 (100.0%) | 0 (0.0%) |
| 18 to 19 Year Olds | 0 (0.0%) | 0 (0.0%) |
| 20 to 24 Year Olds | 0 (0.0%) | 18 (100.0%) |
| 25 to 34 Year Olds | 24 (26.4%) | 67 (73.6%) |
| 35 Years and over | 10 (100.0%) | 0 (0.0%) |
| Total | 207 (70.9%) | 85 (29.1%) |
Educational Attainment by Field of Study in Timber Lakes
Business (114 | 40.7%), arts & humanities (47 | 16.8%), bio, nature & agricultural (43 | 15.4%), engineering (40 | 14.3%), and science & technology (17 | 6.1%) are the most common fields of study among 280 individuals in Timber Lakes who have obtained a bachelor's degree or higher.
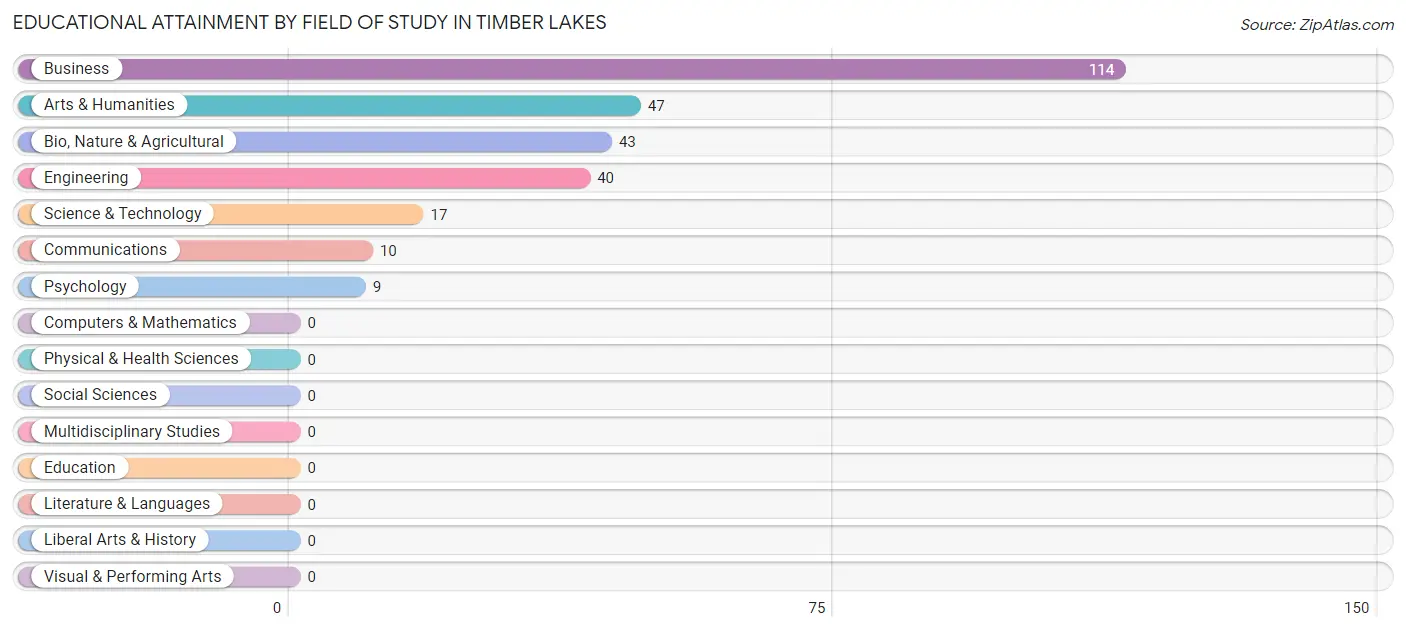
| Field of Study | # Graduates | % Graduates |
| Computers & Mathematics | 0 | 0.0% |
| Bio, Nature & Agricultural | 43 | 15.4% |
| Physical & Health Sciences | 0 | 0.0% |
| Psychology | 9 | 3.2% |
| Social Sciences | 0 | 0.0% |
| Engineering | 40 | 14.3% |
| Multidisciplinary Studies | 0 | 0.0% |
| Science & Technology | 17 | 6.1% |
| Business | 114 | 40.7% |
| Education | 0 | 0.0% |
| Literature & Languages | 0 | 0.0% |
| Liberal Arts & History | 0 | 0.0% |
| Visual & Performing Arts | 0 | 0.0% |
| Communications | 10 | 3.6% |
| Arts & Humanities | 47 | 16.8% |
| Total | 280 | 100.0% |
Transportation & Commute in Timber Lakes
Vehicle Availability by Sex in Timber Lakes
The most prevalent vehicle ownership categories in Timber Lakes are males with 2 vehicles (121, accounting for 65.8%) and females with 2 vehicles (20, making up 124.7%).
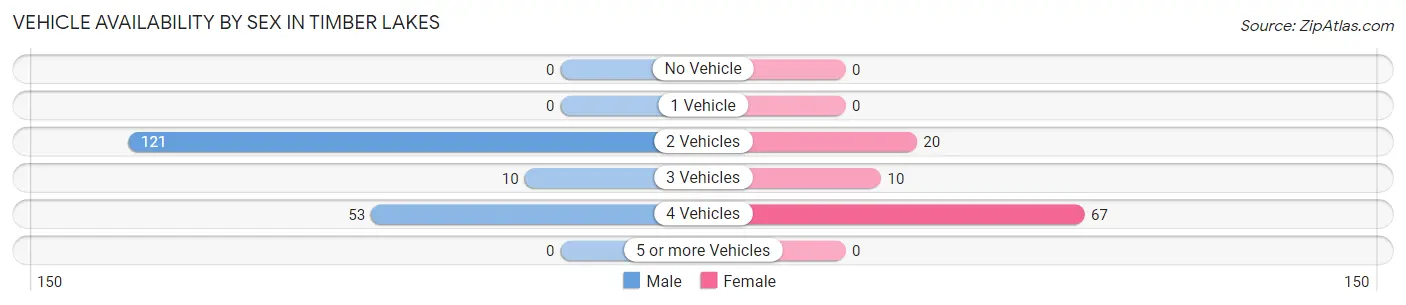
| Vehicles Available | Male | Female |
| No Vehicle | 0 (0.0%) | 0 (0.0%) |
| 1 Vehicle | 0 (0.0%) | 0 (0.0%) |
| 2 Vehicles | 121 (65.8%) | 20 (20.6%) |
| 3 Vehicles | 10 (5.4%) | 10 (10.3%) |
| 4 Vehicles | 53 (28.8%) | 67 (69.1%) |
| 5 or more Vehicles | 0 (0.0%) | 0 (0.0%) |
| Total | 184 (100.0%) | 97 (100.0%) |
Commute Time in Timber Lakes
The most frequently occuring commute durations in Timber Lakes are 45 to 59 minutes (120 commuters, 69.0%), less than 5 minutes (24 commuters, 13.8%), and 15 to 19 minutes (20 commuters, 11.5%).
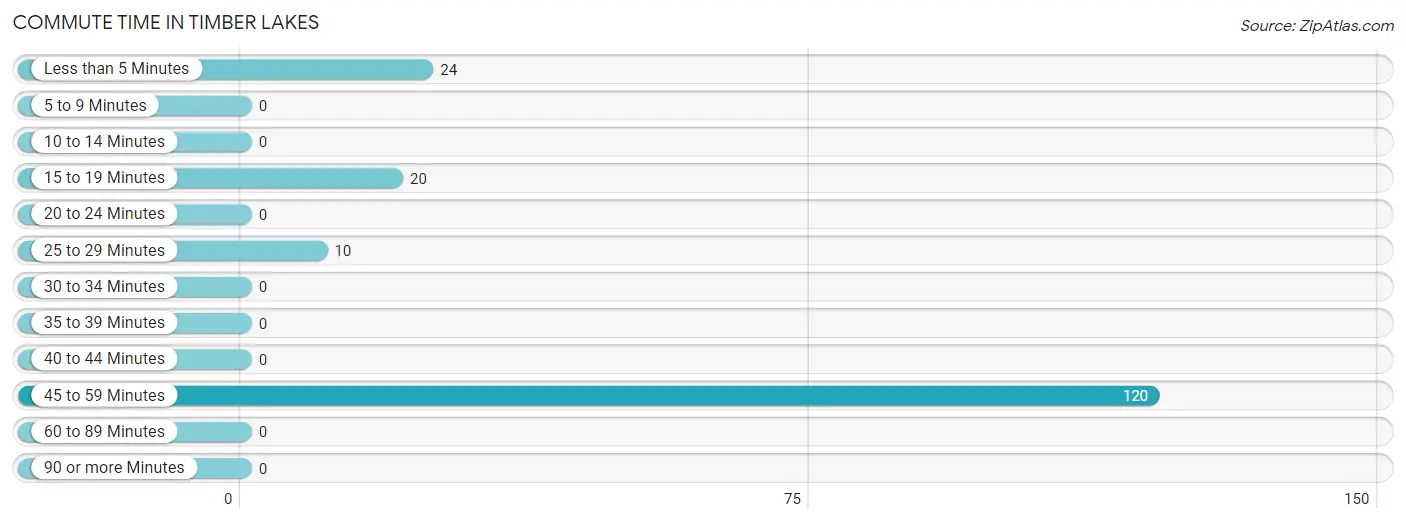
| Commute Time | # Commuters | % Commuters |
| Less than 5 Minutes | 24 | 13.8% |
| 5 to 9 Minutes | 0 | 0.0% |
| 10 to 14 Minutes | 0 | 0.0% |
| 15 to 19 Minutes | 20 | 11.5% |
| 20 to 24 Minutes | 0 | 0.0% |
| 25 to 29 Minutes | 10 | 5.8% |
| 30 to 34 Minutes | 0 | 0.0% |
| 35 to 39 Minutes | 0 | 0.0% |
| 40 to 44 Minutes | 0 | 0.0% |
| 45 to 59 Minutes | 120 | 69.0% |
| 60 to 89 Minutes | 0 | 0.0% |
| 90 or more Minutes | 0 | 0.0% |
Commute Time by Sex in Timber Lakes
The most common commute times in Timber Lakes are 45 to 59 minutes (53 commuters, 60.9%) for males and 45 to 59 minutes (67 commuters, 77.0%) for females.
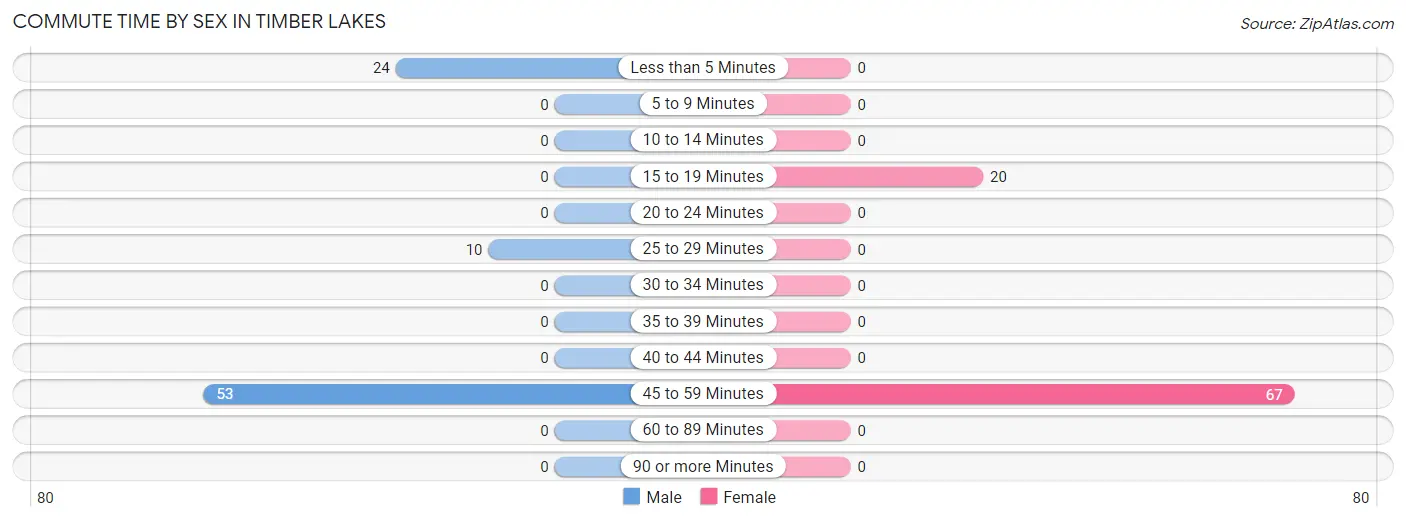
| Commute Time | Male | Female |
| Less than 5 Minutes | 24 (27.6%) | 0 (0.0%) |
| 5 to 9 Minutes | 0 (0.0%) | 0 (0.0%) |
| 10 to 14 Minutes | 0 (0.0%) | 0 (0.0%) |
| 15 to 19 Minutes | 0 (0.0%) | 20 (23.0%) |
| 20 to 24 Minutes | 0 (0.0%) | 0 (0.0%) |
| 25 to 29 Minutes | 10 (11.5%) | 0 (0.0%) |
| 30 to 34 Minutes | 0 (0.0%) | 0 (0.0%) |
| 35 to 39 Minutes | 0 (0.0%) | 0 (0.0%) |
| 40 to 44 Minutes | 0 (0.0%) | 0 (0.0%) |
| 45 to 59 Minutes | 53 (60.9%) | 67 (77.0%) |
| 60 to 89 Minutes | 0 (0.0%) | 0 (0.0%) |
| 90 or more Minutes | 0 (0.0%) | 0 (0.0%) |
Time of Departure to Work by Sex in Timber Lakes
The most frequent times of departure to work in Timber Lakes are 8:00 AM to 8:29 AM (53, 60.9%) for males and 8:00 AM to 8:29 AM (67, 77.0%) for females.
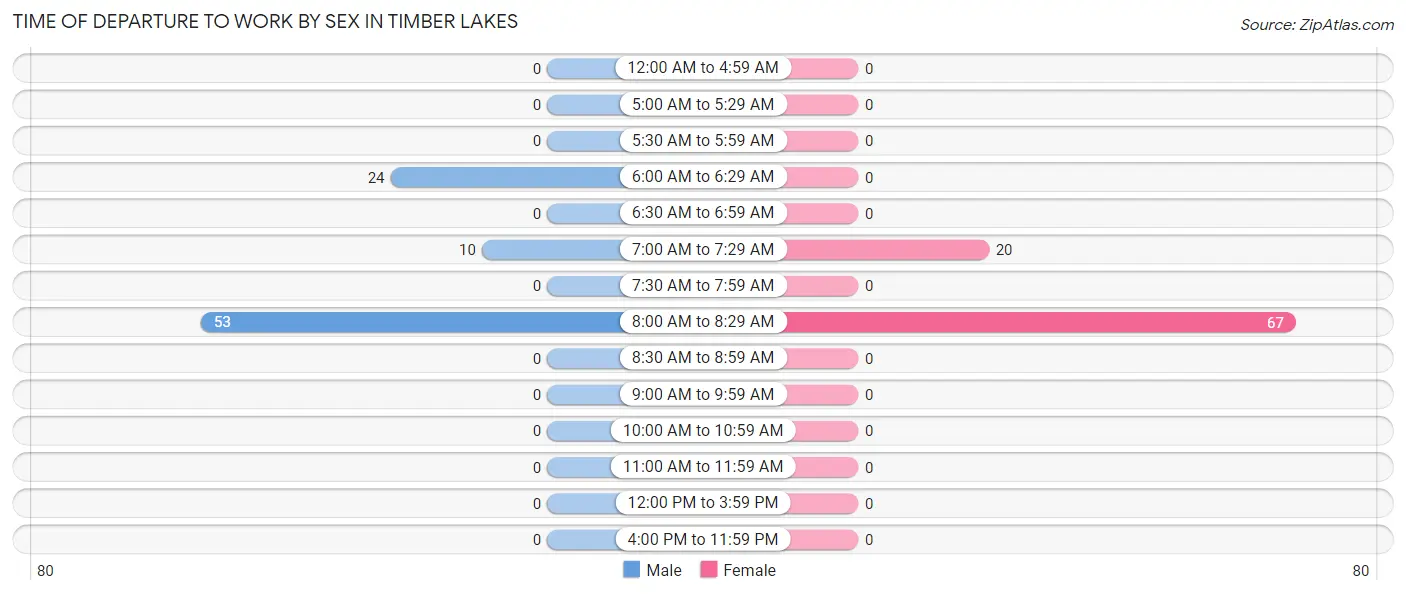
| Time of Departure | Male | Female |
| 12:00 AM to 4:59 AM | 0 (0.0%) | 0 (0.0%) |
| 5:00 AM to 5:29 AM | 0 (0.0%) | 0 (0.0%) |
| 5:30 AM to 5:59 AM | 0 (0.0%) | 0 (0.0%) |
| 6:00 AM to 6:29 AM | 24 (27.6%) | 0 (0.0%) |
| 6:30 AM to 6:59 AM | 0 (0.0%) | 0 (0.0%) |
| 7:00 AM to 7:29 AM | 10 (11.5%) | 20 (23.0%) |
| 7:30 AM to 7:59 AM | 0 (0.0%) | 0 (0.0%) |
| 8:00 AM to 8:29 AM | 53 (60.9%) | 67 (77.0%) |
| 8:30 AM to 8:59 AM | 0 (0.0%) | 0 (0.0%) |
| 9:00 AM to 9:59 AM | 0 (0.0%) | 0 (0.0%) |
| 10:00 AM to 10:59 AM | 0 (0.0%) | 0 (0.0%) |
| 11:00 AM to 11:59 AM | 0 (0.0%) | 0 (0.0%) |
| 12:00 PM to 3:59 PM | 0 (0.0%) | 0 (0.0%) |
| 4:00 PM to 11:59 PM | 0 (0.0%) | 0 (0.0%) |
| Total | 87 (100.0%) | 87 (100.0%) |
Housing Occupancy in Timber Lakes
Occupancy by Ownership in Timber Lakes
Of the total 337 dwellings in Timber Lakes, owner-occupied units account for 337 (100.0%), while renter-occupied units make up 0 (0.0%).
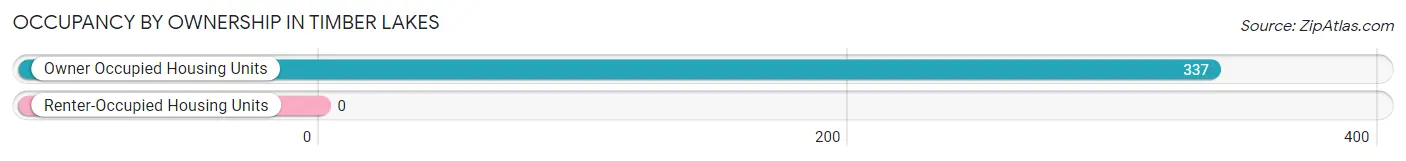
| Occupancy | # Housing Units | % Housing Units |
| Owner Occupied Housing Units | 337 | 100.0% |
| Renter-Occupied Housing Units | 0 | 0.0% |
| Total Occupied Housing Units | 337 | 100.0% |
Occupancy by Household Size in Timber Lakes
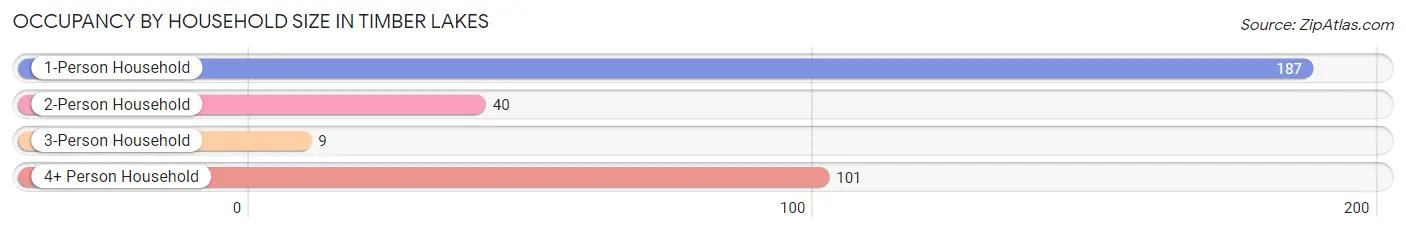
| Household Size | # Housing Units | % Housing Units |
| 1-Person Household | 187 | 55.5% |
| 2-Person Household | 40 | 11.9% |
| 3-Person Household | 9 | 2.7% |
| 4+ Person Household | 101 | 30.0% |
| Total Housing Units | 337 | 100.0% |
Occupancy by Ownership by Household Size in Timber Lakes
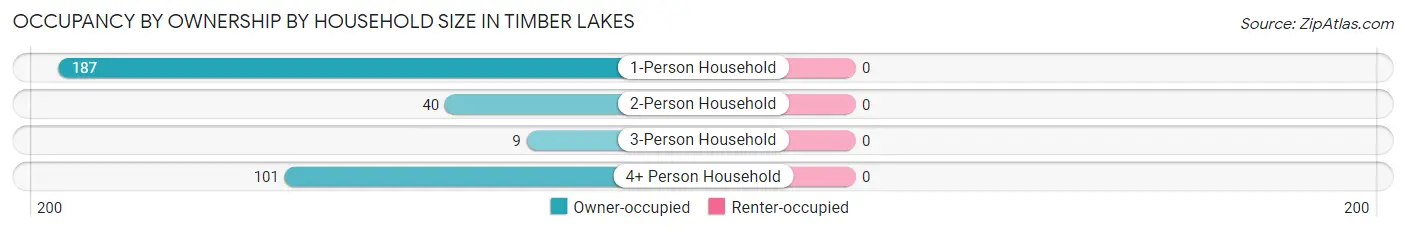
| Household Size | Owner-occupied | Renter-occupied |
| 1-Person Household | 187 (100.0%) | 0 (0.0%) |
| 2-Person Household | 40 (100.0%) | 0 (0.0%) |
| 3-Person Household | 9 (100.0%) | 0 (0.0%) |
| 4+ Person Household | 101 (100.0%) | 0 (0.0%) |
| Total Housing Units | 337 (100.0%) | 0 (0.0%) |
Occupancy by Educational Attainment in Timber Lakes
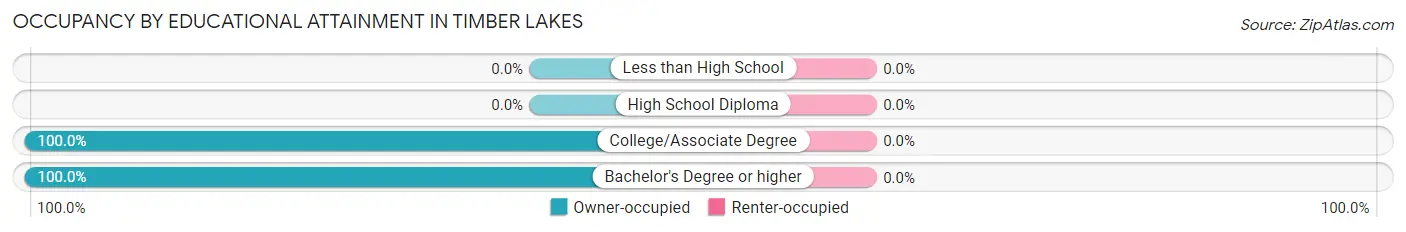
| Household Size | Owner-occupied | Renter-occupied |
| Less than High School | 0 (0.0%) | 0 (0.0%) |
| High School Diploma | 0 (0.0%) | 0 (0.0%) |
| College/Associate Degree | 121 (100.0%) | 0 (0.0%) |
| Bachelor's Degree or higher | 216 (100.0%) | 0 (0.0%) |
Occupancy by Age of Householder in Timber Lakes
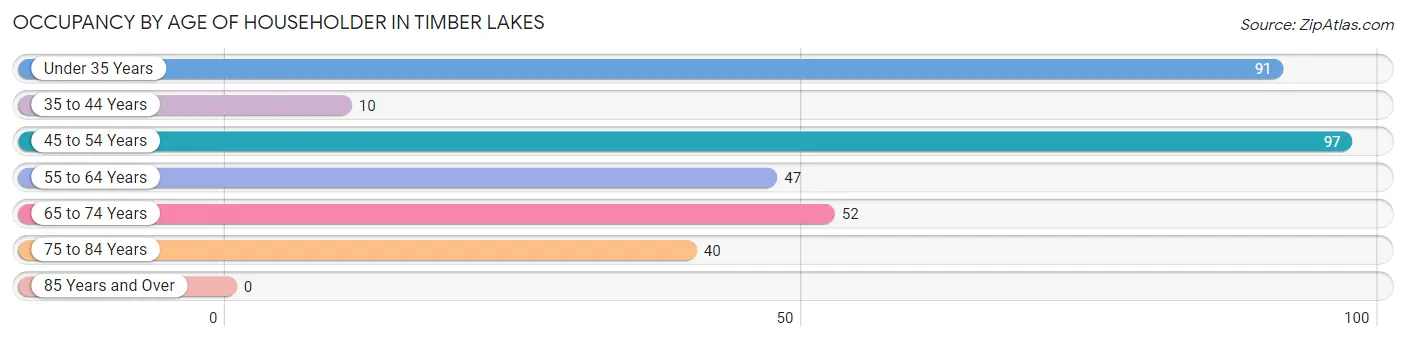
| Age Bracket | # Households | % Households |
| Under 35 Years | 91 | 27.0% |
| 35 to 44 Years | 10 | 3.0% |
| 45 to 54 Years | 97 | 28.8% |
| 55 to 64 Years | 47 | 14.0% |
| 65 to 74 Years | 52 | 15.4% |
| 75 to 84 Years | 40 | 11.9% |
| 85 Years and Over | 0 | 0.0% |
| Total | 337 | 100.0% |
Housing Finances in Timber Lakes
Median Income by Occupancy in Timber Lakes
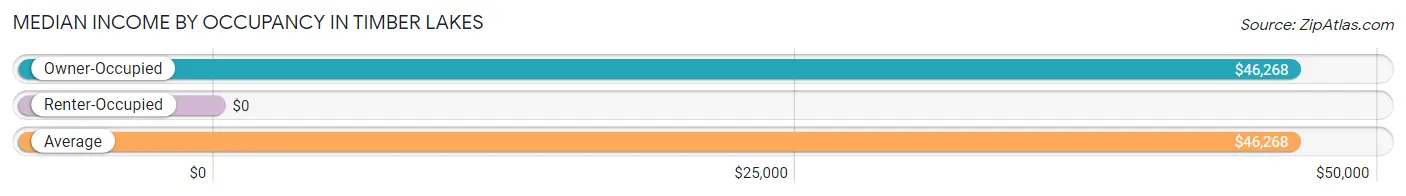
| Occupancy Type | # Households | Median Income |
| Owner-Occupied | 337 (100.0%) | $46,268 |
| Renter-Occupied | 0 (0.0%) | $0 |
| Average | 337 (100.0%) | $46,268 |
Occupancy by Householder Income Bracket in Timber Lakes
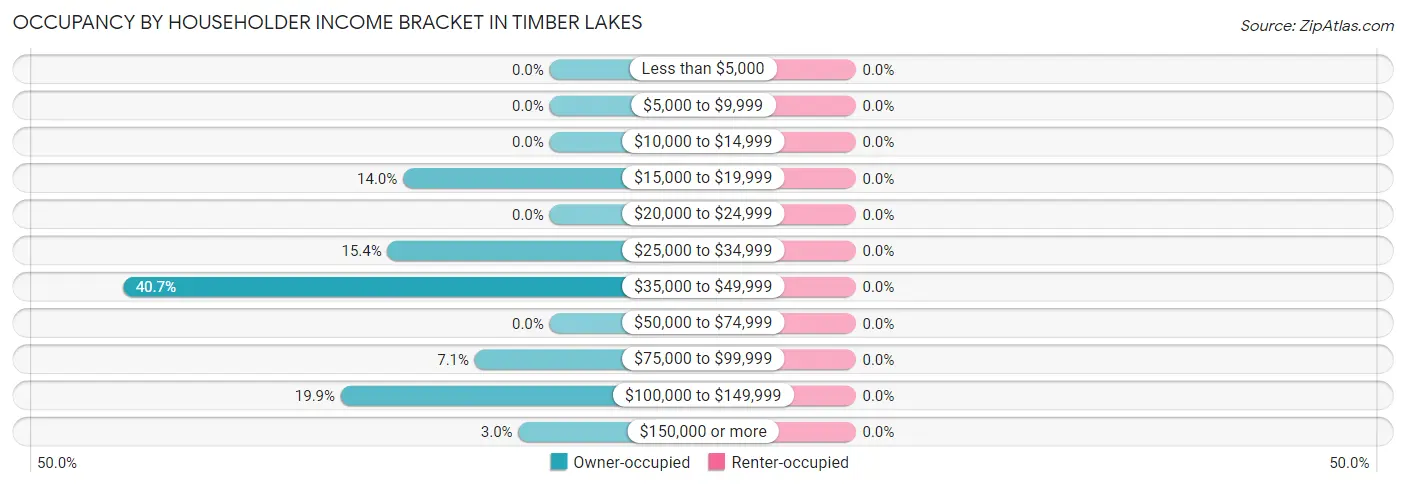
| Income Bracket | Owner-occupied | Renter-occupied |
| Less than $5,000 | 0 (0.0%) | 0 (0.0%) |
| $5,000 to $9,999 | 0 (0.0%) | 0 (0.0%) |
| $10,000 to $14,999 | 0 (0.0%) | 0 (0.0%) |
| $15,000 to $19,999 | 47 (14.0%) | 0 (0.0%) |
| $20,000 to $24,999 | 0 (0.0%) | 0 (0.0%) |
| $25,000 to $34,999 | 52 (15.4%) | 0 (0.0%) |
| $35,000 to $49,999 | 137 (40.6%) | 0 (0.0%) |
| $50,000 to $74,999 | 0 (0.0%) | 0 (0.0%) |
| $75,000 to $99,999 | 24 (7.1%) | 0 (0.0%) |
| $100,000 to $149,999 | 67 (19.9%) | 0 (0.0%) |
| $150,000 or more | 10 (3.0%) | 0 (0.0%) |
| Total | 337 (100.0%) | 0 (0.0%) |
Monthly Housing Cost Tiers in Timber Lakes
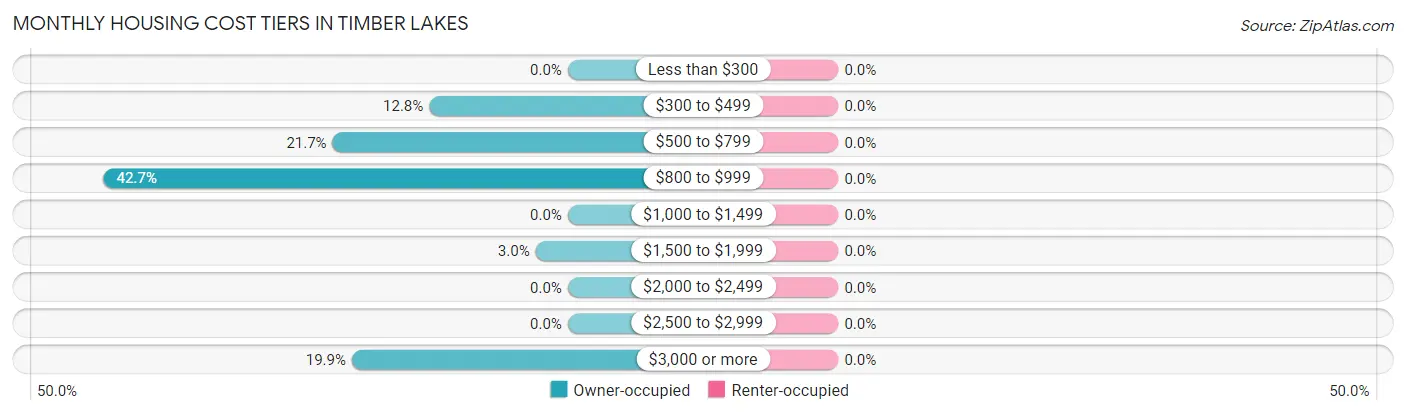
| Monthly Cost | Owner-occupied | Renter-occupied |
| Less than $300 | 0 (0.0%) | 0 (0.0%) |
| $300 to $499 | 43 (12.8%) | 0 (0.0%) |
| $500 to $799 | 73 (21.7%) | 0 (0.0%) |
| $800 to $999 | 144 (42.7%) | 0 (0.0%) |
| $1,000 to $1,499 | 0 (0.0%) | 0 (0.0%) |
| $1,500 to $1,999 | 10 (3.0%) | 0 (0.0%) |
| $2,000 to $2,499 | 0 (0.0%) | 0 (0.0%) |
| $2,500 to $2,999 | 0 (0.0%) | 0 (0.0%) |
| $3,000 or more | 67 (19.9%) | 0 (0.0%) |
| Total | 337 (100.0%) | 0 (0.0%) |
Physical Housing Characteristics in Timber Lakes
Housing Structures in Timber Lakes
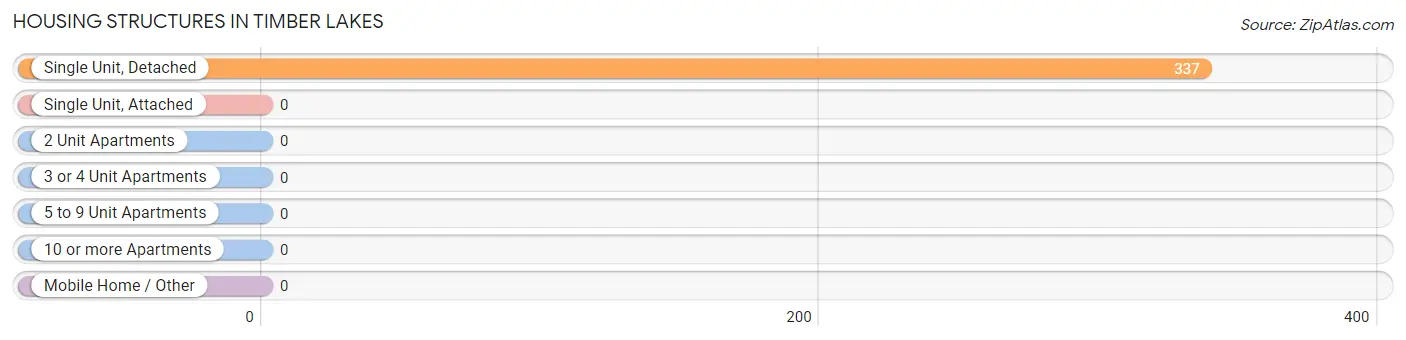
| Structure Type | # Housing Units | % Housing Units |
| Single Unit, Detached | 337 | 100.0% |
| Single Unit, Attached | 0 | 0.0% |
| 2 Unit Apartments | 0 | 0.0% |
| 3 or 4 Unit Apartments | 0 | 0.0% |
| 5 to 9 Unit Apartments | 0 | 0.0% |
| 10 or more Apartments | 0 | 0.0% |
| Mobile Home / Other | 0 | 0.0% |
| Total | 337 | 100.0% |
Housing Structures by Occupancy in Timber Lakes
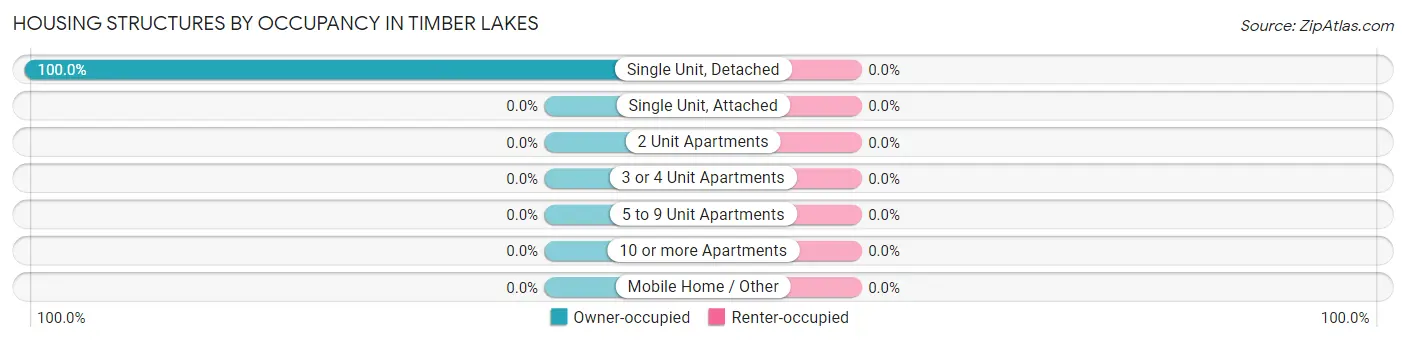
| Structure Type | Owner-occupied | Renter-occupied |
| Single Unit, Detached | 337 (100.0%) | 0 (0.0%) |
| Single Unit, Attached | 0 (0.0%) | 0 (0.0%) |
| 2 Unit Apartments | 0 (0.0%) | 0 (0.0%) |
| 3 or 4 Unit Apartments | 0 (0.0%) | 0 (0.0%) |
| 5 to 9 Unit Apartments | 0 (0.0%) | 0 (0.0%) |
| 10 or more Apartments | 0 (0.0%) | 0 (0.0%) |
| Mobile Home / Other | 0 (0.0%) | 0 (0.0%) |
| Total | 337 (100.0%) | 0 (0.0%) |
Housing Structures by Number of Rooms in Timber Lakes
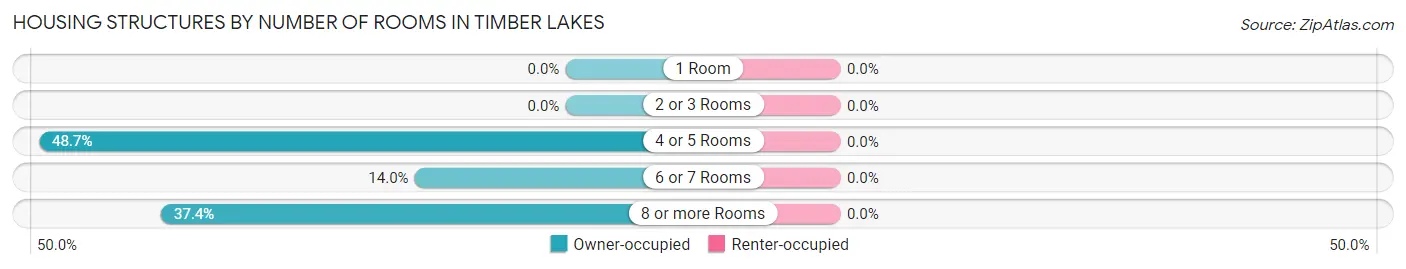
| Number of Rooms | Owner-occupied | Renter-occupied |
| 1 Room | 0 (0.0%) | 0 (0.0%) |
| 2 or 3 Rooms | 0 (0.0%) | 0 (0.0%) |
| 4 or 5 Rooms | 164 (48.7%) | 0 (0.0%) |
| 6 or 7 Rooms | 47 (14.0%) | 0 (0.0%) |
| 8 or more Rooms | 126 (37.4%) | 0 (0.0%) |
| Total | 337 (100.0%) | 0 (0.0%) |
Housing Structure by Heating Type in Timber Lakes
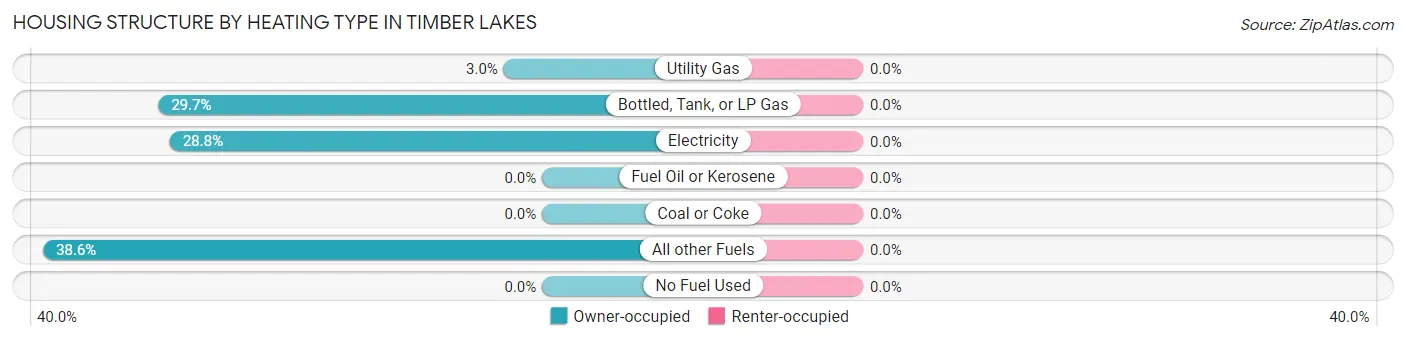
| Heating Type | Owner-occupied | Renter-occupied |
| Utility Gas | 10 (3.0%) | 0 (0.0%) |
| Bottled, Tank, or LP Gas | 100 (29.7%) | 0 (0.0%) |
| Electricity | 97 (28.8%) | 0 (0.0%) |
| Fuel Oil or Kerosene | 0 (0.0%) | 0 (0.0%) |
| Coal or Coke | 0 (0.0%) | 0 (0.0%) |
| All other Fuels | 130 (38.6%) | 0 (0.0%) |
| No Fuel Used | 0 (0.0%) | 0 (0.0%) |
| Total | 337 (100.0%) | 0 (0.0%) |
Household Vehicle Usage in Timber Lakes
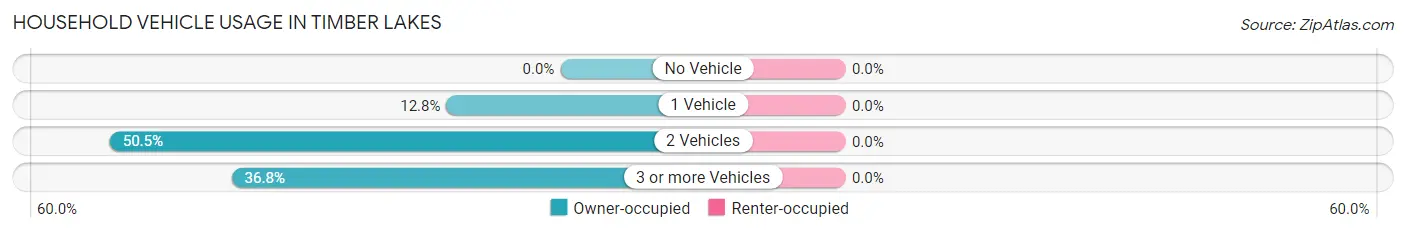
| Vehicles per Household | Owner-occupied | Renter-occupied |
| No Vehicle | 0 (0.0%) | 0 (0.0%) |
| 1 Vehicle | 43 (12.8%) | 0 (0.0%) |
| 2 Vehicles | 170 (50.4%) | 0 (0.0%) |
| 3 or more Vehicles | 124 (36.8%) | 0 (0.0%) |
| Total | 337 (100.0%) | 0 (0.0%) |
Real Estate & Mortgages in Timber Lakes
Real Estate and Mortgage Overview in Timber Lakes
| Characteristic | Without Mortgage | With Mortgage |
| Housing Units | 139 | 198 |
| Median Property Value | $567,800 | $481,800 |
| Median Household Income | $28,808 | $10 |
| Monthly Housing Costs | $666 | $67 |
| Real Estate Taxes | - | - |
Property Value by Mortgage Status in Timber Lakes
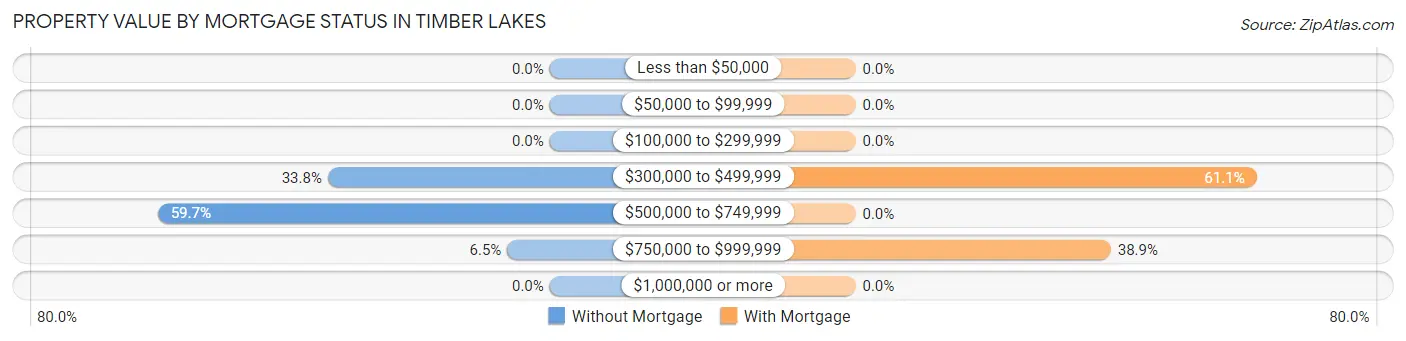
| Property Value | Without Mortgage | With Mortgage |
| Less than $50,000 | 0 (0.0%) | 0 (0.0%) |
| $50,000 to $99,999 | 0 (0.0%) | 0 (0.0%) |
| $100,000 to $299,999 | 0 (0.0%) | 0 (0.0%) |
| $300,000 to $499,999 | 47 (33.8%) | 121 (61.1%) |
| $500,000 to $749,999 | 83 (59.7%) | 0 (0.0%) |
| $750,000 to $999,999 | 9 (6.5%) | 77 (38.9%) |
| $1,000,000 or more | 0 (0.0%) | 0 (0.0%) |
| Total | 139 (100.0%) | 198 (100.0%) |
Household Income by Mortgage Status in Timber Lakes
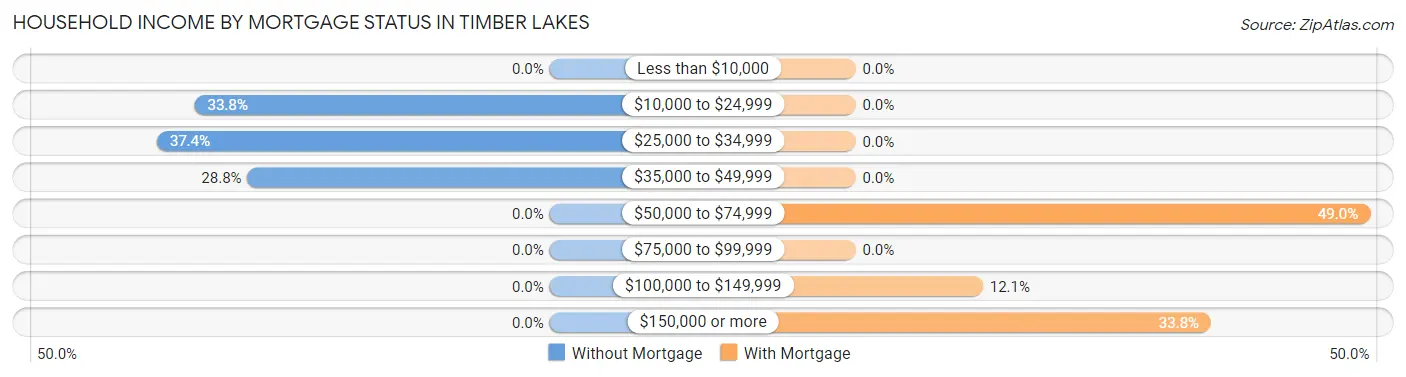
| Household Income | Without Mortgage | With Mortgage |
| Less than $10,000 | 0 (0.0%) | 0 (0.0%) |
| $10,000 to $24,999 | 47 (33.8%) | 0 (0.0%) |
| $25,000 to $34,999 | 52 (37.4%) | 0 (0.0%) |
| $35,000 to $49,999 | 40 (28.8%) | 0 (0.0%) |
| $50,000 to $74,999 | 0 (0.0%) | 97 (49.0%) |
| $75,000 to $99,999 | 0 (0.0%) | 0 (0.0%) |
| $100,000 to $149,999 | 0 (0.0%) | 24 (12.1%) |
| $150,000 or more | 0 (0.0%) | 67 (33.8%) |
| Total | 139 (100.0%) | 198 (100.0%) |
Property Value to Household Income Ratio in Timber Lakes
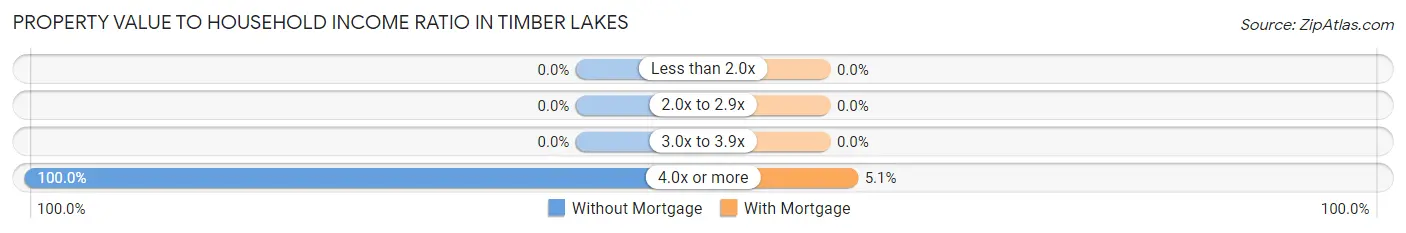
| Value-to-Income Ratio | Without Mortgage | With Mortgage |
| Less than 2.0x | 0 (0.0%) | 0 (0.0%) |
| 2.0x to 2.9x | 0 (0.0%) | 0 (0.0%) |
| 3.0x to 3.9x | 0 (0.0%) | 0 (0.0%) |
| 4.0x or more | 139 (100.0%) | 10 (5.1%) |
| Total | 139 (100.0%) | 198 (100.0%) |
Real Estate Taxes by Mortgage Status in Timber Lakes
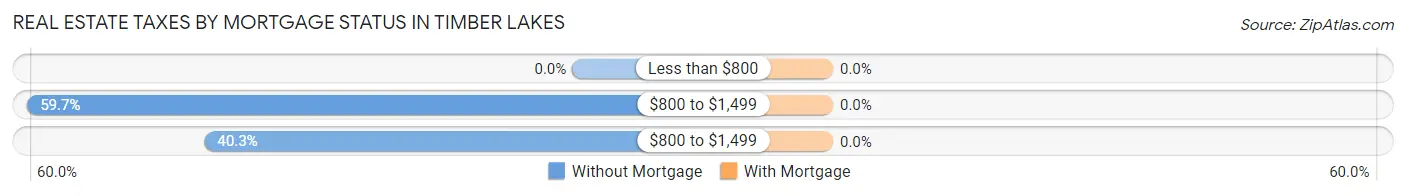
| Property Taxes | Without Mortgage | With Mortgage |
| Less than $800 | 0 (0.0%) | 0 (0.0%) |
| $800 to $1,499 | 83 (59.7%) | 0 (0.0%) |
| $800 to $1,499 | 56 (40.3%) | 0 (0.0%) |
| Total | 139 (100.0%) | 198 (100.0%) |
Health & Disability in Timber Lakes
Health Insurance Coverage by Age in Timber Lakes
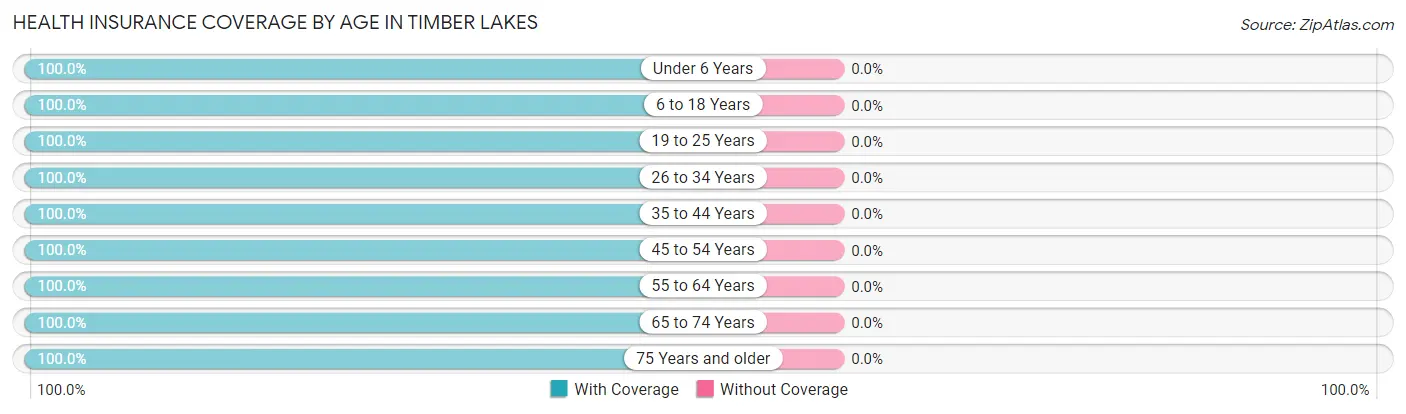
| Age Bracket | With Coverage | Without Coverage |
| Under 6 Years | 135 (100.0%) | 0 (0.0%) |
| 6 to 18 Years | 88 (100.0%) | 0 (0.0%) |
| 19 to 25 Years | 18 (100.0%) | 0 (0.0%) |
| 26 to 34 Years | 164 (100.0%) | 0 (0.0%) |
| 35 to 44 Years | 10 (100.0%) | 0 (0.0%) |
| 45 to 54 Years | 107 (100.0%) | 0 (0.0%) |
| 55 to 64 Years | 54 (100.0%) | 0 (0.0%) |
| 65 to 74 Years | 52 (100.0%) | 0 (0.0%) |
| 75 Years and older | 82 (100.0%) | 0 (0.0%) |
| Total | 710 (100.0%) | 0 (0.0%) |
Health Insurance Coverage by Citizenship Status in Timber Lakes
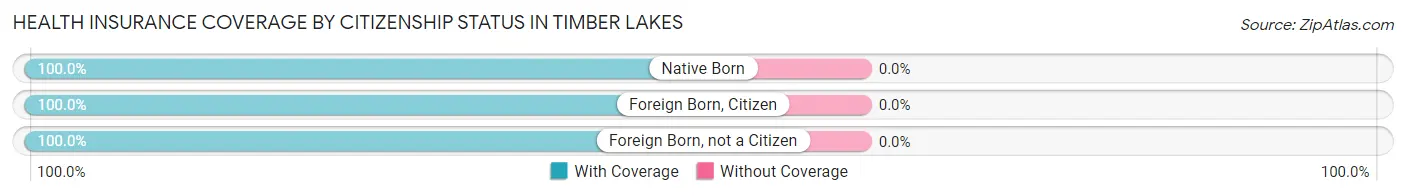
| Citizenship Status | With Coverage | Without Coverage |
| Native Born | 135 (100.0%) | 0 (0.0%) |
| Foreign Born, Citizen | 88 (100.0%) | 0 (0.0%) |
| Foreign Born, not a Citizen | 18 (100.0%) | 0 (0.0%) |
Health Insurance Coverage by Household Income in Timber Lakes
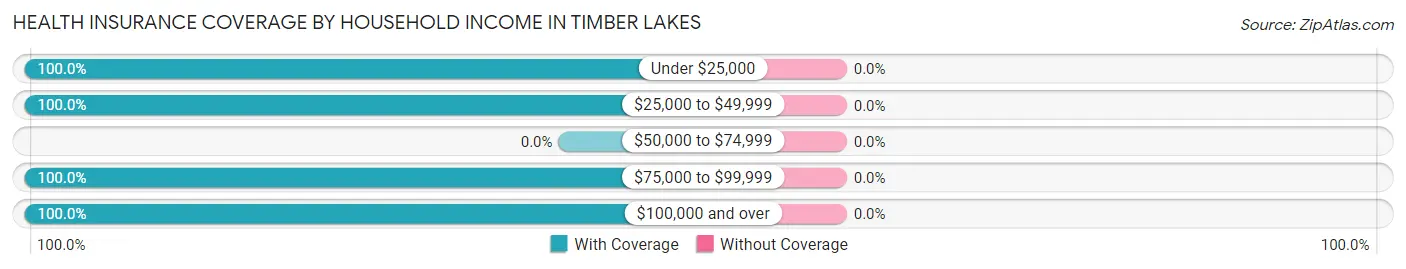
| Household Income | With Coverage | Without Coverage |
| Under $25,000 | 47 (100.0%) | 0 (0.0%) |
| $25,000 to $49,999 | 256 (100.0%) | 0 (0.0%) |
| $50,000 to $74,999 | 0 (0.0%) | 0 (0.0%) |
| $75,000 to $99,999 | 99 (100.0%) | 0 (0.0%) |
| $100,000 and over | 308 (100.0%) | 0 (0.0%) |
Public vs Private Health Insurance Coverage by Age in Timber Lakes
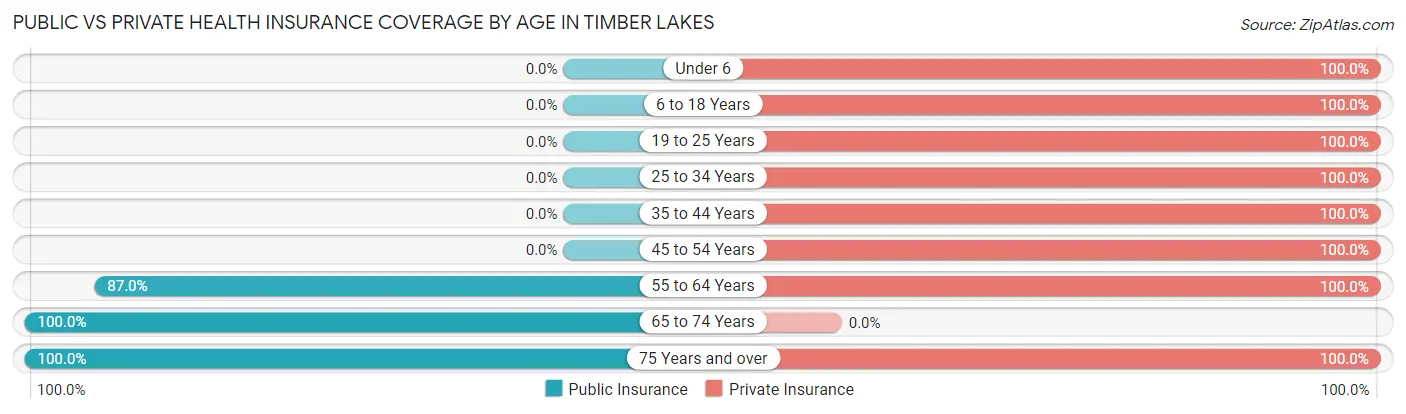
| Age Bracket | Public Insurance | Private Insurance |
| Under 6 | 0 (0.0%) | 135 (100.0%) |
| 6 to 18 Years | 0 (0.0%) | 88 (100.0%) |
| 19 to 25 Years | 0 (0.0%) | 18 (100.0%) |
| 25 to 34 Years | 0 (0.0%) | 164 (100.0%) |
| 35 to 44 Years | 0 (0.0%) | 10 (100.0%) |
| 45 to 54 Years | 0 (0.0%) | 107 (100.0%) |
| 55 to 64 Years | 47 (87.0%) | 54 (100.0%) |
| 65 to 74 Years | 52 (100.0%) | 0 (0.0%) |
| 75 Years and over | 82 (100.0%) | 82 (100.0%) |
| Total | 181 (25.5%) | 658 (92.7%) |
Disability Status by Sex by Age in Timber Lakes
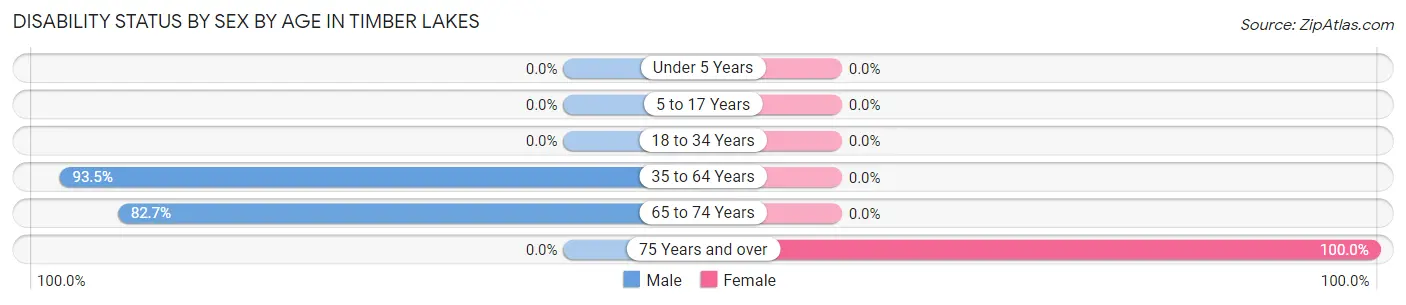
| Age Bracket | Male | Female |
| Under 5 Years | 0 (0.0%) | 0 (0.0%) |
| 5 to 17 Years | 0 (0.0%) | 0 (0.0%) |
| 18 to 34 Years | 0 (0.0%) | 0 (0.0%) |
| 35 to 64 Years | 144 (93.5%) | 0 (0.0%) |
| 65 to 74 Years | 43 (82.7%) | 0 (0.0%) |
| 75 Years and over | 0 (0.0%) | 42 (100.0%) |
Disability Class by Sex by Age in Timber Lakes
Disability Class: Hearing Difficulty
| Age Bracket | Male | Female |
| Under 5 Years | 0 (0.0%) | 0 (0.0%) |
| 5 to 17 Years | 0 (0.0%) | 0 (0.0%) |
| 18 to 34 Years | 0 (0.0%) | 0 (0.0%) |
| 35 to 64 Years | 0 (0.0%) | 0 (0.0%) |
| 65 to 74 Years | 0 (0.0%) | 0 (0.0%) |
| 75 Years and over | 0 (0.0%) | 0 (0.0%) |
Disability Class: Vision Difficulty
| Age Bracket | Male | Female |
| Under 5 Years | 0 (0.0%) | 0 (0.0%) |
| 5 to 17 Years | 0 (0.0%) | 0 (0.0%) |
| 18 to 34 Years | 0 (0.0%) | 0 (0.0%) |
| 35 to 64 Years | 0 (0.0%) | 0 (0.0%) |
| 65 to 74 Years | 0 (0.0%) | 0 (0.0%) |
| 75 Years and over | 0 (0.0%) | 0 (0.0%) |
Disability Class: Cognitive Difficulty
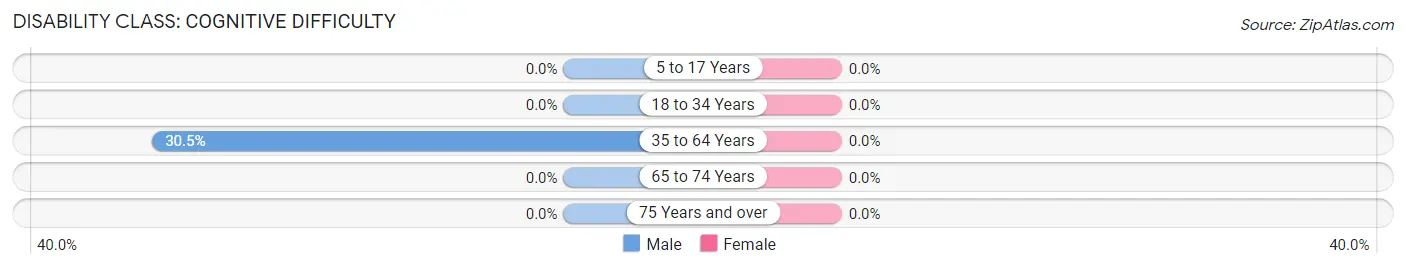
| Age Bracket | Male | Female |
| 5 to 17 Years | 0 (0.0%) | 0 (0.0%) |
| 18 to 34 Years | 0 (0.0%) | 0 (0.0%) |
| 35 to 64 Years | 47 (30.5%) | 0 (0.0%) |
| 65 to 74 Years | 0 (0.0%) | 0 (0.0%) |
| 75 Years and over | 0 (0.0%) | 0 (0.0%) |
Disability Class: Ambulatory Difficulty
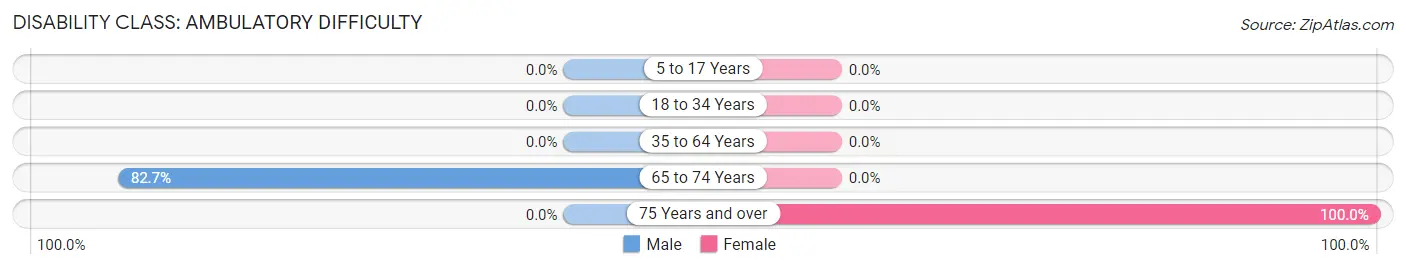
| Age Bracket | Male | Female |
| 5 to 17 Years | 0 (0.0%) | 0 (0.0%) |
| 18 to 34 Years | 0 (0.0%) | 0 (0.0%) |
| 35 to 64 Years | 0 (0.0%) | 0 (0.0%) |
| 65 to 74 Years | 43 (82.7%) | 0 (0.0%) |
| 75 Years and over | 0 (0.0%) | 42 (100.0%) |
Disability Class: Self-Care Difficulty
| Age Bracket | Male | Female |
| 5 to 17 Years | 0 (0.0%) | 0 (0.0%) |
| 18 to 34 Years | 0 (0.0%) | 0 (0.0%) |
| 35 to 64 Years | 0 (0.0%) | 0 (0.0%) |
| 65 to 74 Years | 0 (0.0%) | 0 (0.0%) |
| 75 Years and over | 0 (0.0%) | 0 (0.0%) |
Technology Access in Timber Lakes
Computing Device Access in Timber Lakes
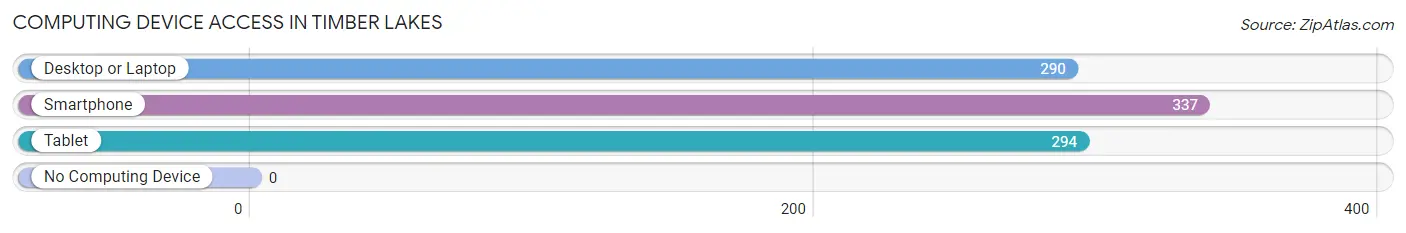
| Device Type | # Households | % Households |
| Desktop or Laptop | 290 | 86.1% |
| Smartphone | 337 | 100.0% |
| Tablet | 294 | 87.2% |
| No Computing Device | 0 | 0.0% |
| Total | 337 | 100.0% |
Internet Access in Timber Lakes
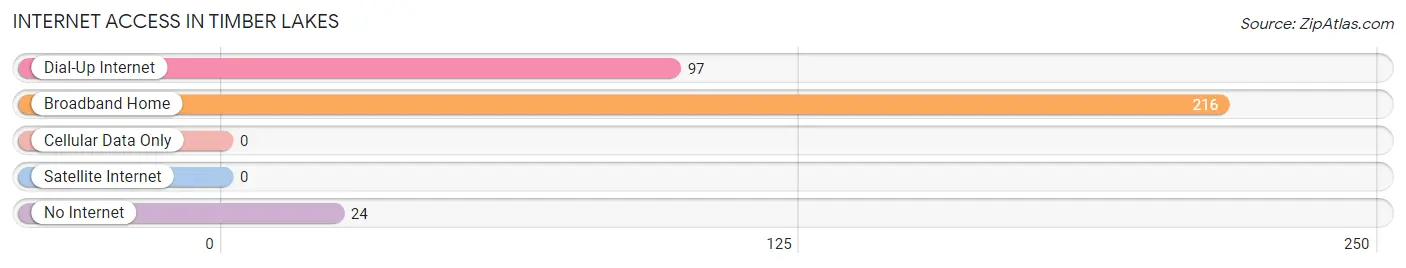
| Internet Type | # Households | % Households |
| Dial-Up Internet | 97 | 28.8% |
| Broadband Home | 216 | 64.1% |
| Cellular Data Only | 0 | 0.0% |
| Satellite Internet | 0 | 0.0% |
| No Internet | 24 | 7.1% |
| Total | 337 | 100.0% |
Timber Lakes Summary
Timber Lakes is a small unincorporated community located in Wasatch County, Utah, United States. It is situated in the Wasatch Mountains, approximately 25 miles east of Heber City and 40 miles southeast of Salt Lake City. The community is located in the Uinta-Wasatch-Cache National Forest and is surrounded by the Uinta National Forest.
History
Timber Lakes was first settled in the late 1800s by Mormon pioneers. The area was originally known as "Timber Creek" and was used for logging and grazing. In the early 1900s, the area was renamed "Timber Lakes" and the first cabin was built in the area. The community was officially established in the 1950s and has since grown to include a variety of homes, cabins, and businesses.
Geography
Timber Lakes is located in the Wasatch Mountains at an elevation of 6,800 feet. The area is surrounded by the Uinta National Forest and is home to several lakes, including Lake Creek, Lake Fork, and Lake Jordan. The area is known for its scenic beauty and is popular for camping, fishing, and hiking.
Economy
The economy of Timber Lakes is largely based on tourism. The area is popular for camping, fishing, and hiking, and is home to several resorts and lodges. The area is also home to several small businesses, including a general store, a restaurant, and a gas station.
Demographics
As of the 2010 census, the population of Timber Lakes was 545. The racial makeup of the community was 97.3% White, 0.2% African American, 0.2% Native American, 0.2% Asian, 0.2% Pacific Islander, 0.7% from other races, and 1.2% from two or more races. The median household income was $50,000 and the median family income was $54,000. The per capita income was $25,000.
Conclusion
Timber Lakes is a small unincorporated community located in Wasatch County, Utah. It is situated in the Wasatch Mountains and is surrounded by the Uinta National Forest. The area is known for its scenic beauty and is popular for camping, fishing, and hiking. The economy of Timber Lakes is largely based on tourism and the area is home to several small businesses. As of the 2010 census, the population of Timber Lakes was 545.
Common Questions
What is Per Capita Income in Timber Lakes?
Per Capita income in Timber Lakes is $29,886.
What is the Median Family Income in Timber Lakes?
Median Family Income in Timber Lakes is $135,075.
What is the Median Household income in Timber Lakes?
Median Household Income in Timber Lakes is $46,268.
What is Inequality or Gini Index in Timber Lakes?
Inequality or Gini Index in Timber Lakes is 0.39.
What is the Total Population of Timber Lakes?
Total Population of Timber Lakes is 710.
What is the Total Male Population of Timber Lakes?
Total Male Population of Timber Lakes is 480.
What is the Total Female Population of Timber Lakes?
Total Female Population of Timber Lakes is 230.
What is the Ratio of Males per 100 Females in Timber Lakes?
There are 208.70 Males per 100 Females in Timber Lakes.
What is the Ratio of Females per 100 Males in Timber Lakes?
There are 47.92 Females per 100 Males in Timber Lakes.
What is the Median Population Age in Timber Lakes?
Median Population Age in Timber Lakes is 31.1 Years.
What is the Average Family Size in Timber Lakes
Average Family Size in Timber Lakes is 3.5 People.
What is the Average Household Size in Timber Lakes
Average Household Size in Timber Lakes is 2.1 People.
How Large is the Labor Force in Timber Lakes?
There are 281 People in the Labor Forcein in Timber Lakes.
What is the Percentage of People in the Labor Force in Timber Lakes?
56.5% of People are in the Labor Force in Timber Lakes.