Wolf Creek, UT Map & Demographics
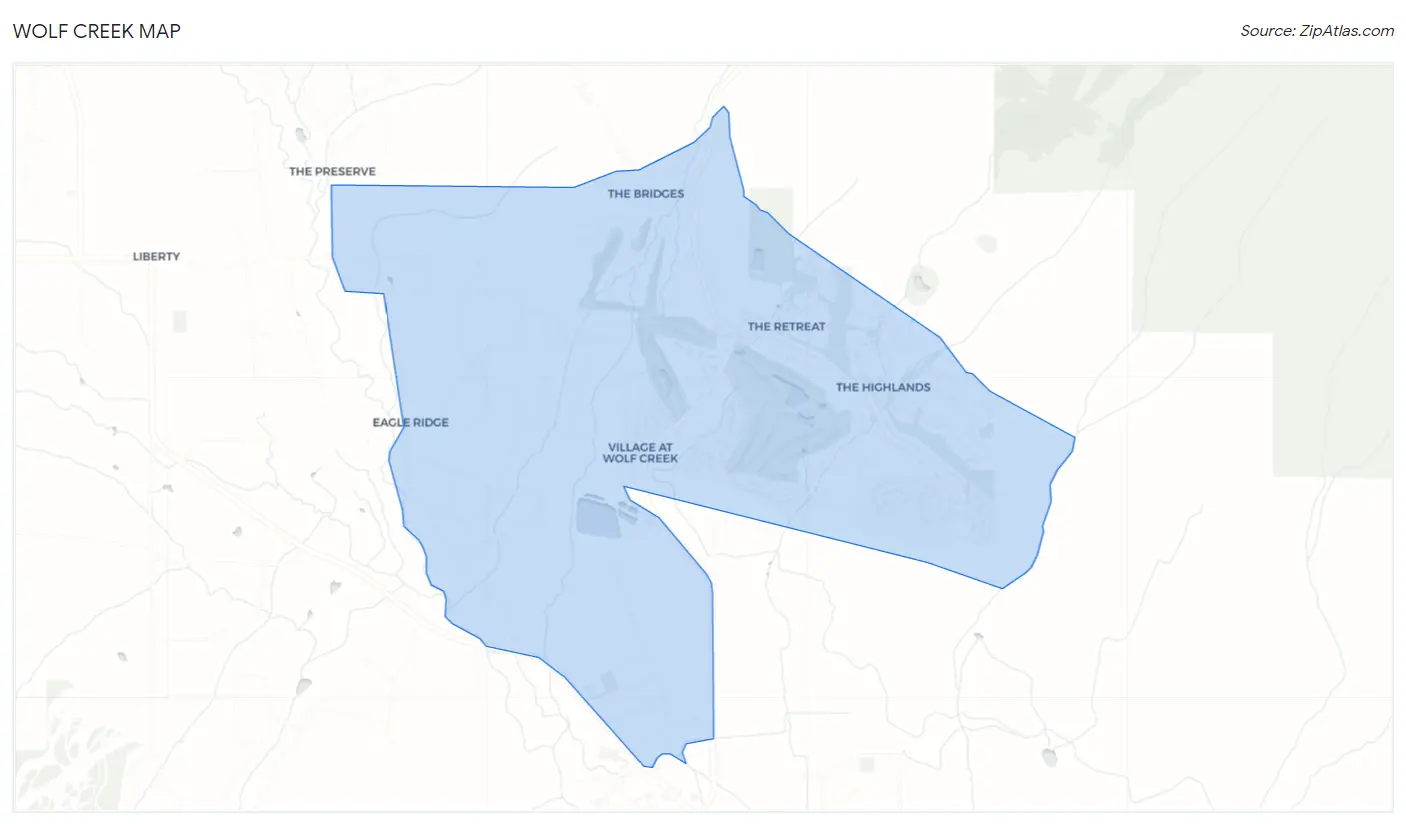
Wolf Creek Map
Wolf Creek Overview
$65,508
PER CAPITA INCOME
$180,750
AVG FAMILY INCOME
$137,813
AVG HOUSEHOLD INCOME
36.8%
WAGE / INCOME GAP [ % ]
63.2¢/ $1
WAGE / INCOME GAP [ $ ]
0.39
INEQUALITY / GINI INDEX
1,642
TOTAL POPULATION
990
MALE POPULATION
652
FEMALE POPULATION
151.84
MALES / 100 FEMALES
65.86
FEMALES / 100 MALES
41.8
MEDIAN AGE
3.3
AVG FAMILY SIZE
2.8
AVG HOUSEHOLD SIZE
838
LABOR FORCE [ PEOPLE ]
65.5%
PERCENT IN LABOR FORCE
Income in Wolf Creek
Income Overview in Wolf Creek
Per Capita Income in Wolf Creek is $65,508, while median incomes of families and households are $180,750 and $137,813 respectively.
| Characteristic | Number | Measure |
| Per Capita Income | 1,642 | $65,508 |
| Median Family Income | 463 | $180,750 |
| Mean Family Income | 463 | $210,552 |
| Median Household Income | 582 | $137,813 |
| Mean Household Income | 582 | $183,266 |
| Income Deficit | 463 | $0 |
| Wage / Income Gap (%) | 1,642 | 36.81% |
| Wage / Income Gap ($) | 1,642 | 63.19¢ per $1 |
| Gini / Inequality Index | 1,642 | 0.39 |
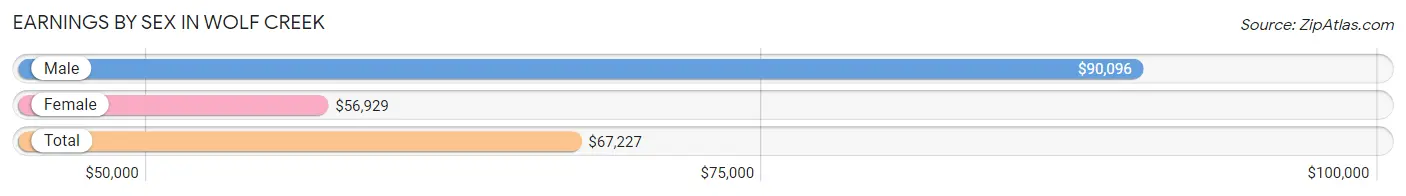
Earnings by Sex in Wolf Creek
Average Earnings in Wolf Creek are $67,227, $90,096 for men and $56,929 for women, a difference of 36.8%.
| Sex | Number | Average Earnings |
| Male | 607 (70.3%) | $90,096 |
| Female | 256 (29.7%) | $56,929 |
| Total | 863 (100.0%) | $67,227 |
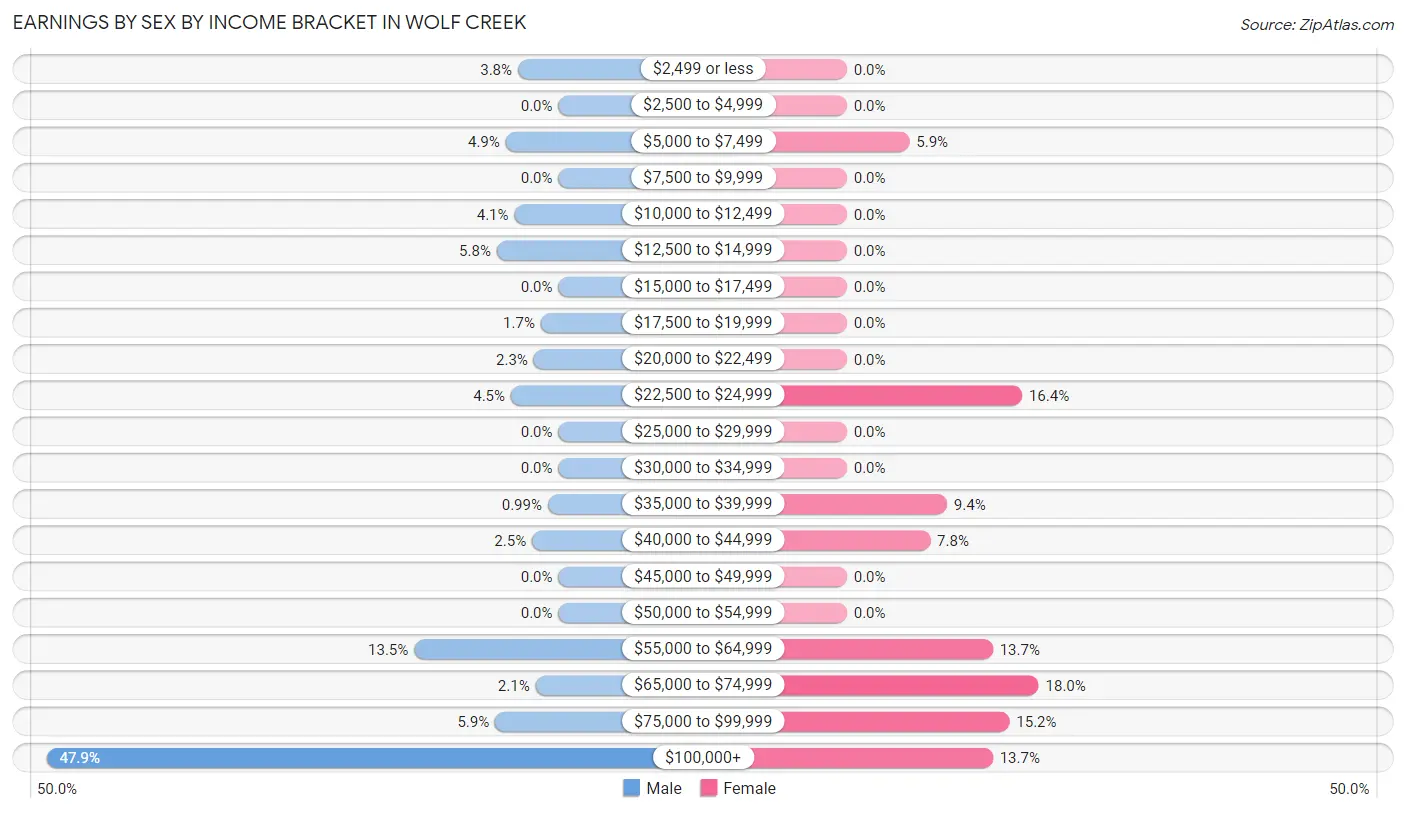
Earnings by Sex by Income Bracket in Wolf Creek
The most common earnings brackets in Wolf Creek are $100,000+ for men (291 | 47.9%) and $65,000 to $74,999 for women (46 | 18.0%).
| Income | Male | Female |
| $2,499 or less | 23 (3.8%) | 0 (0.0%) |
| $2,500 to $4,999 | 0 (0.0%) | 0 (0.0%) |
| $5,000 to $7,499 | 30 (4.9%) | 15 (5.9%) |
| $7,500 to $9,999 | 0 (0.0%) | 0 (0.0%) |
| $10,000 to $12,499 | 25 (4.1%) | 0 (0.0%) |
| $12,500 to $14,999 | 35 (5.8%) | 0 (0.0%) |
| $15,000 to $17,499 | 0 (0.0%) | 0 (0.0%) |
| $17,500 to $19,999 | 10 (1.7%) | 0 (0.0%) |
| $20,000 to $22,499 | 14 (2.3%) | 0 (0.0%) |
| $22,500 to $24,999 | 27 (4.4%) | 42 (16.4%) |
| $25,000 to $29,999 | 0 (0.0%) | 0 (0.0%) |
| $30,000 to $34,999 | 0 (0.0%) | 0 (0.0%) |
| $35,000 to $39,999 | 6 (1.0%) | 24 (9.4%) |
| $40,000 to $44,999 | 15 (2.5%) | 20 (7.8%) |
| $45,000 to $49,999 | 0 (0.0%) | 0 (0.0%) |
| $50,000 to $54,999 | 0 (0.0%) | 0 (0.0%) |
| $55,000 to $64,999 | 82 (13.5%) | 35 (13.7%) |
| $65,000 to $74,999 | 13 (2.1%) | 46 (18.0%) |
| $75,000 to $99,999 | 36 (5.9%) | 39 (15.2%) |
| $100,000+ | 291 (47.9%) | 35 (13.7%) |
| Total | 607 (100.0%) | 256 (100.0%) |
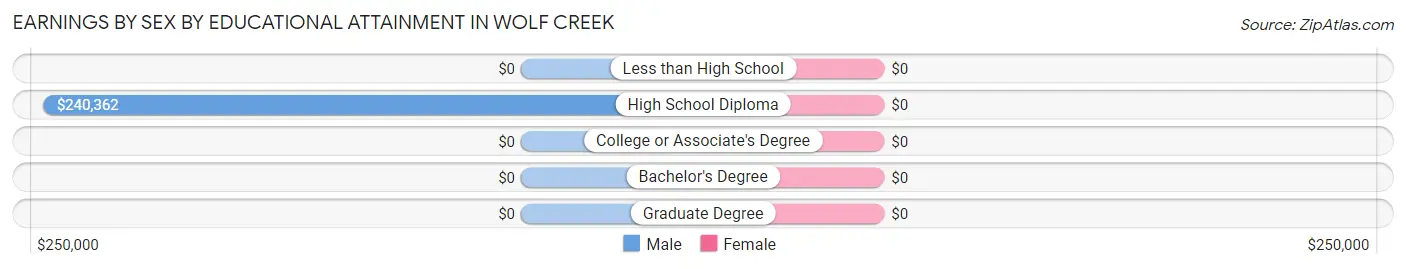
Earnings by Sex by Educational Attainment in Wolf Creek
| Educational Attainment | Male Income | Female Income |
| Less than High School | - | - |
| High School Diploma | $240,362 | $0 |
| College or Associate's Degree | - | - |
| Bachelor's Degree | - | - |
| Graduate Degree | - | - |
| Total | $101,842 | $57,429 |
Family Income in Wolf Creek
Family Income Brackets in Wolf Creek
According to the Wolf Creek family income data, there are 157 families falling into the $200,000+ income range, which is the most common income bracket and makes up 33.9% of all families.
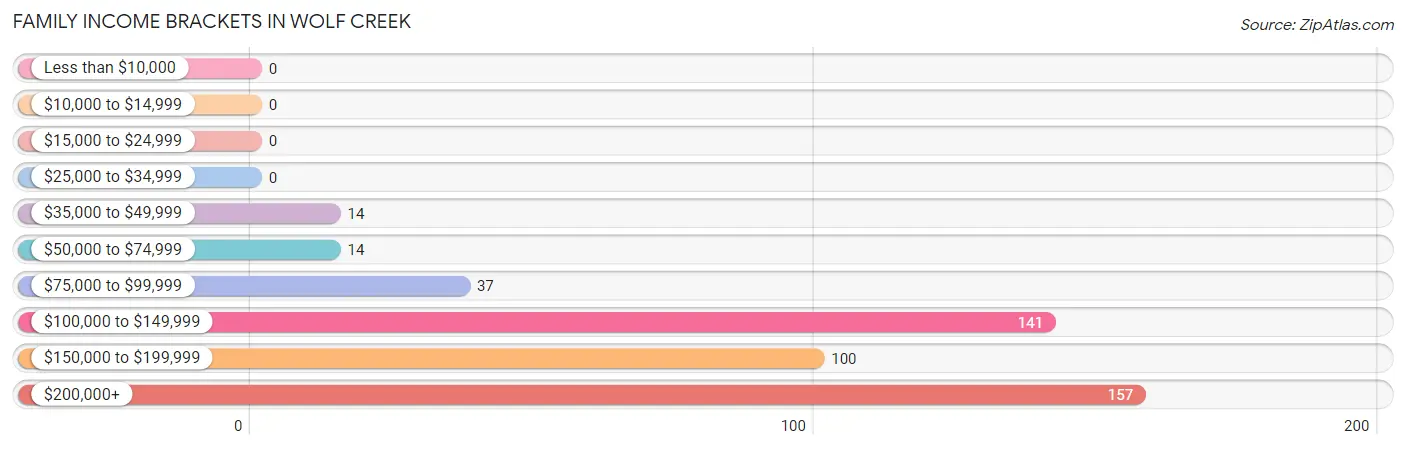
| Income Bracket | # Families | % Families |
| Less than $10,000 | 0 | 0.0% |
| $10,000 to $14,999 | 0 | 0.0% |
| $15,000 to $24,999 | 0 | 0.0% |
| $25,000 to $34,999 | 0 | 0.0% |
| $35,000 to $49,999 | 14 | 3.0% |
| $50,000 to $74,999 | 14 | 3.0% |
| $75,000 to $99,999 | 37 | 8.0% |
| $100,000 to $149,999 | 141 | 30.5% |
| $150,000 to $199,999 | 100 | 21.6% |
| $200,000+ | 157 | 33.9% |
Family Income by Famaliy Size in Wolf Creek
4-person families (45 | 9.7%) account for the highest median family income in Wolf Creek with $180,917 per family, while 2-person families (270 | 58.3%) have the highest median income of $65,670 per family member.
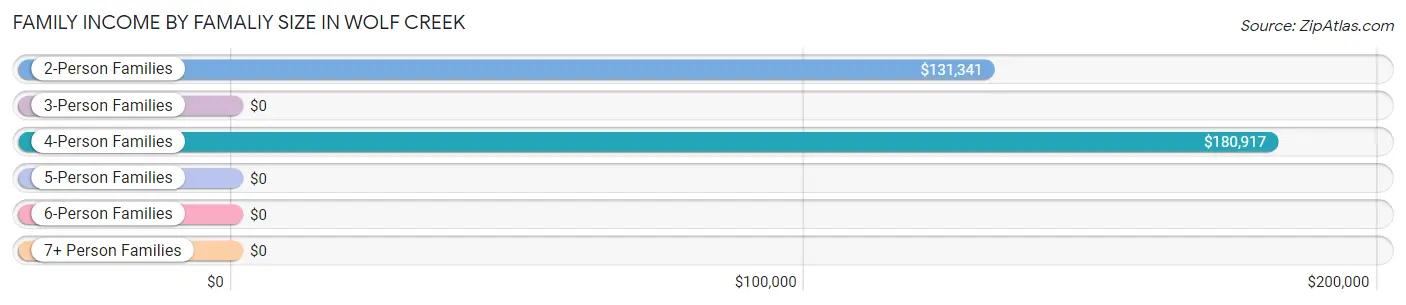
| Income Bracket | # Families | Median Income |
| 2-Person Families | 270 (58.3%) | $131,341 |
| 3-Person Families | 50 (10.8%) | $0 |
| 4-Person Families | 45 (9.7%) | $180,917 |
| 5-Person Families | 75 (16.2%) | $0 |
| 6-Person Families | 0 (0.0%) | $0 |
| 7+ Person Families | 23 (5.0%) | $0 |
| Total | 463 (100.0%) | $180,750 |
Family Income by Number of Earners in Wolf Creek
The median family income in Wolf Creek is $180,750, with families comprising 2 earners (156) having the highest median family income of $191,087, while families with no earners (32) have the lowest median family income of $130,357, accounting for 33.7% and 6.9% of families, respectively.
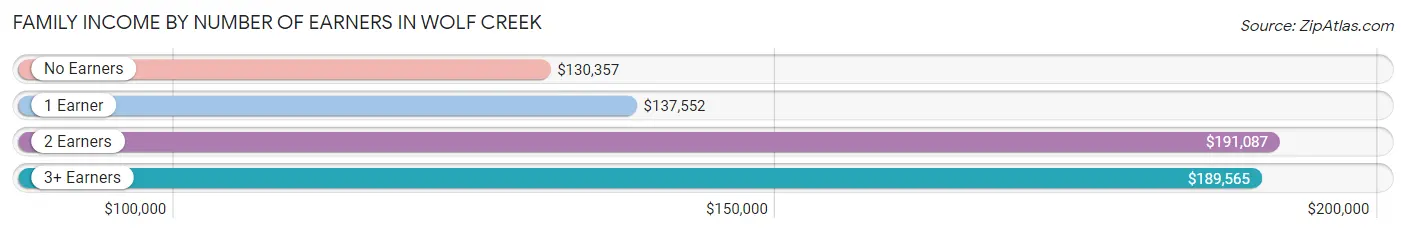
| Number of Earners | # Families | Median Income |
| No Earners | 32 (6.9%) | $130,357 |
| 1 Earner | 213 (46.0%) | $137,552 |
| 2 Earners | 156 (33.7%) | $191,087 |
| 3+ Earners | 62 (13.4%) | $189,565 |
| Total | 463 (100.0%) | $180,750 |
Household Income in Wolf Creek
Household Income Brackets in Wolf Creek
With 170 households falling in the category, the $200,000+ income range is the most frequent in Wolf Creek, accounting for 29.2% of all households.
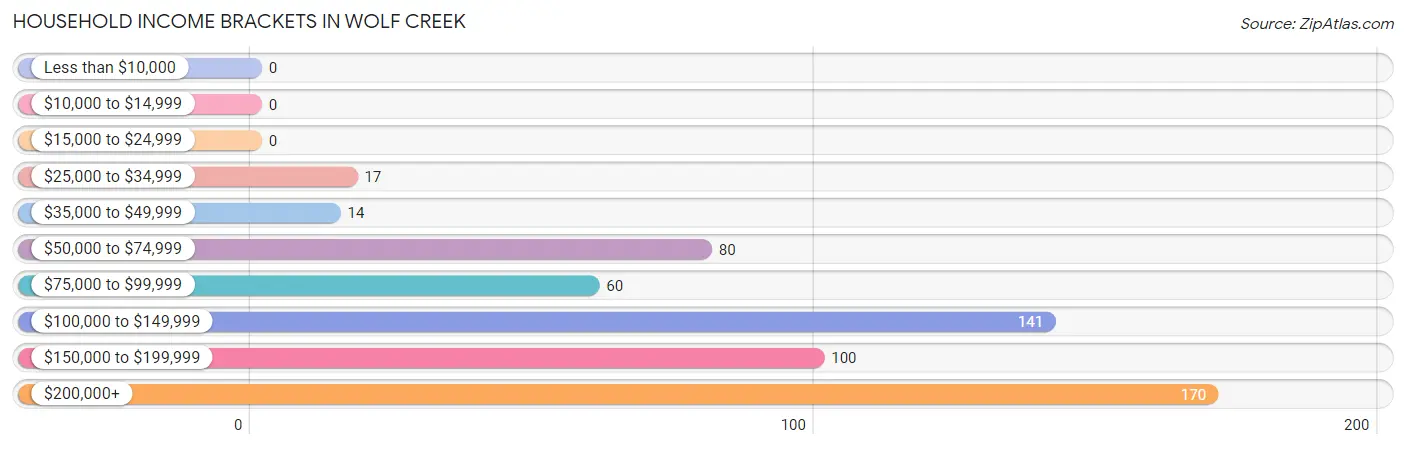
| Income Bracket | # Households | % Households |
| Less than $10,000 | 0 | 0.0% |
| $10,000 to $14,999 | 0 | 0.0% |
| $15,000 to $24,999 | 0 | 0.0% |
| $25,000 to $34,999 | 17 | 2.9% |
| $35,000 to $49,999 | 14 | 2.4% |
| $50,000 to $74,999 | 80 | 13.7% |
| $75,000 to $99,999 | 60 | 10.3% |
| $100,000 to $149,999 | 141 | 24.2% |
| $150,000 to $199,999 | 100 | 17.2% |
| $200,000+ | 170 | 29.2% |
Household Income by Householder Age in Wolf Creek
The median household income in Wolf Creek is $137,813, with the highest median household income of $188,967 found in the 45 to 64 years age bracket for the primary householder. A total of 247 households (42.4%) fall into this category.
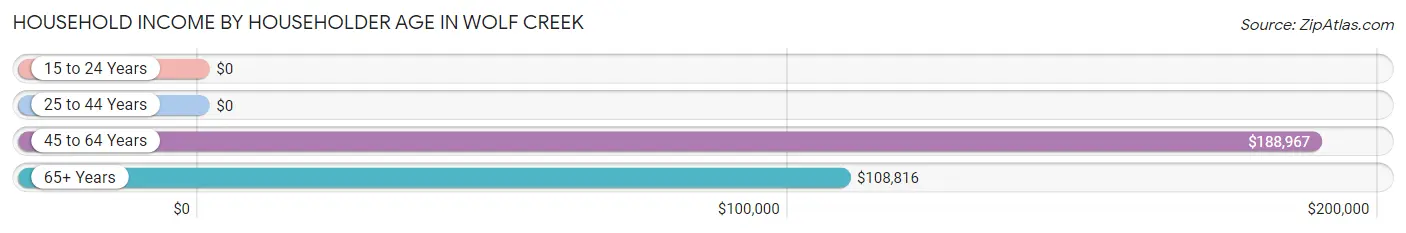
| Income Bracket | # Households | Median Income |
| 15 to 24 Years | 0 (0.0%) | $0 |
| 25 to 44 Years | 179 (30.8%) | $0 |
| 45 to 64 Years | 247 (42.4%) | $188,967 |
| 65+ Years | 156 (26.8%) | $108,816 |
| Total | 582 (100.0%) | $137,813 |
Poverty in Wolf Creek
Income Below Poverty by Sex and Age in Wolf Creek
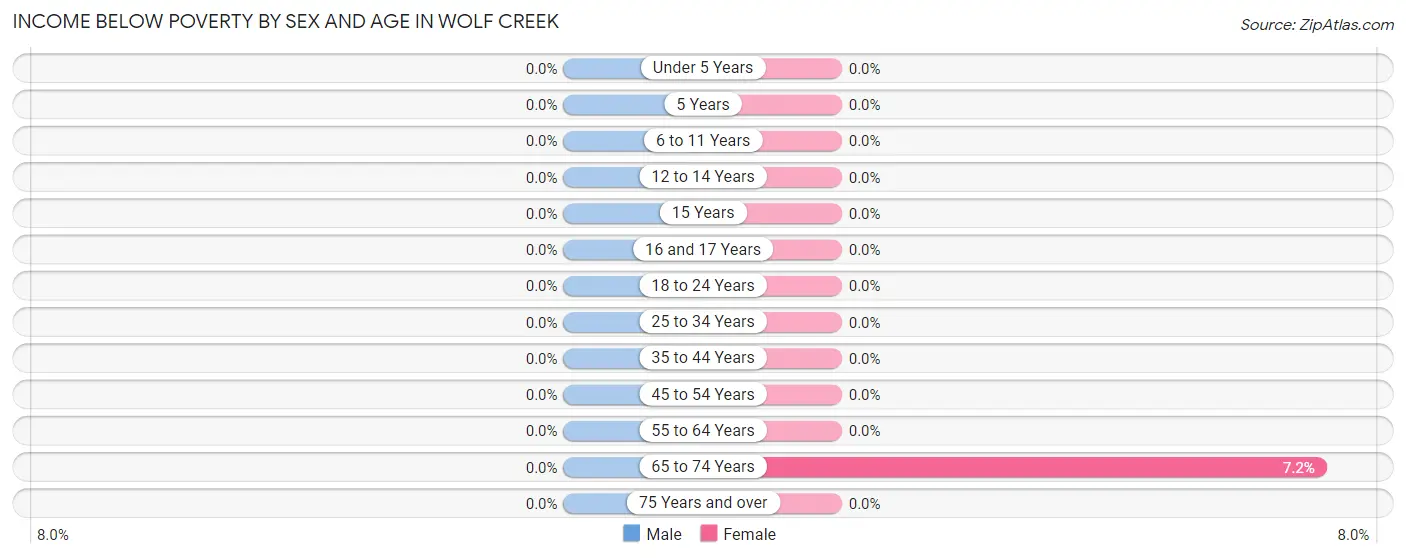
| Age Bracket | Male | Female |
| Under 5 Years | 0 (0.0%) | 0 (0.0%) |
| 5 Years | 0 (0.0%) | 0 (0.0%) |
| 6 to 11 Years | 0 (0.0%) | 0 (0.0%) |
| 12 to 14 Years | 0 (0.0%) | 0 (0.0%) |
| 15 Years | 0 (0.0%) | 0 (0.0%) |
| 16 and 17 Years | 0 (0.0%) | 0 (0.0%) |
| 18 to 24 Years | 0 (0.0%) | 0 (0.0%) |
| 25 to 34 Years | 0 (0.0%) | 0 (0.0%) |
| 35 to 44 Years | 0 (0.0%) | 0 (0.0%) |
| 45 to 54 Years | 0 (0.0%) | 0 (0.0%) |
| 55 to 64 Years | 0 (0.0%) | 0 (0.0%) |
| 65 to 74 Years | 0 (0.0%) | 9 (7.2%) |
| 75 Years and over | 0 (0.0%) | 0 (0.0%) |
| Total | 0 (0.0%) | 9 (1.4%) |
Income Above Poverty by Sex and Age in Wolf Creek
According to the poverty statistics in Wolf Creek, males aged under 5 years and females aged 6 to 11 years are the age groups that are most secure financially, with 100.0% of males and 100.0% of females in these age groups living above the poverty line.
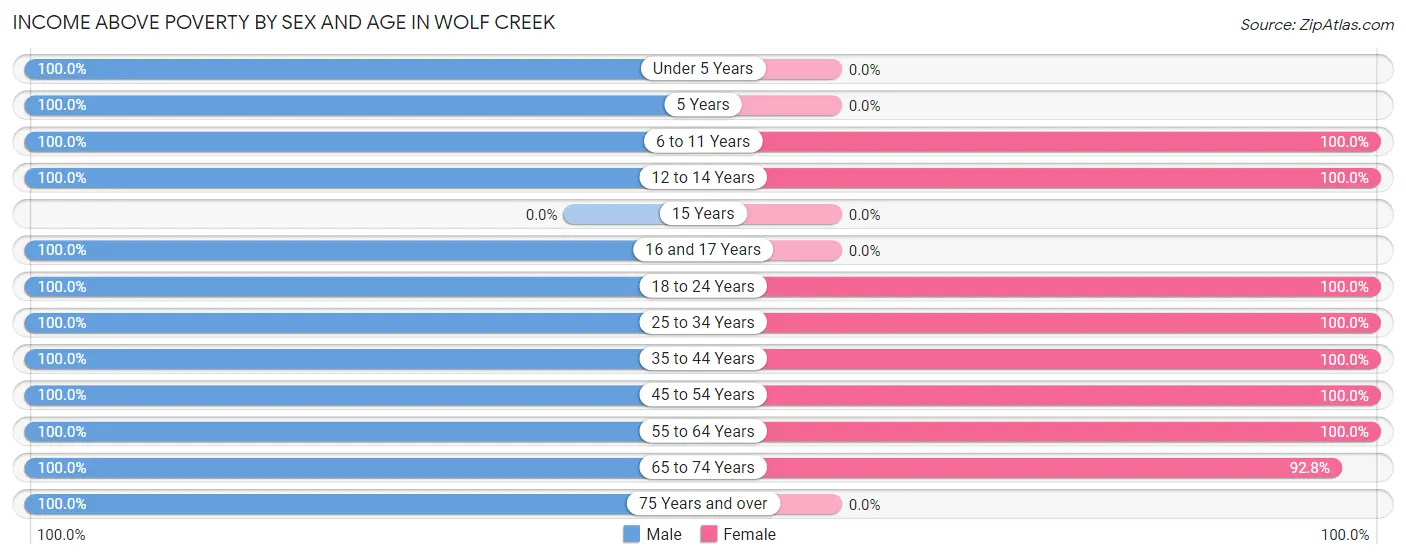
| Age Bracket | Male | Female |
| Under 5 Years | 71 (100.0%) | 0 (0.0%) |
| 5 Years | 33 (100.0%) | 0 (0.0%) |
| 6 to 11 Years | 90 (100.0%) | 57 (100.0%) |
| 12 to 14 Years | 76 (100.0%) | 35 (100.0%) |
| 15 Years | 0 (0.0%) | 0 (0.0%) |
| 16 and 17 Years | 39 (100.0%) | 0 (0.0%) |
| 18 to 24 Years | 66 (100.0%) | 57 (100.0%) |
| 25 to 34 Years | 71 (100.0%) | 52 (100.0%) |
| 35 to 44 Years | 136 (100.0%) | 127 (100.0%) |
| 45 to 54 Years | 74 (100.0%) | 86 (100.0%) |
| 55 to 64 Years | 114 (100.0%) | 113 (100.0%) |
| 65 to 74 Years | 138 (100.0%) | 116 (92.8%) |
| 75 Years and over | 82 (100.0%) | 0 (0.0%) |
| Total | 990 (100.0%) | 643 (98.6%) |
Income Below Poverty Among Married-Couple Families in Wolf Creek
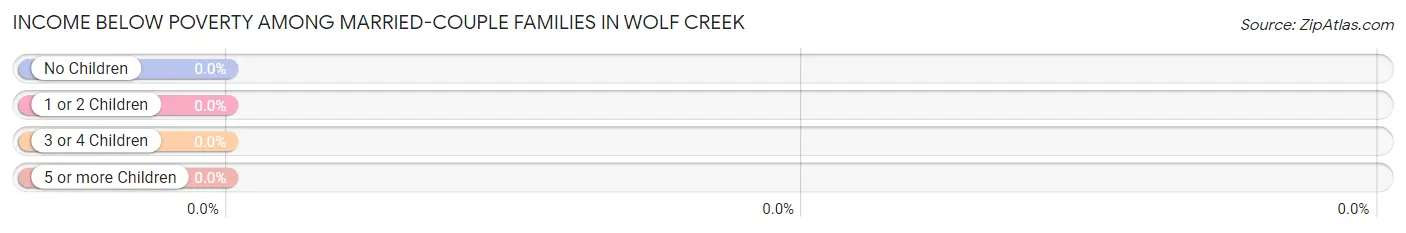
| Children | Above Poverty | Below Poverty |
| No Children | 300 (100.0%) | 0 (0.0%) |
| 1 or 2 Children | 42 (100.0%) | 0 (0.0%) |
| 3 or 4 Children | 75 (100.0%) | 0 (0.0%) |
| 5 or more Children | 23 (100.0%) | 0 (0.0%) |
| Total | 440 (100.0%) | 0 (0.0%) |
Income Below Poverty Among Single-Parent Households in Wolf Creek
| Children | Single Father | Single Mother |
| No Children | 0 (0.0%) | 0 (0.0%) |
| 1 or 2 Children | 0 (0.0%) | 0 (0.0%) |
| 3 or 4 Children | 0 (0.0%) | 0 (0.0%) |
| 5 or more Children | 0 (0.0%) | 0 (0.0%) |
| Total | 0 (0.0%) | 0 (0.0%) |
Income Below Poverty Among Married-Couple vs Single-Parent Households in Wolf Creek
| Children | Married-Couple Families | Single-Parent Households |
| No Children | 0 (0.0%) | 0 (0.0%) |
| 1 or 2 Children | 0 (0.0%) | 0 (0.0%) |
| 3 or 4 Children | 0 (0.0%) | 0 (0.0%) |
| 5 or more Children | 0 (0.0%) | 0 (0.0%) |
| Total | 0 (0.0%) | 0 (0.0%) |
Race in Wolf Creek
The most populous races in Wolf Creek are White / Caucasian (1,556 | 94.8%), Black / African American (57 | 3.5%), and Asian (29 | 1.8%).
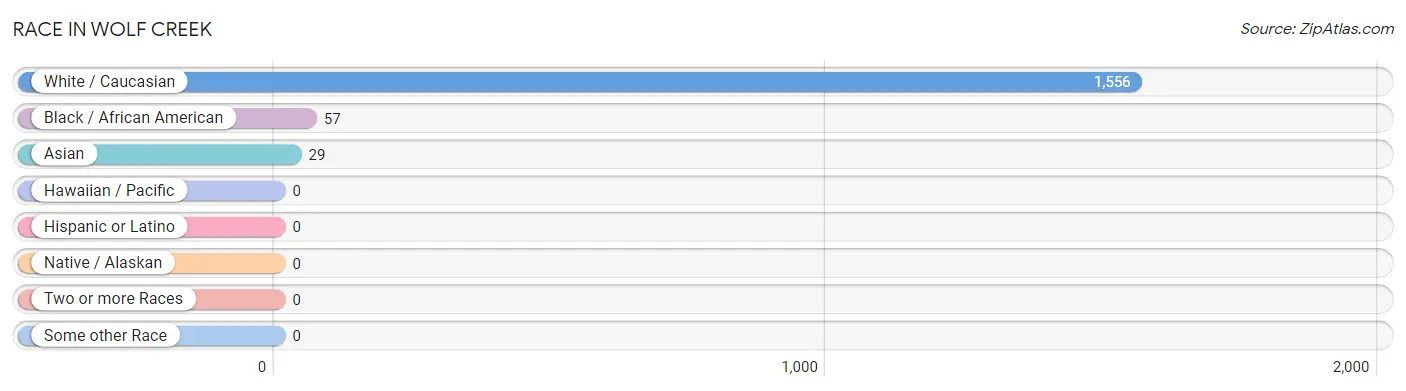
| Race | # Population | % Population |
| Asian | 29 | 1.8% |
| Black / African American | 57 | 3.5% |
| Hawaiian / Pacific | 0 | 0.0% |
| Hispanic or Latino | 0 | 0.0% |
| Native / Alaskan | 0 | 0.0% |
| White / Caucasian | 1,556 | 94.8% |
| Two or more Races | 0 | 0.0% |
| Some other Race | 0 | 0.0% |
| Total | 1,642 | 100.0% |
Ancestry in Wolf Creek
The most populous ancestries reported in Wolf Creek are English (529 | 32.2%), German (441 | 26.9%), Norwegian (286 | 17.4%), French (257 | 15.7%), and Scottish (80 | 4.9%), together accounting for 97.0% of all Wolf Creek residents.
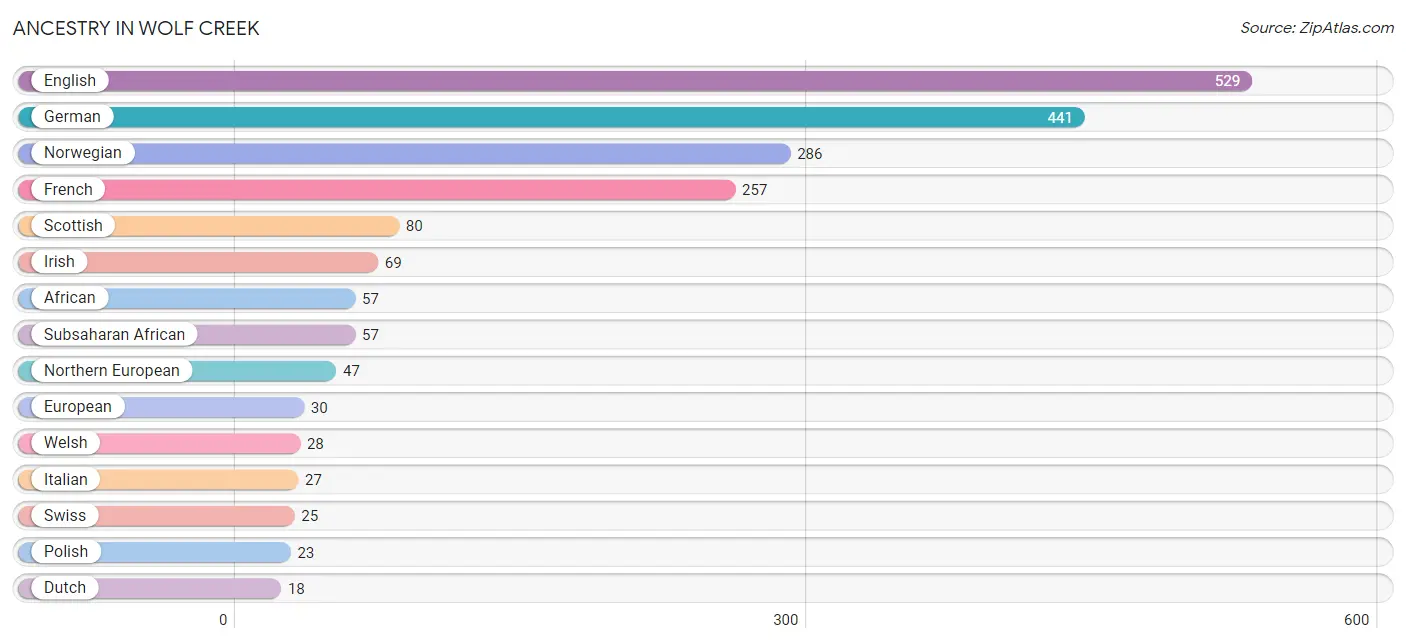
| Ancestry | # Population | % Population |
| African | 57 | 3.5% |
| British | 10 | 0.6% |
| Dutch | 18 | 1.1% |
| English | 529 | 32.2% |
| European | 30 | 1.8% |
| French | 257 | 15.7% |
| German | 441 | 26.9% |
| Greek | 14 | 0.9% |
| Indian (Asian) | 14 | 0.9% |
| Irish | 69 | 4.2% |
| Italian | 27 | 1.6% |
| Northern European | 47 | 2.9% |
| Norwegian | 286 | 17.4% |
| Polish | 23 | 1.4% |
| Russian | 14 | 0.9% |
| Scandinavian | 8 | 0.5% |
| Scottish | 80 | 4.9% |
| Sri Lankan | 15 | 0.9% |
| Subsaharan African | 57 | 3.5% |
| Swedish | 14 | 0.9% |
| Swiss | 25 | 1.5% |
| Welsh | 28 | 1.7% | View All 22 Rows |
Immigrants in Wolf Creek
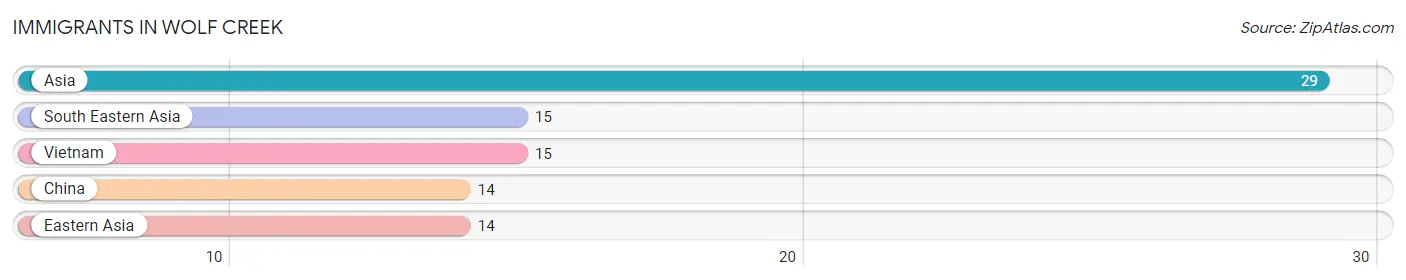
The most numerous immigrant groups reported in Wolf Creek came from Asia (29 | 1.8%), South Eastern Asia (15 | 0.9%), Vietnam (15 | 0.9%), China (14 | 0.9%), and Eastern Asia (14 | 0.9%), together accounting for 5.3% of all Wolf Creek residents.
| Immigration Origin | # Population | % Population |
| Asia | 29 | 1.8% |
| China | 14 | 0.9% |
| Eastern Asia | 14 | 0.9% |
| South Eastern Asia | 15 | 0.9% |
| Vietnam | 15 | 0.9% | View All 5 Rows |
Sex and Age in Wolf Creek
Sex and Age in Wolf Creek
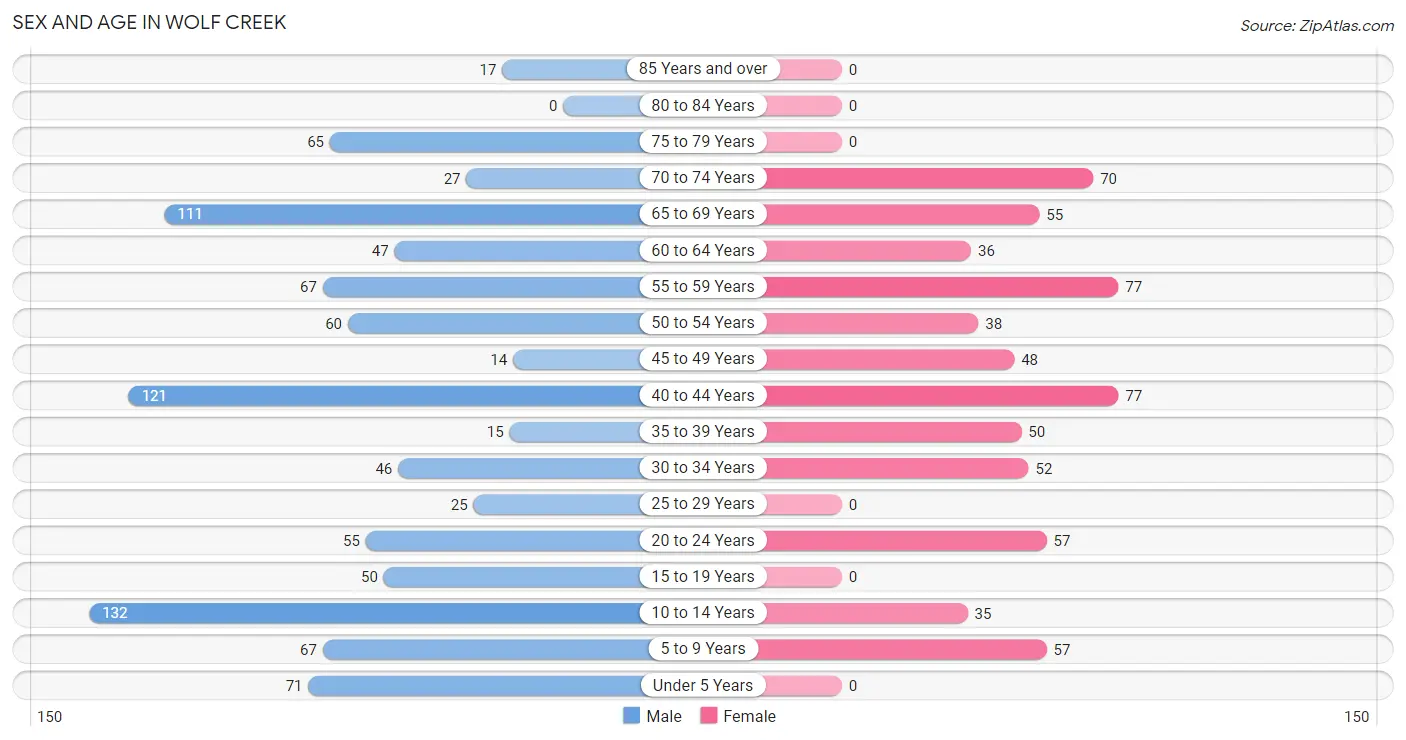
The most populous age groups in Wolf Creek are 10 to 14 Years (132 | 13.3%) for men and 40 to 44 Years (77 | 11.8%) for women.
| Age Bracket | Male | Female |
| Under 5 Years | 71 (7.2%) | 0 (0.0%) |
| 5 to 9 Years | 67 (6.8%) | 57 (8.7%) |
| 10 to 14 Years | 132 (13.3%) | 35 (5.4%) |
| 15 to 19 Years | 50 (5.1%) | 0 (0.0%) |
| 20 to 24 Years | 55 (5.6%) | 57 (8.7%) |
| 25 to 29 Years | 25 (2.5%) | 0 (0.0%) |
| 30 to 34 Years | 46 (4.6%) | 52 (8.0%) |
| 35 to 39 Years | 15 (1.5%) | 50 (7.7%) |
| 40 to 44 Years | 121 (12.2%) | 77 (11.8%) |
| 45 to 49 Years | 14 (1.4%) | 48 (7.4%) |
| 50 to 54 Years | 60 (6.1%) | 38 (5.8%) |
| 55 to 59 Years | 67 (6.8%) | 77 (11.8%) |
| 60 to 64 Years | 47 (4.8%) | 36 (5.5%) |
| 65 to 69 Years | 111 (11.2%) | 55 (8.4%) |
| 70 to 74 Years | 27 (2.7%) | 70 (10.7%) |
| 75 to 79 Years | 65 (6.6%) | 0 (0.0%) |
| 80 to 84 Years | 0 (0.0%) | 0 (0.0%) |
| 85 Years and over | 17 (1.7%) | 0 (0.0%) |
| Total | 990 (100.0%) | 652 (100.0%) |
Families and Households in Wolf Creek
Median Family Size in Wolf Creek
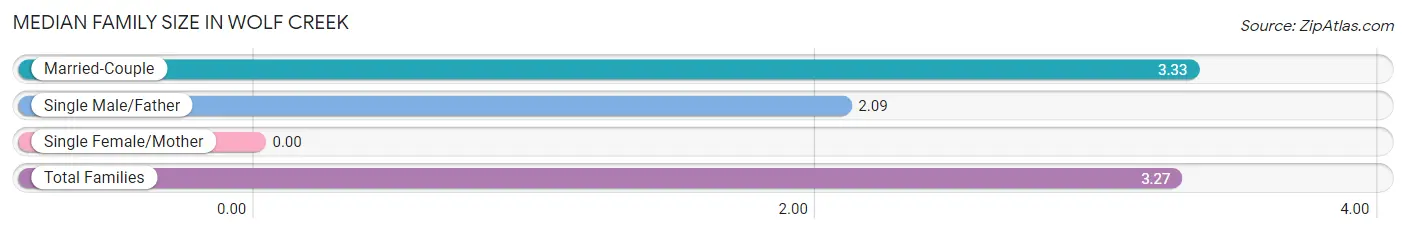
| Family Type | # Families | Family Size |
| Married-Couple | 440 (95.0%) | 3.33 |
| Single Male/Father | 23 (5.0%) | 2.09 |
| Single Female/Mother | 0 (0.0%) | - |
| Total Families | 463 (100.0%) | 3.27 |
Median Household Size in Wolf Creek
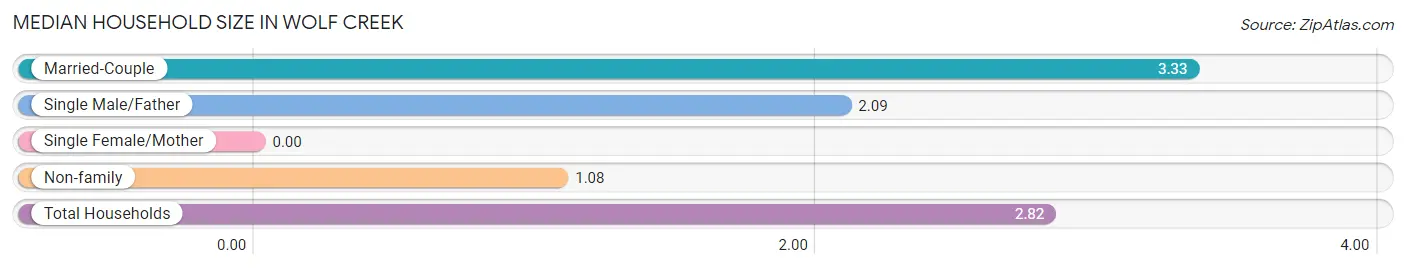
| Household Type | # Households | Household Size |
| Married-Couple | 440 (75.6%) | 3.33 |
| Single Male/Father | 23 (4.0%) | 2.09 |
| Single Female/Mother | 0 (0.0%) | - |
| Non-family | 119 (20.4%) | 1.08 |
| Total Households | 582 (100.0%) | 2.82 |
Household Size by Marriage Status in Wolf Creek
Out of a total of 582 households in Wolf Creek, 463 (79.5%) are family households, while 119 (20.4%) are nonfamily households. The most numerous type of family households are 2-person households, comprising 270, and the most common type of nonfamily households are 1-person households, comprising 110.
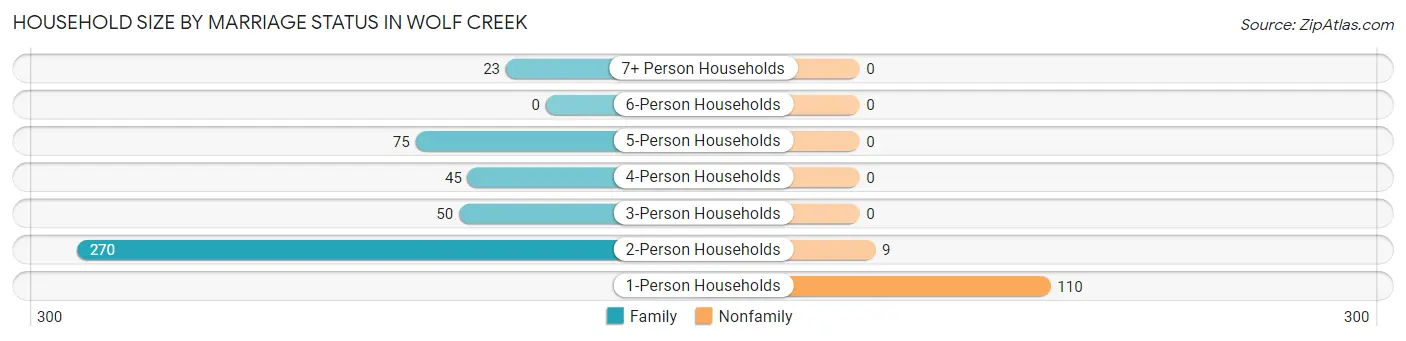
| Household Size | Family Households | Nonfamily Households |
| 1-Person Households | - | 110 (18.9%) |
| 2-Person Households | 270 (46.4%) | 9 (1.5%) |
| 3-Person Households | 50 (8.6%) | 0 (0.0%) |
| 4-Person Households | 45 (7.7%) | 0 (0.0%) |
| 5-Person Households | 75 (12.9%) | 0 (0.0%) |
| 6-Person Households | 0 (0.0%) | 0 (0.0%) |
| 7+ Person Households | 23 (4.0%) | 0 (0.0%) |
| Total | 463 (79.5%) | 119 (20.4%) |
Female Fertility in Wolf Creek
Fertility by Age in Wolf Creek
Average fertility rate in Wolf Creek is 56.0 births per 1,000 women. Women in the age bracket of 35 to 50 years have the highest fertility rate with 89.0 births per 1,000 women. Women in the age bracket of 35 to 50 years acount for 100.0% of all women with births.
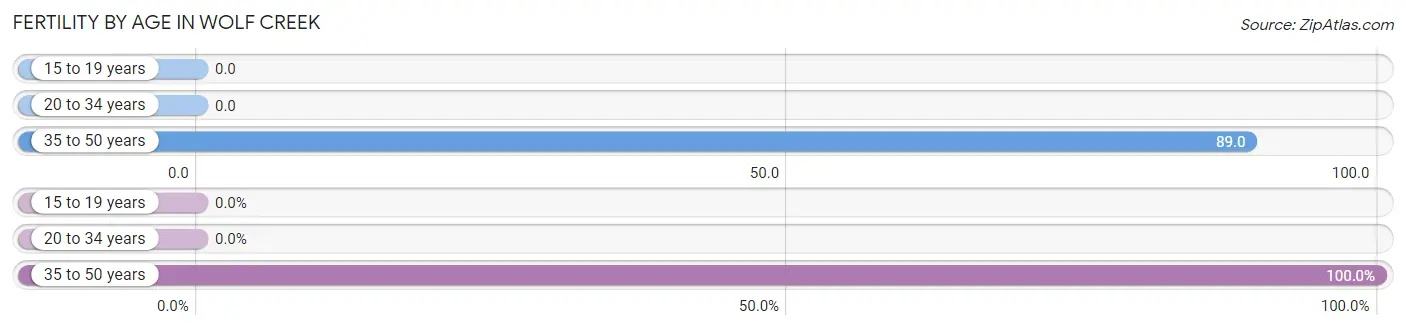
| Age Bracket | Women with Births | Births / 1,000 Women |
| 15 to 19 years | 0 (0.0%) | 0.0 |
| 20 to 34 years | 0 (0.0%) | 0.0 |
| 35 to 50 years | 16 (100.0%) | 89.0 |
| Total | 16 (100.0%) | 56.0 |
Fertility by Age by Marriage Status in Wolf Creek
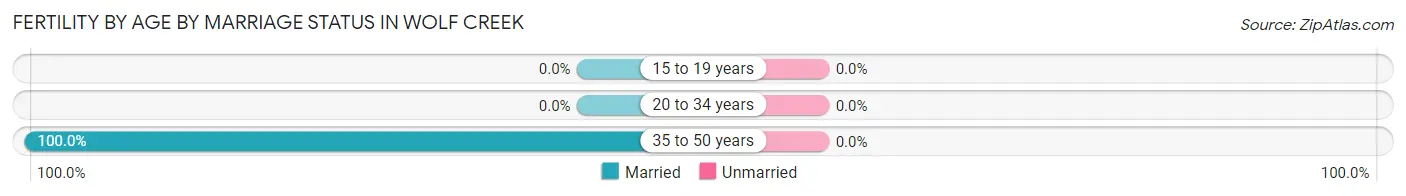
| Age Bracket | Married | Unmarried |
| 15 to 19 years | 0 (0.0%) | 0 (0.0%) |
| 20 to 34 years | 0 (0.0%) | 0 (0.0%) |
| 35 to 50 years | 16 (100.0%) | 0 (0.0%) |
| Total | 16 (100.0%) | 0 (0.0%) |
Fertility by Education in Wolf Creek
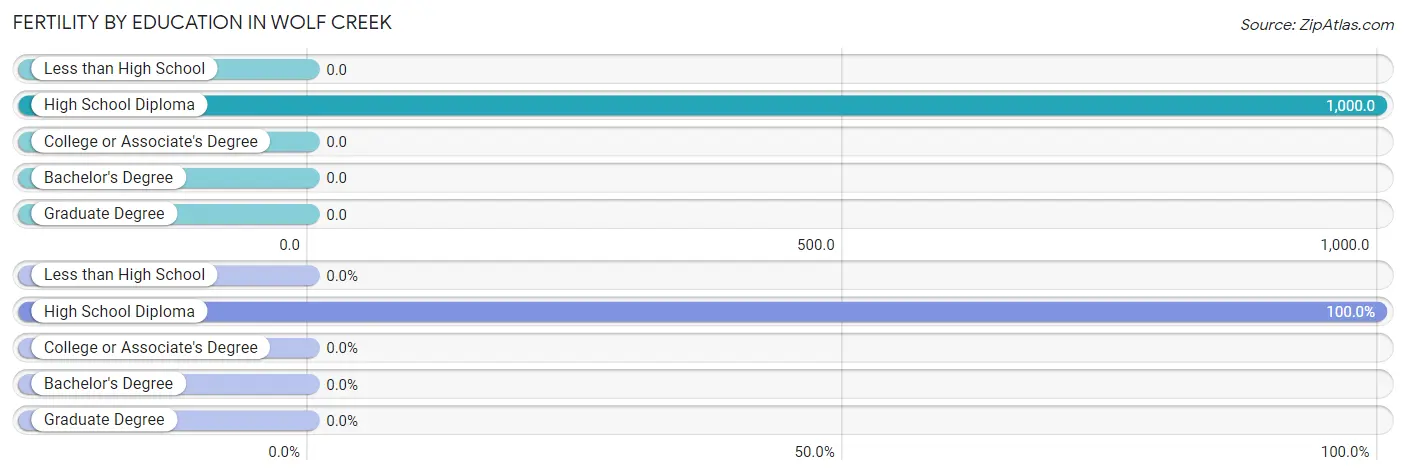
| Educational Attainment | Women with Births | Births / 1,000 Women |
| Less than High School | 0 (0.0%) | 0.0 |
| High School Diploma | 16 (100.0%) | 1,000.0 |
| College or Associate's Degree | 0 (0.0%) | 0.0 |
| Bachelor's Degree | 0 (0.0%) | 0.0 |
| Graduate Degree | 0 (0.0%) | 0.0 |
| Total | 16 (100.0%) | 56.0 |
Fertility by Education by Marriage Status in Wolf Creek
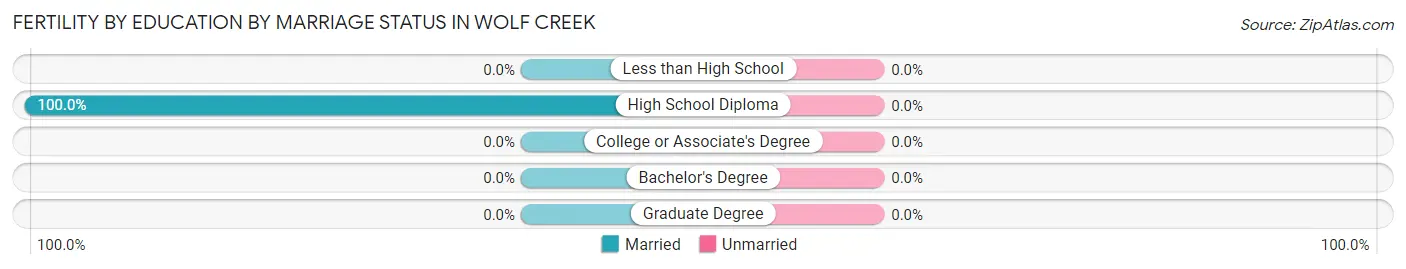
| Educational Attainment | Married | Unmarried |
| Less than High School | 0 (0.0%) | 0 (0.0%) |
| High School Diploma | 16 (100.0%) | 0 (0.0%) |
| College or Associate's Degree | 0 (0.0%) | 0 (0.0%) |
| Bachelor's Degree | 0 (0.0%) | 0 (0.0%) |
| Graduate Degree | 0 (0.0%) | 0 (0.0%) |
| Total | 16 (100.0%) | 0 (0.0%) |
Employment Characteristics in Wolf Creek
Employment by Class of Employer in Wolf Creek
Among the 821 employed individuals in Wolf Creek, private company employees (534 | 65.0%), self-employed (incorporated) (117 | 14.2%), and federal government employees (76 | 9.3%) make up the most common classes of employment.
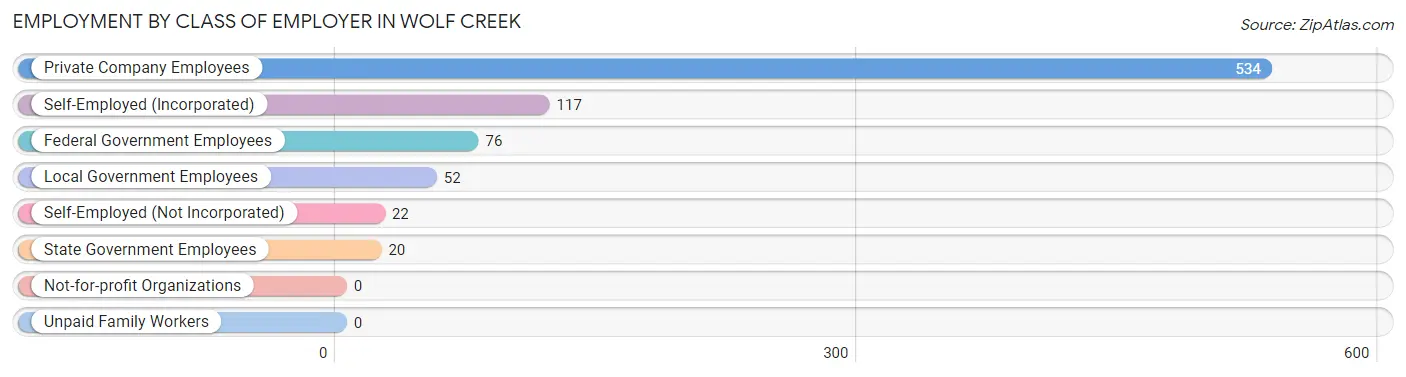
| Employer Class | # Employees | % Employees |
| Private Company Employees | 534 | 65.0% |
| Self-Employed (Incorporated) | 117 | 14.2% |
| Self-Employed (Not Incorporated) | 22 | 2.7% |
| Not-for-profit Organizations | 0 | 0.0% |
| Local Government Employees | 52 | 6.3% |
| State Government Employees | 20 | 2.4% |
| Federal Government Employees | 76 | 9.3% |
| Unpaid Family Workers | 0 | 0.0% |
| Total | 821 | 100.0% |
Employment Status by Age in Wolf Creek
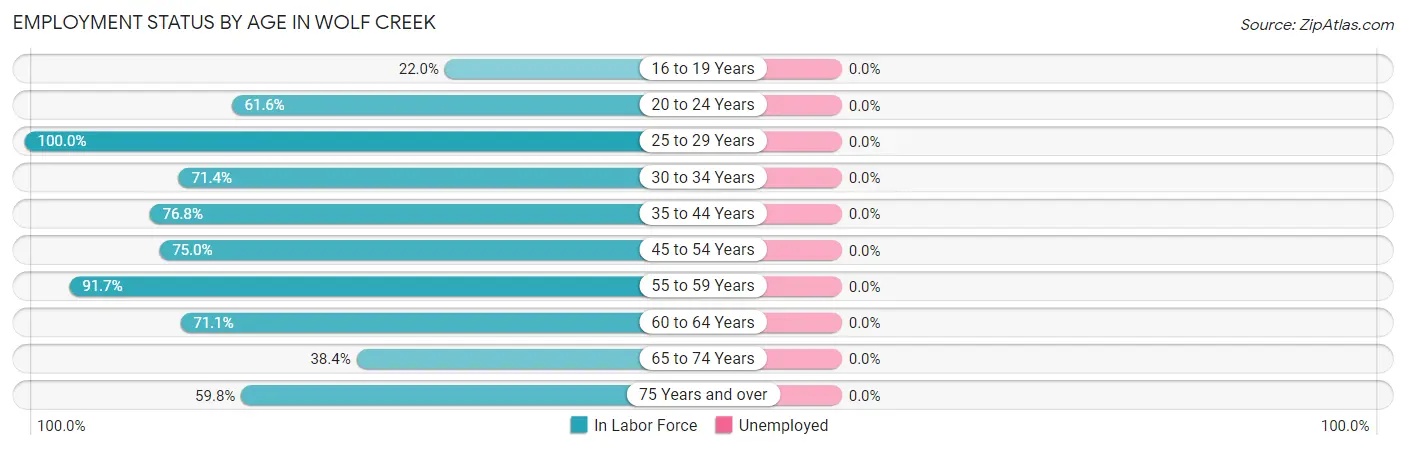
| Age Bracket | In Labor Force | Unemployed |
| 16 to 19 Years | 11 (22.0%) | 0 (0.0%) |
| 20 to 24 Years | 69 (61.6%) | 0 (0.0%) |
| 25 to 29 Years | 25 (100.0%) | 0 (0.0%) |
| 30 to 34 Years | 70 (71.4%) | 0 (0.0%) |
| 35 to 44 Years | 202 (76.8%) | 0 (0.0%) |
| 45 to 54 Years | 120 (75.0%) | 0 (0.0%) |
| 55 to 59 Years | 132 (91.7%) | 0 (0.0%) |
| 60 to 64 Years | 59 (71.1%) | 0 (0.0%) |
| 65 to 74 Years | 101 (38.4%) | 0 (0.0%) |
| 75 Years and over | 49 (59.8%) | 0 (0.0%) |
| Total | 838 (65.5%) | 0 (0.0%) |
Employment Status by Educational Attainment in Wolf Creek
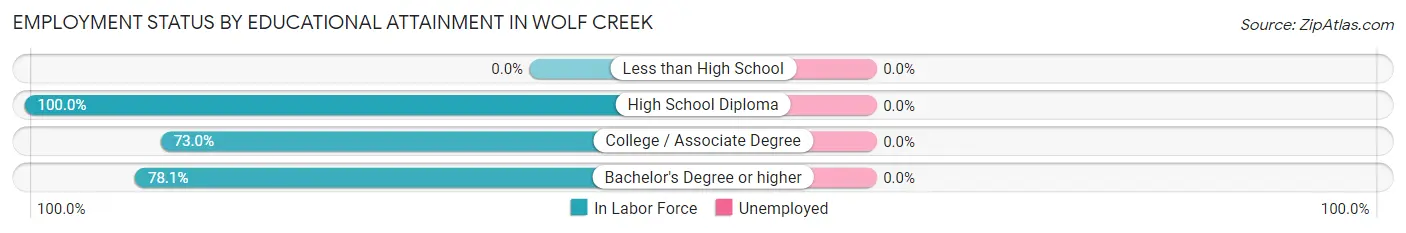
| Educational Attainment | In Labor Force | Unemployed |
| Less than High School | 0 (0.0%) | 0 (0.0%) |
| High School Diploma | 58 (100.0%) | 0 (0.0%) |
| College / Associate Degree | 116 (73.0%) | 0 (0.0%) |
| Bachelor's Degree or higher | 434 (78.1%) | 0 (0.0%) |
| Total | 608 (78.7%) | 0 (0.0%) |
Employment Occupations by Sex in Wolf Creek
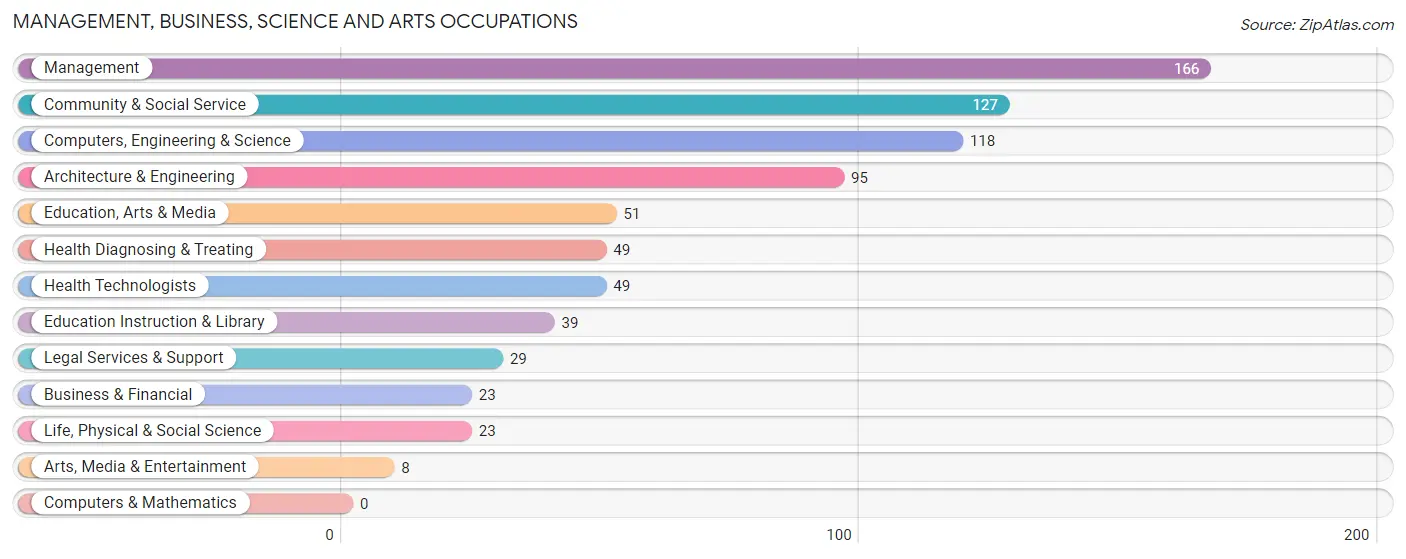
Management, Business, Science and Arts Occupations
The most common Management, Business, Science and Arts occupations in Wolf Creek are Management (166 | 19.8%), Community & Social Service (127 | 15.2%), Computers, Engineering & Science (118 | 14.1%), Architecture & Engineering (95 | 11.3%), and Education, Arts & Media (51 | 6.1%).
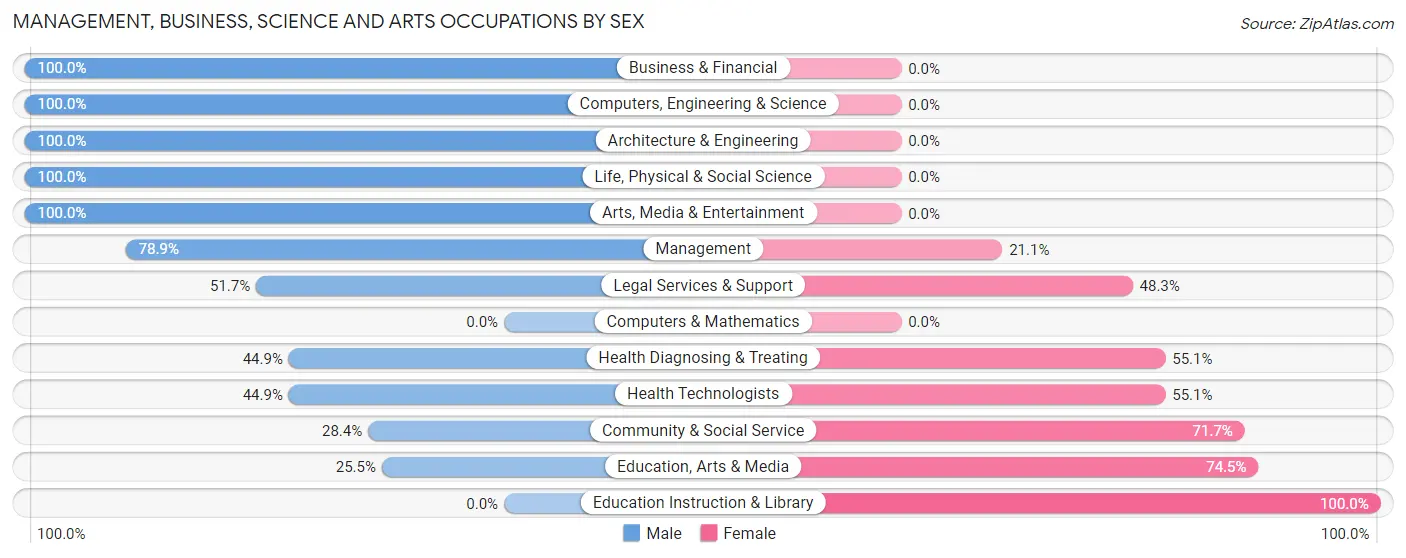
Management, Business, Science and Arts Occupations by Sex
Within the Management, Business, Science and Arts occupations in Wolf Creek, the most male-oriented occupations are Business & Financial (100.0%), Computers, Engineering & Science (100.0%), and Architecture & Engineering (100.0%), while the most female-oriented occupations are Education Instruction & Library (100.0%), Education, Arts & Media (74.5%), and Community & Social Service (71.7%).
| Occupation | Male | Female |
| Management | 131 (78.9%) | 35 (21.1%) |
| Business & Financial | 23 (100.0%) | 0 (0.0%) |
| Computers, Engineering & Science | 118 (100.0%) | 0 (0.0%) |
| Computers & Mathematics | 0 (0.0%) | 0 (0.0%) |
| Architecture & Engineering | 95 (100.0%) | 0 (0.0%) |
| Life, Physical & Social Science | 23 (100.0%) | 0 (0.0%) |
| Community & Social Service | 36 (28.3%) | 91 (71.7%) |
| Education, Arts & Media | 13 (25.5%) | 38 (74.5%) |
| Legal Services & Support | 15 (51.7%) | 14 (48.3%) |
| Education Instruction & Library | 0 (0.0%) | 39 (100.0%) |
| Arts, Media & Entertainment | 8 (100.0%) | 0 (0.0%) |
| Health Diagnosing & Treating | 22 (44.9%) | 27 (55.1%) |
| Health Technologists | 22 (44.9%) | 27 (55.1%) |
| Total (Category) | 330 (68.3%) | 153 (31.7%) |
| Total (Overall) | 582 (69.5%) | 256 (30.5%) |
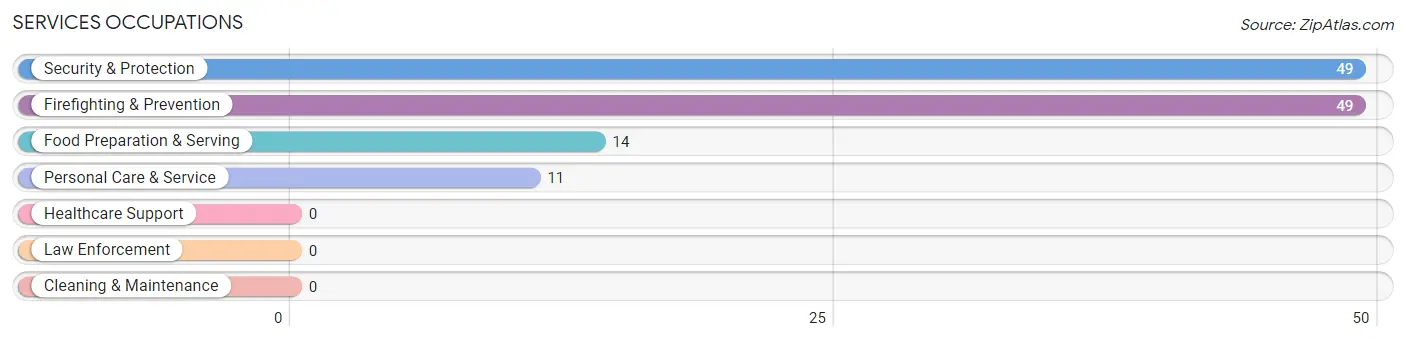
Services Occupations
The most common Services occupations in Wolf Creek are Security & Protection (49 | 5.9%), Firefighting & Prevention (49 | 5.9%), Food Preparation & Serving (14 | 1.7%), and Personal Care & Service (11 | 1.3%).
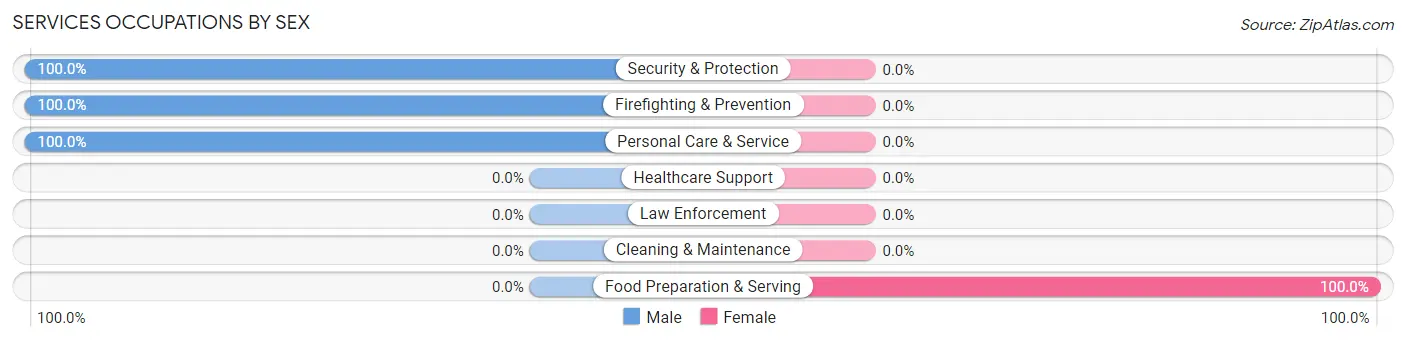
Services Occupations by Sex
| Occupation | Male | Female |
| Healthcare Support | 0 (0.0%) | 0 (0.0%) |
| Security & Protection | 49 (100.0%) | 0 (0.0%) |
| Firefighting & Prevention | 49 (100.0%) | 0 (0.0%) |
| Law Enforcement | 0 (0.0%) | 0 (0.0%) |
| Food Preparation & Serving | 0 (0.0%) | 14 (100.0%) |
| Cleaning & Maintenance | 0 (0.0%) | 0 (0.0%) |
| Personal Care & Service | 11 (100.0%) | 0 (0.0%) |
| Total (Category) | 60 (81.1%) | 14 (18.9%) |
| Total (Overall) | 582 (69.5%) | 256 (30.5%) |
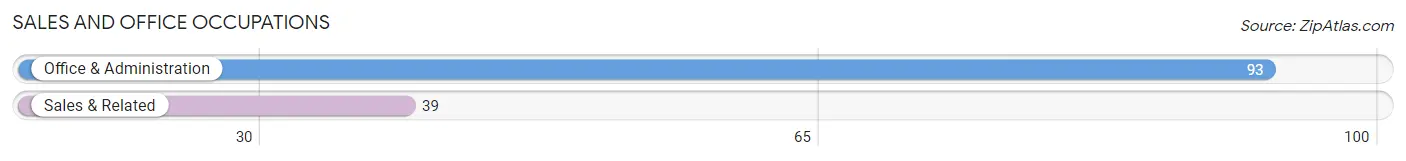
Sales and Office Occupations
The most common Sales and Office occupations in Wolf Creek are Office & Administration (93 | 11.1%), and Sales & Related (39 | 4.6%).
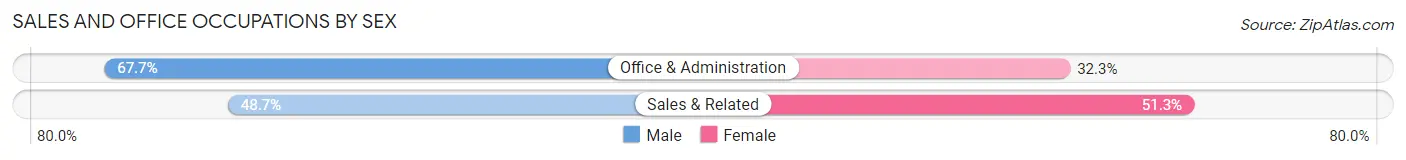
Sales and Office Occupations by Sex
| Occupation | Male | Female |
| Sales & Related | 19 (48.7%) | 20 (51.3%) |
| Office & Administration | 63 (67.7%) | 30 (32.3%) |
| Total (Category) | 82 (62.1%) | 50 (37.9%) |
| Total (Overall) | 582 (69.5%) | 256 (30.5%) |
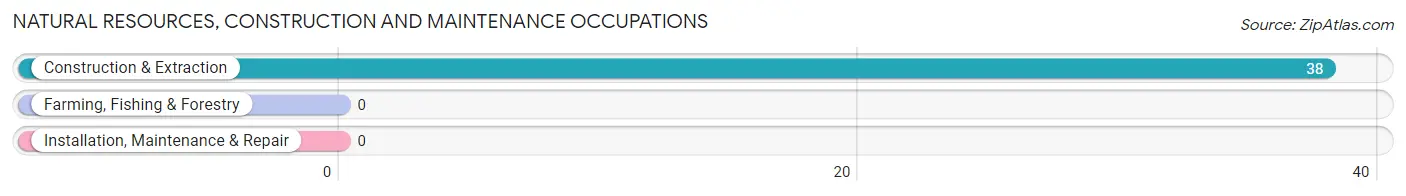
Natural Resources, Construction and Maintenance Occupations
The most common Natural Resources, Construction and Maintenance occupations in Wolf Creek are , and Construction & Extraction (38 | 4.5%).
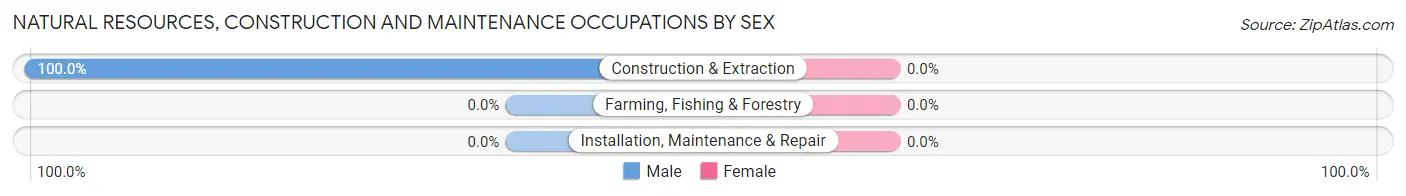
Natural Resources, Construction and Maintenance Occupations by Sex
| Occupation | Male | Female |
| Farming, Fishing & Forestry | 0 (0.0%) | 0 (0.0%) |
| Construction & Extraction | 38 (100.0%) | 0 (0.0%) |
| Installation, Maintenance & Repair | 0 (0.0%) | 0 (0.0%) |
| Total (Category) | 38 (100.0%) | 0 (0.0%) |
| Total (Overall) | 582 (69.5%) | 256 (30.5%) |
Production, Transportation and Moving Occupations
The most common Production, Transportation and Moving occupations in Wolf Creek are Transportation (83 | 9.9%), and Production (28 | 3.3%).
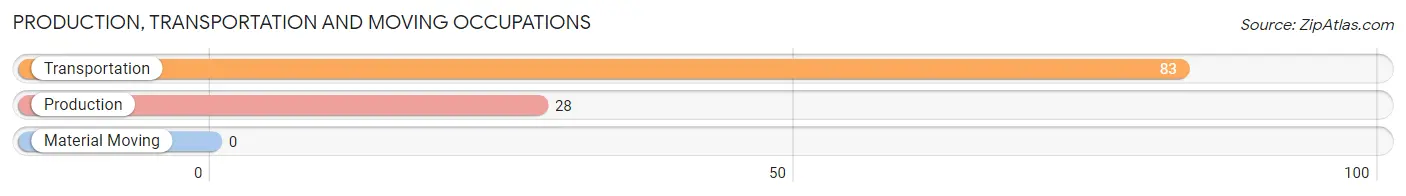
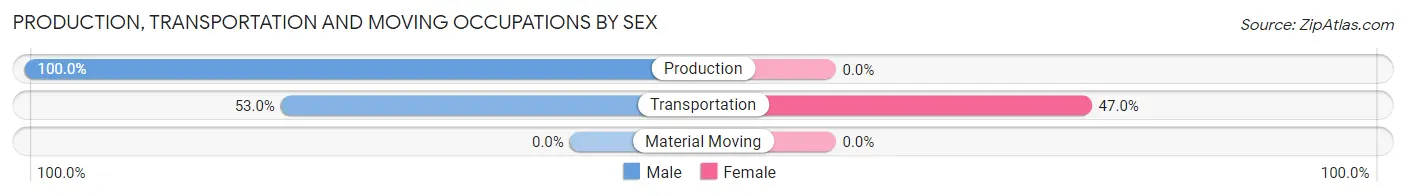
Production, Transportation and Moving Occupations by Sex
| Occupation | Male | Female |
| Production | 28 (100.0%) | 0 (0.0%) |
| Transportation | 44 (53.0%) | 39 (47.0%) |
| Material Moving | 0 (0.0%) | 0 (0.0%) |
| Total (Category) | 72 (64.9%) | 39 (35.1%) |
| Total (Overall) | 582 (69.5%) | 256 (30.5%) |
Employment Industries by Sex in Wolf Creek
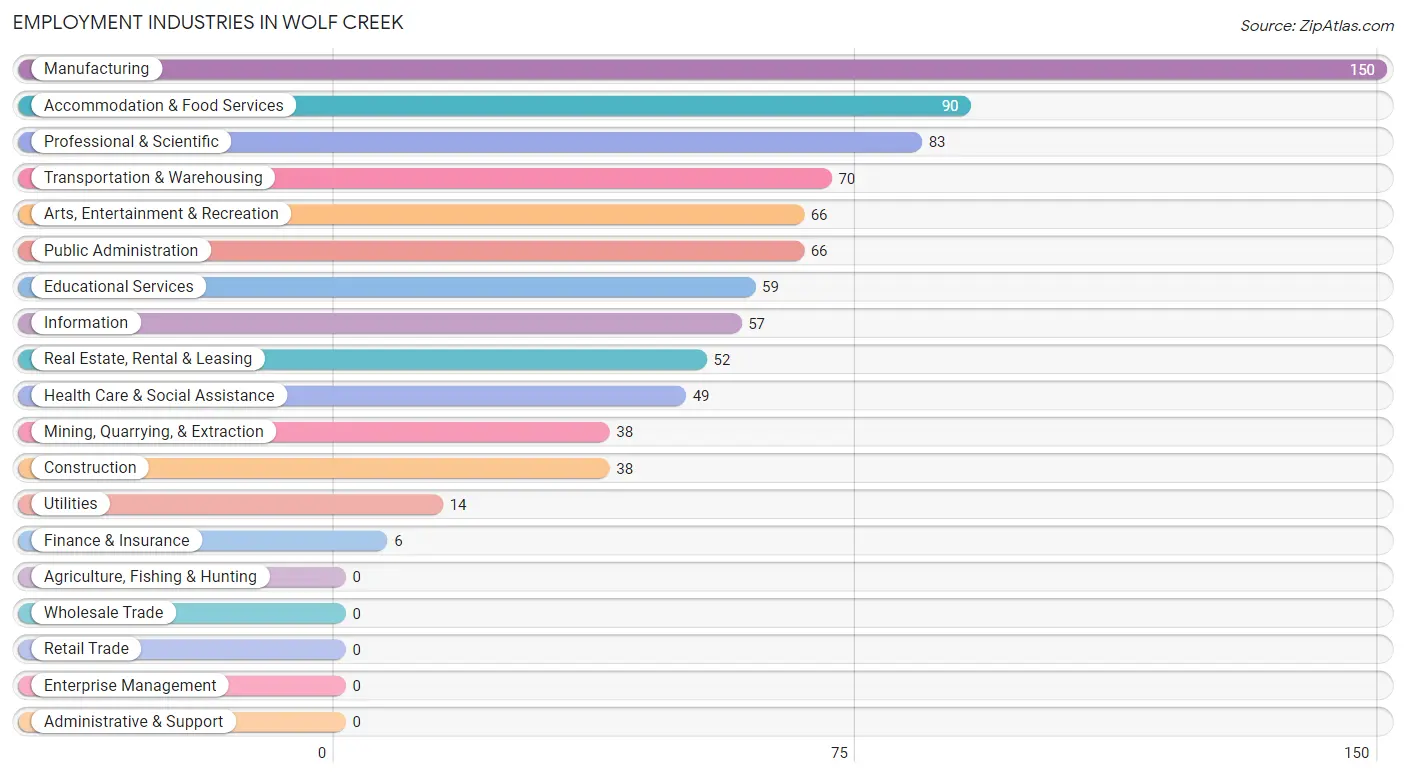
Employment Industries in Wolf Creek
The major employment industries in Wolf Creek include Manufacturing (150 | 17.9%), Accommodation & Food Services (90 | 10.7%), Professional & Scientific (83 | 9.9%), Transportation & Warehousing (70 | 8.4%), and Arts, Entertainment & Recreation (66 | 7.9%).
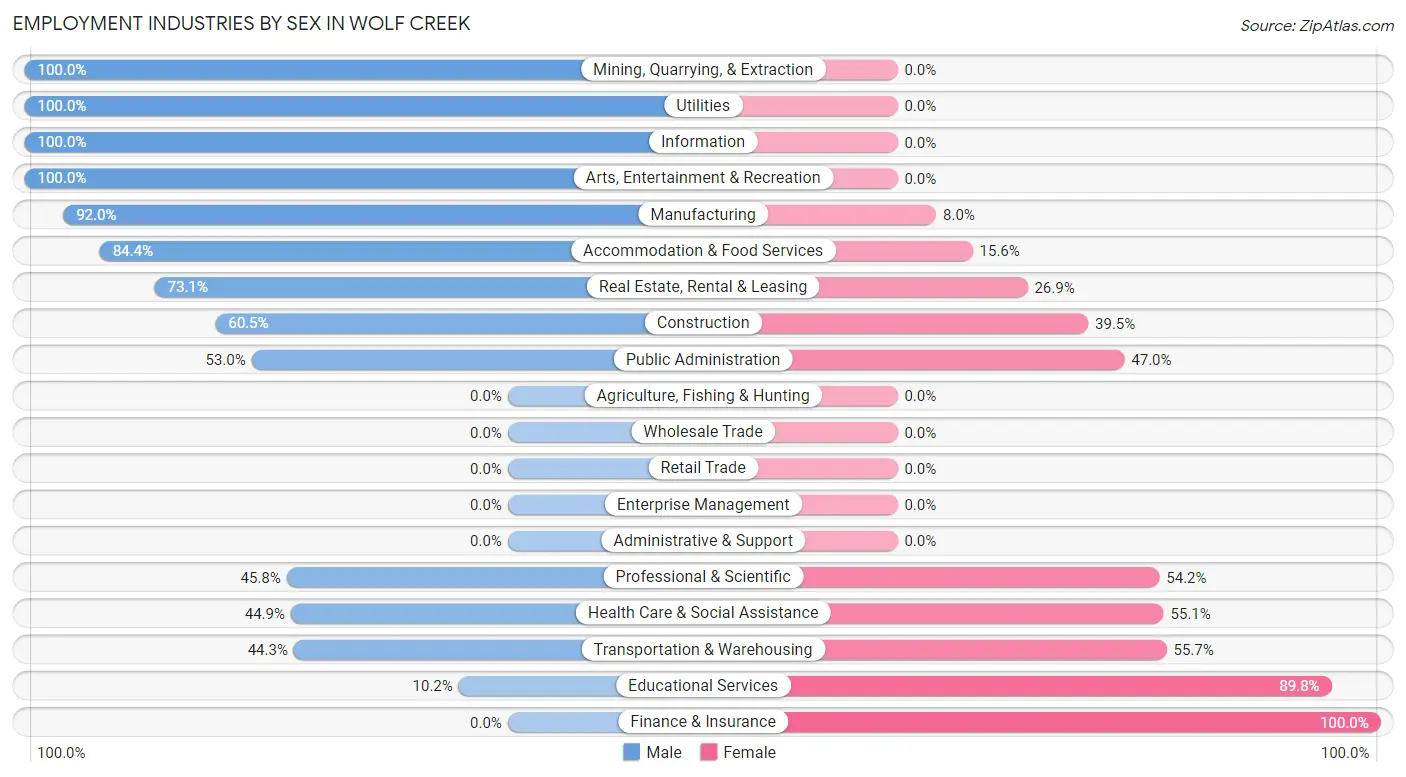
Employment Industries by Sex in Wolf Creek
The Wolf Creek industries that see more men than women are Mining, Quarrying, & Extraction (100.0%), Utilities (100.0%), and Information (100.0%), whereas the industries that tend to have a higher number of women are Finance & Insurance (100.0%), Educational Services (89.8%), and Transportation & Warehousing (55.7%).
| Industry | Male | Female |
| Agriculture, Fishing & Hunting | 0 (0.0%) | 0 (0.0%) |
| Mining, Quarrying, & Extraction | 38 (100.0%) | 0 (0.0%) |
| Construction | 23 (60.5%) | 15 (39.5%) |
| Manufacturing | 138 (92.0%) | 12 (8.0%) |
| Wholesale Trade | 0 (0.0%) | 0 (0.0%) |
| Retail Trade | 0 (0.0%) | 0 (0.0%) |
| Transportation & Warehousing | 31 (44.3%) | 39 (55.7%) |
| Utilities | 14 (100.0%) | 0 (0.0%) |
| Information | 57 (100.0%) | 0 (0.0%) |
| Finance & Insurance | 0 (0.0%) | 6 (100.0%) |
| Real Estate, Rental & Leasing | 38 (73.1%) | 14 (26.9%) |
| Professional & Scientific | 38 (45.8%) | 45 (54.2%) |
| Enterprise Management | 0 (0.0%) | 0 (0.0%) |
| Administrative & Support | 0 (0.0%) | 0 (0.0%) |
| Educational Services | 6 (10.2%) | 53 (89.8%) |
| Health Care & Social Assistance | 22 (44.9%) | 27 (55.1%) |
| Arts, Entertainment & Recreation | 66 (100.0%) | 0 (0.0%) |
| Accommodation & Food Services | 76 (84.4%) | 14 (15.6%) |
| Public Administration | 35 (53.0%) | 31 (47.0%) |
| Total | 582 (69.5%) | 256 (30.5%) |
Education in Wolf Creek
School Enrollment in Wolf Creek
The most common levels of schooling among the 432 students in Wolf Creek are middle school (152 | 35.2%), college / undergraduate (73 | 16.9%), and elementary school (71 | 16.4%).
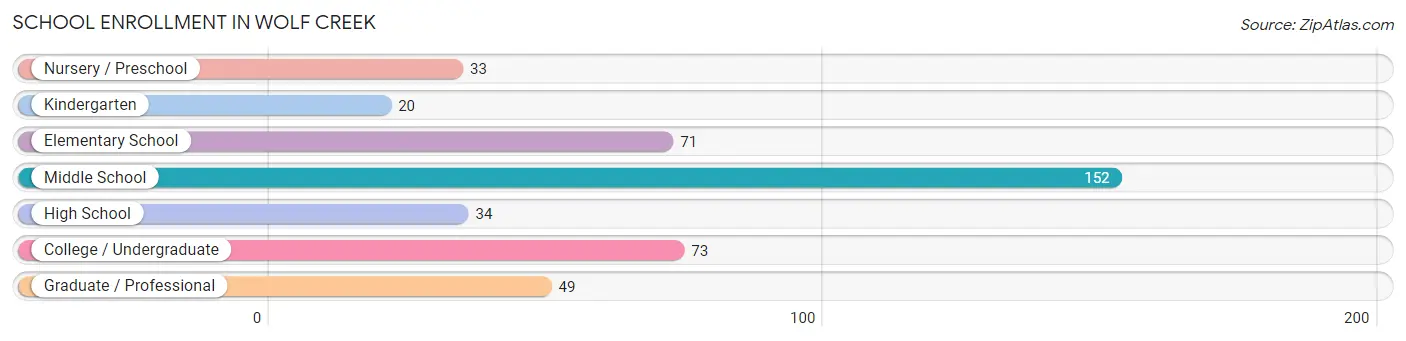
| School Level | # Students | % Students |
| Nursery / Preschool | 33 | 7.6% |
| Kindergarten | 20 | 4.6% |
| Elementary School | 71 | 16.4% |
| Middle School | 152 | 35.2% |
| High School | 34 | 7.9% |
| College / Undergraduate | 73 | 16.9% |
| Graduate / Professional | 49 | 11.3% |
| Total | 432 | 100.0% |
School Enrollment by Age by Funding Source in Wolf Creek
Out of a total of 432 students who are enrolled in schools in Wolf Creek, 121 (28.0%) attend a private institution, while the remaining 311 (72.0%) are enrolled in public schools. The age group of 35 years and over has the highest likelihood of being enrolled in private schools, with 35 (100.0% in the age bracket) enrolled. Conversely, the age group of 18 to 19 year olds has the lowest likelihood of being enrolled in a private school, with 11 (100.0% in the age bracket) attending a public institution.
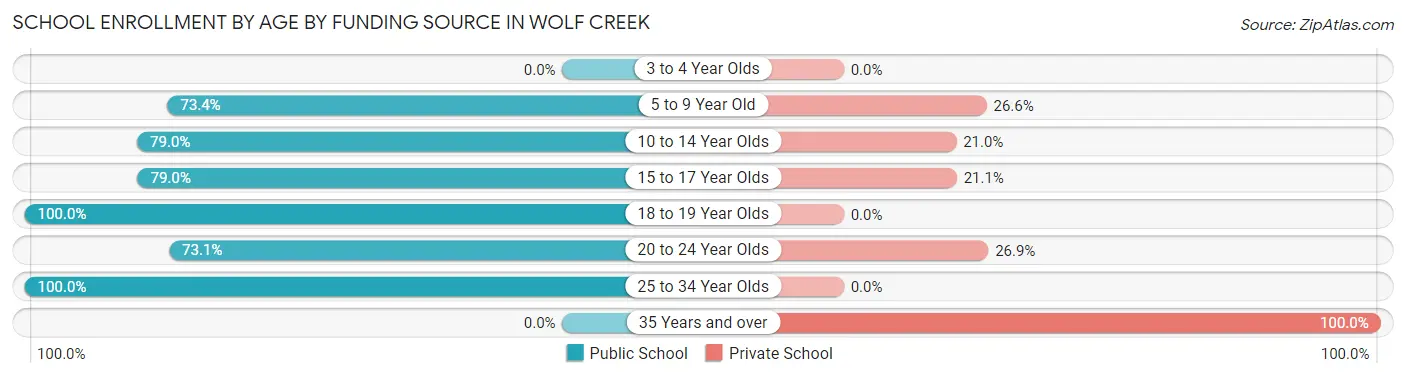
| Age Bracket | Public School | Private School |
| 3 to 4 Year Olds | 0 (0.0%) | 0 (0.0%) |
| 5 to 9 Year Old | 91 (73.4%) | 33 (26.6%) |
| 10 to 14 Year Olds | 132 (79.0%) | 35 (21.0%) |
| 15 to 17 Year Olds | 15 (78.9%) | 4 (21.0%) |
| 18 to 19 Year Olds | 11 (100.0%) | 0 (0.0%) |
| 20 to 24 Year Olds | 38 (73.1%) | 14 (26.9%) |
| 25 to 34 Year Olds | 24 (100.0%) | 0 (0.0%) |
| 35 Years and over | 0 (0.0%) | 35 (100.0%) |
| Total | 311 (72.0%) | 121 (28.0%) |
Educational Attainment by Field of Study in Wolf Creek
Business (180 | 23.5%), science & technology (123 | 16.0%), bio, nature & agricultural (102 | 13.3%), engineering (96 | 12.5%), and education (84 | 11.0%) are the most common fields of study among 767 individuals in Wolf Creek who have obtained a bachelor's degree or higher.
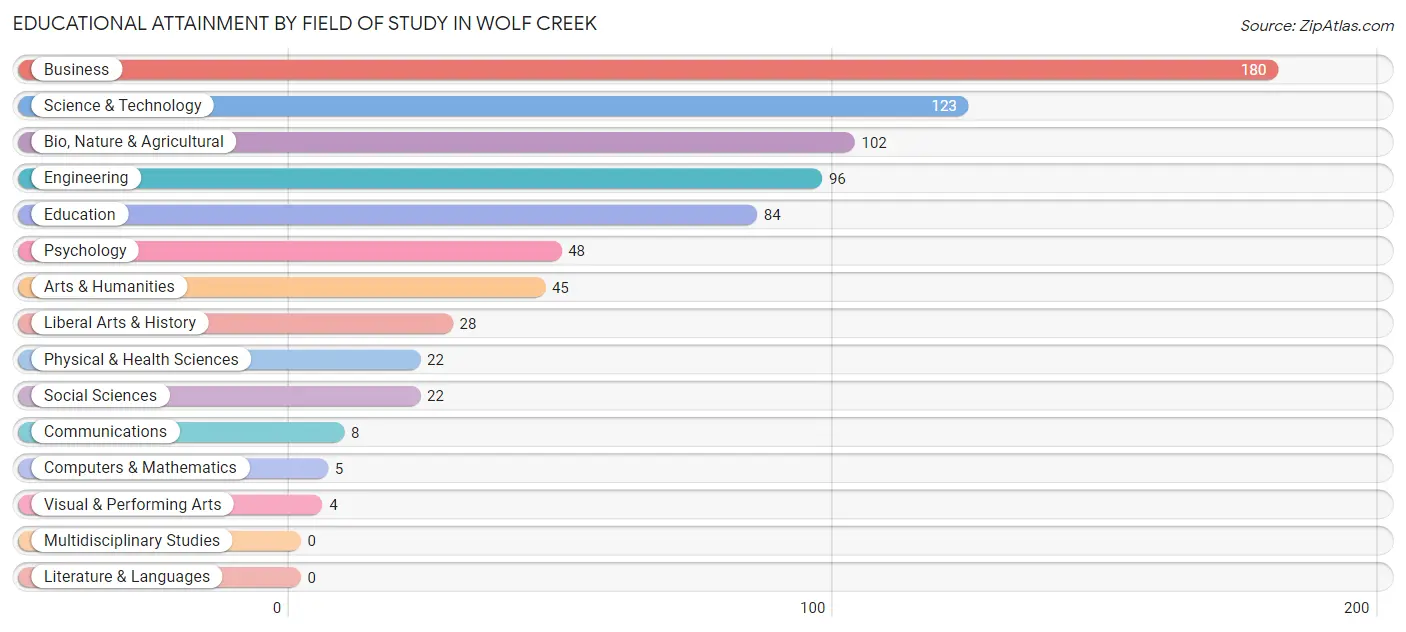
| Field of Study | # Graduates | % Graduates |
| Computers & Mathematics | 5 | 0.6% |
| Bio, Nature & Agricultural | 102 | 13.3% |
| Physical & Health Sciences | 22 | 2.9% |
| Psychology | 48 | 6.3% |
| Social Sciences | 22 | 2.9% |
| Engineering | 96 | 12.5% |
| Multidisciplinary Studies | 0 | 0.0% |
| Science & Technology | 123 | 16.0% |
| Business | 180 | 23.5% |
| Education | 84 | 11.0% |
| Literature & Languages | 0 | 0.0% |
| Liberal Arts & History | 28 | 3.6% |
| Visual & Performing Arts | 4 | 0.5% |
| Communications | 8 | 1.0% |
| Arts & Humanities | 45 | 5.9% |
| Total | 767 | 100.0% |
Transportation & Commute in Wolf Creek
Vehicle Availability by Sex in Wolf Creek
The most prevalent vehicle ownership categories in Wolf Creek are males with 2 vehicles (201, accounting for 35.6%) and females with 2 vehicles (106, making up 78.5%).
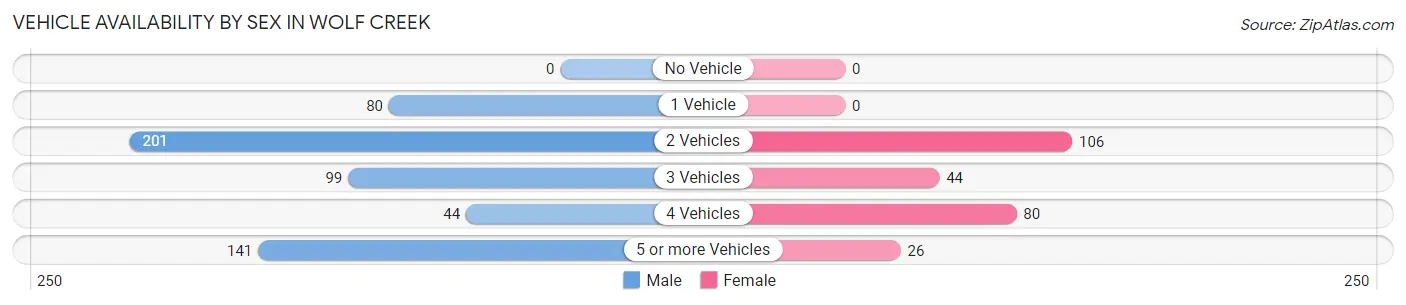
| Vehicles Available | Male | Female |
| No Vehicle | 0 (0.0%) | 0 (0.0%) |
| 1 Vehicle | 80 (14.2%) | 0 (0.0%) |
| 2 Vehicles | 201 (35.6%) | 106 (41.4%) |
| 3 Vehicles | 99 (17.5%) | 44 (17.2%) |
| 4 Vehicles | 44 (7.8%) | 80 (31.2%) |
| 5 or more Vehicles | 141 (25.0%) | 26 (10.2%) |
| Total | 565 (100.0%) | 256 (100.0%) |
Commute Time in Wolf Creek
The most frequently occuring commute durations in Wolf Creek are 30 to 34 minutes (222 commuters, 32.7%), 45 to 59 minutes (166 commuters, 24.4%), and 5 to 9 minutes (100 commuters, 14.7%).
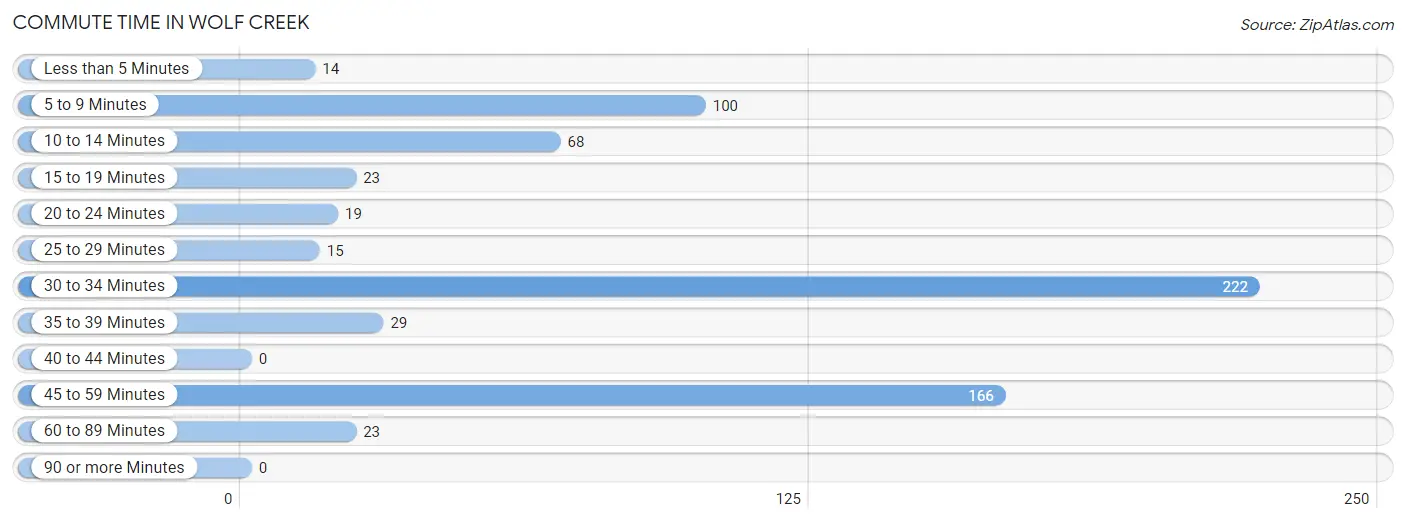
| Commute Time | # Commuters | % Commuters |
| Less than 5 Minutes | 14 | 2.1% |
| 5 to 9 Minutes | 100 | 14.7% |
| 10 to 14 Minutes | 68 | 10.0% |
| 15 to 19 Minutes | 23 | 3.4% |
| 20 to 24 Minutes | 19 | 2.8% |
| 25 to 29 Minutes | 15 | 2.2% |
| 30 to 34 Minutes | 222 | 32.7% |
| 35 to 39 Minutes | 29 | 4.3% |
| 40 to 44 Minutes | 0 | 0.0% |
| 45 to 59 Minutes | 166 | 24.4% |
| 60 to 89 Minutes | 23 | 3.4% |
| 90 or more Minutes | 0 | 0.0% |
Commute Time by Sex in Wolf Creek
The most common commute times in Wolf Creek are 45 to 59 minutes (115 commuters, 23.9%) for males and 30 to 34 minutes (132 commuters, 67.0%) for females.
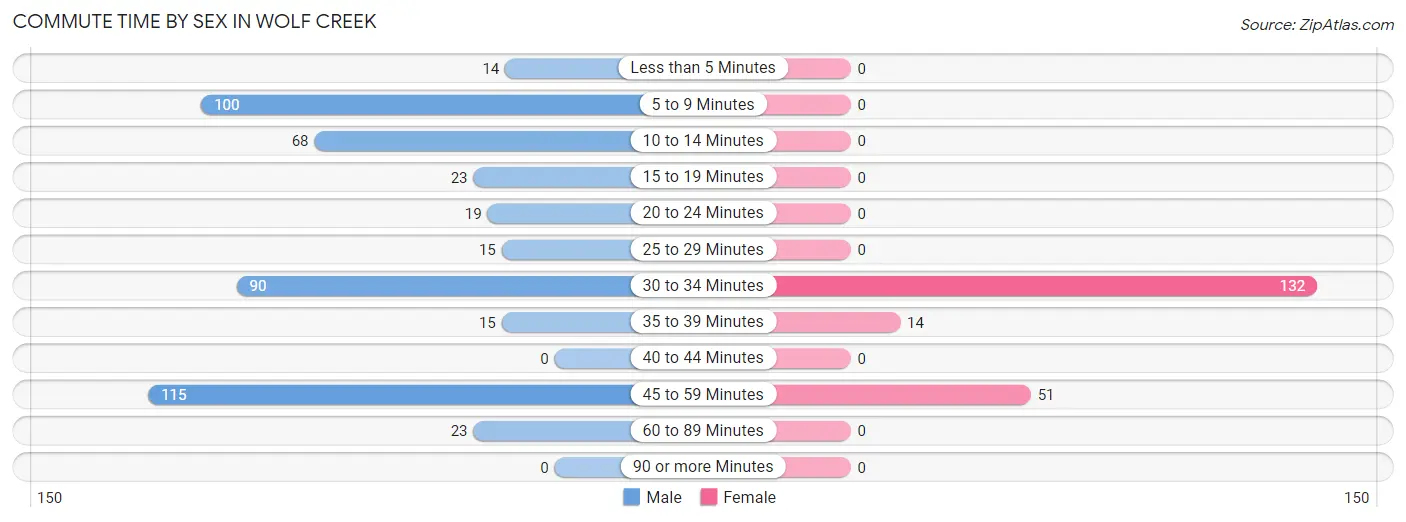
| Commute Time | Male | Female |
| Less than 5 Minutes | 14 (2.9%) | 0 (0.0%) |
| 5 to 9 Minutes | 100 (20.7%) | 0 (0.0%) |
| 10 to 14 Minutes | 68 (14.1%) | 0 (0.0%) |
| 15 to 19 Minutes | 23 (4.8%) | 0 (0.0%) |
| 20 to 24 Minutes | 19 (3.9%) | 0 (0.0%) |
| 25 to 29 Minutes | 15 (3.1%) | 0 (0.0%) |
| 30 to 34 Minutes | 90 (18.7%) | 132 (67.0%) |
| 35 to 39 Minutes | 15 (3.1%) | 14 (7.1%) |
| 40 to 44 Minutes | 0 (0.0%) | 0 (0.0%) |
| 45 to 59 Minutes | 115 (23.9%) | 51 (25.9%) |
| 60 to 89 Minutes | 23 (4.8%) | 0 (0.0%) |
| 90 or more Minutes | 0 (0.0%) | 0 (0.0%) |
Time of Departure to Work by Sex in Wolf Creek
The most frequent times of departure to work in Wolf Creek are 6:00 AM to 6:29 AM (117, 24.3%) for males and 7:00 AM to 7:29 AM (81, 41.1%) for females.
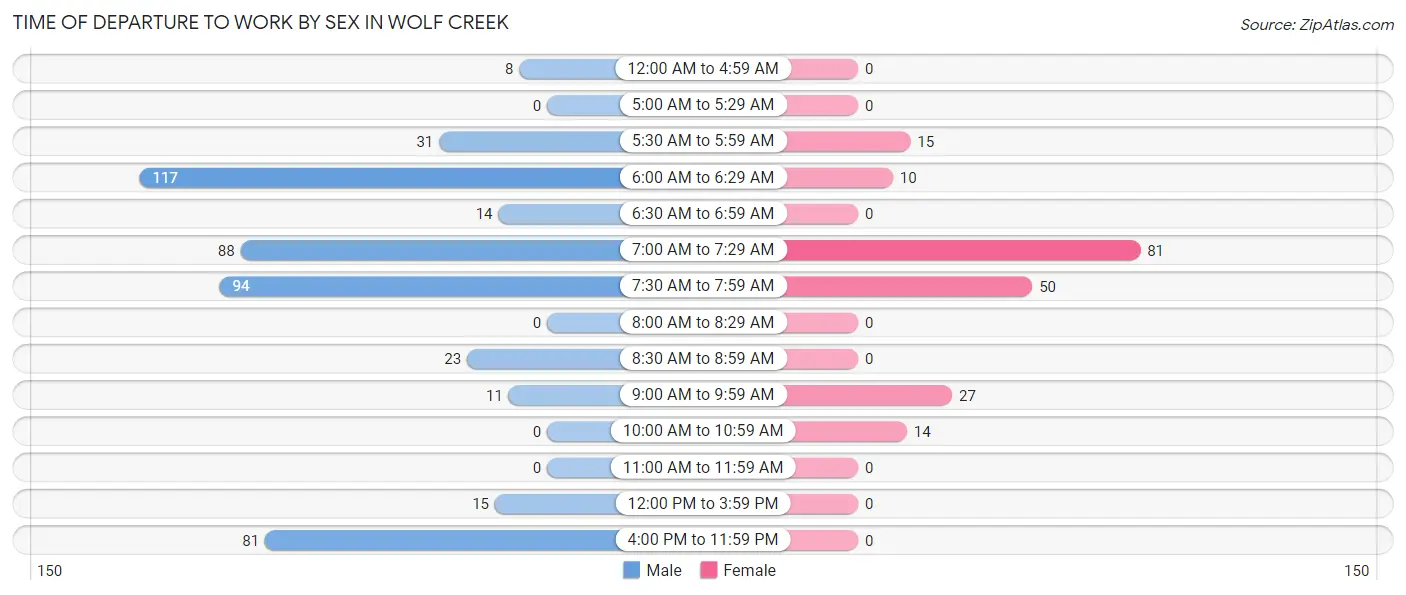
| Time of Departure | Male | Female |
| 12:00 AM to 4:59 AM | 8 (1.7%) | 0 (0.0%) |
| 5:00 AM to 5:29 AM | 0 (0.0%) | 0 (0.0%) |
| 5:30 AM to 5:59 AM | 31 (6.4%) | 15 (7.6%) |
| 6:00 AM to 6:29 AM | 117 (24.3%) | 10 (5.1%) |
| 6:30 AM to 6:59 AM | 14 (2.9%) | 0 (0.0%) |
| 7:00 AM to 7:29 AM | 88 (18.3%) | 81 (41.1%) |
| 7:30 AM to 7:59 AM | 94 (19.5%) | 50 (25.4%) |
| 8:00 AM to 8:29 AM | 0 (0.0%) | 0 (0.0%) |
| 8:30 AM to 8:59 AM | 23 (4.8%) | 0 (0.0%) |
| 9:00 AM to 9:59 AM | 11 (2.3%) | 27 (13.7%) |
| 10:00 AM to 10:59 AM | 0 (0.0%) | 14 (7.1%) |
| 11:00 AM to 11:59 AM | 0 (0.0%) | 0 (0.0%) |
| 12:00 PM to 3:59 PM | 15 (3.1%) | 0 (0.0%) |
| 4:00 PM to 11:59 PM | 81 (16.8%) | 0 (0.0%) |
| Total | 482 (100.0%) | 197 (100.0%) |
Housing Occupancy in Wolf Creek
Occupancy by Ownership in Wolf Creek
Of the total 582 dwellings in Wolf Creek, owner-occupied units account for 473 (81.3%), while renter-occupied units make up 109 (18.7%).
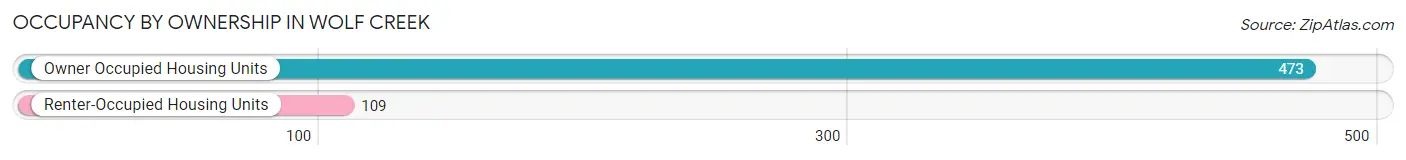
| Occupancy | # Housing Units | % Housing Units |
| Owner Occupied Housing Units | 473 | 81.3% |
| Renter-Occupied Housing Units | 109 | 18.7% |
| Total Occupied Housing Units | 582 | 100.0% |
Occupancy by Household Size in Wolf Creek
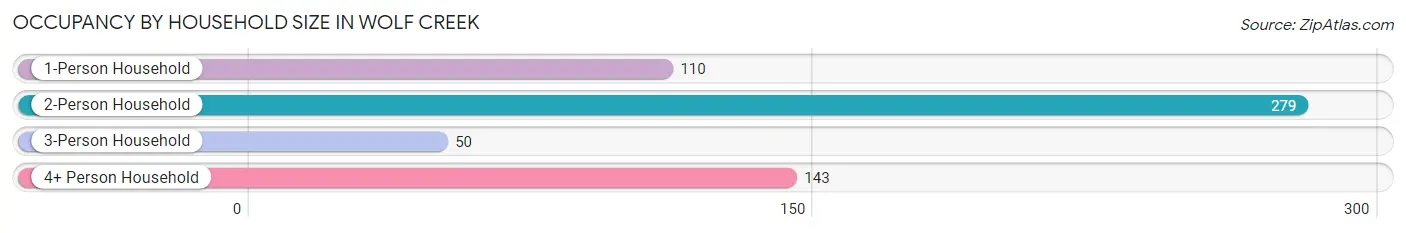
| Household Size | # Housing Units | % Housing Units |
| 1-Person Household | 110 | 18.9% |
| 2-Person Household | 279 | 47.9% |
| 3-Person Household | 50 | 8.6% |
| 4+ Person Household | 143 | 24.6% |
| Total Housing Units | 582 | 100.0% |
Occupancy by Ownership by Household Size in Wolf Creek
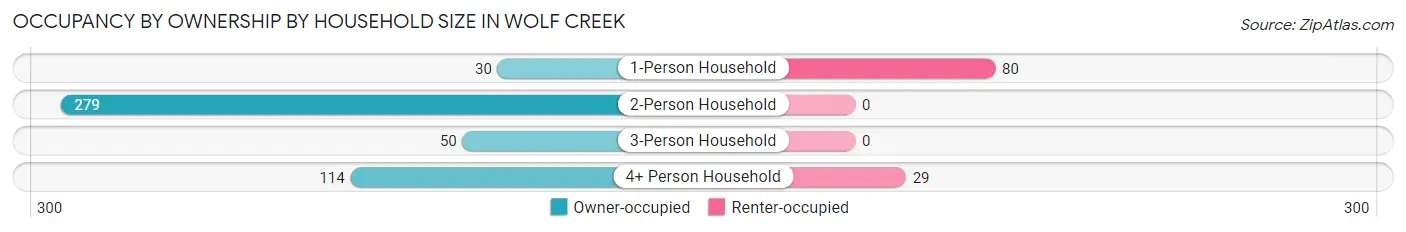
| Household Size | Owner-occupied | Renter-occupied |
| 1-Person Household | 30 (27.3%) | 80 (72.7%) |
| 2-Person Household | 279 (100.0%) | 0 (0.0%) |
| 3-Person Household | 50 (100.0%) | 0 (0.0%) |
| 4+ Person Household | 114 (79.7%) | 29 (20.3%) |
| Total Housing Units | 473 (81.3%) | 109 (18.7%) |
Occupancy by Educational Attainment in Wolf Creek
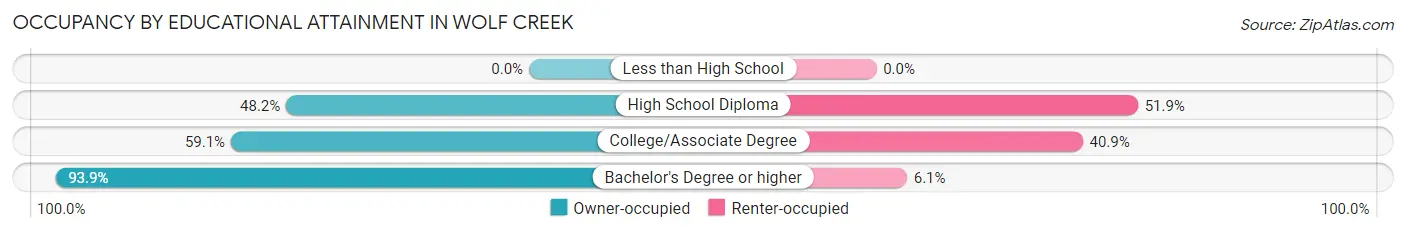
| Household Size | Owner-occupied | Renter-occupied |
| Less than High School | 0 (0.0%) | 0 (0.0%) |
| High School Diploma | 13 (48.1%) | 14 (51.8%) |
| College/Associate Degree | 104 (59.1%) | 72 (40.9%) |
| Bachelor's Degree or higher | 356 (93.9%) | 23 (6.1%) |
Occupancy by Age of Householder in Wolf Creek
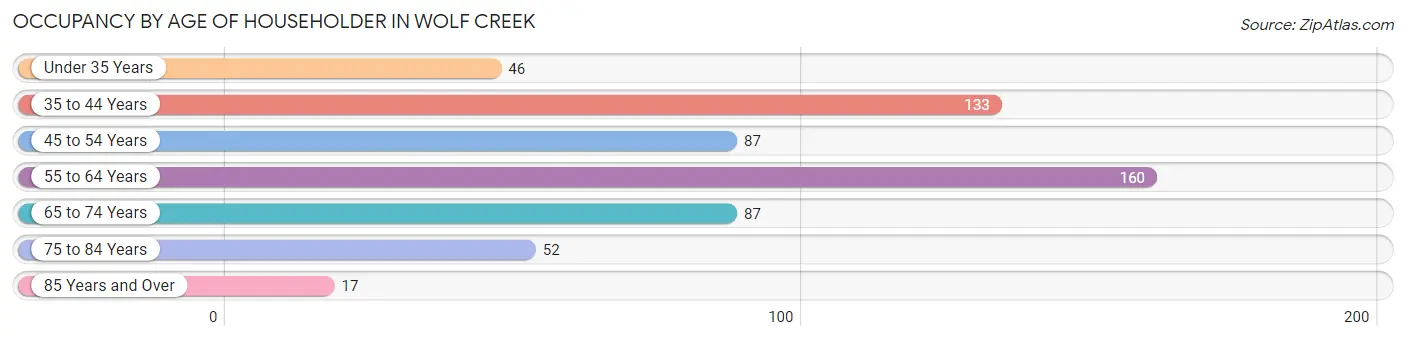
| Age Bracket | # Households | % Households |
| Under 35 Years | 46 | 7.9% |
| 35 to 44 Years | 133 | 22.9% |
| 45 to 54 Years | 87 | 14.9% |
| 55 to 64 Years | 160 | 27.5% |
| 65 to 74 Years | 87 | 14.9% |
| 75 to 84 Years | 52 | 8.9% |
| 85 Years and Over | 17 | 2.9% |
| Total | 582 | 100.0% |
Housing Finances in Wolf Creek
Median Income by Occupancy in Wolf Creek
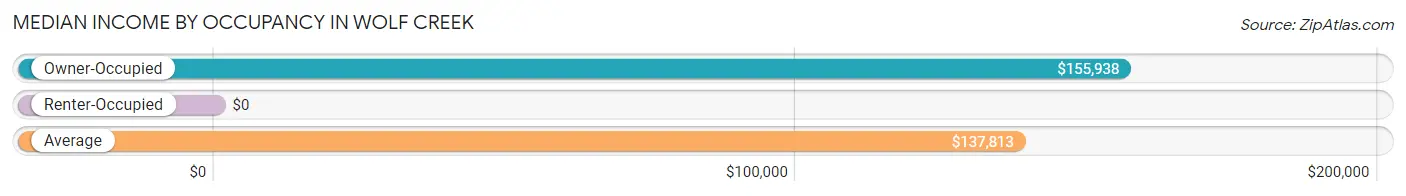
| Occupancy Type | # Households | Median Income |
| Owner-Occupied | 473 (81.3%) | $155,938 |
| Renter-Occupied | 109 (18.7%) | $0 |
| Average | 582 (100.0%) | $137,813 |
Occupancy by Householder Income Bracket in Wolf Creek
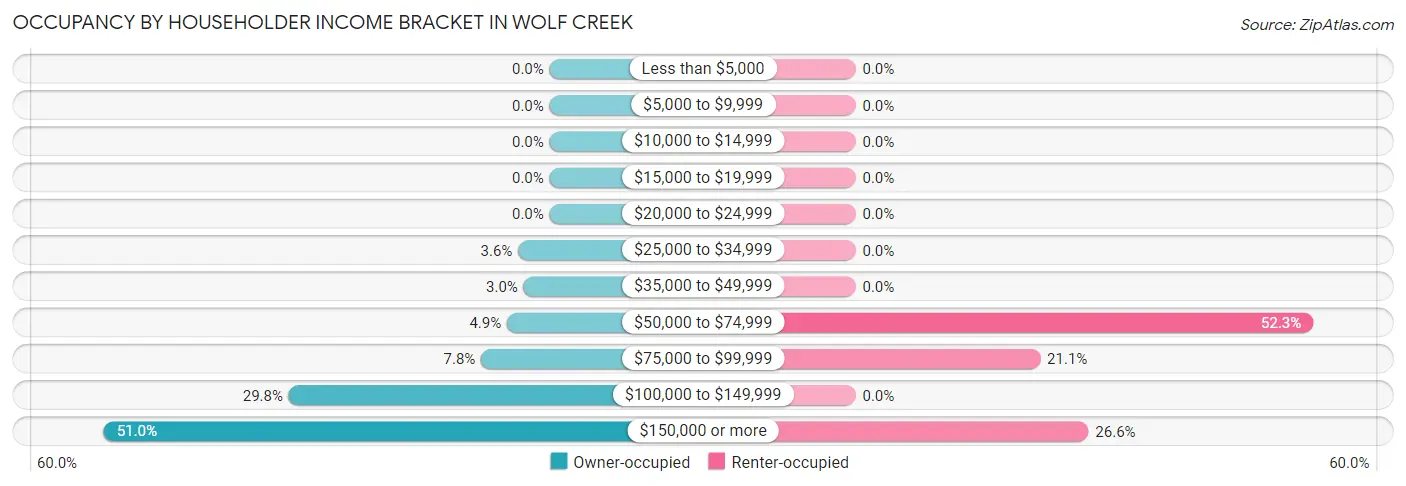
| Income Bracket | Owner-occupied | Renter-occupied |
| Less than $5,000 | 0 (0.0%) | 0 (0.0%) |
| $5,000 to $9,999 | 0 (0.0%) | 0 (0.0%) |
| $10,000 to $14,999 | 0 (0.0%) | 0 (0.0%) |
| $15,000 to $19,999 | 0 (0.0%) | 0 (0.0%) |
| $20,000 to $24,999 | 0 (0.0%) | 0 (0.0%) |
| $25,000 to $34,999 | 17 (3.6%) | 0 (0.0%) |
| $35,000 to $49,999 | 14 (3.0%) | 0 (0.0%) |
| $50,000 to $74,999 | 23 (4.9%) | 57 (52.3%) |
| $75,000 to $99,999 | 37 (7.8%) | 23 (21.1%) |
| $100,000 to $149,999 | 141 (29.8%) | 0 (0.0%) |
| $150,000 or more | 241 (50.9%) | 29 (26.6%) |
| Total | 473 (100.0%) | 109 (100.0%) |
Monthly Housing Cost Tiers in Wolf Creek
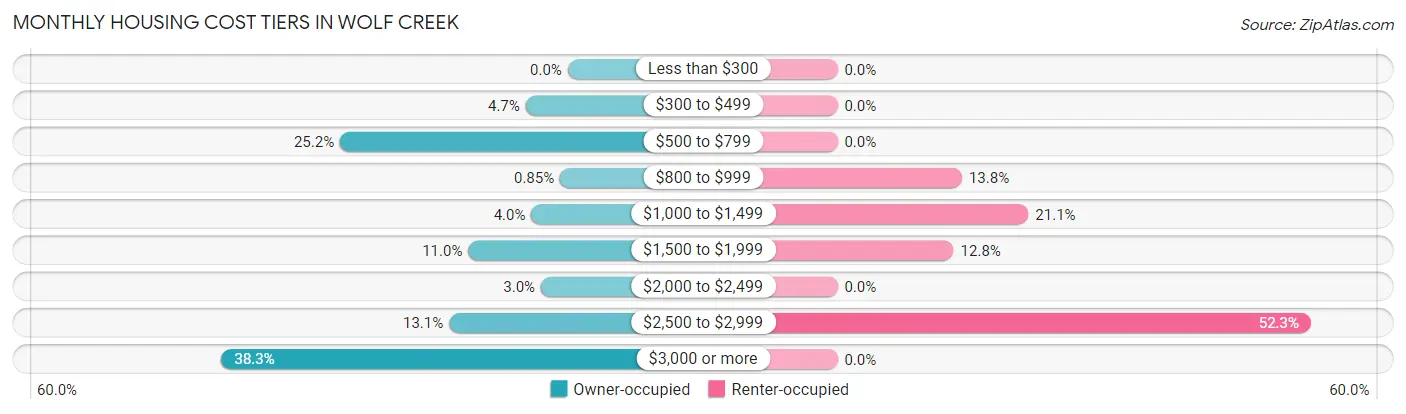
| Monthly Cost | Owner-occupied | Renter-occupied |
| Less than $300 | 0 (0.0%) | 0 (0.0%) |
| $300 to $499 | 22 (4.6%) | 0 (0.0%) |
| $500 to $799 | 119 (25.2%) | 0 (0.0%) |
| $800 to $999 | 4 (0.9%) | 15 (13.8%) |
| $1,000 to $1,499 | 19 (4.0%) | 23 (21.1%) |
| $1,500 to $1,999 | 52 (11.0%) | 14 (12.8%) |
| $2,000 to $2,499 | 14 (3.0%) | 0 (0.0%) |
| $2,500 to $2,999 | 62 (13.1%) | 57 (52.3%) |
| $3,000 or more | 181 (38.3%) | 0 (0.0%) |
| Total | 473 (100.0%) | 109 (100.0%) |
Physical Housing Characteristics in Wolf Creek
Housing Structures in Wolf Creek
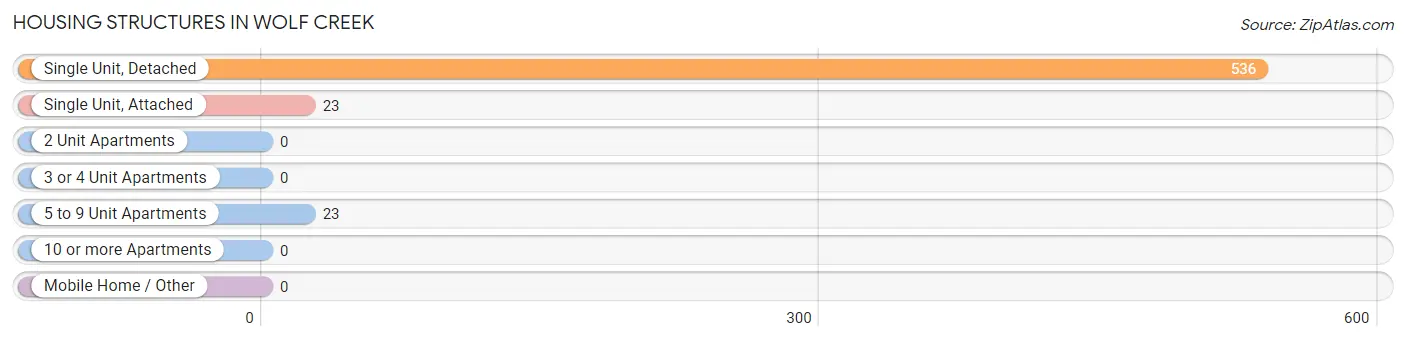
| Structure Type | # Housing Units | % Housing Units |
| Single Unit, Detached | 536 | 92.1% |
| Single Unit, Attached | 23 | 4.0% |
| 2 Unit Apartments | 0 | 0.0% |
| 3 or 4 Unit Apartments | 0 | 0.0% |
| 5 to 9 Unit Apartments | 23 | 4.0% |
| 10 or more Apartments | 0 | 0.0% |
| Mobile Home / Other | 0 | 0.0% |
| Total | 582 | 100.0% |
Housing Structures by Occupancy in Wolf Creek
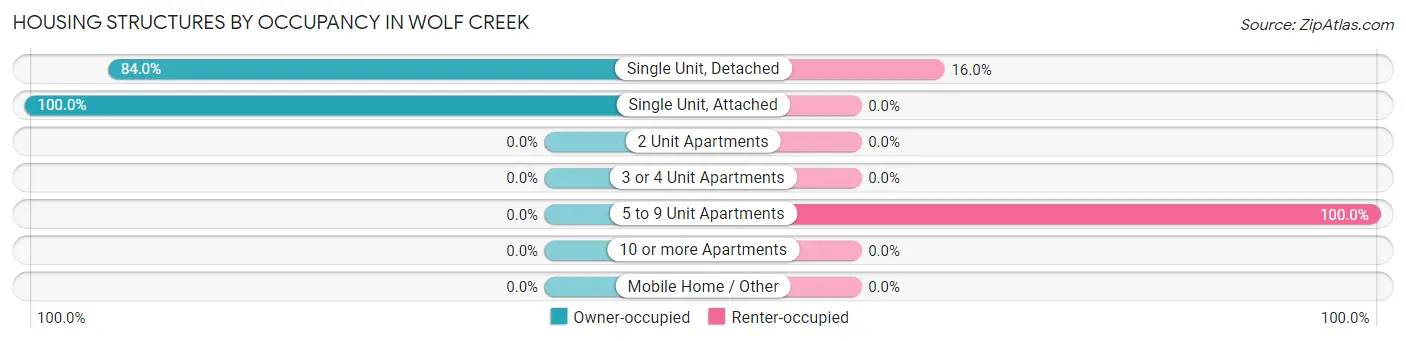
| Structure Type | Owner-occupied | Renter-occupied |
| Single Unit, Detached | 450 (84.0%) | 86 (16.0%) |
| Single Unit, Attached | 23 (100.0%) | 0 (0.0%) |
| 2 Unit Apartments | 0 (0.0%) | 0 (0.0%) |
| 3 or 4 Unit Apartments | 0 (0.0%) | 0 (0.0%) |
| 5 to 9 Unit Apartments | 0 (0.0%) | 23 (100.0%) |
| 10 or more Apartments | 0 (0.0%) | 0 (0.0%) |
| Mobile Home / Other | 0 (0.0%) | 0 (0.0%) |
| Total | 473 (81.3%) | 109 (18.7%) |
Housing Structures by Number of Rooms in Wolf Creek
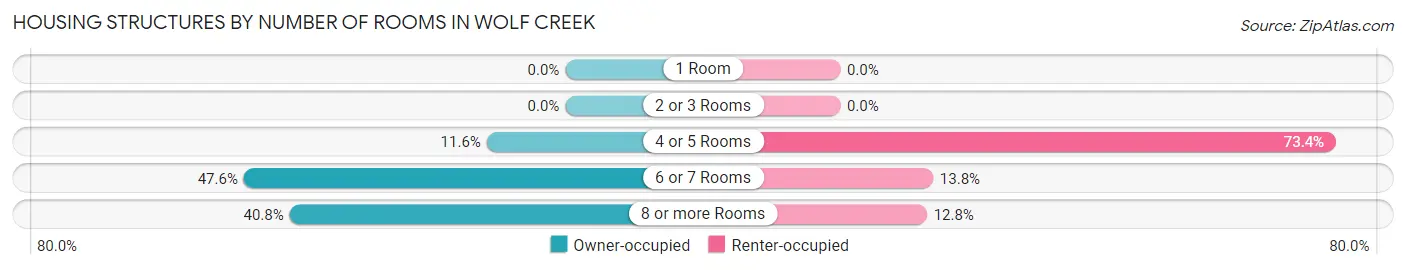
| Number of Rooms | Owner-occupied | Renter-occupied |
| 1 Room | 0 (0.0%) | 0 (0.0%) |
| 2 or 3 Rooms | 0 (0.0%) | 0 (0.0%) |
| 4 or 5 Rooms | 55 (11.6%) | 80 (73.4%) |
| 6 or 7 Rooms | 225 (47.6%) | 15 (13.8%) |
| 8 or more Rooms | 193 (40.8%) | 14 (12.8%) |
| Total | 473 (100.0%) | 109 (100.0%) |
Housing Structure by Heating Type in Wolf Creek
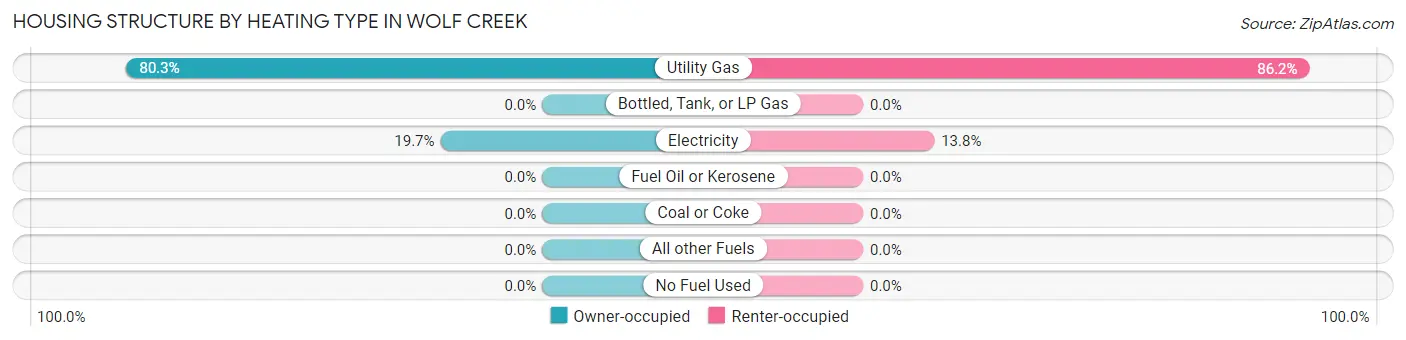
| Heating Type | Owner-occupied | Renter-occupied |
| Utility Gas | 380 (80.3%) | 94 (86.2%) |
| Bottled, Tank, or LP Gas | 0 (0.0%) | 0 (0.0%) |
| Electricity | 93 (19.7%) | 15 (13.8%) |
| Fuel Oil or Kerosene | 0 (0.0%) | 0 (0.0%) |
| Coal or Coke | 0 (0.0%) | 0 (0.0%) |
| All other Fuels | 0 (0.0%) | 0 (0.0%) |
| No Fuel Used | 0 (0.0%) | 0 (0.0%) |
| Total | 473 (100.0%) | 109 (100.0%) |
Household Vehicle Usage in Wolf Creek
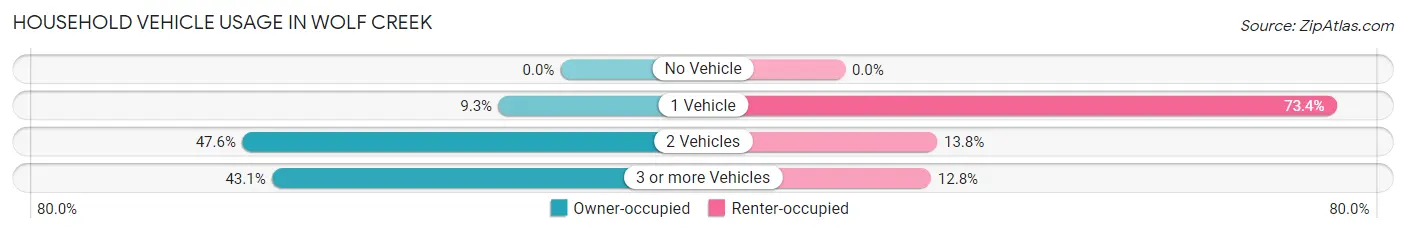
| Vehicles per Household | Owner-occupied | Renter-occupied |
| No Vehicle | 0 (0.0%) | 0 (0.0%) |
| 1 Vehicle | 44 (9.3%) | 80 (73.4%) |
| 2 Vehicles | 225 (47.6%) | 15 (13.8%) |
| 3 or more Vehicles | 204 (43.1%) | 14 (12.8%) |
| Total | 473 (100.0%) | 109 (100.0%) |
Real Estate & Mortgages in Wolf Creek
Real Estate and Mortgage Overview in Wolf Creek
| Characteristic | Without Mortgage | With Mortgage |
| Housing Units | 155 | 318 |
| Median Property Value | $703,400 | $626,800 |
| Median Household Income | - | - |
| Monthly Housing Costs | $696 | $181 |
| Real Estate Taxes | $3,612 | $0 |
Property Value by Mortgage Status in Wolf Creek
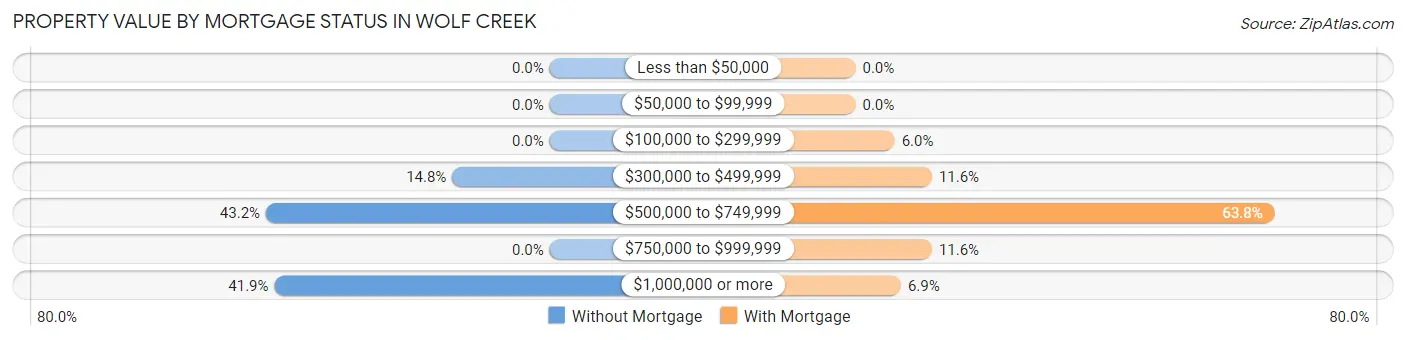
| Property Value | Without Mortgage | With Mortgage |
| Less than $50,000 | 0 (0.0%) | 0 (0.0%) |
| $50,000 to $99,999 | 0 (0.0%) | 0 (0.0%) |
| $100,000 to $299,999 | 0 (0.0%) | 19 (6.0%) |
| $300,000 to $499,999 | 23 (14.8%) | 37 (11.6%) |
| $500,000 to $749,999 | 67 (43.2%) | 203 (63.8%) |
| $750,000 to $999,999 | 0 (0.0%) | 37 (11.6%) |
| $1,000,000 or more | 65 (41.9%) | 22 (6.9%) |
| Total | 155 (100.0%) | 318 (100.0%) |
Household Income by Mortgage Status in Wolf Creek
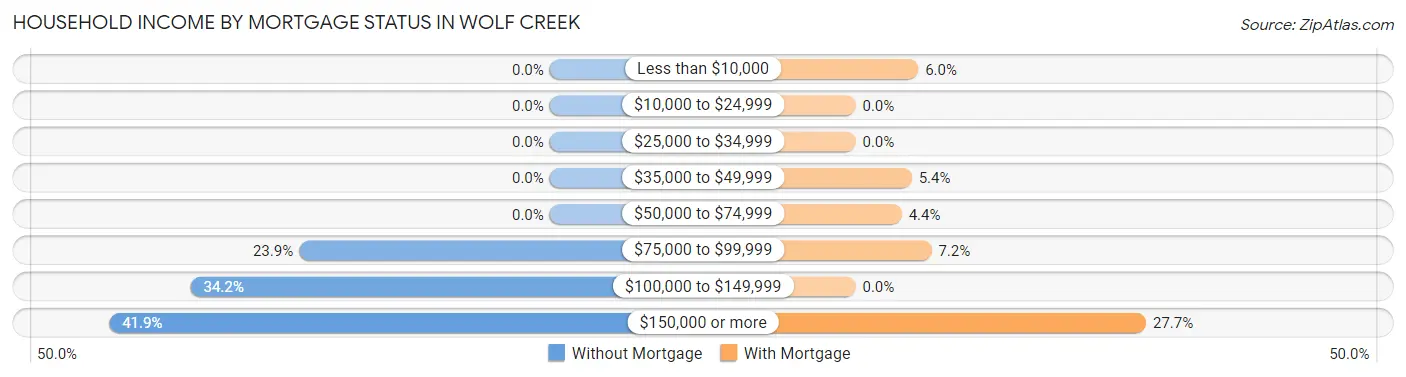
| Household Income | Without Mortgage | With Mortgage |
| Less than $10,000 | 0 (0.0%) | 19 (6.0%) |
| $10,000 to $24,999 | 0 (0.0%) | 0 (0.0%) |
| $25,000 to $34,999 | 0 (0.0%) | 0 (0.0%) |
| $35,000 to $49,999 | 0 (0.0%) | 17 (5.3%) |
| $50,000 to $74,999 | 0 (0.0%) | 14 (4.4%) |
| $75,000 to $99,999 | 37 (23.9%) | 23 (7.2%) |
| $100,000 to $149,999 | 53 (34.2%) | 0 (0.0%) |
| $150,000 or more | 65 (41.9%) | 88 (27.7%) |
| Total | 155 (100.0%) | 318 (100.0%) |
Property Value to Household Income Ratio in Wolf Creek
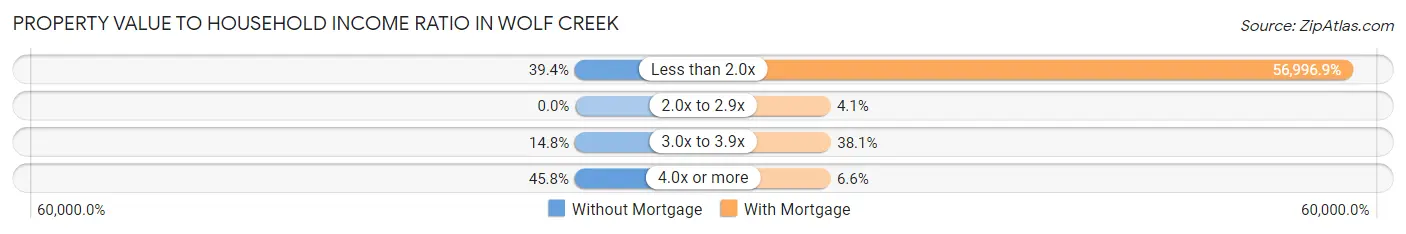
| Value-to-Income Ratio | Without Mortgage | With Mortgage |
| Less than 2.0x | 61 (39.4%) | 181,250 (56,996.9%) |
| 2.0x to 2.9x | 0 (0.0%) | 13 (4.1%) |
| 3.0x to 3.9x | 23 (14.8%) | 121 (38.1%) |
| 4.0x or more | 71 (45.8%) | 21 (6.6%) |
| Total | 155 (100.0%) | 318 (100.0%) |
Real Estate Taxes by Mortgage Status in Wolf Creek
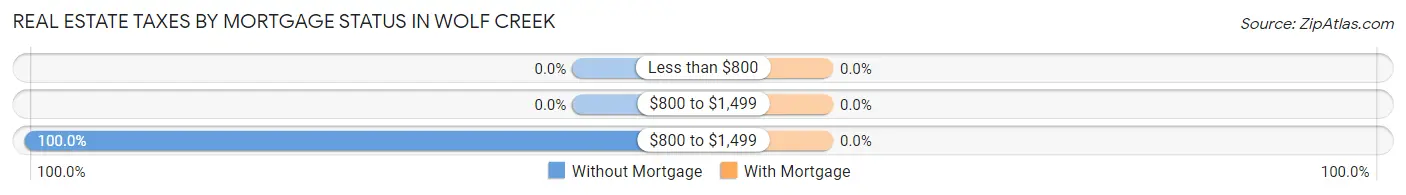
| Property Taxes | Without Mortgage | With Mortgage |
| Less than $800 | 0 (0.0%) | 0 (0.0%) |
| $800 to $1,499 | 0 (0.0%) | 0 (0.0%) |
| $800 to $1,499 | 155 (100.0%) | 0 (0.0%) |
| Total | 155 (100.0%) | 318 (100.0%) |
Health & Disability in Wolf Creek
Health Insurance Coverage by Age in Wolf Creek
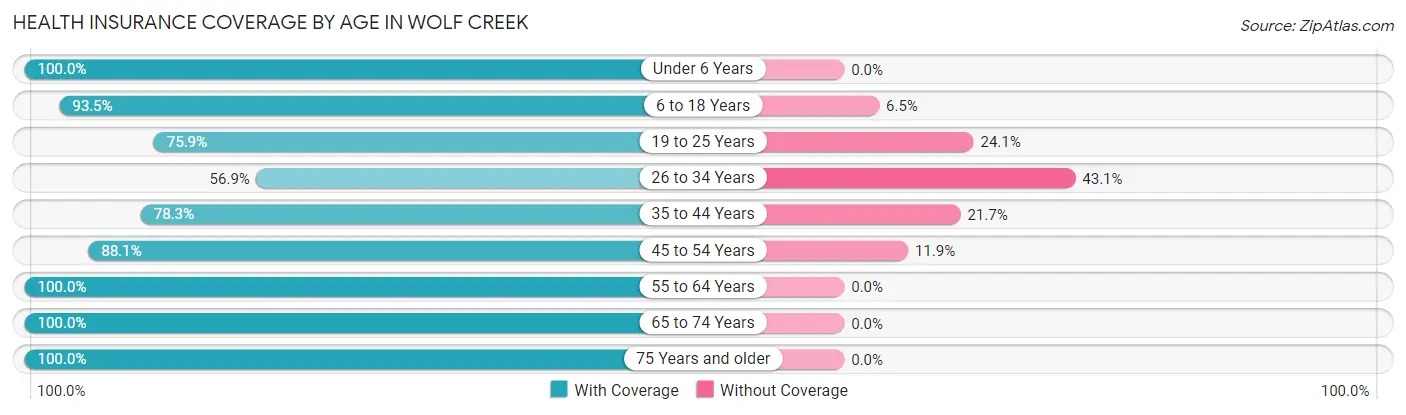
| Age Bracket | With Coverage | Without Coverage |
| Under 6 Years | 104 (100.0%) | 0 (0.0%) |
| 6 to 18 Years | 288 (93.5%) | 20 (6.5%) |
| 19 to 25 Years | 85 (75.9%) | 27 (24.1%) |
| 26 to 34 Years | 70 (56.9%) | 53 (43.1%) |
| 35 to 44 Years | 206 (78.3%) | 57 (21.7%) |
| 45 to 54 Years | 141 (88.1%) | 19 (11.9%) |
| 55 to 64 Years | 227 (100.0%) | 0 (0.0%) |
| 65 to 74 Years | 263 (100.0%) | 0 (0.0%) |
| 75 Years and older | 82 (100.0%) | 0 (0.0%) |
| Total | 1,466 (89.3%) | 176 (10.7%) |
Health Insurance Coverage by Citizenship Status in Wolf Creek
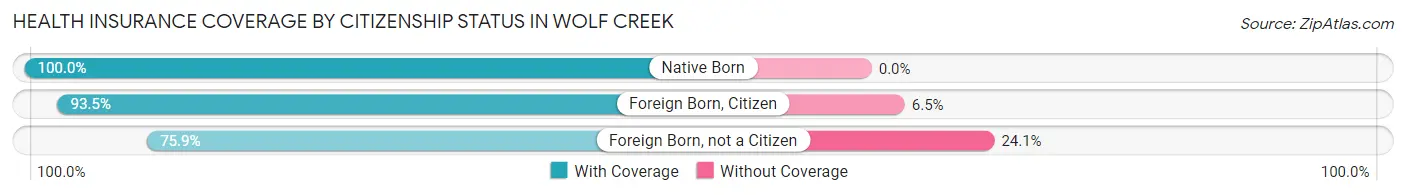
| Citizenship Status | With Coverage | Without Coverage |
| Native Born | 104 (100.0%) | 0 (0.0%) |
| Foreign Born, Citizen | 288 (93.5%) | 20 (6.5%) |
| Foreign Born, not a Citizen | 85 (75.9%) | 27 (24.1%) |
Health Insurance Coverage by Household Income in Wolf Creek
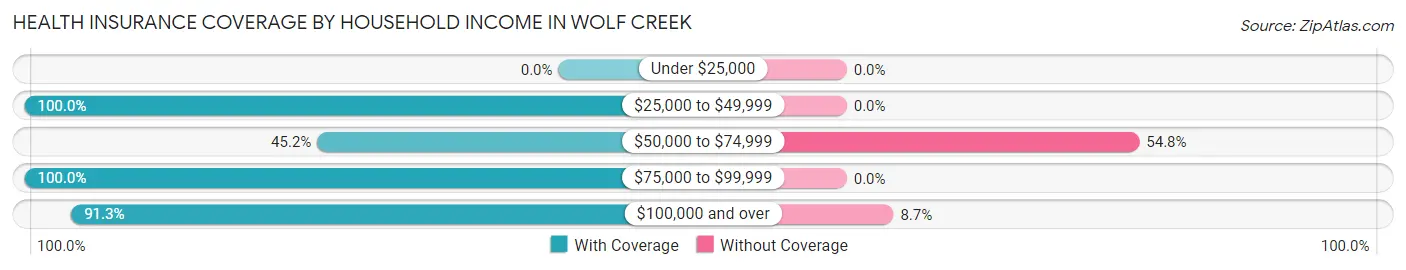
| Household Income | With Coverage | Without Coverage |
| Under $25,000 | 0 (0.0%) | 0 (0.0%) |
| $25,000 to $49,999 | 45 (100.0%) | 0 (0.0%) |
| $50,000 to $74,999 | 47 (45.2%) | 57 (54.8%) |
| $75,000 to $99,999 | 131 (100.0%) | 0 (0.0%) |
| $100,000 and over | 1,243 (91.3%) | 119 (8.7%) |
Public vs Private Health Insurance Coverage by Age in Wolf Creek
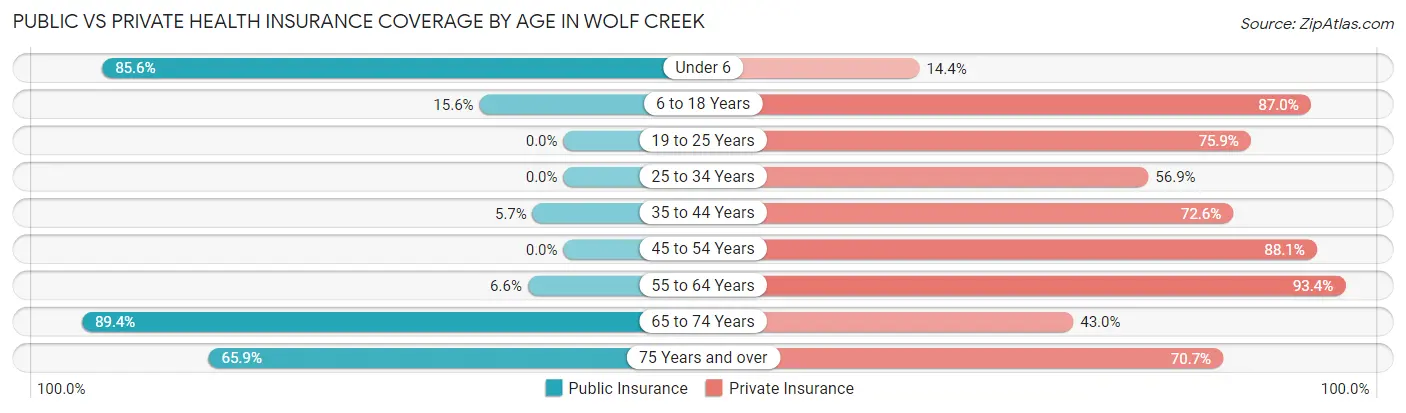
| Age Bracket | Public Insurance | Private Insurance |
| Under 6 | 89 (85.6%) | 15 (14.4%) |
| 6 to 18 Years | 48 (15.6%) | 268 (87.0%) |
| 19 to 25 Years | 0 (0.0%) | 85 (75.9%) |
| 25 to 34 Years | 0 (0.0%) | 70 (56.9%) |
| 35 to 44 Years | 15 (5.7%) | 191 (72.6%) |
| 45 to 54 Years | 0 (0.0%) | 141 (88.1%) |
| 55 to 64 Years | 15 (6.6%) | 212 (93.4%) |
| 65 to 74 Years | 235 (89.3%) | 113 (43.0%) |
| 75 Years and over | 54 (65.8%) | 58 (70.7%) |
| Total | 456 (27.8%) | 1,153 (70.2%) |
Disability Status by Sex by Age in Wolf Creek
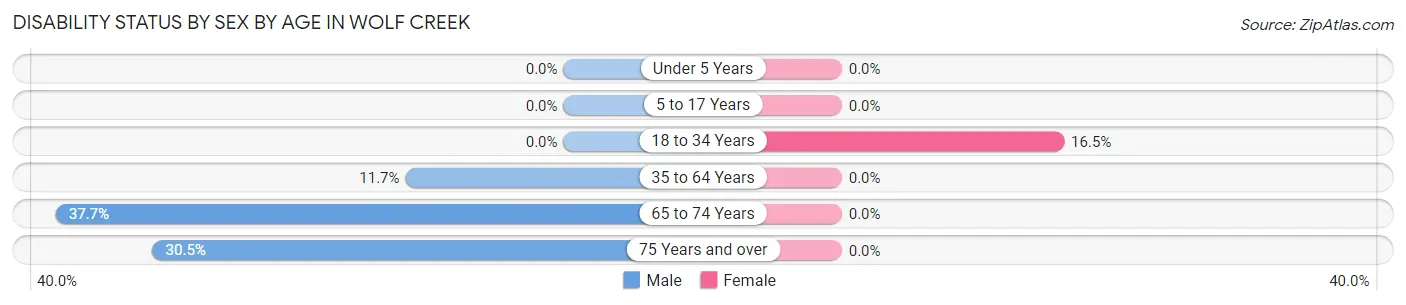
| Age Bracket | Male | Female |
| Under 5 Years | 0 (0.0%) | 0 (0.0%) |
| 5 to 17 Years | 0 (0.0%) | 0 (0.0%) |
| 18 to 34 Years | 0 (0.0%) | 18 (16.5%) |
| 35 to 64 Years | 38 (11.7%) | 0 (0.0%) |
| 65 to 74 Years | 52 (37.7%) | 0 (0.0%) |
| 75 Years and over | 25 (30.5%) | 0 (0.0%) |
Disability Class by Sex by Age in Wolf Creek
Disability Class: Hearing Difficulty
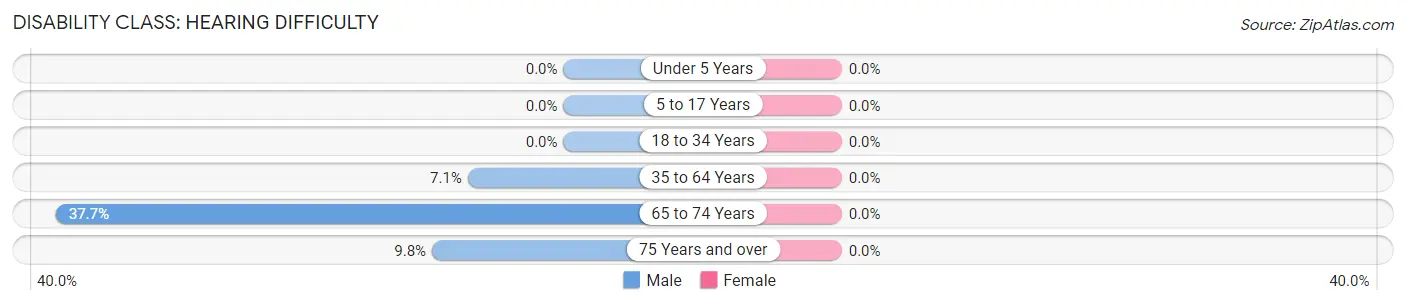
| Age Bracket | Male | Female |
| Under 5 Years | 0 (0.0%) | 0 (0.0%) |
| 5 to 17 Years | 0 (0.0%) | 0 (0.0%) |
| 18 to 34 Years | 0 (0.0%) | 0 (0.0%) |
| 35 to 64 Years | 23 (7.1%) | 0 (0.0%) |
| 65 to 74 Years | 52 (37.7%) | 0 (0.0%) |
| 75 Years and over | 8 (9.8%) | 0 (0.0%) |
Disability Class: Vision Difficulty
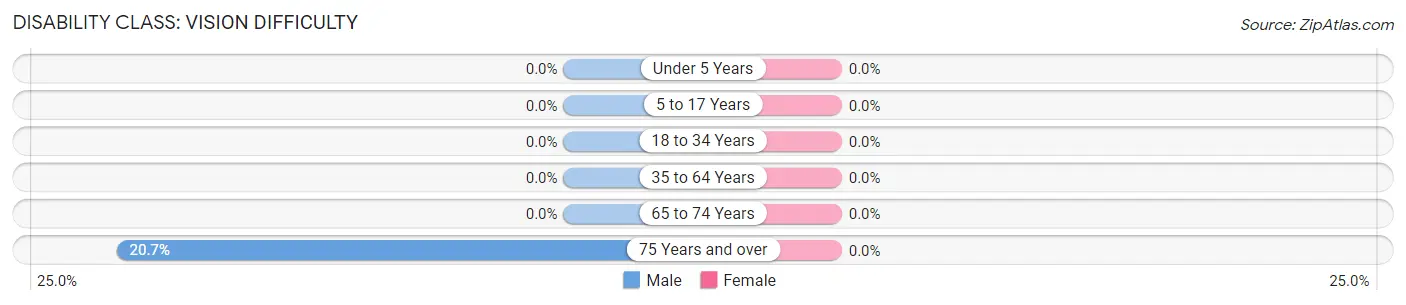
| Age Bracket | Male | Female |
| Under 5 Years | 0 (0.0%) | 0 (0.0%) |
| 5 to 17 Years | 0 (0.0%) | 0 (0.0%) |
| 18 to 34 Years | 0 (0.0%) | 0 (0.0%) |
| 35 to 64 Years | 0 (0.0%) | 0 (0.0%) |
| 65 to 74 Years | 0 (0.0%) | 0 (0.0%) |
| 75 Years and over | 17 (20.7%) | 0 (0.0%) |
Disability Class: Cognitive Difficulty
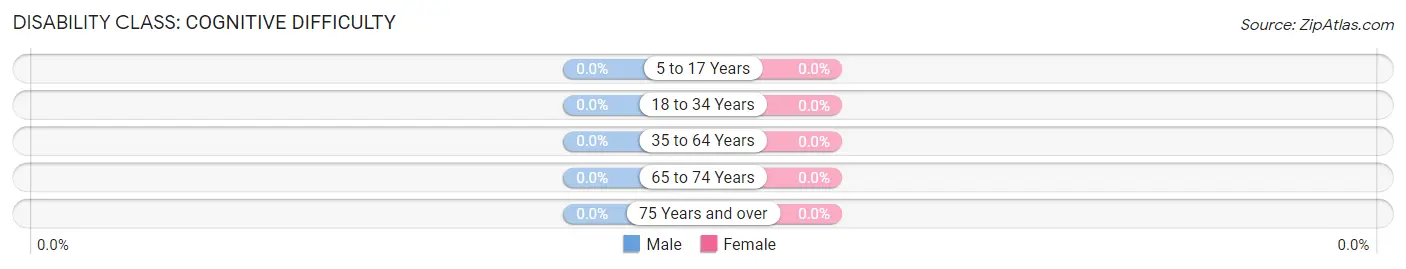
| Age Bracket | Male | Female |
| 5 to 17 Years | 0 (0.0%) | 0 (0.0%) |
| 18 to 34 Years | 0 (0.0%) | 0 (0.0%) |
| 35 to 64 Years | 0 (0.0%) | 0 (0.0%) |
| 65 to 74 Years | 0 (0.0%) | 0 (0.0%) |
| 75 Years and over | 0 (0.0%) | 0 (0.0%) |
Disability Class: Ambulatory Difficulty
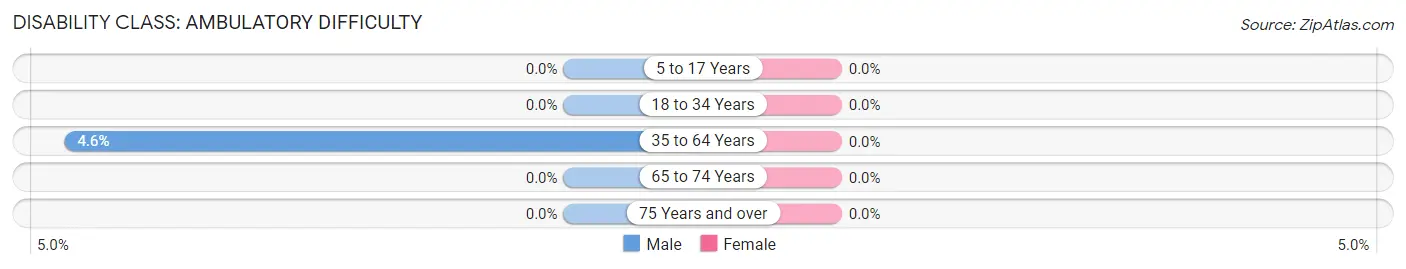
| Age Bracket | Male | Female |
| 5 to 17 Years | 0 (0.0%) | 0 (0.0%) |
| 18 to 34 Years | 0 (0.0%) | 0 (0.0%) |
| 35 to 64 Years | 15 (4.6%) | 0 (0.0%) |
| 65 to 74 Years | 0 (0.0%) | 0 (0.0%) |
| 75 Years and over | 0 (0.0%) | 0 (0.0%) |
Disability Class: Self-Care Difficulty
| Age Bracket | Male | Female |
| 5 to 17 Years | 0 (0.0%) | 0 (0.0%) |
| 18 to 34 Years | 0 (0.0%) | 0 (0.0%) |
| 35 to 64 Years | 0 (0.0%) | 0 (0.0%) |
| 65 to 74 Years | 0 (0.0%) | 0 (0.0%) |
| 75 Years and over | 0 (0.0%) | 0 (0.0%) |
Technology Access in Wolf Creek
Computing Device Access in Wolf Creek
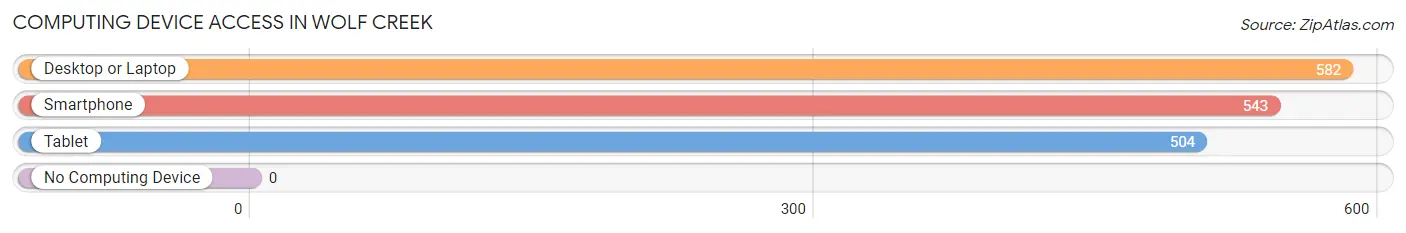
| Device Type | # Households | % Households |
| Desktop or Laptop | 582 | 100.0% |
| Smartphone | 543 | 93.3% |
| Tablet | 504 | 86.6% |
| No Computing Device | 0 | 0.0% |
| Total | 582 | 100.0% |
Internet Access in Wolf Creek
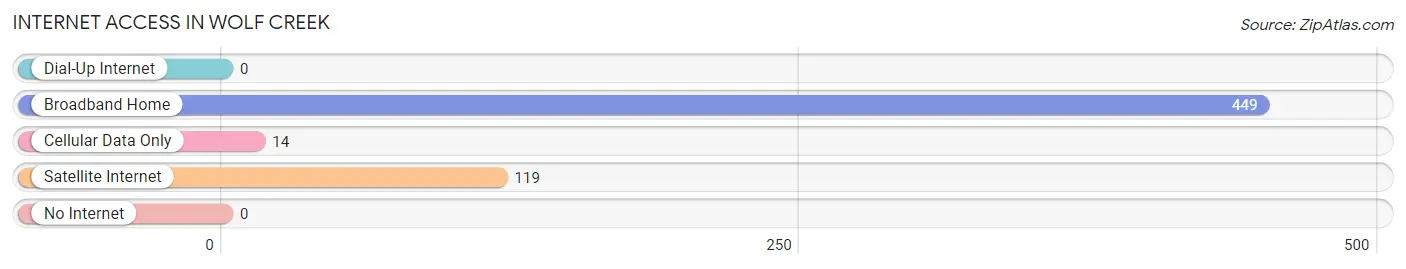
| Internet Type | # Households | % Households |
| Dial-Up Internet | 0 | 0.0% |
| Broadband Home | 449 | 77.1% |
| Cellular Data Only | 14 | 2.4% |
| Satellite Internet | 119 | 20.4% |
| No Internet | 0 | 0.0% |
| Total | 582 | 100.0% |
Wolf Creek Summary
Wolf Creek is a small unincorporated community located in the southeastern corner of Utah, in the United States. It is situated in the San Rafael Swell, a large geological formation in the Colorado Plateau. The community is located in Emery County, and is approximately 20 miles south of the city of Green River.
History
The area around Wolf Creek has been inhabited for thousands of years by Native American tribes, including the Ute, Paiute, and Navajo. The first European settlers arrived in the area in the late 1800s, and the town of Wolf Creek was established in the early 1900s. The town was named after a nearby creek, which was named for the large number of wolves that inhabited the area.
The town of Wolf Creek was originally a farming and ranching community, and the local economy was largely based on the production of hay, cattle, and sheep. In the early 1900s, the town also had a small coal mine, which provided employment for many of the local residents.
Geography
Wolf Creek is located in the San Rafael Swell, a large geological formation in the Colorado Plateau. The town is situated at an elevation of 5,400 feet, and is surrounded by a variety of terrain, including desert, canyons, and mesas. The area is known for its spectacular views of the surrounding landscape, and is a popular destination for hikers, campers, and other outdoor enthusiasts.
The climate in Wolf Creek is semi-arid, with hot summers and cold winters. The average annual temperature is around 50 degrees Fahrenheit, and the average annual precipitation is around 8 inches.
Economy
The economy of Wolf Creek is largely based on agriculture and ranching. The town is home to several farms and ranches, which produce hay, cattle, and sheep. The town also has a small coal mine, which provides employment for some of the local residents.
In addition to agriculture and mining, Wolf Creek is also home to a variety of small businesses, including restaurants, stores, and other services. The town is also a popular destination for tourists, who come to enjoy the area’s natural beauty and outdoor activities.
Demographics
As of the 2010 census, the population of Wolf Creek was 545. The racial makeup of the town was 97.3% White, 0.2% African American, 0.2% Native American, 0.2% Asian, 0.2% from other races, and 1.9% from two or more races. The median household income was $37,500, and the median family income was $41,250.
Wolf Creek is a small, rural community with a close-knit population. The town is home to a variety of churches, and the local school district serves the educational needs of the community. The town is also home to a variety of recreational activities, including hiking, camping, fishing, and hunting.
Common Questions
What is Per Capita Income in Wolf Creek?
Per Capita income in Wolf Creek is $65,508.
What is the Median Family Income in Wolf Creek?
Median Family Income in Wolf Creek is $180,750.
What is the Median Household income in Wolf Creek?
Median Household Income in Wolf Creek is $137,813.
What is Income or Wage Gap in Wolf Creek?
Income or Wage Gap in Wolf Creek is 36.8%.
Women in Wolf Creek earn 63.2 cents for every dollar earned by a man.
What is Inequality or Gini Index in Wolf Creek?
Inequality or Gini Index in Wolf Creek is 0.39.
What is the Total Population of Wolf Creek?
Total Population of Wolf Creek is 1,642.
What is the Total Male Population of Wolf Creek?
Total Male Population of Wolf Creek is 990.
What is the Total Female Population of Wolf Creek?
Total Female Population of Wolf Creek is 652.
What is the Ratio of Males per 100 Females in Wolf Creek?
There are 151.84 Males per 100 Females in Wolf Creek.
What is the Ratio of Females per 100 Males in Wolf Creek?
There are 65.86 Females per 100 Males in Wolf Creek.
What is the Median Population Age in Wolf Creek?
Median Population Age in Wolf Creek is 41.8 Years.
What is the Average Family Size in Wolf Creek
Average Family Size in Wolf Creek is 3.3 People.
What is the Average Household Size in Wolf Creek
Average Household Size in Wolf Creek is 2.8 People.
How Large is the Labor Force in Wolf Creek?
There are 838 People in the Labor Forcein in Wolf Creek.
What is the Percentage of People in the Labor Force in Wolf Creek?
65.5% of People are in the Labor Force in Wolf Creek.