Manti, UT Map & Demographics
Manti Map
Manti Overview
$24,148
PER CAPITA INCOME
$65,852
AVG FAMILY INCOME
$53,750
AVG HOUSEHOLD INCOME
47.8%
WAGE / INCOME GAP [ % ]
52.2¢/ $1
WAGE / INCOME GAP [ $ ]
0.41
INEQUALITY / GINI INDEX
3,474
TOTAL POPULATION
1,879
MALE POPULATION
1,595
FEMALE POPULATION
117.81
MALES / 100 FEMALES
84.89
FEMALES / 100 MALES
36.2
MEDIAN AGE
3.6
AVG FAMILY SIZE
3.1
AVG HOUSEHOLD SIZE
1,453
LABOR FORCE [ PEOPLE ]
55.6%
PERCENT IN LABOR FORCE
1.7%
UNEMPLOYMENT RATE
Manti Zip Codes
Manti Area Codes
Income in Manti
Income Overview in Manti
Per Capita Income in Manti is $24,148, while median incomes of families and households are $65,852 and $53,750 respectively.
| Characteristic | Number | Measure |
| Per Capita Income | 3,474 | $24,148 |
| Median Family Income | 817 | $65,852 |
| Mean Family Income | 817 | $80,890 |
| Median Household Income | 1,054 | $53,750 |
| Mean Household Income | 1,054 | $77,020 |
| Income Deficit | 817 | $0 |
| Wage / Income Gap (%) | 3,474 | 47.76% |
| Wage / Income Gap ($) | 3,474 | 52.24¢ per $1 |
| Gini / Inequality Index | 3,474 | 0.41 |
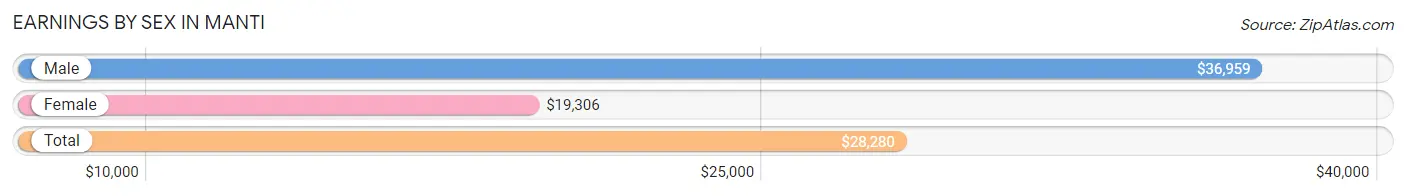
Earnings by Sex in Manti
Average Earnings in Manti are $28,280, $36,959 for men and $19,306 for women, a difference of 47.8%.
| Sex | Number | Average Earnings |
| Male | 962 (58.4%) | $36,959 |
| Female | 685 (41.6%) | $19,306 |
| Total | 1,647 (100.0%) | $28,280 |
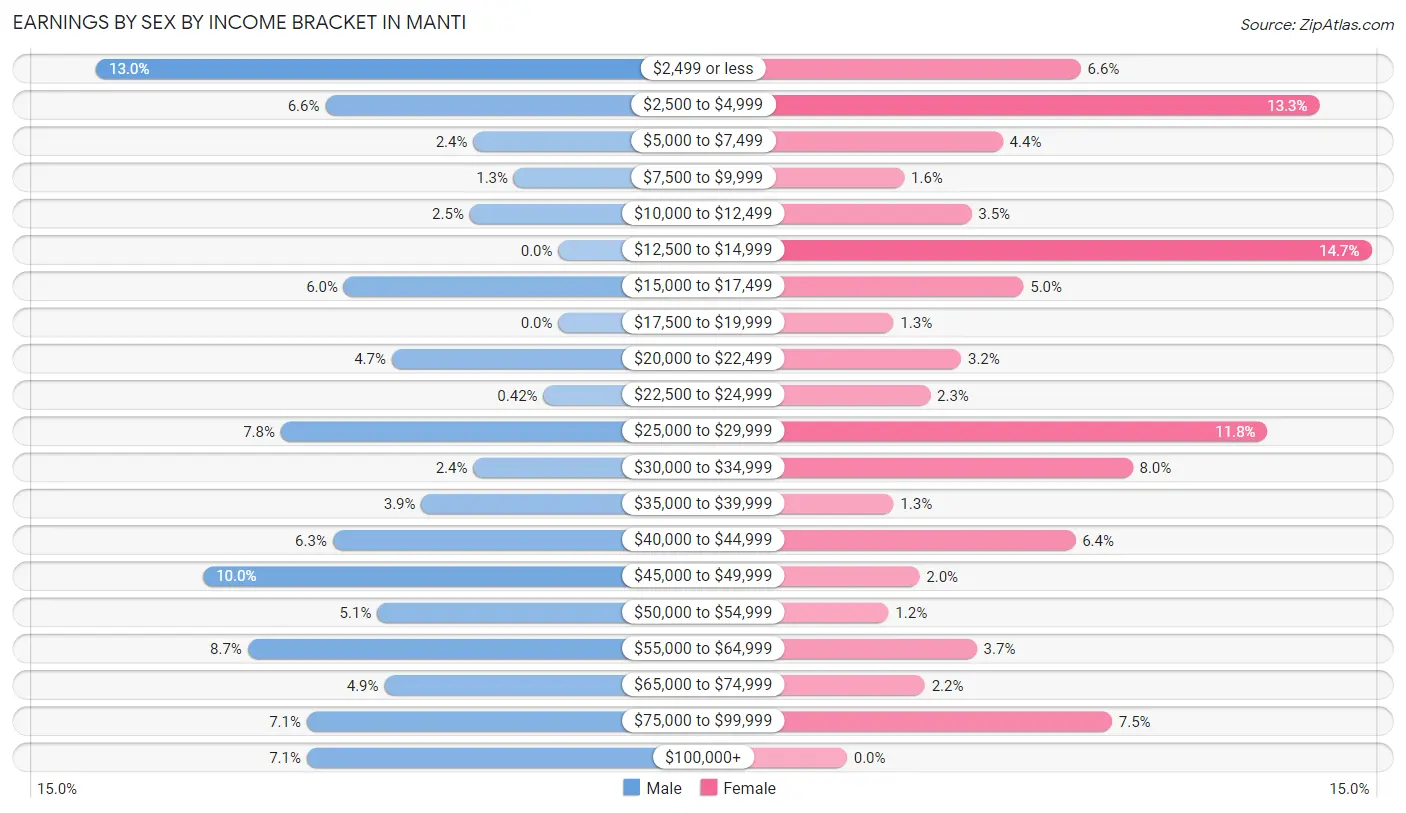
Earnings by Sex by Income Bracket in Manti
The most common earnings brackets in Manti are $2,499 or less for men (125 | 13.0%) and $12,500 to $14,999 for women (101 | 14.7%).
| Income | Male | Female |
| $2,499 or less | 125 (13.0%) | 45 (6.6%) |
| $2,500 to $4,999 | 63 (6.6%) | 91 (13.3%) |
| $5,000 to $7,499 | 23 (2.4%) | 30 (4.4%) |
| $7,500 to $9,999 | 12 (1.3%) | 11 (1.6%) |
| $10,000 to $12,499 | 24 (2.5%) | 24 (3.5%) |
| $12,500 to $14,999 | 0 (0.0%) | 101 (14.7%) |
| $15,000 to $17,499 | 58 (6.0%) | 34 (5.0%) |
| $17,500 to $19,999 | 0 (0.0%) | 9 (1.3%) |
| $20,000 to $22,499 | 45 (4.7%) | 22 (3.2%) |
| $22,500 to $24,999 | 4 (0.4%) | 16 (2.3%) |
| $25,000 to $29,999 | 75 (7.8%) | 81 (11.8%) |
| $30,000 to $34,999 | 23 (2.4%) | 55 (8.0%) |
| $35,000 to $39,999 | 37 (3.8%) | 9 (1.3%) |
| $40,000 to $44,999 | 61 (6.3%) | 44 (6.4%) |
| $45,000 to $49,999 | 96 (10.0%) | 14 (2.0%) |
| $50,000 to $54,999 | 49 (5.1%) | 8 (1.2%) |
| $55,000 to $64,999 | 84 (8.7%) | 25 (3.6%) |
| $65,000 to $74,999 | 47 (4.9%) | 15 (2.2%) |
| $75,000 to $99,999 | 68 (7.1%) | 51 (7.4%) |
| $100,000+ | 68 (7.1%) | 0 (0.0%) |
| Total | 962 (100.0%) | 685 (100.0%) |
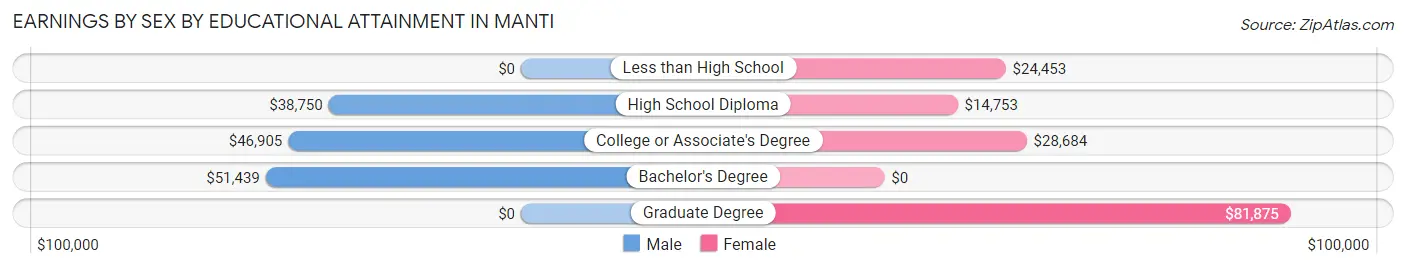
Earnings by Sex by Educational Attainment in Manti
Average earnings in Manti are $48,125 for men and $25,455 for women, a difference of 47.1%. Men with an educational attainment of bachelor's degree enjoy the highest average annual earnings of $51,439, while those with high school diploma education earn the least with $38,750. Women with an educational attainment of graduate degree earn the most with the average annual earnings of $81,875, while those with high school diploma education have the smallest earnings of $14,753.
| Educational Attainment | Male Income | Female Income |
| Less than High School | - | - |
| High School Diploma | $38,750 | $14,753 |
| College or Associate's Degree | $46,905 | $28,684 |
| Bachelor's Degree | $51,439 | $0 |
| Graduate Degree | - | - |
| Total | $48,125 | $25,455 |
Family Income in Manti
Family Income Brackets in Manti
According to the Manti family income data, there are 220 families falling into the $35,000 to $49,999 income range, which is the most common income bracket and makes up 26.9% of all families. Conversely, the $10,000 to $14,999 income bracket is the least frequent group with only 4 families (0.5%) belonging to this category.

| Income Bracket | # Families | % Families |
| Less than $10,000 | 20 | 2.4% |
| $10,000 to $14,999 | 4 | 0.5% |
| $15,000 to $24,999 | 15 | 1.8% |
| $25,000 to $34,999 | 61 | 7.5% |
| $35,000 to $49,999 | 220 | 26.9% |
| $50,000 to $74,999 | 156 | 19.1% |
| $75,000 to $99,999 | 106 | 13.0% |
| $100,000 to $149,999 | 164 | 20.1% |
| $150,000 to $199,999 | 58 | 7.1% |
| $200,000+ | 13 | 1.6% |
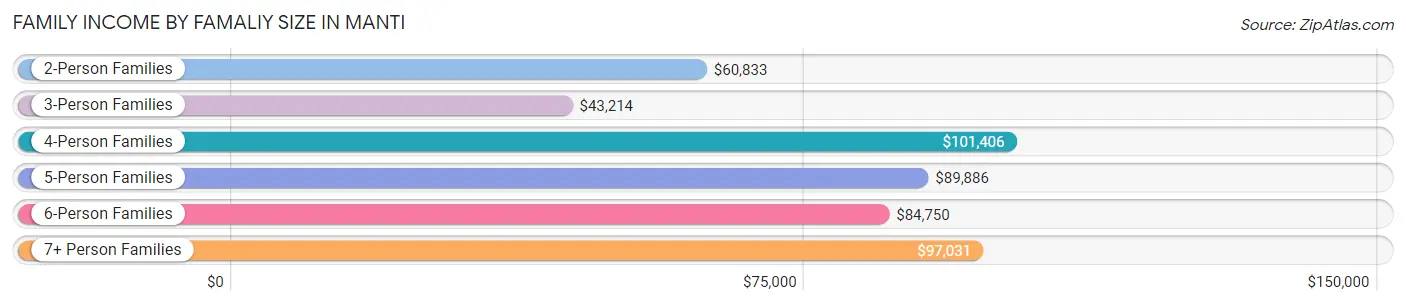
Family Income by Famaliy Size in Manti
4-person families (151 | 18.5%) account for the highest median family income in Manti with $101,406 per family, while 2-person families (294 | 36.0%) have the highest median income of $30,416 per family member.
| Income Bracket | # Families | Median Income |
| 2-Person Families | 294 (36.0%) | $60,833 |
| 3-Person Families | 184 (22.5%) | $43,214 |
| 4-Person Families | 151 (18.5%) | $101,406 |
| 5-Person Families | 79 (9.7%) | $89,886 |
| 6-Person Families | 72 (8.8%) | $84,750 |
| 7+ Person Families | 37 (4.5%) | $97,031 |
| Total | 817 (100.0%) | $65,852 |
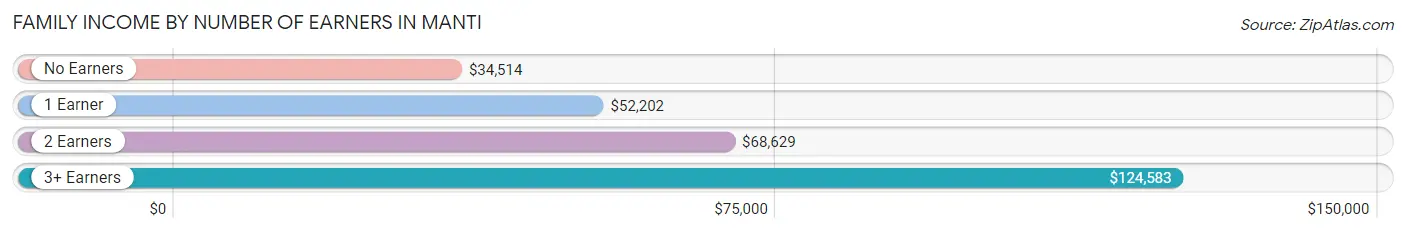
Family Income by Number of Earners in Manti
The median family income in Manti is $65,852, with families comprising 3+ earners (135) having the highest median family income of $124,583, while families with no earners (117) have the lowest median family income of $34,514, accounting for 16.5% and 14.3% of families, respectively.
| Number of Earners | # Families | Median Income |
| No Earners | 117 (14.3%) | $34,514 |
| 1 Earner | 189 (23.1%) | $52,202 |
| 2 Earners | 376 (46.0%) | $68,629 |
| 3+ Earners | 135 (16.5%) | $124,583 |
| Total | 817 (100.0%) | $65,852 |
Household Income in Manti
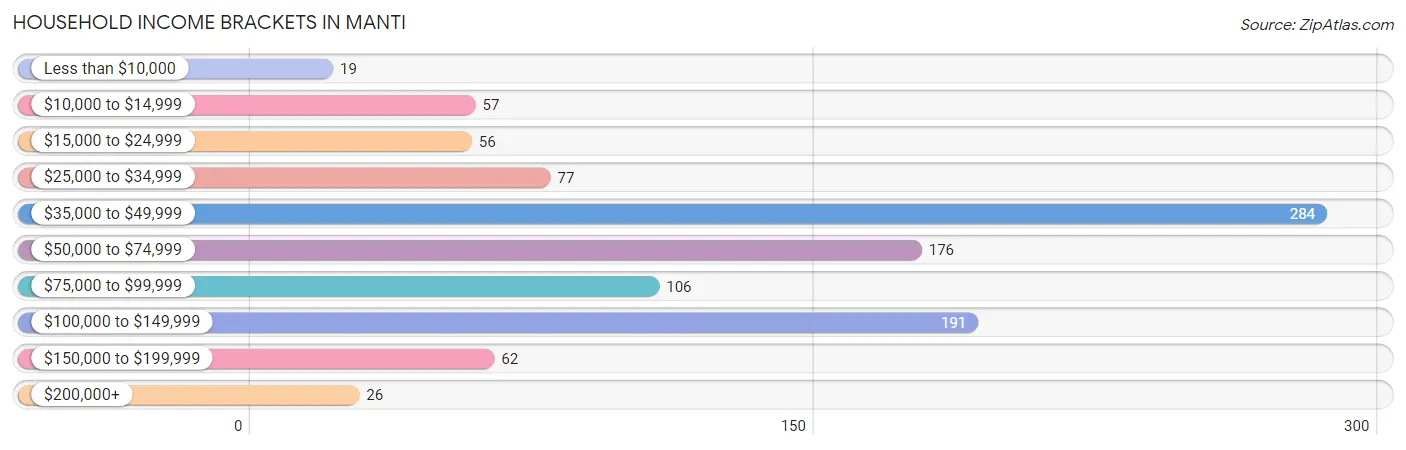
Household Income Brackets in Manti
With 284 households falling in the category, the $35,000 to $49,999 income range is the most frequent in Manti, accounting for 26.9% of all households. In contrast, only 19 households (1.8%) fall into the less than $10,000 income bracket, making it the least populous group.
| Income Bracket | # Households | % Households |
| Less than $10,000 | 19 | 1.8% |
| $10,000 to $14,999 | 57 | 5.4% |
| $15,000 to $24,999 | 56 | 5.3% |
| $25,000 to $34,999 | 77 | 7.3% |
| $35,000 to $49,999 | 284 | 26.9% |
| $50,000 to $74,999 | 176 | 16.7% |
| $75,000 to $99,999 | 106 | 10.1% |
| $100,000 to $149,999 | 191 | 18.1% |
| $150,000 to $199,999 | 62 | 5.9% |
| $200,000+ | 26 | 2.5% |
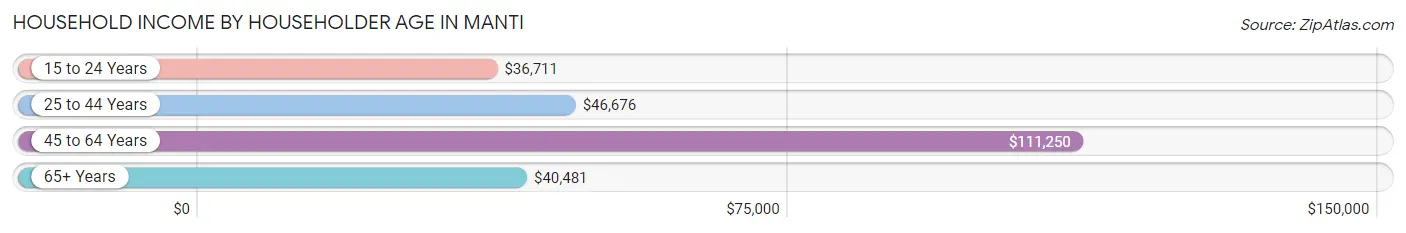
Household Income by Householder Age in Manti
The median household income in Manti is $53,750, with the highest median household income of $111,250 found in the 45 to 64 years age bracket for the primary householder. A total of 342 households (32.5%) fall into this category. Meanwhile, the 15 to 24 years age bracket for the primary householder has the lowest median household income of $36,711, with 46 households (4.4%) in this group.
| Income Bracket | # Households | Median Income |
| 15 to 24 Years | 46 (4.4%) | $36,711 |
| 25 to 44 Years | 323 (30.6%) | $46,676 |
| 45 to 64 Years | 342 (32.5%) | $111,250 |
| 65+ Years | 343 (32.5%) | $40,481 |
| Total | 1,054 (100.0%) | $53,750 |
Poverty in Manti
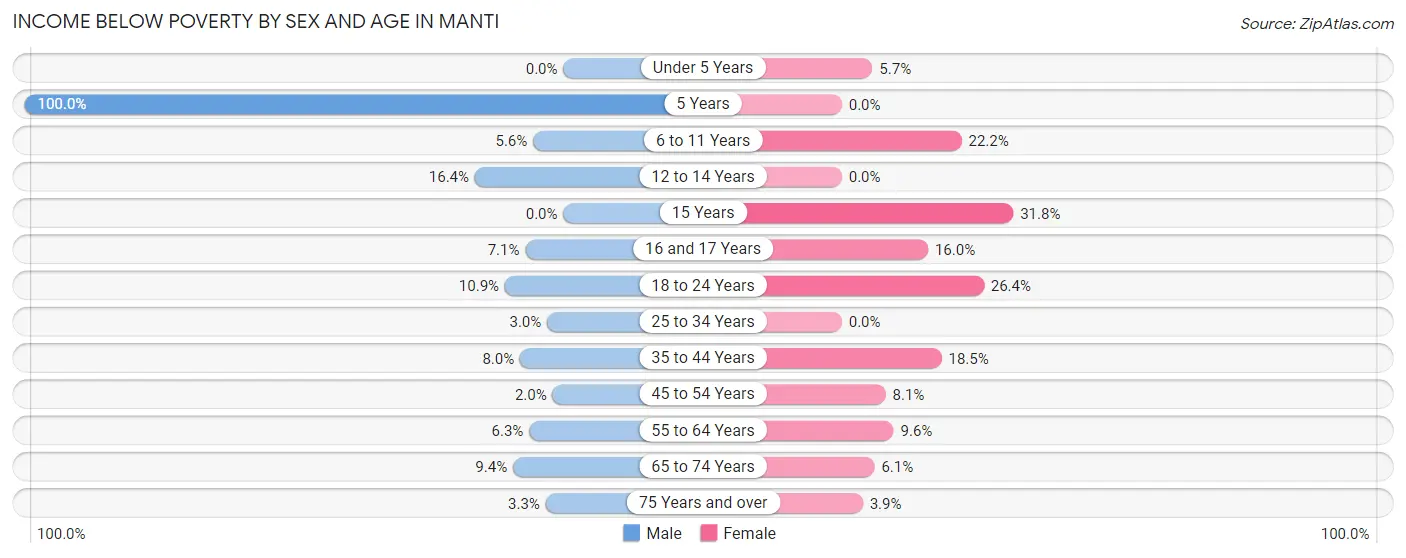
Income Below Poverty by Sex and Age in Manti
With 6.2% poverty level for males and 10.5% for females among the residents of Manti, 5 year old males and 15 year old females are the most vulnerable to poverty, with 2 males (100.0%) and 7 females (31.8%) in their respective age groups living below the poverty level.
| Age Bracket | Male | Female |
| Under 5 Years | 0 (0.0%) | 5 (5.7%) |
| 5 Years | 2 (100.0%) | 0 (0.0%) |
| 6 to 11 Years | 11 (5.6%) | 34 (22.2%) |
| 12 to 14 Years | 11 (16.4%) | 0 (0.0%) |
| 15 Years | 0 (0.0%) | 7 (31.8%) |
| 16 and 17 Years | 6 (7.1%) | 4 (16.0%) |
| 18 to 24 Years | 23 (10.8%) | 29 (26.4%) |
| 25 to 34 Years | 5 (3.0%) | 0 (0.0%) |
| 35 to 44 Years | 16 (8.0%) | 40 (18.5%) |
| 45 to 54 Years | 4 (2.0%) | 10 (8.1%) |
| 55 to 64 Years | 9 (6.3%) | 20 (9.6%) |
| 65 to 74 Years | 13 (9.3%) | 14 (6.1%) |
| 75 Years and over | 4 (3.3%) | 4 (3.9%) |
| Total | 104 (6.2%) | 167 (10.5%) |
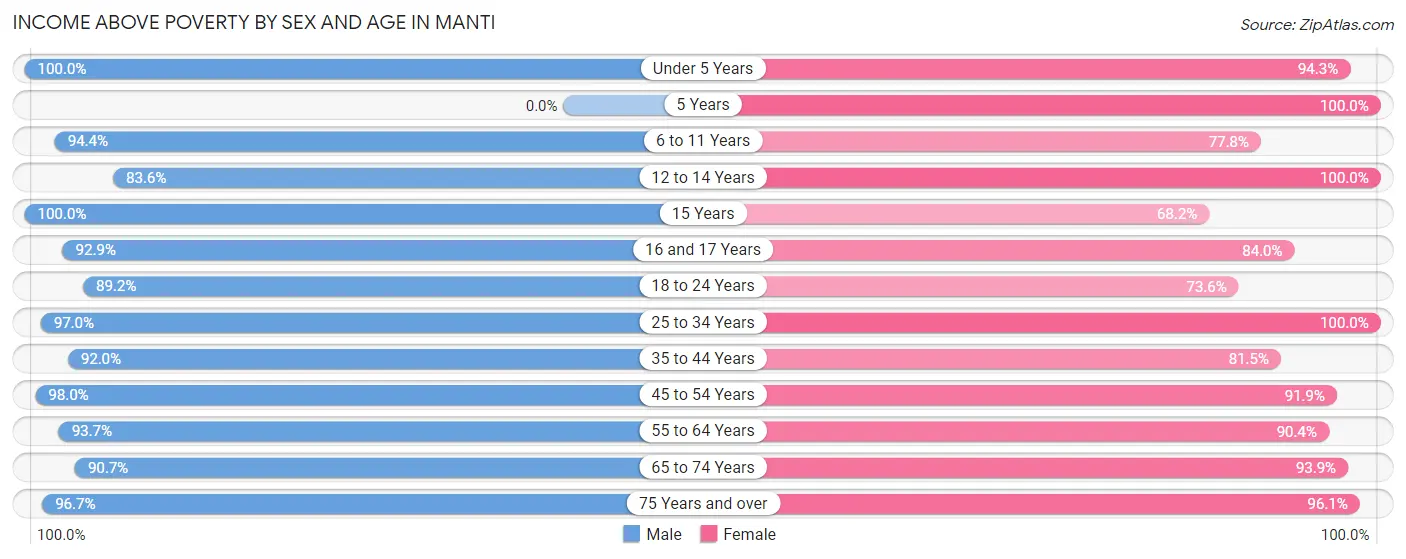
Income Above Poverty by Sex and Age in Manti
According to the poverty statistics in Manti, males aged under 5 years and females aged 5 years are the age groups that are most secure financially, with 100.0% of males and 100.0% of females in these age groups living above the poverty line.
| Age Bracket | Male | Female |
| Under 5 Years | 70 (100.0%) | 83 (94.3%) |
| 5 Years | 0 (0.0%) | 19 (100.0%) |
| 6 to 11 Years | 185 (94.4%) | 119 (77.8%) |
| 12 to 14 Years | 56 (83.6%) | 101 (100.0%) |
| 15 Years | 66 (100.0%) | 15 (68.2%) |
| 16 and 17 Years | 79 (92.9%) | 21 (84.0%) |
| 18 to 24 Years | 189 (89.1%) | 81 (73.6%) |
| 25 to 34 Years | 161 (97.0%) | 189 (100.0%) |
| 35 to 44 Years | 183 (92.0%) | 176 (81.5%) |
| 45 to 54 Years | 195 (98.0%) | 113 (91.9%) |
| 55 to 64 Years | 133 (93.7%) | 188 (90.4%) |
| 65 to 74 Years | 126 (90.6%) | 217 (93.9%) |
| 75 Years and over | 118 (96.7%) | 99 (96.1%) |
| Total | 1,561 (93.8%) | 1,421 (89.5%) |
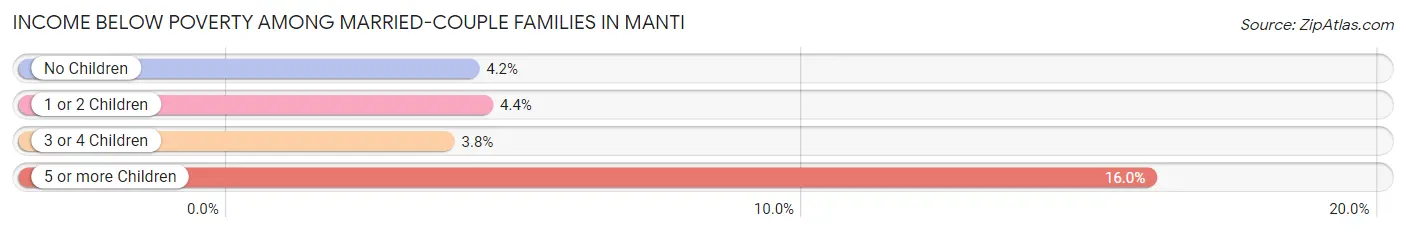
Income Below Poverty Among Married-Couple Families in Manti
The poverty statistics for married-couple families in Manti show that 4.6% or 33 of the total 712 families live below the poverty line. Families with 5 or more children have the highest poverty rate of 16.0%, comprising of 4 families. On the other hand, families with 3 or 4 children have the lowest poverty rate of 3.8%, which includes 4 families.
| Children | Above Poverty | Below Poverty |
| No Children | 319 (95.8%) | 14 (4.2%) |
| 1 or 2 Children | 237 (95.6%) | 11 (4.4%) |
| 3 or 4 Children | 102 (96.2%) | 4 (3.8%) |
| 5 or more Children | 21 (84.0%) | 4 (16.0%) |
| Total | 679 (95.4%) | 33 (4.6%) |
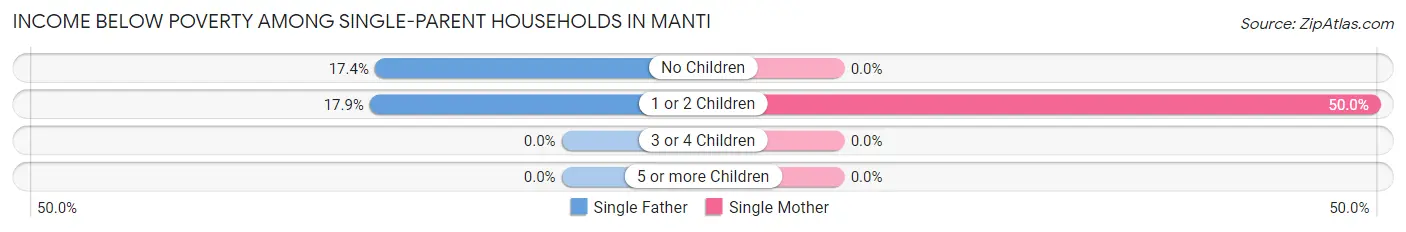
Income Below Poverty Among Single-Parent Households in Manti
According to the poverty data in Manti, 14.5% or 9 single-father households and 25.6% or 11 single-mother households are living below the poverty line. Among single-father households, those with 1 or 2 children have the highest poverty rate, with 5 households (17.9%) experiencing poverty. Likewise, among single-mother households, those with 1 or 2 children have the highest poverty rate, with 11 households (50.0%) falling below the poverty line.
| Children | Single Father | Single Mother |
| No Children | 4 (17.4%) | 0 (0.0%) |
| 1 or 2 Children | 5 (17.9%) | 11 (50.0%) |
| 3 or 4 Children | 0 (0.0%) | 0 (0.0%) |
| 5 or more Children | 0 (0.0%) | 0 (0.0%) |
| Total | 9 (14.5%) | 11 (25.6%) |
Income Below Poverty Among Married-Couple vs Single-Parent Households in Manti
The poverty data for Manti shows that 33 of the married-couple family households (4.6%) and 20 of the single-parent households (19.1%) are living below the poverty level. Within the married-couple family households, those with 5 or more children have the highest poverty rate, with 4 households (16.0%) falling below the poverty line. Among the single-parent households, those with 1 or 2 children have the highest poverty rate, with 16 household (32.0%) living below poverty.
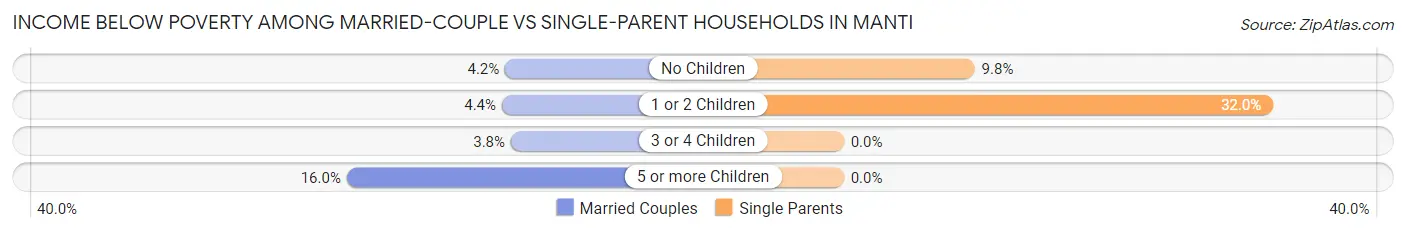
| Children | Married-Couple Families | Single-Parent Households |
| No Children | 14 (4.2%) | 4 (9.8%) |
| 1 or 2 Children | 11 (4.4%) | 16 (32.0%) |
| 3 or 4 Children | 4 (3.8%) | 0 (0.0%) |
| 5 or more Children | 4 (16.0%) | 0 (0.0%) |
| Total | 33 (4.6%) | 20 (19.1%) |
Race in Manti
The most populous races in Manti are White / Caucasian (3,049 | 87.8%), Hispanic or Latino (303 | 8.7%), and Some other Race (146 | 4.2%).
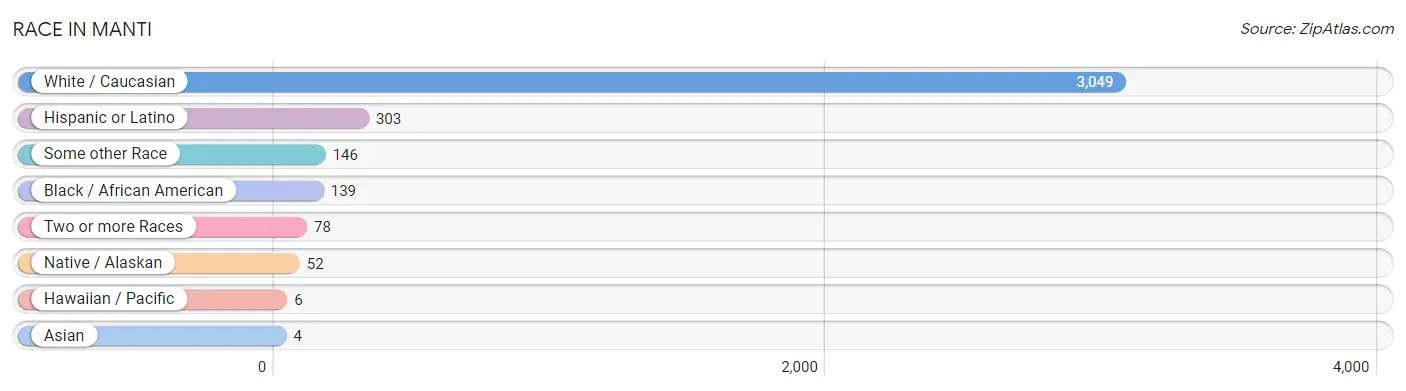
| Race | # Population | % Population |
| Asian | 4 | 0.1% |
| Black / African American | 139 | 4.0% |
| Hawaiian / Pacific | 6 | 0.2% |
| Hispanic or Latino | 303 | 8.7% |
| Native / Alaskan | 52 | 1.5% |
| White / Caucasian | 3,049 | 87.8% |
| Two or more Races | 78 | 2.2% |
| Some other Race | 146 | 4.2% |
| Total | 3,474 | 100.0% |
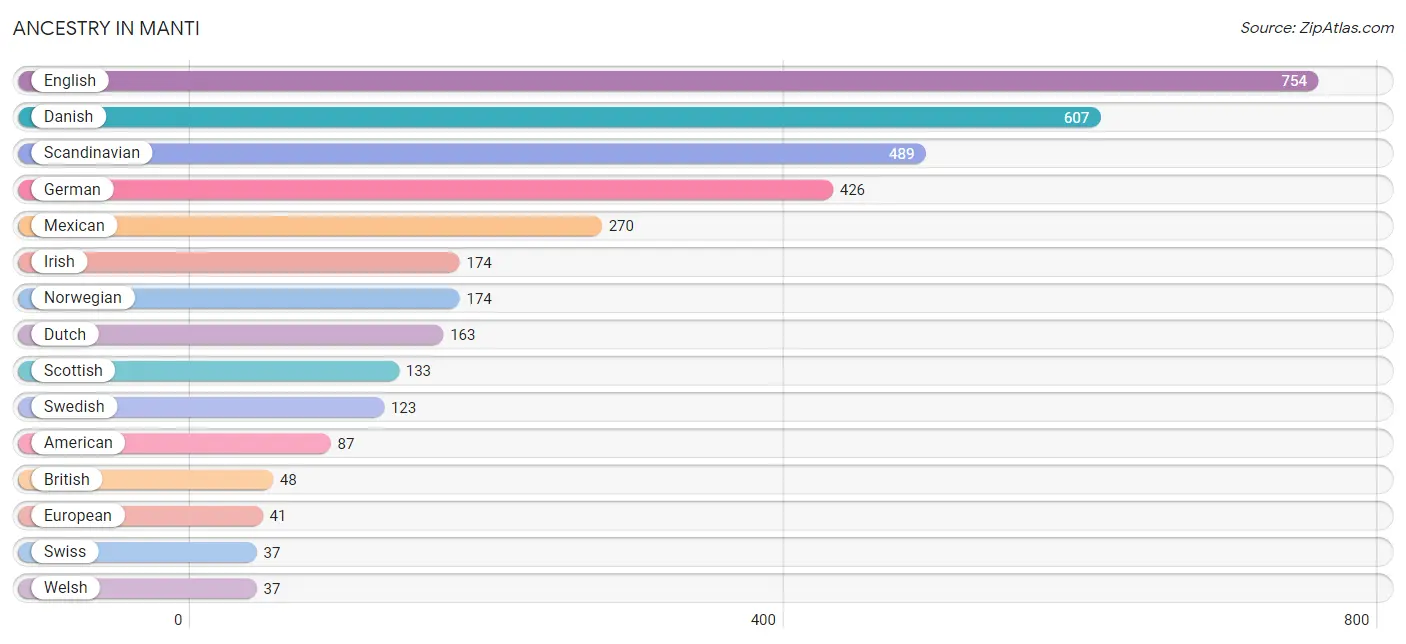
Ancestry in Manti
The most populous ancestries reported in Manti are English (754 | 21.7%), Danish (607 | 17.5%), Scandinavian (489 | 14.1%), German (426 | 12.3%), and Mexican (270 | 7.8%), together accounting for 73.3% of all Manti residents.
| Ancestry | # Population | % Population |
| Alaska Native | 24 | 0.7% |
| American | 87 | 2.5% |
| Austrian | 4 | 0.1% |
| Basque | 16 | 0.5% |
| Bhutanese | 9 | 0.3% |
| British | 48 | 1.4% |
| Canadian | 8 | 0.2% |
| Central American | 24 | 0.7% |
| Cherokee | 14 | 0.4% |
| Costa Rican | 6 | 0.2% |
| Czech | 15 | 0.4% |
| Danish | 607 | 17.5% |
| Dutch | 163 | 4.7% |
| English | 754 | 21.7% |
| European | 41 | 1.2% |
| French | 22 | 0.6% |
| German | 426 | 12.3% |
| Greek | 13 | 0.4% |
| Guatemalan | 7 | 0.2% |
| Irish | 174 | 5.0% |
| Israeli | 4 | 0.1% |
| Italian | 5 | 0.1% |
| Mexican | 270 | 7.8% |
| Mexican American Indian | 25 | 0.7% |
| Native Hawaiian | 11 | 0.3% |
| Navajo | 21 | 0.6% |
| Northern European | 12 | 0.4% |
| Norwegian | 174 | 5.0% |
| Paraguayan | 5 | 0.1% |
| Polish | 9 | 0.3% |
| Puerto Rican | 4 | 0.1% |
| Russian | 4 | 0.1% |
| Salvadoran | 11 | 0.3% |
| Scandinavian | 489 | 14.1% |
| Scottish | 133 | 3.8% |
| South American | 5 | 0.1% |
| Swedish | 123 | 3.5% |
| Swiss | 37 | 1.1% |
| Ute | 6 | 0.2% |
| Welsh | 37 | 1.1% | View All 40 Rows |
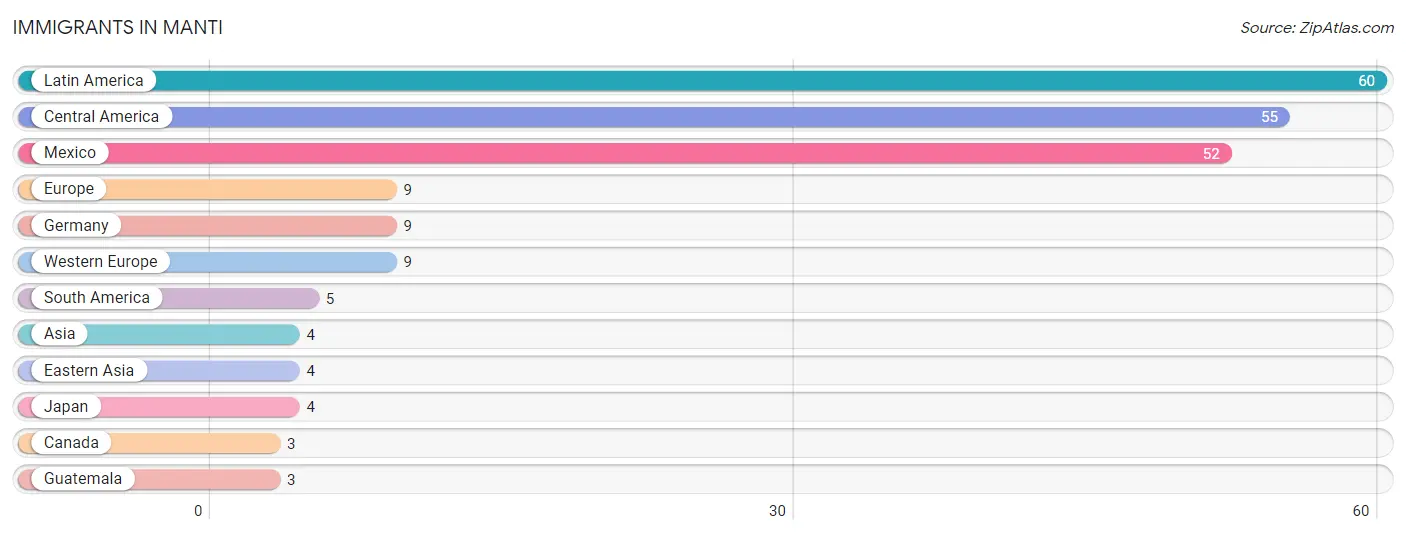
Immigrants in Manti
The most numerous immigrant groups reported in Manti came from Latin America (60 | 1.7%), Central America (55 | 1.6%), Mexico (52 | 1.5%), Europe (9 | 0.3%), and Germany (9 | 0.3%), together accounting for 5.3% of all Manti residents.
| Immigration Origin | # Population | % Population |
| Asia | 4 | 0.1% |
| Canada | 3 | 0.1% |
| Central America | 55 | 1.6% |
| Eastern Asia | 4 | 0.1% |
| Europe | 9 | 0.3% |
| Germany | 9 | 0.3% |
| Guatemala | 3 | 0.1% |
| Japan | 4 | 0.1% |
| Latin America | 60 | 1.7% |
| Mexico | 52 | 1.5% |
| South America | 5 | 0.1% |
| Western Europe | 9 | 0.3% | View All 12 Rows |
Sex and Age in Manti
Sex and Age in Manti
The most populous age groups in Manti are 15 to 19 Years (263 | 14.0%) for men and 10 to 14 Years (159 | 10.0%) for women.
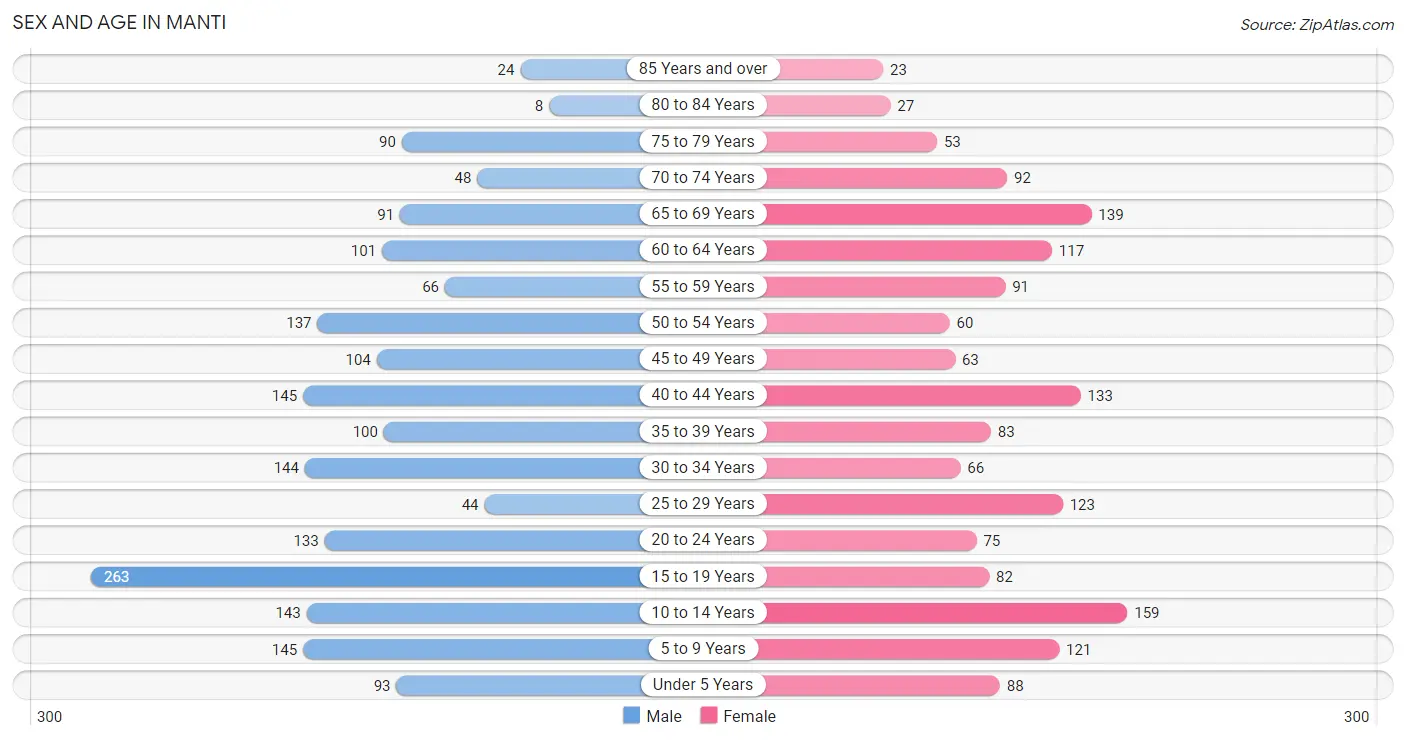
| Age Bracket | Male | Female |
| Under 5 Years | 93 (5.0%) | 88 (5.5%) |
| 5 to 9 Years | 145 (7.7%) | 121 (7.6%) |
| 10 to 14 Years | 143 (7.6%) | 159 (10.0%) |
| 15 to 19 Years | 263 (14.0%) | 82 (5.1%) |
| 20 to 24 Years | 133 (7.1%) | 75 (4.7%) |
| 25 to 29 Years | 44 (2.3%) | 123 (7.7%) |
| 30 to 34 Years | 144 (7.7%) | 66 (4.1%) |
| 35 to 39 Years | 100 (5.3%) | 83 (5.2%) |
| 40 to 44 Years | 145 (7.7%) | 133 (8.3%) |
| 45 to 49 Years | 104 (5.5%) | 63 (4.0%) |
| 50 to 54 Years | 137 (7.3%) | 60 (3.8%) |
| 55 to 59 Years | 66 (3.5%) | 91 (5.7%) |
| 60 to 64 Years | 101 (5.4%) | 117 (7.3%) |
| 65 to 69 Years | 91 (4.8%) | 139 (8.7%) |
| 70 to 74 Years | 48 (2.5%) | 92 (5.8%) |
| 75 to 79 Years | 90 (4.8%) | 53 (3.3%) |
| 80 to 84 Years | 8 (0.4%) | 27 (1.7%) |
| 85 Years and over | 24 (1.3%) | 23 (1.4%) |
| Total | 1,879 (100.0%) | 1,595 (100.0%) |
Families and Households in Manti
Median Family Size in Manti
The median family size in Manti is 3.59 persons per family, with married-couple families (712 | 87.2%) accounting for the largest median family size of 3.7 persons per family. On the other hand, single female/mother families (43 | 5.3%) represent the smallest median family size with 2.33 persons per family.
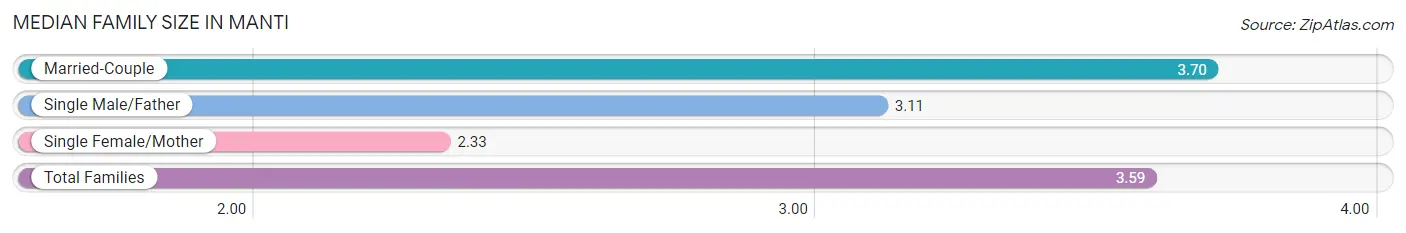
| Family Type | # Families | Family Size |
| Married-Couple | 712 (87.2%) | 3.70 |
| Single Male/Father | 62 (7.6%) | 3.11 |
| Single Female/Mother | 43 (5.3%) | 2.33 |
| Total Families | 817 (100.0%) | 3.59 |
Median Household Size in Manti
The median household size in Manti is 3.14 persons per household, with single male/father households (62 | 5.9%) accounting for the largest median household size of 3.85 persons per household. non-family households (237 | 22.5%) represent the smallest median household size with 1.17 persons per household.
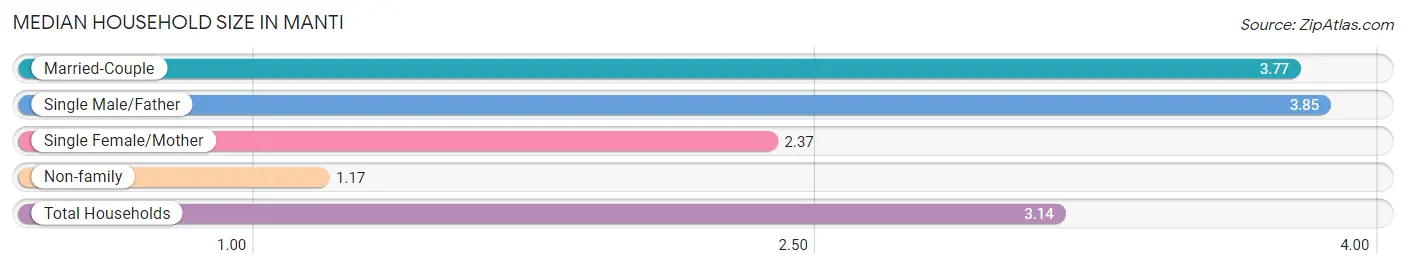
| Household Type | # Households | Household Size |
| Married-Couple | 712 (67.5%) | 3.77 |
| Single Male/Father | 62 (5.9%) | 3.85 |
| Single Female/Mother | 43 (4.1%) | 2.37 |
| Non-family | 237 (22.5%) | 1.17 |
| Total Households | 1,054 (100.0%) | 3.14 |
Household Size by Marriage Status in Manti
Out of a total of 1,054 households in Manti, 817 (77.5%) are family households, while 237 (22.5%) are nonfamily households. The most numerous type of family households are 2-person households, comprising 284, and the most common type of nonfamily households are 1-person households, comprising 206.
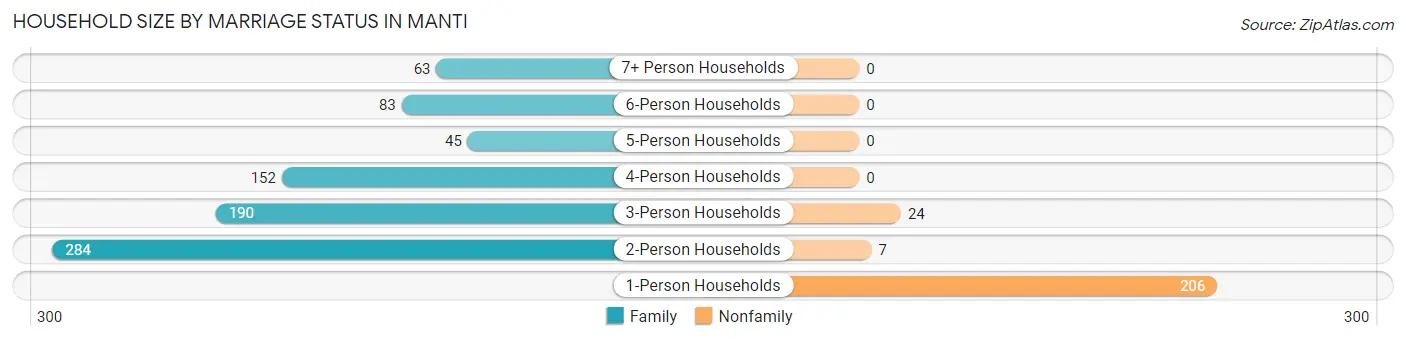
| Household Size | Family Households | Nonfamily Households |
| 1-Person Households | - | 206 (19.5%) |
| 2-Person Households | 284 (26.9%) | 7 (0.7%) |
| 3-Person Households | 190 (18.0%) | 24 (2.3%) |
| 4-Person Households | 152 (14.4%) | 0 (0.0%) |
| 5-Person Households | 45 (4.3%) | 0 (0.0%) |
| 6-Person Households | 83 (7.9%) | 0 (0.0%) |
| 7+ Person Households | 63 (6.0%) | 0 (0.0%) |
| Total | 817 (77.5%) | 237 (22.5%) |
Female Fertility in Manti
Fertility by Age in Manti
Average fertility rate in Manti is 50.0 births per 1,000 women. Women in the age bracket of 20 to 34 years have the highest fertility rate with 87.0 births per 1,000 women. Women in the age bracket of 20 to 34 years acount for 74.2% of all women with births.
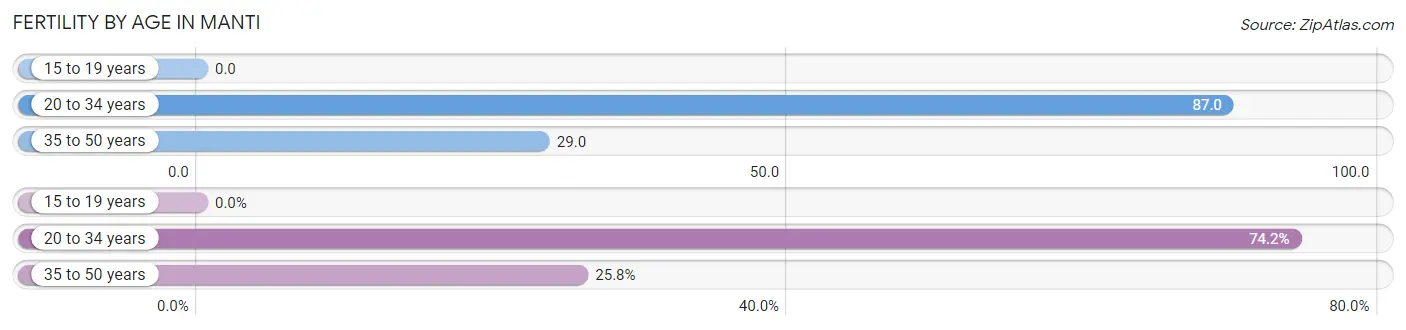
| Age Bracket | Women with Births | Births / 1,000 Women |
| 15 to 19 years | 0 (0.0%) | 0.0 |
| 20 to 34 years | 23 (74.2%) | 87.0 |
| 35 to 50 years | 8 (25.8%) | 29.0 |
| Total | 31 (100.0%) | 50.0 |
Fertility by Age by Marriage Status in Manti
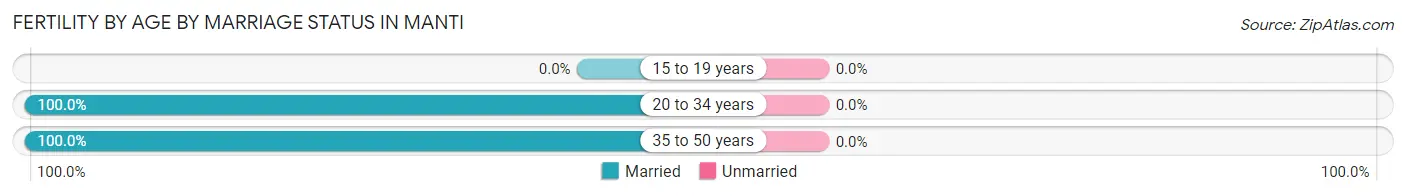
| Age Bracket | Married | Unmarried |
| 15 to 19 years | 0 (0.0%) | 0 (0.0%) |
| 20 to 34 years | 23 (100.0%) | 0 (0.0%) |
| 35 to 50 years | 8 (100.0%) | 0 (0.0%) |
| Total | 31 (100.0%) | 0 (0.0%) |
Fertility by Education in Manti
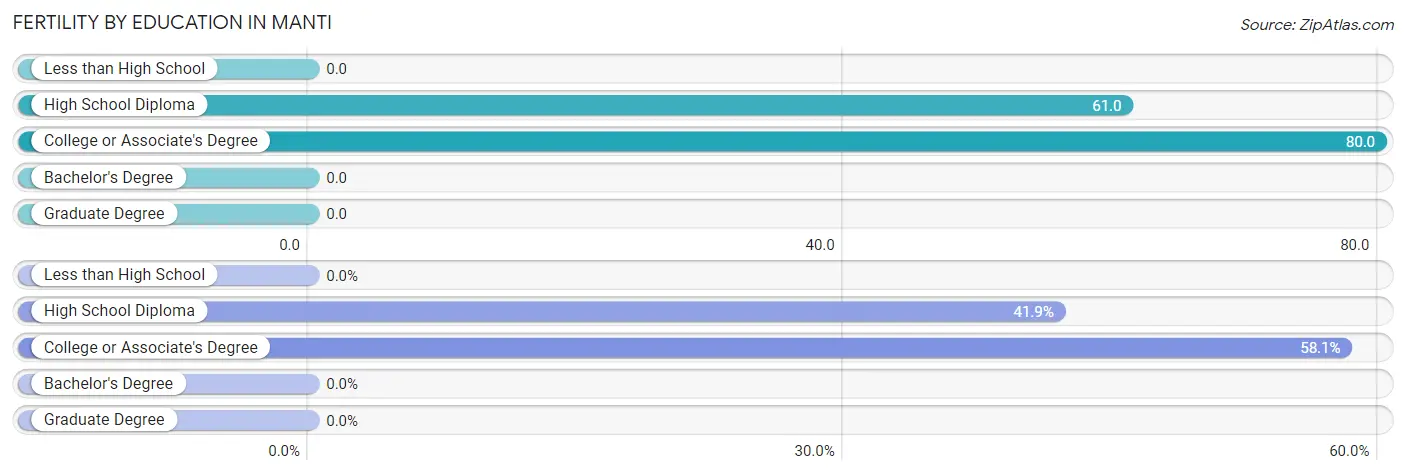
| Educational Attainment | Women with Births | Births / 1,000 Women |
| Less than High School | 0 (0.0%) | 0.0 |
| High School Diploma | 13 (41.9%) | 61.0 |
| College or Associate's Degree | 18 (58.1%) | 80.0 |
| Bachelor's Degree | 0 (0.0%) | 0.0 |
| Graduate Degree | 0 (0.0%) | 0.0 |
| Total | 31 (100.0%) | 50.0 |
Fertility by Education by Marriage Status in Manti
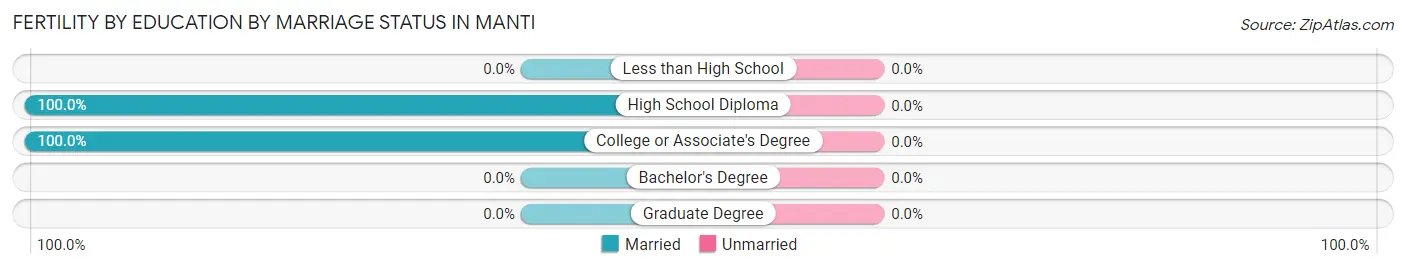
| Educational Attainment | Married | Unmarried |
| Less than High School | 0 (0.0%) | 0 (0.0%) |
| High School Diploma | 13 (100.0%) | 0 (0.0%) |
| College or Associate's Degree | 18 (100.0%) | 0 (0.0%) |
| Bachelor's Degree | 0 (0.0%) | 0 (0.0%) |
| Graduate Degree | 0 (0.0%) | 0 (0.0%) |
| Total | 31 (100.0%) | 0 (0.0%) |
Employment Characteristics in Manti
Employment by Class of Employer in Manti
Among the 1,403 employed individuals in Manti, private company employees (821 | 58.5%), state government employees (192 | 13.7%), and local government employees (167 | 11.9%) make up the most common classes of employment.
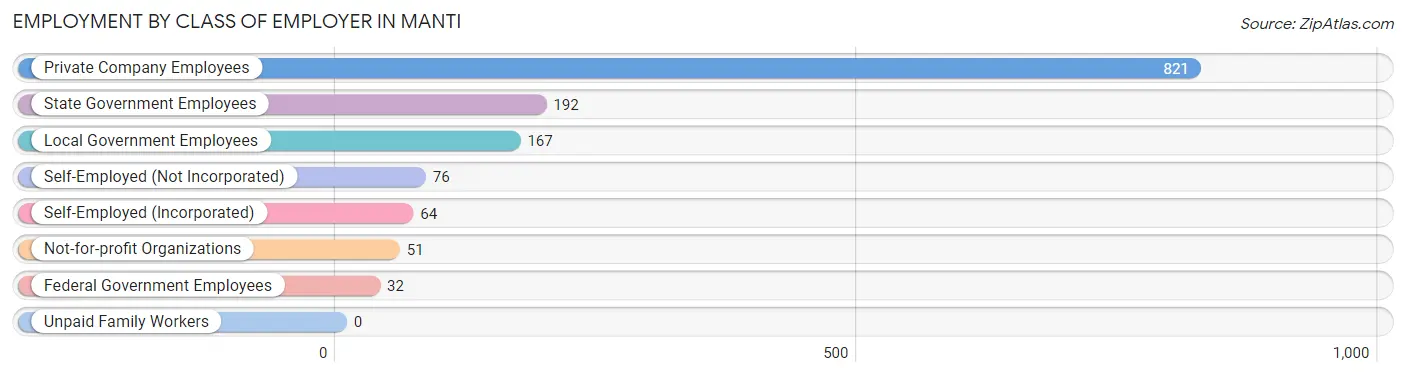
| Employer Class | # Employees | % Employees |
| Private Company Employees | 821 | 58.5% |
| Self-Employed (Incorporated) | 64 | 4.6% |
| Self-Employed (Not Incorporated) | 76 | 5.4% |
| Not-for-profit Organizations | 51 | 3.6% |
| Local Government Employees | 167 | 11.9% |
| State Government Employees | 192 | 13.7% |
| Federal Government Employees | 32 | 2.3% |
| Unpaid Family Workers | 0 | 0.0% |
| Total | 1,403 | 100.0% |
Employment Status by Age in Manti
According to the labor force statistics for Manti, out of the total population over 16 years of age (2,613), 55.6% or 1,453 individuals are in the labor force, with 1.7% or 25 of them unemployed. The age group with the highest labor force participation rate is 20 to 24 years, with 75.5% or 157 individuals in the labor force. Within the labor force, the 75 years and over age range has the highest percentage of unemployed individuals, with 36.4% or 4 of them being unemployed.
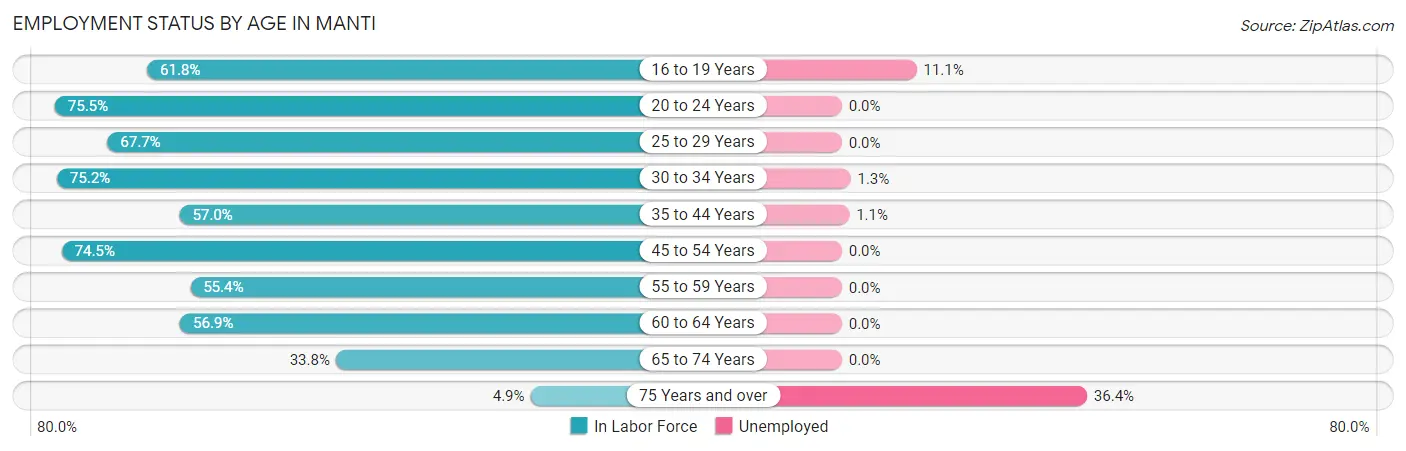
| Age Bracket | In Labor Force | Unemployed |
| 16 to 19 Years | 144 (61.8%) | 16 (11.1%) |
| 20 to 24 Years | 157 (75.5%) | 0 (0.0%) |
| 25 to 29 Years | 113 (67.7%) | 0 (0.0%) |
| 30 to 34 Years | 158 (75.2%) | 2 (1.3%) |
| 35 to 44 Years | 263 (57.0%) | 3 (1.1%) |
| 45 to 54 Years | 271 (74.5%) | 0 (0.0%) |
| 55 to 59 Years | 87 (55.4%) | 0 (0.0%) |
| 60 to 64 Years | 124 (56.9%) | 0 (0.0%) |
| 65 to 74 Years | 125 (33.8%) | 0 (0.0%) |
| 75 Years and over | 11 (4.9%) | 4 (36.4%) |
| Total | 1,453 (55.6%) | 25 (1.7%) |
Employment Status by Educational Attainment in Manti
According to labor force statistics for Manti, 64.4% of individuals (1,016) out of the total population between 25 and 64 years of age (1,577) are in the labor force, with 0.5% or 5 of them being unemployed. The group with the highest labor force participation rate are those with the educational attainment of bachelor's degree or higher, with 88.2% or 285 individuals in the labor force. Within the labor force, individuals with bachelor's degree or higher education have the highest percentage of unemployment, with 1.1% or 3 of them being unemployed.
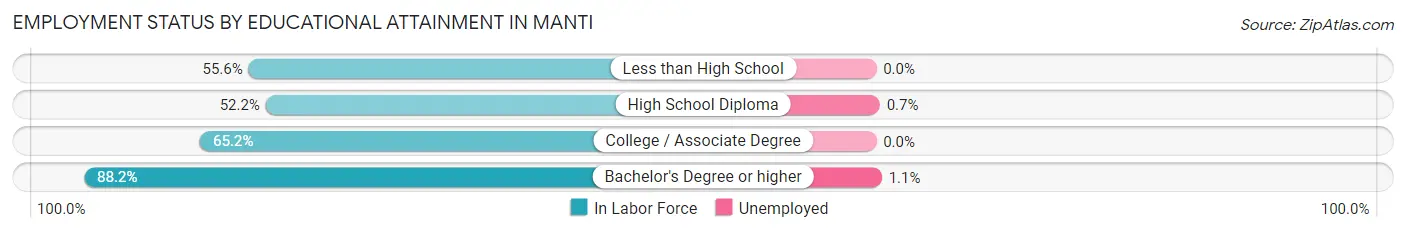
| Educational Attainment | In Labor Force | Unemployed |
| Less than High School | 75 (55.6%) | 0 (0.0%) |
| High School Diploma | 296 (52.2%) | 4 (0.7%) |
| College / Associate Degree | 360 (65.2%) | 0 (0.0%) |
| Bachelor's Degree or higher | 285 (88.2%) | 4 (1.1%) |
| Total | 1,016 (64.4%) | 8 (0.5%) |
Employment Occupations by Sex in Manti
Management, Business, Science and Arts Occupations
The most common Management, Business, Science and Arts occupations in Manti are Community & Social Service (264 | 18.5%), Education Instruction & Library (220 | 15.4%), Management (174 | 12.2%), Business & Financial (31 | 2.2%), and Computers, Engineering & Science (23 | 1.6%).
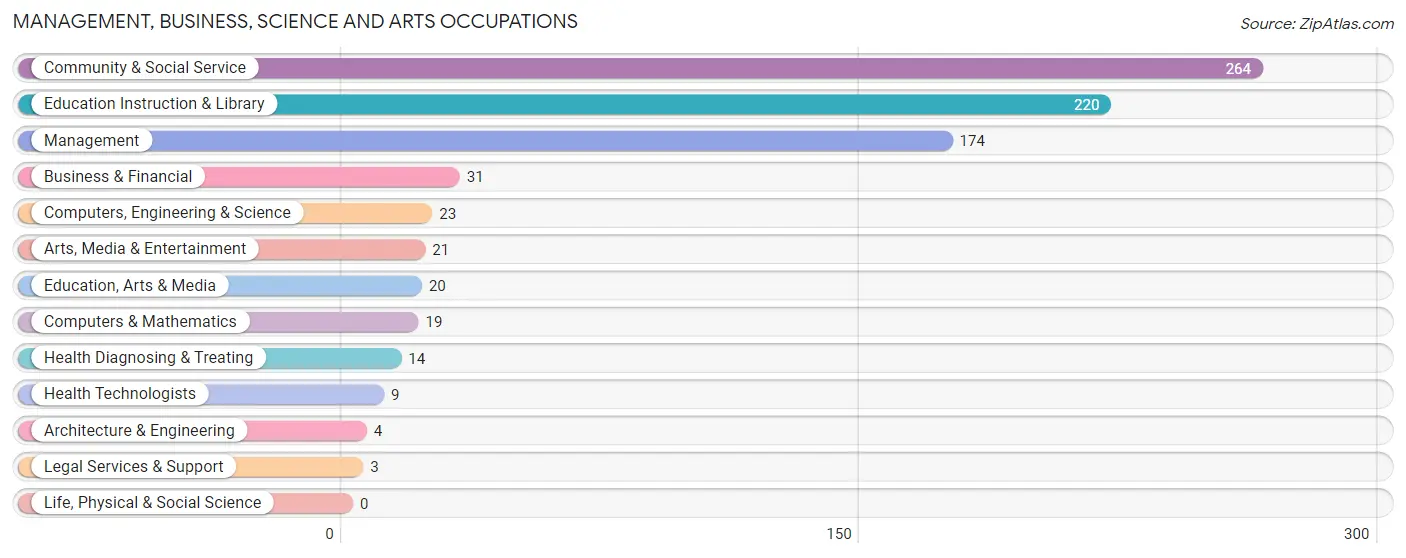
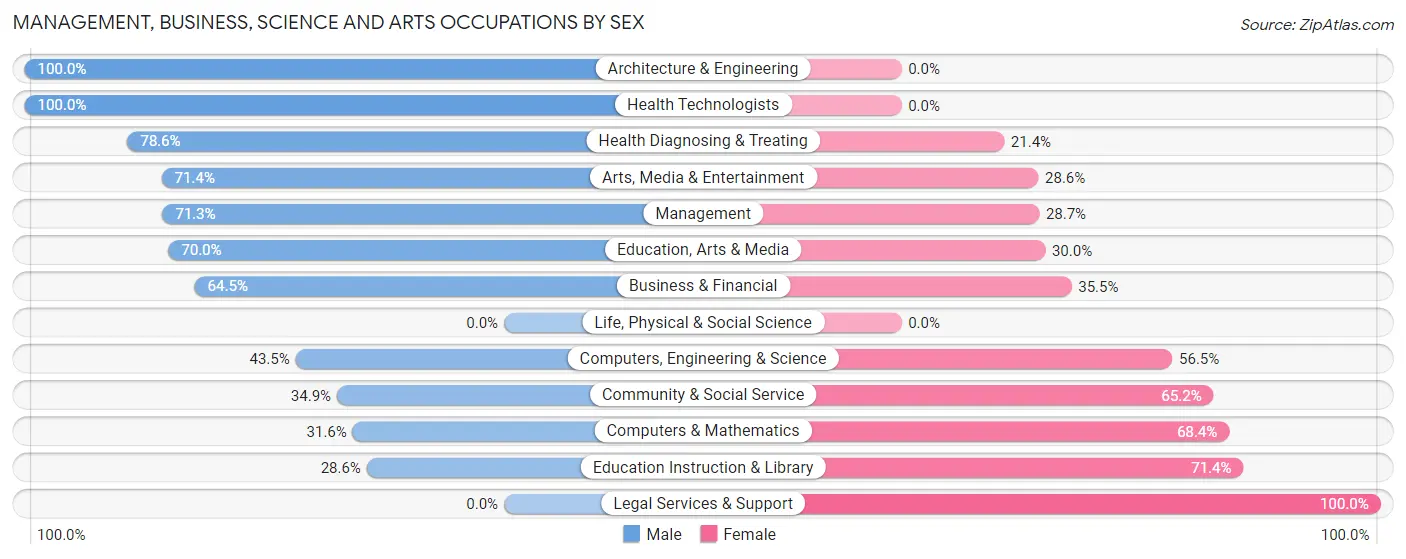
Management, Business, Science and Arts Occupations by Sex
Within the Management, Business, Science and Arts occupations in Manti, the most male-oriented occupations are Architecture & Engineering (100.0%), Health Technologists (100.0%), and Health Diagnosing & Treating (78.6%), while the most female-oriented occupations are Legal Services & Support (100.0%), Education Instruction & Library (71.4%), and Computers & Mathematics (68.4%).
| Occupation | Male | Female |
| Management | 124 (71.3%) | 50 (28.7%) |
| Business & Financial | 20 (64.5%) | 11 (35.5%) |
| Computers, Engineering & Science | 10 (43.5%) | 13 (56.5%) |
| Computers & Mathematics | 6 (31.6%) | 13 (68.4%) |
| Architecture & Engineering | 4 (100.0%) | 0 (0.0%) |
| Life, Physical & Social Science | 0 (0.0%) | 0 (0.0%) |
| Community & Social Service | 92 (34.8%) | 172 (65.1%) |
| Education, Arts & Media | 14 (70.0%) | 6 (30.0%) |
| Legal Services & Support | 0 (0.0%) | 3 (100.0%) |
| Education Instruction & Library | 63 (28.6%) | 157 (71.4%) |
| Arts, Media & Entertainment | 15 (71.4%) | 6 (28.6%) |
| Health Diagnosing & Treating | 11 (78.6%) | 3 (21.4%) |
| Health Technologists | 9 (100.0%) | 0 (0.0%) |
| Total (Category) | 257 (50.8%) | 249 (49.2%) |
| Total (Overall) | 792 (55.5%) | 636 (44.5%) |
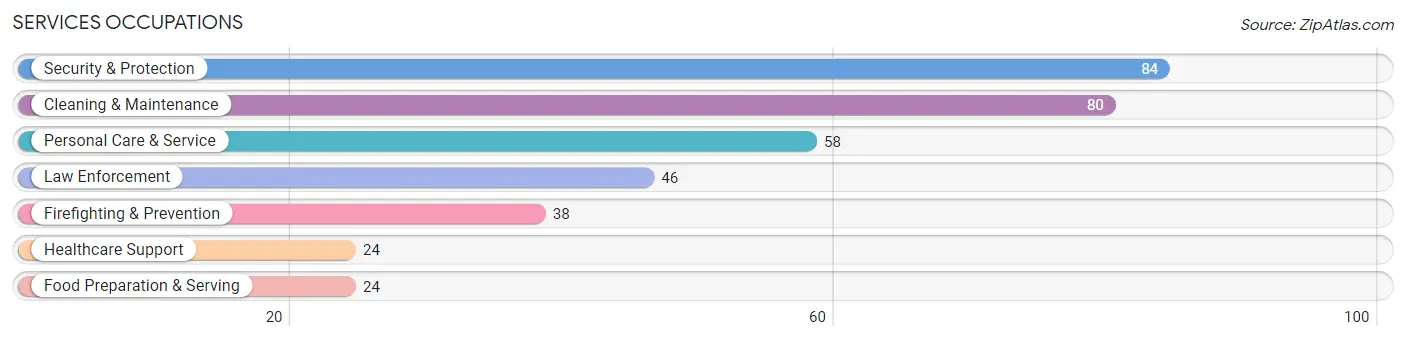
Services Occupations
The most common Services occupations in Manti are Security & Protection (84 | 5.9%), Cleaning & Maintenance (80 | 5.6%), Personal Care & Service (58 | 4.1%), Law Enforcement (46 | 3.2%), and Firefighting & Prevention (38 | 2.7%).
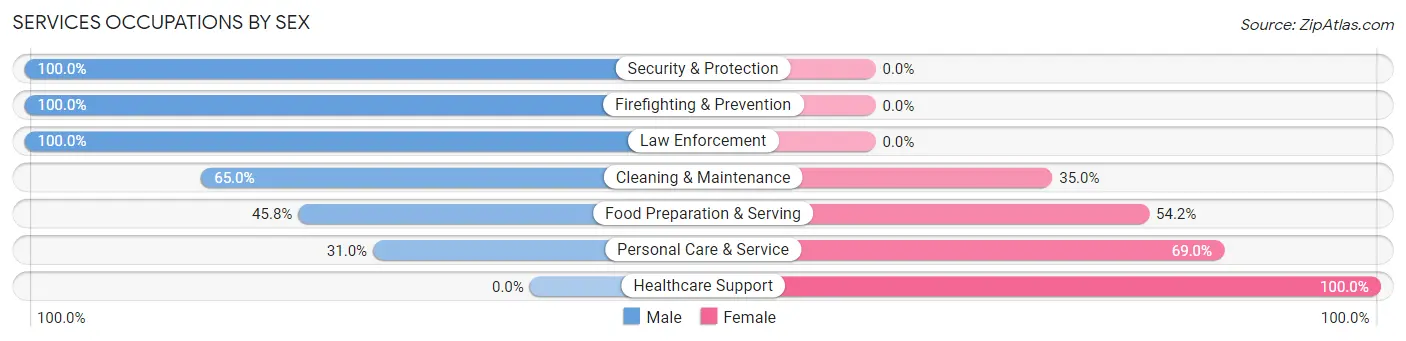
Services Occupations by Sex
Within the Services occupations in Manti, the most male-oriented occupations are Security & Protection (100.0%), Firefighting & Prevention (100.0%), and Law Enforcement (100.0%), while the most female-oriented occupations are Healthcare Support (100.0%), Personal Care & Service (69.0%), and Food Preparation & Serving (54.2%).
| Occupation | Male | Female |
| Healthcare Support | 0 (0.0%) | 24 (100.0%) |
| Security & Protection | 84 (100.0%) | 0 (0.0%) |
| Firefighting & Prevention | 38 (100.0%) | 0 (0.0%) |
| Law Enforcement | 46 (100.0%) | 0 (0.0%) |
| Food Preparation & Serving | 11 (45.8%) | 13 (54.2%) |
| Cleaning & Maintenance | 52 (65.0%) | 28 (35.0%) |
| Personal Care & Service | 18 (31.0%) | 40 (69.0%) |
| Total (Category) | 165 (61.1%) | 105 (38.9%) |
| Total (Overall) | 792 (55.5%) | 636 (44.5%) |
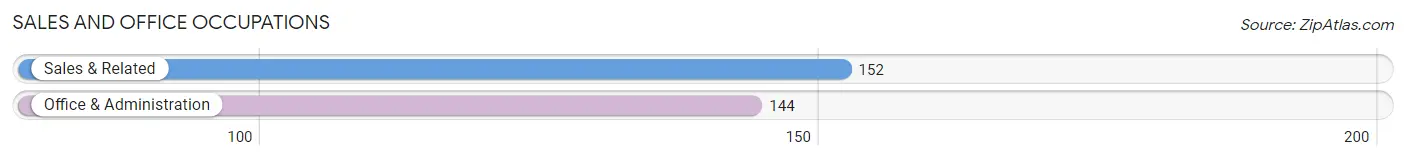
Sales and Office Occupations
The most common Sales and Office occupations in Manti are Sales & Related (152 | 10.6%), and Office & Administration (144 | 10.1%).
Sales and Office Occupations by Sex
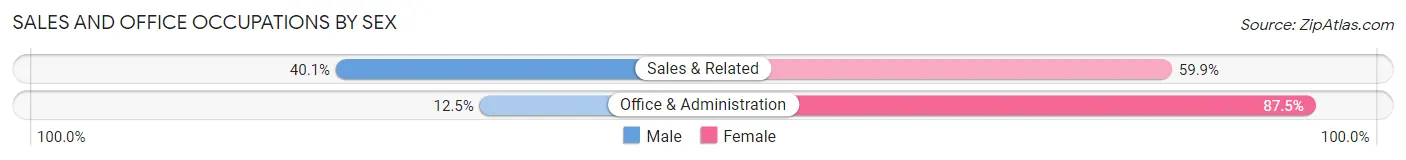
| Occupation | Male | Female |
| Sales & Related | 61 (40.1%) | 91 (59.9%) |
| Office & Administration | 18 (12.5%) | 126 (87.5%) |
| Total (Category) | 79 (26.7%) | 217 (73.3%) |
| Total (Overall) | 792 (55.5%) | 636 (44.5%) |
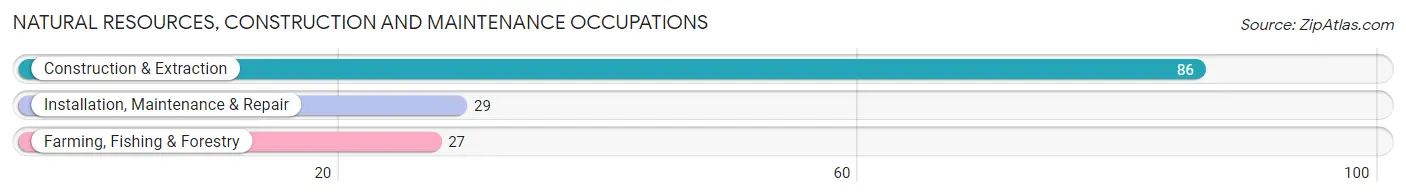
Natural Resources, Construction and Maintenance Occupations
The most common Natural Resources, Construction and Maintenance occupations in Manti are Construction & Extraction (86 | 6.0%), Installation, Maintenance & Repair (29 | 2.0%), and Farming, Fishing & Forestry (27 | 1.9%).
Natural Resources, Construction and Maintenance Occupations by Sex
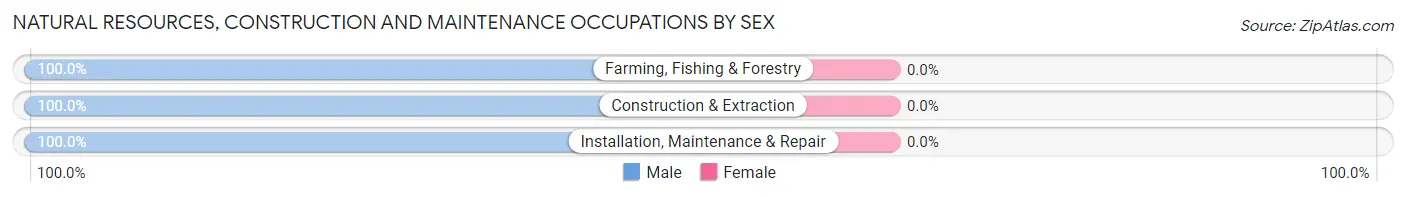
| Occupation | Male | Female |
| Farming, Fishing & Forestry | 27 (100.0%) | 0 (0.0%) |
| Construction & Extraction | 86 (100.0%) | 0 (0.0%) |
| Installation, Maintenance & Repair | 29 (100.0%) | 0 (0.0%) |
| Total (Category) | 142 (100.0%) | 0 (0.0%) |
| Total (Overall) | 792 (55.5%) | 636 (44.5%) |
Production, Transportation and Moving Occupations
The most common Production, Transportation and Moving occupations in Manti are Production (138 | 9.7%), Transportation (53 | 3.7%), and Material Moving (23 | 1.6%).
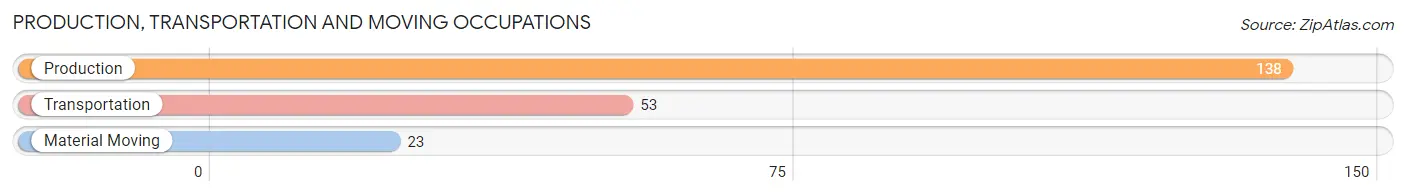
Production, Transportation and Moving Occupations by Sex
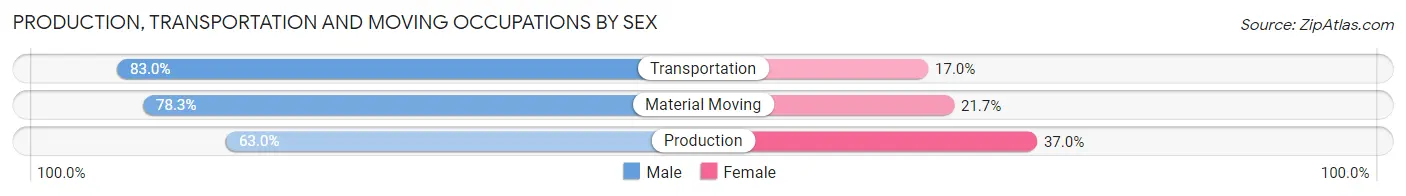
| Occupation | Male | Female |
| Production | 87 (63.0%) | 51 (37.0%) |
| Transportation | 44 (83.0%) | 9 (17.0%) |
| Material Moving | 18 (78.3%) | 5 (21.7%) |
| Total (Category) | 149 (69.6%) | 65 (30.4%) |
| Total (Overall) | 792 (55.5%) | 636 (44.5%) |
Employment Industries by Sex in Manti
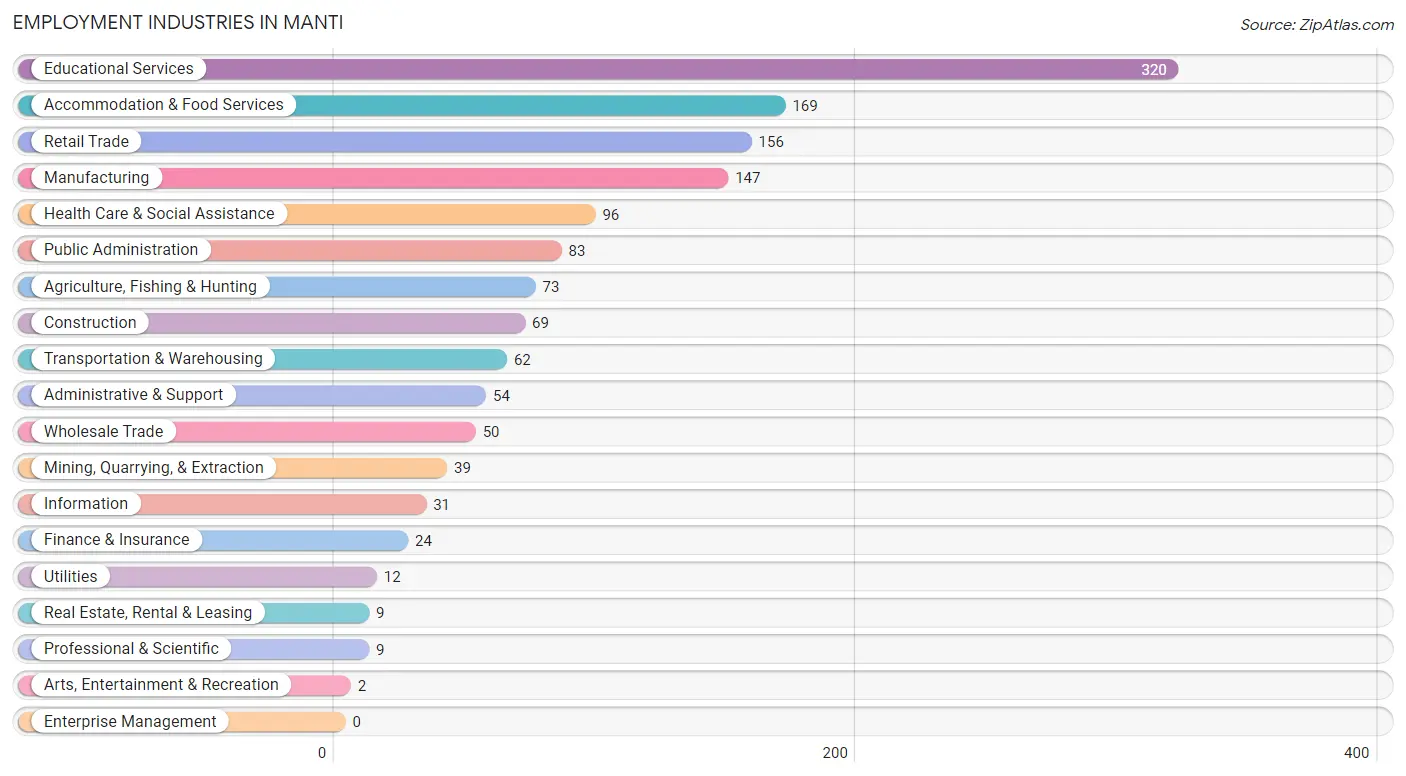
Employment Industries in Manti
The major employment industries in Manti include Educational Services (320 | 22.4%), Accommodation & Food Services (169 | 11.8%), Retail Trade (156 | 10.9%), Manufacturing (147 | 10.3%), and Health Care & Social Assistance (96 | 6.7%).
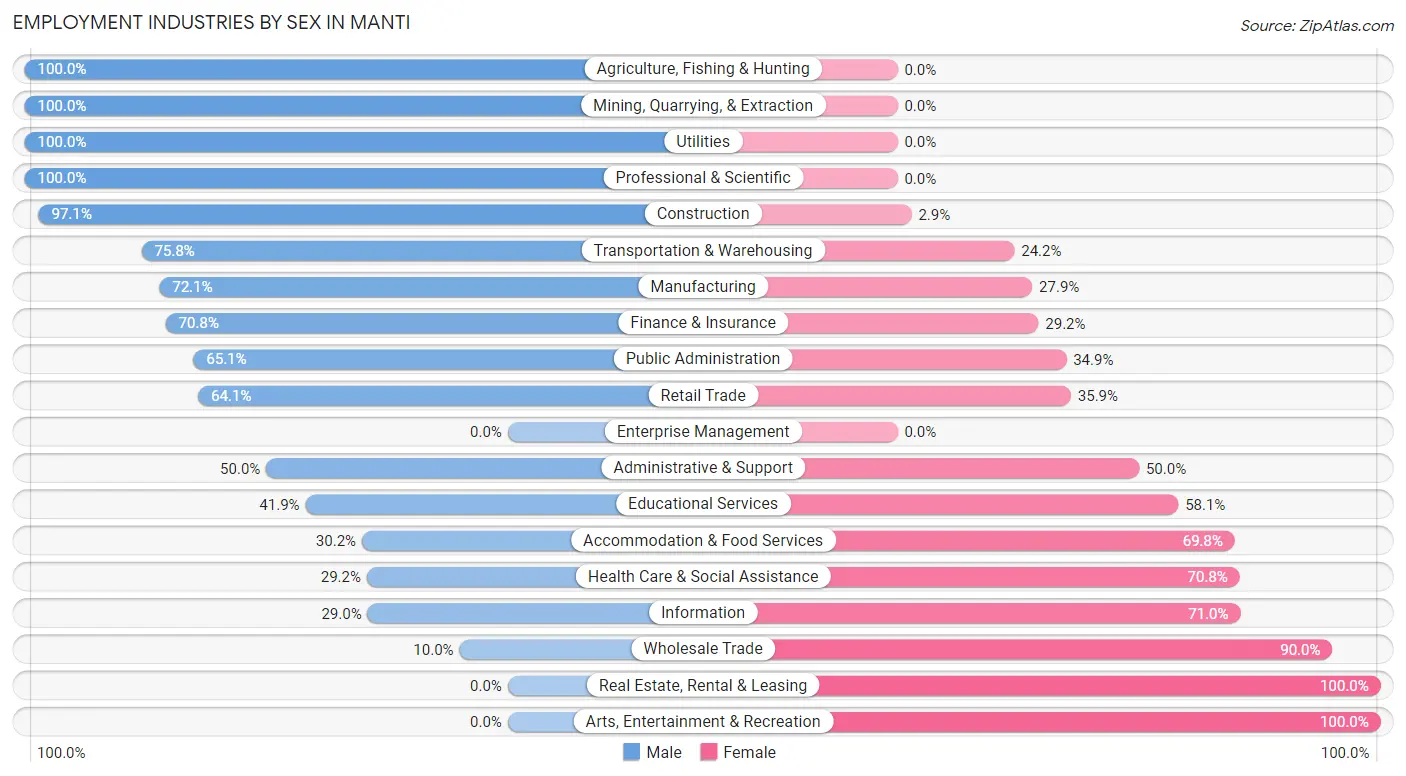
Employment Industries by Sex in Manti
The Manti industries that see more men than women are Agriculture, Fishing & Hunting (100.0%), Mining, Quarrying, & Extraction (100.0%), and Utilities (100.0%), whereas the industries that tend to have a higher number of women are Real Estate, Rental & Leasing (100.0%), Arts, Entertainment & Recreation (100.0%), and Wholesale Trade (90.0%).
| Industry | Male | Female |
| Agriculture, Fishing & Hunting | 73 (100.0%) | 0 (0.0%) |
| Mining, Quarrying, & Extraction | 39 (100.0%) | 0 (0.0%) |
| Construction | 67 (97.1%) | 2 (2.9%) |
| Manufacturing | 106 (72.1%) | 41 (27.9%) |
| Wholesale Trade | 5 (10.0%) | 45 (90.0%) |
| Retail Trade | 100 (64.1%) | 56 (35.9%) |
| Transportation & Warehousing | 47 (75.8%) | 15 (24.2%) |
| Utilities | 12 (100.0%) | 0 (0.0%) |
| Information | 9 (29.0%) | 22 (71.0%) |
| Finance & Insurance | 17 (70.8%) | 7 (29.2%) |
| Real Estate, Rental & Leasing | 0 (0.0%) | 9 (100.0%) |
| Professional & Scientific | 9 (100.0%) | 0 (0.0%) |
| Enterprise Management | 0 (0.0%) | 0 (0.0%) |
| Administrative & Support | 27 (50.0%) | 27 (50.0%) |
| Educational Services | 134 (41.9%) | 186 (58.1%) |
| Health Care & Social Assistance | 28 (29.2%) | 68 (70.8%) |
| Arts, Entertainment & Recreation | 0 (0.0%) | 2 (100.0%) |
| Accommodation & Food Services | 51 (30.2%) | 118 (69.8%) |
| Public Administration | 54 (65.1%) | 29 (34.9%) |
| Total | 792 (55.5%) | 636 (44.5%) |
Education in Manti
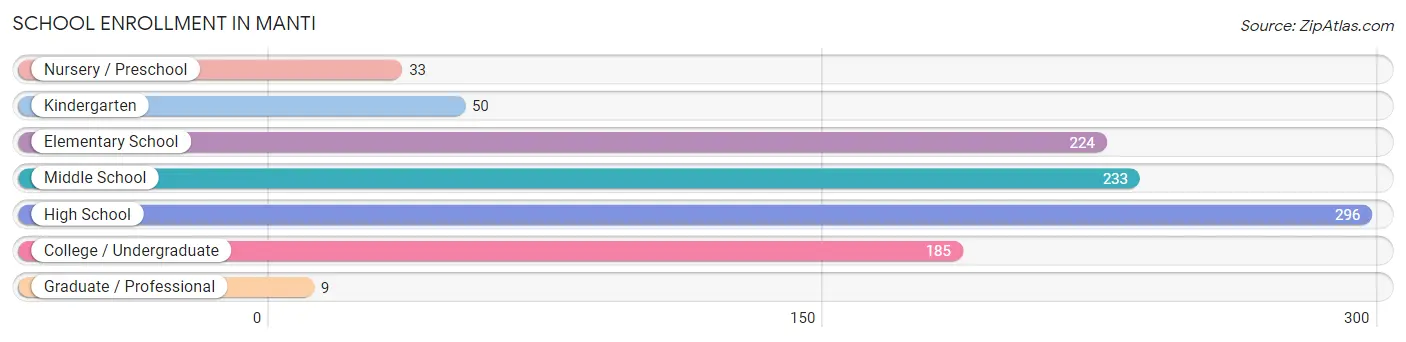
School Enrollment in Manti
The most common levels of schooling among the 1,030 students in Manti are high school (296 | 28.7%), middle school (233 | 22.6%), and elementary school (224 | 21.7%).
| School Level | # Students | % Students |
| Nursery / Preschool | 33 | 3.2% |
| Kindergarten | 50 | 4.9% |
| Elementary School | 224 | 21.7% |
| Middle School | 233 | 22.6% |
| High School | 296 | 28.7% |
| College / Undergraduate | 185 | 18.0% |
| Graduate / Professional | 9 | 0.9% |
| Total | 1,030 | 100.0% |
School Enrollment by Age by Funding Source in Manti
Out of a total of 1,030 students who are enrolled in schools in Manti, 13 (1.3%) attend a private institution, while the remaining 1,017 (98.7%) are enrolled in public schools. The age group of 15 to 17 year olds has the highest likelihood of being enrolled in private schools, with 7 (3.2% in the age bracket) enrolled. Conversely, the age group of 3 to 4 year olds has the lowest likelihood of being enrolled in a private school, with 33 (100.0% in the age bracket) attending a public institution.
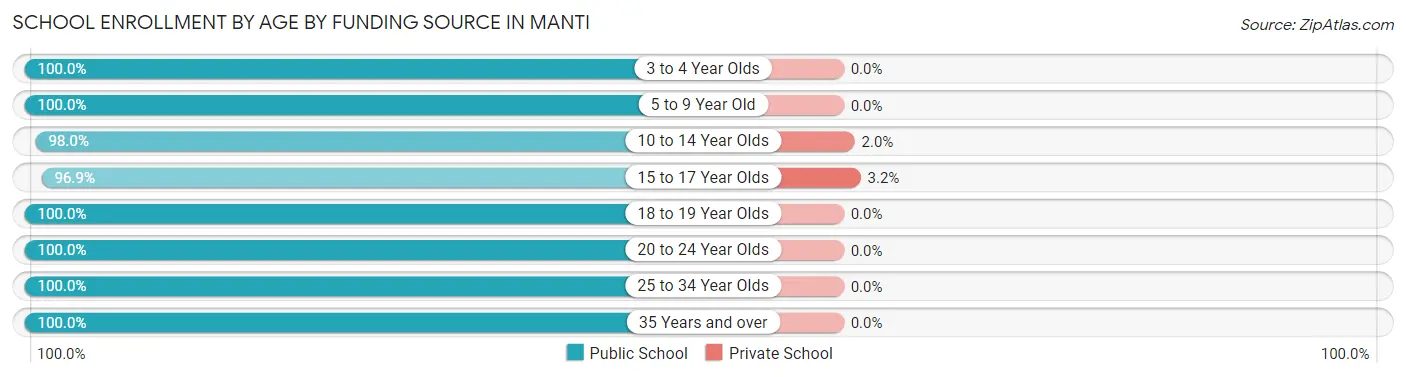
| Age Bracket | Public School | Private School |
| 3 to 4 Year Olds | 33 (100.0%) | 0 (0.0%) |
| 5 to 9 Year Old | 229 (100.0%) | 0 (0.0%) |
| 10 to 14 Year Olds | 290 (98.0%) | 6 (2.0%) |
| 15 to 17 Year Olds | 215 (96.9%) | 7 (3.2%) |
| 18 to 19 Year Olds | 75 (100.0%) | 0 (0.0%) |
| 20 to 24 Year Olds | 113 (100.0%) | 0 (0.0%) |
| 25 to 34 Year Olds | 34 (100.0%) | 0 (0.0%) |
| 35 Years and over | 28 (100.0%) | 0 (0.0%) |
| Total | 1,017 (98.7%) | 13 (1.3%) |
Educational Attainment by Field of Study in Manti
Education (182 | 33.5%), business (65 | 11.9%), bio, nature & agricultural (49 | 9.0%), science & technology (49 | 9.0%), and arts & humanities (38 | 7.0%) are the most common fields of study among 544 individuals in Manti who have obtained a bachelor's degree or higher.
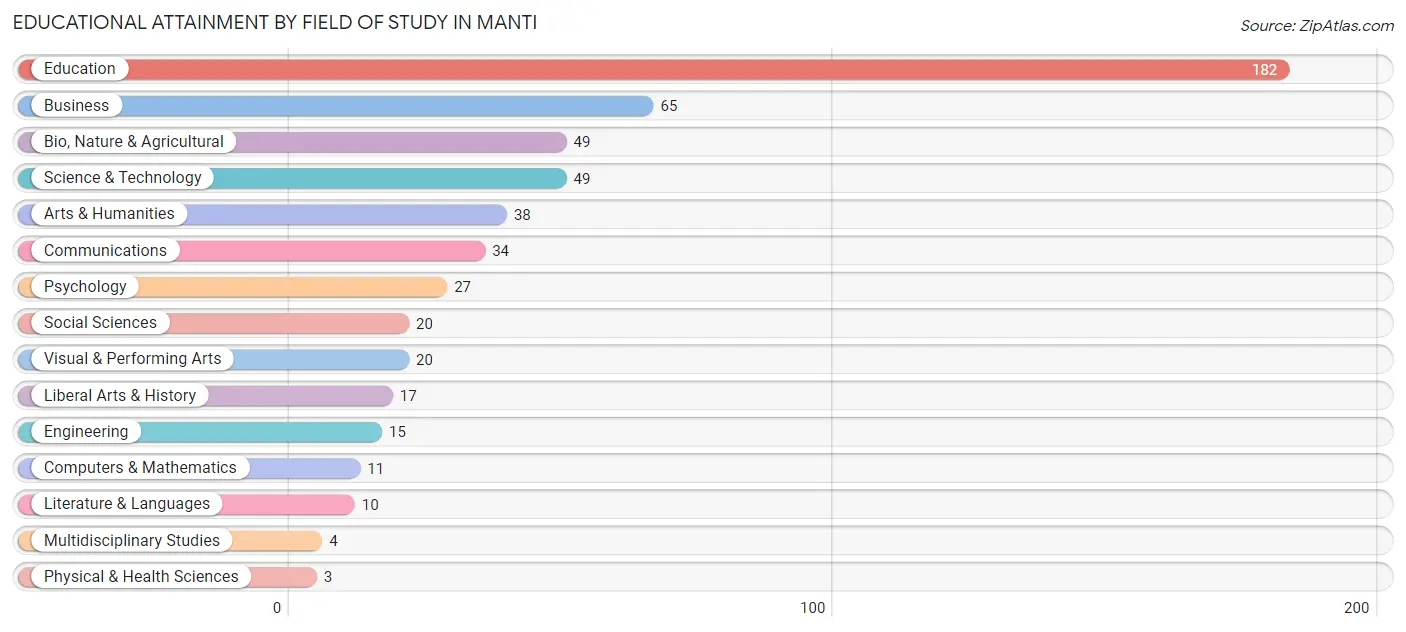
| Field of Study | # Graduates | % Graduates |
| Computers & Mathematics | 11 | 2.0% |
| Bio, Nature & Agricultural | 49 | 9.0% |
| Physical & Health Sciences | 3 | 0.5% |
| Psychology | 27 | 5.0% |
| Social Sciences | 20 | 3.7% |
| Engineering | 15 | 2.8% |
| Multidisciplinary Studies | 4 | 0.7% |
| Science & Technology | 49 | 9.0% |
| Business | 65 | 11.9% |
| Education | 182 | 33.5% |
| Literature & Languages | 10 | 1.8% |
| Liberal Arts & History | 17 | 3.1% |
| Visual & Performing Arts | 20 | 3.7% |
| Communications | 34 | 6.2% |
| Arts & Humanities | 38 | 7.0% |
| Total | 544 | 100.0% |
Transportation & Commute in Manti
Vehicle Availability by Sex in Manti
The most prevalent vehicle ownership categories in Manti are males with 3 vehicles (238, accounting for 30.0%) and females with 3 vehicles (139, making up 39.0%).
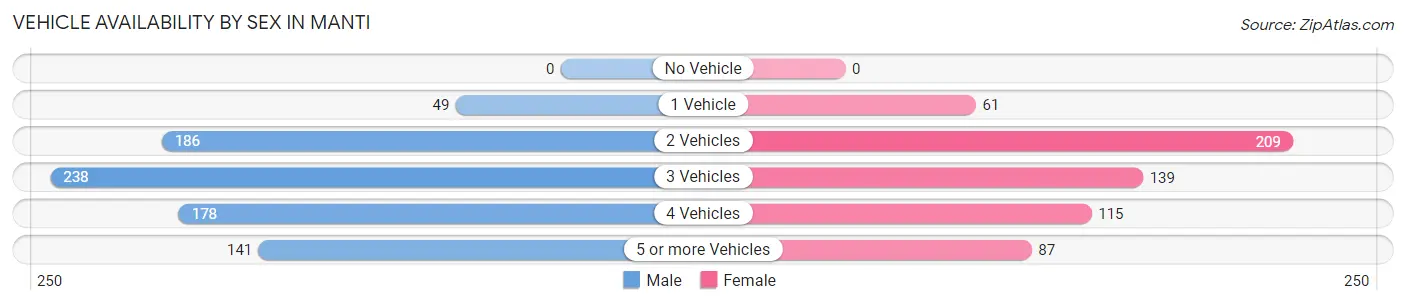
| Vehicles Available | Male | Female |
| No Vehicle | 0 (0.0%) | 0 (0.0%) |
| 1 Vehicle | 49 (6.2%) | 61 (10.0%) |
| 2 Vehicles | 186 (23.5%) | 209 (34.2%) |
| 3 Vehicles | 238 (30.0%) | 139 (22.8%) |
| 4 Vehicles | 178 (22.5%) | 115 (18.8%) |
| 5 or more Vehicles | 141 (17.8%) | 87 (14.2%) |
| Total | 792 (100.0%) | 611 (100.0%) |
Commute Time in Manti
The most frequently occuring commute durations in Manti are 5 to 9 minutes (294 commuters, 22.9%), less than 5 minutes (266 commuters, 20.7%), and 10 to 14 minutes (239 commuters, 18.6%).
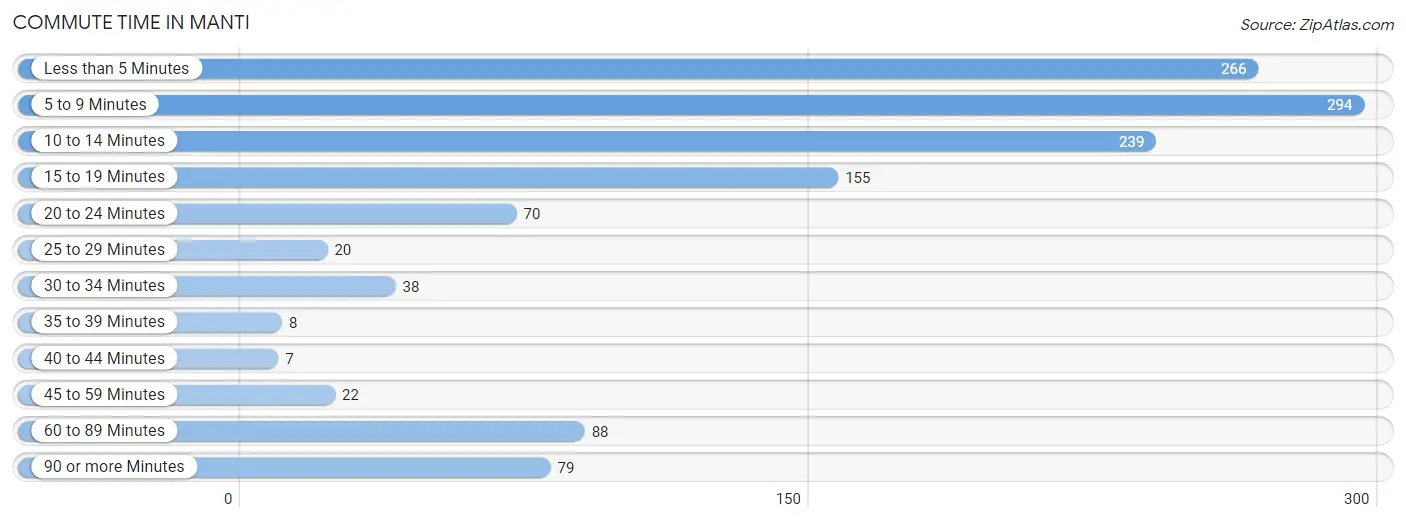
| Commute Time | # Commuters | % Commuters |
| Less than 5 Minutes | 266 | 20.7% |
| 5 to 9 Minutes | 294 | 22.9% |
| 10 to 14 Minutes | 239 | 18.6% |
| 15 to 19 Minutes | 155 | 12.0% |
| 20 to 24 Minutes | 70 | 5.4% |
| 25 to 29 Minutes | 20 | 1.6% |
| 30 to 34 Minutes | 38 | 2.9% |
| 35 to 39 Minutes | 8 | 0.6% |
| 40 to 44 Minutes | 7 | 0.5% |
| 45 to 59 Minutes | 22 | 1.7% |
| 60 to 89 Minutes | 88 | 6.8% |
| 90 or more Minutes | 79 | 6.1% |
Commute Time by Sex in Manti
The most common commute times in Manti are 10 to 14 minutes (167 commuters, 21.6%) for males and 5 to 9 minutes (177 commuters, 34.6%) for females.
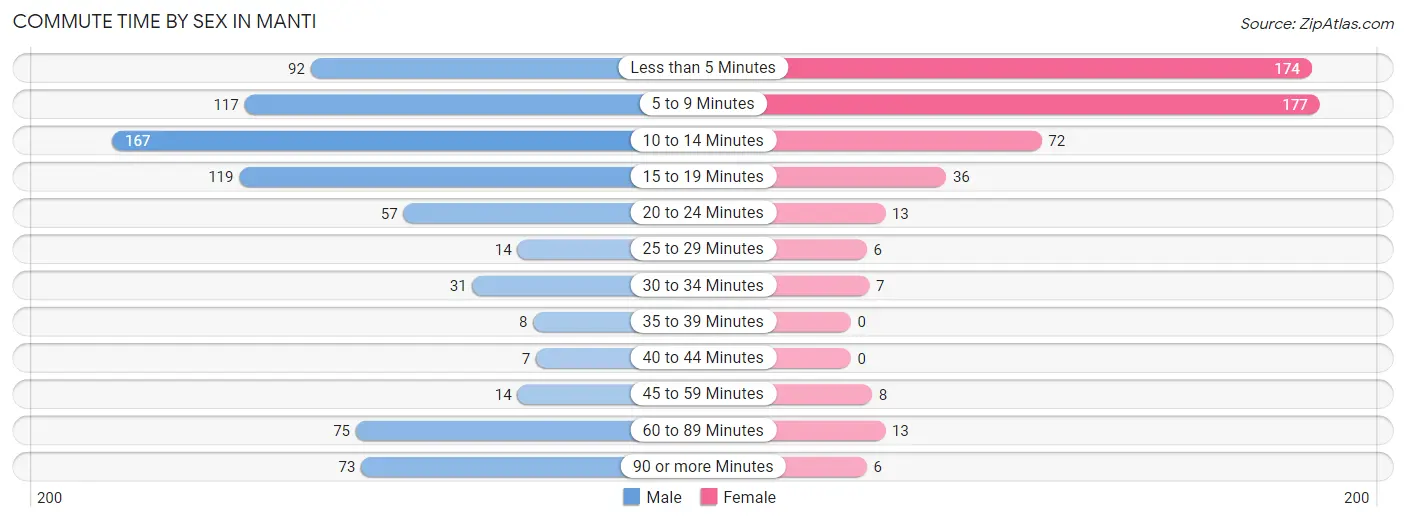
| Commute Time | Male | Female |
| Less than 5 Minutes | 92 (11.9%) | 174 (34.0%) |
| 5 to 9 Minutes | 117 (15.1%) | 177 (34.6%) |
| 10 to 14 Minutes | 167 (21.6%) | 72 (14.1%) |
| 15 to 19 Minutes | 119 (15.4%) | 36 (7.0%) |
| 20 to 24 Minutes | 57 (7.4%) | 13 (2.5%) |
| 25 to 29 Minutes | 14 (1.8%) | 6 (1.2%) |
| 30 to 34 Minutes | 31 (4.0%) | 7 (1.4%) |
| 35 to 39 Minutes | 8 (1.0%) | 0 (0.0%) |
| 40 to 44 Minutes | 7 (0.9%) | 0 (0.0%) |
| 45 to 59 Minutes | 14 (1.8%) | 8 (1.6%) |
| 60 to 89 Minutes | 75 (9.7%) | 13 (2.5%) |
| 90 or more Minutes | 73 (9.4%) | 6 (1.2%) |
Time of Departure to Work by Sex in Manti
The most frequent times of departure to work in Manti are 6:30 AM to 6:59 AM (139, 18.0%) for males and 7:30 AM to 7:59 AM (123, 24.0%) for females.
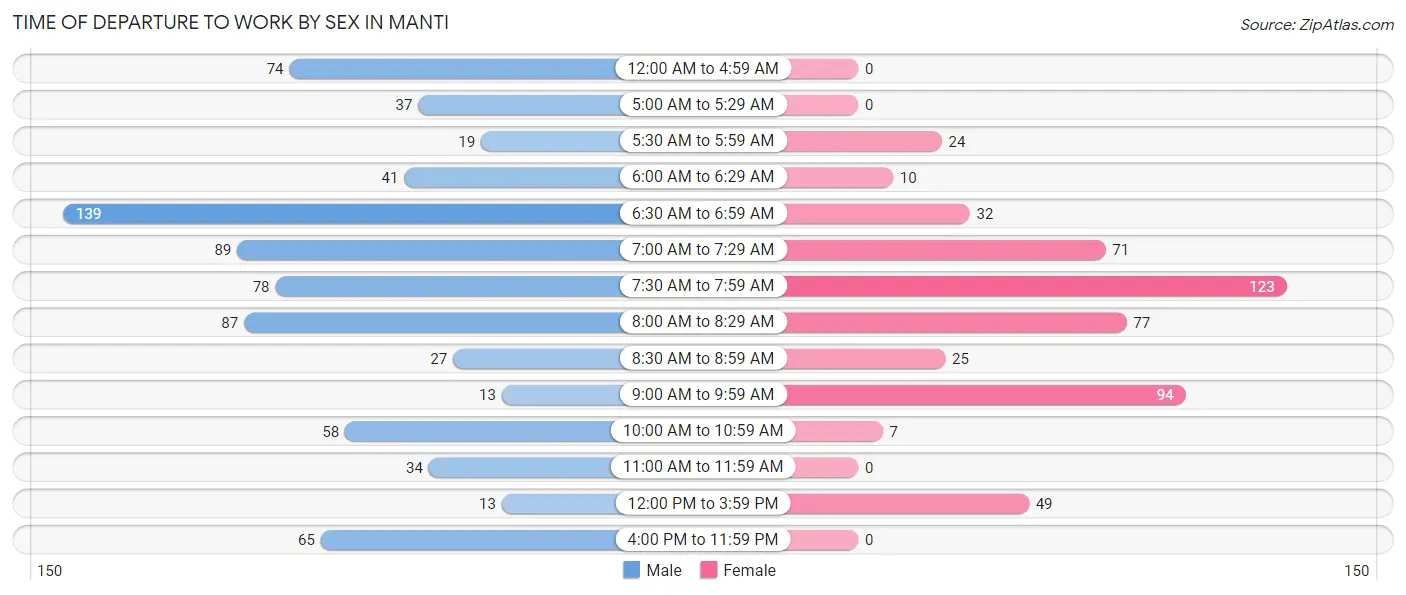
| Time of Departure | Male | Female |
| 12:00 AM to 4:59 AM | 74 (9.6%) | 0 (0.0%) |
| 5:00 AM to 5:29 AM | 37 (4.8%) | 0 (0.0%) |
| 5:30 AM to 5:59 AM | 19 (2.5%) | 24 (4.7%) |
| 6:00 AM to 6:29 AM | 41 (5.3%) | 10 (1.9%) |
| 6:30 AM to 6:59 AM | 139 (18.0%) | 32 (6.2%) |
| 7:00 AM to 7:29 AM | 89 (11.5%) | 71 (13.9%) |
| 7:30 AM to 7:59 AM | 78 (10.1%) | 123 (24.0%) |
| 8:00 AM to 8:29 AM | 87 (11.2%) | 77 (15.0%) |
| 8:30 AM to 8:59 AM | 27 (3.5%) | 25 (4.9%) |
| 9:00 AM to 9:59 AM | 13 (1.7%) | 94 (18.4%) |
| 10:00 AM to 10:59 AM | 58 (7.5%) | 7 (1.4%) |
| 11:00 AM to 11:59 AM | 34 (4.4%) | 0 (0.0%) |
| 12:00 PM to 3:59 PM | 13 (1.7%) | 49 (9.6%) |
| 4:00 PM to 11:59 PM | 65 (8.4%) | 0 (0.0%) |
| Total | 774 (100.0%) | 512 (100.0%) |
Housing Occupancy in Manti
Occupancy by Ownership in Manti
Of the total 1,054 dwellings in Manti, owner-occupied units account for 794 (75.3%), while renter-occupied units make up 260 (24.7%).
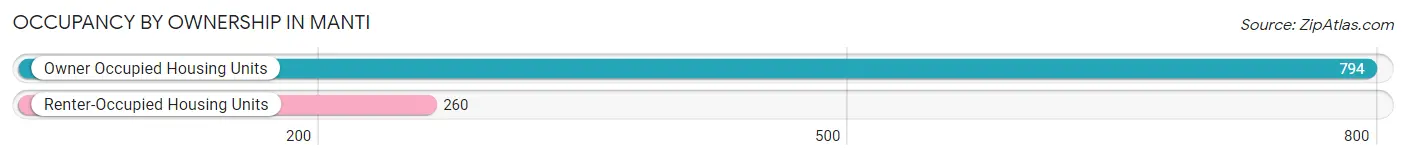
| Occupancy | # Housing Units | % Housing Units |
| Owner Occupied Housing Units | 794 | 75.3% |
| Renter-Occupied Housing Units | 260 | 24.7% |
| Total Occupied Housing Units | 1,054 | 100.0% |
Occupancy by Household Size in Manti
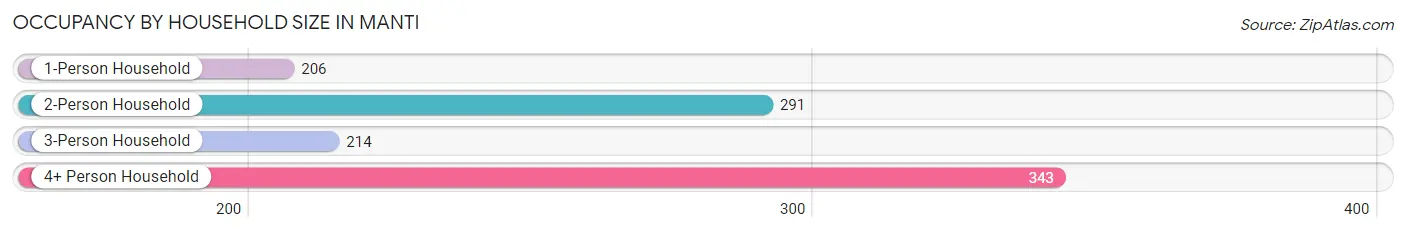
| Household Size | # Housing Units | % Housing Units |
| 1-Person Household | 206 | 19.5% |
| 2-Person Household | 291 | 27.6% |
| 3-Person Household | 214 | 20.3% |
| 4+ Person Household | 343 | 32.5% |
| Total Housing Units | 1,054 | 100.0% |
Occupancy by Ownership by Household Size in Manti
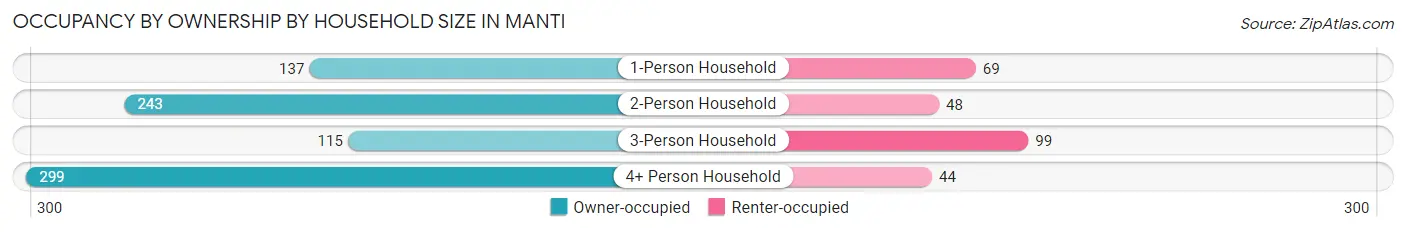
| Household Size | Owner-occupied | Renter-occupied |
| 1-Person Household | 137 (66.5%) | 69 (33.5%) |
| 2-Person Household | 243 (83.5%) | 48 (16.5%) |
| 3-Person Household | 115 (53.7%) | 99 (46.3%) |
| 4+ Person Household | 299 (87.2%) | 44 (12.8%) |
| Total Housing Units | 794 (75.3%) | 260 (24.7%) |
Occupancy by Educational Attainment in Manti
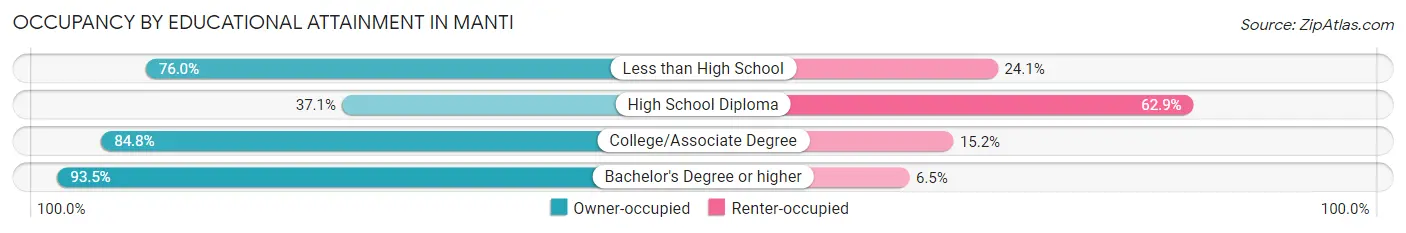
| Household Size | Owner-occupied | Renter-occupied |
| Less than High School | 60 (75.9%) | 19 (24.0%) |
| High School Diploma | 95 (37.1%) | 161 (62.9%) |
| College/Associate Degree | 323 (84.8%) | 58 (15.2%) |
| Bachelor's Degree or higher | 316 (93.5%) | 22 (6.5%) |
Occupancy by Age of Householder in Manti
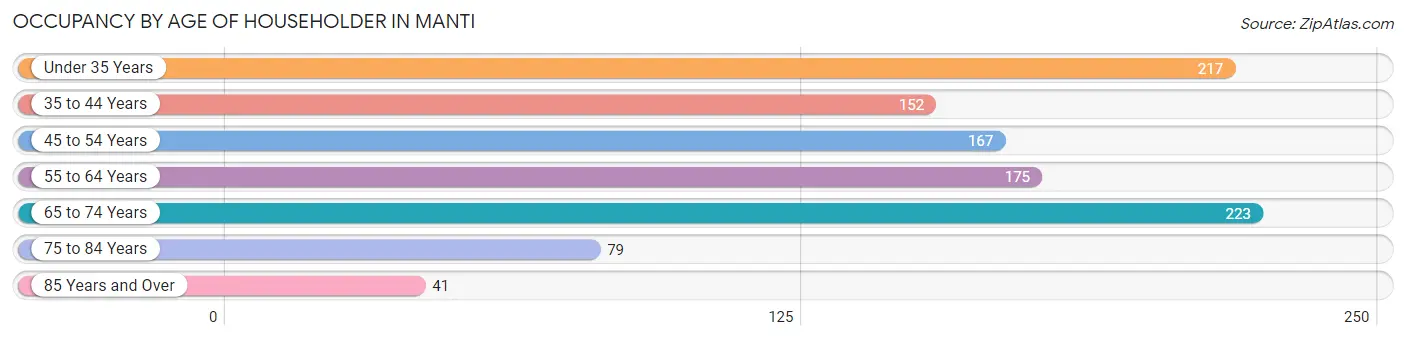
| Age Bracket | # Households | % Households |
| Under 35 Years | 217 | 20.6% |
| 35 to 44 Years | 152 | 14.4% |
| 45 to 54 Years | 167 | 15.8% |
| 55 to 64 Years | 175 | 16.6% |
| 65 to 74 Years | 223 | 21.2% |
| 75 to 84 Years | 79 | 7.5% |
| 85 Years and Over | 41 | 3.9% |
| Total | 1,054 | 100.0% |
Housing Finances in Manti
Median Income by Occupancy in Manti
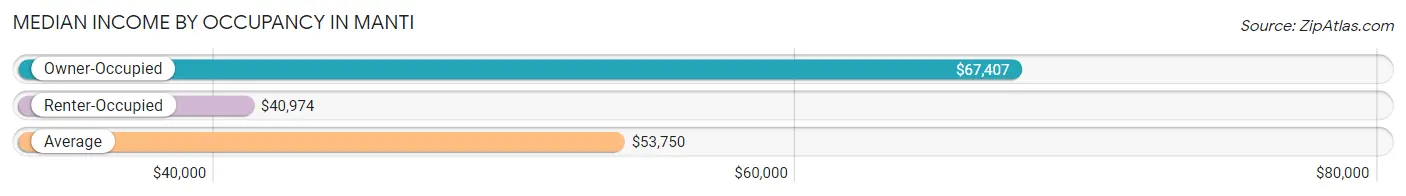
| Occupancy Type | # Households | Median Income |
| Owner-Occupied | 794 (75.3%) | $67,407 |
| Renter-Occupied | 260 (24.7%) | $40,974 |
| Average | 1,054 (100.0%) | $53,750 |
Occupancy by Householder Income Bracket in Manti
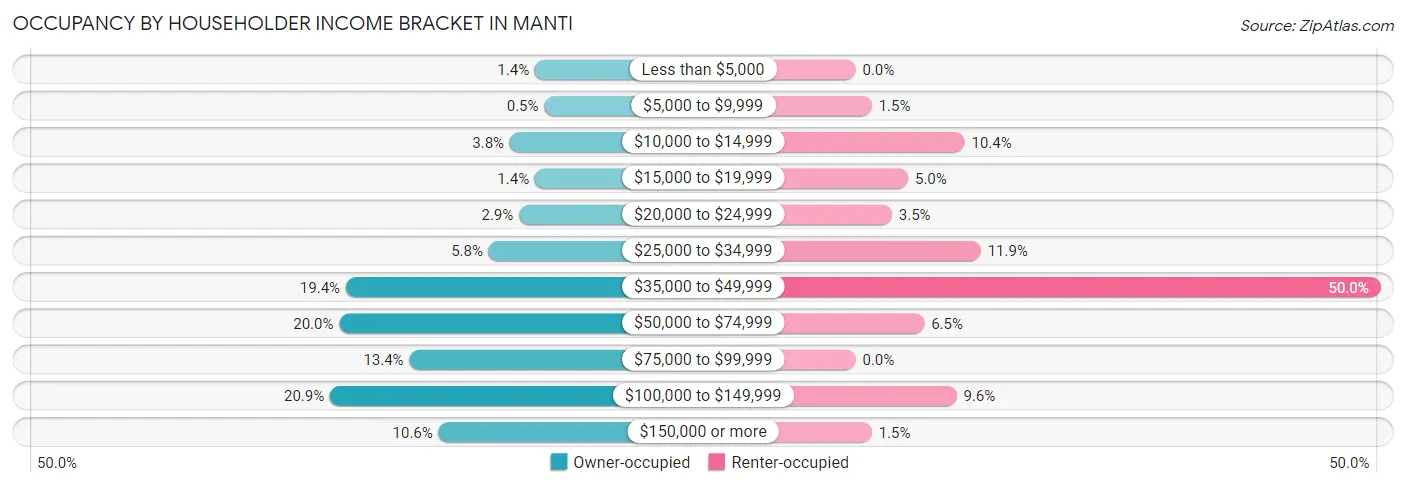
| Income Bracket | Owner-occupied | Renter-occupied |
| Less than $5,000 | 11 (1.4%) | 0 (0.0%) |
| $5,000 to $9,999 | 4 (0.5%) | 4 (1.5%) |
| $10,000 to $14,999 | 30 (3.8%) | 27 (10.4%) |
| $15,000 to $19,999 | 11 (1.4%) | 13 (5.0%) |
| $20,000 to $24,999 | 23 (2.9%) | 9 (3.5%) |
| $25,000 to $34,999 | 46 (5.8%) | 31 (11.9%) |
| $35,000 to $49,999 | 154 (19.4%) | 130 (50.0%) |
| $50,000 to $74,999 | 159 (20.0%) | 17 (6.5%) |
| $75,000 to $99,999 | 106 (13.4%) | 0 (0.0%) |
| $100,000 to $149,999 | 166 (20.9%) | 25 (9.6%) |
| $150,000 or more | 84 (10.6%) | 4 (1.5%) |
| Total | 794 (100.0%) | 260 (100.0%) |
Monthly Housing Cost Tiers in Manti
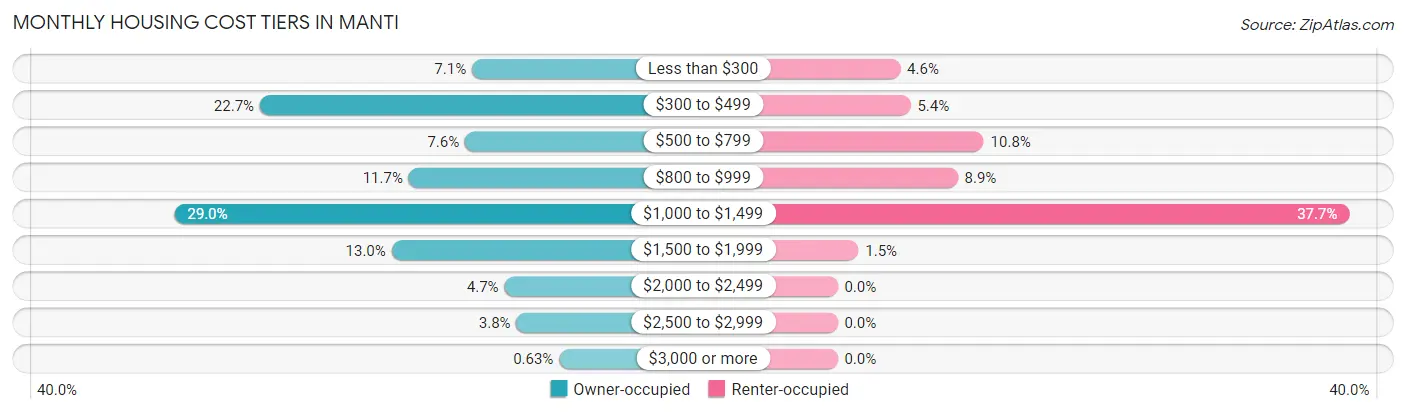
| Monthly Cost | Owner-occupied | Renter-occupied |
| Less than $300 | 56 (7.0%) | 12 (4.6%) |
| $300 to $499 | 180 (22.7%) | 14 (5.4%) |
| $500 to $799 | 60 (7.6%) | 28 (10.8%) |
| $800 to $999 | 93 (11.7%) | 23 (8.8%) |
| $1,000 to $1,499 | 230 (29.0%) | 98 (37.7%) |
| $1,500 to $1,999 | 103 (13.0%) | 4 (1.5%) |
| $2,000 to $2,499 | 37 (4.7%) | 0 (0.0%) |
| $2,500 to $2,999 | 30 (3.8%) | 0 (0.0%) |
| $3,000 or more | 5 (0.6%) | 0 (0.0%) |
| Total | 794 (100.0%) | 260 (100.0%) |
Physical Housing Characteristics in Manti
Housing Structures in Manti
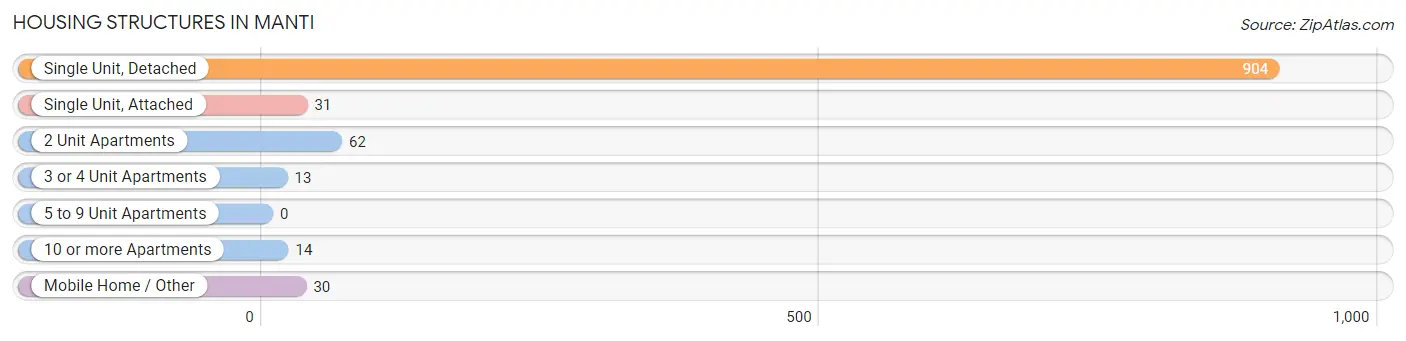
| Structure Type | # Housing Units | % Housing Units |
| Single Unit, Detached | 904 | 85.8% |
| Single Unit, Attached | 31 | 2.9% |
| 2 Unit Apartments | 62 | 5.9% |
| 3 or 4 Unit Apartments | 13 | 1.2% |
| 5 to 9 Unit Apartments | 0 | 0.0% |
| 10 or more Apartments | 14 | 1.3% |
| Mobile Home / Other | 30 | 2.9% |
| Total | 1,054 | 100.0% |
Housing Structures by Occupancy in Manti
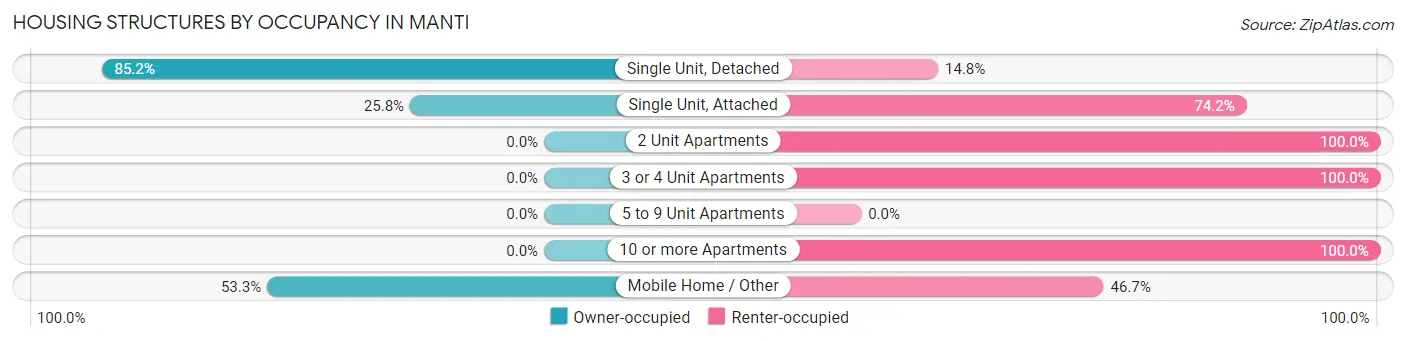
| Structure Type | Owner-occupied | Renter-occupied |
| Single Unit, Detached | 770 (85.2%) | 134 (14.8%) |
| Single Unit, Attached | 8 (25.8%) | 23 (74.2%) |
| 2 Unit Apartments | 0 (0.0%) | 62 (100.0%) |
| 3 or 4 Unit Apartments | 0 (0.0%) | 13 (100.0%) |
| 5 to 9 Unit Apartments | 0 (0.0%) | 0 (0.0%) |
| 10 or more Apartments | 0 (0.0%) | 14 (100.0%) |
| Mobile Home / Other | 16 (53.3%) | 14 (46.7%) |
| Total | 794 (75.3%) | 260 (24.7%) |
Housing Structures by Number of Rooms in Manti
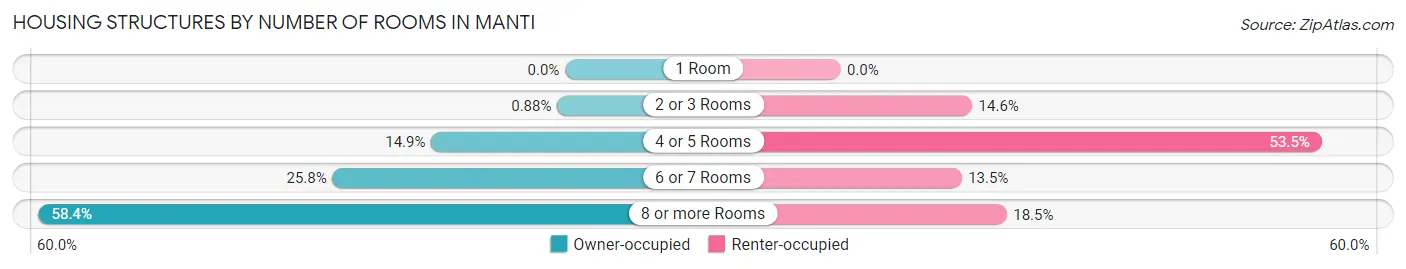
| Number of Rooms | Owner-occupied | Renter-occupied |
| 1 Room | 0 (0.0%) | 0 (0.0%) |
| 2 or 3 Rooms | 7 (0.9%) | 38 (14.6%) |
| 4 or 5 Rooms | 118 (14.9%) | 139 (53.5%) |
| 6 or 7 Rooms | 205 (25.8%) | 35 (13.5%) |
| 8 or more Rooms | 464 (58.4%) | 48 (18.5%) |
| Total | 794 (100.0%) | 260 (100.0%) |
Housing Structure by Heating Type in Manti
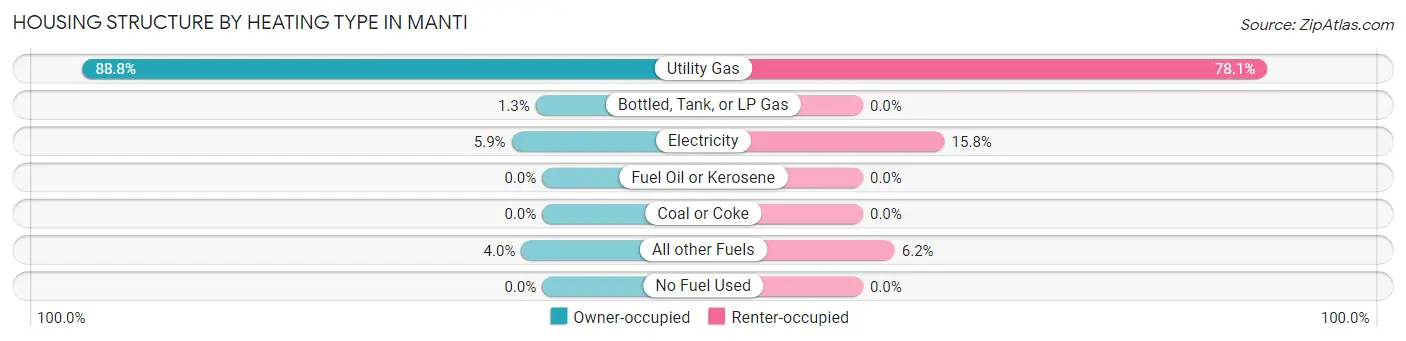
| Heating Type | Owner-occupied | Renter-occupied |
| Utility Gas | 705 (88.8%) | 203 (78.1%) |
| Bottled, Tank, or LP Gas | 10 (1.3%) | 0 (0.0%) |
| Electricity | 47 (5.9%) | 41 (15.8%) |
| Fuel Oil or Kerosene | 0 (0.0%) | 0 (0.0%) |
| Coal or Coke | 0 (0.0%) | 0 (0.0%) |
| All other Fuels | 32 (4.0%) | 16 (6.1%) |
| No Fuel Used | 0 (0.0%) | 0 (0.0%) |
| Total | 794 (100.0%) | 260 (100.0%) |
Household Vehicle Usage in Manti
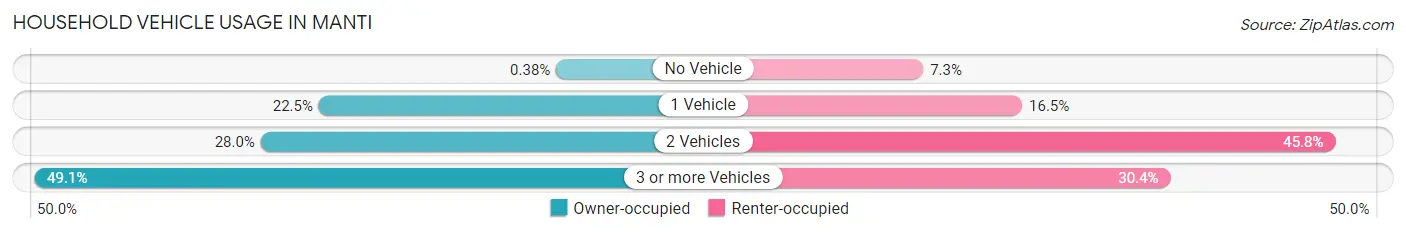
| Vehicles per Household | Owner-occupied | Renter-occupied |
| No Vehicle | 3 (0.4%) | 19 (7.3%) |
| 1 Vehicle | 179 (22.5%) | 43 (16.5%) |
| 2 Vehicles | 222 (28.0%) | 119 (45.8%) |
| 3 or more Vehicles | 390 (49.1%) | 79 (30.4%) |
| Total | 794 (100.0%) | 260 (100.0%) |
Real Estate & Mortgages in Manti
Real Estate and Mortgage Overview in Manti
| Characteristic | Without Mortgage | With Mortgage |
| Housing Units | 270 | 524 |
| Median Property Value | $234,500 | $237,700 |
| Median Household Income | $49,583 | $55 |
| Monthly Housing Costs | $368 | $5 |
| Real Estate Taxes | $1,481 | $6 |
Property Value by Mortgage Status in Manti
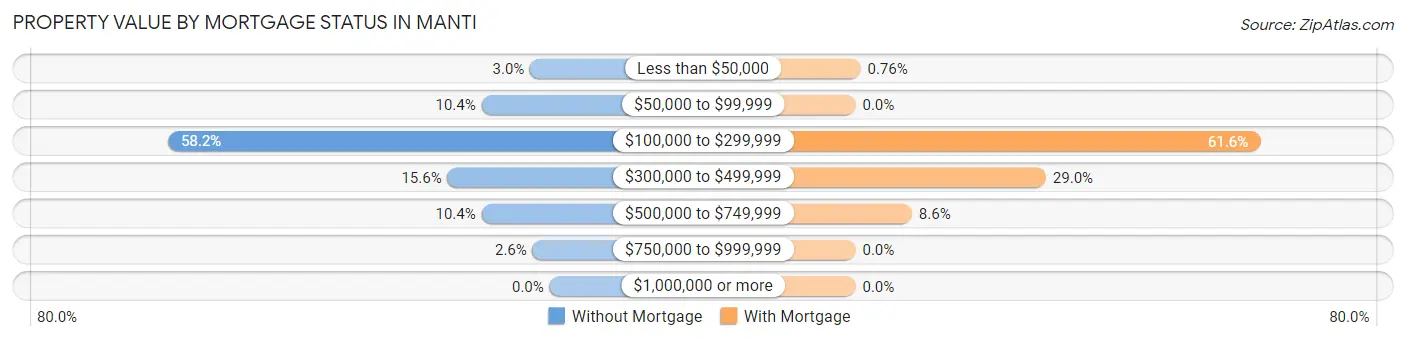
| Property Value | Without Mortgage | With Mortgage |
| Less than $50,000 | 8 (3.0%) | 4 (0.8%) |
| $50,000 to $99,999 | 28 (10.4%) | 0 (0.0%) |
| $100,000 to $299,999 | 157 (58.2%) | 323 (61.6%) |
| $300,000 to $499,999 | 42 (15.6%) | 152 (29.0%) |
| $500,000 to $749,999 | 28 (10.4%) | 45 (8.6%) |
| $750,000 to $999,999 | 7 (2.6%) | 0 (0.0%) |
| $1,000,000 or more | 0 (0.0%) | 0 (0.0%) |
| Total | 270 (100.0%) | 524 (100.0%) |
Household Income by Mortgage Status in Manti
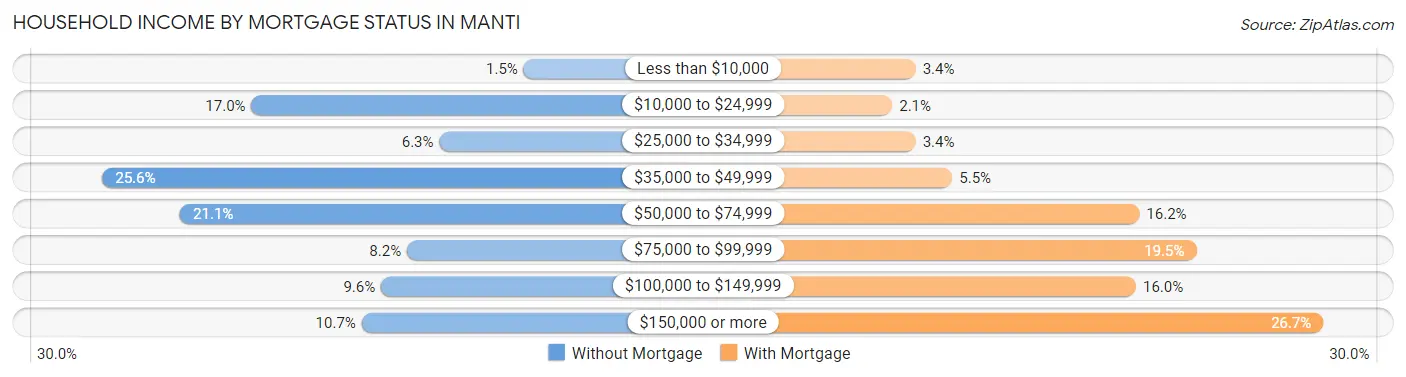
| Household Income | Without Mortgage | With Mortgage |
| Less than $10,000 | 4 (1.5%) | 18 (3.4%) |
| $10,000 to $24,999 | 46 (17.0%) | 11 (2.1%) |
| $25,000 to $34,999 | 17 (6.3%) | 18 (3.4%) |
| $35,000 to $49,999 | 69 (25.6%) | 29 (5.5%) |
| $50,000 to $74,999 | 57 (21.1%) | 85 (16.2%) |
| $75,000 to $99,999 | 22 (8.2%) | 102 (19.5%) |
| $100,000 to $149,999 | 26 (9.6%) | 84 (16.0%) |
| $150,000 or more | 29 (10.7%) | 140 (26.7%) |
| Total | 270 (100.0%) | 524 (100.0%) |
Property Value to Household Income Ratio in Manti
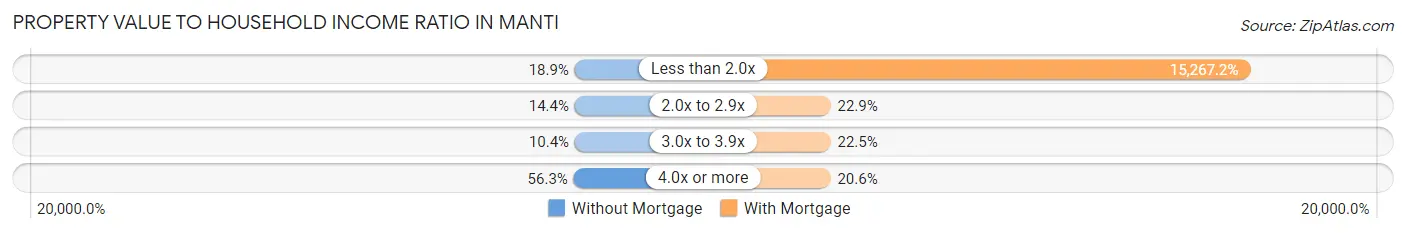
| Value-to-Income Ratio | Without Mortgage | With Mortgage |
| Less than 2.0x | 51 (18.9%) | 80,000 (15,267.2%) |
| 2.0x to 2.9x | 39 (14.4%) | 120 (22.9%) |
| 3.0x to 3.9x | 28 (10.4%) | 118 (22.5%) |
| 4.0x or more | 152 (56.3%) | 108 (20.6%) |
| Total | 270 (100.0%) | 524 (100.0%) |
Real Estate Taxes by Mortgage Status in Manti
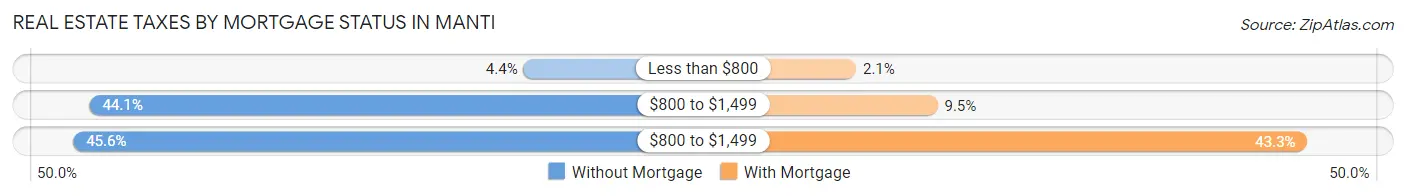
| Property Taxes | Without Mortgage | With Mortgage |
| Less than $800 | 12 (4.4%) | 11 (2.1%) |
| $800 to $1,499 | 119 (44.1%) | 50 (9.5%) |
| $800 to $1,499 | 123 (45.6%) | 227 (43.3%) |
| Total | 270 (100.0%) | 524 (100.0%) |
Health & Disability in Manti
Health Insurance Coverage by Age in Manti
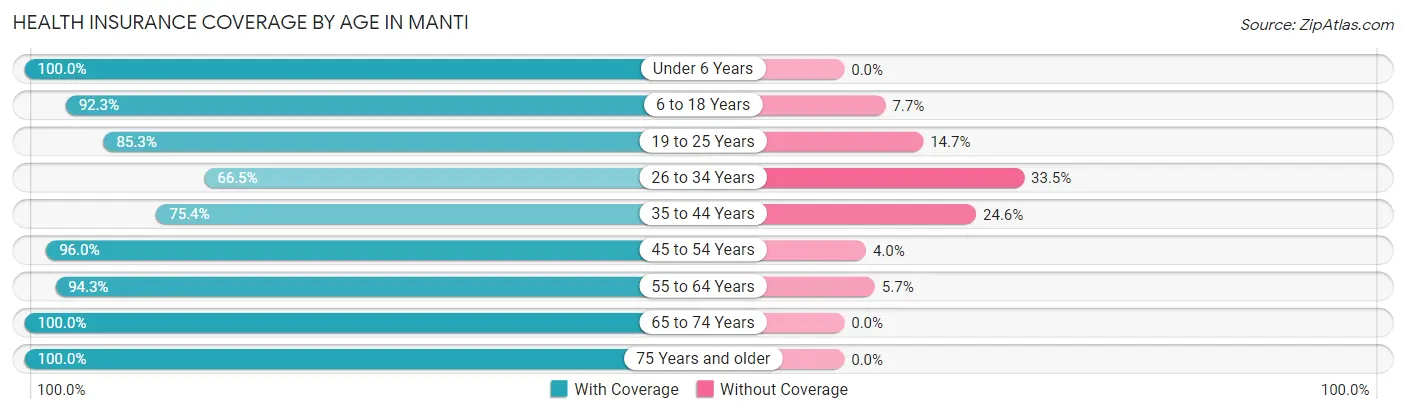
| Age Bracket | With Coverage | Without Coverage |
| Under 6 Years | 202 (100.0%) | 0 (0.0%) |
| 6 to 18 Years | 757 (92.3%) | 63 (7.7%) |
| 19 to 25 Years | 226 (85.3%) | 39 (14.7%) |
| 26 to 34 Years | 224 (66.5%) | 113 (33.5%) |
| 35 to 44 Years | 313 (75.4%) | 102 (24.6%) |
| 45 to 54 Years | 309 (96.0%) | 13 (4.0%) |
| 55 to 64 Years | 330 (94.3%) | 20 (5.7%) |
| 65 to 74 Years | 370 (100.0%) | 0 (0.0%) |
| 75 Years and older | 225 (100.0%) | 0 (0.0%) |
| Total | 2,956 (89.4%) | 350 (10.6%) |
Health Insurance Coverage by Citizenship Status in Manti
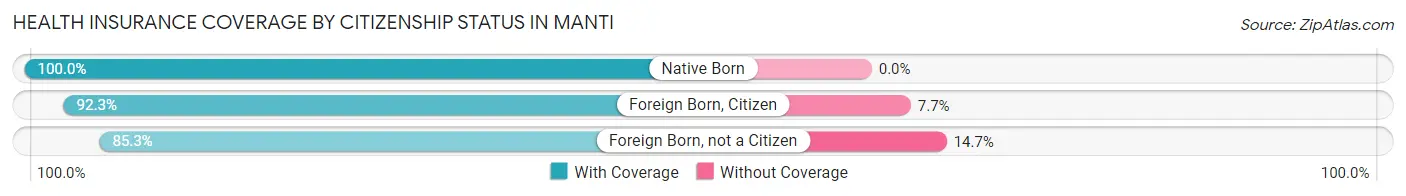
| Citizenship Status | With Coverage | Without Coverage |
| Native Born | 202 (100.0%) | 0 (0.0%) |
| Foreign Born, Citizen | 757 (92.3%) | 63 (7.7%) |
| Foreign Born, not a Citizen | 226 (85.3%) | 39 (14.7%) |
Health Insurance Coverage by Household Income in Manti
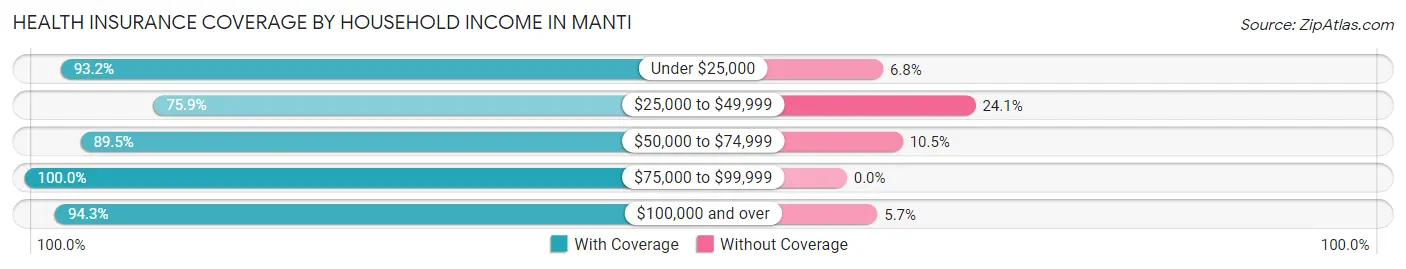
| Household Income | With Coverage | Without Coverage |
| Under $25,000 | 179 (93.2%) | 13 (6.8%) |
| $25,000 to $49,999 | 658 (75.9%) | 209 (24.1%) |
| $50,000 to $74,999 | 539 (89.5%) | 63 (10.5%) |
| $75,000 to $99,999 | 507 (100.0%) | 0 (0.0%) |
| $100,000 and over | 1,073 (94.3%) | 65 (5.7%) |
Public vs Private Health Insurance Coverage by Age in Manti
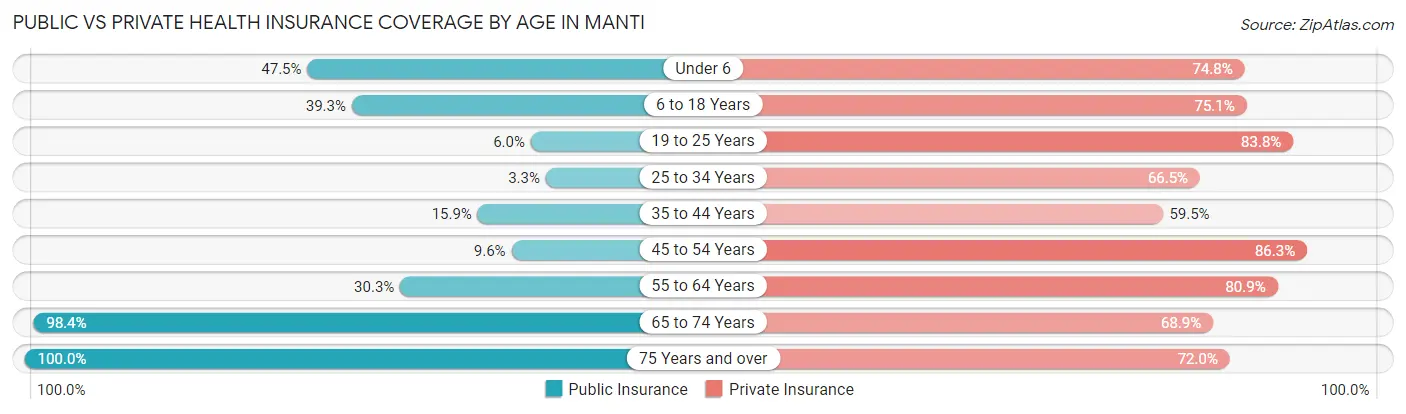
| Age Bracket | Public Insurance | Private Insurance |
| Under 6 | 96 (47.5%) | 151 (74.8%) |
| 6 to 18 Years | 322 (39.3%) | 616 (75.1%) |
| 19 to 25 Years | 16 (6.0%) | 222 (83.8%) |
| 25 to 34 Years | 11 (3.3%) | 224 (66.5%) |
| 35 to 44 Years | 66 (15.9%) | 247 (59.5%) |
| 45 to 54 Years | 31 (9.6%) | 278 (86.3%) |
| 55 to 64 Years | 106 (30.3%) | 283 (80.9%) |
| 65 to 74 Years | 364 (98.4%) | 255 (68.9%) |
| 75 Years and over | 225 (100.0%) | 162 (72.0%) |
| Total | 1,237 (37.4%) | 2,438 (73.7%) |
Disability Status by Sex by Age in Manti
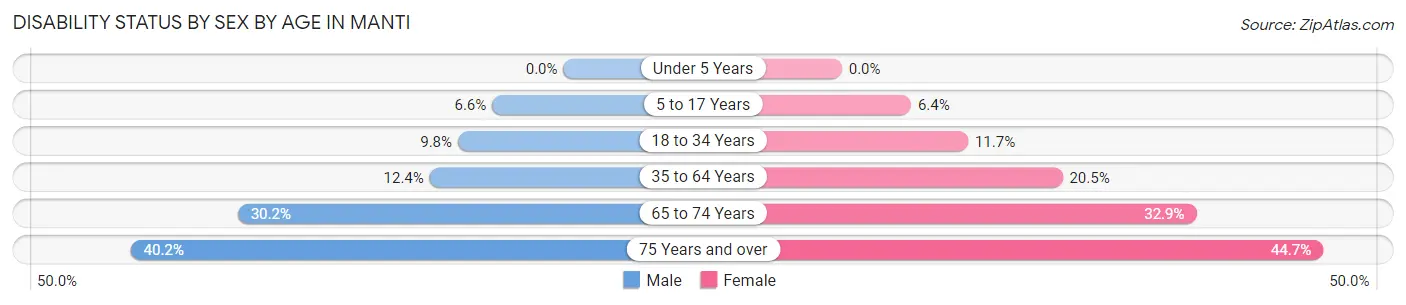
| Age Bracket | Male | Female |
| Under 5 Years | 0 (0.0%) | 0 (0.0%) |
| 5 to 17 Years | 29 (6.6%) | 21 (6.4%) |
| 18 to 34 Years | 37 (9.8%) | 35 (11.7%) |
| 35 to 64 Years | 67 (12.4%) | 112 (20.5%) |
| 65 to 74 Years | 42 (30.2%) | 76 (32.9%) |
| 75 Years and over | 49 (40.2%) | 46 (44.7%) |
Disability Class by Sex by Age in Manti
Disability Class: Hearing Difficulty
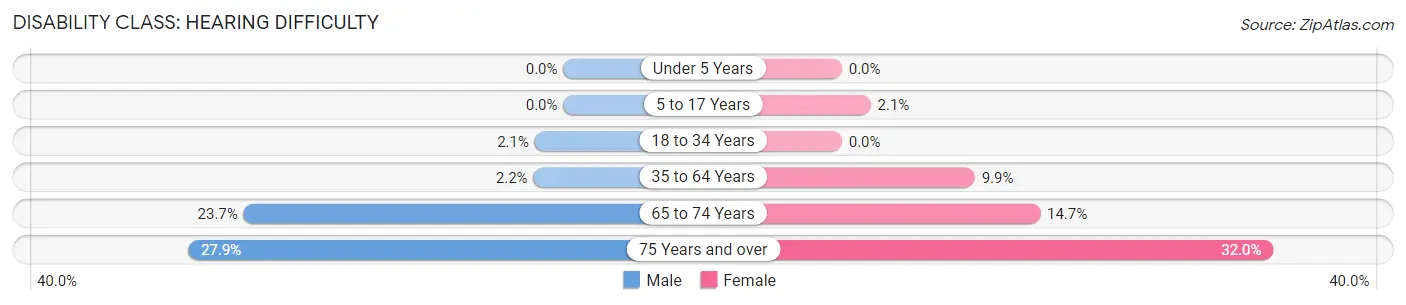
| Age Bracket | Male | Female |
| Under 5 Years | 0 (0.0%) | 0 (0.0%) |
| 5 to 17 Years | 0 (0.0%) | 7 (2.1%) |
| 18 to 34 Years | 8 (2.1%) | 0 (0.0%) |
| 35 to 64 Years | 12 (2.2%) | 54 (9.9%) |
| 65 to 74 Years | 33 (23.7%) | 34 (14.7%) |
| 75 Years and over | 34 (27.9%) | 33 (32.0%) |
Disability Class: Vision Difficulty
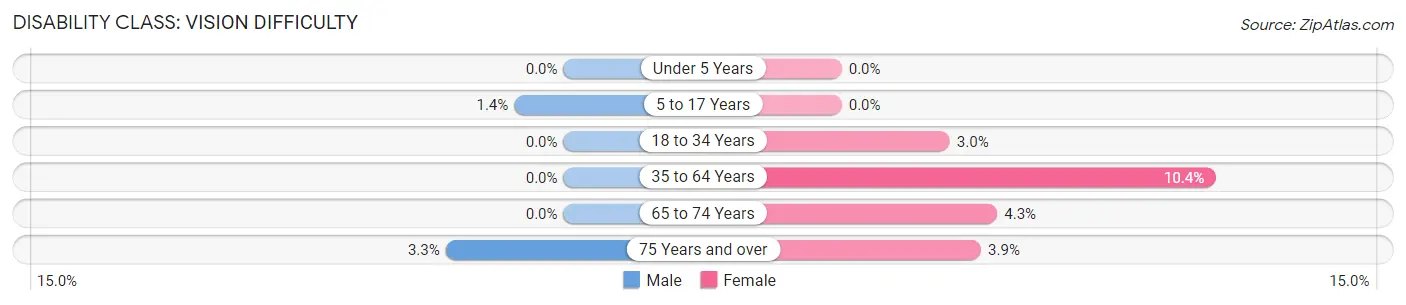
| Age Bracket | Male | Female |
| Under 5 Years | 0 (0.0%) | 0 (0.0%) |
| 5 to 17 Years | 6 (1.4%) | 0 (0.0%) |
| 18 to 34 Years | 0 (0.0%) | 9 (3.0%) |
| 35 to 64 Years | 0 (0.0%) | 57 (10.4%) |
| 65 to 74 Years | 0 (0.0%) | 10 (4.3%) |
| 75 Years and over | 4 (3.3%) | 4 (3.9%) |
Disability Class: Cognitive Difficulty
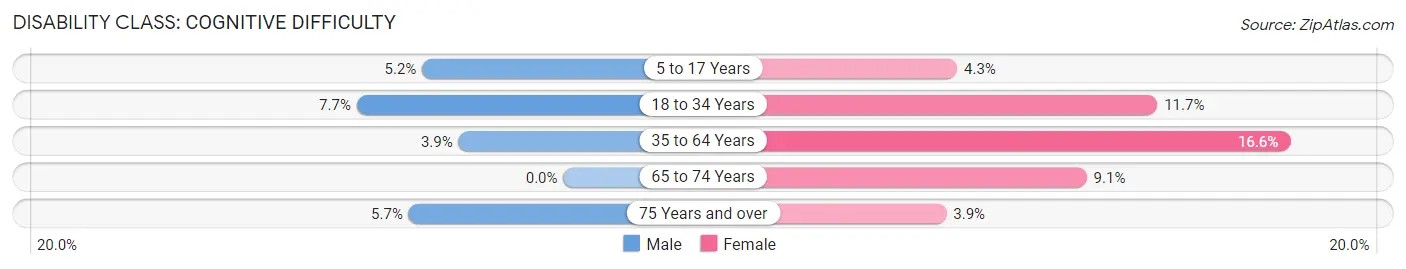
| Age Bracket | Male | Female |
| 5 to 17 Years | 23 (5.2%) | 14 (4.3%) |
| 18 to 34 Years | 29 (7.7%) | 35 (11.7%) |
| 35 to 64 Years | 21 (3.9%) | 91 (16.6%) |
| 65 to 74 Years | 0 (0.0%) | 21 (9.1%) |
| 75 Years and over | 7 (5.7%) | 4 (3.9%) |
Disability Class: Ambulatory Difficulty
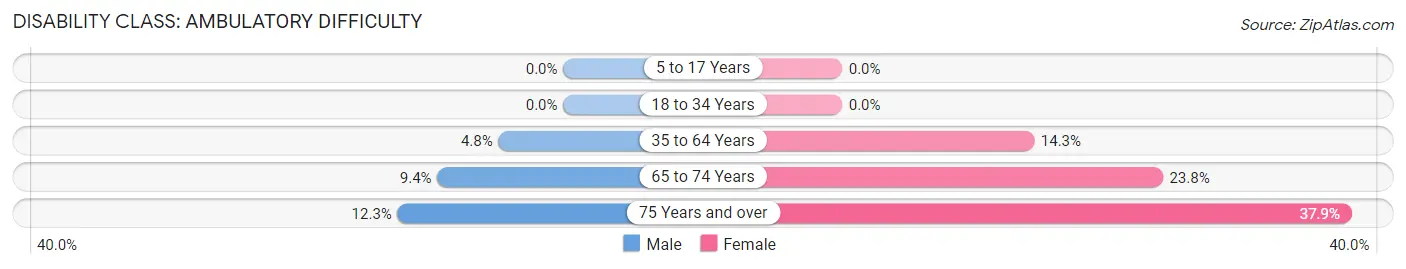
| Age Bracket | Male | Female |
| 5 to 17 Years | 0 (0.0%) | 0 (0.0%) |
| 18 to 34 Years | 0 (0.0%) | 0 (0.0%) |
| 35 to 64 Years | 26 (4.8%) | 78 (14.3%) |
| 65 to 74 Years | 13 (9.3%) | 55 (23.8%) |
| 75 Years and over | 15 (12.3%) | 39 (37.9%) |
Disability Class: Self-Care Difficulty
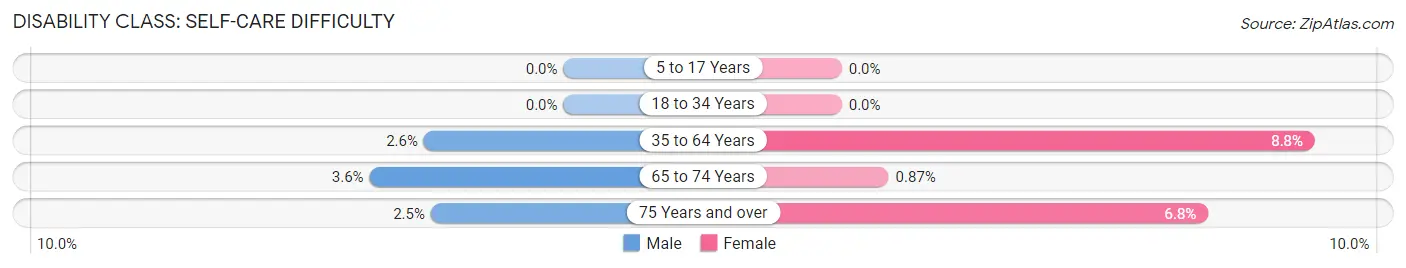
| Age Bracket | Male | Female |
| 5 to 17 Years | 0 (0.0%) | 0 (0.0%) |
| 18 to 34 Years | 0 (0.0%) | 0 (0.0%) |
| 35 to 64 Years | 14 (2.6%) | 48 (8.8%) |
| 65 to 74 Years | 5 (3.6%) | 2 (0.9%) |
| 75 Years and over | 3 (2.5%) | 7 (6.8%) |
Technology Access in Manti
Computing Device Access in Manti
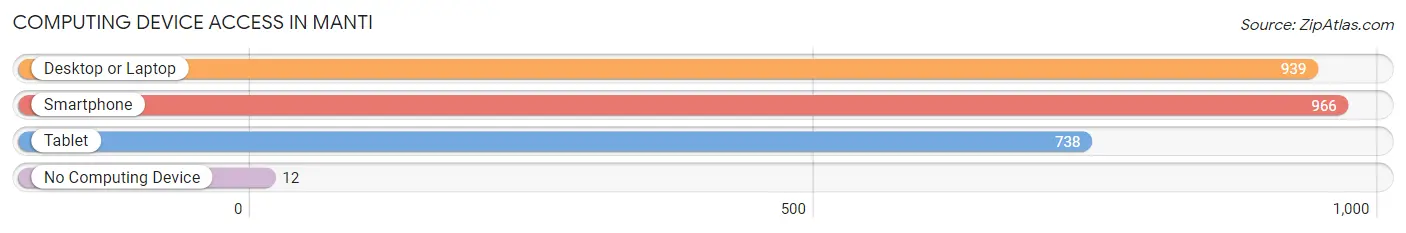
| Device Type | # Households | % Households |
| Desktop or Laptop | 939 | 89.1% |
| Smartphone | 966 | 91.6% |
| Tablet | 738 | 70.0% |
| No Computing Device | 12 | 1.1% |
| Total | 1,054 | 100.0% |
Internet Access in Manti
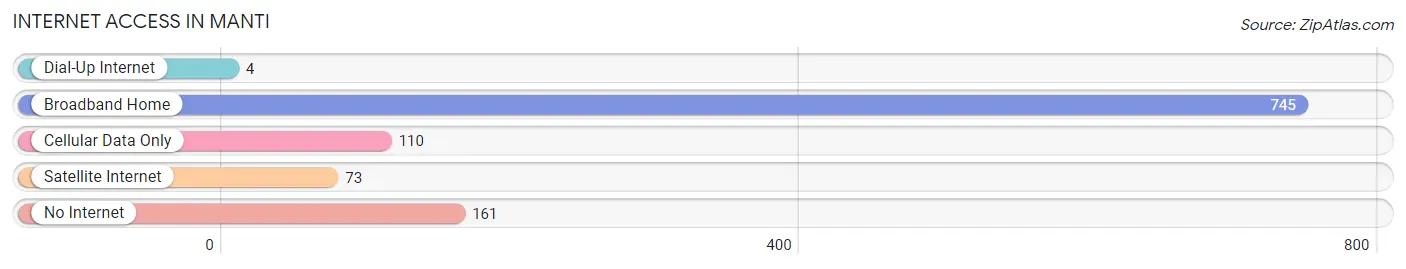
| Internet Type | # Households | % Households |
| Dial-Up Internet | 4 | 0.4% |
| Broadband Home | 745 | 70.7% |
| Cellular Data Only | 110 | 10.4% |
| Satellite Internet | 73 | 6.9% |
| No Internet | 161 | 15.3% |
| Total | 1,054 | 100.0% |
Manti Summary
Manti is a city located in Sanpete County, Utah, United States. It is the county seat of Sanpete County and is located in the central part of the state. The population of Manti was 3,040 at the 2010 census.
History
Manti was first settled in 1849 by Mormon pioneers. The city was named after the Manti Temple, which was built in the city in 1888. The temple was built by the Church of Jesus Christ of Latter-day Saints (LDS Church) and is the fourth temple built by the church.
Manti was incorporated in 1851 and has been the county seat of Sanpete County since 1852. The city has a rich history and has been the site of many important events in Utah's history. In 1857, the Utah War began when the United States Army marched into Utah to put down a rebellion by the Mormon settlers. The army camped in Manti and the city was the site of the first battle of the war.
In 1858, the Utah War ended and the LDS Church regained control of the area. In the late 1800s, Manti was a major center of the wool industry in Utah. The city was also the site of the first Mormon temple built in Utah, the Manti Temple.
Geography
Manti is located in central Utah at the base of the Wasatch Mountains. The city is situated at an elevation of 5,400 feet (1,646 m). The city is located in the Manti-La Sal National Forest and is surrounded by mountains and forests.
The city is located on the Manti-La Sal National Forest Scenic Byway, which is a scenic drive that passes through the city. The byway passes through the Manti-La Sal National Forest and offers views of the Wasatch Mountains, the Sanpete Valley, and the Manti Temple.
Economy
Manti's economy is largely based on agriculture and tourism. The city is home to several farms and ranches that produce hay, corn, wheat, and other crops. The city is also home to several tourist attractions, including the Manti Temple, the Manti-La Sal National Forest, and the Manti-La Sal National Scenic Byway.
The city is also home to several businesses, including restaurants, retail stores, and service providers. The city is also home to several manufacturing companies, including a furniture manufacturer and a plastics manufacturer.
Demographics
As of the 2010 census, the population of Manti was 3,040. The racial makeup of the city was 95.3% White, 0.3% African American, 0.3% Native American, 0.3% Asian, 0.1% Pacific Islander, 1.7% from other races, and 1.9% from two or more races. Hispanic or Latino of any race were 4.2% of the population.
The median income for a household in Manti was $37,917, and the median income for a family was $45,000. The per capita income for the city was $17,845. About 11.2% of families and 14.2% of the population were below the poverty line, including 17.2% of those under age 18 and 8.3% of those age 65 or over.
Common Questions
What is Per Capita Income in Manti?
Per Capita income in Manti is $24,148.
What is the Median Family Income in Manti?
Median Family Income in Manti is $65,852.
What is the Median Household income in Manti?
Median Household Income in Manti is $53,750.
What is Income or Wage Gap in Manti?
Income or Wage Gap in Manti is 47.8%.
Women in Manti earn 52.2 cents for every dollar earned by a man.
What is Inequality or Gini Index in Manti?
Inequality or Gini Index in Manti is 0.41.
What is the Total Population of Manti?
Total Population of Manti is 3,474.
What is the Total Male Population of Manti?
Total Male Population of Manti is 1,879.
What is the Total Female Population of Manti?
Total Female Population of Manti is 1,595.
What is the Ratio of Males per 100 Females in Manti?
There are 117.81 Males per 100 Females in Manti.
What is the Ratio of Females per 100 Males in Manti?
There are 84.89 Females per 100 Males in Manti.
What is the Median Population Age in Manti?
Median Population Age in Manti is 36.2 Years.
What is the Average Family Size in Manti
Average Family Size in Manti is 3.6 People.
What is the Average Household Size in Manti
Average Household Size in Manti is 3.1 People.
How Large is the Labor Force in Manti?
There are 1,453 People in the Labor Forcein in Manti.
What is the Percentage of People in the Labor Force in Manti?
55.6% of People are in the Labor Force in Manti.
What is the Unemployment Rate in Manti?
Unemployment Rate in Manti is 1.7%.