Smithfield, UT Map & Demographics
Smithfield Map
Smithfield Overview
$27,949
PER CAPITA INCOME
$91,343
AVG FAMILY INCOME
$87,175
AVG HOUSEHOLD INCOME
62.8%
WAGE / INCOME GAP [ % ]
37.2¢/ $1
WAGE / INCOME GAP [ $ ]
0.34
INEQUALITY / GINI INDEX
13,658
TOTAL POPULATION
6,948
MALE POPULATION
6,710
FEMALE POPULATION
103.55
MALES / 100 FEMALES
96.57
FEMALES / 100 MALES
28.0
MEDIAN AGE
3.9
AVG FAMILY SIZE
3.5
AVG HOUSEHOLD SIZE
6,171
LABOR FORCE [ PEOPLE ]
67.9%
PERCENT IN LABOR FORCE
2.7%
UNEMPLOYMENT RATE
Smithfield Zip Codes
Smithfield Area Codes
Income in Smithfield
Income Overview in Smithfield
Per Capita Income in Smithfield is $27,949, while median incomes of families and households are $91,343 and $87,175 respectively.
| Characteristic | Number | Measure |
| Per Capita Income | 13,658 | $27,949 |
| Median Family Income | 3,346 | $91,343 |
| Mean Family Income | 3,346 | $100,062 |
| Median Household Income | 3,895 | $87,175 |
| Mean Household Income | 3,895 | $95,635 |
| Income Deficit | 3,346 | $0 |
| Wage / Income Gap (%) | 13,658 | 62.83% |
| Wage / Income Gap ($) | 13,658 | 37.17¢ per $1 |
| Gini / Inequality Index | 13,658 | 0.34 |
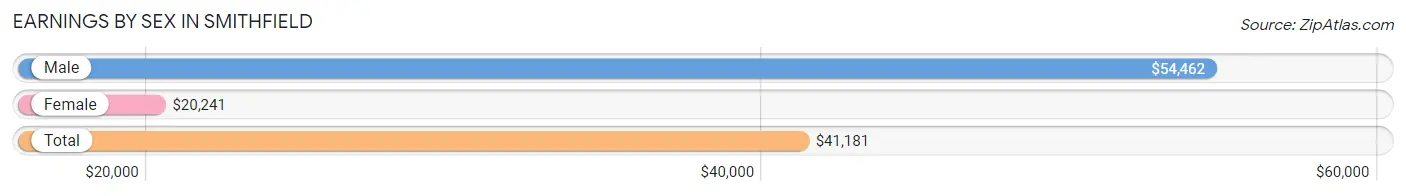
Earnings by Sex in Smithfield
Average Earnings in Smithfield are $41,181, $54,462 for men and $20,241 for women, a difference of 62.8%.
| Sex | Number | Average Earnings |
| Male | 3,627 (55.6%) | $54,462 |
| Female | 2,896 (44.4%) | $20,241 |
| Total | 6,523 (100.0%) | $41,181 |
Earnings by Sex by Income Bracket in Smithfield
The most common earnings brackets in Smithfield are $75,000 to $99,999 for men (622 | 17.2%) and $7,500 to $9,999 for women (284 | 9.8%).

| Income | Male | Female |
| $2,499 or less | 87 (2.4%) | 250 (8.6%) |
| $2,500 to $4,999 | 158 (4.4%) | 262 (9.0%) |
| $5,000 to $7,499 | 118 (3.3%) | 274 (9.5%) |
| $7,500 to $9,999 | 18 (0.5%) | 284 (9.8%) |
| $10,000 to $12,499 | 42 (1.2%) | 120 (4.1%) |
| $12,500 to $14,999 | 21 (0.6%) | 101 (3.5%) |
| $15,000 to $17,499 | 27 (0.7%) | 69 (2.4%) |
| $17,500 to $19,999 | 59 (1.6%) | 77 (2.7%) |
| $20,000 to $22,499 | 92 (2.5%) | 114 (3.9%) |
| $22,500 to $24,999 | 46 (1.3%) | 51 (1.8%) |
| $25,000 to $29,999 | 146 (4.0%) | 201 (6.9%) |
| $30,000 to $34,999 | 114 (3.1%) | 44 (1.5%) |
| $35,000 to $39,999 | 216 (6.0%) | 193 (6.7%) |
| $40,000 to $44,999 | 260 (7.2%) | 150 (5.2%) |
| $45,000 to $49,999 | 224 (6.2%) | 111 (3.8%) |
| $50,000 to $54,999 | 229 (6.3%) | 114 (3.9%) |
| $55,000 to $64,999 | 202 (5.6%) | 218 (7.5%) |
| $65,000 to $74,999 | 380 (10.5%) | 102 (3.5%) |
| $75,000 to $99,999 | 622 (17.2%) | 126 (4.3%) |
| $100,000+ | 566 (15.6%) | 35 (1.2%) |
| Total | 3,627 (100.0%) | 2,896 (100.0%) |
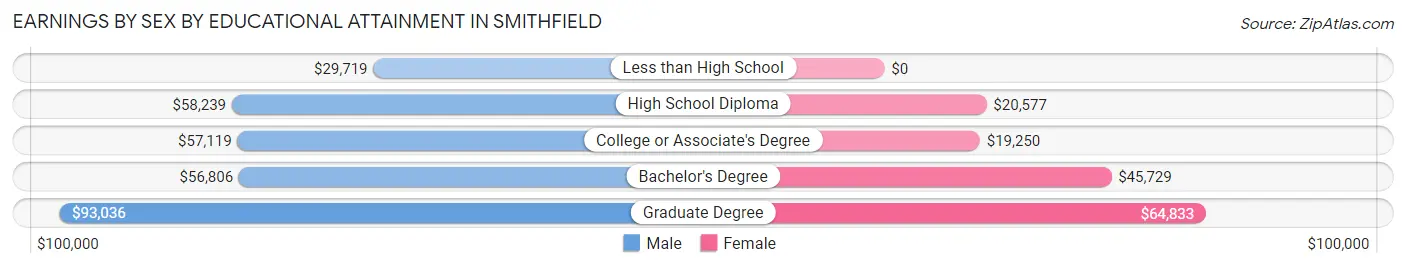
Earnings by Sex by Educational Attainment in Smithfield
Average earnings in Smithfield are $59,955 for men and $29,309 for women, a difference of 51.1%. Men with an educational attainment of graduate degree enjoy the highest average annual earnings of $93,036, while those with less than high school education earn the least with $29,719. Women with an educational attainment of graduate degree earn the most with the average annual earnings of $64,833, while those with college or associate's degree education have the smallest earnings of $19,250.
| Educational Attainment | Male Income | Female Income |
| Less than High School | $29,719 | $0 |
| High School Diploma | $58,239 | $20,577 |
| College or Associate's Degree | $57,119 | $19,250 |
| Bachelor's Degree | $56,806 | $45,729 |
| Graduate Degree | $93,036 | $64,833 |
| Total | $59,955 | $29,309 |
Family Income in Smithfield
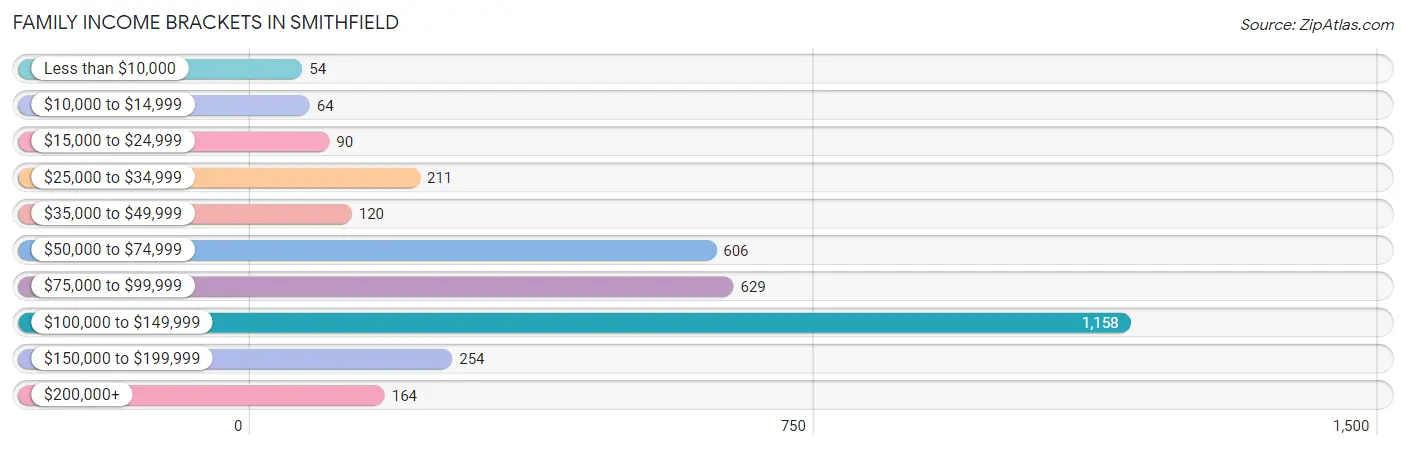
Family Income Brackets in Smithfield
According to the Smithfield family income data, there are 1,158 families falling into the $100,000 to $149,999 income range, which is the most common income bracket and makes up 34.6% of all families. Conversely, the less than $10,000 income bracket is the least frequent group with only 54 families (1.6%) belonging to this category.
| Income Bracket | # Families | % Families |
| Less than $10,000 | 54 | 1.6% |
| $10,000 to $14,999 | 64 | 1.9% |
| $15,000 to $24,999 | 90 | 2.7% |
| $25,000 to $34,999 | 211 | 6.3% |
| $35,000 to $49,999 | 120 | 3.6% |
| $50,000 to $74,999 | 606 | 18.1% |
| $75,000 to $99,999 | 629 | 18.8% |
| $100,000 to $149,999 | 1,158 | 34.6% |
| $150,000 to $199,999 | 254 | 7.6% |
| $200,000+ | 164 | 4.9% |
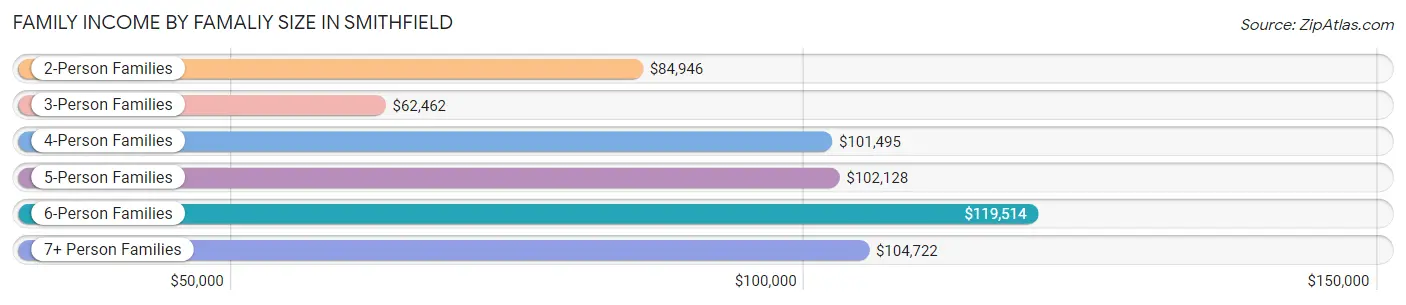
Family Income by Famaliy Size in Smithfield
6-person families (287 | 8.6%) account for the highest median family income in Smithfield with $119,514 per family, while 2-person families (1,112 | 33.2%) have the highest median income of $42,473 per family member.
| Income Bracket | # Families | Median Income |
| 2-Person Families | 1,112 (33.2%) | $84,946 |
| 3-Person Families | 663 (19.8%) | $62,462 |
| 4-Person Families | 560 (16.7%) | $101,495 |
| 5-Person Families | 498 (14.9%) | $102,128 |
| 6-Person Families | 287 (8.6%) | $119,514 |
| 7+ Person Families | 226 (6.8%) | $104,722 |
| Total | 3,346 (100.0%) | $91,343 |
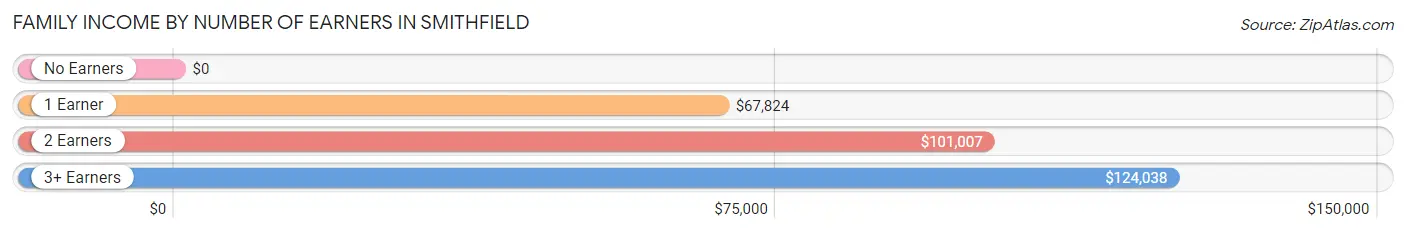
Family Income by Number of Earners in Smithfield
| Number of Earners | # Families | Median Income |
| No Earners | 289 (8.6%) | $0 |
| 1 Earner | 1,009 (30.2%) | $67,824 |
| 2 Earners | 1,502 (44.9%) | $101,007 |
| 3+ Earners | 546 (16.3%) | $124,038 |
| Total | 3,346 (100.0%) | $91,343 |
Household Income in Smithfield
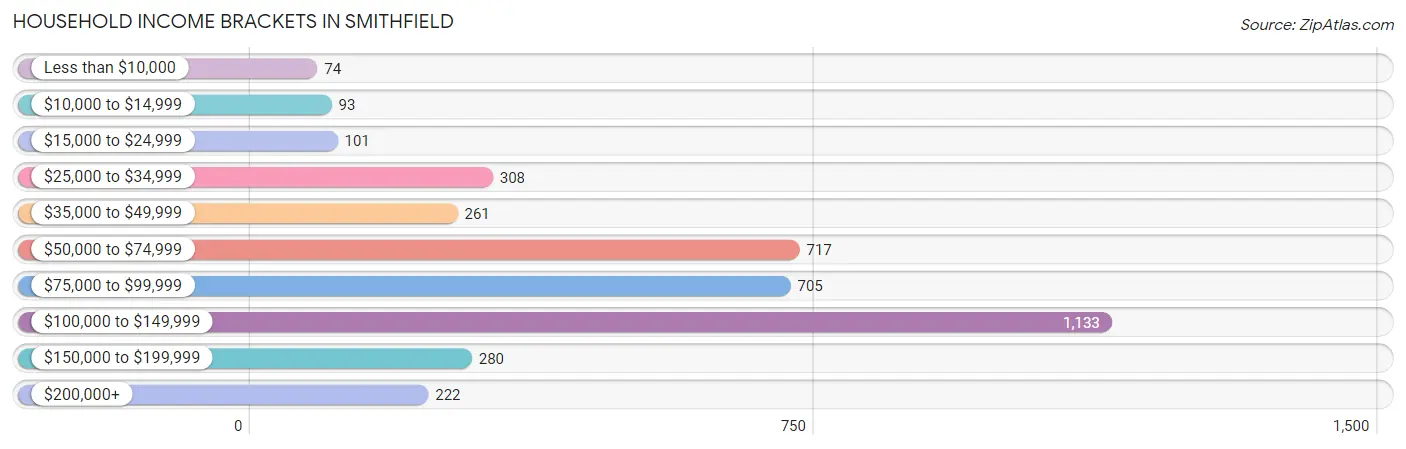
Household Income Brackets in Smithfield
With 1,133 households falling in the category, the $100,000 to $149,999 income range is the most frequent in Smithfield, accounting for 29.1% of all households. In contrast, only 74 households (1.9%) fall into the less than $10,000 income bracket, making it the least populous group.
| Income Bracket | # Households | % Households |
| Less than $10,000 | 74 | 1.9% |
| $10,000 to $14,999 | 93 | 2.4% |
| $15,000 to $24,999 | 101 | 2.6% |
| $25,000 to $34,999 | 308 | 7.9% |
| $35,000 to $49,999 | 261 | 6.7% |
| $50,000 to $74,999 | 717 | 18.4% |
| $75,000 to $99,999 | 705 | 18.1% |
| $100,000 to $149,999 | 1,133 | 29.1% |
| $150,000 to $199,999 | 280 | 7.2% |
| $200,000+ | 222 | 5.7% |
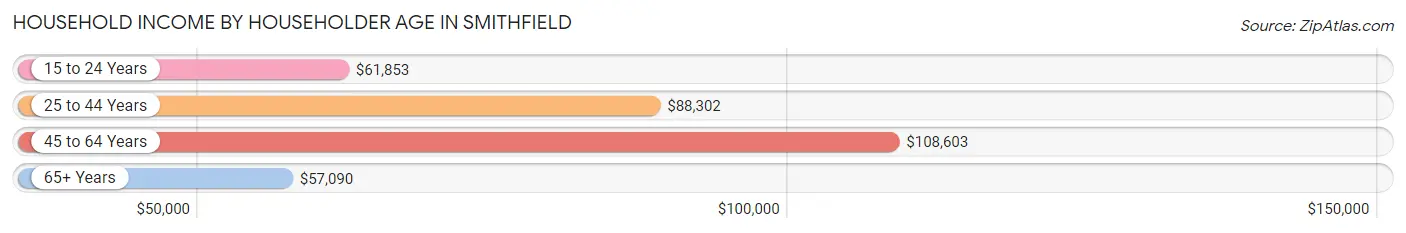
Household Income by Householder Age in Smithfield
The median household income in Smithfield is $87,175, with the highest median household income of $108,603 found in the 45 to 64 years age bracket for the primary householder. A total of 1,250 households (32.1%) fall into this category. Meanwhile, the 65+ years age bracket for the primary householder has the lowest median household income of $57,090, with 687 households (17.6%) in this group.
| Income Bracket | # Households | Median Income |
| 15 to 24 Years | 241 (6.2%) | $61,853 |
| 25 to 44 Years | 1,717 (44.1%) | $88,302 |
| 45 to 64 Years | 1,250 (32.1%) | $108,603 |
| 65+ Years | 687 (17.6%) | $57,090 |
| Total | 3,895 (100.0%) | $87,175 |
Poverty in Smithfield
Income Below Poverty by Sex and Age in Smithfield
With 7.3% poverty level for males and 7.9% for females among the residents of Smithfield, 75 year old and over males and 15 year old females are the most vulnerable to poverty, with 45 males (23.6%) and 46 females (35.7%) in their respective age groups living below the poverty level.
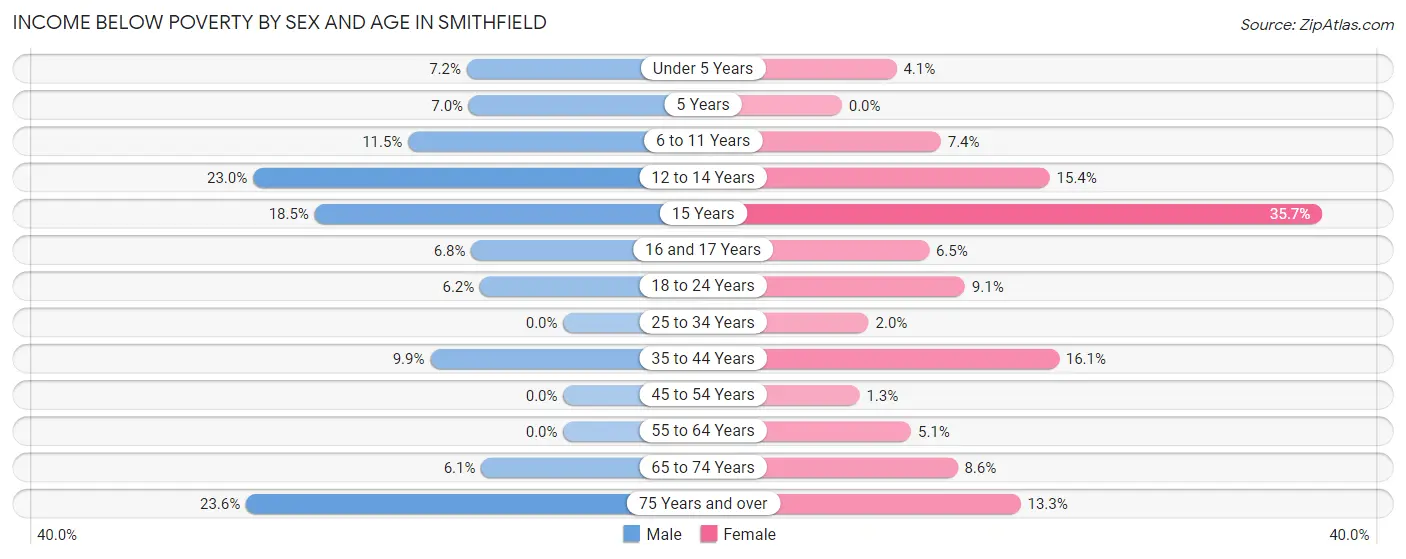
| Age Bracket | Male | Female |
| Under 5 Years | 68 (7.2%) | 25 (4.1%) |
| 5 Years | 11 (7.0%) | 0 (0.0%) |
| 6 to 11 Years | 101 (11.5%) | 62 (7.3%) |
| 12 to 14 Years | 85 (23.0%) | 52 (15.4%) |
| 15 Years | 24 (18.5%) | 46 (35.7%) |
| 16 and 17 Years | 17 (6.8%) | 13 (6.5%) |
| 18 to 24 Years | 39 (6.2%) | 63 (9.1%) |
| 25 to 34 Years | 0 (0.0%) | 20 (2.0%) |
| 35 to 44 Years | 97 (9.9%) | 139 (16.1%) |
| 45 to 54 Years | 0 (0.0%) | 8 (1.3%) |
| 55 to 64 Years | 0 (0.0%) | 32 (5.1%) |
| 65 to 74 Years | 21 (6.1%) | 31 (8.6%) |
| 75 Years and over | 45 (23.6%) | 39 (13.3%) |
| Total | 508 (7.3%) | 530 (7.9%) |
Income Above Poverty by Sex and Age in Smithfield
According to the poverty statistics in Smithfield, males aged 25 to 34 years and females aged 5 years are the age groups that are most secure financially, with 100.0% of males and 100.0% of females in these age groups living above the poverty line.
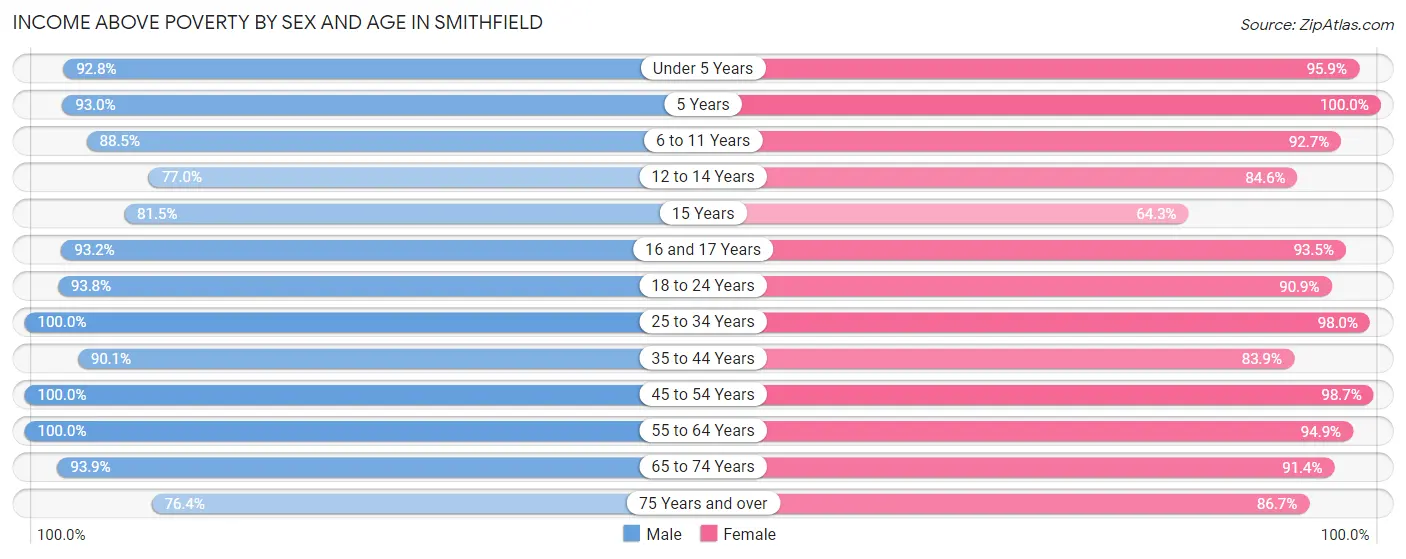
| Age Bracket | Male | Female |
| Under 5 Years | 881 (92.8%) | 591 (95.9%) |
| 5 Years | 146 (93.0%) | 131 (100.0%) |
| 6 to 11 Years | 776 (88.5%) | 781 (92.6%) |
| 12 to 14 Years | 284 (77.0%) | 285 (84.6%) |
| 15 Years | 106 (81.5%) | 83 (64.3%) |
| 16 and 17 Years | 232 (93.2%) | 188 (93.5%) |
| 18 to 24 Years | 592 (93.8%) | 626 (90.9%) |
| 25 to 34 Years | 945 (100.0%) | 983 (98.0%) |
| 35 to 44 Years | 885 (90.1%) | 724 (83.9%) |
| 45 to 54 Years | 437 (100.0%) | 605 (98.7%) |
| 55 to 64 Years | 661 (100.0%) | 591 (94.9%) |
| 65 to 74 Years | 324 (93.9%) | 330 (91.4%) |
| 75 Years and over | 146 (76.4%) | 255 (86.7%) |
| Total | 6,415 (92.7%) | 6,173 (92.1%) |
Income Below Poverty Among Married-Couple Families in Smithfield
The poverty statistics for married-couple families in Smithfield show that 4.5% or 134 of the total 2,992 families live below the poverty line. Families with 5 or more children have the highest poverty rate of 37.4%, comprising of 55 families. On the other hand, families with 3 or 4 children have the lowest poverty rate of 0.0%, which includes 0 families.
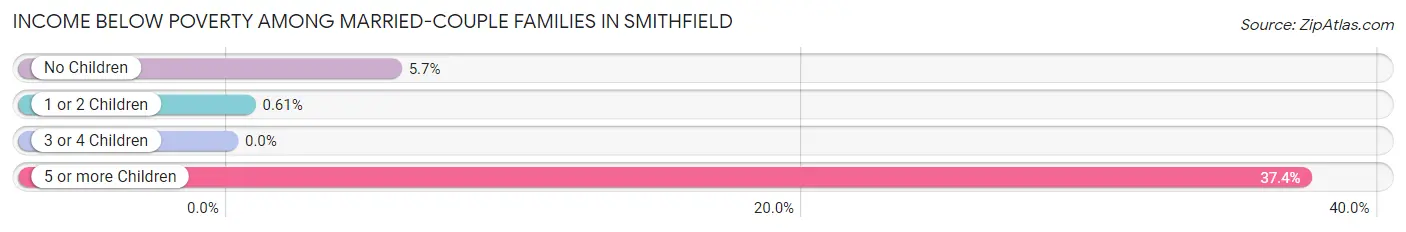
| Children | Above Poverty | Below Poverty |
| No Children | 1,207 (94.3%) | 73 (5.7%) |
| 1 or 2 Children | 985 (99.4%) | 6 (0.6%) |
| 3 or 4 Children | 574 (100.0%) | 0 (0.0%) |
| 5 or more Children | 92 (62.6%) | 55 (37.4%) |
| Total | 2,858 (95.5%) | 134 (4.5%) |
Income Below Poverty Among Single-Parent Households in Smithfield
According to the poverty data in Smithfield, 15.6% or 22 single-father households and 25.4% or 54 single-mother households are living below the poverty line. Among single-father households, those with 1 or 2 children have the highest poverty rate, with 22 households (21.8%) experiencing poverty. Likewise, among single-mother households, those with 1 or 2 children have the highest poverty rate, with 54 households (51.9%) falling below the poverty line.
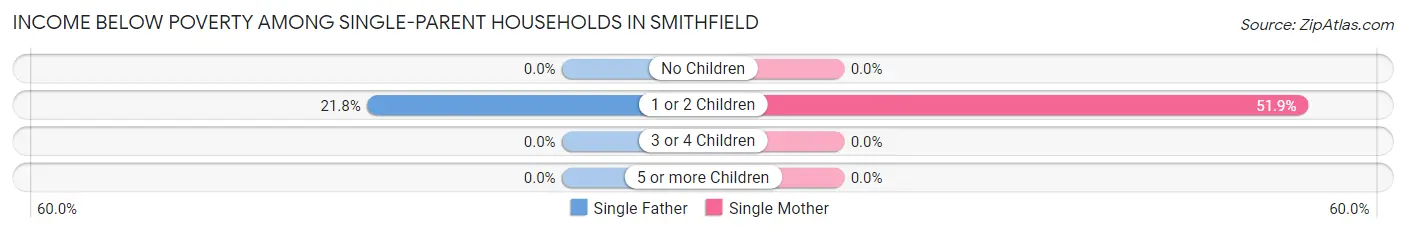
| Children | Single Father | Single Mother |
| No Children | 0 (0.0%) | 0 (0.0%) |
| 1 or 2 Children | 22 (21.8%) | 54 (51.9%) |
| 3 or 4 Children | 0 (0.0%) | 0 (0.0%) |
| 5 or more Children | 0 (0.0%) | 0 (0.0%) |
| Total | 22 (15.6%) | 54 (25.4%) |
Income Below Poverty Among Married-Couple vs Single-Parent Households in Smithfield
The poverty data for Smithfield shows that 134 of the married-couple family households (4.5%) and 76 of the single-parent households (21.5%) are living below the poverty level. Within the married-couple family households, those with 5 or more children have the highest poverty rate, with 55 households (37.4%) falling below the poverty line. Among the single-parent households, those with 1 or 2 children have the highest poverty rate, with 76 household (37.1%) living below poverty.
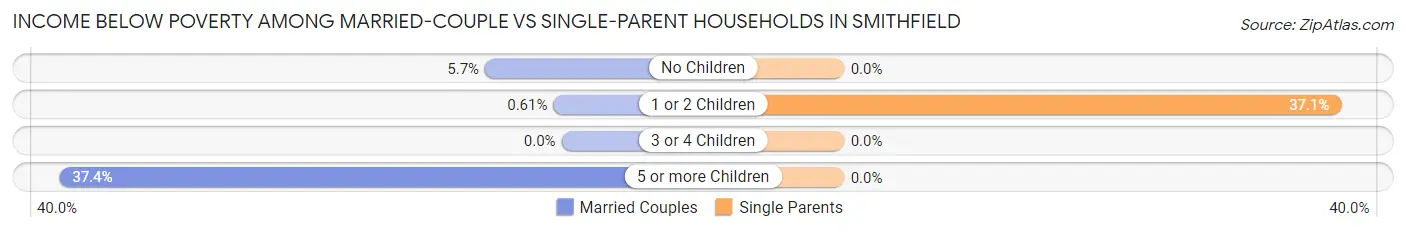
| Children | Married-Couple Families | Single-Parent Households |
| No Children | 73 (5.7%) | 0 (0.0%) |
| 1 or 2 Children | 6 (0.6%) | 76 (37.1%) |
| 3 or 4 Children | 0 (0.0%) | 0 (0.0%) |
| 5 or more Children | 55 (37.4%) | 0 (0.0%) |
| Total | 134 (4.5%) | 76 (21.5%) |
Race in Smithfield
The most populous races in Smithfield are White / Caucasian (12,370 | 90.6%), Hispanic or Latino (1,131 | 8.3%), and Some other Race (605 | 4.4%).
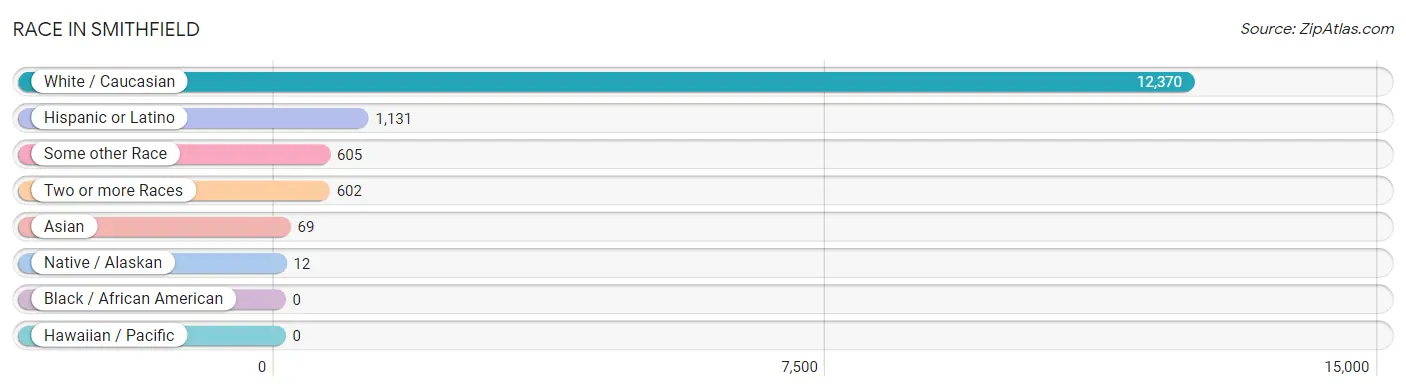
| Race | # Population | % Population |
| Asian | 69 | 0.5% |
| Black / African American | 0 | 0.0% |
| Hawaiian / Pacific | 0 | 0.0% |
| Hispanic or Latino | 1,131 | 8.3% |
| Native / Alaskan | 12 | 0.1% |
| White / Caucasian | 12,370 | 90.6% |
| Two or more Races | 602 | 4.4% |
| Some other Race | 605 | 4.4% |
| Total | 13,658 | 100.0% |
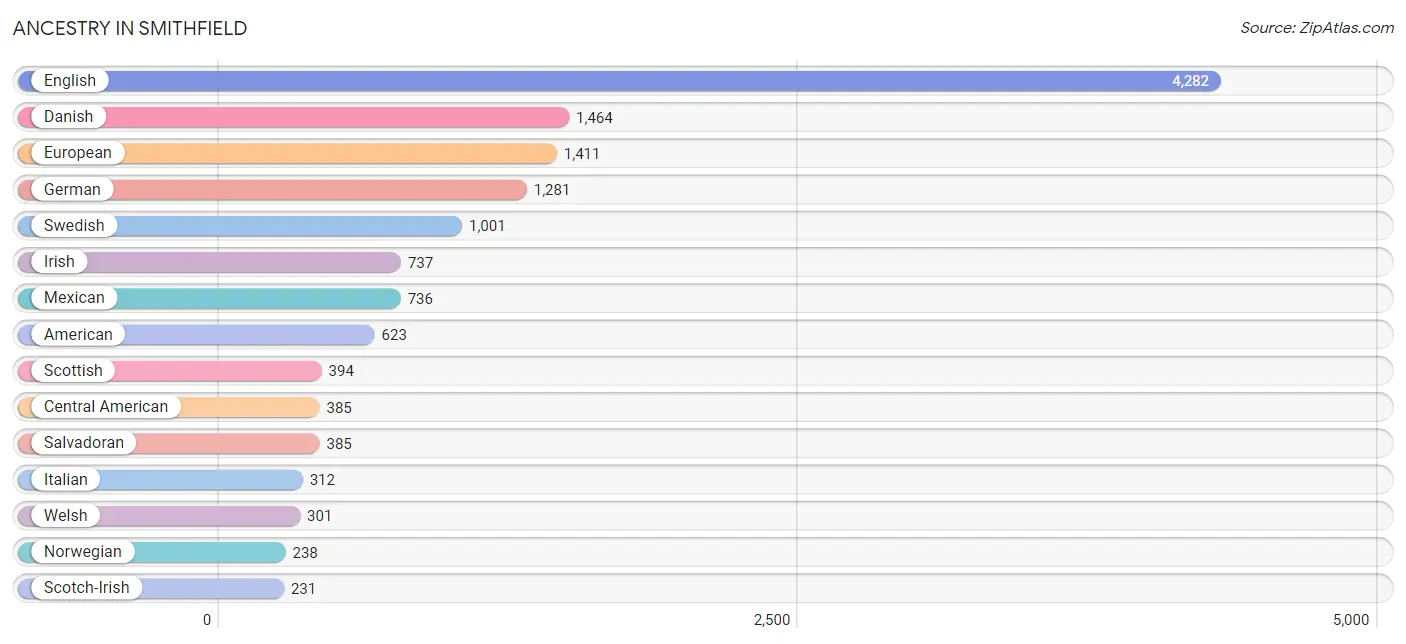
Ancestry in Smithfield
The most populous ancestries reported in Smithfield are English (4,282 | 31.4%), Danish (1,464 | 10.7%), European (1,411 | 10.3%), German (1,281 | 9.4%), and Swedish (1,001 | 7.3%), together accounting for 69.1% of all Smithfield residents.
| Ancestry | # Population | % Population |
| American | 623 | 4.6% |
| Arab | 131 | 1.0% |
| Australian | 33 | 0.2% |
| Austrian | 18 | 0.1% |
| Basque | 6 | 0.0% |
| British | 117 | 0.9% |
| Burmese | 37 | 0.3% |
| Canadian | 83 | 0.6% |
| Central American | 385 | 2.8% |
| Czech | 84 | 0.6% |
| Danish | 1,464 | 10.7% |
| Dutch | 117 | 0.9% |
| English | 4,282 | 31.4% |
| European | 1,411 | 10.3% |
| Finnish | 42 | 0.3% |
| French | 112 | 0.8% |
| German | 1,281 | 9.4% |
| Greek | 65 | 0.5% |
| Indian (Asian) | 17 | 0.1% |
| Irish | 737 | 5.4% |
| Italian | 312 | 2.3% |
| Mexican | 736 | 5.4% |
| Norwegian | 238 | 1.7% |
| Peruvian | 10 | 0.1% |
| Polish | 113 | 0.8% |
| Russian | 35 | 0.3% |
| Salvadoran | 385 | 2.8% |
| Scandinavian | 51 | 0.4% |
| Scotch-Irish | 231 | 1.7% |
| Scottish | 394 | 2.9% |
| Shoshone | 34 | 0.3% |
| Slovak | 30 | 0.2% |
| South African | 11 | 0.1% |
| South American | 10 | 0.1% |
| Subsaharan African | 11 | 0.1% |
| Swedish | 1,001 | 7.3% |
| Swiss | 182 | 1.3% |
| Thai | 39 | 0.3% |
| Welsh | 301 | 2.2% | View All 39 Rows |
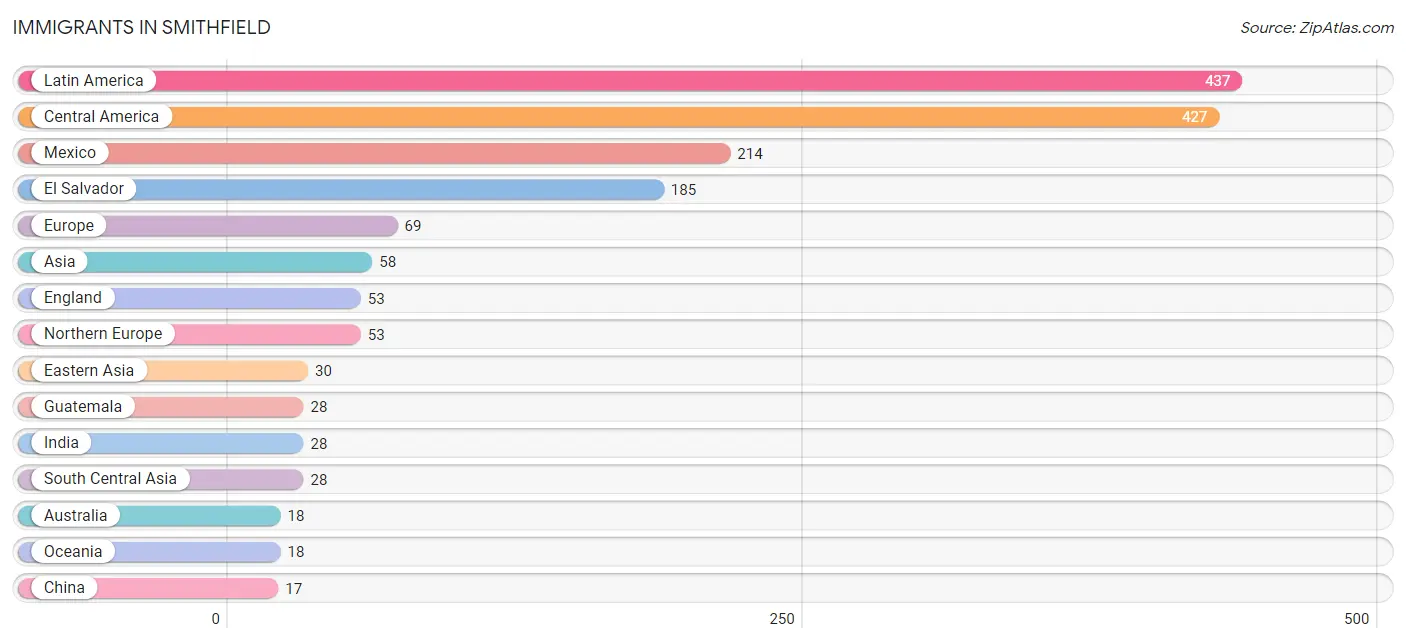
Immigrants in Smithfield
The most numerous immigrant groups reported in Smithfield came from Latin America (437 | 3.2%), Central America (427 | 3.1%), Mexico (214 | 1.6%), El Salvador (185 | 1.3%), and Europe (69 | 0.5%), together accounting for 9.8% of all Smithfield residents.
| Immigration Origin | # Population | % Population |
| Asia | 58 | 0.4% |
| Australia | 18 | 0.1% |
| Central America | 427 | 3.1% |
| China | 17 | 0.1% |
| Eastern Asia | 30 | 0.2% |
| El Salvador | 185 | 1.3% |
| England | 53 | 0.4% |
| Europe | 69 | 0.5% |
| Germany | 10 | 0.1% |
| Guatemala | 28 | 0.2% |
| India | 28 | 0.2% |
| Korea | 13 | 0.1% |
| Latin America | 437 | 3.2% |
| Mexico | 214 | 1.6% |
| Netherlands | 6 | 0.0% |
| Northern Europe | 53 | 0.4% |
| Oceania | 18 | 0.1% |
| Peru | 10 | 0.1% |
| South America | 10 | 0.1% |
| South Central Asia | 28 | 0.2% |
| Western Europe | 16 | 0.1% | View All 21 Rows |
Sex and Age in Smithfield
Sex and Age in Smithfield
The most populous age groups in Smithfield are Under 5 Years (949 | 13.7%) for men and 5 to 9 Years (758 | 11.3%) for women.
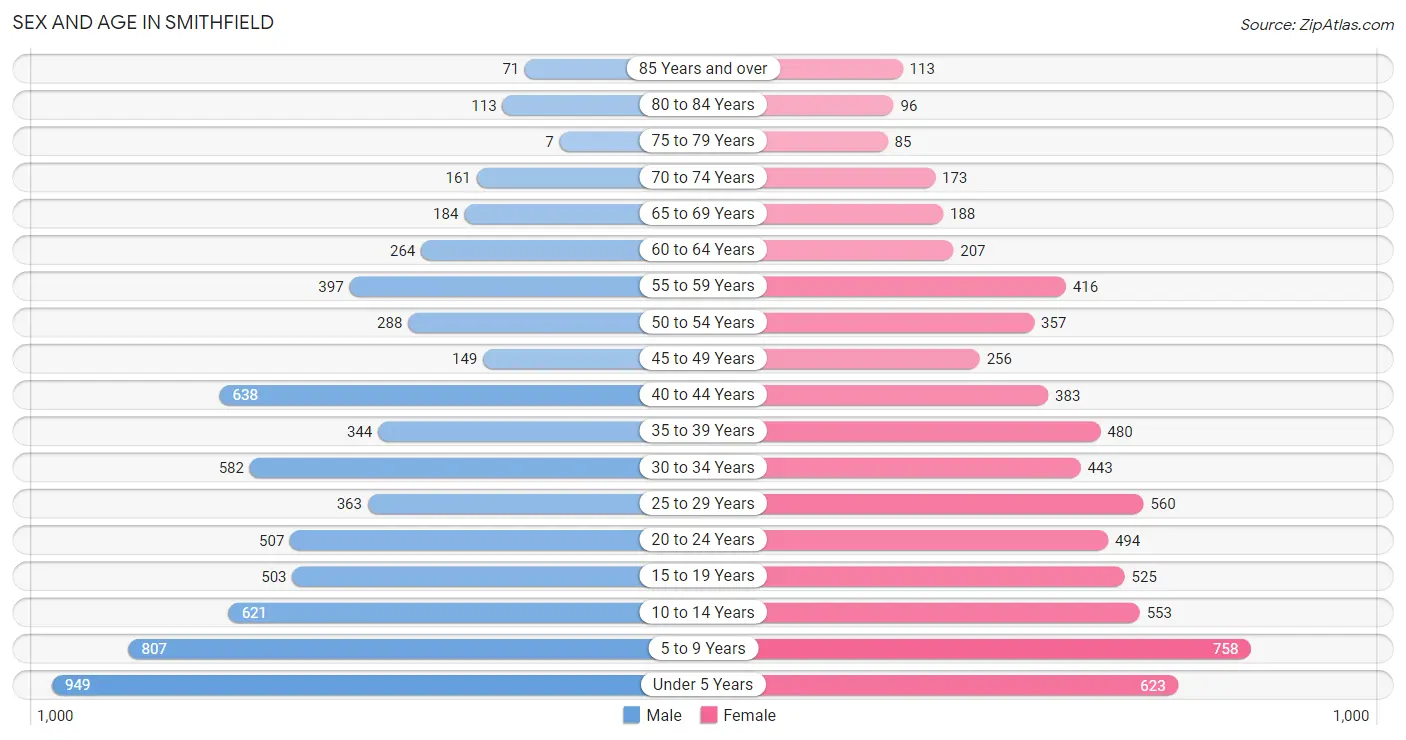
| Age Bracket | Male | Female |
| Under 5 Years | 949 (13.7%) | 623 (9.3%) |
| 5 to 9 Years | 807 (11.6%) | 758 (11.3%) |
| 10 to 14 Years | 621 (8.9%) | 553 (8.2%) |
| 15 to 19 Years | 503 (7.2%) | 525 (7.8%) |
| 20 to 24 Years | 507 (7.3%) | 494 (7.4%) |
| 25 to 29 Years | 363 (5.2%) | 560 (8.4%) |
| 30 to 34 Years | 582 (8.4%) | 443 (6.6%) |
| 35 to 39 Years | 344 (5.0%) | 480 (7.1%) |
| 40 to 44 Years | 638 (9.2%) | 383 (5.7%) |
| 45 to 49 Years | 149 (2.1%) | 256 (3.8%) |
| 50 to 54 Years | 288 (4.2%) | 357 (5.3%) |
| 55 to 59 Years | 397 (5.7%) | 416 (6.2%) |
| 60 to 64 Years | 264 (3.8%) | 207 (3.1%) |
| 65 to 69 Years | 184 (2.6%) | 188 (2.8%) |
| 70 to 74 Years | 161 (2.3%) | 173 (2.6%) |
| 75 to 79 Years | 7 (0.1%) | 85 (1.3%) |
| 80 to 84 Years | 113 (1.6%) | 96 (1.4%) |
| 85 Years and over | 71 (1.0%) | 113 (1.7%) |
| Total | 6,948 (100.0%) | 6,710 (100.0%) |
Families and Households in Smithfield
Median Family Size in Smithfield
The median family size in Smithfield is 3.87 persons per family, with married-couple families (2,992 | 89.4%) accounting for the largest median family size of 3.96 persons per family. On the other hand, single female/mother families (213 | 6.4%) represent the smallest median family size with 2.91 persons per family.
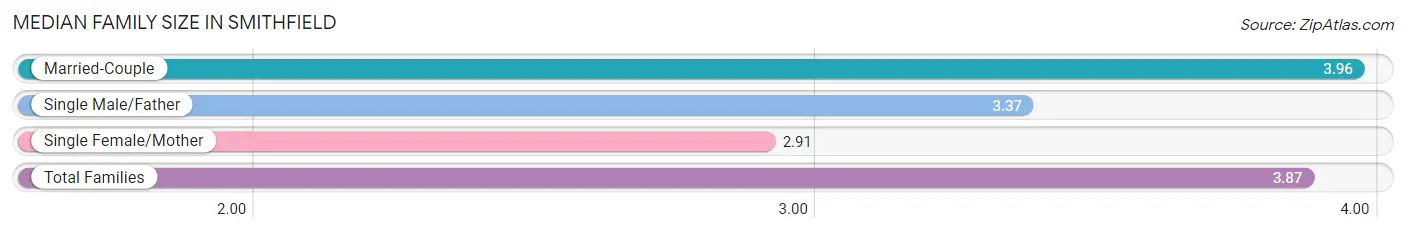
| Family Type | # Families | Family Size |
| Married-Couple | 2,992 (89.4%) | 3.96 |
| Single Male/Father | 141 (4.2%) | 3.37 |
| Single Female/Mother | 213 (6.4%) | 2.91 |
| Total Families | 3,346 (100.0%) | 3.87 |
Median Household Size in Smithfield
The median household size in Smithfield is 3.51 persons per household, with married-couple households (2,992 | 76.8%) accounting for the largest median household size of 3.98 persons per household. non-family households (549 | 14.1%) represent the smallest median household size with 1.05 persons per household.
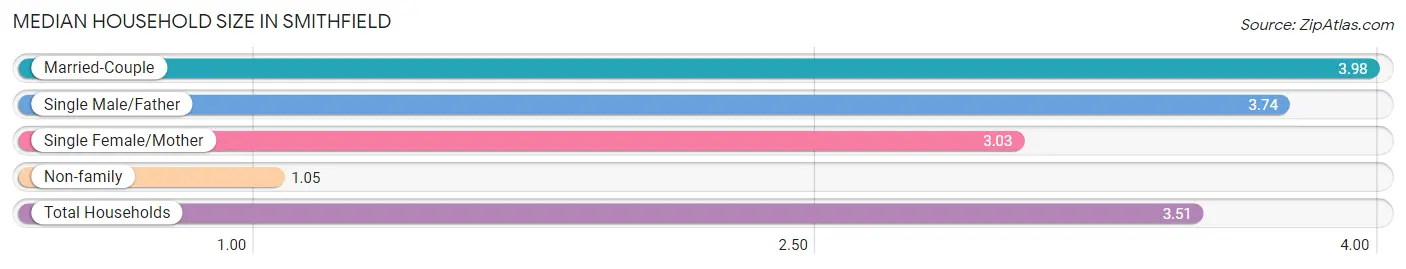
| Household Type | # Households | Household Size |
| Married-Couple | 2,992 (76.8%) | 3.98 |
| Single Male/Father | 141 (3.6%) | 3.74 |
| Single Female/Mother | 213 (5.5%) | 3.03 |
| Non-family | 549 (14.1%) | 1.05 |
| Total Households | 3,895 (100.0%) | 3.51 |
Household Size by Marriage Status in Smithfield
Out of a total of 3,895 households in Smithfield, 3,346 (85.9%) are family households, while 549 (14.1%) are nonfamily households. The most numerous type of family households are 2-person households, comprising 1,040, and the most common type of nonfamily households are 1-person households, comprising 520.
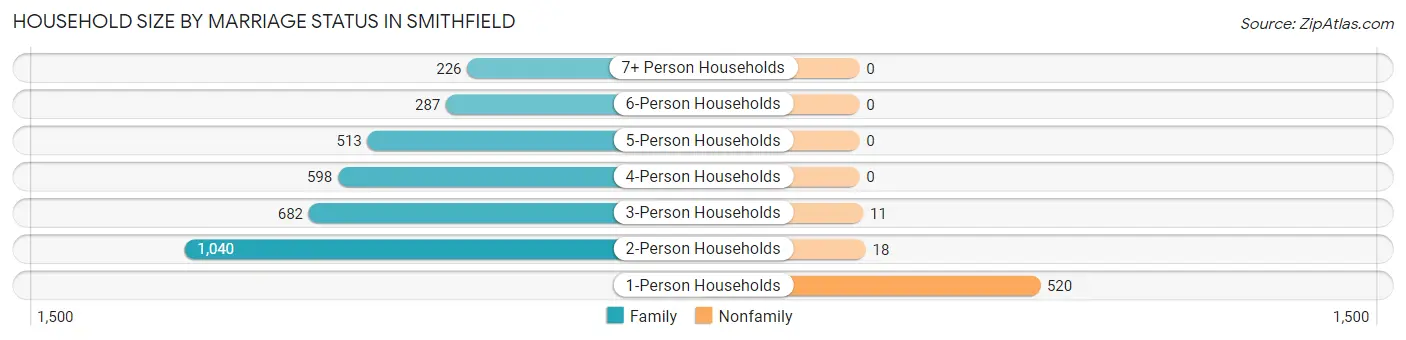
| Household Size | Family Households | Nonfamily Households |
| 1-Person Households | - | 520 (13.4%) |
| 2-Person Households | 1,040 (26.7%) | 18 (0.5%) |
| 3-Person Households | 682 (17.5%) | 11 (0.3%) |
| 4-Person Households | 598 (15.3%) | 0 (0.0%) |
| 5-Person Households | 513 (13.2%) | 0 (0.0%) |
| 6-Person Households | 287 (7.4%) | 0 (0.0%) |
| 7+ Person Households | 226 (5.8%) | 0 (0.0%) |
| Total | 3,346 (85.9%) | 549 (14.1%) |
Female Fertility in Smithfield
Fertility by Age in Smithfield
Average fertility rate in Smithfield is 125.0 births per 1,000 women. Women in the age bracket of 20 to 34 years have the highest fertility rate with 216.0 births per 1,000 women. Women in the age bracket of 20 to 34 years acount for 80.2% of all women with births.
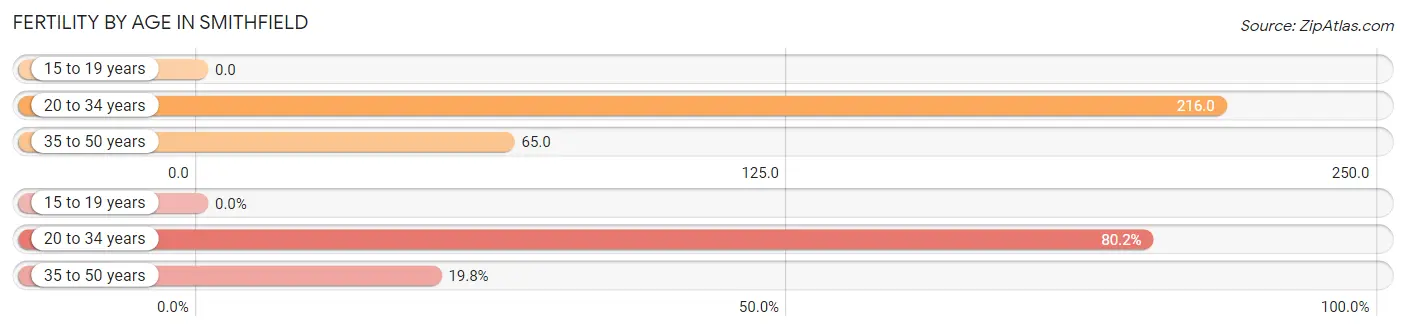
| Age Bracket | Women with Births | Births / 1,000 Women |
| 15 to 19 years | 0 (0.0%) | 0.0 |
| 20 to 34 years | 324 (80.2%) | 216.0 |
| 35 to 50 years | 80 (19.8%) | 65.0 |
| Total | 404 (100.0%) | 125.0 |
Fertility by Age by Marriage Status in Smithfield
93.8% of women with births (404) in Smithfield are married. The highest percentage of unmarried women with births falls into 35 to 50 years age bracket with 31.2% of them unmarried at the time of birth, while the lowest percentage of unmarried women with births belong to 20 to 34 years age bracket with 0.0% of them unmarried.
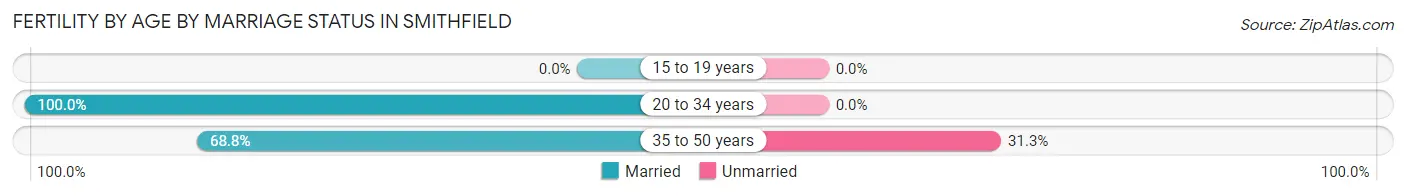
| Age Bracket | Married | Unmarried |
| 15 to 19 years | 0 (0.0%) | 0 (0.0%) |
| 20 to 34 years | 324 (100.0%) | 0 (0.0%) |
| 35 to 50 years | 55 (68.8%) | 25 (31.2%) |
| Total | 379 (93.8%) | 25 (6.2%) |
Fertility by Education in Smithfield
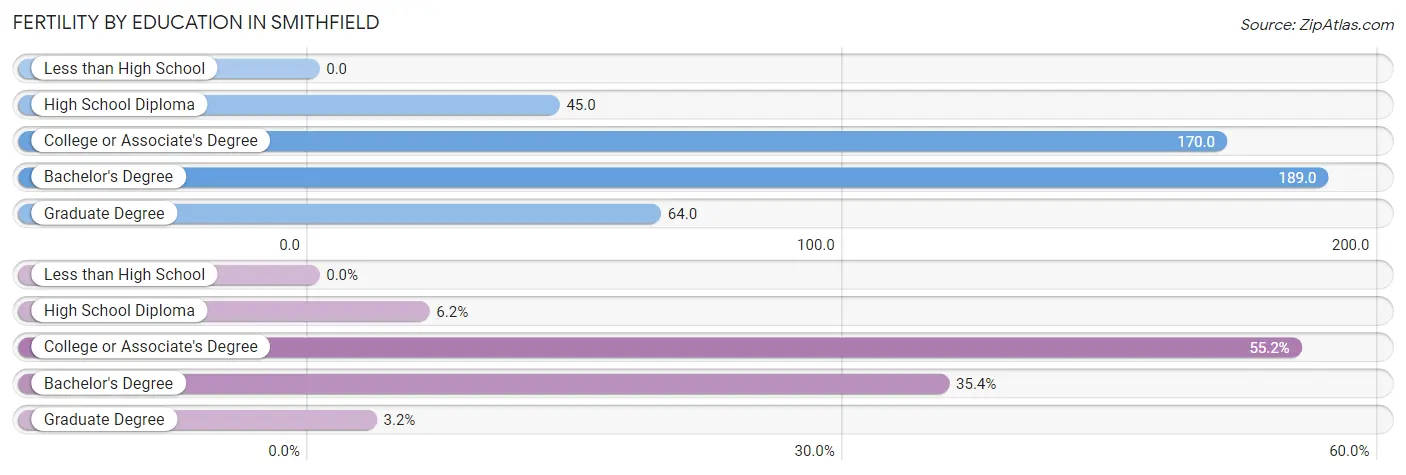
| Educational Attainment | Women with Births | Births / 1,000 Women |
| Less than High School | 0 (0.0%) | 0.0 |
| High School Diploma | 25 (6.2%) | 45.0 |
| College or Associate's Degree | 223 (55.2%) | 170.0 |
| Bachelor's Degree | 143 (35.4%) | 189.0 |
| Graduate Degree | 13 (3.2%) | 64.0 |
| Total | 404 (100.0%) | 125.0 |
Fertility by Education by Marriage Status in Smithfield
6.2% of women with births in Smithfield are unmarried. Women with the educational attainment of college or associate's degree are most likely to be married with 100.0% of them married at childbirth, while women with the educational attainment of high school diploma are least likely to be married with 100.0% of them unmarried at childbirth.
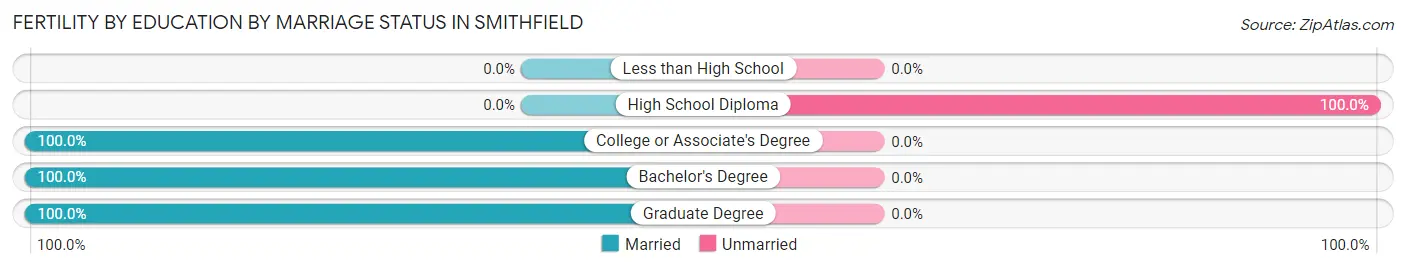
| Educational Attainment | Married | Unmarried |
| Less than High School | 0 (0.0%) | 0 (0.0%) |
| High School Diploma | 0 (0.0%) | 25 (100.0%) |
| College or Associate's Degree | 223 (100.0%) | 0 (0.0%) |
| Bachelor's Degree | 143 (100.0%) | 0 (0.0%) |
| Graduate Degree | 13 (100.0%) | 0 (0.0%) |
| Total | 379 (93.8%) | 25 (6.2%) |
Employment Characteristics in Smithfield
Employment by Class of Employer in Smithfield
Among the 5,833 employed individuals in Smithfield, private company employees (3,755 | 64.4%), local government employees (521 | 8.9%), and not-for-profit organizations (502 | 8.6%) make up the most common classes of employment.
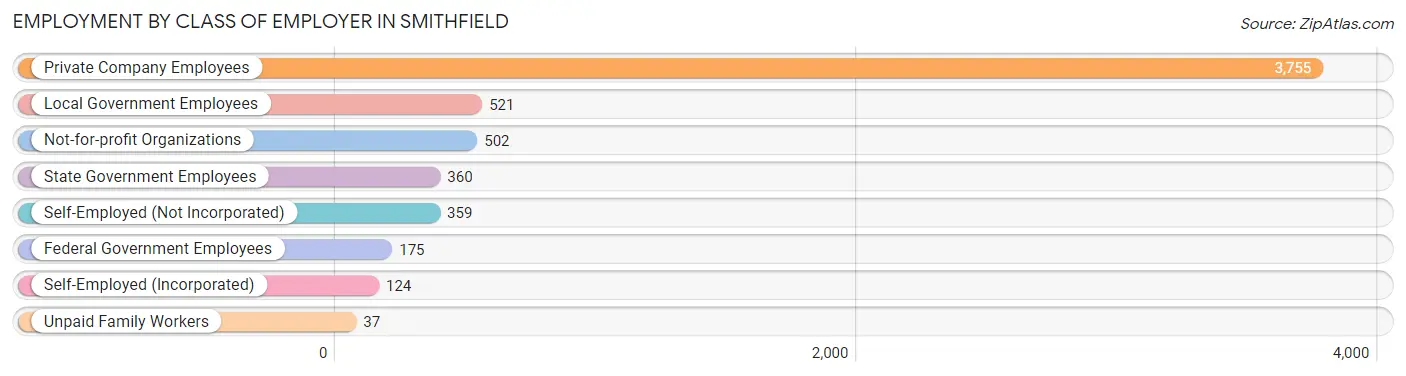
| Employer Class | # Employees | % Employees |
| Private Company Employees | 3,755 | 64.4% |
| Self-Employed (Incorporated) | 124 | 2.1% |
| Self-Employed (Not Incorporated) | 359 | 6.1% |
| Not-for-profit Organizations | 502 | 8.6% |
| Local Government Employees | 521 | 8.9% |
| State Government Employees | 360 | 6.2% |
| Federal Government Employees | 175 | 3.0% |
| Unpaid Family Workers | 37 | 0.6% |
| Total | 5,833 | 100.0% |
Employment Status by Age in Smithfield
According to the labor force statistics for Smithfield, out of the total population over 16 years of age (9,088), 67.9% or 6,171 individuals are in the labor force, with 2.7% or 167 of them unemployed. The age group with the highest labor force participation rate is 35 to 44 years, with 85.3% or 1,574 individuals in the labor force. Within the labor force, the 55 to 59 years age range has the highest percentage of unemployed individuals, with 7.9% or 52 of them being unemployed.
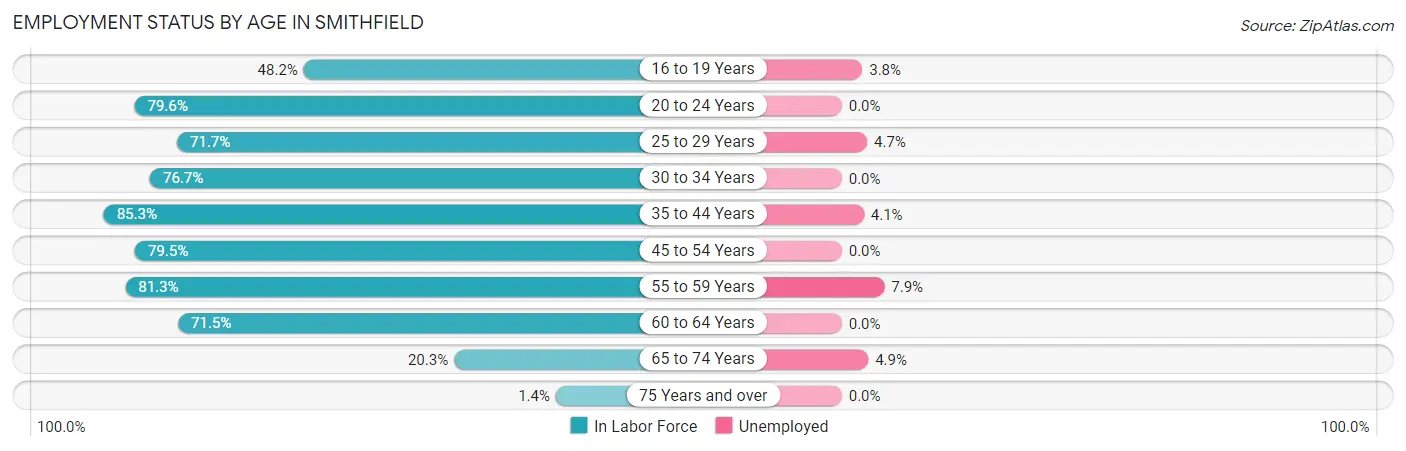
| Age Bracket | In Labor Force | Unemployed |
| 16 to 19 Years | 371 (48.2%) | 14 (3.8%) |
| 20 to 24 Years | 797 (79.6%) | 0 (0.0%) |
| 25 to 29 Years | 662 (71.7%) | 31 (4.7%) |
| 30 to 34 Years | 786 (76.7%) | 0 (0.0%) |
| 35 to 44 Years | 1,574 (85.3%) | 65 (4.1%) |
| 45 to 54 Years | 835 (79.5%) | 0 (0.0%) |
| 55 to 59 Years | 661 (81.3%) | 52 (7.9%) |
| 60 to 64 Years | 337 (71.5%) | 0 (0.0%) |
| 65 to 74 Years | 143 (20.3%) | 7 (4.9%) |
| 75 Years and over | 7 (1.4%) | 0 (0.0%) |
| Total | 6,171 (67.9%) | 167 (2.7%) |
Employment Status by Educational Attainment in Smithfield
According to labor force statistics for Smithfield, 79.2% of individuals (4,853) out of the total population between 25 and 64 years of age (6,127) are in the labor force, with 3.0% or 146 of them being unemployed. The group with the highest labor force participation rate are those with the educational attainment of bachelor's degree or higher, with 84.2% or 2,286 individuals in the labor force. Within the labor force, individuals with high school diploma education have the highest percentage of unemployment, with 5.7% or 46 of them being unemployed.
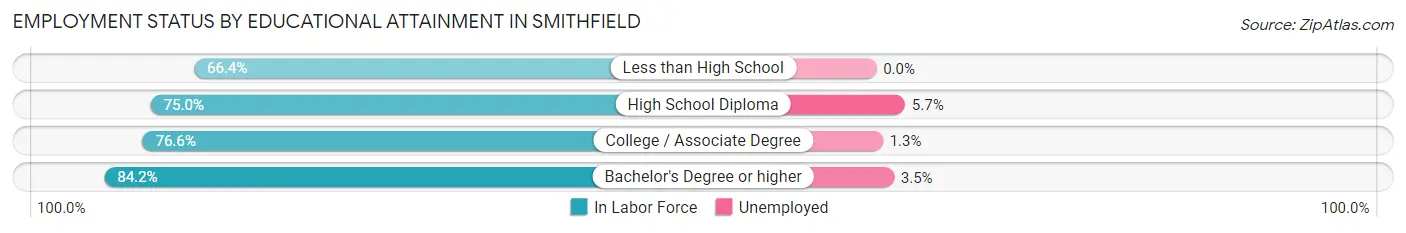
| Educational Attainment | In Labor Force | Unemployed |
| Less than High School | 170 (66.4%) | 0 (0.0%) |
| High School Diploma | 808 (75.0%) | 61 (5.7%) |
| College / Associate Degree | 1,592 (76.6%) | 27 (1.3%) |
| Bachelor's Degree or higher | 2,286 (84.2%) | 95 (3.5%) |
| Total | 4,853 (79.2%) | 184 (3.0%) |
Employment Occupations by Sex in Smithfield
Management, Business, Science and Arts Occupations
The most common Management, Business, Science and Arts occupations in Smithfield are Community & Social Service (799 | 13.3%), Computers, Engineering & Science (623 | 10.4%), Education Instruction & Library (531 | 8.8%), Management (466 | 7.8%), and Computers & Mathematics (348 | 5.8%).
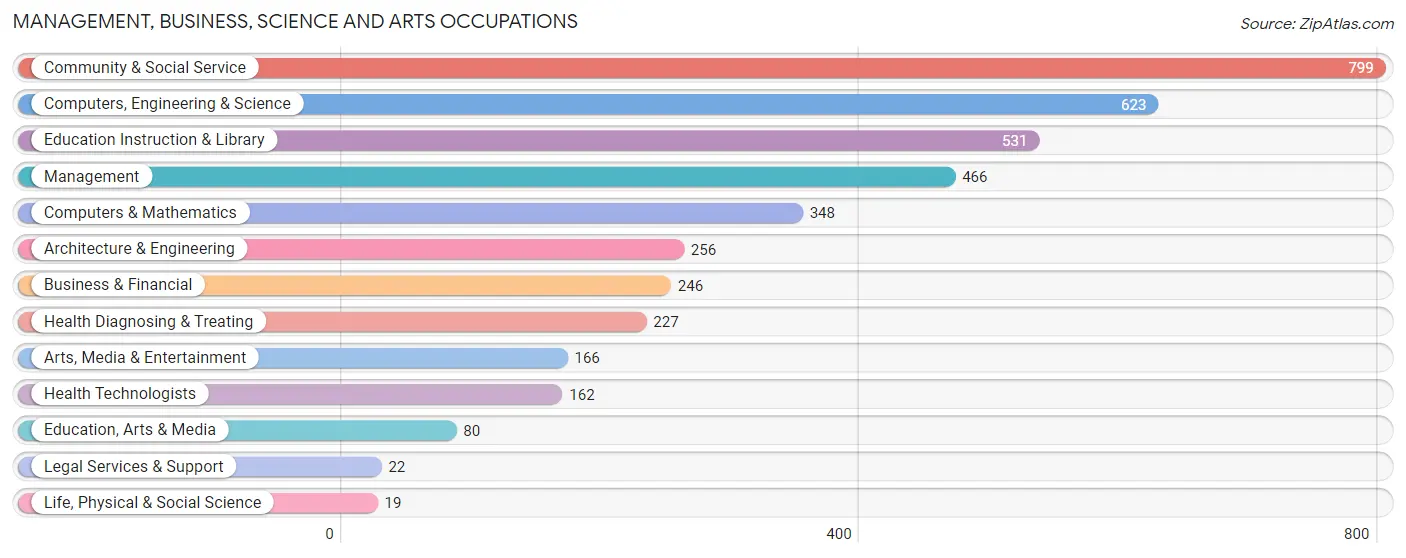
Management, Business, Science and Arts Occupations by Sex
Within the Management, Business, Science and Arts occupations in Smithfield, the most male-oriented occupations are Architecture & Engineering (100.0%), Legal Services & Support (100.0%), and Computers, Engineering & Science (89.9%), while the most female-oriented occupations are Education Instruction & Library (78.3%), Health Diagnosing & Treating (74.5%), and Community & Social Service (70.2%).
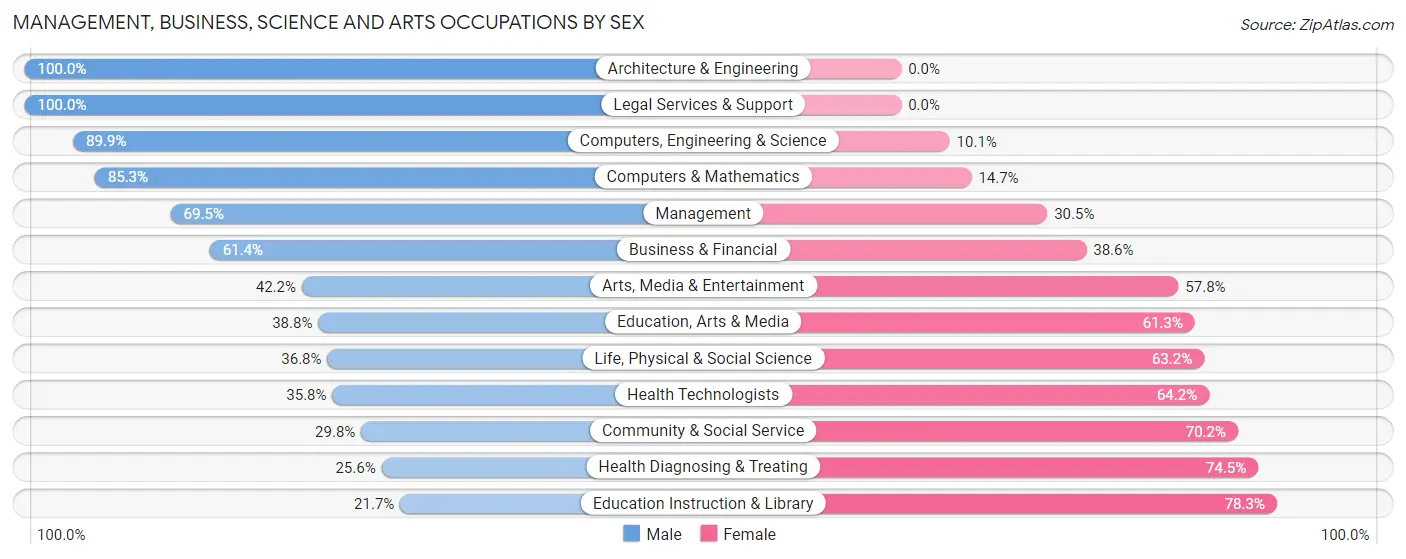
| Occupation | Male | Female |
| Management | 324 (69.5%) | 142 (30.5%) |
| Business & Financial | 151 (61.4%) | 95 (38.6%) |
| Computers, Engineering & Science | 560 (89.9%) | 63 (10.1%) |
| Computers & Mathematics | 297 (85.3%) | 51 (14.7%) |
| Architecture & Engineering | 256 (100.0%) | 0 (0.0%) |
| Life, Physical & Social Science | 7 (36.8%) | 12 (63.2%) |
| Community & Social Service | 238 (29.8%) | 561 (70.2%) |
| Education, Arts & Media | 31 (38.8%) | 49 (61.3%) |
| Legal Services & Support | 22 (100.0%) | 0 (0.0%) |
| Education Instruction & Library | 115 (21.7%) | 416 (78.3%) |
| Arts, Media & Entertainment | 70 (42.2%) | 96 (57.8%) |
| Health Diagnosing & Treating | 58 (25.6%) | 169 (74.5%) |
| Health Technologists | 58 (35.8%) | 104 (64.2%) |
| Total (Category) | 1,331 (56.4%) | 1,030 (43.6%) |
| Total (Overall) | 3,441 (57.3%) | 2,564 (42.7%) |
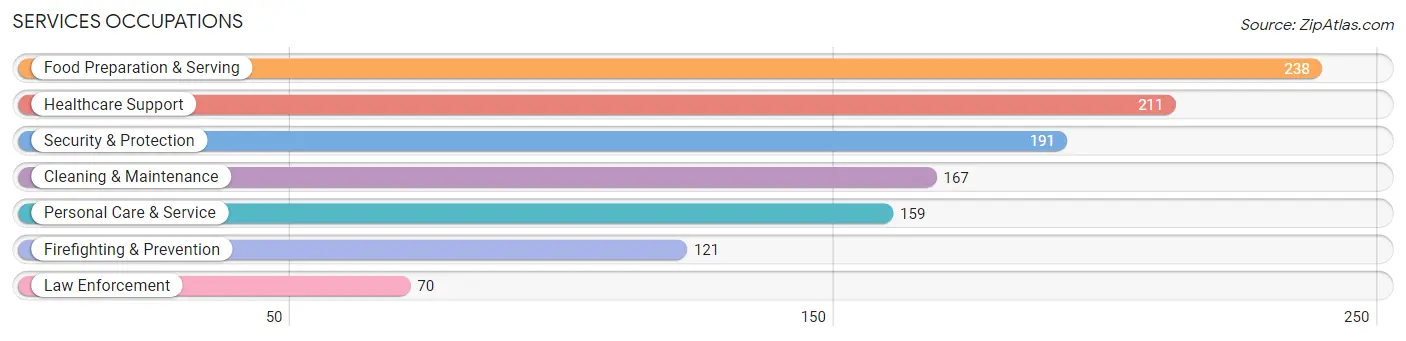
Services Occupations
The most common Services occupations in Smithfield are Food Preparation & Serving (238 | 4.0%), Healthcare Support (211 | 3.5%), Security & Protection (191 | 3.2%), Cleaning & Maintenance (167 | 2.8%), and Personal Care & Service (159 | 2.6%).
Services Occupations by Sex
Within the Services occupations in Smithfield, the most male-oriented occupations are Cleaning & Maintenance (85.0%), Law Enforcement (70.0%), and Security & Protection (64.4%), while the most female-oriented occupations are Personal Care & Service (85.5%), Healthcare Support (84.8%), and Food Preparation & Serving (83.6%).
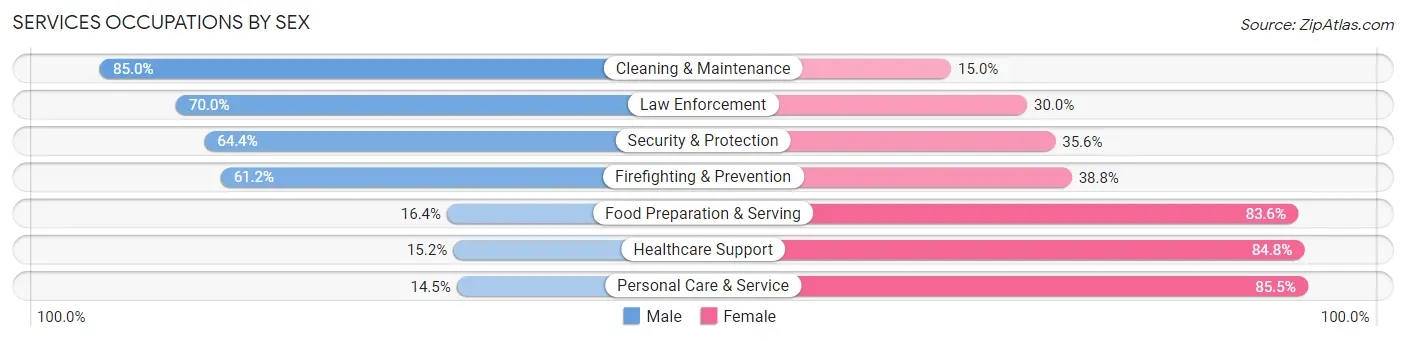
| Occupation | Male | Female |
| Healthcare Support | 32 (15.2%) | 179 (84.8%) |
| Security & Protection | 123 (64.4%) | 68 (35.6%) |
| Firefighting & Prevention | 74 (61.2%) | 47 (38.8%) |
| Law Enforcement | 49 (70.0%) | 21 (30.0%) |
| Food Preparation & Serving | 39 (16.4%) | 199 (83.6%) |
| Cleaning & Maintenance | 142 (85.0%) | 25 (15.0%) |
| Personal Care & Service | 23 (14.5%) | 136 (85.5%) |
| Total (Category) | 359 (37.2%) | 607 (62.8%) |
| Total (Overall) | 3,441 (57.3%) | 2,564 (42.7%) |
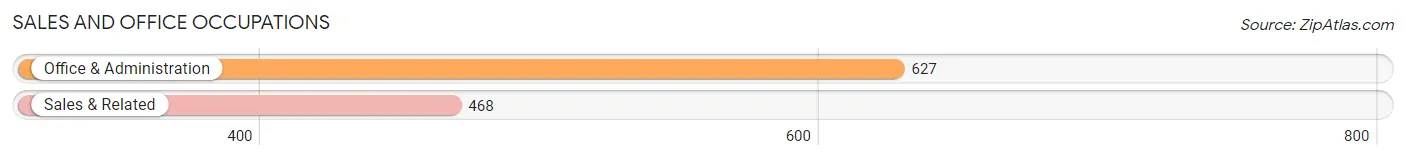
Sales and Office Occupations
The most common Sales and Office occupations in Smithfield are Office & Administration (627 | 10.4%), and Sales & Related (468 | 7.8%).
Sales and Office Occupations by Sex
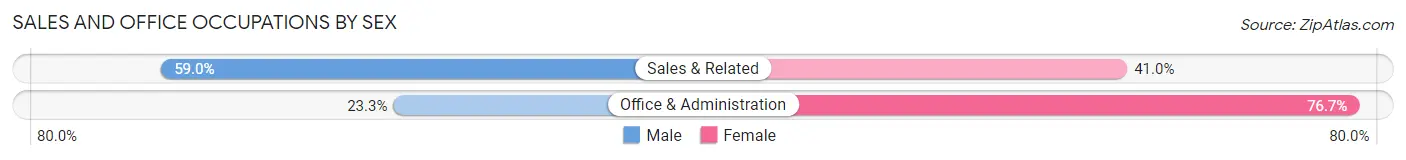
| Occupation | Male | Female |
| Sales & Related | 276 (59.0%) | 192 (41.0%) |
| Office & Administration | 146 (23.3%) | 481 (76.7%) |
| Total (Category) | 422 (38.5%) | 673 (61.5%) |
| Total (Overall) | 3,441 (57.3%) | 2,564 (42.7%) |
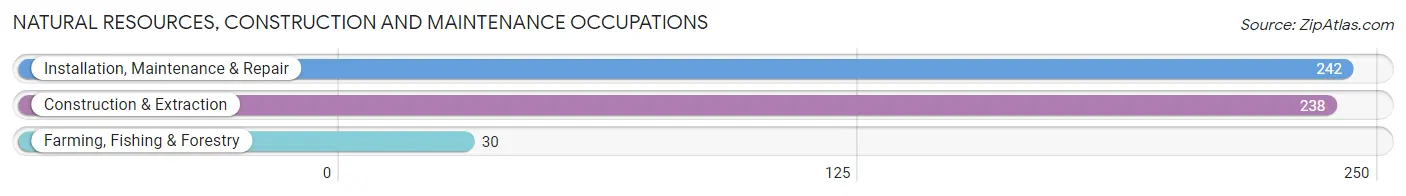
Natural Resources, Construction and Maintenance Occupations
The most common Natural Resources, Construction and Maintenance occupations in Smithfield are Installation, Maintenance & Repair (242 | 4.0%), Construction & Extraction (238 | 4.0%), and Farming, Fishing & Forestry (30 | 0.5%).
Natural Resources, Construction and Maintenance Occupations by Sex
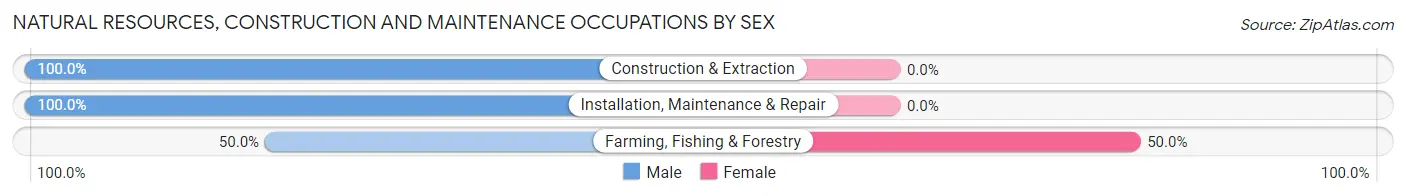
| Occupation | Male | Female |
| Farming, Fishing & Forestry | 15 (50.0%) | 15 (50.0%) |
| Construction & Extraction | 238 (100.0%) | 0 (0.0%) |
| Installation, Maintenance & Repair | 242 (100.0%) | 0 (0.0%) |
| Total (Category) | 495 (97.1%) | 15 (2.9%) |
| Total (Overall) | 3,441 (57.3%) | 2,564 (42.7%) |
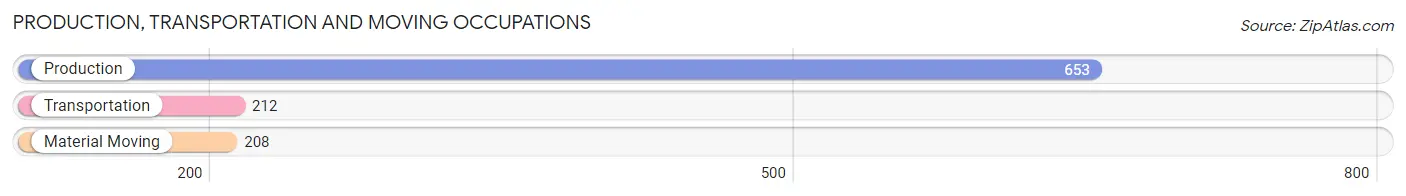
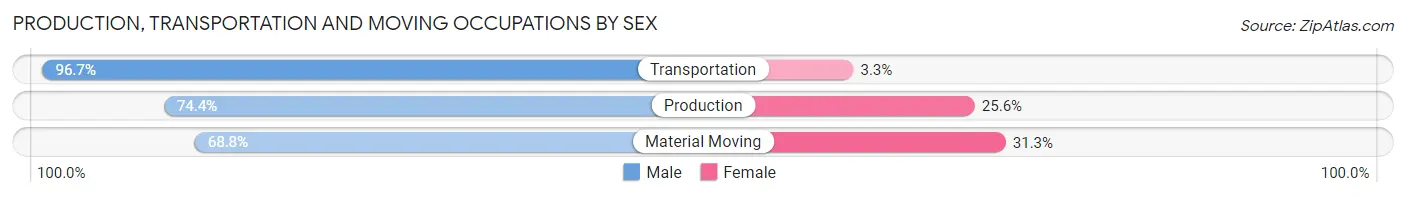
Production, Transportation and Moving Occupations
The most common Production, Transportation and Moving occupations in Smithfield are Production (653 | 10.9%), Transportation (212 | 3.5%), and Material Moving (208 | 3.5%).
Production, Transportation and Moving Occupations by Sex
| Occupation | Male | Female |
| Production | 486 (74.4%) | 167 (25.6%) |
| Transportation | 205 (96.7%) | 7 (3.3%) |
| Material Moving | 143 (68.8%) | 65 (31.2%) |
| Total (Category) | 834 (77.7%) | 239 (22.3%) |
| Total (Overall) | 3,441 (57.3%) | 2,564 (42.7%) |
Employment Industries by Sex in Smithfield
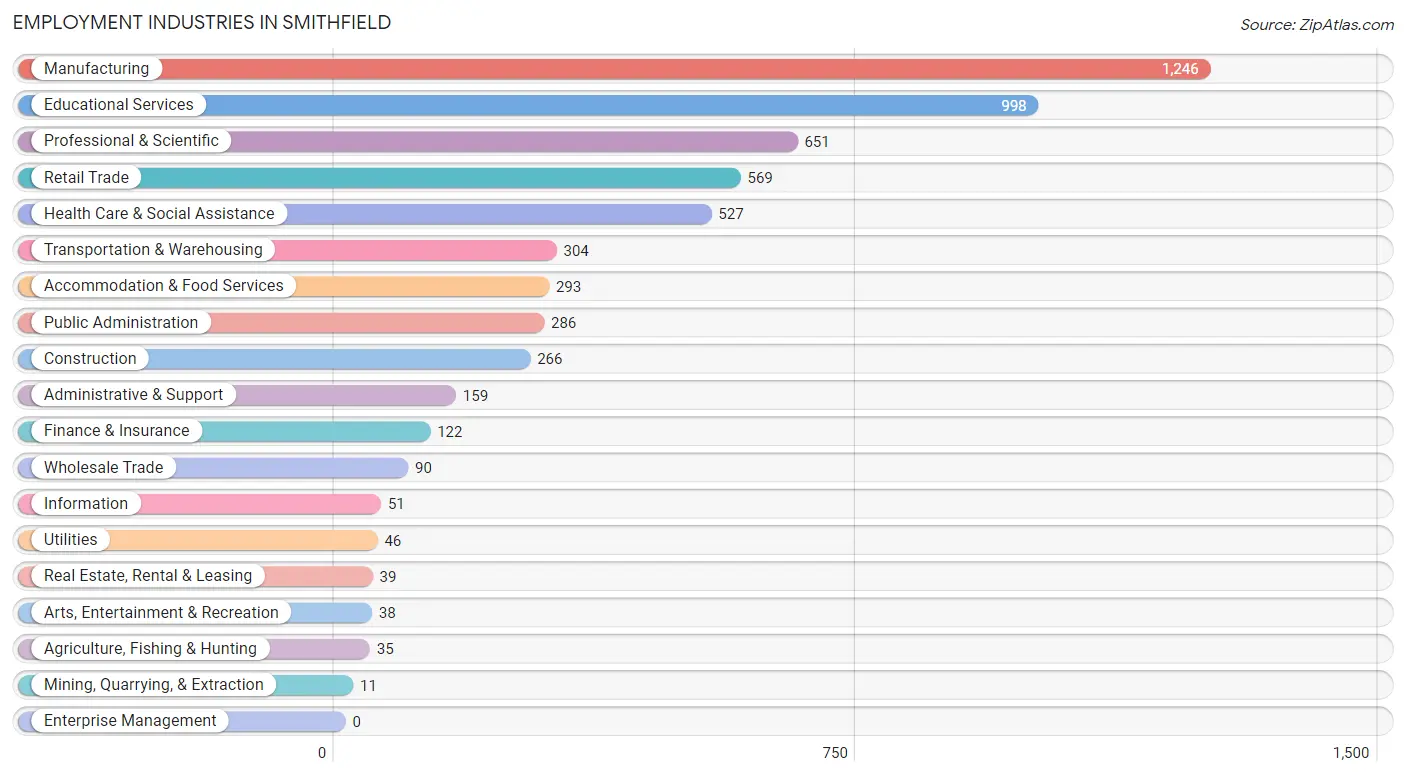
Employment Industries in Smithfield
The major employment industries in Smithfield include Manufacturing (1,246 | 20.7%), Educational Services (998 | 16.6%), Professional & Scientific (651 | 10.8%), Retail Trade (569 | 9.5%), and Health Care & Social Assistance (527 | 8.8%).
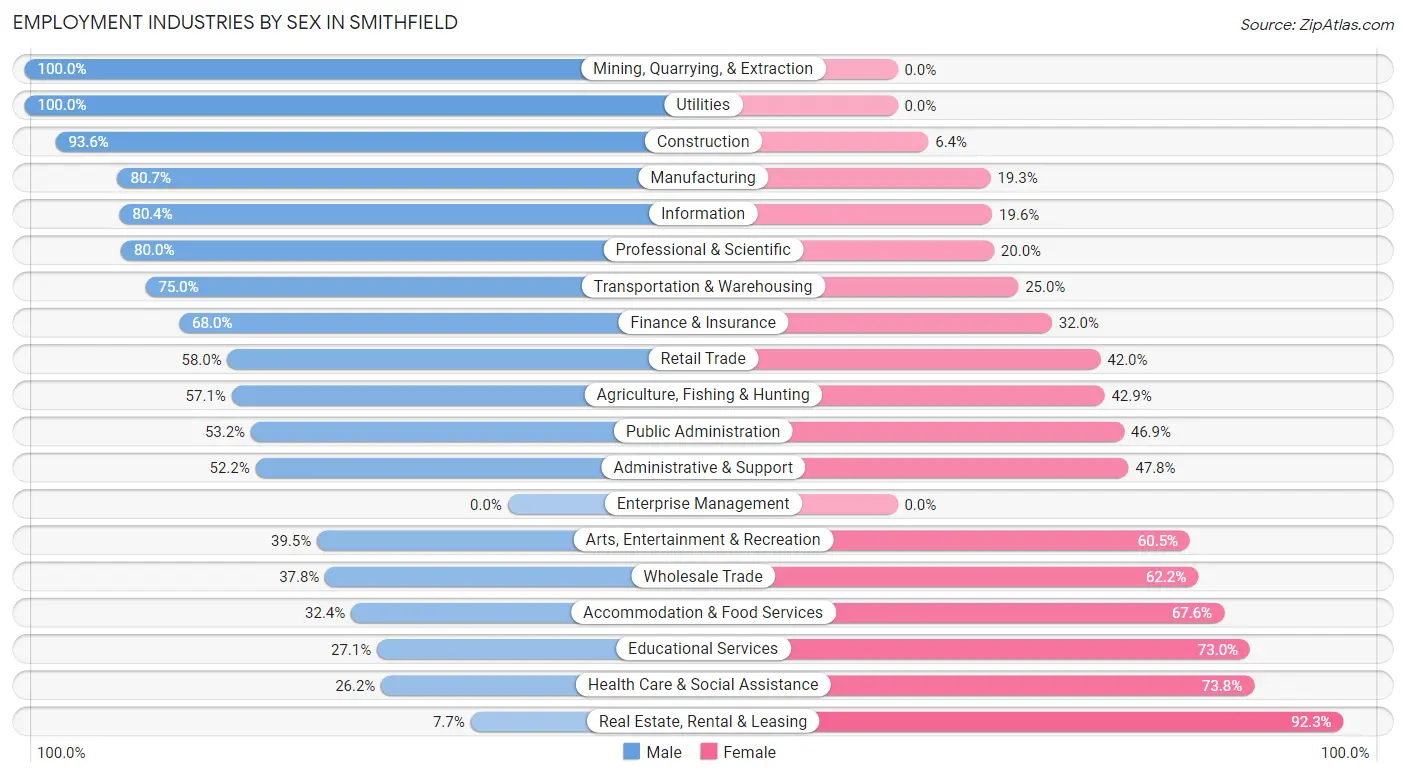
Employment Industries by Sex in Smithfield
The Smithfield industries that see more men than women are Mining, Quarrying, & Extraction (100.0%), Utilities (100.0%), and Construction (93.6%), whereas the industries that tend to have a higher number of women are Real Estate, Rental & Leasing (92.3%), Health Care & Social Assistance (73.8%), and Educational Services (73.0%).
| Industry | Male | Female |
| Agriculture, Fishing & Hunting | 20 (57.1%) | 15 (42.9%) |
| Mining, Quarrying, & Extraction | 11 (100.0%) | 0 (0.0%) |
| Construction | 249 (93.6%) | 17 (6.4%) |
| Manufacturing | 1,006 (80.7%) | 240 (19.3%) |
| Wholesale Trade | 34 (37.8%) | 56 (62.2%) |
| Retail Trade | 330 (58.0%) | 239 (42.0%) |
| Transportation & Warehousing | 228 (75.0%) | 76 (25.0%) |
| Utilities | 46 (100.0%) | 0 (0.0%) |
| Information | 41 (80.4%) | 10 (19.6%) |
| Finance & Insurance | 83 (68.0%) | 39 (32.0%) |
| Real Estate, Rental & Leasing | 3 (7.7%) | 36 (92.3%) |
| Professional & Scientific | 521 (80.0%) | 130 (20.0%) |
| Enterprise Management | 0 (0.0%) | 0 (0.0%) |
| Administrative & Support | 83 (52.2%) | 76 (47.8%) |
| Educational Services | 270 (27.1%) | 728 (73.0%) |
| Health Care & Social Assistance | 138 (26.2%) | 389 (73.8%) |
| Arts, Entertainment & Recreation | 15 (39.5%) | 23 (60.5%) |
| Accommodation & Food Services | 95 (32.4%) | 198 (67.6%) |
| Public Administration | 152 (53.1%) | 134 (46.9%) |
| Total | 3,441 (57.3%) | 2,564 (42.7%) |
Education in Smithfield
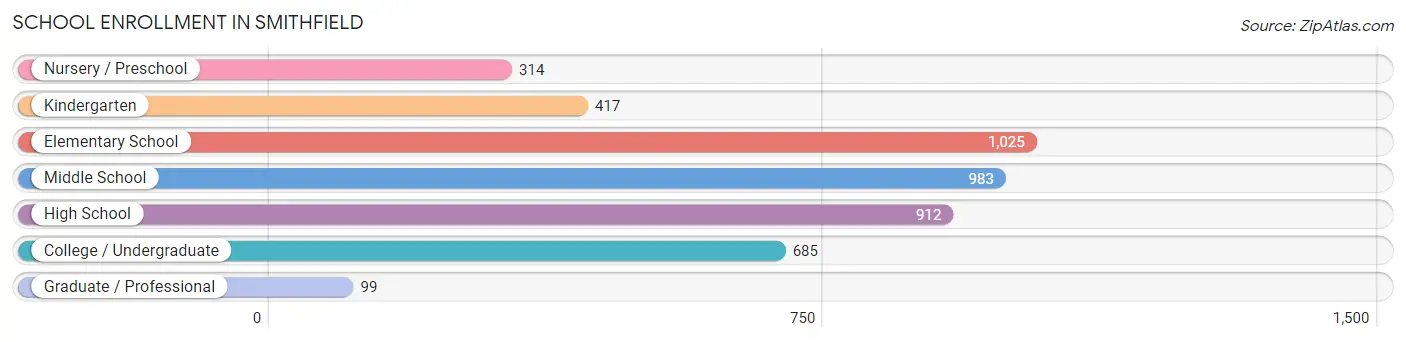
School Enrollment in Smithfield
The most common levels of schooling among the 4,435 students in Smithfield are elementary school (1,025 | 23.1%), middle school (983 | 22.2%), and high school (912 | 20.6%).
| School Level | # Students | % Students |
| Nursery / Preschool | 314 | 7.1% |
| Kindergarten | 417 | 9.4% |
| Elementary School | 1,025 | 23.1% |
| Middle School | 983 | 22.2% |
| High School | 912 | 20.6% |
| College / Undergraduate | 685 | 15.4% |
| Graduate / Professional | 99 | 2.2% |
| Total | 4,435 | 100.0% |
School Enrollment by Age by Funding Source in Smithfield
Out of a total of 4,435 students who are enrolled in schools in Smithfield, 395 (8.9%) attend a private institution, while the remaining 4,040 (91.1%) are enrolled in public schools. The age group of 3 to 4 year olds has the highest likelihood of being enrolled in private schools, with 52 (33.1% in the age bracket) enrolled. Conversely, the age group of 15 to 17 year olds has the lowest likelihood of being enrolled in a private school, with 690 (98.4% in the age bracket) attending a public institution.
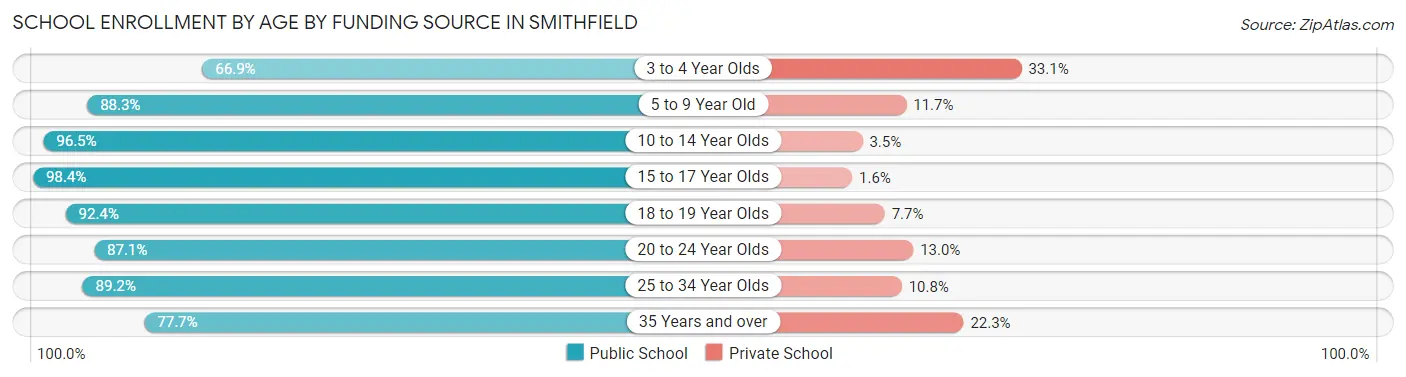
| Age Bracket | Public School | Private School |
| 3 to 4 Year Olds | 105 (66.9%) | 52 (33.1%) |
| 5 to 9 Year Old | 1,362 (88.3%) | 180 (11.7%) |
| 10 to 14 Year Olds | 1,104 (96.5%) | 40 (3.5%) |
| 15 to 17 Year Olds | 690 (98.4%) | 11 (1.6%) |
| 18 to 19 Year Olds | 181 (92.3%) | 15 (7.6%) |
| 20 to 24 Year Olds | 242 (87.1%) | 36 (13.0%) |
| 25 to 34 Year Olds | 264 (89.2%) | 32 (10.8%) |
| 35 Years and over | 94 (77.7%) | 27 (22.3%) |
| Total | 4,040 (91.1%) | 395 (8.9%) |
Educational Attainment by Field of Study in Smithfield
Business (764 | 22.8%), education (628 | 18.7%), arts & humanities (289 | 8.6%), science & technology (273 | 8.1%), and engineering (263 | 7.8%) are the most common fields of study among 3,354 individuals in Smithfield who have obtained a bachelor's degree or higher.
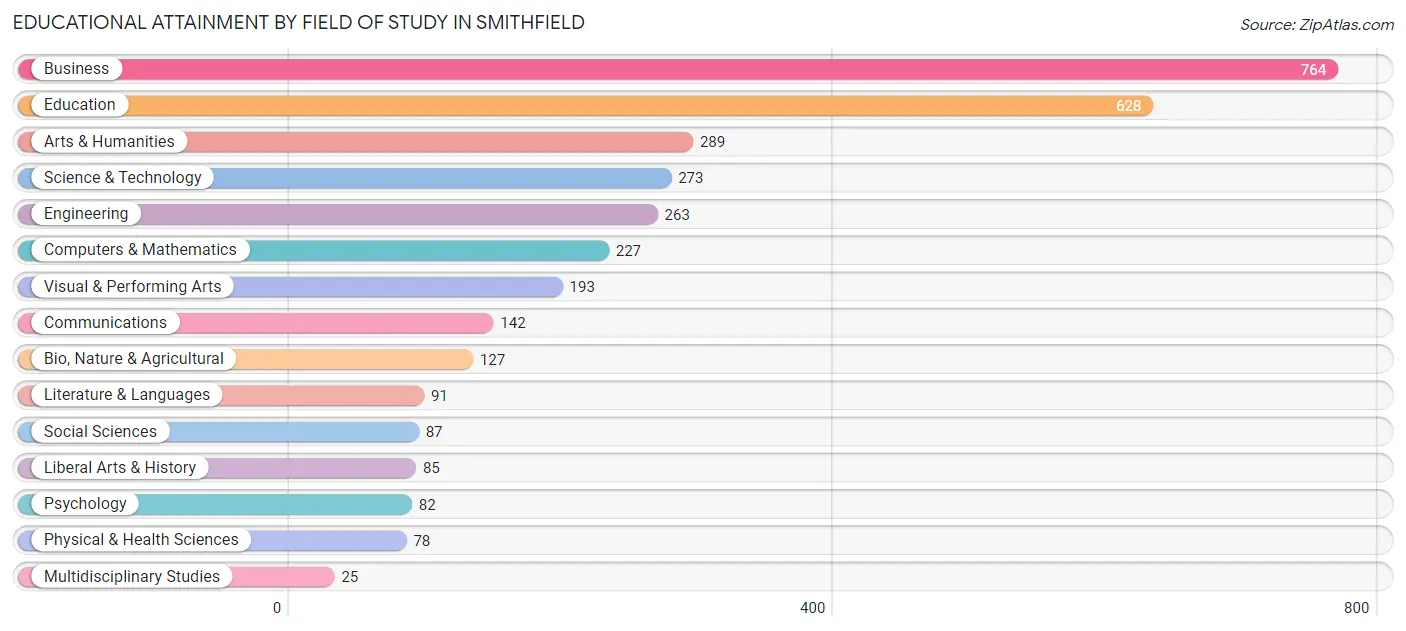
| Field of Study | # Graduates | % Graduates |
| Computers & Mathematics | 227 | 6.8% |
| Bio, Nature & Agricultural | 127 | 3.8% |
| Physical & Health Sciences | 78 | 2.3% |
| Psychology | 82 | 2.4% |
| Social Sciences | 87 | 2.6% |
| Engineering | 263 | 7.8% |
| Multidisciplinary Studies | 25 | 0.7% |
| Science & Technology | 273 | 8.1% |
| Business | 764 | 22.8% |
| Education | 628 | 18.7% |
| Literature & Languages | 91 | 2.7% |
| Liberal Arts & History | 85 | 2.5% |
| Visual & Performing Arts | 193 | 5.8% |
| Communications | 142 | 4.2% |
| Arts & Humanities | 289 | 8.6% |
| Total | 3,354 | 100.0% |
Transportation & Commute in Smithfield
Vehicle Availability by Sex in Smithfield
The most prevalent vehicle ownership categories in Smithfield are males with 2 vehicles (1,392, accounting for 40.9%) and females with 2 vehicles (891, making up 57.2%).
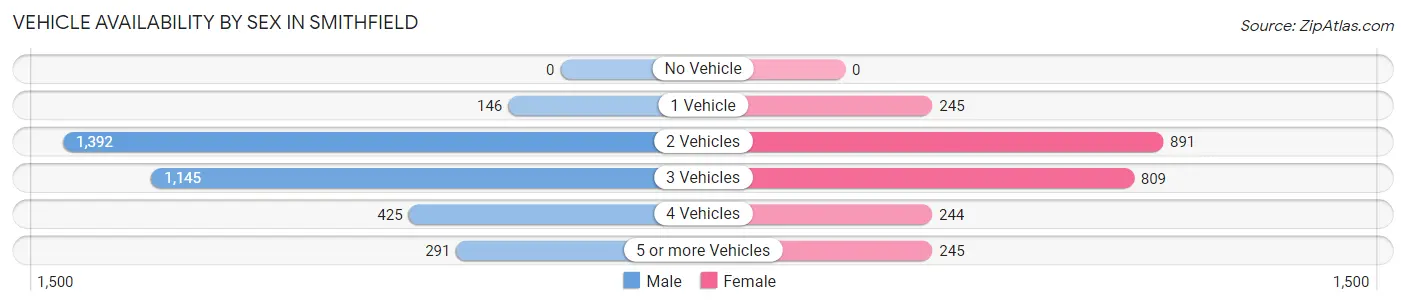
| Vehicles Available | Male | Female |
| No Vehicle | 0 (0.0%) | 0 (0.0%) |
| 1 Vehicle | 146 (4.3%) | 245 (10.1%) |
| 2 Vehicles | 1,392 (40.9%) | 891 (36.6%) |
| 3 Vehicles | 1,145 (33.7%) | 809 (33.2%) |
| 4 Vehicles | 425 (12.5%) | 244 (10.0%) |
| 5 or more Vehicles | 291 (8.6%) | 245 (10.1%) |
| Total | 3,399 (100.0%) | 2,434 (100.0%) |
Commute Time in Smithfield
The most frequently occuring commute durations in Smithfield are 15 to 19 minutes (1,285 commuters, 26.4%), 10 to 14 minutes (1,057 commuters, 21.7%), and 20 to 24 minutes (781 commuters, 16.0%).
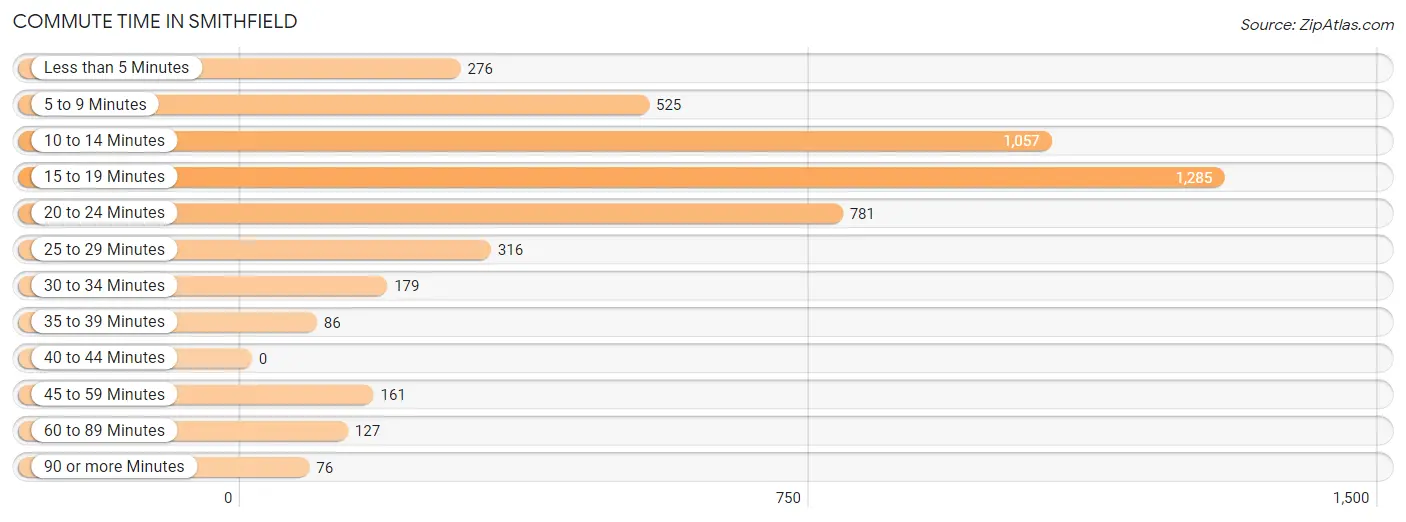
| Commute Time | # Commuters | % Commuters |
| Less than 5 Minutes | 276 | 5.7% |
| 5 to 9 Minutes | 525 | 10.8% |
| 10 to 14 Minutes | 1,057 | 21.7% |
| 15 to 19 Minutes | 1,285 | 26.4% |
| 20 to 24 Minutes | 781 | 16.0% |
| 25 to 29 Minutes | 316 | 6.5% |
| 30 to 34 Minutes | 179 | 3.7% |
| 35 to 39 Minutes | 86 | 1.8% |
| 40 to 44 Minutes | 0 | 0.0% |
| 45 to 59 Minutes | 161 | 3.3% |
| 60 to 89 Minutes | 127 | 2.6% |
| 90 or more Minutes | 76 | 1.6% |
Commute Time by Sex in Smithfield
The most common commute times in Smithfield are 15 to 19 minutes (792 commuters, 27.1%) for males and 15 to 19 minutes (493 commuters, 25.4%) for females.
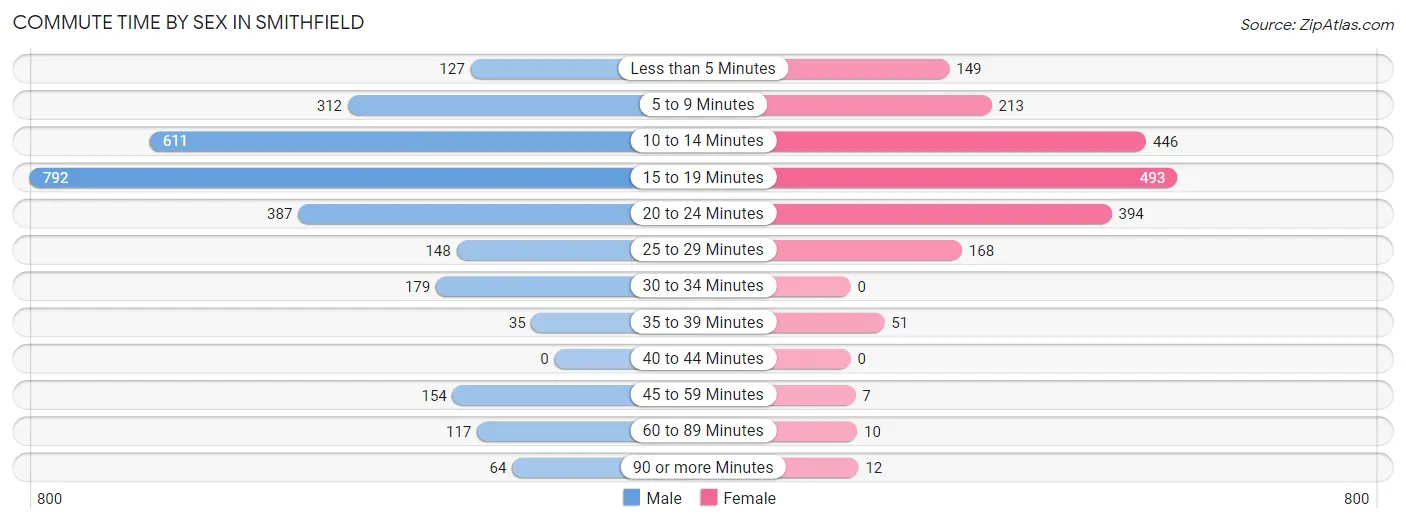
| Commute Time | Male | Female |
| Less than 5 Minutes | 127 (4.3%) | 149 (7.7%) |
| 5 to 9 Minutes | 312 (10.7%) | 213 (11.0%) |
| 10 to 14 Minutes | 611 (20.9%) | 446 (23.0%) |
| 15 to 19 Minutes | 792 (27.1%) | 493 (25.4%) |
| 20 to 24 Minutes | 387 (13.2%) | 394 (20.3%) |
| 25 to 29 Minutes | 148 (5.1%) | 168 (8.6%) |
| 30 to 34 Minutes | 179 (6.1%) | 0 (0.0%) |
| 35 to 39 Minutes | 35 (1.2%) | 51 (2.6%) |
| 40 to 44 Minutes | 0 (0.0%) | 0 (0.0%) |
| 45 to 59 Minutes | 154 (5.3%) | 7 (0.4%) |
| 60 to 89 Minutes | 117 (4.0%) | 10 (0.5%) |
| 90 or more Minutes | 64 (2.2%) | 12 (0.6%) |
Time of Departure to Work by Sex in Smithfield
The most frequent times of departure to work in Smithfield are 7:30 AM to 7:59 AM (428, 14.6%) for males and 7:00 AM to 7:29 AM (287, 14.8%) for females.
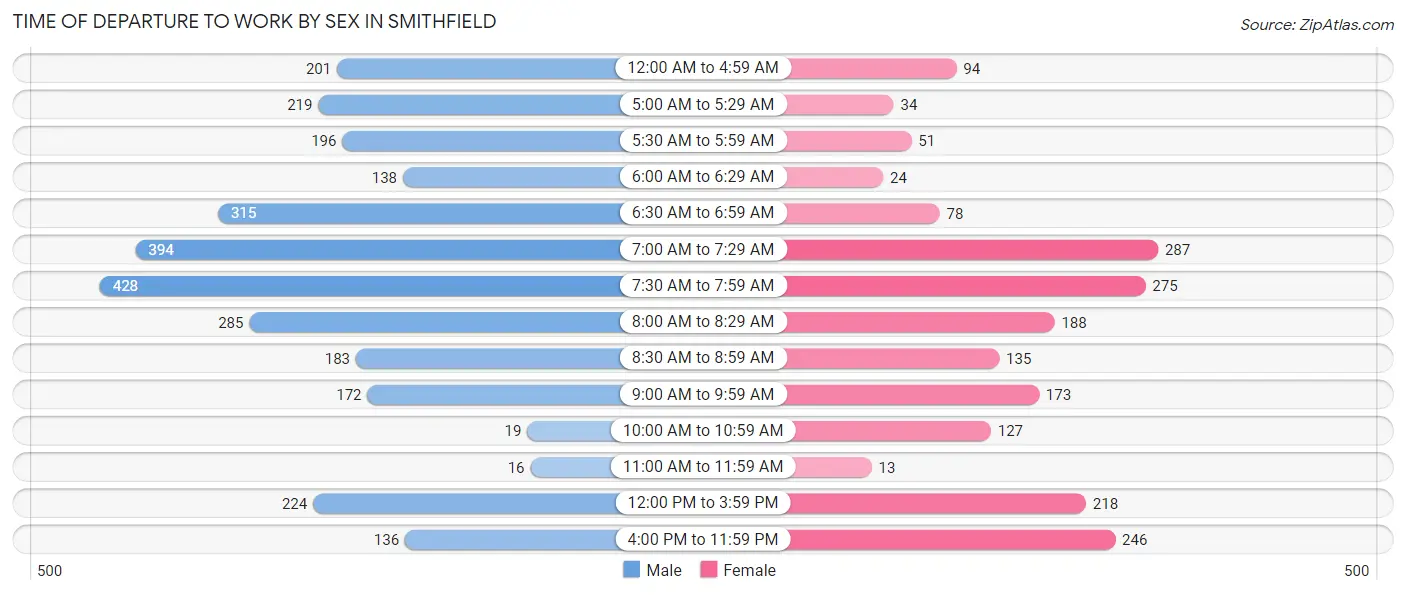
| Time of Departure | Male | Female |
| 12:00 AM to 4:59 AM | 201 (6.9%) | 94 (4.8%) |
| 5:00 AM to 5:29 AM | 219 (7.5%) | 34 (1.8%) |
| 5:30 AM to 5:59 AM | 196 (6.7%) | 51 (2.6%) |
| 6:00 AM to 6:29 AM | 138 (4.7%) | 24 (1.2%) |
| 6:30 AM to 6:59 AM | 315 (10.8%) | 78 (4.0%) |
| 7:00 AM to 7:29 AM | 394 (13.5%) | 287 (14.8%) |
| 7:30 AM to 7:59 AM | 428 (14.6%) | 275 (14.1%) |
| 8:00 AM to 8:29 AM | 285 (9.7%) | 188 (9.7%) |
| 8:30 AM to 8:59 AM | 183 (6.2%) | 135 (7.0%) |
| 9:00 AM to 9:59 AM | 172 (5.9%) | 173 (8.9%) |
| 10:00 AM to 10:59 AM | 19 (0.6%) | 127 (6.5%) |
| 11:00 AM to 11:59 AM | 16 (0.5%) | 13 (0.7%) |
| 12:00 PM to 3:59 PM | 224 (7.7%) | 218 (11.2%) |
| 4:00 PM to 11:59 PM | 136 (4.6%) | 246 (12.7%) |
| Total | 2,926 (100.0%) | 1,943 (100.0%) |
Housing Occupancy in Smithfield
Occupancy by Ownership in Smithfield
Of the total 3,895 dwellings in Smithfield, owner-occupied units account for 3,128 (80.3%), while renter-occupied units make up 767 (19.7%).
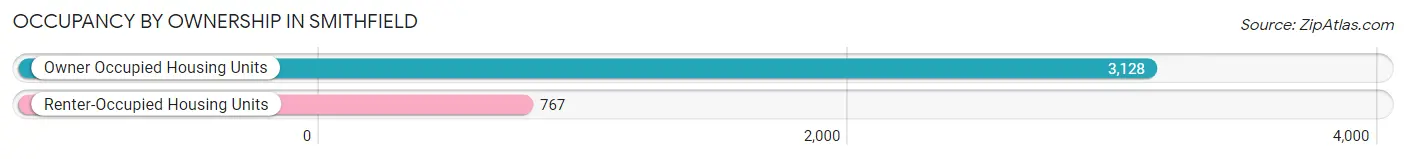
| Occupancy | # Housing Units | % Housing Units |
| Owner Occupied Housing Units | 3,128 | 80.3% |
| Renter-Occupied Housing Units | 767 | 19.7% |
| Total Occupied Housing Units | 3,895 | 100.0% |
Occupancy by Household Size in Smithfield
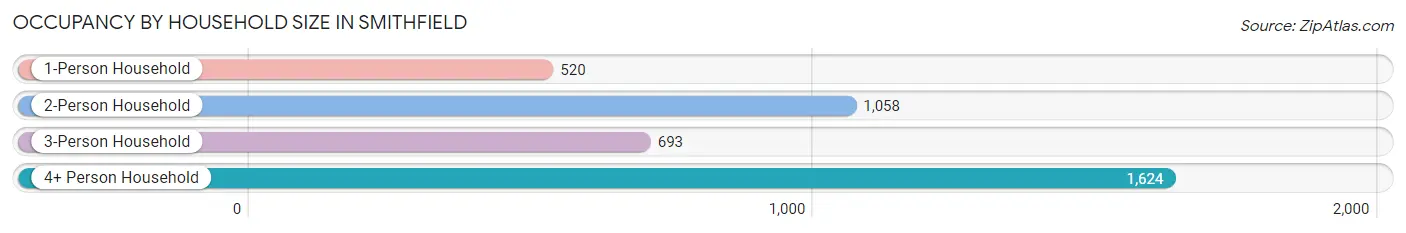
| Household Size | # Housing Units | % Housing Units |
| 1-Person Household | 520 | 13.4% |
| 2-Person Household | 1,058 | 27.2% |
| 3-Person Household | 693 | 17.8% |
| 4+ Person Household | 1,624 | 41.7% |
| Total Housing Units | 3,895 | 100.0% |
Occupancy by Ownership by Household Size in Smithfield
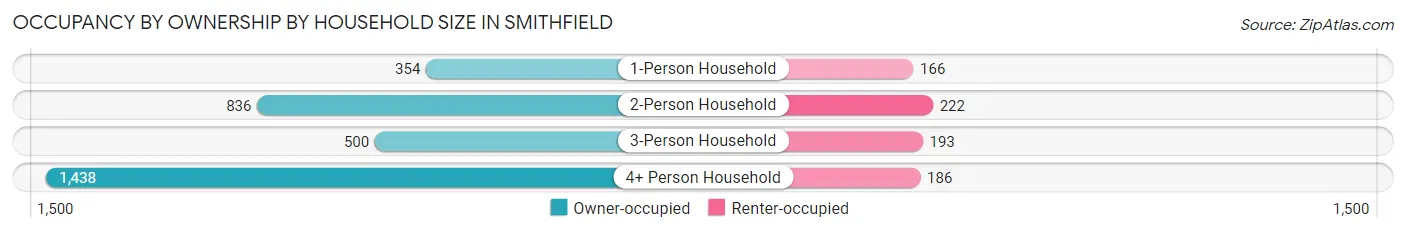
| Household Size | Owner-occupied | Renter-occupied |
| 1-Person Household | 354 (68.1%) | 166 (31.9%) |
| 2-Person Household | 836 (79.0%) | 222 (21.0%) |
| 3-Person Household | 500 (72.2%) | 193 (27.9%) |
| 4+ Person Household | 1,438 (88.5%) | 186 (11.5%) |
| Total Housing Units | 3,128 (80.3%) | 767 (19.7%) |
Occupancy by Educational Attainment in Smithfield
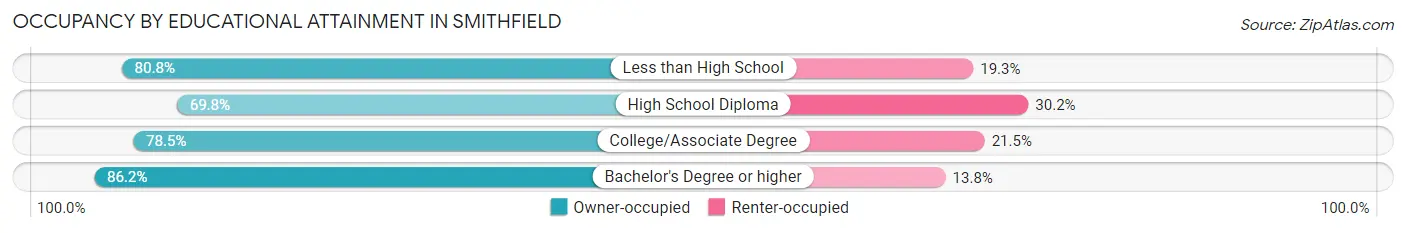
| Household Size | Owner-occupied | Renter-occupied |
| Less than High School | 130 (80.7%) | 31 (19.3%) |
| High School Diploma | 465 (69.8%) | 201 (30.2%) |
| College/Associate Degree | 1,138 (78.5%) | 312 (21.5%) |
| Bachelor's Degree or higher | 1,395 (86.2%) | 223 (13.8%) |
Occupancy by Age of Householder in Smithfield
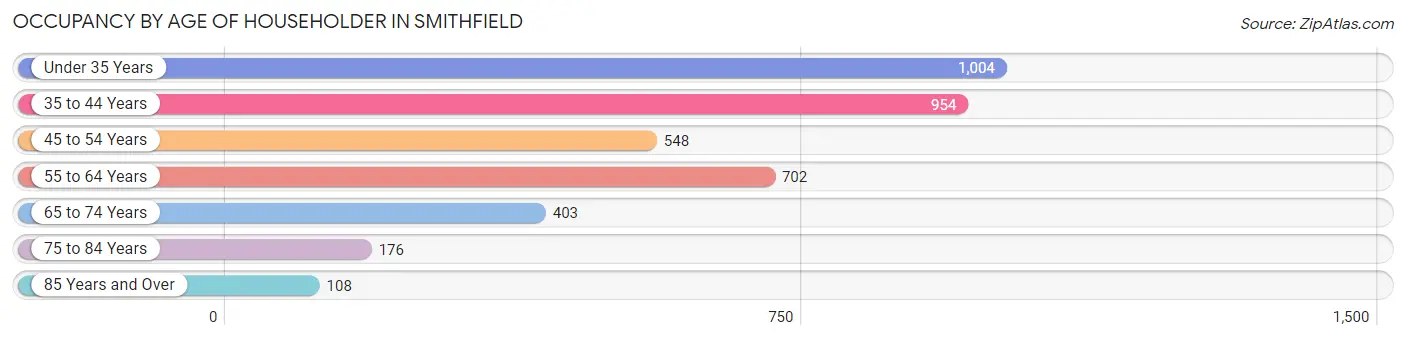
| Age Bracket | # Households | % Households |
| Under 35 Years | 1,004 | 25.8% |
| 35 to 44 Years | 954 | 24.5% |
| 45 to 54 Years | 548 | 14.1% |
| 55 to 64 Years | 702 | 18.0% |
| 65 to 74 Years | 403 | 10.3% |
| 75 to 84 Years | 176 | 4.5% |
| 85 Years and Over | 108 | 2.8% |
| Total | 3,895 | 100.0% |
Housing Finances in Smithfield
Median Income by Occupancy in Smithfield
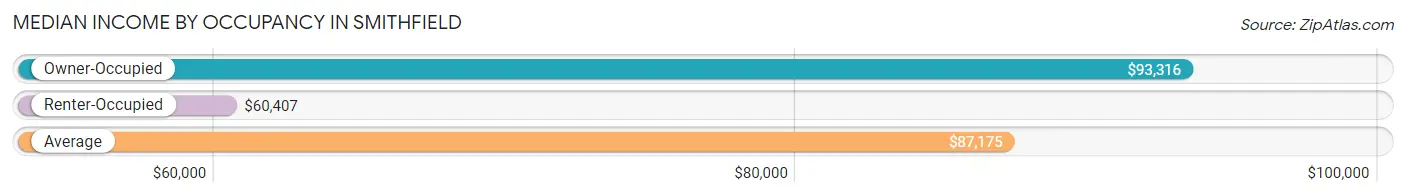
| Occupancy Type | # Households | Median Income |
| Owner-Occupied | 3,128 (80.3%) | $93,316 |
| Renter-Occupied | 767 (19.7%) | $60,407 |
| Average | 3,895 (100.0%) | $87,175 |
Occupancy by Householder Income Bracket in Smithfield
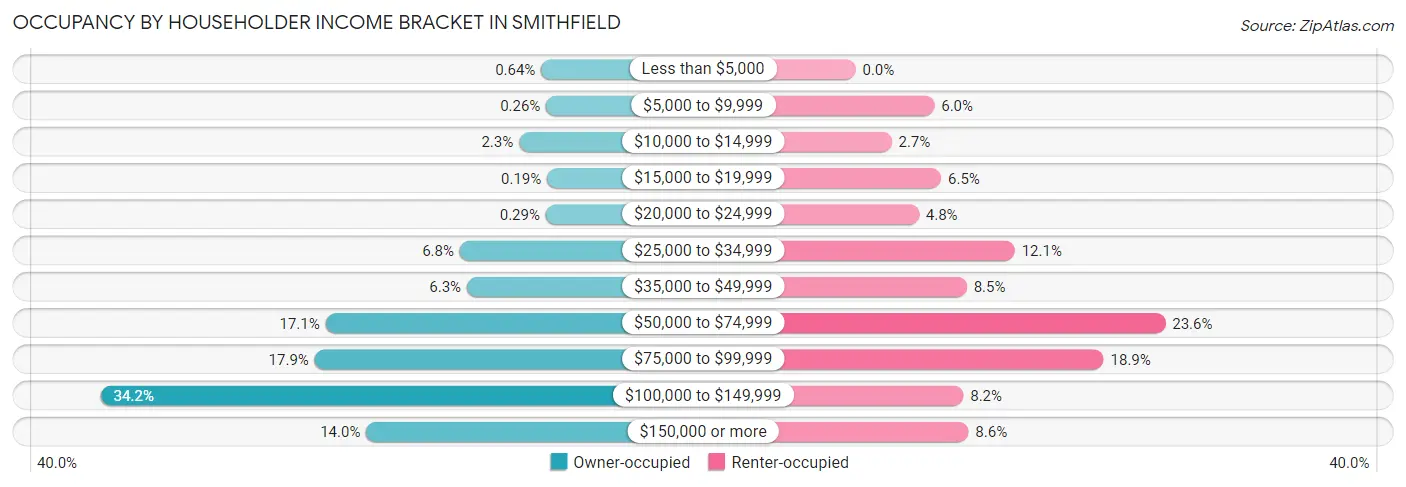
| Income Bracket | Owner-occupied | Renter-occupied |
| Less than $5,000 | 20 (0.6%) | 0 (0.0%) |
| $5,000 to $9,999 | 8 (0.3%) | 46 (6.0%) |
| $10,000 to $14,999 | 73 (2.3%) | 21 (2.7%) |
| $15,000 to $19,999 | 6 (0.2%) | 50 (6.5%) |
| $20,000 to $24,999 | 9 (0.3%) | 37 (4.8%) |
| $25,000 to $34,999 | 214 (6.8%) | 93 (12.1%) |
| $35,000 to $49,999 | 197 (6.3%) | 65 (8.5%) |
| $50,000 to $74,999 | 534 (17.1%) | 181 (23.6%) |
| $75,000 to $99,999 | 560 (17.9%) | 145 (18.9%) |
| $100,000 to $149,999 | 1,070 (34.2%) | 63 (8.2%) |
| $150,000 or more | 437 (14.0%) | 66 (8.6%) |
| Total | 3,128 (100.0%) | 767 (100.0%) |
Monthly Housing Cost Tiers in Smithfield
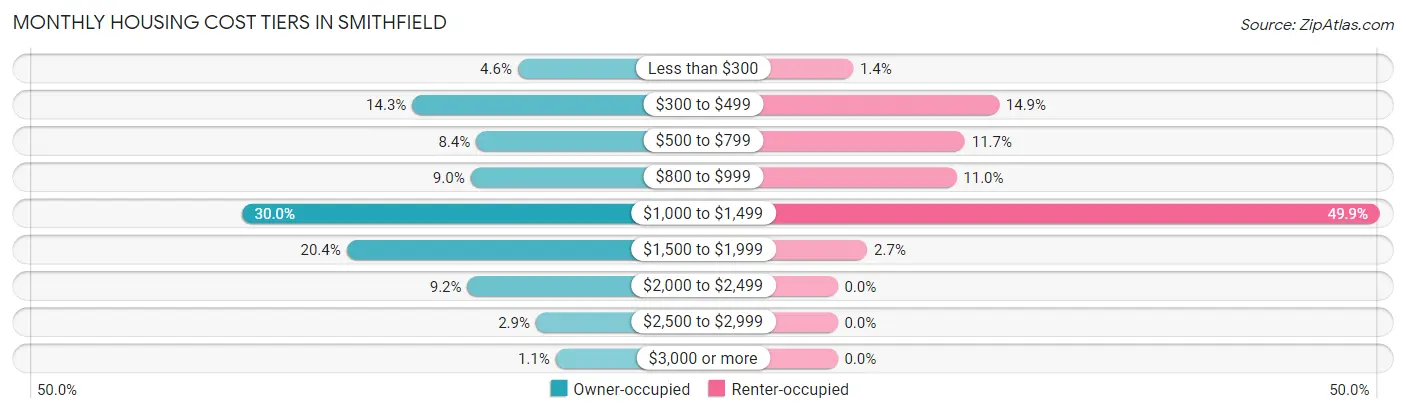
| Monthly Cost | Owner-occupied | Renter-occupied |
| Less than $300 | 144 (4.6%) | 11 (1.4%) |
| $300 to $499 | 448 (14.3%) | 114 (14.9%) |
| $500 to $799 | 264 (8.4%) | 90 (11.7%) |
| $800 to $999 | 280 (8.9%) | 84 (11.0%) |
| $1,000 to $1,499 | 939 (30.0%) | 383 (49.9%) |
| $1,500 to $1,999 | 637 (20.4%) | 21 (2.7%) |
| $2,000 to $2,499 | 289 (9.2%) | 0 (0.0%) |
| $2,500 to $2,999 | 92 (2.9%) | 0 (0.0%) |
| $3,000 or more | 35 (1.1%) | 0 (0.0%) |
| Total | 3,128 (100.0%) | 767 (100.0%) |
Physical Housing Characteristics in Smithfield
Housing Structures in Smithfield
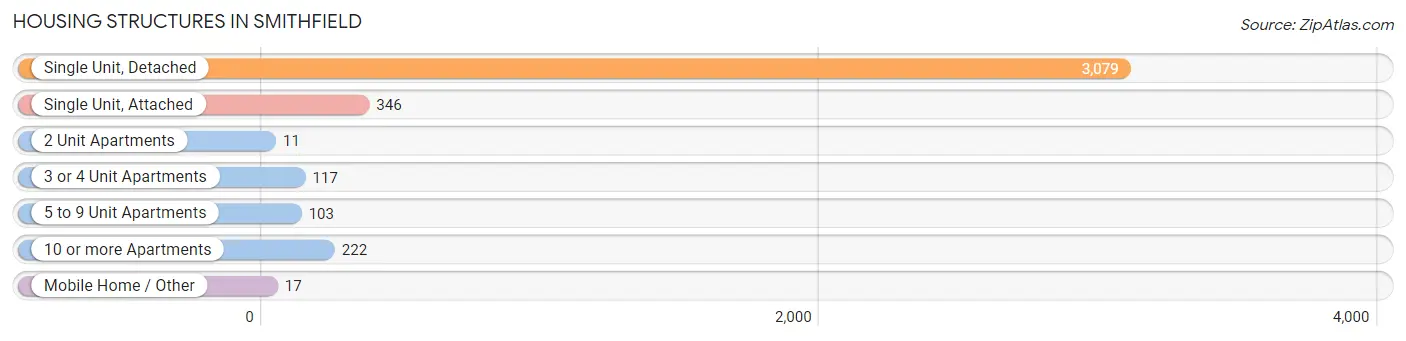
| Structure Type | # Housing Units | % Housing Units |
| Single Unit, Detached | 3,079 | 79.0% |
| Single Unit, Attached | 346 | 8.9% |
| 2 Unit Apartments | 11 | 0.3% |
| 3 or 4 Unit Apartments | 117 | 3.0% |
| 5 to 9 Unit Apartments | 103 | 2.6% |
| 10 or more Apartments | 222 | 5.7% |
| Mobile Home / Other | 17 | 0.4% |
| Total | 3,895 | 100.0% |
Housing Structures by Occupancy in Smithfield
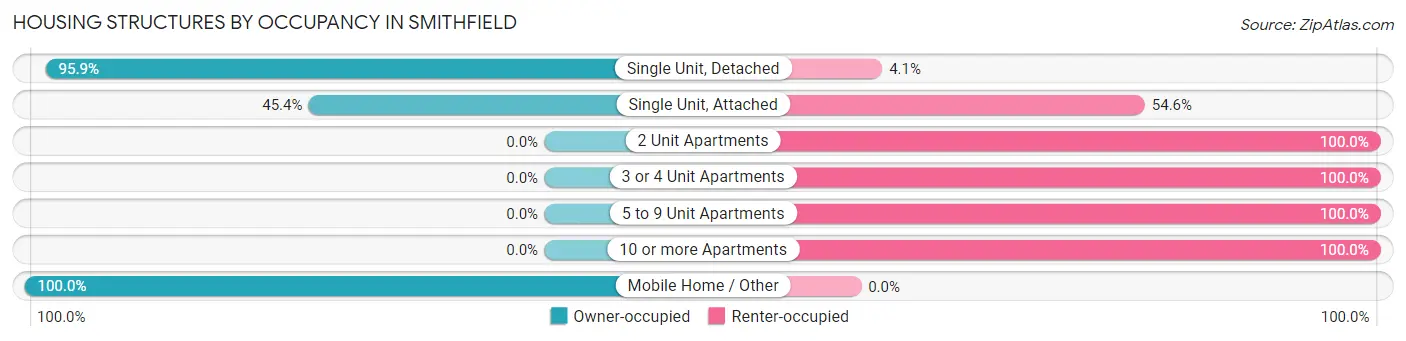
| Structure Type | Owner-occupied | Renter-occupied |
| Single Unit, Detached | 2,954 (95.9%) | 125 (4.1%) |
| Single Unit, Attached | 157 (45.4%) | 189 (54.6%) |
| 2 Unit Apartments | 0 (0.0%) | 11 (100.0%) |
| 3 or 4 Unit Apartments | 0 (0.0%) | 117 (100.0%) |
| 5 to 9 Unit Apartments | 0 (0.0%) | 103 (100.0%) |
| 10 or more Apartments | 0 (0.0%) | 222 (100.0%) |
| Mobile Home / Other | 17 (100.0%) | 0 (0.0%) |
| Total | 3,128 (80.3%) | 767 (19.7%) |
Housing Structures by Number of Rooms in Smithfield
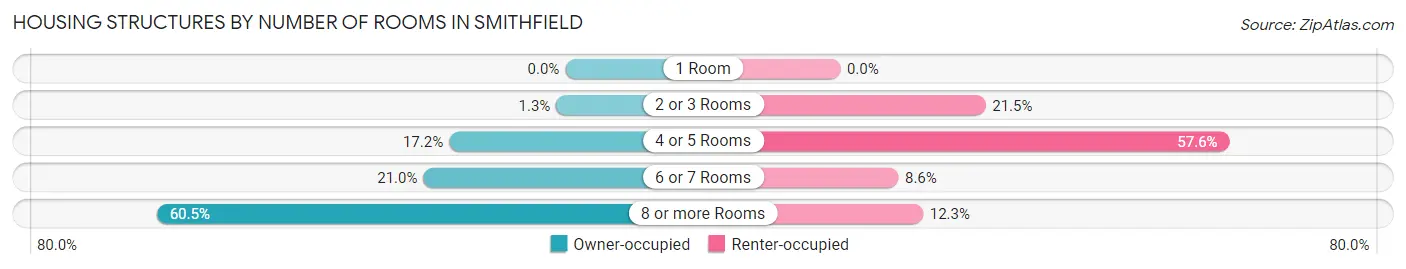
| Number of Rooms | Owner-occupied | Renter-occupied |
| 1 Room | 0 (0.0%) | 0 (0.0%) |
| 2 or 3 Rooms | 42 (1.3%) | 165 (21.5%) |
| 4 or 5 Rooms | 538 (17.2%) | 442 (57.6%) |
| 6 or 7 Rooms | 657 (21.0%) | 66 (8.6%) |
| 8 or more Rooms | 1,891 (60.5%) | 94 (12.3%) |
| Total | 3,128 (100.0%) | 767 (100.0%) |
Housing Structure by Heating Type in Smithfield
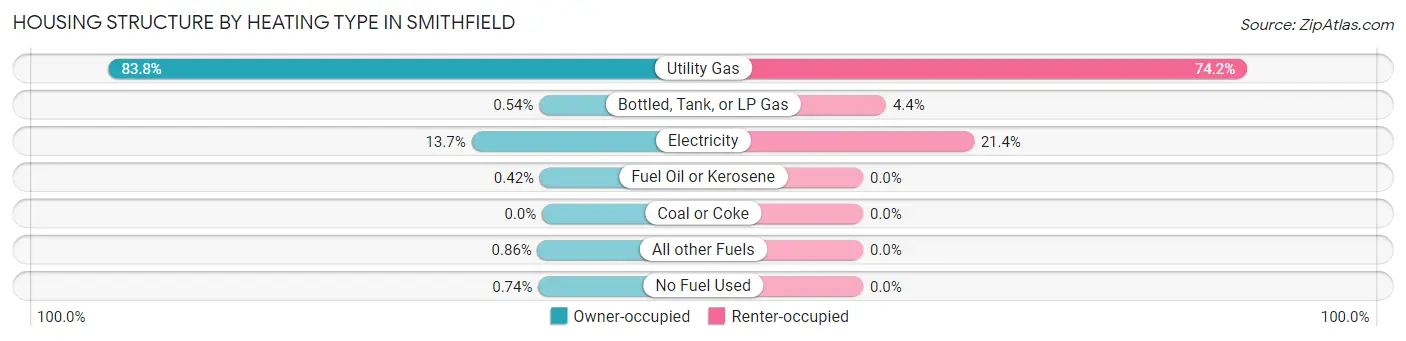
| Heating Type | Owner-occupied | Renter-occupied |
| Utility Gas | 2,621 (83.8%) | 569 (74.2%) |
| Bottled, Tank, or LP Gas | 17 (0.5%) | 34 (4.4%) |
| Electricity | 427 (13.7%) | 164 (21.4%) |
| Fuel Oil or Kerosene | 13 (0.4%) | 0 (0.0%) |
| Coal or Coke | 0 (0.0%) | 0 (0.0%) |
| All other Fuels | 27 (0.9%) | 0 (0.0%) |
| No Fuel Used | 23 (0.7%) | 0 (0.0%) |
| Total | 3,128 (100.0%) | 767 (100.0%) |
Household Vehicle Usage in Smithfield
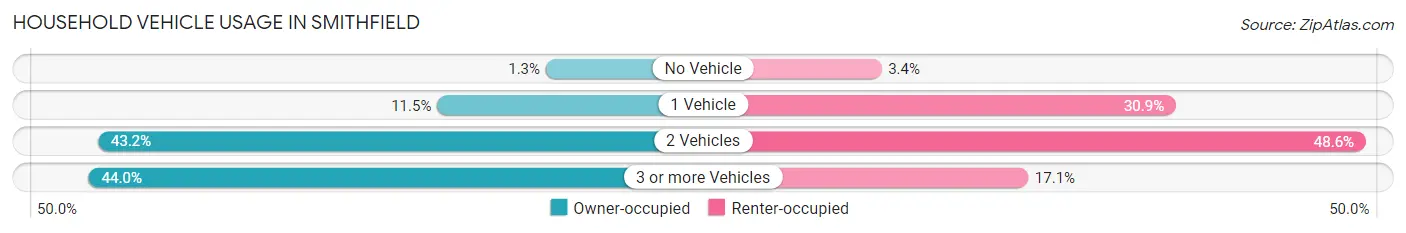
| Vehicles per Household | Owner-occupied | Renter-occupied |
| No Vehicle | 42 (1.3%) | 26 (3.4%) |
| 1 Vehicle | 359 (11.5%) | 237 (30.9%) |
| 2 Vehicles | 1,350 (43.2%) | 373 (48.6%) |
| 3 or more Vehicles | 1,377 (44.0%) | 131 (17.1%) |
| Total | 3,128 (100.0%) | 767 (100.0%) |
Real Estate & Mortgages in Smithfield
Real Estate and Mortgage Overview in Smithfield
| Characteristic | Without Mortgage | With Mortgage |
| Housing Units | 872 | 2,256 |
| Median Property Value | $372,300 | $354,200 |
| Median Household Income | $81,250 | $372 |
| Monthly Housing Costs | $422 | $35 |
| Real Estate Taxes | $1,787 | $18 |
Property Value by Mortgage Status in Smithfield
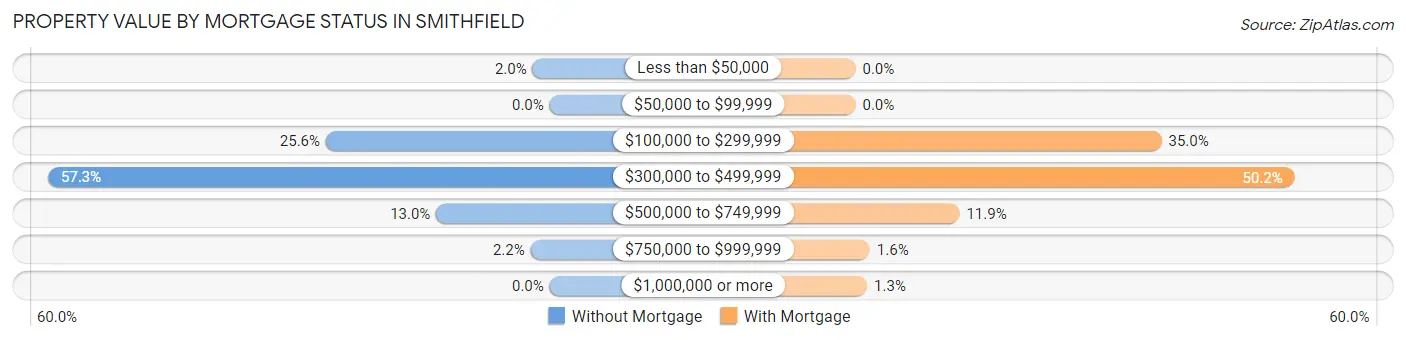
| Property Value | Without Mortgage | With Mortgage |
| Less than $50,000 | 17 (1.9%) | 0 (0.0%) |
| $50,000 to $99,999 | 0 (0.0%) | 0 (0.0%) |
| $100,000 to $299,999 | 223 (25.6%) | 789 (35.0%) |
| $300,000 to $499,999 | 500 (57.3%) | 1,132 (50.2%) |
| $500,000 to $749,999 | 113 (13.0%) | 268 (11.9%) |
| $750,000 to $999,999 | 19 (2.2%) | 37 (1.6%) |
| $1,000,000 or more | 0 (0.0%) | 30 (1.3%) |
| Total | 872 (100.0%) | 2,256 (100.0%) |
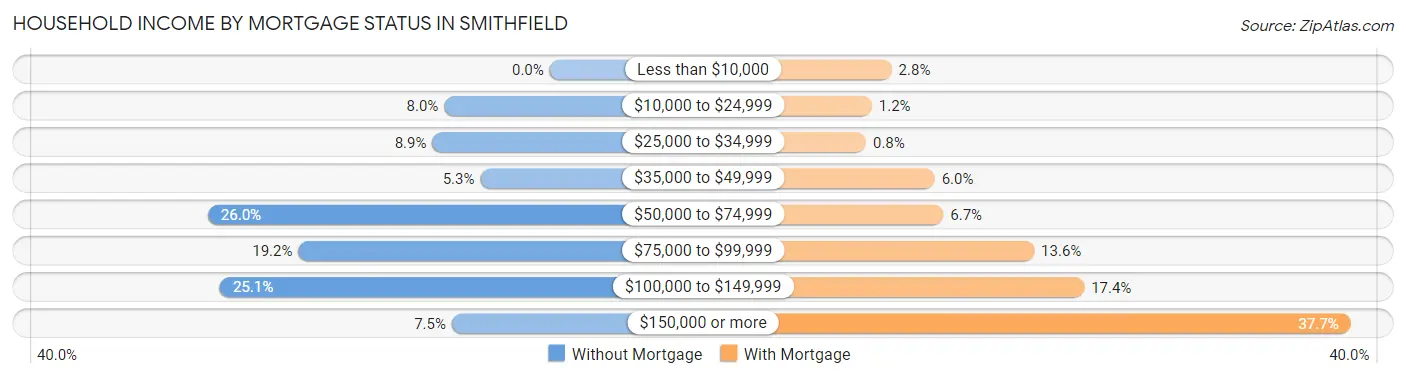
Household Income by Mortgage Status in Smithfield
| Household Income | Without Mortgage | With Mortgage |
| Less than $10,000 | 0 (0.0%) | 62 (2.8%) |
| $10,000 to $24,999 | 70 (8.0%) | 28 (1.2%) |
| $25,000 to $34,999 | 78 (8.9%) | 18 (0.8%) |
| $35,000 to $49,999 | 46 (5.3%) | 136 (6.0%) |
| $50,000 to $74,999 | 227 (26.0%) | 151 (6.7%) |
| $75,000 to $99,999 | 167 (19.2%) | 307 (13.6%) |
| $100,000 to $149,999 | 219 (25.1%) | 393 (17.4%) |
| $150,000 or more | 65 (7.4%) | 851 (37.7%) |
| Total | 872 (100.0%) | 2,256 (100.0%) |
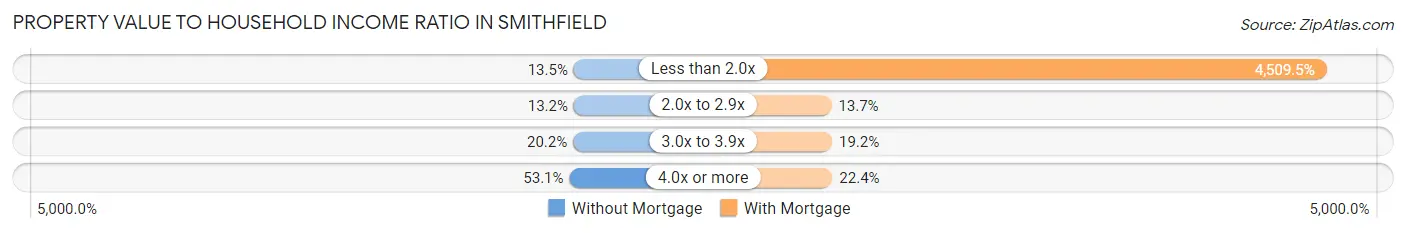
Property Value to Household Income Ratio in Smithfield
| Value-to-Income Ratio | Without Mortgage | With Mortgage |
| Less than 2.0x | 118 (13.5%) | 101,734 (4,509.5%) |
| 2.0x to 2.9x | 115 (13.2%) | 310 (13.7%) |
| 3.0x to 3.9x | 176 (20.2%) | 433 (19.2%) |
| 4.0x or more | 463 (53.1%) | 505 (22.4%) |
| Total | 872 (100.0%) | 2,256 (100.0%) |
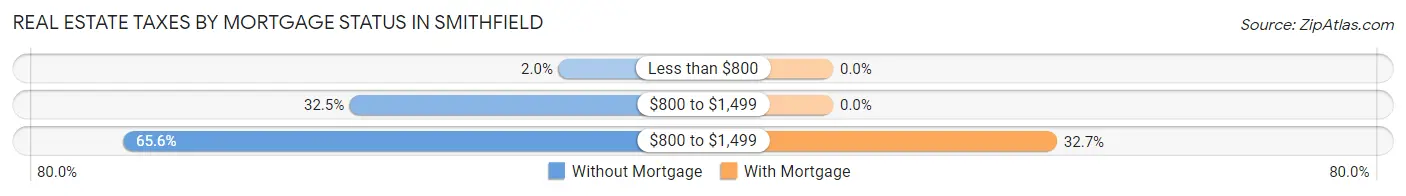
Real Estate Taxes by Mortgage Status in Smithfield
| Property Taxes | Without Mortgage | With Mortgage |
| Less than $800 | 17 (1.9%) | 0 (0.0%) |
| $800 to $1,499 | 283 (32.5%) | 0 (0.0%) |
| $800 to $1,499 | 572 (65.6%) | 738 (32.7%) |
| Total | 872 (100.0%) | 2,256 (100.0%) |
Health & Disability in Smithfield
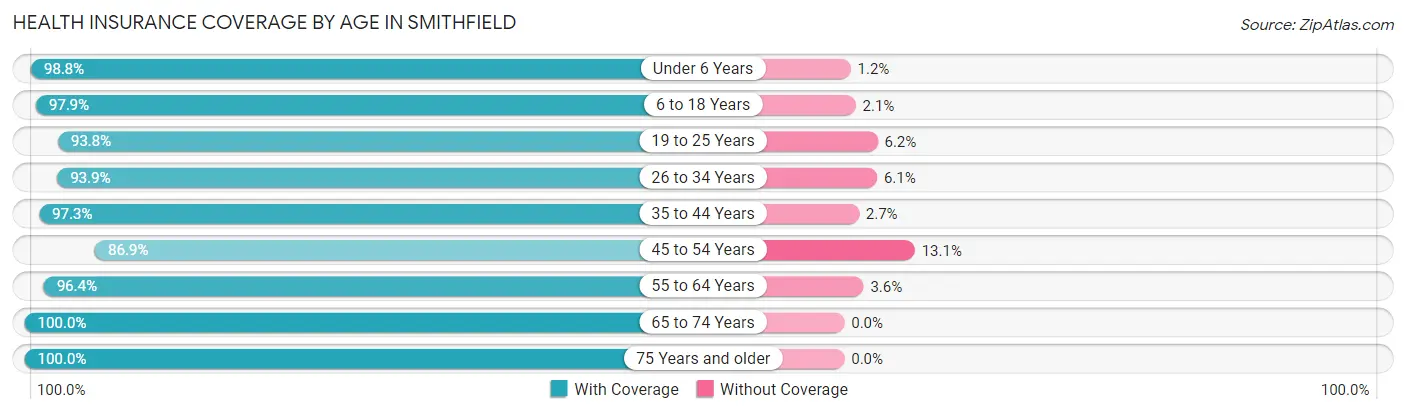
Health Insurance Coverage by Age in Smithfield
| Age Bracket | With Coverage | Without Coverage |
| Under 6 Years | 1,838 (98.8%) | 22 (1.2%) |
| 6 to 18 Years | 3,248 (97.9%) | 70 (2.1%) |
| 19 to 25 Years | 1,285 (93.8%) | 85 (6.2%) |
| 26 to 34 Years | 1,634 (93.9%) | 106 (6.1%) |
| 35 to 44 Years | 1,795 (97.3%) | 50 (2.7%) |
| 45 to 54 Years | 912 (86.9%) | 138 (13.1%) |
| 55 to 64 Years | 1,238 (96.4%) | 46 (3.6%) |
| 65 to 74 Years | 706 (100.0%) | 0 (0.0%) |
| 75 Years and older | 485 (100.0%) | 0 (0.0%) |
| Total | 13,141 (96.2%) | 517 (3.8%) |
Health Insurance Coverage by Citizenship Status in Smithfield
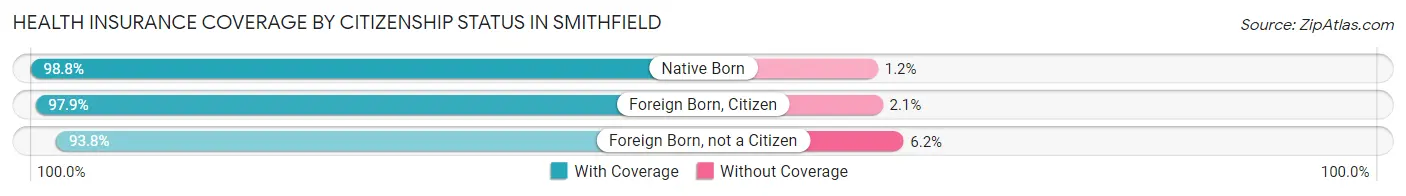
| Citizenship Status | With Coverage | Without Coverage |
| Native Born | 1,838 (98.8%) | 22 (1.2%) |
| Foreign Born, Citizen | 3,248 (97.9%) | 70 (2.1%) |
| Foreign Born, not a Citizen | 1,285 (93.8%) | 85 (6.2%) |
Health Insurance Coverage by Household Income in Smithfield
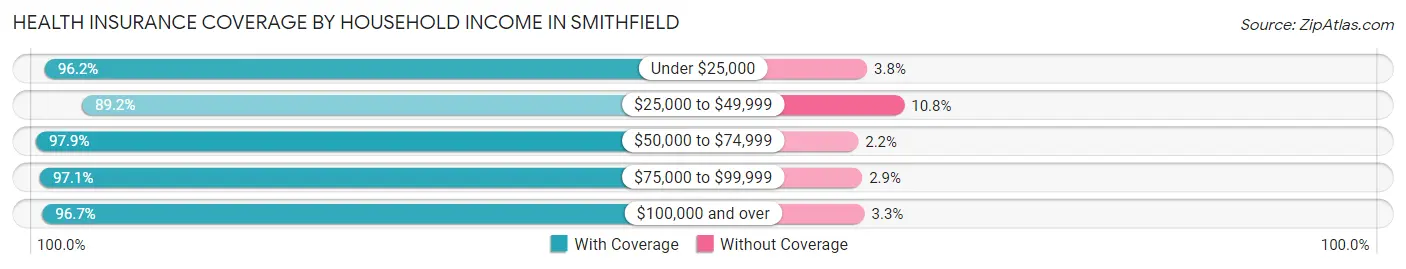
| Household Income | With Coverage | Without Coverage |
| Under $25,000 | 657 (96.2%) | 26 (3.8%) |
| $25,000 to $49,999 | 1,175 (89.2%) | 142 (10.8%) |
| $50,000 to $74,999 | 2,368 (97.9%) | 52 (2.1%) |
| $75,000 to $99,999 | 2,454 (97.1%) | 73 (2.9%) |
| $100,000 and over | 6,487 (96.7%) | 224 (3.3%) |
Public vs Private Health Insurance Coverage by Age in Smithfield
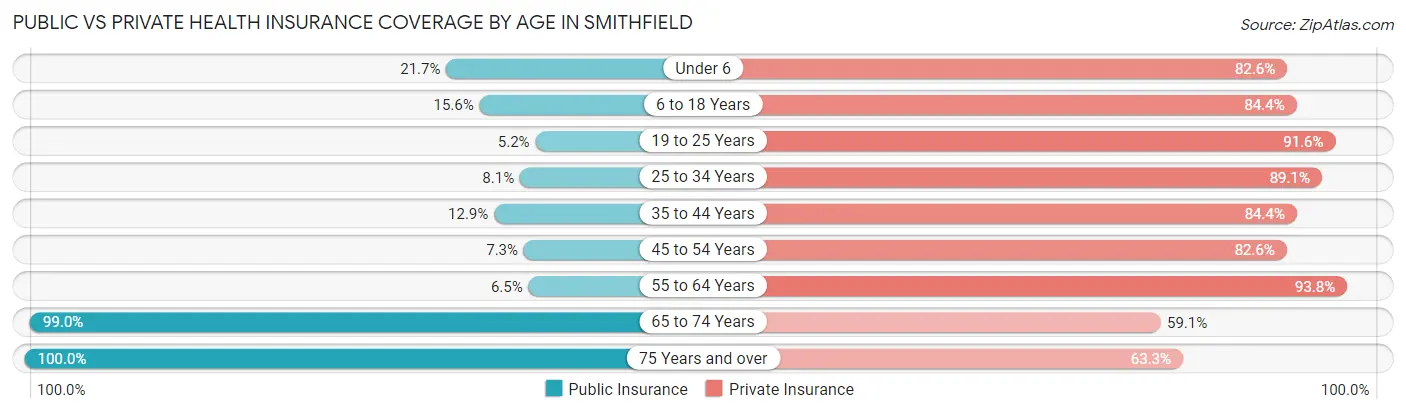
| Age Bracket | Public Insurance | Private Insurance |
| Under 6 | 404 (21.7%) | 1,537 (82.6%) |
| 6 to 18 Years | 516 (15.5%) | 2,800 (84.4%) |
| 19 to 25 Years | 71 (5.2%) | 1,255 (91.6%) |
| 25 to 34 Years | 140 (8.1%) | 1,550 (89.1%) |
| 35 to 44 Years | 237 (12.9%) | 1,558 (84.4%) |
| 45 to 54 Years | 77 (7.3%) | 867 (82.6%) |
| 55 to 64 Years | 83 (6.5%) | 1,204 (93.8%) |
| 65 to 74 Years | 699 (99.0%) | 417 (59.1%) |
| 75 Years and over | 485 (100.0%) | 307 (63.3%) |
| Total | 2,712 (19.9%) | 11,495 (84.2%) |
Disability Status by Sex by Age in Smithfield
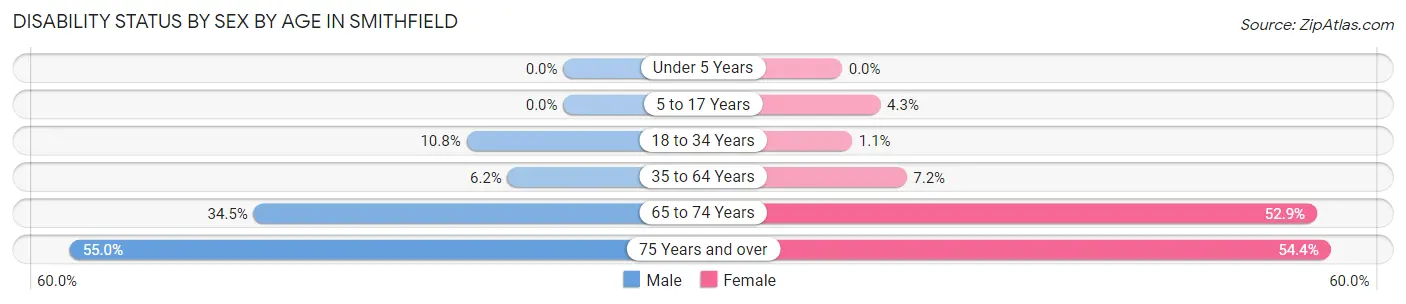
| Age Bracket | Male | Female |
| Under 5 Years | 0 (0.0%) | 0 (0.0%) |
| 5 to 17 Years | 0 (0.0%) | 70 (4.3%) |
| 18 to 34 Years | 170 (10.8%) | 19 (1.1%) |
| 35 to 64 Years | 129 (6.2%) | 151 (7.2%) |
| 65 to 74 Years | 119 (34.5%) | 191 (52.9%) |
| 75 Years and over | 105 (55.0%) | 160 (54.4%) |
Disability Class by Sex by Age in Smithfield
Disability Class: Hearing Difficulty
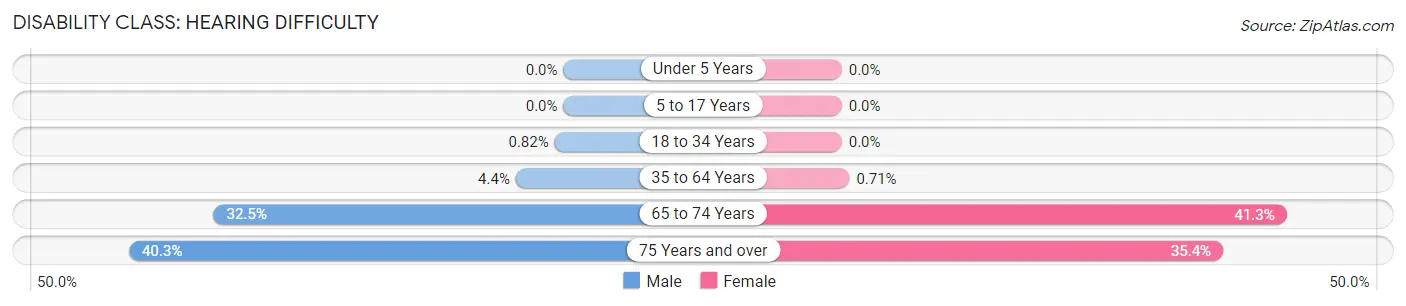
| Age Bracket | Male | Female |
| Under 5 Years | 0 (0.0%) | 0 (0.0%) |
| 5 to 17 Years | 0 (0.0%) | 0 (0.0%) |
| 18 to 34 Years | 13 (0.8%) | 0 (0.0%) |
| 35 to 64 Years | 92 (4.4%) | 15 (0.7%) |
| 65 to 74 Years | 112 (32.5%) | 149 (41.3%) |
| 75 Years and over | 77 (40.3%) | 104 (35.4%) |
Disability Class: Vision Difficulty
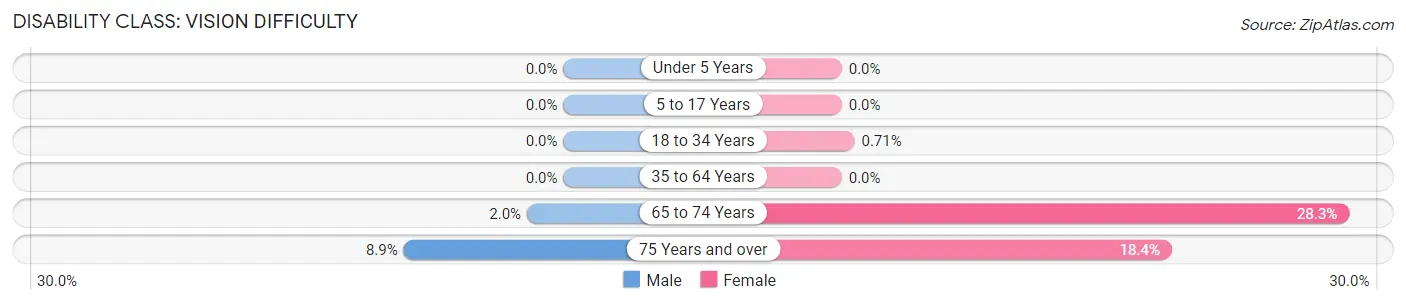
| Age Bracket | Male | Female |
| Under 5 Years | 0 (0.0%) | 0 (0.0%) |
| 5 to 17 Years | 0 (0.0%) | 0 (0.0%) |
| 18 to 34 Years | 0 (0.0%) | 12 (0.7%) |
| 35 to 64 Years | 0 (0.0%) | 0 (0.0%) |
| 65 to 74 Years | 7 (2.0%) | 102 (28.2%) |
| 75 Years and over | 17 (8.9%) | 54 (18.4%) |
Disability Class: Cognitive Difficulty
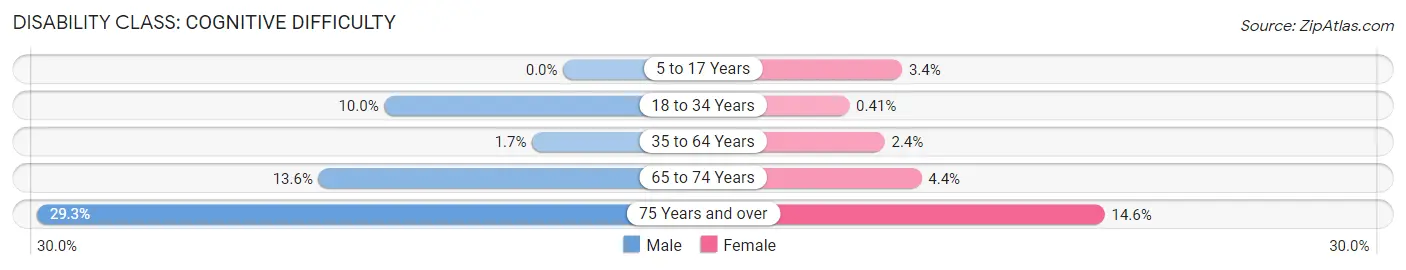
| Age Bracket | Male | Female |
| 5 to 17 Years | 0 (0.0%) | 55 (3.4%) |
| 18 to 34 Years | 157 (10.0%) | 7 (0.4%) |
| 35 to 64 Years | 36 (1.7%) | 50 (2.4%) |
| 65 to 74 Years | 47 (13.6%) | 16 (4.4%) |
| 75 Years and over | 56 (29.3%) | 43 (14.6%) |
Disability Class: Ambulatory Difficulty
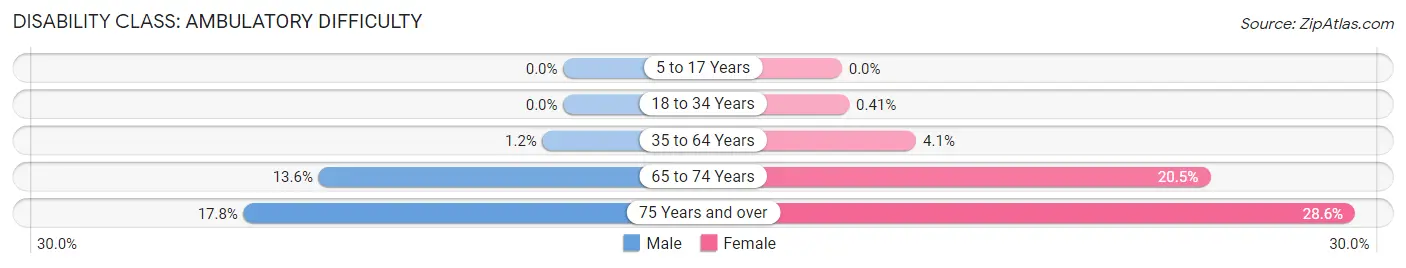
| Age Bracket | Male | Female |
| 5 to 17 Years | 0 (0.0%) | 0 (0.0%) |
| 18 to 34 Years | 0 (0.0%) | 7 (0.4%) |
| 35 to 64 Years | 24 (1.1%) | 87 (4.1%) |
| 65 to 74 Years | 47 (13.6%) | 74 (20.5%) |
| 75 Years and over | 34 (17.8%) | 84 (28.6%) |
Disability Class: Self-Care Difficulty
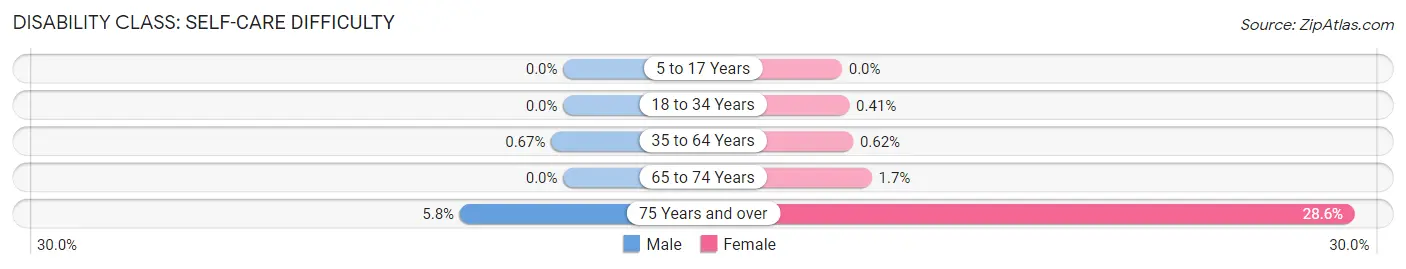
| Age Bracket | Male | Female |
| 5 to 17 Years | 0 (0.0%) | 0 (0.0%) |
| 18 to 34 Years | 0 (0.0%) | 7 (0.4%) |
| 35 to 64 Years | 14 (0.7%) | 13 (0.6%) |
| 65 to 74 Years | 0 (0.0%) | 6 (1.7%) |
| 75 Years and over | 11 (5.8%) | 84 (28.6%) |
Technology Access in Smithfield
Computing Device Access in Smithfield
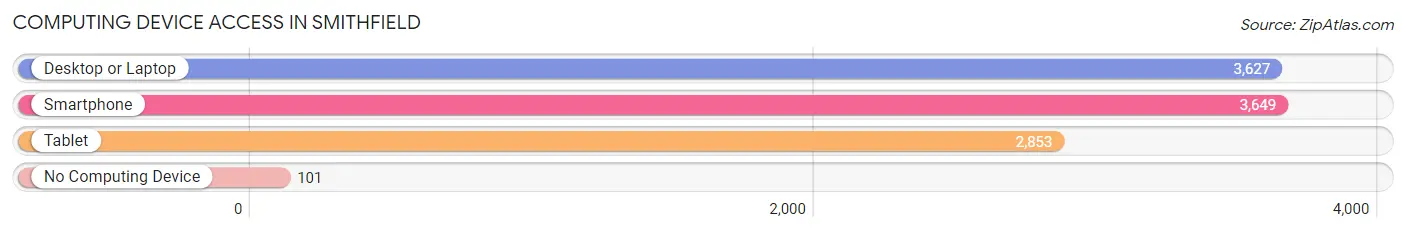
| Device Type | # Households | % Households |
| Desktop or Laptop | 3,627 | 93.1% |
| Smartphone | 3,649 | 93.7% |
| Tablet | 2,853 | 73.3% |
| No Computing Device | 101 | 2.6% |
| Total | 3,895 | 100.0% |
Internet Access in Smithfield
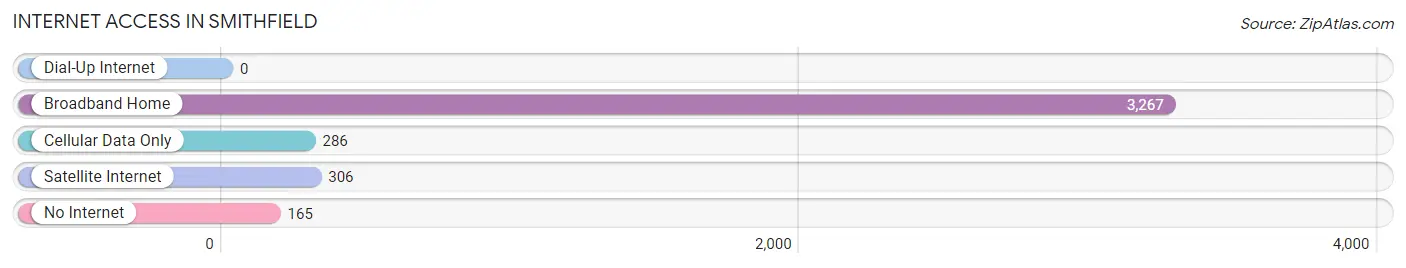
| Internet Type | # Households | % Households |
| Dial-Up Internet | 0 | 0.0% |
| Broadband Home | 3,267 | 83.9% |
| Cellular Data Only | 286 | 7.3% |
| Satellite Internet | 306 | 7.9% |
| No Internet | 165 | 4.2% |
| Total | 3,895 | 100.0% |
Smithfield Summary
Smithfield, Utah is a small city located in Cache County, Utah. It is situated in the northern part of the state, about 30 miles north of Logan and about 90 miles north of Salt Lake City. The city is located in a valley surrounded by mountains, and is known for its beautiful scenery and outdoor activities.
History
Smithfield was first settled in 1859 by a group of Mormon pioneers led by William Smith. The city was named after Smith, who was the first settler in the area. The settlers built a fort and a sawmill, and the area quickly grew. By the late 1800s, Smithfield had become a thriving agricultural community, with a population of over 1,000 people.
In the early 1900s, Smithfield began to experience a period of growth and development. The city was incorporated in 1909, and the first mayor was elected in 1910. The city continued to grow, and by the 1950s, it had become a popular tourist destination.
Geography
Smithfield is located in the northern part of Utah, in Cache County. It is situated in a valley surrounded by mountains, and is known for its beautiful scenery and outdoor activities. The city is located at an elevation of 4,890 feet, and has a total area of 4.3 square miles.
The climate in Smithfield is generally mild, with cold winters and warm summers. The average annual temperature is around 45 degrees Fahrenheit, and the average annual precipitation is around 17 inches.
Economy
Smithfield’s economy is largely based on agriculture and tourism. The city is home to several farms and ranches, and is known for its production of hay, potatoes, and other crops. Tourism is also an important part of the local economy, as the city is a popular destination for outdoor activities such as camping, fishing, and hiking.
In addition to agriculture and tourism, Smithfield is home to several businesses and industries. The city is home to several manufacturing companies, as well as a number of retail stores and restaurants.
Demographics
As of the 2010 census, Smithfield had a population of 9,495 people. The racial makeup of the city was 94.3% White, 0.7% African American, 0.4% Native American, 0.7% Asian, 0.1% Pacific Islander, 1.7% from other races, and 2.1% from two or more races. Hispanic or Latino of any race were 4.2% of the population.
The median household income in Smithfield was $50,945, and the median family income was $56,945. The per capita income was $21,945. About 8.3% of the population was below the poverty line.
Smithfield is a small city with a rich history and a vibrant economy. It is known for its beautiful scenery and outdoor activities, and is a popular destination for tourists and locals alike. The city is home to several businesses and industries, and is a great place to live and work.
Common Questions
What is Per Capita Income in Smithfield?
Per Capita income in Smithfield is $27,949.
What is the Median Family Income in Smithfield?
Median Family Income in Smithfield is $91,343.
What is the Median Household income in Smithfield?
Median Household Income in Smithfield is $87,175.
What is Income or Wage Gap in Smithfield?
Income or Wage Gap in Smithfield is 62.8%.
Women in Smithfield earn 37.2 cents for every dollar earned by a man.
What is Inequality or Gini Index in Smithfield?
Inequality or Gini Index in Smithfield is 0.34.
What is the Total Population of Smithfield?
Total Population of Smithfield is 13,658.
What is the Total Male Population of Smithfield?
Total Male Population of Smithfield is 6,948.
What is the Total Female Population of Smithfield?
Total Female Population of Smithfield is 6,710.
What is the Ratio of Males per 100 Females in Smithfield?
There are 103.55 Males per 100 Females in Smithfield.
What is the Ratio of Females per 100 Males in Smithfield?
There are 96.57 Females per 100 Males in Smithfield.
What is the Median Population Age in Smithfield?
Median Population Age in Smithfield is 28.0 Years.
What is the Average Family Size in Smithfield
Average Family Size in Smithfield is 3.9 People.
What is the Average Household Size in Smithfield
Average Household Size in Smithfield is 3.5 People.
How Large is the Labor Force in Smithfield?
There are 6,171 People in the Labor Forcein in Smithfield.
What is the Percentage of People in the Labor Force in Smithfield?
67.9% of People are in the Labor Force in Smithfield.
What is the Unemployment Rate in Smithfield?
Unemployment Rate in Smithfield is 2.7%.