Maeser, UT Map & Demographics
Maeser Map
Maeser Overview
$26,341
PER CAPITA INCOME
$85,819
AVG FAMILY INCOME
$67,389
AVG HOUSEHOLD INCOME
53.9%
WAGE / INCOME GAP [ % ]
46.1¢/ $1
WAGE / INCOME GAP [ $ ]
0.38
INEQUALITY / GINI INDEX
4,126
TOTAL POPULATION
1,948
MALE POPULATION
2,178
FEMALE POPULATION
89.44
MALES / 100 FEMALES
111.81
FEMALES / 100 MALES
33.4
MEDIAN AGE
3.6
AVG FAMILY SIZE
2.8
AVG HOUSEHOLD SIZE
1,565
LABOR FORCE [ PEOPLE ]
53.0%
PERCENT IN LABOR FORCE
3.5%
UNEMPLOYMENT RATE
Income in Maeser
Income Overview in Maeser
Per Capita Income in Maeser is $26,341, while median incomes of families and households are $85,819 and $67,389 respectively.
| Characteristic | Number | Measure |
| Per Capita Income | 4,126 | $26,341 |
| Median Family Income | 986 | $85,819 |
| Mean Family Income | 986 | $88,875 |
| Median Household Income | 1,480 | $67,389 |
| Mean Household Income | 1,480 | $72,964 |
| Income Deficit | 986 | $0 |
| Wage / Income Gap (%) | 4,126 | 53.94% |
| Wage / Income Gap ($) | 4,126 | 46.06¢ per $1 |
| Gini / Inequality Index | 4,126 | 0.38 |
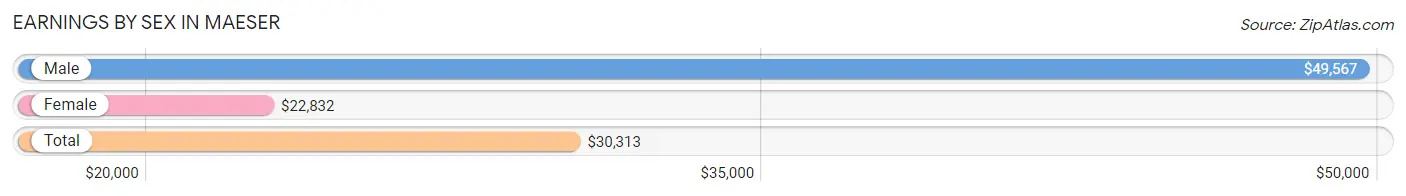
Earnings by Sex in Maeser
Average Earnings in Maeser are $30,313, $49,567 for men and $22,832 for women, a difference of 53.9%.
| Sex | Number | Average Earnings |
| Male | 1,003 (56.5%) | $49,567 |
| Female | 771 (43.5%) | $22,832 |
| Total | 1,774 (100.0%) | $30,313 |
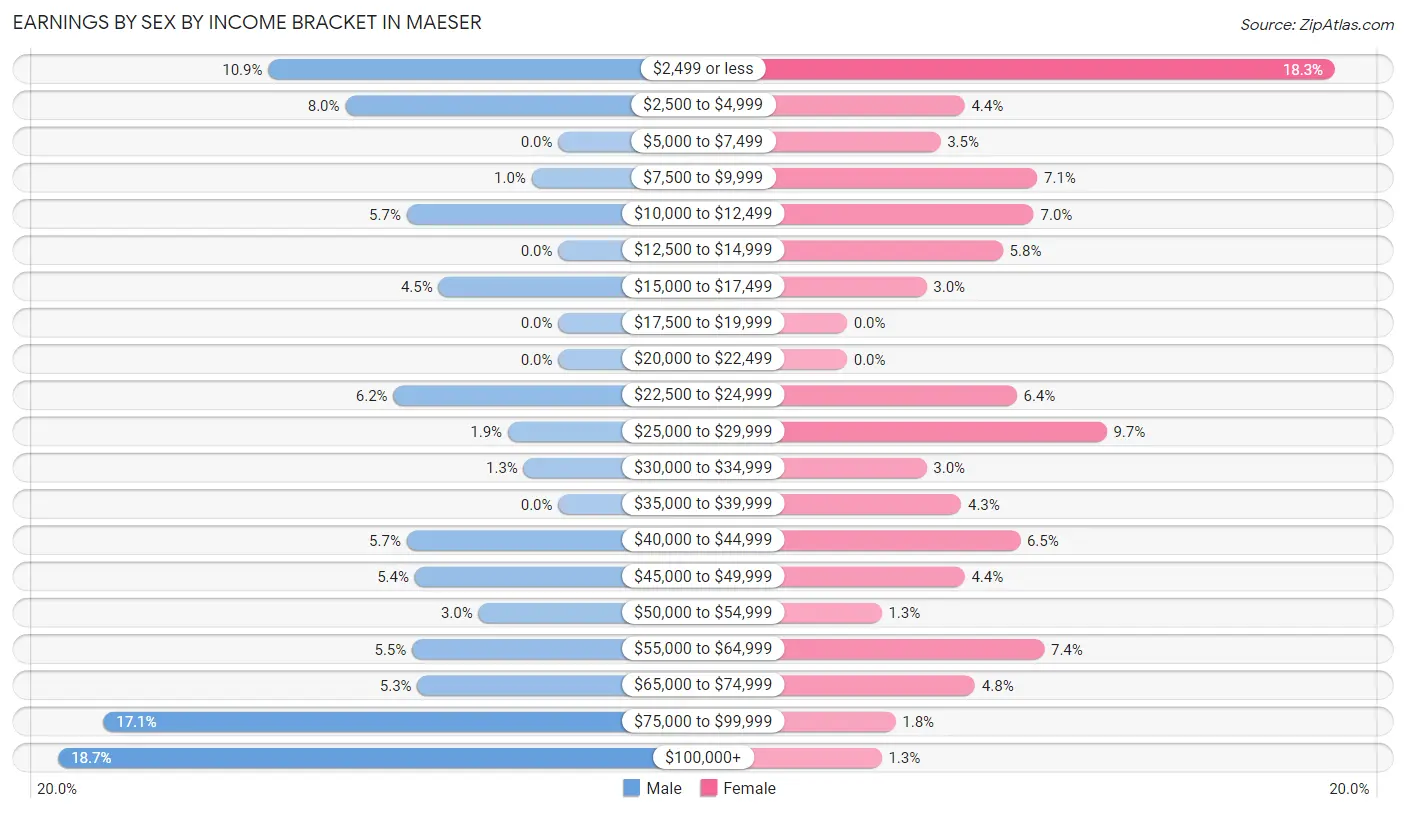
Earnings by Sex by Income Bracket in Maeser
The most common earnings brackets in Maeser are $100,000+ for men (188 | 18.7%) and $2,499 or less for women (141 | 18.3%).
| Income | Male | Female |
| $2,499 or less | 109 (10.9%) | 141 (18.3%) |
| $2,500 to $4,999 | 80 (8.0%) | 34 (4.4%) |
| $5,000 to $7,499 | 0 (0.0%) | 27 (3.5%) |
| $7,500 to $9,999 | 10 (1.0%) | 55 (7.1%) |
| $10,000 to $12,499 | 57 (5.7%) | 54 (7.0%) |
| $12,500 to $14,999 | 0 (0.0%) | 45 (5.8%) |
| $15,000 to $17,499 | 45 (4.5%) | 23 (3.0%) |
| $17,500 to $19,999 | 0 (0.0%) | 0 (0.0%) |
| $20,000 to $22,499 | 0 (0.0%) | 0 (0.0%) |
| $22,500 to $24,999 | 62 (6.2%) | 49 (6.4%) |
| $25,000 to $29,999 | 19 (1.9%) | 75 (9.7%) |
| $30,000 to $34,999 | 13 (1.3%) | 23 (3.0%) |
| $35,000 to $39,999 | 0 (0.0%) | 33 (4.3%) |
| $40,000 to $44,999 | 57 (5.7%) | 50 (6.5%) |
| $45,000 to $49,999 | 54 (5.4%) | 34 (4.4%) |
| $50,000 to $54,999 | 30 (3.0%) | 10 (1.3%) |
| $55,000 to $64,999 | 55 (5.5%) | 57 (7.4%) |
| $65,000 to $74,999 | 53 (5.3%) | 37 (4.8%) |
| $75,000 to $99,999 | 171 (17.1%) | 14 (1.8%) |
| $100,000+ | 188 (18.7%) | 10 (1.3%) |
| Total | 1,003 (100.0%) | 771 (100.0%) |
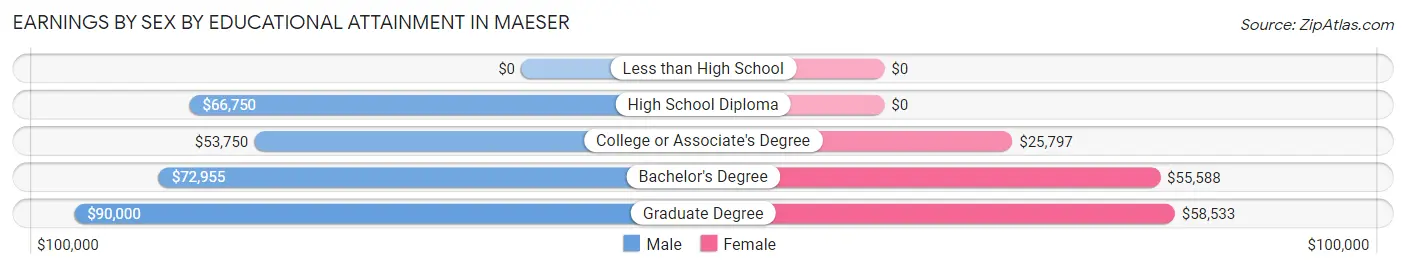
Earnings by Sex by Educational Attainment in Maeser
Average earnings in Maeser are $65,114 for men and $25,754 for women, a difference of 60.5%. Men with an educational attainment of graduate degree enjoy the highest average annual earnings of $90,000, while those with college or associate's degree education earn the least with $53,750. Women with an educational attainment of graduate degree earn the most with the average annual earnings of $58,533, while those with college or associate's degree education have the smallest earnings of $25,797.
| Educational Attainment | Male Income | Female Income |
| Less than High School | - | - |
| High School Diploma | $66,750 | $0 |
| College or Associate's Degree | $53,750 | $25,797 |
| Bachelor's Degree | $72,955 | $55,588 |
| Graduate Degree | $90,000 | $58,533 |
| Total | $65,114 | $25,754 |
Family Income in Maeser
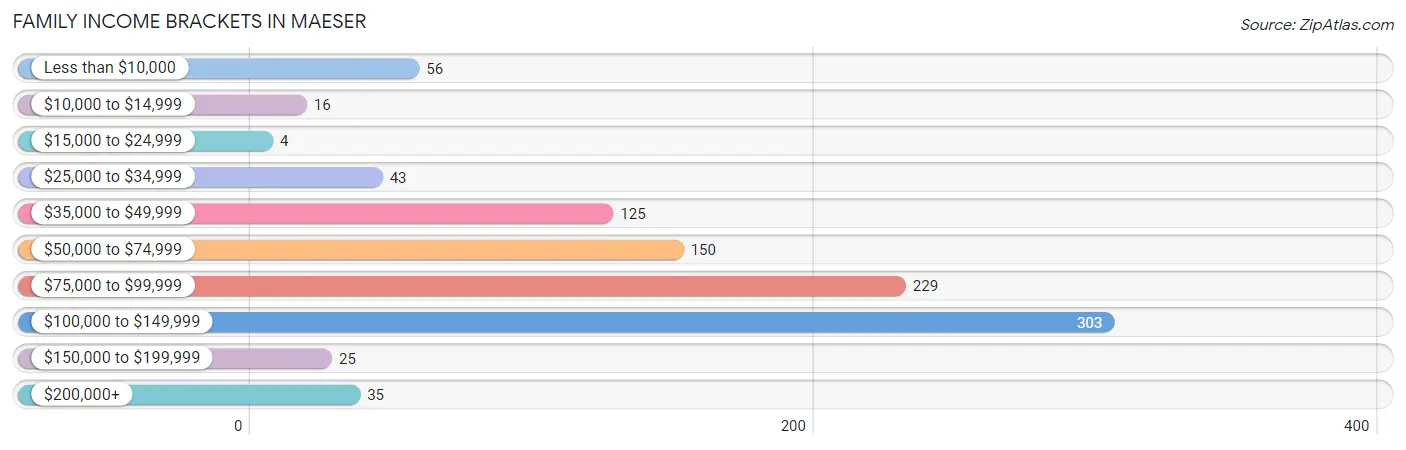
Family Income Brackets in Maeser
According to the Maeser family income data, there are 303 families falling into the $100,000 to $149,999 income range, which is the most common income bracket and makes up 30.7% of all families. Conversely, the $15,000 to $24,999 income bracket is the least frequent group with only 4 families (0.4%) belonging to this category.
| Income Bracket | # Families | % Families |
| Less than $10,000 | 56 | 5.7% |
| $10,000 to $14,999 | 16 | 1.6% |
| $15,000 to $24,999 | 4 | 0.4% |
| $25,000 to $34,999 | 43 | 4.4% |
| $35,000 to $49,999 | 125 | 12.7% |
| $50,000 to $74,999 | 150 | 15.2% |
| $75,000 to $99,999 | 229 | 23.2% |
| $100,000 to $149,999 | 303 | 30.7% |
| $150,000 to $199,999 | 25 | 2.5% |
| $200,000+ | 35 | 3.5% |
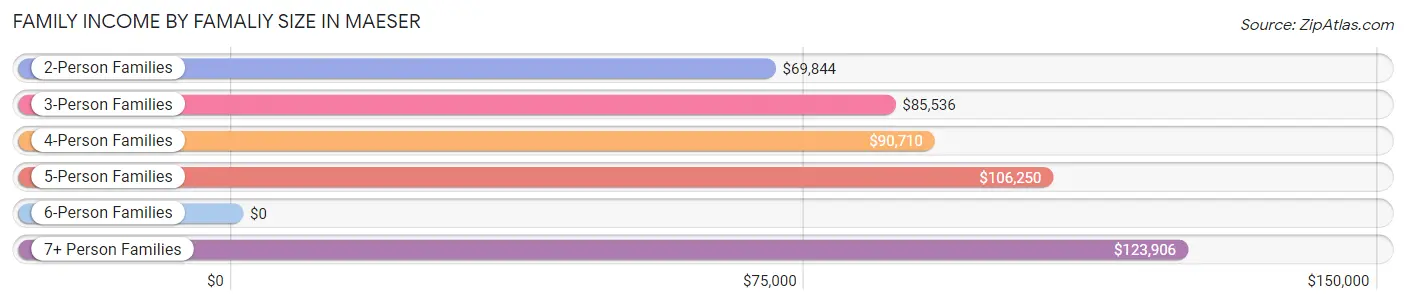
Family Income by Famaliy Size in Maeser
7+ person families (44 | 4.5%) account for the highest median family income in Maeser with $123,906 per family, while 2-person families (465 | 47.2%) have the highest median income of $34,922 per family member.
| Income Bracket | # Families | Median Income |
| 2-Person Families | 465 (47.2%) | $69,844 |
| 3-Person Families | 156 (15.8%) | $85,536 |
| 4-Person Families | 157 (15.9%) | $90,710 |
| 5-Person Families | 79 (8.0%) | $106,250 |
| 6-Person Families | 85 (8.6%) | $0 |
| 7+ Person Families | 44 (4.5%) | $123,906 |
| Total | 986 (100.0%) | $85,819 |
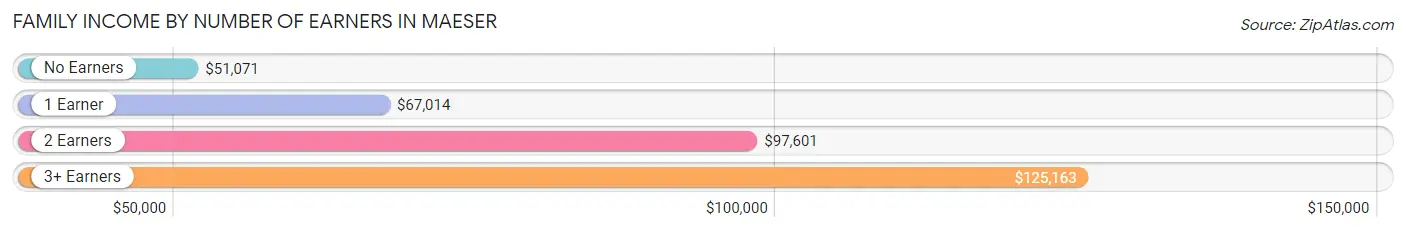
Family Income by Number of Earners in Maeser
The median family income in Maeser is $85,819, with families comprising 3+ earners (89) having the highest median family income of $125,163, while families with no earners (166) have the lowest median family income of $51,071, accounting for 9.0% and 16.8% of families, respectively.
| Number of Earners | # Families | Median Income |
| No Earners | 166 (16.8%) | $51,071 |
| 1 Earner | 362 (36.7%) | $67,014 |
| 2 Earners | 369 (37.4%) | $97,601 |
| 3+ Earners | 89 (9.0%) | $125,163 |
| Total | 986 (100.0%) | $85,819 |
Household Income in Maeser
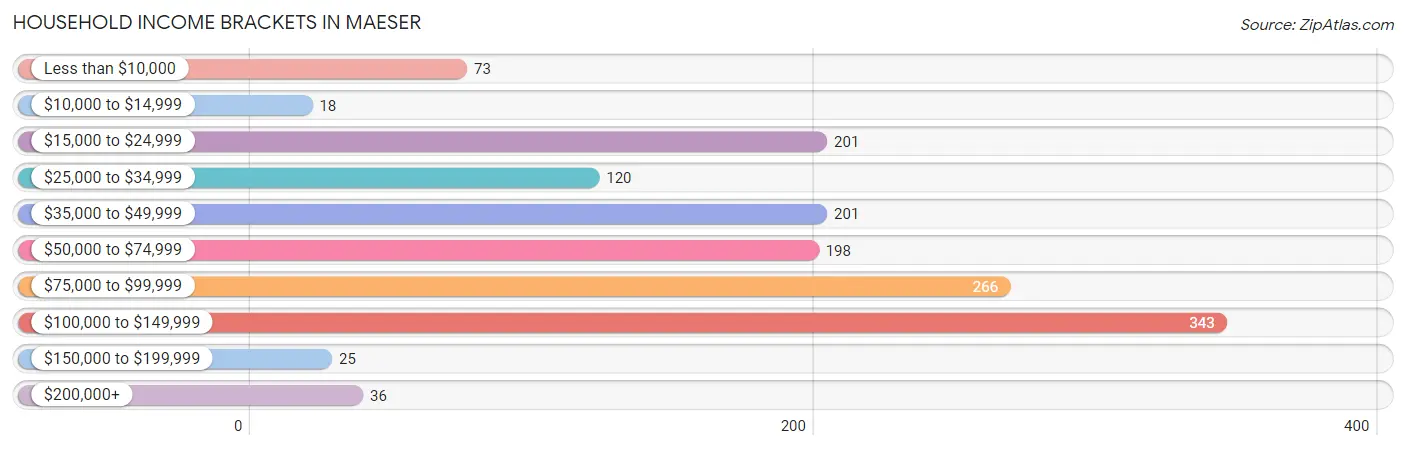
Household Income Brackets in Maeser
With 343 households falling in the category, the $100,000 to $149,999 income range is the most frequent in Maeser, accounting for 23.2% of all households. In contrast, only 18 households (1.2%) fall into the $10,000 to $14,999 income bracket, making it the least populous group.
| Income Bracket | # Households | % Households |
| Less than $10,000 | 73 | 4.9% |
| $10,000 to $14,999 | 18 | 1.2% |
| $15,000 to $24,999 | 201 | 13.6% |
| $25,000 to $34,999 | 120 | 8.1% |
| $35,000 to $49,999 | 201 | 13.6% |
| $50,000 to $74,999 | 198 | 13.4% |
| $75,000 to $99,999 | 266 | 18.0% |
| $100,000 to $149,999 | 343 | 23.2% |
| $150,000 to $199,999 | 25 | 1.7% |
| $200,000+ | 36 | 2.4% |
Household Income by Householder Age in Maeser
The median household income in Maeser is $67,389, with the highest median household income of $86,789 found in the 25 to 44 years age bracket for the primary householder. A total of 503 households (34.0%) fall into this category. Meanwhile, the 15 to 24 years age bracket for the primary householder has the lowest median household income of $0, with 62 households (4.2%) in this group.
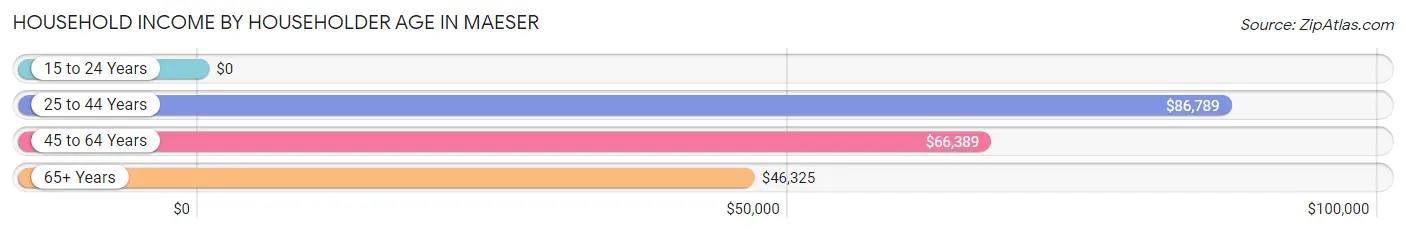
| Income Bracket | # Households | Median Income |
| 15 to 24 Years | 62 (4.2%) | $0 |
| 25 to 44 Years | 503 (34.0%) | $86,789 |
| 45 to 64 Years | 550 (37.2%) | $66,389 |
| 65+ Years | 365 (24.7%) | $46,325 |
| Total | 1,480 (100.0%) | $67,389 |
Poverty in Maeser
Income Below Poverty by Sex and Age in Maeser
With 8.1% poverty level for males and 9.7% for females among the residents of Maeser, 16 and 17 year old males and 65 to 74 year old females are the most vulnerable to poverty, with 27 males (27.3%) and 78 females (42.4%) in their respective age groups living below the poverty level.
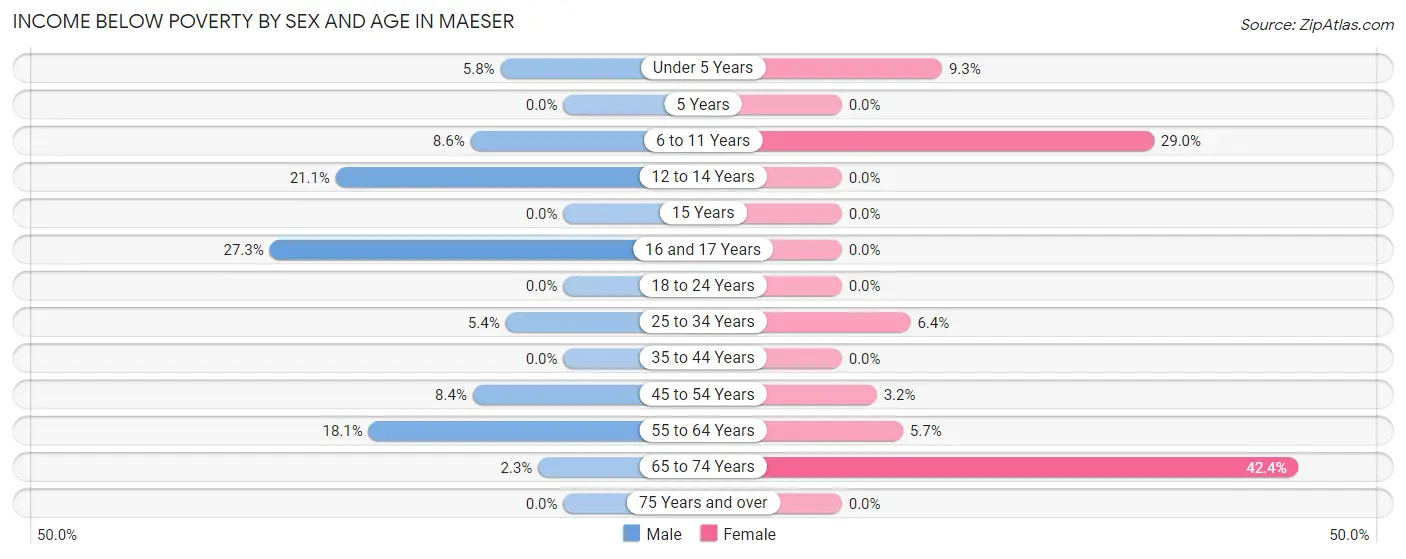
| Age Bracket | Male | Female |
| Under 5 Years | 8 (5.8%) | 8 (9.3%) |
| 5 Years | 0 (0.0%) | 0 (0.0%) |
| 6 to 11 Years | 20 (8.6%) | 86 (29.0%) |
| 12 to 14 Years | 30 (21.1%) | 0 (0.0%) |
| 15 Years | 0 (0.0%) | 0 (0.0%) |
| 16 and 17 Years | 27 (27.3%) | 0 (0.0%) |
| 18 to 24 Years | 0 (0.0%) | 0 (0.0%) |
| 25 to 34 Years | 11 (5.4%) | 16 (6.4%) |
| 35 to 44 Years | 0 (0.0%) | 0 (0.0%) |
| 45 to 54 Years | 9 (8.4%) | 6 (3.2%) |
| 55 to 64 Years | 47 (18.1%) | 16 (5.7%) |
| 65 to 74 Years | 5 (2.3%) | 78 (42.4%) |
| 75 Years and over | 0 (0.0%) | 0 (0.0%) |
| Total | 157 (8.1%) | 210 (9.7%) |
Income Above Poverty by Sex and Age in Maeser
According to the poverty statistics in Maeser, males aged 5 years and females aged 5 years are the age groups that are most secure financially, with 100.0% of males and 100.0% of females in these age groups living above the poverty line.
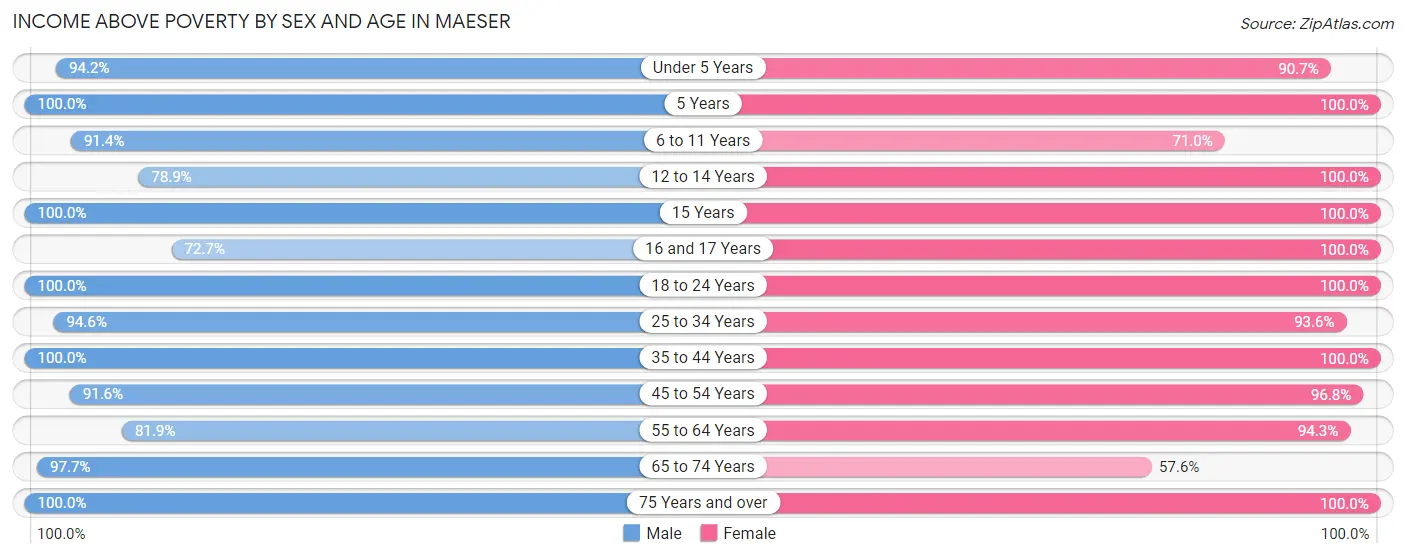
| Age Bracket | Male | Female |
| Under 5 Years | 129 (94.2%) | 78 (90.7%) |
| 5 Years | 40 (100.0%) | 50 (100.0%) |
| 6 to 11 Years | 212 (91.4%) | 211 (71.0%) |
| 12 to 14 Years | 112 (78.9%) | 110 (100.0%) |
| 15 Years | 30 (100.0%) | 32 (100.0%) |
| 16 and 17 Years | 72 (72.7%) | 110 (100.0%) |
| 18 to 24 Years | 136 (100.0%) | 152 (100.0%) |
| 25 to 34 Years | 194 (94.6%) | 235 (93.6%) |
| 35 to 44 Years | 243 (100.0%) | 288 (100.0%) |
| 45 to 54 Years | 98 (91.6%) | 179 (96.8%) |
| 55 to 64 Years | 213 (81.9%) | 266 (94.3%) |
| 65 to 74 Years | 209 (97.7%) | 106 (57.6%) |
| 75 Years and over | 103 (100.0%) | 134 (100.0%) |
| Total | 1,791 (91.9%) | 1,951 (90.3%) |
Income Below Poverty Among Married-Couple Families in Maeser
The poverty statistics for married-couple families in Maeser show that 7.0% or 63 of the total 904 families live below the poverty line. Families with no children have the highest poverty rate of 9.8%, comprising of 47 families. On the other hand, families with 5 or more children have the lowest poverty rate of 0.0%, which includes 0 families.
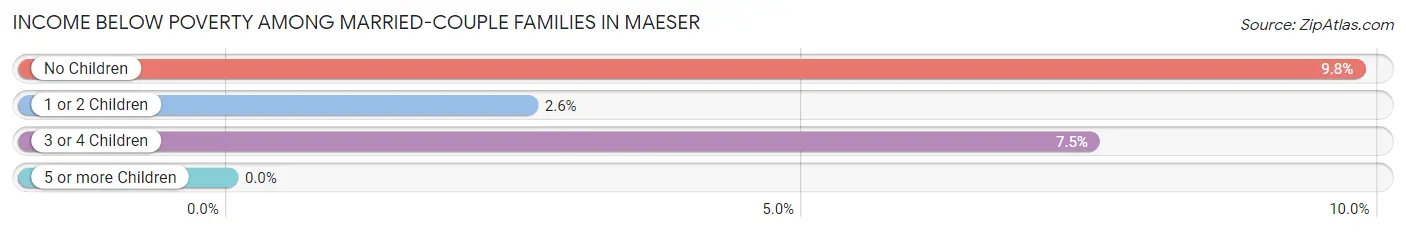
| Children | Above Poverty | Below Poverty |
| No Children | 432 (90.2%) | 47 (9.8%) |
| 1 or 2 Children | 261 (97.4%) | 7 (2.6%) |
| 3 or 4 Children | 111 (92.5%) | 9 (7.5%) |
| 5 or more Children | 37 (100.0%) | 0 (0.0%) |
| Total | 841 (93.0%) | 63 (7.0%) |
Income Below Poverty Among Single-Parent Households in Maeser
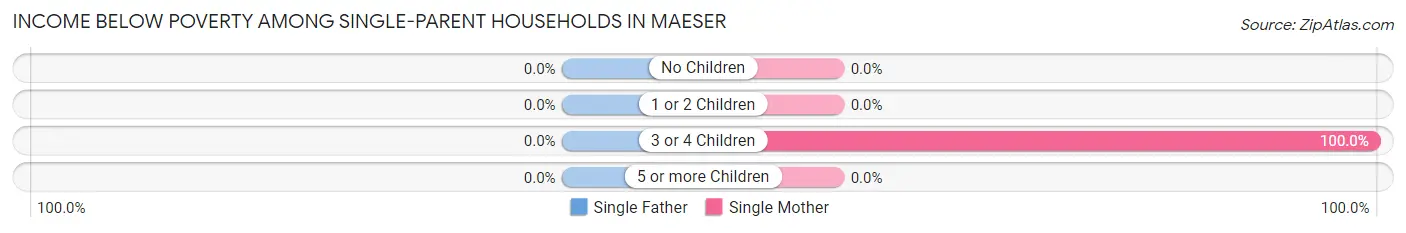
| Children | Single Father | Single Mother |
| No Children | 0 (0.0%) | 0 (0.0%) |
| 1 or 2 Children | 0 (0.0%) | 0 (0.0%) |
| 3 or 4 Children | 0 (0.0%) | 9 (100.0%) |
| 5 or more Children | 0 (0.0%) | 0 (0.0%) |
| Total | 0 (0.0%) | 9 (15.2%) |
Income Below Poverty Among Married-Couple vs Single-Parent Households in Maeser
The poverty data for Maeser shows that 63 of the married-couple family households (7.0%) and 9 of the single-parent households (11.0%) are living below the poverty level. Within the married-couple family households, those with no children have the highest poverty rate, with 47 households (9.8%) falling below the poverty line. Among the single-parent households, those with 3 or 4 children have the highest poverty rate, with 9 household (52.9%) living below poverty.
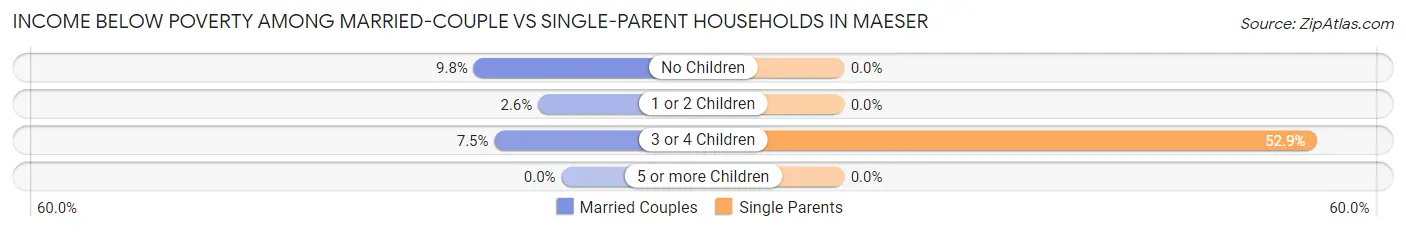
| Children | Married-Couple Families | Single-Parent Households |
| No Children | 47 (9.8%) | 0 (0.0%) |
| 1 or 2 Children | 7 (2.6%) | 0 (0.0%) |
| 3 or 4 Children | 9 (7.5%) | 9 (52.9%) |
| 5 or more Children | 0 (0.0%) | 0 (0.0%) |
| Total | 63 (7.0%) | 9 (11.0%) |
Race in Maeser
The most populous races in Maeser are White / Caucasian (3,649 | 88.4%), Hispanic or Latino (320 | 7.8%), and Two or more Races (232 | 5.6%).
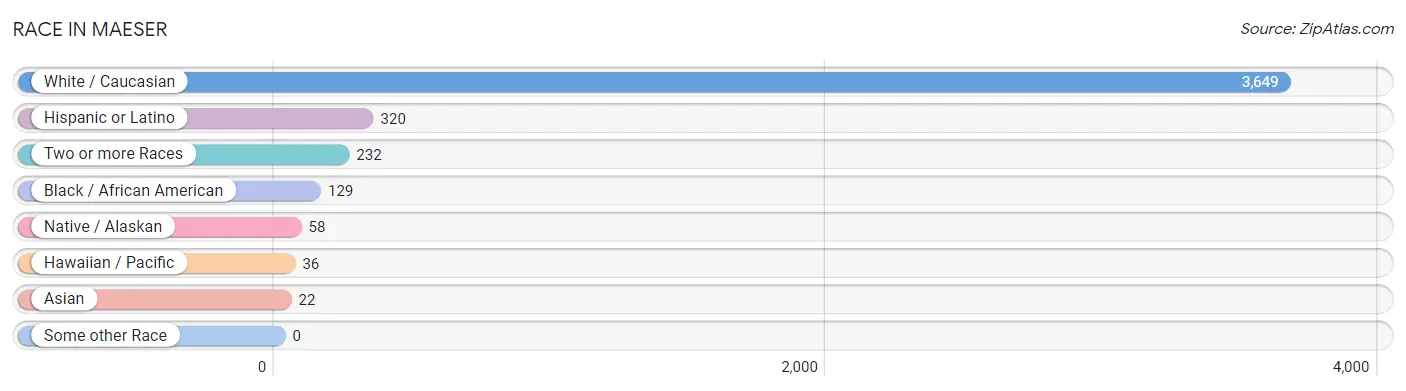
| Race | # Population | % Population |
| Asian | 22 | 0.5% |
| Black / African American | 129 | 3.1% |
| Hawaiian / Pacific | 36 | 0.9% |
| Hispanic or Latino | 320 | 7.8% |
| Native / Alaskan | 58 | 1.4% |
| White / Caucasian | 3,649 | 88.4% |
| Two or more Races | 232 | 5.6% |
| Some other Race | 0 | 0.0% |
| Total | 4,126 | 100.0% |
Ancestry in Maeser
The most populous ancestries reported in Maeser are English (1,317 | 31.9%), German (520 | 12.6%), European (349 | 8.5%), American (324 | 7.9%), and Scottish (288 | 7.0%), together accounting for 67.8% of all Maeser residents.
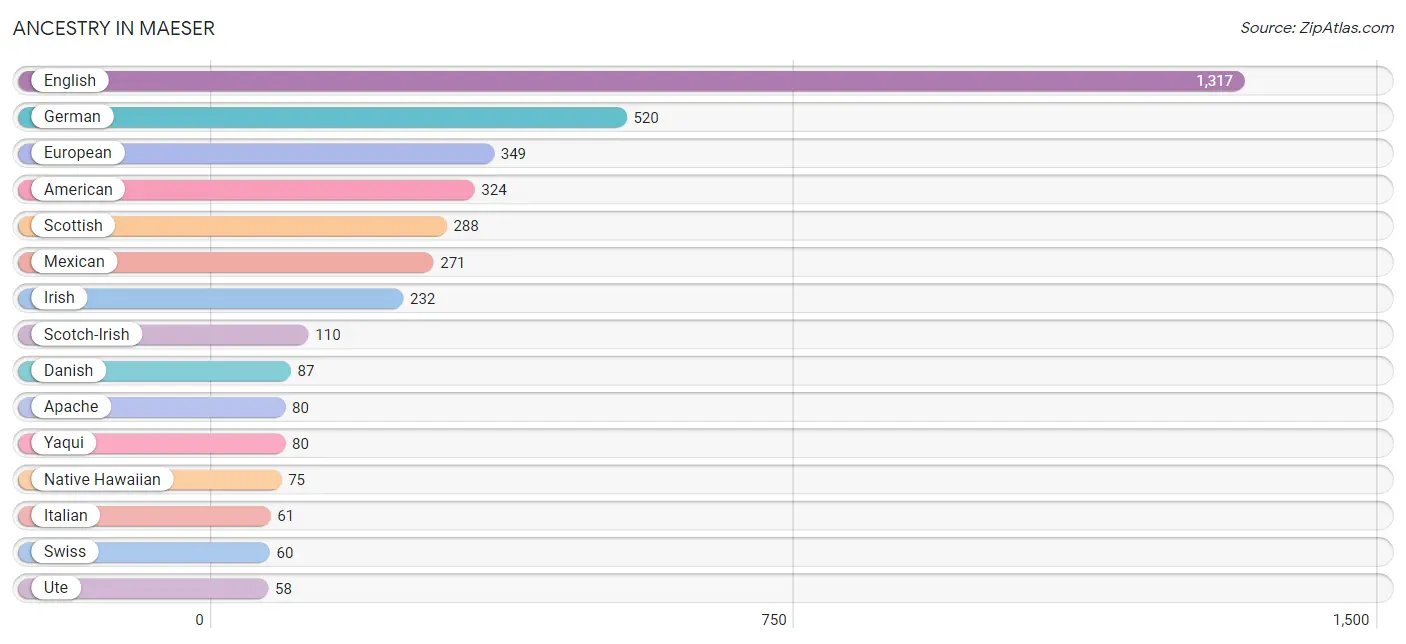
| Ancestry | # Population | % Population |
| American | 324 | 7.9% |
| Apache | 80 | 1.9% |
| Basque | 11 | 0.3% |
| British | 20 | 0.5% |
| Danish | 87 | 2.1% |
| Dutch | 32 | 0.8% |
| English | 1,317 | 31.9% |
| European | 349 | 8.5% |
| French | 24 | 0.6% |
| German | 520 | 12.6% |
| Greek | 9 | 0.2% |
| Indian (Asian) | 22 | 0.5% |
| Irish | 232 | 5.6% |
| Italian | 61 | 1.5% |
| Mexican | 271 | 6.6% |
| Native Hawaiian | 75 | 1.8% |
| Norwegian | 9 | 0.2% |
| Polish | 43 | 1.0% |
| Samoan | 18 | 0.4% |
| Scotch-Irish | 110 | 2.7% |
| Scottish | 288 | 7.0% |
| Spanish | 49 | 1.2% |
| Swedish | 36 | 0.9% |
| Swiss | 60 | 1.5% |
| Tongan | 18 | 0.4% |
| Ute | 58 | 1.4% |
| Welsh | 27 | 0.6% |
| Yaqui | 80 | 1.9% | View All 28 Rows |
Immigrants in Maeser
The most numerous immigrant groups reported in Maeser came from , and Oceania (36 | 0.9%), together accounting for 0.9% of all Maeser residents.

| Immigration Origin | # Population | % Population |
| Oceania | 36 | 0.9% | View All 1 Rows |
Sex and Age in Maeser
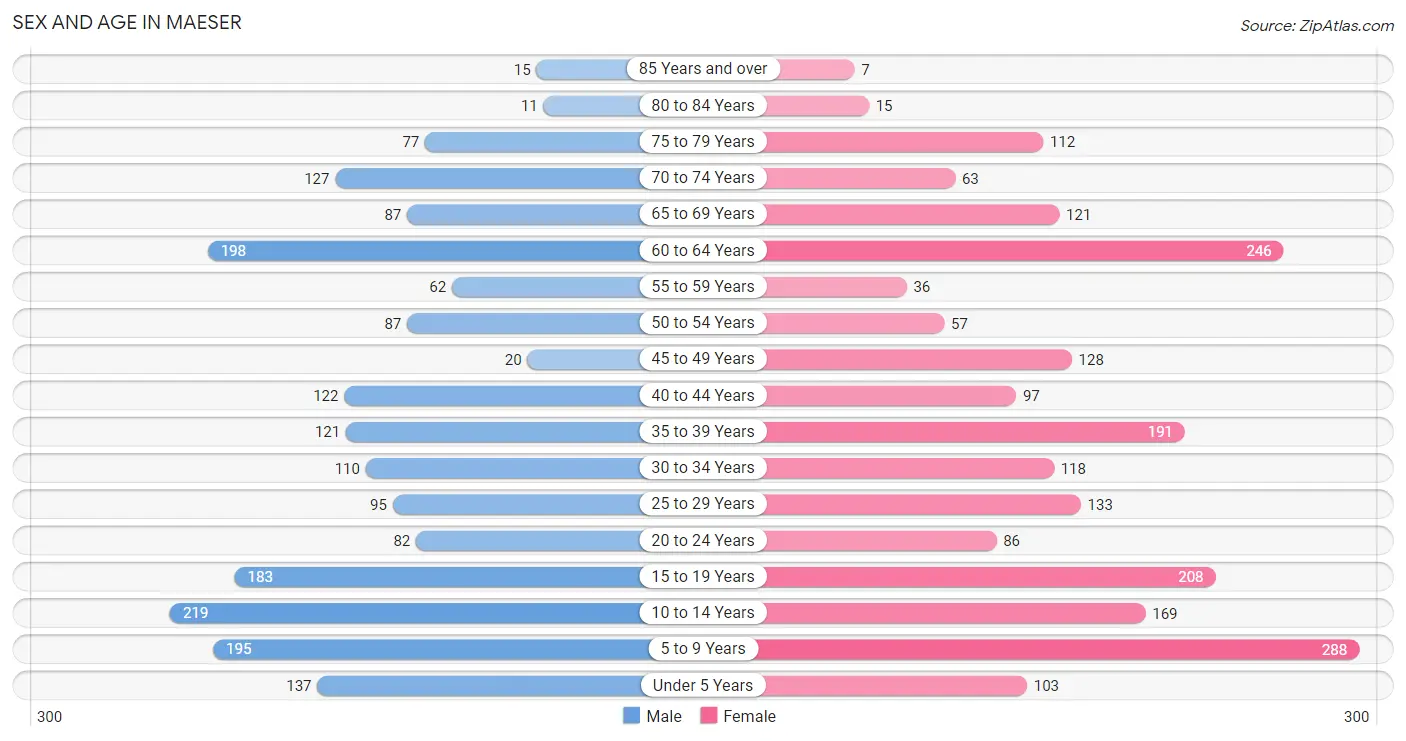
Sex and Age in Maeser
The most populous age groups in Maeser are 10 to 14 Years (219 | 11.2%) for men and 5 to 9 Years (288 | 13.2%) for women.
| Age Bracket | Male | Female |
| Under 5 Years | 137 (7.0%) | 103 (4.7%) |
| 5 to 9 Years | 195 (10.0%) | 288 (13.2%) |
| 10 to 14 Years | 219 (11.2%) | 169 (7.8%) |
| 15 to 19 Years | 183 (9.4%) | 208 (9.6%) |
| 20 to 24 Years | 82 (4.2%) | 86 (4.0%) |
| 25 to 29 Years | 95 (4.9%) | 133 (6.1%) |
| 30 to 34 Years | 110 (5.7%) | 118 (5.4%) |
| 35 to 39 Years | 121 (6.2%) | 191 (8.8%) |
| 40 to 44 Years | 122 (6.3%) | 97 (4.4%) |
| 45 to 49 Years | 20 (1.0%) | 128 (5.9%) |
| 50 to 54 Years | 87 (4.5%) | 57 (2.6%) |
| 55 to 59 Years | 62 (3.2%) | 36 (1.7%) |
| 60 to 64 Years | 198 (10.2%) | 246 (11.3%) |
| 65 to 69 Years | 87 (4.5%) | 121 (5.6%) |
| 70 to 74 Years | 127 (6.5%) | 63 (2.9%) |
| 75 to 79 Years | 77 (4.0%) | 112 (5.1%) |
| 80 to 84 Years | 11 (0.6%) | 15 (0.7%) |
| 85 Years and over | 15 (0.8%) | 7 (0.3%) |
| Total | 1,948 (100.0%) | 2,178 (100.0%) |
Families and Households in Maeser
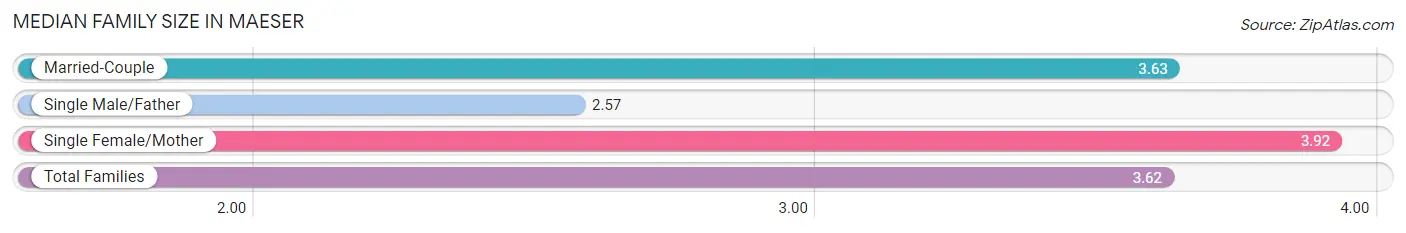
Median Family Size in Maeser
The median family size in Maeser is 3.62 persons per family, with single female/mother families (59 | 6.0%) accounting for the largest median family size of 3.92 persons per family. On the other hand, single male/father families (23 | 2.3%) represent the smallest median family size with 2.57 persons per family.
| Family Type | # Families | Family Size |
| Married-Couple | 904 (91.7%) | 3.63 |
| Single Male/Father | 23 (2.3%) | 2.57 |
| Single Female/Mother | 59 (6.0%) | 3.92 |
| Total Families | 986 (100.0%) | 3.62 |
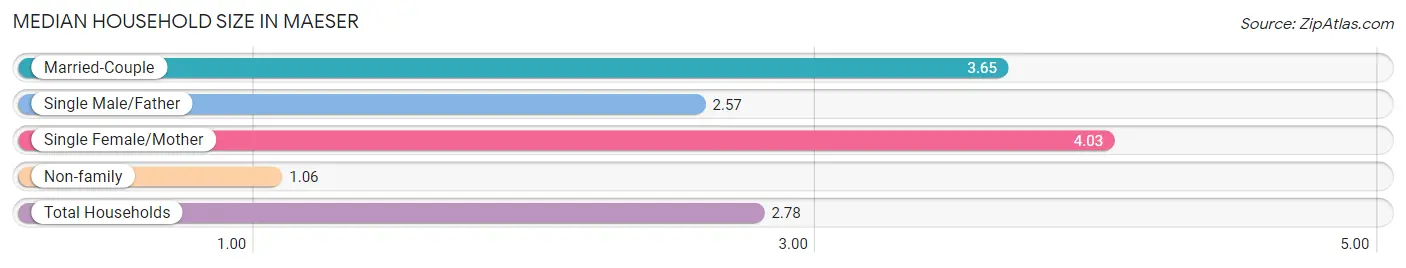
Median Household Size in Maeser
The median household size in Maeser is 2.78 persons per household, with single female/mother households (59 | 4.0%) accounting for the largest median household size of 4.03 persons per household. non-family households (494 | 33.4%) represent the smallest median household size with 1.06 persons per household.
| Household Type | # Households | Household Size |
| Married-Couple | 904 (61.1%) | 3.65 |
| Single Male/Father | 23 (1.5%) | 2.57 |
| Single Female/Mother | 59 (4.0%) | 4.03 |
| Non-family | 494 (33.4%) | 1.06 |
| Total Households | 1,480 (100.0%) | 2.78 |
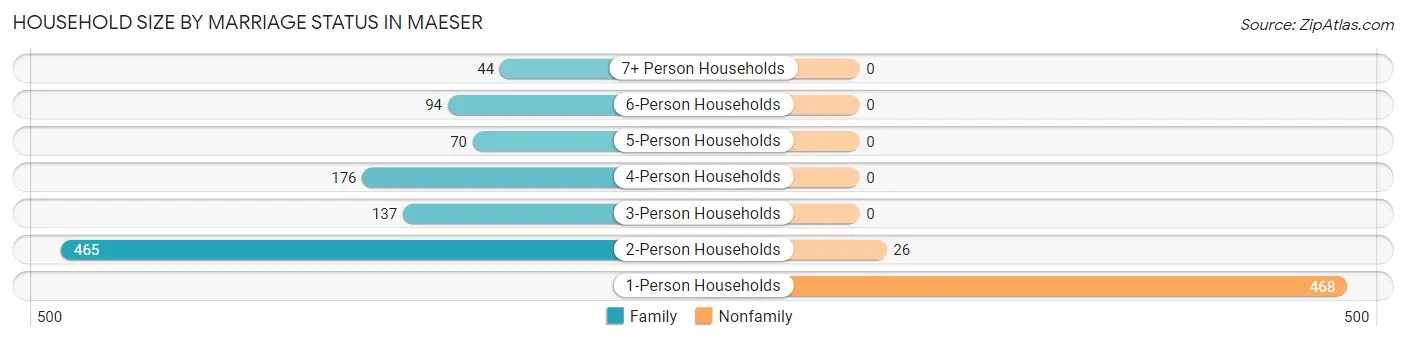
Household Size by Marriage Status in Maeser
Out of a total of 1,480 households in Maeser, 986 (66.6%) are family households, while 494 (33.4%) are nonfamily households. The most numerous type of family households are 2-person households, comprising 465, and the most common type of nonfamily households are 1-person households, comprising 468.
| Household Size | Family Households | Nonfamily Households |
| 1-Person Households | - | 468 (31.6%) |
| 2-Person Households | 465 (31.4%) | 26 (1.8%) |
| 3-Person Households | 137 (9.3%) | 0 (0.0%) |
| 4-Person Households | 176 (11.9%) | 0 (0.0%) |
| 5-Person Households | 70 (4.7%) | 0 (0.0%) |
| 6-Person Households | 94 (6.4%) | 0 (0.0%) |
| 7+ Person Households | 44 (3.0%) | 0 (0.0%) |
| Total | 986 (66.6%) | 494 (33.4%) |
Female Fertility in Maeser
Fertility by Age in Maeser
Average fertility rate in Maeser is 82.0 births per 1,000 women. Women in the age bracket of 20 to 34 years have the highest fertility rate with 234.0 births per 1,000 women. Women in the age bracket of 20 to 34 years acount for 100.0% of all women with births.
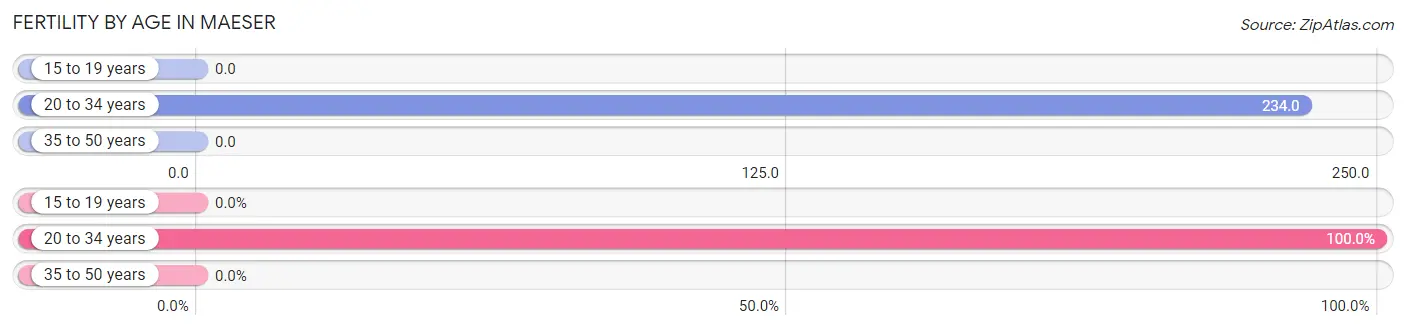
| Age Bracket | Women with Births | Births / 1,000 Women |
| 15 to 19 years | 0 (0.0%) | 0.0 |
| 20 to 34 years | 79 (100.0%) | 234.0 |
| 35 to 50 years | 0 (0.0%) | 0.0 |
| Total | 79 (100.0%) | 82.0 |
Fertility by Age by Marriage Status in Maeser
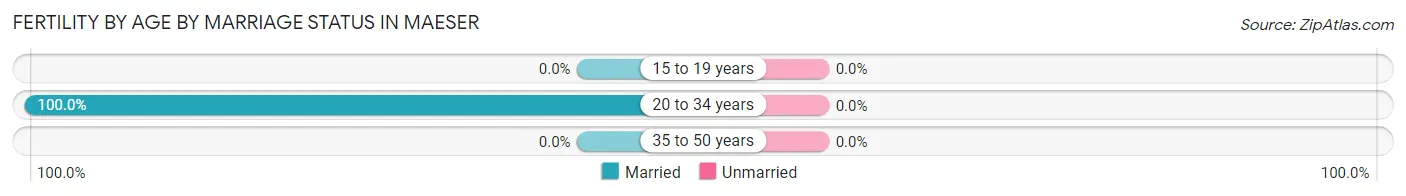
| Age Bracket | Married | Unmarried |
| 15 to 19 years | 0 (0.0%) | 0 (0.0%) |
| 20 to 34 years | 79 (100.0%) | 0 (0.0%) |
| 35 to 50 years | 0 (0.0%) | 0 (0.0%) |
| Total | 79 (100.0%) | 0 (0.0%) |
Fertility by Education in Maeser
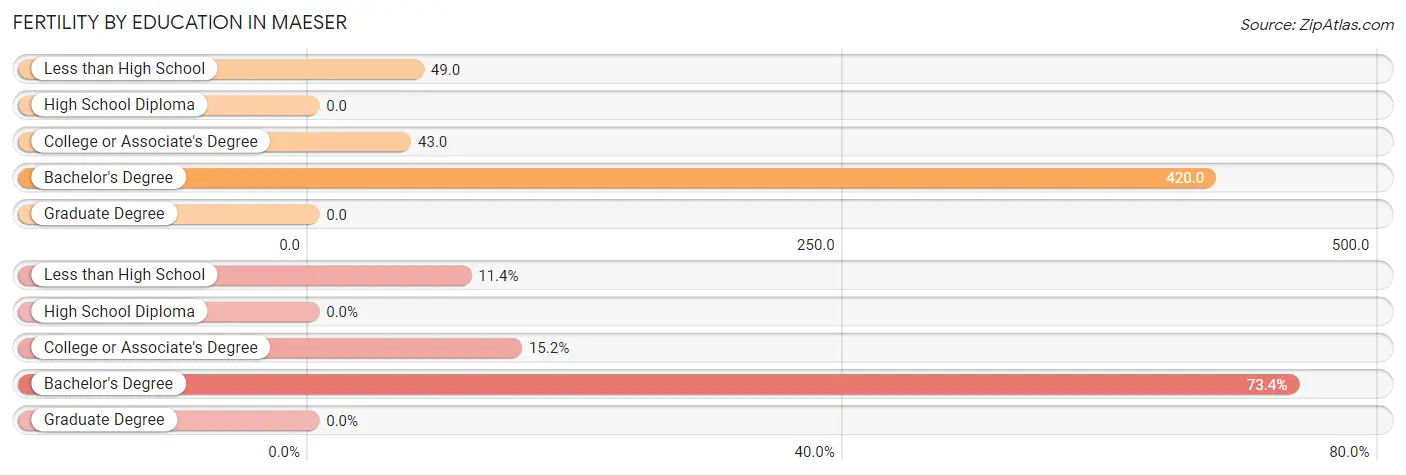
| Educational Attainment | Women with Births | Births / 1,000 Women |
| Less than High School | 9 (11.4%) | 49.0 |
| High School Diploma | 0 (0.0%) | 0.0 |
| College or Associate's Degree | 12 (15.2%) | 43.0 |
| Bachelor's Degree | 58 (73.4%) | 420.0 |
| Graduate Degree | 0 (0.0%) | 0.0 |
| Total | 79 (100.0%) | 82.0 |
Fertility by Education by Marriage Status in Maeser
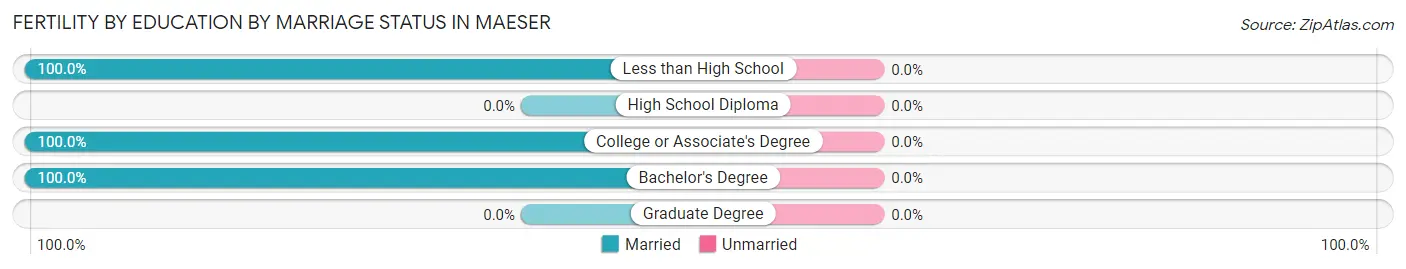
| Educational Attainment | Married | Unmarried |
| Less than High School | 9 (100.0%) | 0 (0.0%) |
| High School Diploma | 0 (0.0%) | 0 (0.0%) |
| College or Associate's Degree | 12 (100.0%) | 0 (0.0%) |
| Bachelor's Degree | 58 (100.0%) | 0 (0.0%) |
| Graduate Degree | 0 (0.0%) | 0 (0.0%) |
| Total | 79 (100.0%) | 0 (0.0%) |
Employment Characteristics in Maeser
Employment by Class of Employer in Maeser
Among the 1,430 employed individuals in Maeser, private company employees (791 | 55.3%), local government employees (282 | 19.7%), and self-employed (incorporated) (99 | 6.9%) make up the most common classes of employment.
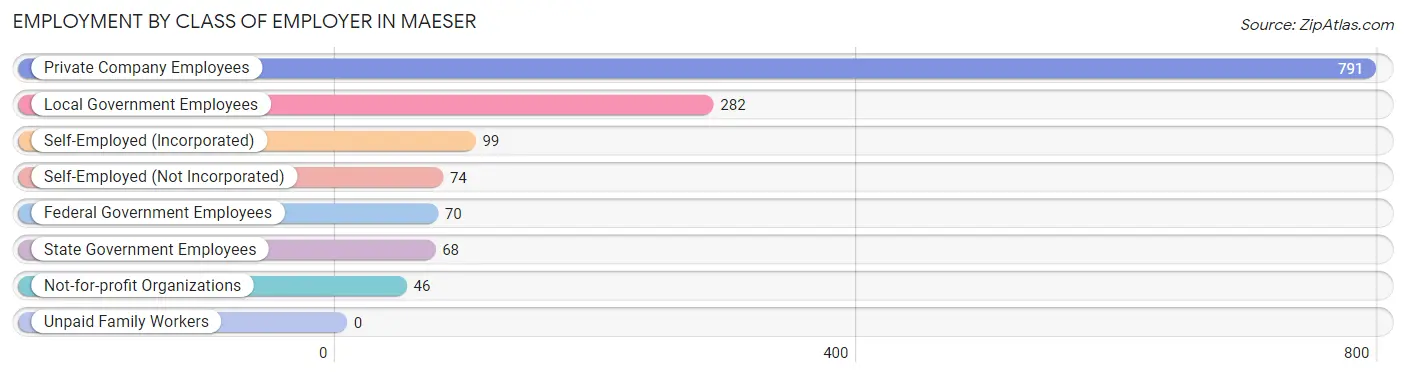
| Employer Class | # Employees | % Employees |
| Private Company Employees | 791 | 55.3% |
| Self-Employed (Incorporated) | 99 | 6.9% |
| Self-Employed (Not Incorporated) | 74 | 5.2% |
| Not-for-profit Organizations | 46 | 3.2% |
| Local Government Employees | 282 | 19.7% |
| State Government Employees | 68 | 4.8% |
| Federal Government Employees | 70 | 4.9% |
| Unpaid Family Workers | 0 | 0.0% |
| Total | 1,430 | 100.0% |
Employment Status by Age in Maeser
According to the labor force statistics for Maeser, out of the total population over 16 years of age (2,953), 53.0% or 1,565 individuals are in the labor force, with 3.5% or 55 of them unemployed. The age group with the highest labor force participation rate is 20 to 24 years, with 89.9% or 151 individuals in the labor force. Within the labor force, the 16 to 19 years age range has the highest percentage of unemployed individuals, with 27.6% or 37 of them being unemployed.
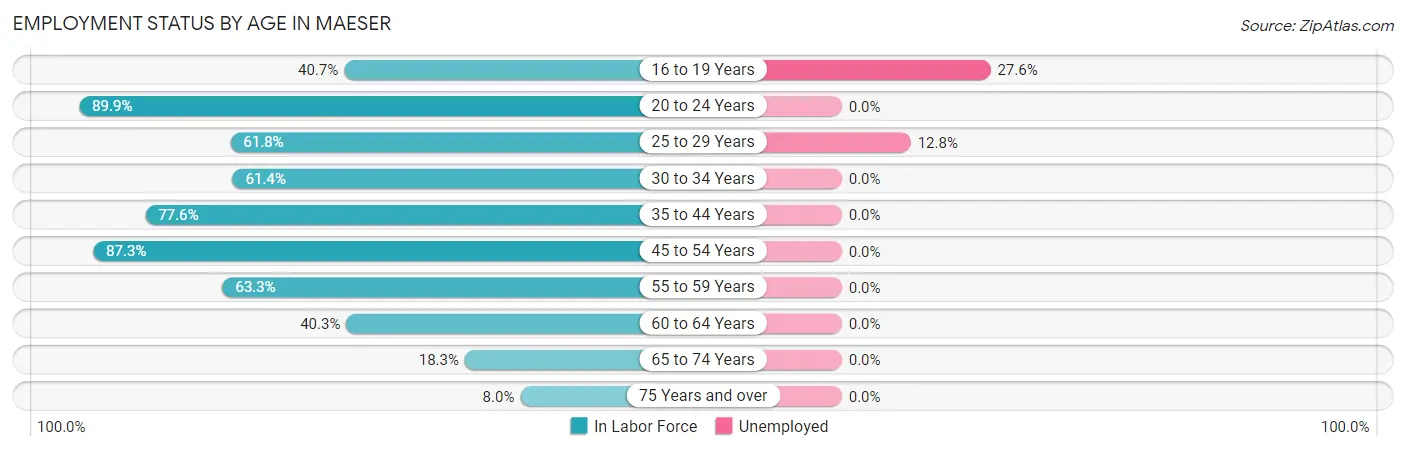
| Age Bracket | In Labor Force | Unemployed |
| 16 to 19 Years | 134 (40.7%) | 37 (27.6%) |
| 20 to 24 Years | 151 (89.9%) | 0 (0.0%) |
| 25 to 29 Years | 141 (61.8%) | 18 (12.8%) |
| 30 to 34 Years | 140 (61.4%) | 0 (0.0%) |
| 35 to 44 Years | 412 (77.6%) | 0 (0.0%) |
| 45 to 54 Years | 255 (87.3%) | 0 (0.0%) |
| 55 to 59 Years | 62 (63.3%) | 0 (0.0%) |
| 60 to 64 Years | 179 (40.3%) | 0 (0.0%) |
| 65 to 74 Years | 73 (18.3%) | 0 (0.0%) |
| 75 Years and over | 19 (8.0%) | 0 (0.0%) |
| Total | 1,565 (53.0%) | 55 (3.5%) |
Employment Status by Educational Attainment in Maeser
According to labor force statistics for Maeser, 65.3% of individuals (1,189) out of the total population between 25 and 64 years of age (1,821) are in the labor force, with 1.5% or 18 of them being unemployed. The group with the highest labor force participation rate are those with the educational attainment of less than high school, with 75.6% or 146 individuals in the labor force. Within the labor force, individuals with college / associate degree education have the highest percentage of unemployment, with 5.5% or 18 of them being unemployed.
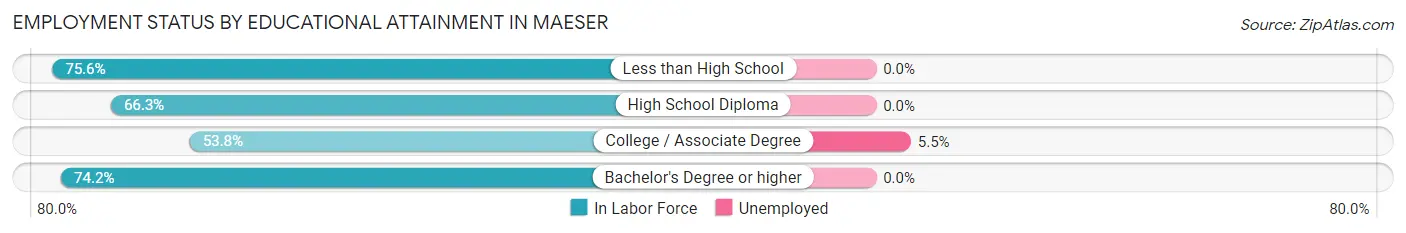
| Educational Attainment | In Labor Force | Unemployed |
| Less than High School | 146 (75.6%) | 0 (0.0%) |
| High School Diploma | 347 (66.3%) | 0 (0.0%) |
| College / Associate Degree | 327 (53.8%) | 33 (5.5%) |
| Bachelor's Degree or higher | 369 (74.2%) | 0 (0.0%) |
| Total | 1,189 (65.3%) | 27 (1.5%) |
Employment Occupations by Sex in Maeser
Management, Business, Science and Arts Occupations
The most common Management, Business, Science and Arts occupations in Maeser are Community & Social Service (212 | 14.0%), Education Instruction & Library (190 | 12.6%), Computers, Engineering & Science (82 | 5.4%), Business & Financial (72 | 4.8%), and Management (69 | 4.6%).
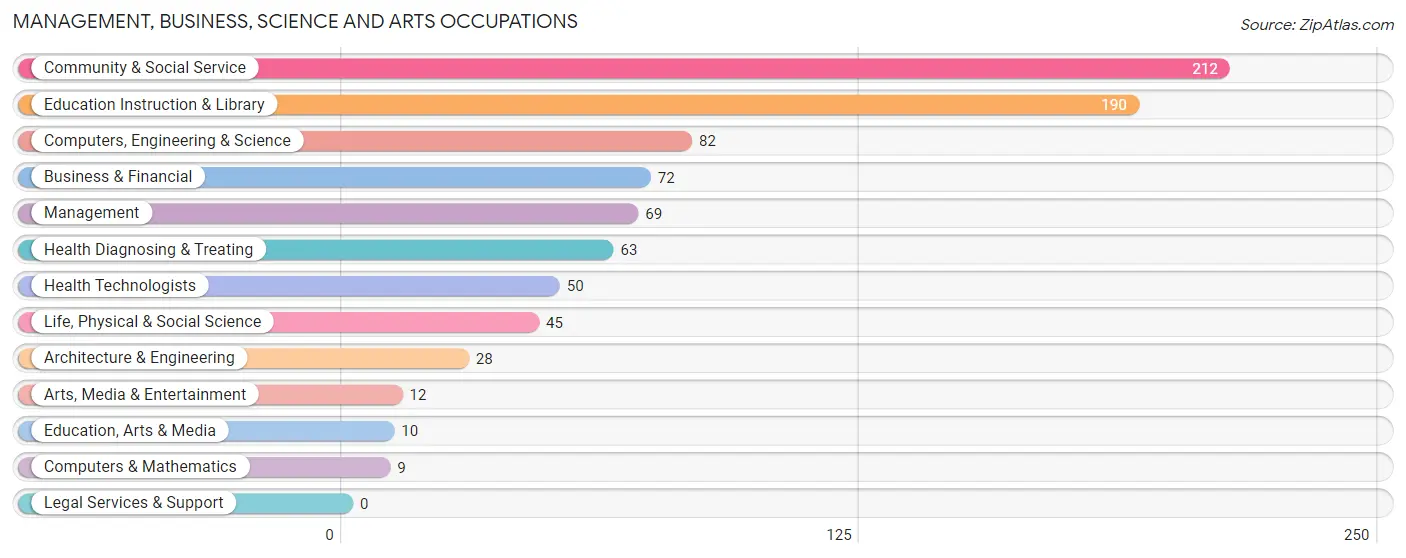
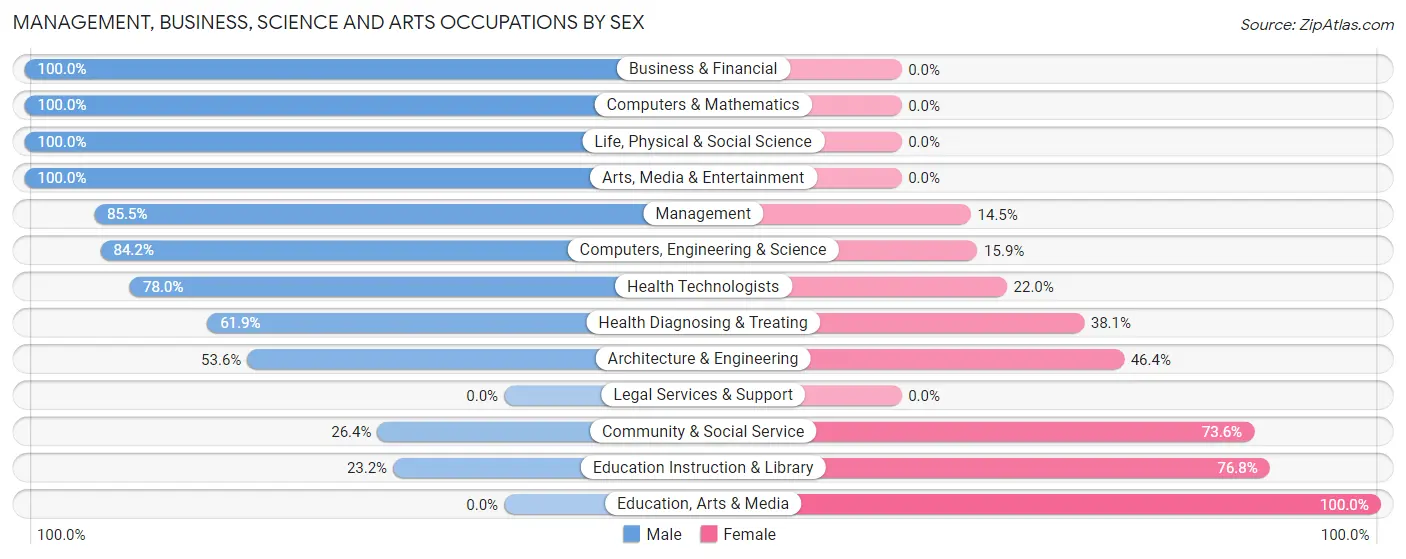
Management, Business, Science and Arts Occupations by Sex
Within the Management, Business, Science and Arts occupations in Maeser, the most male-oriented occupations are Business & Financial (100.0%), Computers & Mathematics (100.0%), and Life, Physical & Social Science (100.0%), while the most female-oriented occupations are Education, Arts & Media (100.0%), Education Instruction & Library (76.8%), and Community & Social Service (73.6%).
| Occupation | Male | Female |
| Management | 59 (85.5%) | 10 (14.5%) |
| Business & Financial | 72 (100.0%) | 0 (0.0%) |
| Computers, Engineering & Science | 69 (84.2%) | 13 (15.9%) |
| Computers & Mathematics | 9 (100.0%) | 0 (0.0%) |
| Architecture & Engineering | 15 (53.6%) | 13 (46.4%) |
| Life, Physical & Social Science | 45 (100.0%) | 0 (0.0%) |
| Community & Social Service | 56 (26.4%) | 156 (73.6%) |
| Education, Arts & Media | 0 (0.0%) | 10 (100.0%) |
| Legal Services & Support | 0 (0.0%) | 0 (0.0%) |
| Education Instruction & Library | 44 (23.2%) | 146 (76.8%) |
| Arts, Media & Entertainment | 12 (100.0%) | 0 (0.0%) |
| Health Diagnosing & Treating | 39 (61.9%) | 24 (38.1%) |
| Health Technologists | 39 (78.0%) | 11 (22.0%) |
| Total (Category) | 295 (59.2%) | 203 (40.8%) |
| Total (Overall) | 857 (56.7%) | 654 (43.3%) |
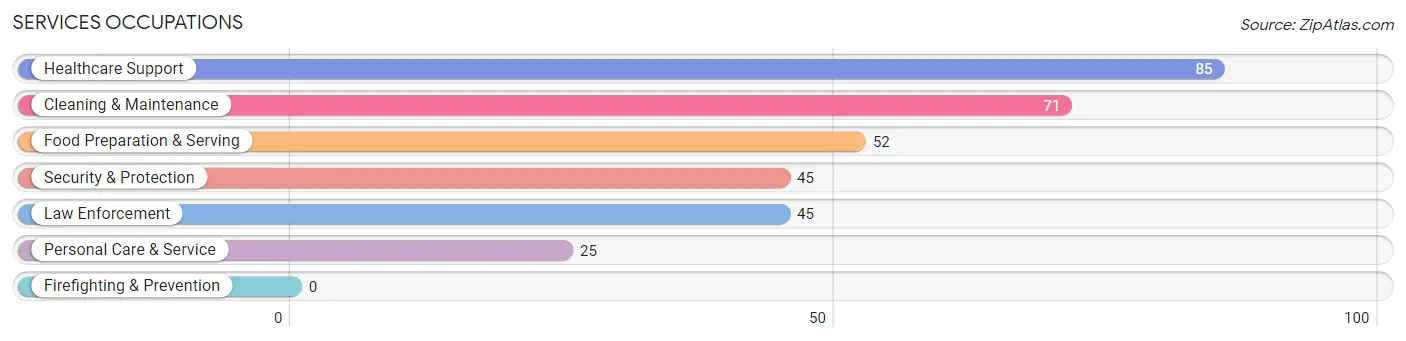
Services Occupations
The most common Services occupations in Maeser are Healthcare Support (85 | 5.6%), Cleaning & Maintenance (71 | 4.7%), Food Preparation & Serving (52 | 3.4%), Security & Protection (45 | 3.0%), and Law Enforcement (45 | 3.0%).
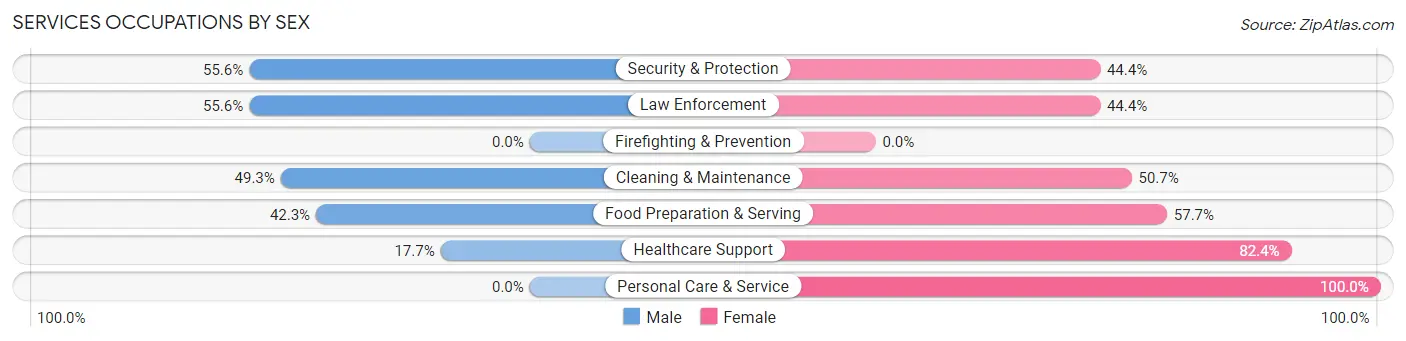
Services Occupations by Sex
Within the Services occupations in Maeser, the most male-oriented occupations are Security & Protection (55.6%), Law Enforcement (55.6%), and Cleaning & Maintenance (49.3%), while the most female-oriented occupations are Personal Care & Service (100.0%), Healthcare Support (82.4%), and Food Preparation & Serving (57.7%).
| Occupation | Male | Female |
| Healthcare Support | 15 (17.6%) | 70 (82.4%) |
| Security & Protection | 25 (55.6%) | 20 (44.4%) |
| Firefighting & Prevention | 0 (0.0%) | 0 (0.0%) |
| Law Enforcement | 25 (55.6%) | 20 (44.4%) |
| Food Preparation & Serving | 22 (42.3%) | 30 (57.7%) |
| Cleaning & Maintenance | 35 (49.3%) | 36 (50.7%) |
| Personal Care & Service | 0 (0.0%) | 25 (100.0%) |
| Total (Category) | 97 (34.9%) | 181 (65.1%) |
| Total (Overall) | 857 (56.7%) | 654 (43.3%) |
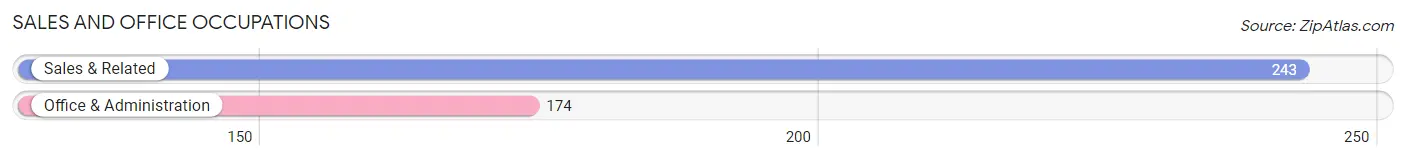
Sales and Office Occupations
The most common Sales and Office occupations in Maeser are Sales & Related (243 | 16.1%), and Office & Administration (174 | 11.5%).
Sales and Office Occupations by Sex
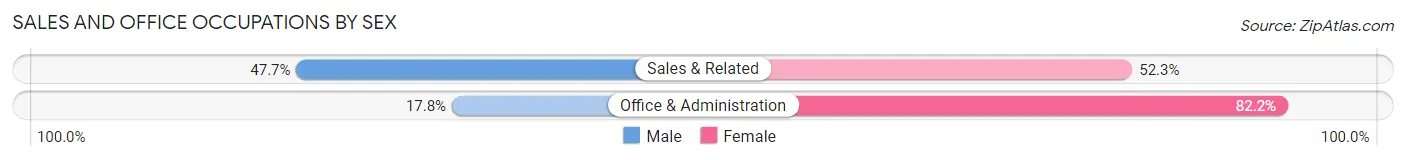
| Occupation | Male | Female |
| Sales & Related | 116 (47.7%) | 127 (52.3%) |
| Office & Administration | 31 (17.8%) | 143 (82.2%) |
| Total (Category) | 147 (35.2%) | 270 (64.7%) |
| Total (Overall) | 857 (56.7%) | 654 (43.3%) |
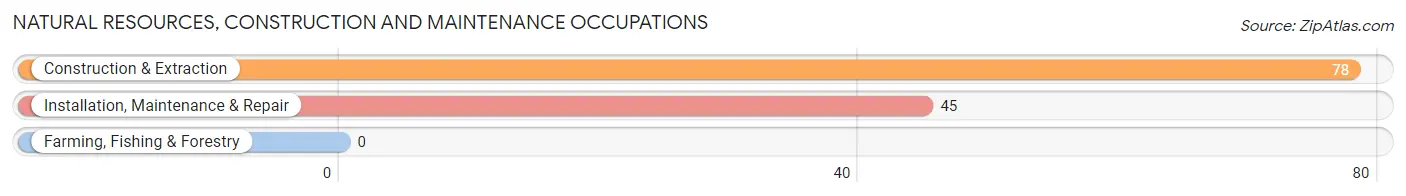
Natural Resources, Construction and Maintenance Occupations
The most common Natural Resources, Construction and Maintenance occupations in Maeser are Construction & Extraction (78 | 5.2%), and Installation, Maintenance & Repair (45 | 3.0%).
Natural Resources, Construction and Maintenance Occupations by Sex
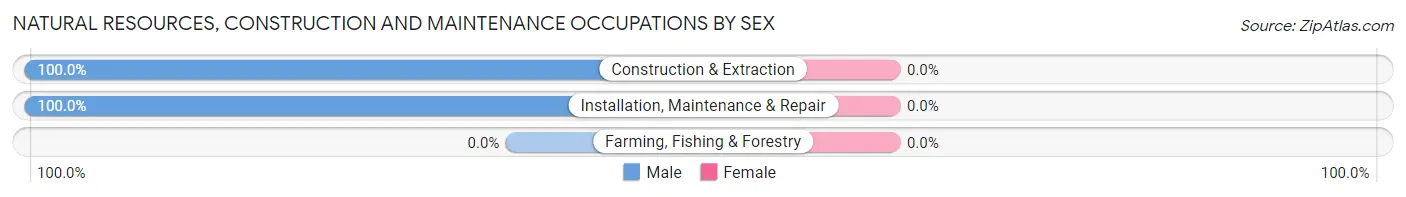
| Occupation | Male | Female |
| Farming, Fishing & Forestry | 0 (0.0%) | 0 (0.0%) |
| Construction & Extraction | 78 (100.0%) | 0 (0.0%) |
| Installation, Maintenance & Repair | 45 (100.0%) | 0 (0.0%) |
| Total (Category) | 123 (100.0%) | 0 (0.0%) |
| Total (Overall) | 857 (56.7%) | 654 (43.3%) |
Production, Transportation and Moving Occupations
The most common Production, Transportation and Moving occupations in Maeser are Transportation (112 | 7.4%), Material Moving (56 | 3.7%), and Production (27 | 1.8%).
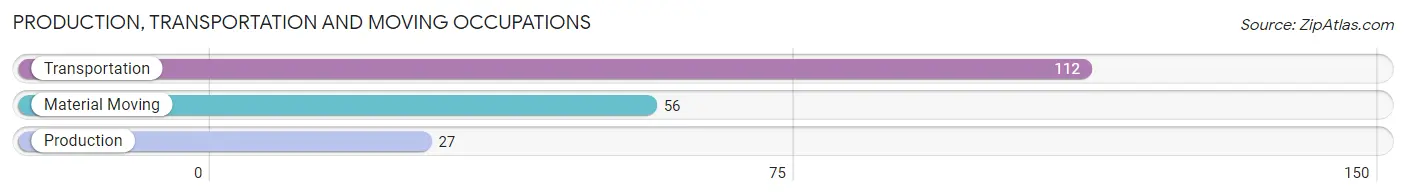
Production, Transportation and Moving Occupations by Sex
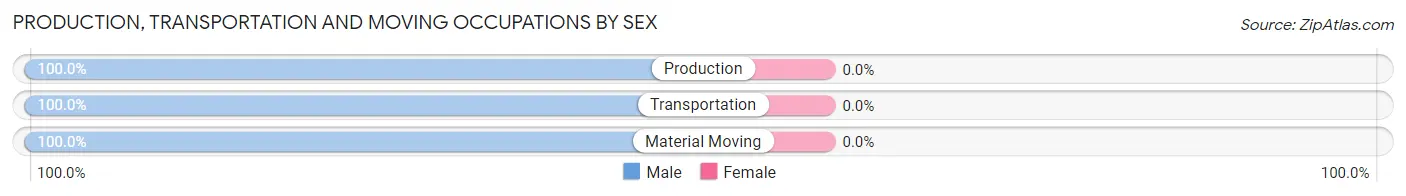
| Occupation | Male | Female |
| Production | 27 (100.0%) | 0 (0.0%) |
| Transportation | 112 (100.0%) | 0 (0.0%) |
| Material Moving | 56 (100.0%) | 0 (0.0%) |
| Total (Category) | 195 (100.0%) | 0 (0.0%) |
| Total (Overall) | 857 (56.7%) | 654 (43.3%) |
Employment Industries by Sex in Maeser
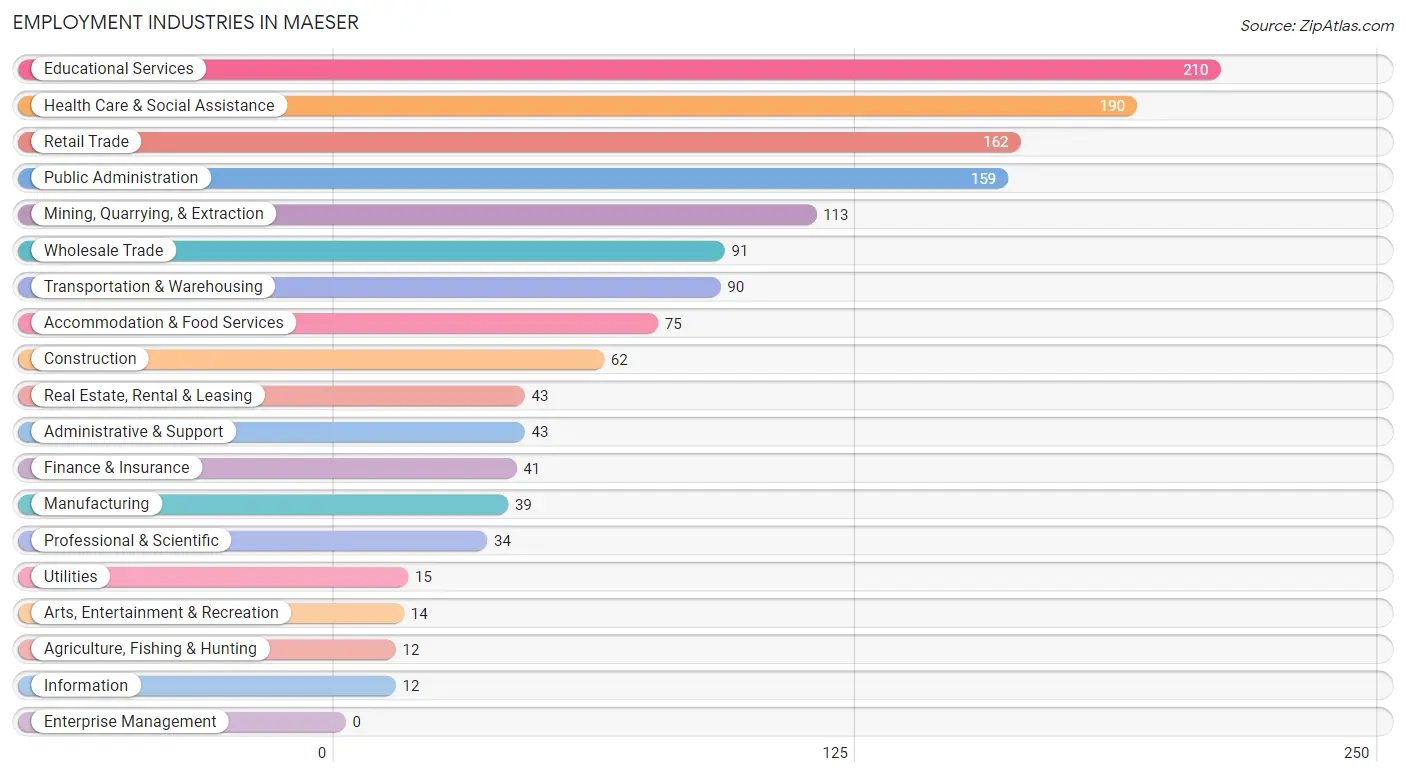
Employment Industries in Maeser
The major employment industries in Maeser include Educational Services (210 | 13.9%), Health Care & Social Assistance (190 | 12.6%), Retail Trade (162 | 10.7%), Public Administration (159 | 10.5%), and Mining, Quarrying, & Extraction (113 | 7.5%).
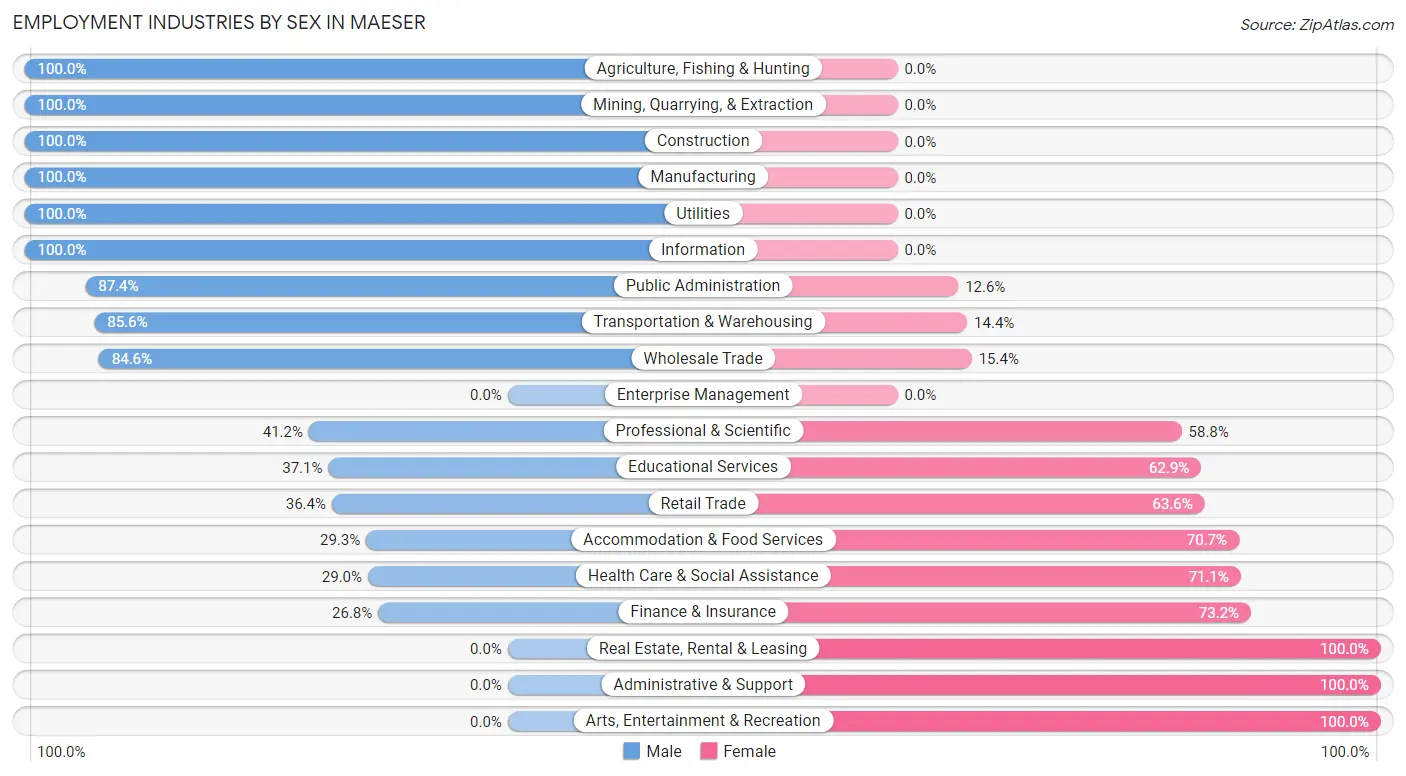
Employment Industries by Sex in Maeser
The Maeser industries that see more men than women are Agriculture, Fishing & Hunting (100.0%), Mining, Quarrying, & Extraction (100.0%), and Construction (100.0%), whereas the industries that tend to have a higher number of women are Real Estate, Rental & Leasing (100.0%), Administrative & Support (100.0%), and Arts, Entertainment & Recreation (100.0%).
| Industry | Male | Female |
| Agriculture, Fishing & Hunting | 12 (100.0%) | 0 (0.0%) |
| Mining, Quarrying, & Extraction | 113 (100.0%) | 0 (0.0%) |
| Construction | 62 (100.0%) | 0 (0.0%) |
| Manufacturing | 39 (100.0%) | 0 (0.0%) |
| Wholesale Trade | 77 (84.6%) | 14 (15.4%) |
| Retail Trade | 59 (36.4%) | 103 (63.6%) |
| Transportation & Warehousing | 77 (85.6%) | 13 (14.4%) |
| Utilities | 15 (100.0%) | 0 (0.0%) |
| Information | 12 (100.0%) | 0 (0.0%) |
| Finance & Insurance | 11 (26.8%) | 30 (73.2%) |
| Real Estate, Rental & Leasing | 0 (0.0%) | 43 (100.0%) |
| Professional & Scientific | 14 (41.2%) | 20 (58.8%) |
| Enterprise Management | 0 (0.0%) | 0 (0.0%) |
| Administrative & Support | 0 (0.0%) | 43 (100.0%) |
| Educational Services | 78 (37.1%) | 132 (62.9%) |
| Health Care & Social Assistance | 55 (28.9%) | 135 (71.1%) |
| Arts, Entertainment & Recreation | 0 (0.0%) | 14 (100.0%) |
| Accommodation & Food Services | 22 (29.3%) | 53 (70.7%) |
| Public Administration | 139 (87.4%) | 20 (12.6%) |
| Total | 857 (56.7%) | 654 (43.3%) |
Education in Maeser
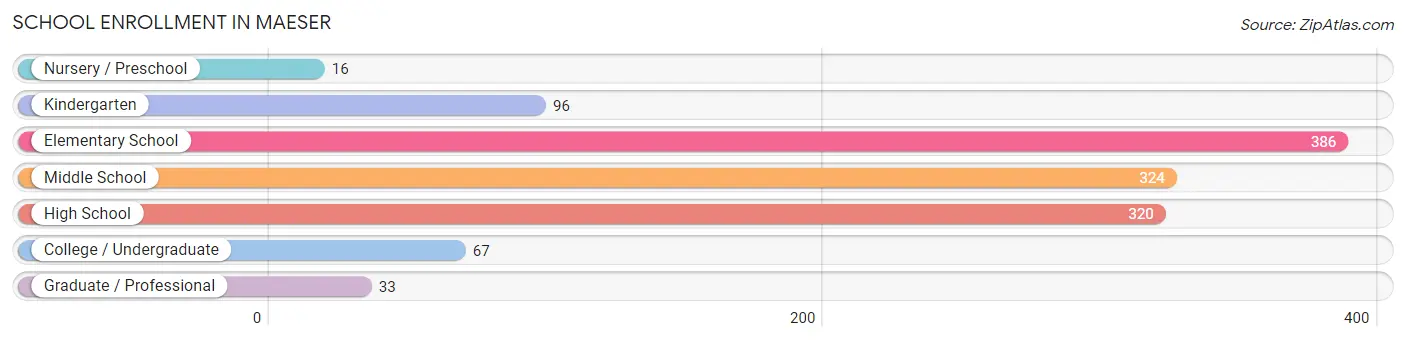
School Enrollment in Maeser
The most common levels of schooling among the 1,242 students in Maeser are elementary school (386 | 31.1%), middle school (324 | 26.1%), and high school (320 | 25.8%).
| School Level | # Students | % Students |
| Nursery / Preschool | 16 | 1.3% |
| Kindergarten | 96 | 7.7% |
| Elementary School | 386 | 31.1% |
| Middle School | 324 | 26.1% |
| High School | 320 | 25.8% |
| College / Undergraduate | 67 | 5.4% |
| Graduate / Professional | 33 | 2.7% |
| Total | 1,242 | 100.0% |
School Enrollment by Age by Funding Source in Maeser
Out of a total of 1,242 students who are enrolled in schools in Maeser, 178 (14.3%) attend a private institution, while the remaining 1,064 (85.7%) are enrolled in public schools. The age group of 25 to 34 year olds has the highest likelihood of being enrolled in private schools, with 13 (50.0% in the age bracket) enrolled. Conversely, the age group of 3 to 4 year olds has the lowest likelihood of being enrolled in a private school, with 8 (100.0% in the age bracket) attending a public institution.
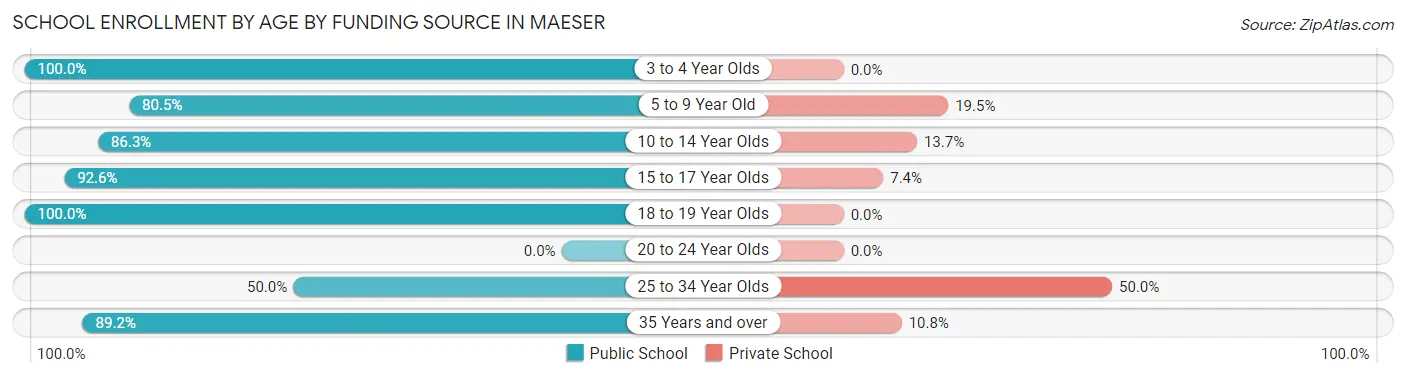
| Age Bracket | Public School | Private School |
| 3 to 4 Year Olds | 8 (100.0%) | 0 (0.0%) |
| 5 to 9 Year Old | 343 (80.5%) | 83 (19.5%) |
| 10 to 14 Year Olds | 335 (86.3%) | 53 (13.7%) |
| 15 to 17 Year Olds | 251 (92.6%) | 20 (7.4%) |
| 18 to 19 Year Olds | 49 (100.0%) | 0 (0.0%) |
| 20 to 24 Year Olds | 0 (0.0%) | 0 (0.0%) |
| 25 to 34 Year Olds | 13 (50.0%) | 13 (50.0%) |
| 35 Years and over | 66 (89.2%) | 8 (10.8%) |
| Total | 1,064 (85.7%) | 178 (14.3%) |
Educational Attainment by Field of Study in Maeser
Education (182 | 27.7%), business (127 | 19.3%), science & technology (67 | 10.2%), psychology (58 | 8.8%), and visual & performing arts (58 | 8.8%) are the most common fields of study among 658 individuals in Maeser who have obtained a bachelor's degree or higher.
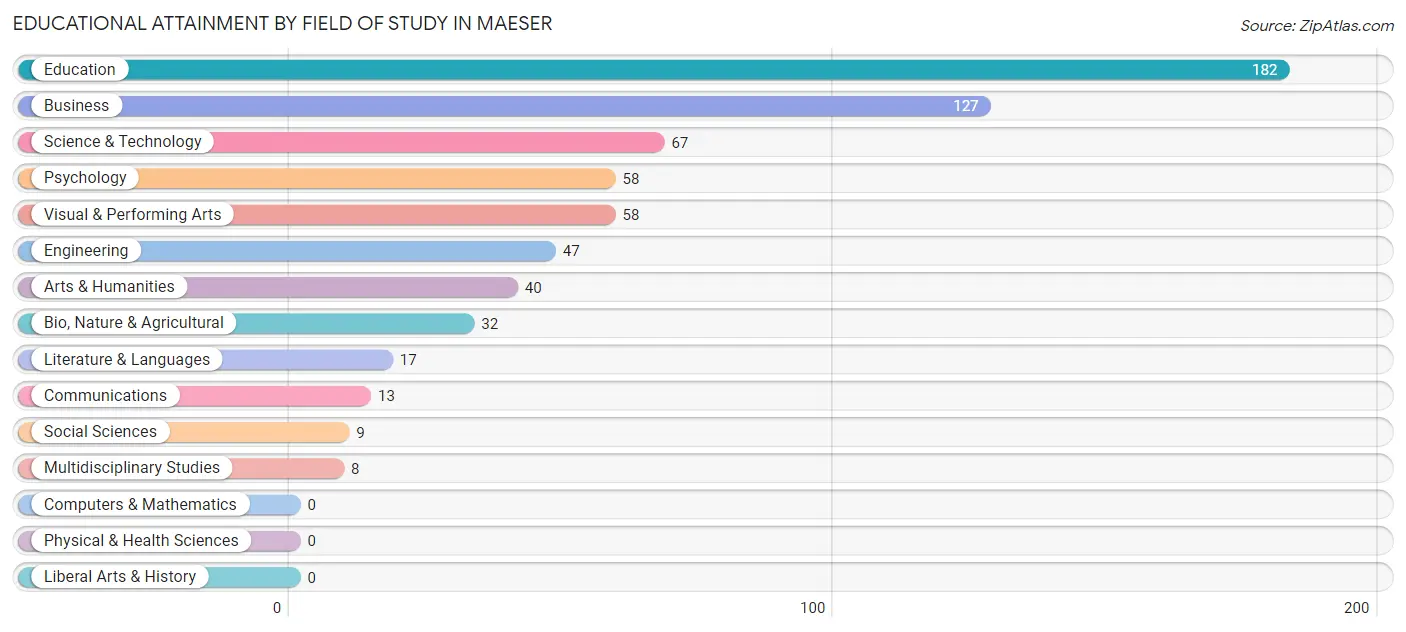
| Field of Study | # Graduates | % Graduates |
| Computers & Mathematics | 0 | 0.0% |
| Bio, Nature & Agricultural | 32 | 4.9% |
| Physical & Health Sciences | 0 | 0.0% |
| Psychology | 58 | 8.8% |
| Social Sciences | 9 | 1.4% |
| Engineering | 47 | 7.1% |
| Multidisciplinary Studies | 8 | 1.2% |
| Science & Technology | 67 | 10.2% |
| Business | 127 | 19.3% |
| Education | 182 | 27.7% |
| Literature & Languages | 17 | 2.6% |
| Liberal Arts & History | 0 | 0.0% |
| Visual & Performing Arts | 58 | 8.8% |
| Communications | 13 | 2.0% |
| Arts & Humanities | 40 | 6.1% |
| Total | 658 | 100.0% |
Transportation & Commute in Maeser
Vehicle Availability by Sex in Maeser
The most prevalent vehicle ownership categories in Maeser are males with 2 vehicles (326, accounting for 41.1%) and females with 2 vehicles (260, making up 51.3%).
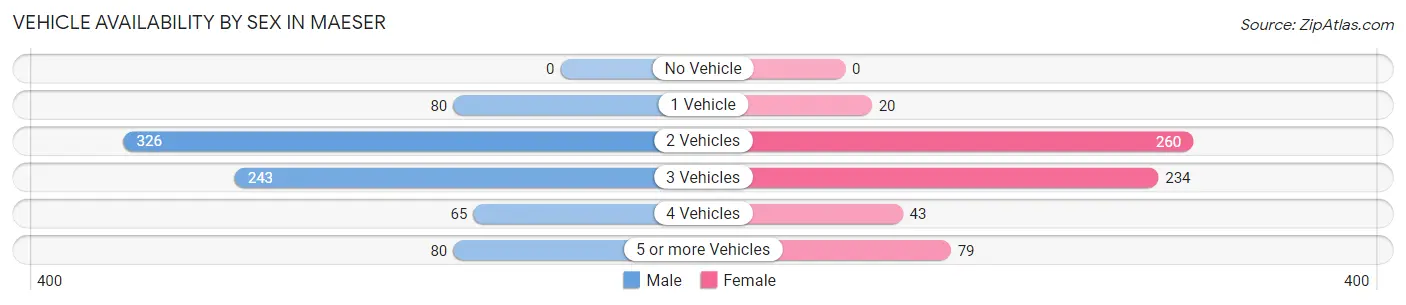
| Vehicles Available | Male | Female |
| No Vehicle | 0 (0.0%) | 0 (0.0%) |
| 1 Vehicle | 80 (10.1%) | 20 (3.1%) |
| 2 Vehicles | 326 (41.1%) | 260 (40.9%) |
| 3 Vehicles | 243 (30.6%) | 234 (36.8%) |
| 4 Vehicles | 65 (8.2%) | 43 (6.8%) |
| 5 or more Vehicles | 80 (10.1%) | 79 (12.4%) |
| Total | 794 (100.0%) | 636 (100.0%) |
Commute Time in Maeser
The most frequently occuring commute durations in Maeser are 5 to 9 minutes (379 commuters, 27.9%), 10 to 14 minutes (264 commuters, 19.4%), and 15 to 19 minutes (261 commuters, 19.2%).
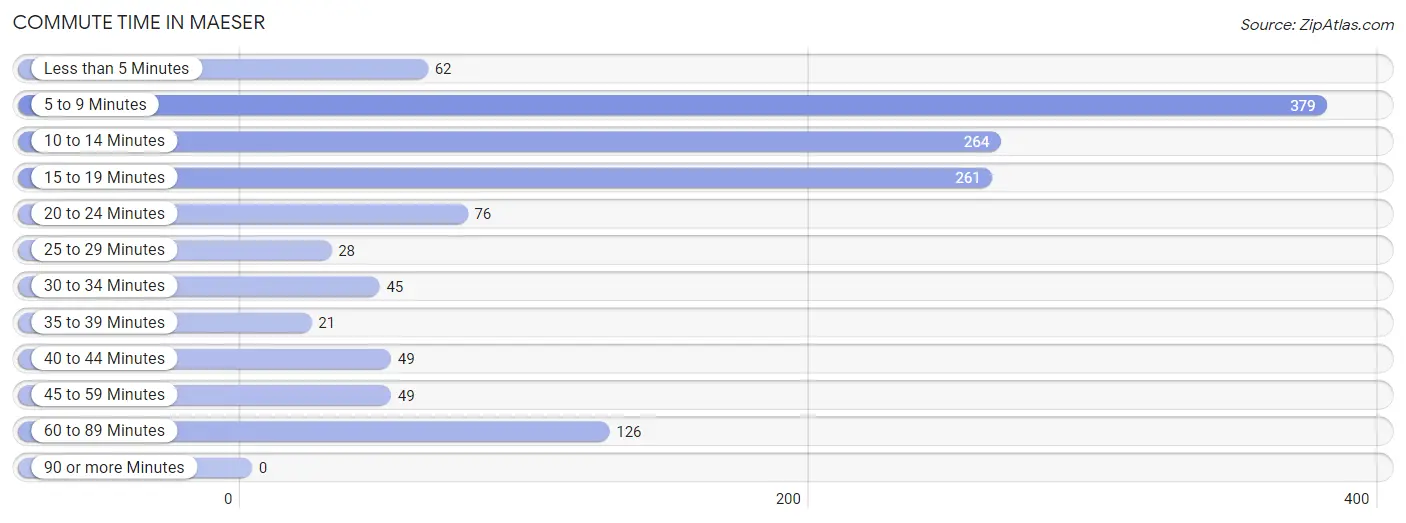
| Commute Time | # Commuters | % Commuters |
| Less than 5 Minutes | 62 | 4.6% |
| 5 to 9 Minutes | 379 | 27.9% |
| 10 to 14 Minutes | 264 | 19.4% |
| 15 to 19 Minutes | 261 | 19.2% |
| 20 to 24 Minutes | 76 | 5.6% |
| 25 to 29 Minutes | 28 | 2.1% |
| 30 to 34 Minutes | 45 | 3.3% |
| 35 to 39 Minutes | 21 | 1.5% |
| 40 to 44 Minutes | 49 | 3.6% |
| 45 to 59 Minutes | 49 | 3.6% |
| 60 to 89 Minutes | 126 | 9.3% |
| 90 or more Minutes | 0 | 0.0% |
Commute Time by Sex in Maeser
The most common commute times in Maeser are 15 to 19 minutes (190 commuters, 24.8%) for males and 5 to 9 minutes (270 commuters, 45.5%) for females.
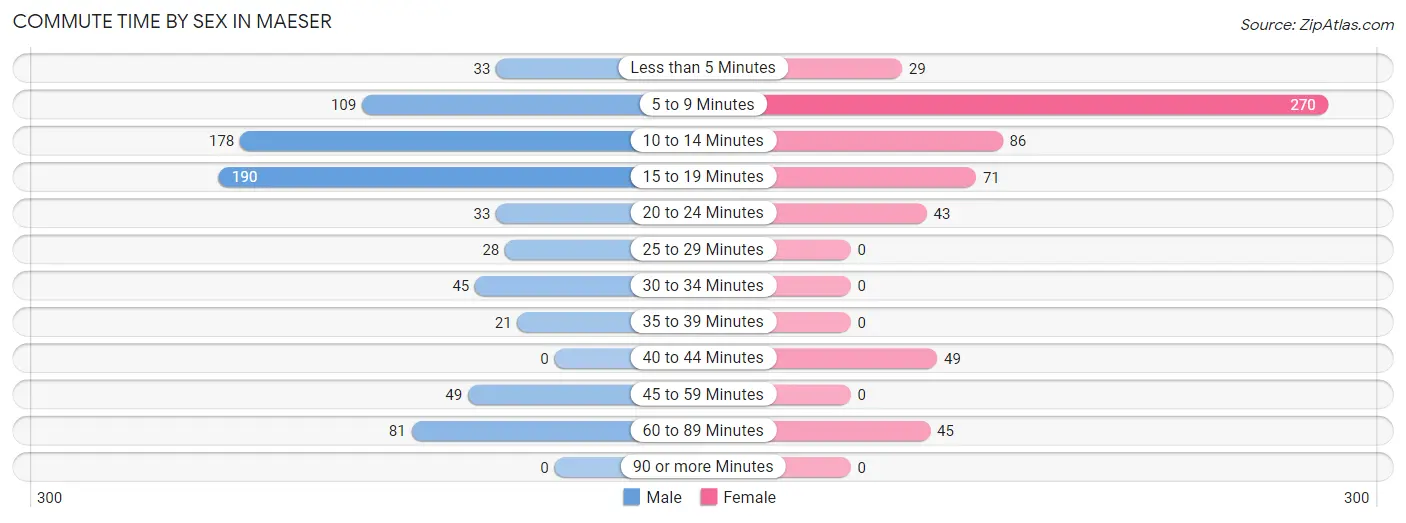
| Commute Time | Male | Female |
| Less than 5 Minutes | 33 (4.3%) | 29 (4.9%) |
| 5 to 9 Minutes | 109 (14.2%) | 270 (45.5%) |
| 10 to 14 Minutes | 178 (23.2%) | 86 (14.5%) |
| 15 to 19 Minutes | 190 (24.8%) | 71 (12.0%) |
| 20 to 24 Minutes | 33 (4.3%) | 43 (7.2%) |
| 25 to 29 Minutes | 28 (3.6%) | 0 (0.0%) |
| 30 to 34 Minutes | 45 (5.9%) | 0 (0.0%) |
| 35 to 39 Minutes | 21 (2.7%) | 0 (0.0%) |
| 40 to 44 Minutes | 0 (0.0%) | 49 (8.3%) |
| 45 to 59 Minutes | 49 (6.4%) | 0 (0.0%) |
| 60 to 89 Minutes | 81 (10.6%) | 45 (7.6%) |
| 90 or more Minutes | 0 (0.0%) | 0 (0.0%) |
Time of Departure to Work by Sex in Maeser
The most frequent times of departure to work in Maeser are 7:30 AM to 7:59 AM (160, 20.9%) for males and 7:30 AM to 7:59 AM (190, 32.0%) for females.
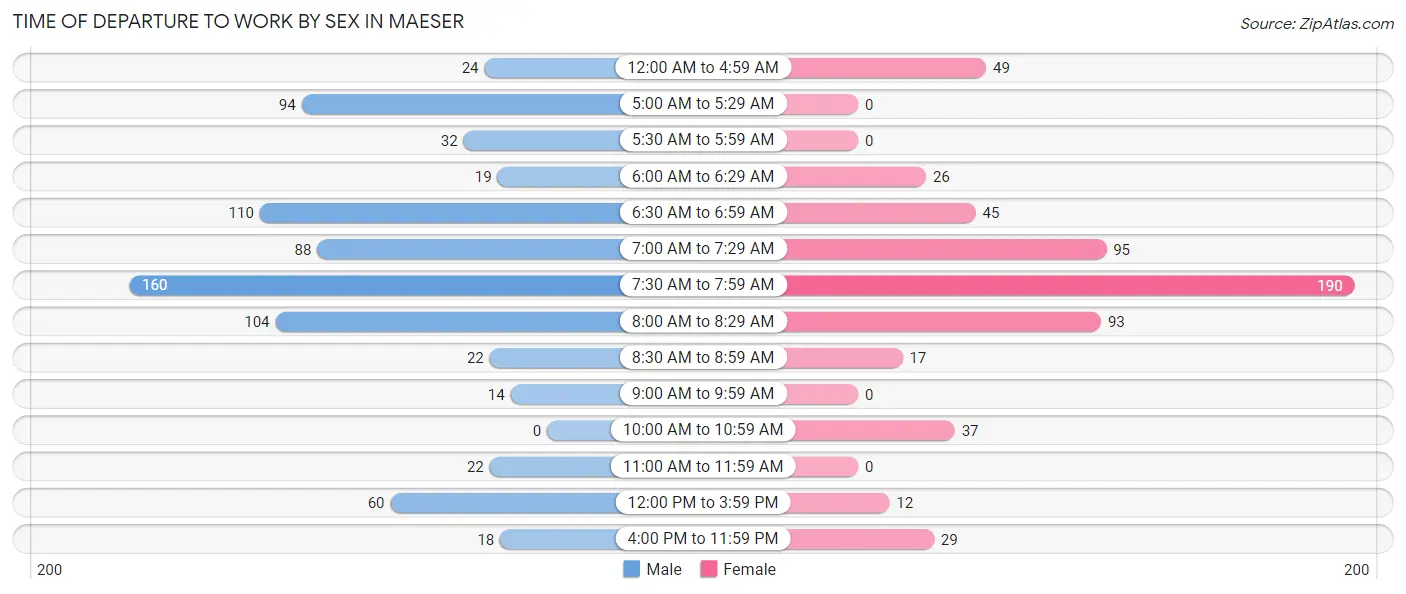
| Time of Departure | Male | Female |
| 12:00 AM to 4:59 AM | 24 (3.1%) | 49 (8.3%) |
| 5:00 AM to 5:29 AM | 94 (12.3%) | 0 (0.0%) |
| 5:30 AM to 5:59 AM | 32 (4.2%) | 0 (0.0%) |
| 6:00 AM to 6:29 AM | 19 (2.5%) | 26 (4.4%) |
| 6:30 AM to 6:59 AM | 110 (14.3%) | 45 (7.6%) |
| 7:00 AM to 7:29 AM | 88 (11.5%) | 95 (16.0%) |
| 7:30 AM to 7:59 AM | 160 (20.9%) | 190 (32.0%) |
| 8:00 AM to 8:29 AM | 104 (13.6%) | 93 (15.7%) |
| 8:30 AM to 8:59 AM | 22 (2.9%) | 17 (2.9%) |
| 9:00 AM to 9:59 AM | 14 (1.8%) | 0 (0.0%) |
| 10:00 AM to 10:59 AM | 0 (0.0%) | 37 (6.2%) |
| 11:00 AM to 11:59 AM | 22 (2.9%) | 0 (0.0%) |
| 12:00 PM to 3:59 PM | 60 (7.8%) | 12 (2.0%) |
| 4:00 PM to 11:59 PM | 18 (2.4%) | 29 (4.9%) |
| Total | 767 (100.0%) | 593 (100.0%) |
Housing Occupancy in Maeser
Occupancy by Ownership in Maeser
Of the total 1,480 dwellings in Maeser, owner-occupied units account for 1,199 (81.0%), while renter-occupied units make up 281 (19.0%).
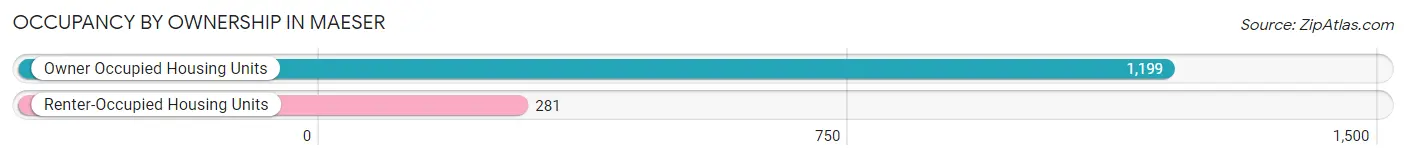
| Occupancy | # Housing Units | % Housing Units |
| Owner Occupied Housing Units | 1,199 | 81.0% |
| Renter-Occupied Housing Units | 281 | 19.0% |
| Total Occupied Housing Units | 1,480 | 100.0% |
Occupancy by Household Size in Maeser
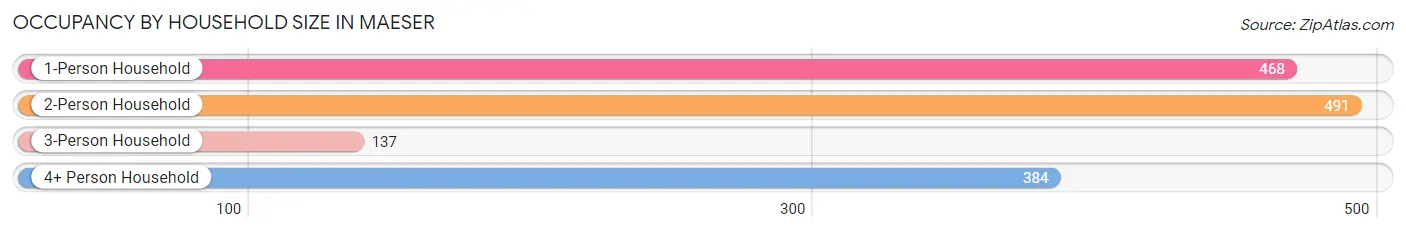
| Household Size | # Housing Units | % Housing Units |
| 1-Person Household | 468 | 31.6% |
| 2-Person Household | 491 | 33.2% |
| 3-Person Household | 137 | 9.3% |
| 4+ Person Household | 384 | 26.0% |
| Total Housing Units | 1,480 | 100.0% |
Occupancy by Ownership by Household Size in Maeser
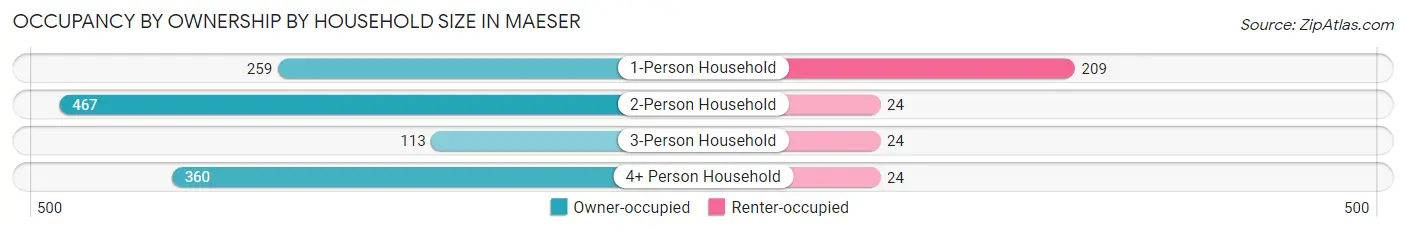
| Household Size | Owner-occupied | Renter-occupied |
| 1-Person Household | 259 (55.3%) | 209 (44.7%) |
| 2-Person Household | 467 (95.1%) | 24 (4.9%) |
| 3-Person Household | 113 (82.5%) | 24 (17.5%) |
| 4+ Person Household | 360 (93.8%) | 24 (6.2%) |
| Total Housing Units | 1,199 (81.0%) | 281 (19.0%) |
Occupancy by Educational Attainment in Maeser
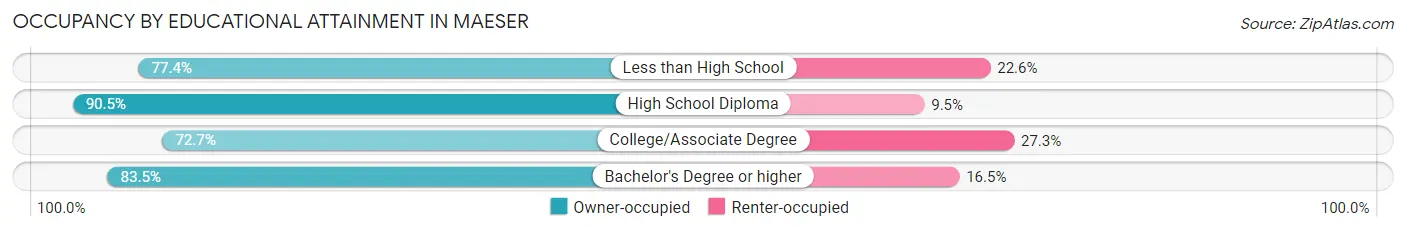
| Household Size | Owner-occupied | Renter-occupied |
| Less than High School | 65 (77.4%) | 19 (22.6%) |
| High School Diploma | 370 (90.5%) | 39 (9.5%) |
| College/Associate Degree | 404 (72.7%) | 152 (27.3%) |
| Bachelor's Degree or higher | 360 (83.5%) | 71 (16.5%) |
Occupancy by Age of Householder in Maeser
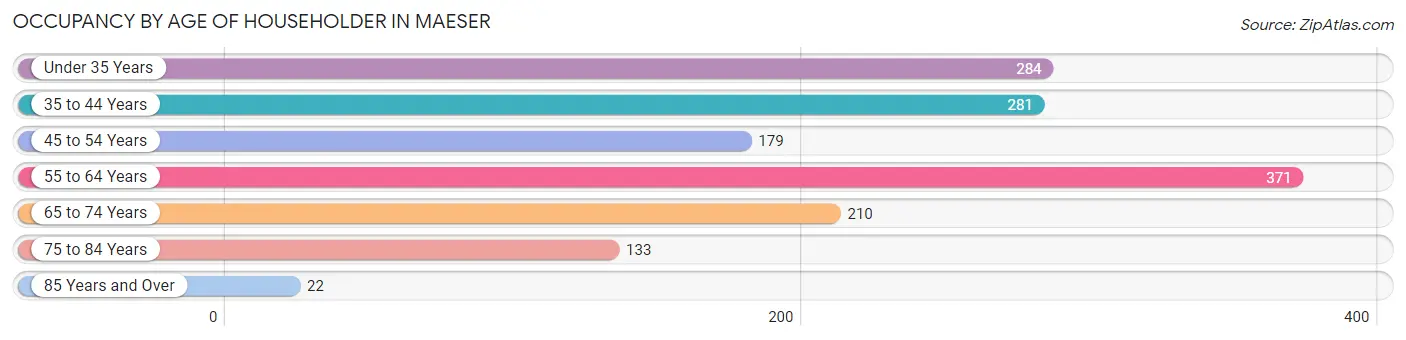
| Age Bracket | # Households | % Households |
| Under 35 Years | 284 | 19.2% |
| 35 to 44 Years | 281 | 19.0% |
| 45 to 54 Years | 179 | 12.1% |
| 55 to 64 Years | 371 | 25.1% |
| 65 to 74 Years | 210 | 14.2% |
| 75 to 84 Years | 133 | 9.0% |
| 85 Years and Over | 22 | 1.5% |
| Total | 1,480 | 100.0% |
Housing Finances in Maeser
Median Income by Occupancy in Maeser
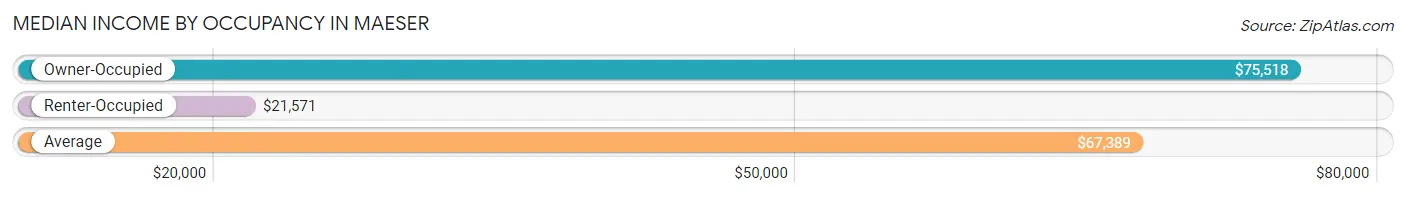
| Occupancy Type | # Households | Median Income |
| Owner-Occupied | 1,199 (81.0%) | $75,518 |
| Renter-Occupied | 281 (19.0%) | $21,571 |
| Average | 1,480 (100.0%) | $67,389 |
Occupancy by Householder Income Bracket in Maeser
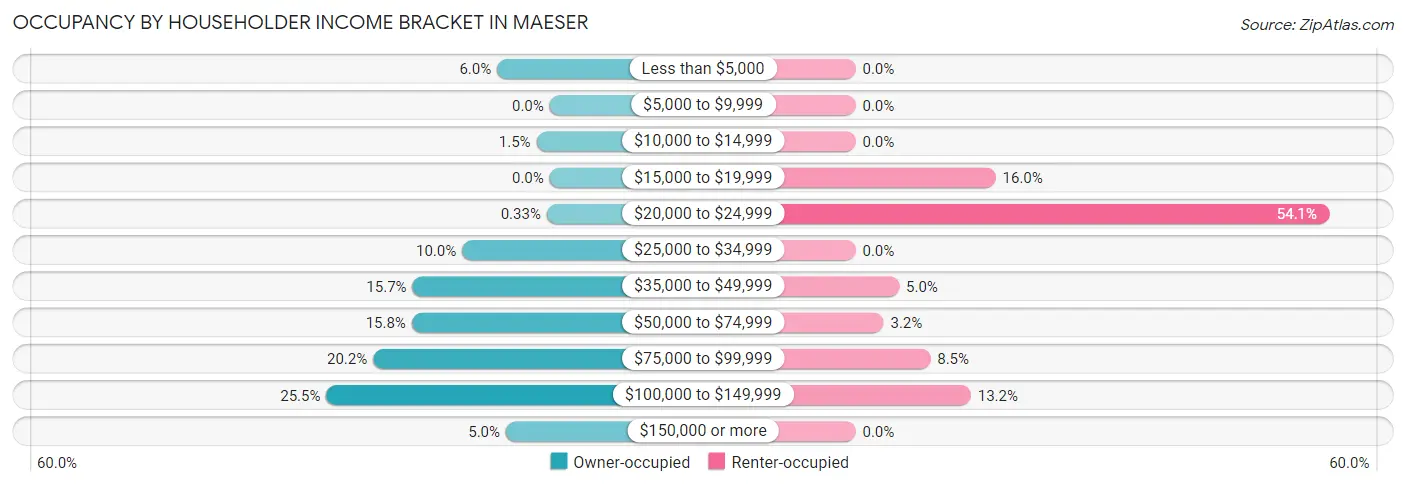
| Income Bracket | Owner-occupied | Renter-occupied |
| Less than $5,000 | 72 (6.0%) | 0 (0.0%) |
| $5,000 to $9,999 | 0 (0.0%) | 0 (0.0%) |
| $10,000 to $14,999 | 18 (1.5%) | 0 (0.0%) |
| $15,000 to $19,999 | 0 (0.0%) | 45 (16.0%) |
| $20,000 to $24,999 | 4 (0.3%) | 152 (54.1%) |
| $25,000 to $34,999 | 120 (10.0%) | 0 (0.0%) |
| $35,000 to $49,999 | 188 (15.7%) | 14 (5.0%) |
| $50,000 to $74,999 | 189 (15.8%) | 9 (3.2%) |
| $75,000 to $99,999 | 242 (20.2%) | 24 (8.5%) |
| $100,000 to $149,999 | 306 (25.5%) | 37 (13.2%) |
| $150,000 or more | 60 (5.0%) | 0 (0.0%) |
| Total | 1,199 (100.0%) | 281 (100.0%) |
Monthly Housing Cost Tiers in Maeser
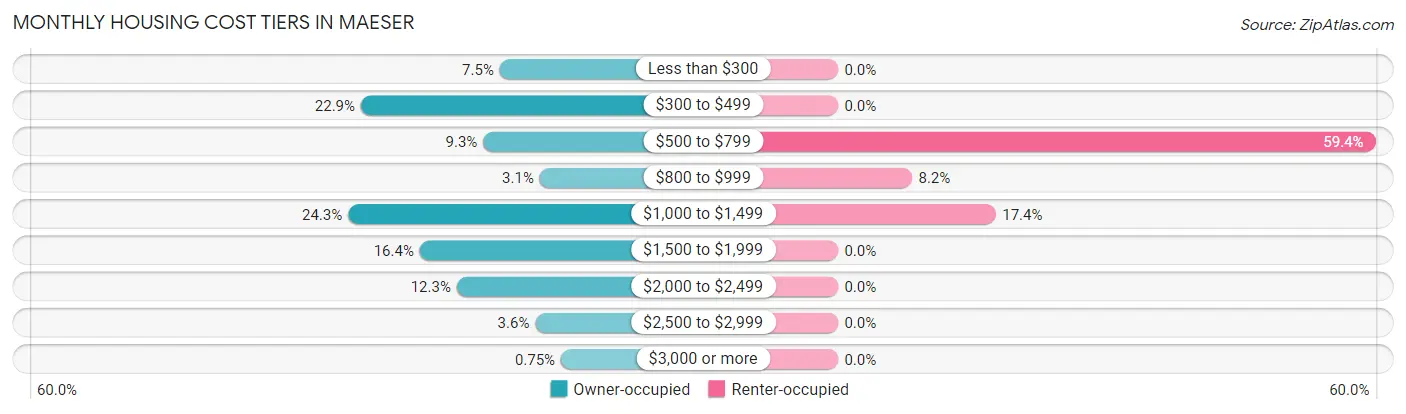
| Monthly Cost | Owner-occupied | Renter-occupied |
| Less than $300 | 90 (7.5%) | 0 (0.0%) |
| $300 to $499 | 274 (22.9%) | 0 (0.0%) |
| $500 to $799 | 112 (9.3%) | 167 (59.4%) |
| $800 to $999 | 37 (3.1%) | 23 (8.2%) |
| $1,000 to $1,499 | 291 (24.3%) | 49 (17.4%) |
| $1,500 to $1,999 | 196 (16.4%) | 0 (0.0%) |
| $2,000 to $2,499 | 147 (12.3%) | 0 (0.0%) |
| $2,500 to $2,999 | 43 (3.6%) | 0 (0.0%) |
| $3,000 or more | 9 (0.7%) | 0 (0.0%) |
| Total | 1,199 (100.0%) | 281 (100.0%) |
Physical Housing Characteristics in Maeser
Housing Structures in Maeser
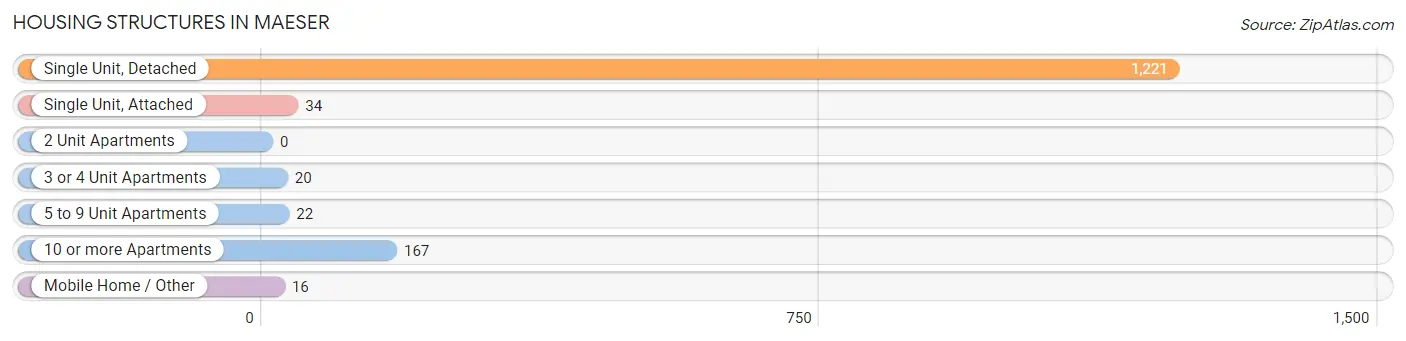
| Structure Type | # Housing Units | % Housing Units |
| Single Unit, Detached | 1,221 | 82.5% |
| Single Unit, Attached | 34 | 2.3% |
| 2 Unit Apartments | 0 | 0.0% |
| 3 or 4 Unit Apartments | 20 | 1.3% |
| 5 to 9 Unit Apartments | 22 | 1.5% |
| 10 or more Apartments | 167 | 11.3% |
| Mobile Home / Other | 16 | 1.1% |
| Total | 1,480 | 100.0% |
Housing Structures by Occupancy in Maeser
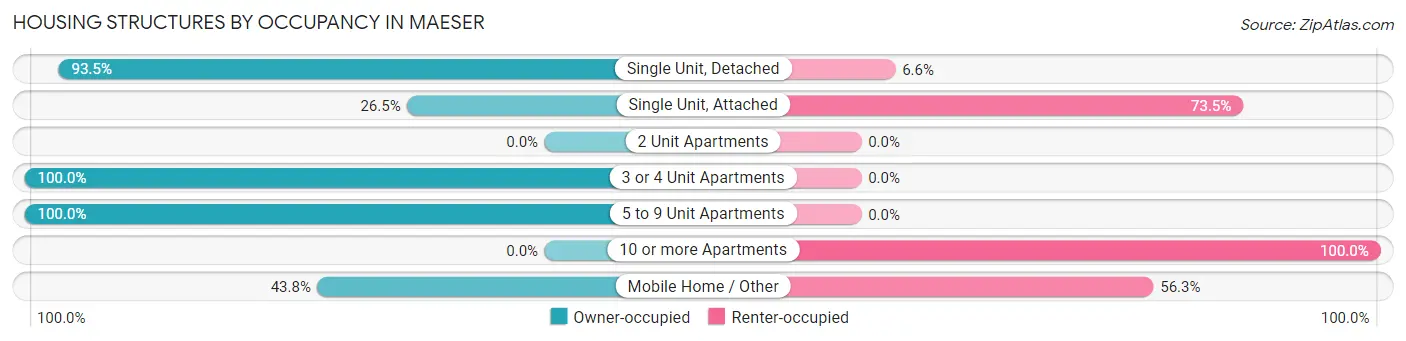
| Structure Type | Owner-occupied | Renter-occupied |
| Single Unit, Detached | 1,141 (93.4%) | 80 (6.6%) |
| Single Unit, Attached | 9 (26.5%) | 25 (73.5%) |
| 2 Unit Apartments | 0 (0.0%) | 0 (0.0%) |
| 3 or 4 Unit Apartments | 20 (100.0%) | 0 (0.0%) |
| 5 to 9 Unit Apartments | 22 (100.0%) | 0 (0.0%) |
| 10 or more Apartments | 0 (0.0%) | 167 (100.0%) |
| Mobile Home / Other | 7 (43.8%) | 9 (56.2%) |
| Total | 1,199 (81.0%) | 281 (19.0%) |
Housing Structures by Number of Rooms in Maeser
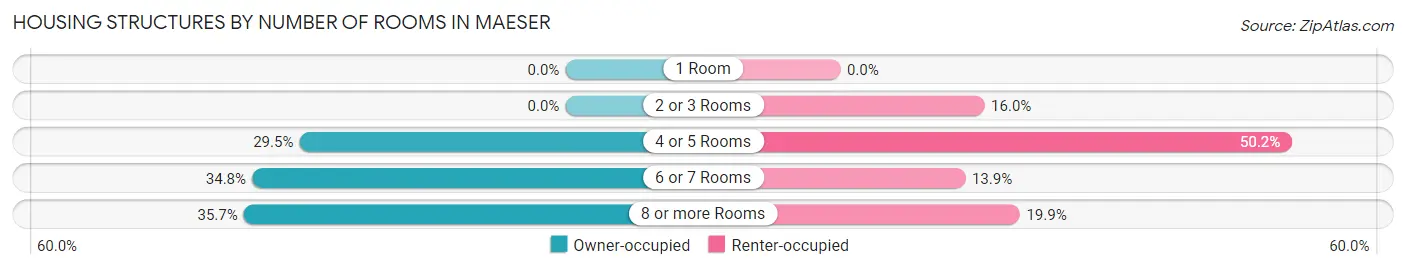
| Number of Rooms | Owner-occupied | Renter-occupied |
| 1 Room | 0 (0.0%) | 0 (0.0%) |
| 2 or 3 Rooms | 0 (0.0%) | 45 (16.0%) |
| 4 or 5 Rooms | 354 (29.5%) | 141 (50.2%) |
| 6 or 7 Rooms | 417 (34.8%) | 39 (13.9%) |
| 8 or more Rooms | 428 (35.7%) | 56 (19.9%) |
| Total | 1,199 (100.0%) | 281 (100.0%) |
Housing Structure by Heating Type in Maeser
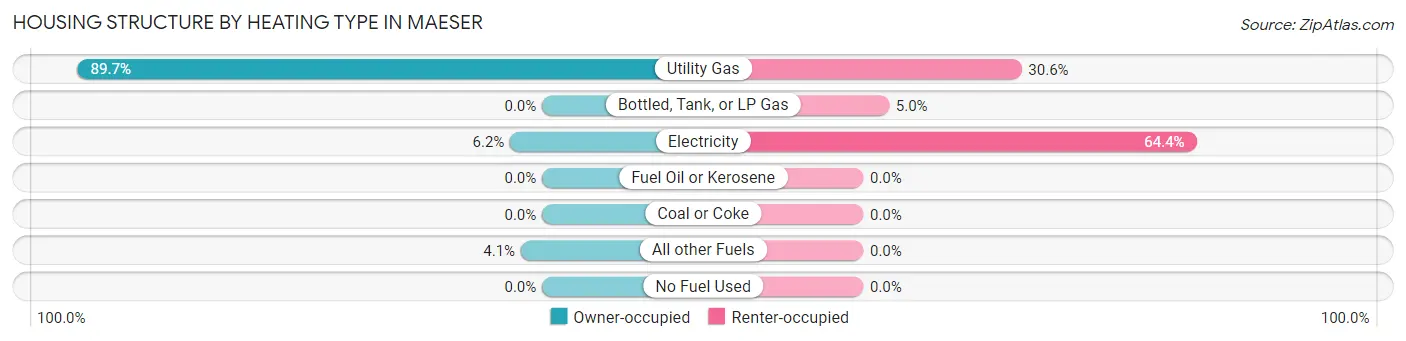
| Heating Type | Owner-occupied | Renter-occupied |
| Utility Gas | 1,076 (89.7%) | 86 (30.6%) |
| Bottled, Tank, or LP Gas | 0 (0.0%) | 14 (5.0%) |
| Electricity | 74 (6.2%) | 181 (64.4%) |
| Fuel Oil or Kerosene | 0 (0.0%) | 0 (0.0%) |
| Coal or Coke | 0 (0.0%) | 0 (0.0%) |
| All other Fuels | 49 (4.1%) | 0 (0.0%) |
| No Fuel Used | 0 (0.0%) | 0 (0.0%) |
| Total | 1,199 (100.0%) | 281 (100.0%) |
Household Vehicle Usage in Maeser
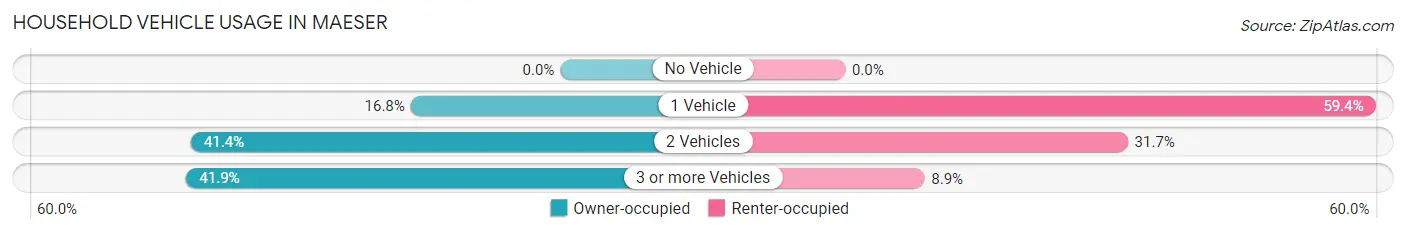
| Vehicles per Household | Owner-occupied | Renter-occupied |
| No Vehicle | 0 (0.0%) | 0 (0.0%) |
| 1 Vehicle | 201 (16.8%) | 167 (59.4%) |
| 2 Vehicles | 496 (41.4%) | 89 (31.7%) |
| 3 or more Vehicles | 502 (41.9%) | 25 (8.9%) |
| Total | 1,199 (100.0%) | 281 (100.0%) |
Real Estate & Mortgages in Maeser
Real Estate and Mortgage Overview in Maeser
| Characteristic | Without Mortgage | With Mortgage |
| Housing Units | 519 | 680 |
| Median Property Value | $313,300 | $283,500 |
| Median Household Income | $69,583 | $60 |
| Monthly Housing Costs | $418 | $9 |
| Real Estate Taxes | $1,566 | $0 |
Property Value by Mortgage Status in Maeser
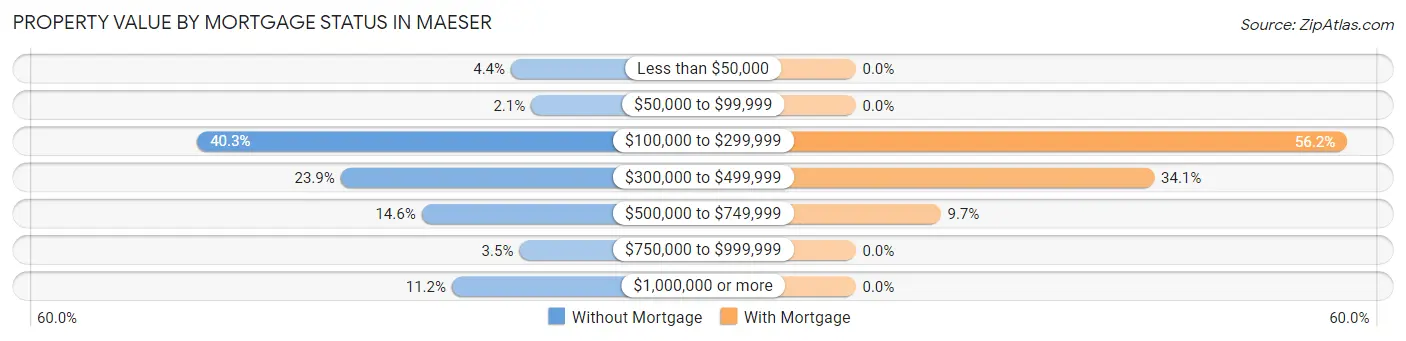
| Property Value | Without Mortgage | With Mortgage |
| Less than $50,000 | 23 (4.4%) | 0 (0.0%) |
| $50,000 to $99,999 | 11 (2.1%) | 0 (0.0%) |
| $100,000 to $299,999 | 209 (40.3%) | 382 (56.2%) |
| $300,000 to $499,999 | 124 (23.9%) | 232 (34.1%) |
| $500,000 to $749,999 | 76 (14.6%) | 66 (9.7%) |
| $750,000 to $999,999 | 18 (3.5%) | 0 (0.0%) |
| $1,000,000 or more | 58 (11.2%) | 0 (0.0%) |
| Total | 519 (100.0%) | 680 (100.0%) |
Household Income by Mortgage Status in Maeser
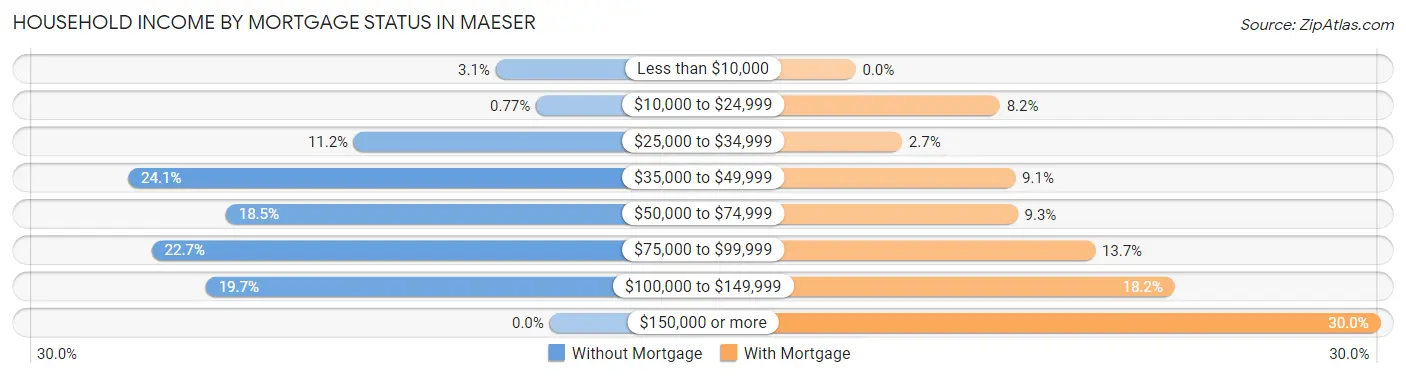
| Household Income | Without Mortgage | With Mortgage |
| Less than $10,000 | 16 (3.1%) | 0 (0.0%) |
| $10,000 to $24,999 | 4 (0.8%) | 56 (8.2%) |
| $25,000 to $34,999 | 58 (11.2%) | 18 (2.6%) |
| $35,000 to $49,999 | 125 (24.1%) | 62 (9.1%) |
| $50,000 to $74,999 | 96 (18.5%) | 63 (9.3%) |
| $75,000 to $99,999 | 118 (22.7%) | 93 (13.7%) |
| $100,000 to $149,999 | 102 (19.7%) | 124 (18.2%) |
| $150,000 or more | 0 (0.0%) | 204 (30.0%) |
| Total | 519 (100.0%) | 680 (100.0%) |
Property Value to Household Income Ratio in Maeser
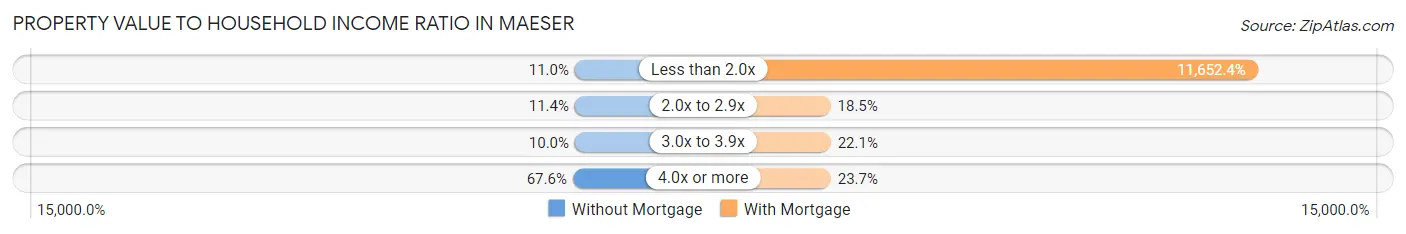
| Value-to-Income Ratio | Without Mortgage | With Mortgage |
| Less than 2.0x | 57 (11.0%) | 79,236 (11,652.3%) |
| 2.0x to 2.9x | 59 (11.4%) | 126 (18.5%) |
| 3.0x to 3.9x | 52 (10.0%) | 150 (22.1%) |
| 4.0x or more | 351 (67.6%) | 161 (23.7%) |
| Total | 519 (100.0%) | 680 (100.0%) |
Real Estate Taxes by Mortgage Status in Maeser
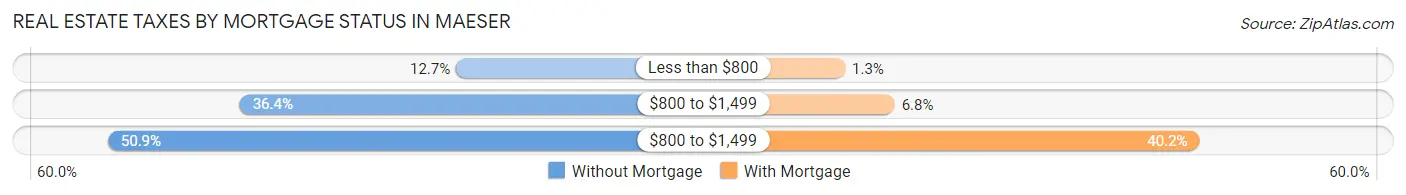
| Property Taxes | Without Mortgage | With Mortgage |
| Less than $800 | 66 (12.7%) | 9 (1.3%) |
| $800 to $1,499 | 189 (36.4%) | 46 (6.8%) |
| $800 to $1,499 | 264 (50.9%) | 273 (40.2%) |
| Total | 519 (100.0%) | 680 (100.0%) |
Health & Disability in Maeser
Health Insurance Coverage by Age in Maeser
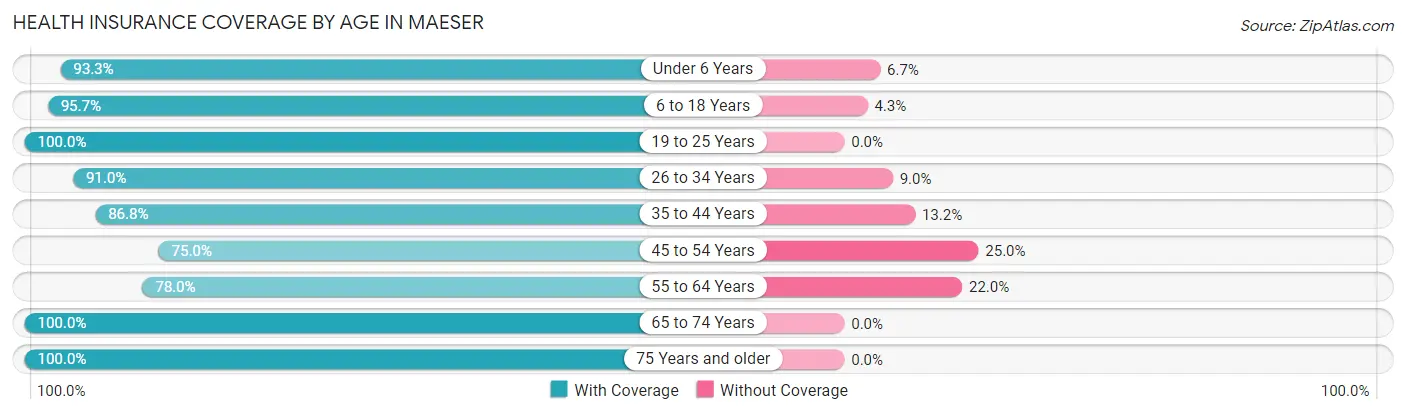
| Age Bracket | With Coverage | Without Coverage |
| Under 6 Years | 308 (93.3%) | 22 (6.7%) |
| 6 to 18 Years | 1,084 (95.7%) | 49 (4.3%) |
| 19 to 25 Years | 220 (100.0%) | 0 (0.0%) |
| 26 to 34 Years | 403 (91.0%) | 40 (9.0%) |
| 35 to 44 Years | 461 (86.8%) | 70 (13.2%) |
| 45 to 54 Years | 219 (75.0%) | 73 (25.0%) |
| 55 to 64 Years | 423 (78.0%) | 119 (22.0%) |
| 65 to 74 Years | 398 (100.0%) | 0 (0.0%) |
| 75 Years and older | 237 (100.0%) | 0 (0.0%) |
| Total | 3,753 (91.0%) | 373 (9.0%) |
Health Insurance Coverage by Citizenship Status in Maeser
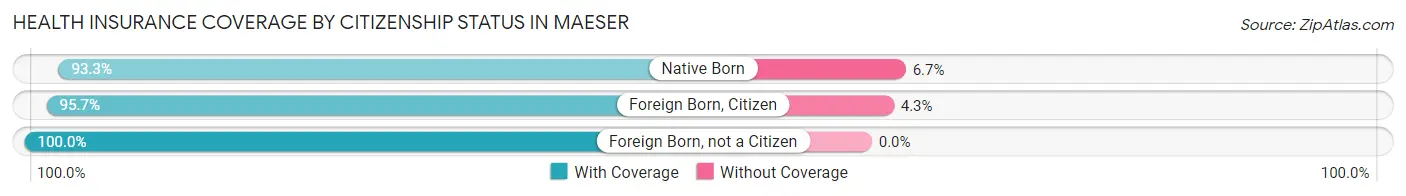
| Citizenship Status | With Coverage | Without Coverage |
| Native Born | 308 (93.3%) | 22 (6.7%) |
| Foreign Born, Citizen | 1,084 (95.7%) | 49 (4.3%) |
| Foreign Born, not a Citizen | 220 (100.0%) | 0 (0.0%) |
Health Insurance Coverage by Household Income in Maeser
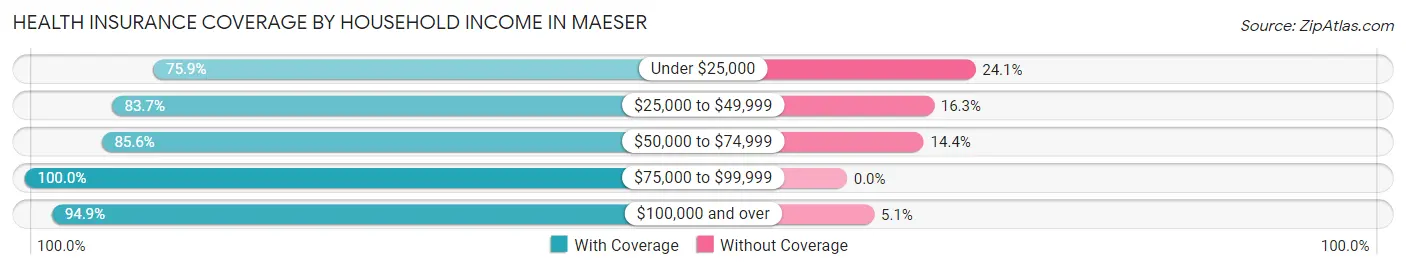
| Household Income | With Coverage | Without Coverage |
| Under $25,000 | 394 (75.9%) | 125 (24.1%) |
| $25,000 to $49,999 | 493 (83.7%) | 96 (16.3%) |
| $50,000 to $74,999 | 446 (85.6%) | 75 (14.4%) |
| $75,000 to $99,999 | 986 (100.0%) | 0 (0.0%) |
| $100,000 and over | 1,429 (94.9%) | 77 (5.1%) |
Public vs Private Health Insurance Coverage by Age in Maeser
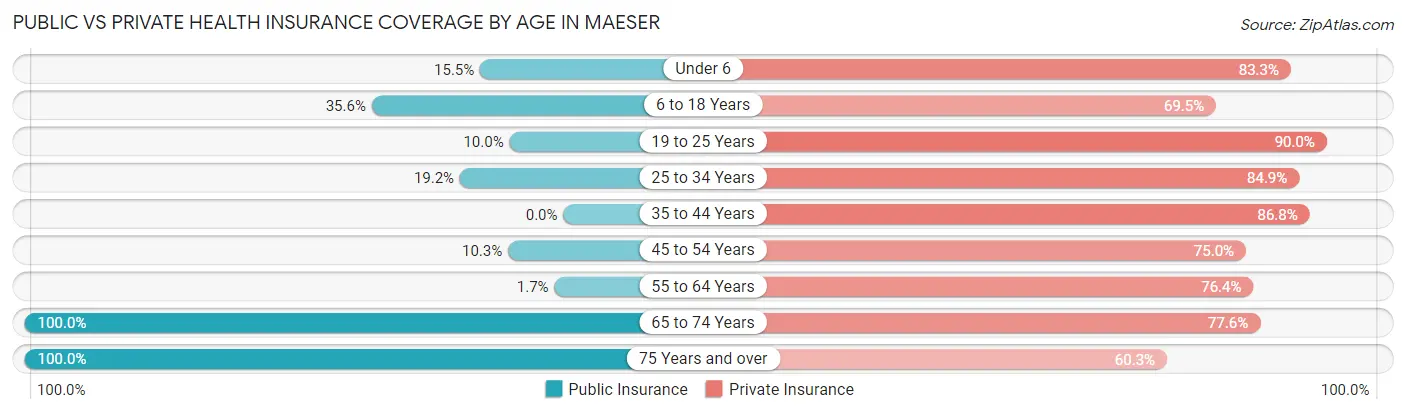
| Age Bracket | Public Insurance | Private Insurance |
| Under 6 | 51 (15.4%) | 275 (83.3%) |
| 6 to 18 Years | 403 (35.6%) | 787 (69.5%) |
| 19 to 25 Years | 22 (10.0%) | 198 (90.0%) |
| 25 to 34 Years | 85 (19.2%) | 376 (84.9%) |
| 35 to 44 Years | 0 (0.0%) | 461 (86.8%) |
| 45 to 54 Years | 30 (10.3%) | 219 (75.0%) |
| 55 to 64 Years | 9 (1.7%) | 414 (76.4%) |
| 65 to 74 Years | 398 (100.0%) | 309 (77.6%) |
| 75 Years and over | 237 (100.0%) | 143 (60.3%) |
| Total | 1,235 (29.9%) | 3,182 (77.1%) |
Disability Status by Sex by Age in Maeser
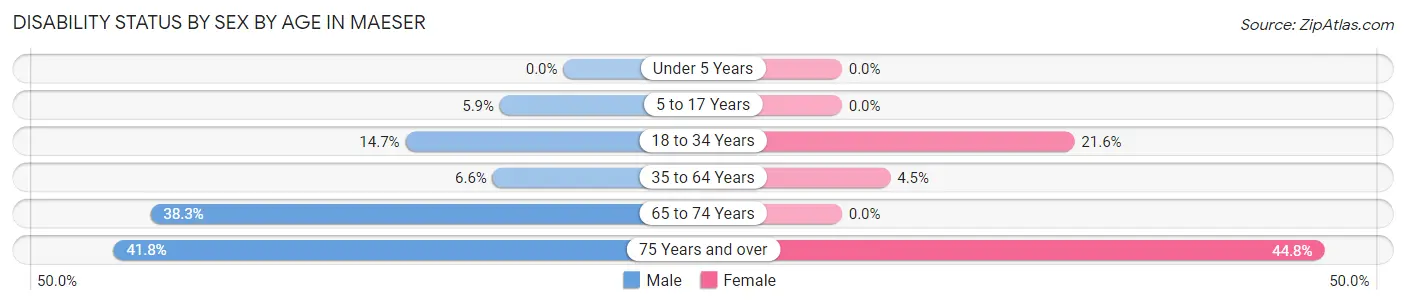
| Age Bracket | Male | Female |
| Under 5 Years | 0 (0.0%) | 0 (0.0%) |
| 5 to 17 Years | 32 (5.9%) | 0 (0.0%) |
| 18 to 34 Years | 50 (14.7%) | 87 (21.6%) |
| 35 to 64 Years | 40 (6.6%) | 34 (4.5%) |
| 65 to 74 Years | 82 (38.3%) | 0 (0.0%) |
| 75 Years and over | 43 (41.7%) | 60 (44.8%) |
Disability Class by Sex by Age in Maeser
Disability Class: Hearing Difficulty
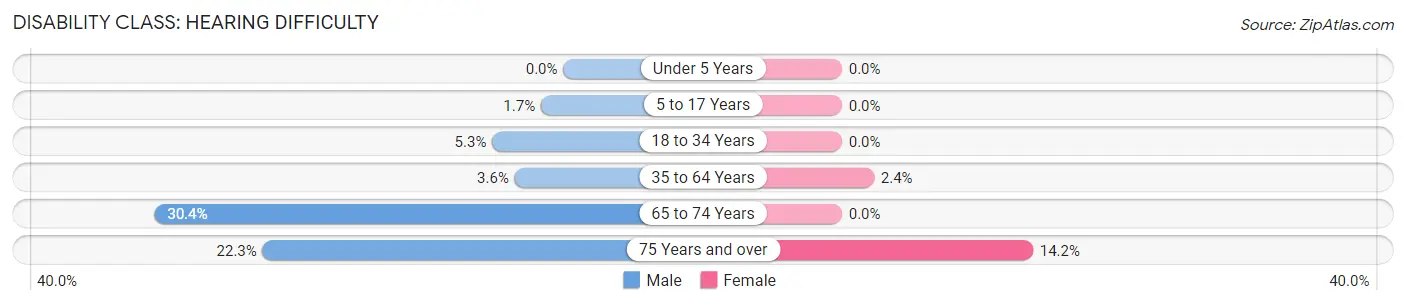
| Age Bracket | Male | Female |
| Under 5 Years | 0 (0.0%) | 0 (0.0%) |
| 5 to 17 Years | 9 (1.7%) | 0 (0.0%) |
| 18 to 34 Years | 18 (5.3%) | 0 (0.0%) |
| 35 to 64 Years | 22 (3.6%) | 18 (2.4%) |
| 65 to 74 Years | 65 (30.4%) | 0 (0.0%) |
| 75 Years and over | 23 (22.3%) | 19 (14.2%) |
Disability Class: Vision Difficulty
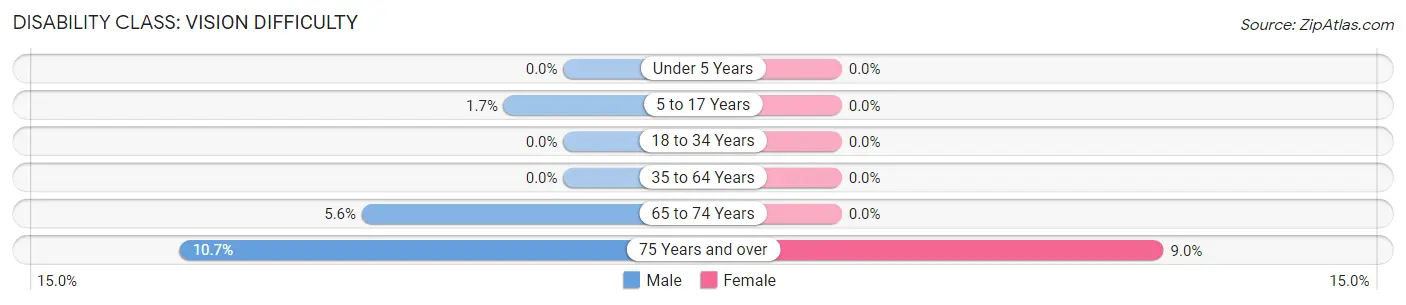
| Age Bracket | Male | Female |
| Under 5 Years | 0 (0.0%) | 0 (0.0%) |
| 5 to 17 Years | 9 (1.7%) | 0 (0.0%) |
| 18 to 34 Years | 0 (0.0%) | 0 (0.0%) |
| 35 to 64 Years | 0 (0.0%) | 0 (0.0%) |
| 65 to 74 Years | 12 (5.6%) | 0 (0.0%) |
| 75 Years and over | 11 (10.7%) | 12 (9.0%) |
Disability Class: Cognitive Difficulty
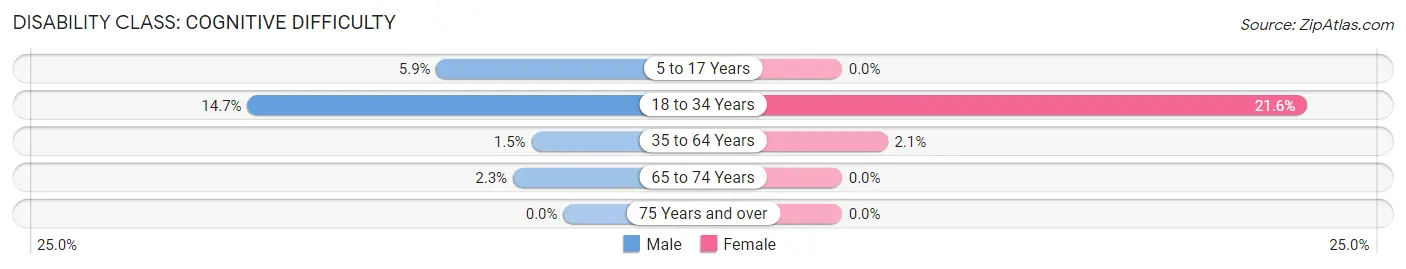
| Age Bracket | Male | Female |
| 5 to 17 Years | 32 (5.9%) | 0 (0.0%) |
| 18 to 34 Years | 50 (14.7%) | 87 (21.6%) |
| 35 to 64 Years | 9 (1.5%) | 16 (2.1%) |
| 65 to 74 Years | 5 (2.3%) | 0 (0.0%) |
| 75 Years and over | 0 (0.0%) | 0 (0.0%) |
Disability Class: Ambulatory Difficulty
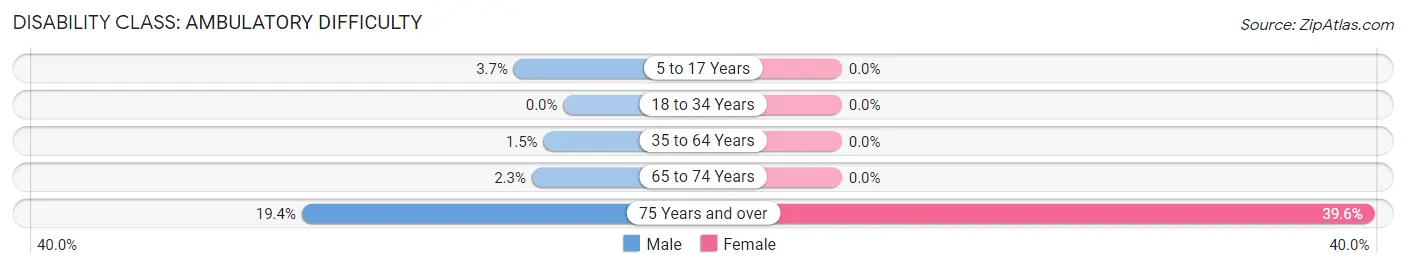
| Age Bracket | Male | Female |
| 5 to 17 Years | 20 (3.7%) | 0 (0.0%) |
| 18 to 34 Years | 0 (0.0%) | 0 (0.0%) |
| 35 to 64 Years | 9 (1.5%) | 0 (0.0%) |
| 65 to 74 Years | 5 (2.3%) | 0 (0.0%) |
| 75 Years and over | 20 (19.4%) | 53 (39.6%) |
Disability Class: Self-Care Difficulty
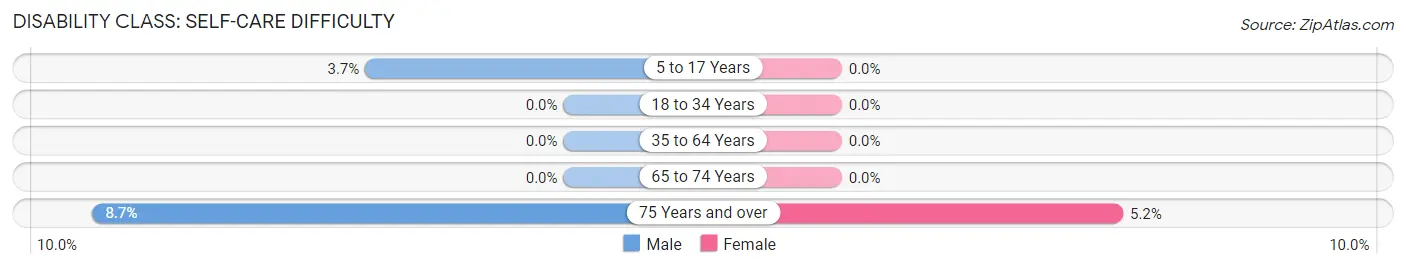
| Age Bracket | Male | Female |
| 5 to 17 Years | 20 (3.7%) | 0 (0.0%) |
| 18 to 34 Years | 0 (0.0%) | 0 (0.0%) |
| 35 to 64 Years | 0 (0.0%) | 0 (0.0%) |
| 65 to 74 Years | 0 (0.0%) | 0 (0.0%) |
| 75 Years and over | 9 (8.7%) | 7 (5.2%) |
Technology Access in Maeser
Computing Device Access in Maeser
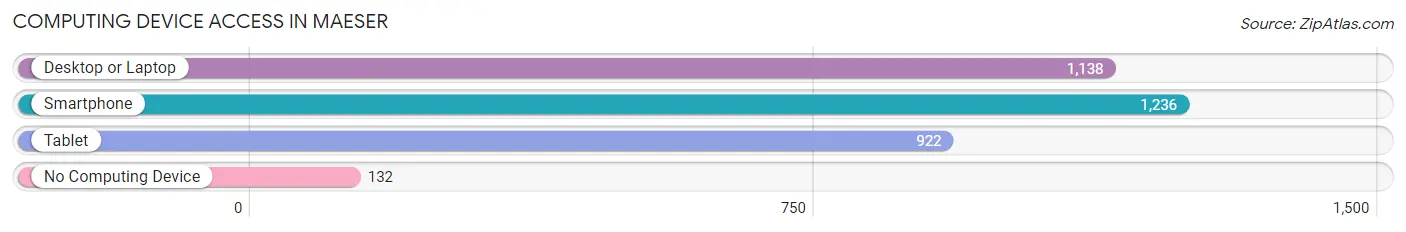
| Device Type | # Households | % Households |
| Desktop or Laptop | 1,138 | 76.9% |
| Smartphone | 1,236 | 83.5% |
| Tablet | 922 | 62.3% |
| No Computing Device | 132 | 8.9% |
| Total | 1,480 | 100.0% |
Internet Access in Maeser
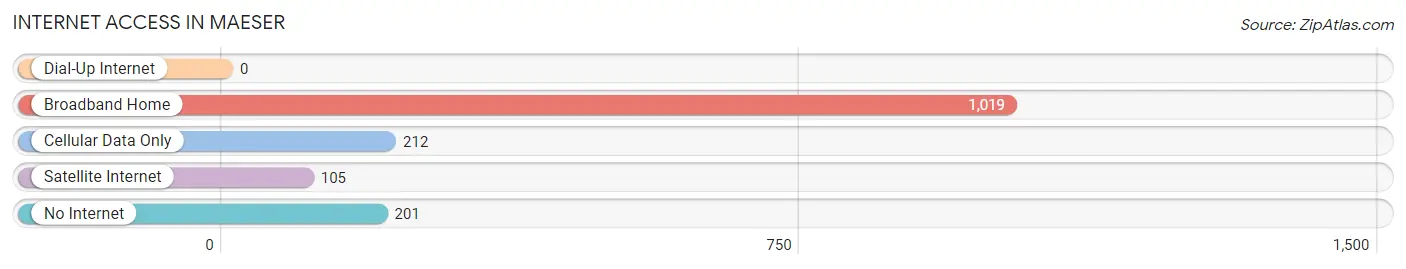
| Internet Type | # Households | % Households |
| Dial-Up Internet | 0 | 0.0% |
| Broadband Home | 1,019 | 68.9% |
| Cellular Data Only | 212 | 14.3% |
| Satellite Internet | 105 | 7.1% |
| No Internet | 201 | 13.6% |
| Total | 1,480 | 100.0% |
Maeser Summary
Maeser is a small unincorporated community located in Uintah County, Utah. It is situated in the Uinta Basin, approximately 10 miles south of Vernal, the county seat. Maeser is a rural community with a population of approximately 1,000 people.
History
Maeser was founded in 1891 by a group of Mormon settlers led by John W. Maeser. The settlers were sent to the area by the Church of Jesus Christ of Latter-day Saints (LDS) to establish a new settlement. The settlers named the town after John Maeser, who was a prominent LDS leader and educator.
The settlers quickly established a thriving community, with a school, a church, and a post office. The town was incorporated in 1895 and the first mayor was John Maeser. The town grew steadily over the next few decades, and by the 1930s it had a population of over 500 people.
Geography
Maeser is located in the Uinta Basin, a large area of land in northeastern Utah. The basin is surrounded by the Uinta Mountains to the east and the Wasatch Mountains to the west. The area is characterized by rolling hills and wide open spaces.
The climate in Maeser is semi-arid, with hot summers and cold winters. The average annual temperature is around 50 degrees Fahrenheit. The area receives an average of 10 inches of precipitation per year, mostly in the form of snow.
Economy
The economy of Maeser is largely based on agriculture and ranching. The area is known for its production of hay, wheat, and other grains. The town also has a small manufacturing sector, with several small businesses producing furniture, clothing, and other goods.
Maeser is also home to several oil and gas companies, which have been operating in the area since the early 1900s. The town is also home to several small businesses, including restaurants, grocery stores, and other retail outlets.
Demographics
As of the 2010 census, Maeser had a population of 1,000 people. The racial makeup of the town was 95.2% White, 0.7% Native American, 0.3% Asian, 0.2% African American, and 3.6% from other races. The median household income was $41,250, and the median family income was $45,000.
Maeser is a predominantly Mormon community, with over 90% of the population identifying as members of the LDS Church. The town is also home to a small Catholic community, as well as a few other religious denominations.
Maeser is a small, rural community with a rich history and a strong sense of community. The town is home to a diverse population of people who are proud of their heritage and their town. Maeser is a great place to live and work, and it is a great place to raise a family.
Common Questions
What is Per Capita Income in Maeser?
Per Capita income in Maeser is $26,341.
What is the Median Family Income in Maeser?
Median Family Income in Maeser is $85,819.
What is the Median Household income in Maeser?
Median Household Income in Maeser is $67,389.
What is Income or Wage Gap in Maeser?
Income or Wage Gap in Maeser is 53.9%.
Women in Maeser earn 46.1 cents for every dollar earned by a man.
What is Inequality or Gini Index in Maeser?
Inequality or Gini Index in Maeser is 0.38.
What is the Total Population of Maeser?
Total Population of Maeser is 4,126.
What is the Total Male Population of Maeser?
Total Male Population of Maeser is 1,948.
What is the Total Female Population of Maeser?
Total Female Population of Maeser is 2,178.
What is the Ratio of Males per 100 Females in Maeser?
There are 89.44 Males per 100 Females in Maeser.
What is the Ratio of Females per 100 Males in Maeser?
There are 111.81 Females per 100 Males in Maeser.
What is the Median Population Age in Maeser?
Median Population Age in Maeser is 33.4 Years.
What is the Average Family Size in Maeser
Average Family Size in Maeser is 3.6 People.
What is the Average Household Size in Maeser
Average Household Size in Maeser is 2.8 People.
How Large is the Labor Force in Maeser?
There are 1,565 People in the Labor Forcein in Maeser.
What is the Percentage of People in the Labor Force in Maeser?
53.0% of People are in the Labor Force in Maeser.
What is the Unemployment Rate in Maeser?
Unemployment Rate in Maeser is 3.5%.