Marion, UT Map & Demographics
Marion Map
Marion Overview
$44,006
PER CAPITA INCOME
$110,625
AVG FAMILY INCOME
$99,464
AVG HOUSEHOLD INCOME
0.51
INEQUALITY / GINI INDEX
617
TOTAL POPULATION
367
MALE POPULATION
250
FEMALE POPULATION
146.80
MALES / 100 FEMALES
68.12
FEMALES / 100 MALES
22.7
MEDIAN AGE
4.4
AVG FAMILY SIZE
3.6
AVG HOUSEHOLD SIZE
240
LABOR FORCE [ PEOPLE ]
51.1%
PERCENT IN LABOR FORCE
Income in Marion
Income Overview in Marion
Per Capita Income in Marion is $44,006, while median incomes of families and households are $110,625 and $99,464 respectively.
| Characteristic | Number | Measure |
| Per Capita Income | 617 | $44,006 |
| Median Family Income | 126 | $110,625 |
| Mean Family Income | 126 | $187,983 |
| Median Household Income | 169 | $99,464 |
| Mean Household Income | 169 | $163,224 |
| Income Deficit | 126 | $0 |
| Wage / Income Gap (%) | 617 | 0.00% |
| Wage / Income Gap ($) | 617 | 100.00¢ per $1 |
| Gini / Inequality Index | 617 | 0.51 |
Earnings by Sex in Marion
| Sex | Number | Average Earnings |
| Male | 253 (65.5%) | $0 |
| Female | 133 (34.5%) | $0 |
| Total | 386 (100.0%) | $0 |
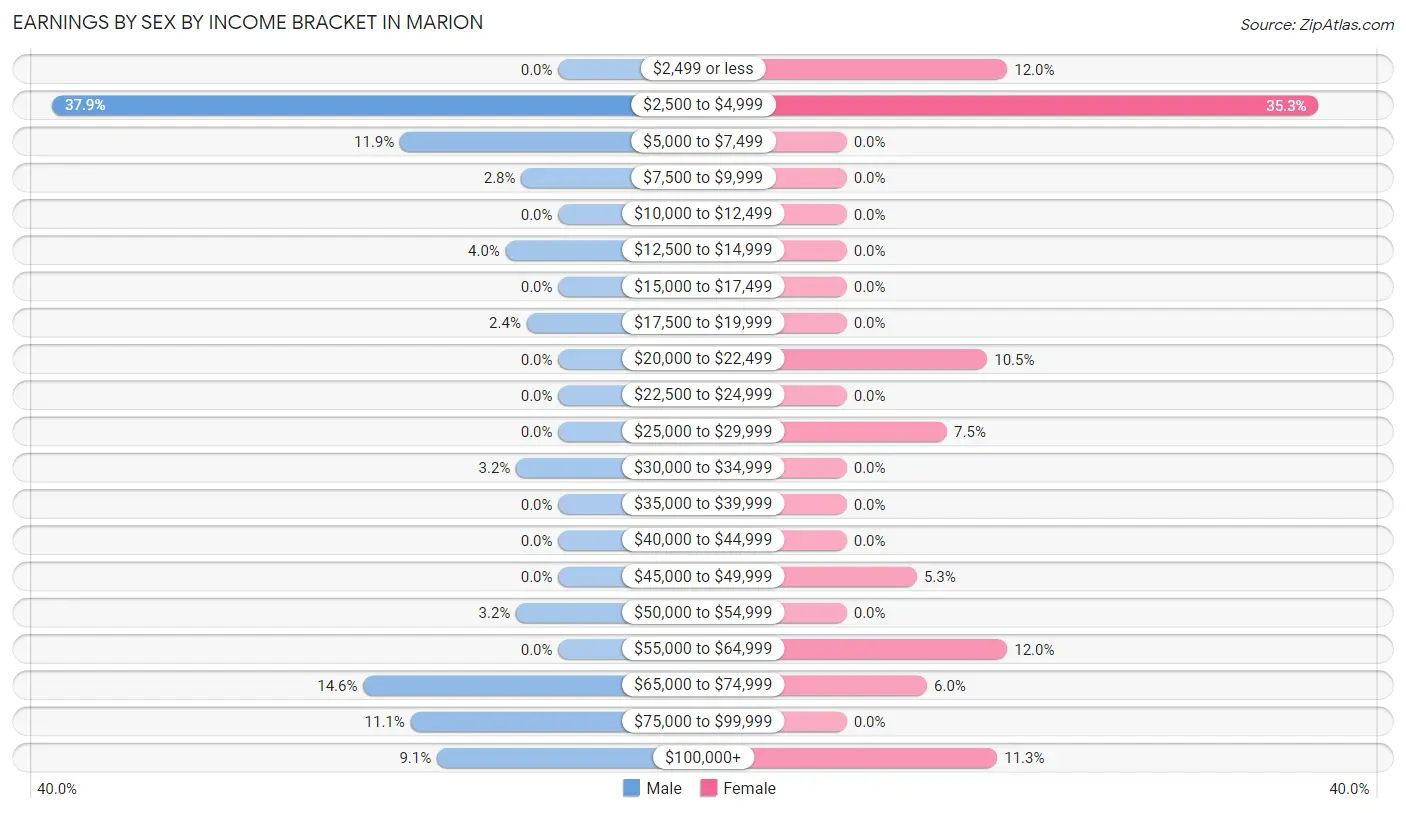
Earnings by Sex by Income Bracket in Marion
The most common earnings brackets in Marion are $2,500 to $4,999 for men (96 | 37.9%) and $2,500 to $4,999 for women (47 | 35.3%).
| Income | Male | Female |
| $2,499 or less | 0 (0.0%) | 16 (12.0%) |
| $2,500 to $4,999 | 96 (37.9%) | 47 (35.3%) |
| $5,000 to $7,499 | 30 (11.9%) | 0 (0.0%) |
| $7,500 to $9,999 | 7 (2.8%) | 0 (0.0%) |
| $10,000 to $12,499 | 0 (0.0%) | 0 (0.0%) |
| $12,500 to $14,999 | 10 (4.0%) | 0 (0.0%) |
| $15,000 to $17,499 | 0 (0.0%) | 0 (0.0%) |
| $17,500 to $19,999 | 6 (2.4%) | 0 (0.0%) |
| $20,000 to $22,499 | 0 (0.0%) | 14 (10.5%) |
| $22,500 to $24,999 | 0 (0.0%) | 0 (0.0%) |
| $25,000 to $29,999 | 0 (0.0%) | 10 (7.5%) |
| $30,000 to $34,999 | 8 (3.2%) | 0 (0.0%) |
| $35,000 to $39,999 | 0 (0.0%) | 0 (0.0%) |
| $40,000 to $44,999 | 0 (0.0%) | 0 (0.0%) |
| $45,000 to $49,999 | 0 (0.0%) | 7 (5.3%) |
| $50,000 to $54,999 | 8 (3.2%) | 0 (0.0%) |
| $55,000 to $64,999 | 0 (0.0%) | 16 (12.0%) |
| $65,000 to $74,999 | 37 (14.6%) | 8 (6.0%) |
| $75,000 to $99,999 | 28 (11.1%) | 0 (0.0%) |
| $100,000+ | 23 (9.1%) | 15 (11.3%) |
| Total | 253 (100.0%) | 133 (100.0%) |
Earnings by Sex by Educational Attainment in Marion
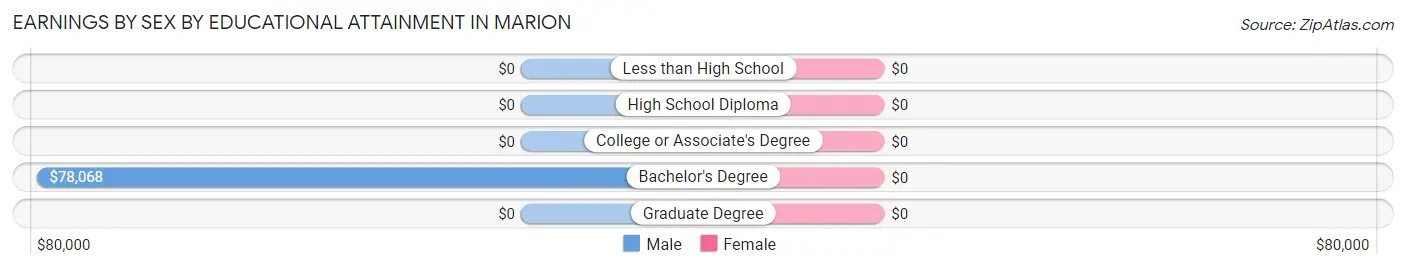
| Educational Attainment | Male Income | Female Income |
| Less than High School | - | - |
| High School Diploma | - | - |
| College or Associate's Degree | - | - |
| Bachelor's Degree | $78,068 | $0 |
| Graduate Degree | - | - |
| Total | $70,769 | $0 |
Family Income in Marion
Family Income Brackets in Marion
According to the Marion family income data, there are 41 families falling into the $150,000 to $199,999 income range, which is the most common income bracket and makes up 32.5% of all families.
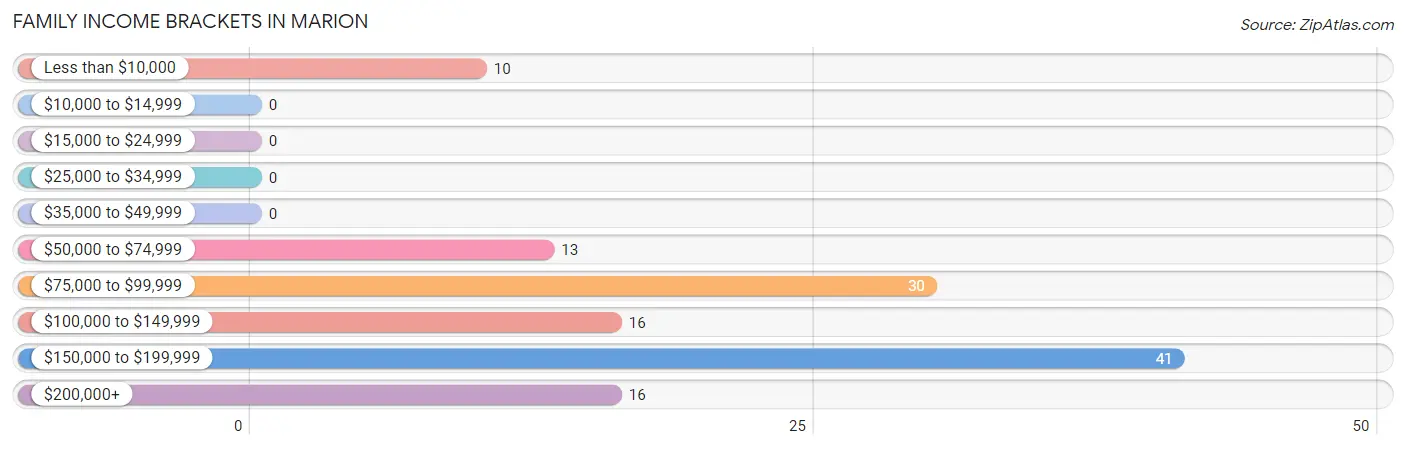
| Income Bracket | # Families | % Families |
| Less than $10,000 | 10 | 7.9% |
| $10,000 to $14,999 | 0 | 0.0% |
| $15,000 to $24,999 | 0 | 0.0% |
| $25,000 to $34,999 | 0 | 0.0% |
| $35,000 to $49,999 | 0 | 0.0% |
| $50,000 to $74,999 | 13 | 10.3% |
| $75,000 to $99,999 | 30 | 23.8% |
| $100,000 to $149,999 | 16 | 12.7% |
| $150,000 to $199,999 | 41 | 32.5% |
| $200,000+ | 16 | 12.7% |
Family Income by Famaliy Size in Marion
4-person families (35 | 27.8%) account for the highest median family income in Marion with $187,614 per family, while 4-person families (35 | 27.8%) have the highest median income of $46,904 per family member.
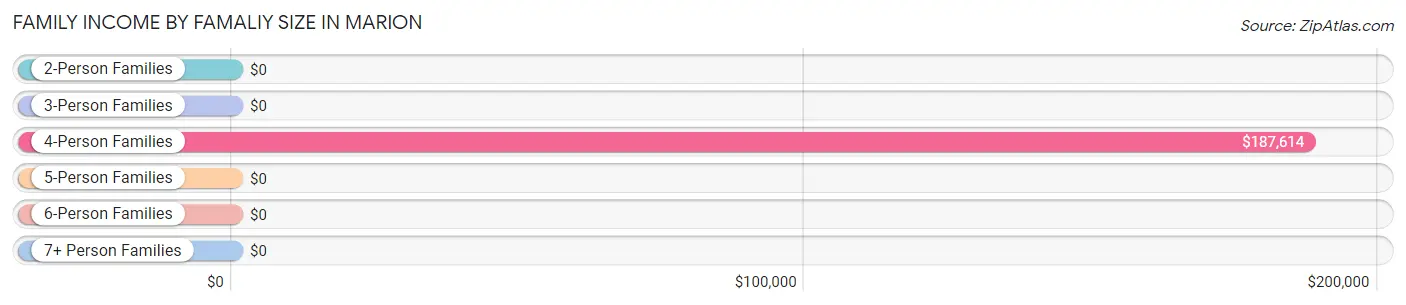
| Income Bracket | # Families | Median Income |
| 2-Person Families | 42 (33.3%) | $0 |
| 3-Person Families | 24 (19.1%) | $0 |
| 4-Person Families | 35 (27.8%) | $187,614 |
| 5-Person Families | 19 (15.1%) | $0 |
| 6-Person Families | 0 (0.0%) | $0 |
| 7+ Person Families | 6 (4.8%) | $0 |
| Total | 126 (100.0%) | $110,625 |
Family Income by Number of Earners in Marion
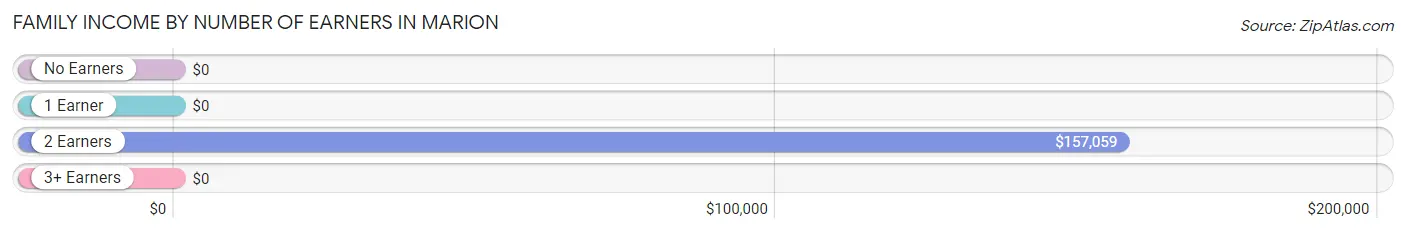
| Number of Earners | # Families | Median Income |
| No Earners | 0 (0.0%) | $0 |
| 1 Earner | 23 (18.2%) | $0 |
| 2 Earners | 60 (47.6%) | $157,059 |
| 3+ Earners | 43 (34.1%) | $0 |
| Total | 126 (100.0%) | $110,625 |
Household Income in Marion
Household Income Brackets in Marion
With 41 households falling in the category, the $150,000 to $199,999 income range is the most frequent in Marion, accounting for 24.3% of all households.
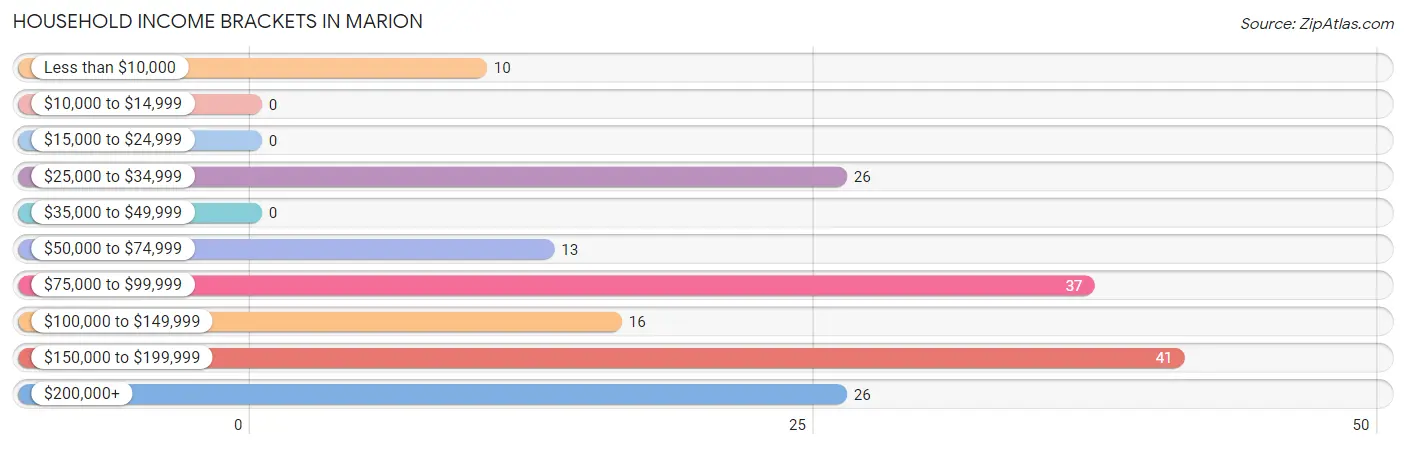
| Income Bracket | # Households | % Households |
| Less than $10,000 | 10 | 5.9% |
| $10,000 to $14,999 | 0 | 0.0% |
| $15,000 to $24,999 | 0 | 0.0% |
| $25,000 to $34,999 | 26 | 15.4% |
| $35,000 to $49,999 | 0 | 0.0% |
| $50,000 to $74,999 | 13 | 7.7% |
| $75,000 to $99,999 | 37 | 21.9% |
| $100,000 to $149,999 | 16 | 9.5% |
| $150,000 to $199,999 | 41 | 24.3% |
| $200,000+ | 26 | 15.4% |
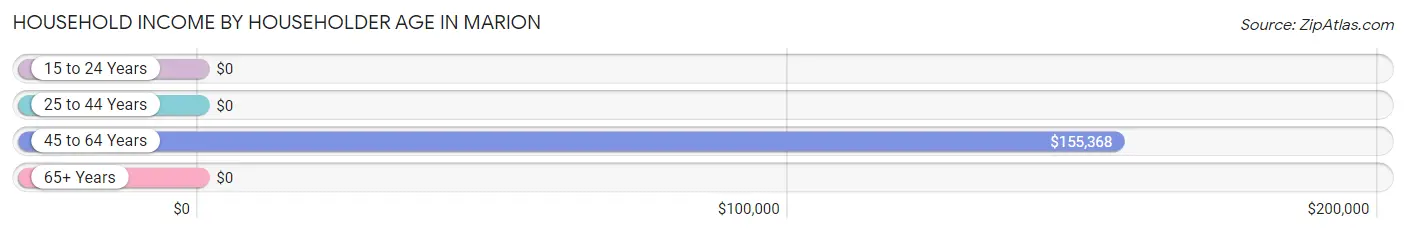
Household Income by Householder Age in Marion
The median household income in Marion is $99,464, with the highest median household income of $155,368 found in the 45 to 64 years age bracket for the primary householder. A total of 81 households (47.9%) fall into this category.
| Income Bracket | # Households | Median Income |
| 15 to 24 Years | 0 (0.0%) | $0 |
| 25 to 44 Years | 40 (23.7%) | $0 |
| 45 to 64 Years | 81 (47.9%) | $155,368 |
| 65+ Years | 48 (28.4%) | $0 |
| Total | 169 (100.0%) | $99,464 |
Poverty in Marion
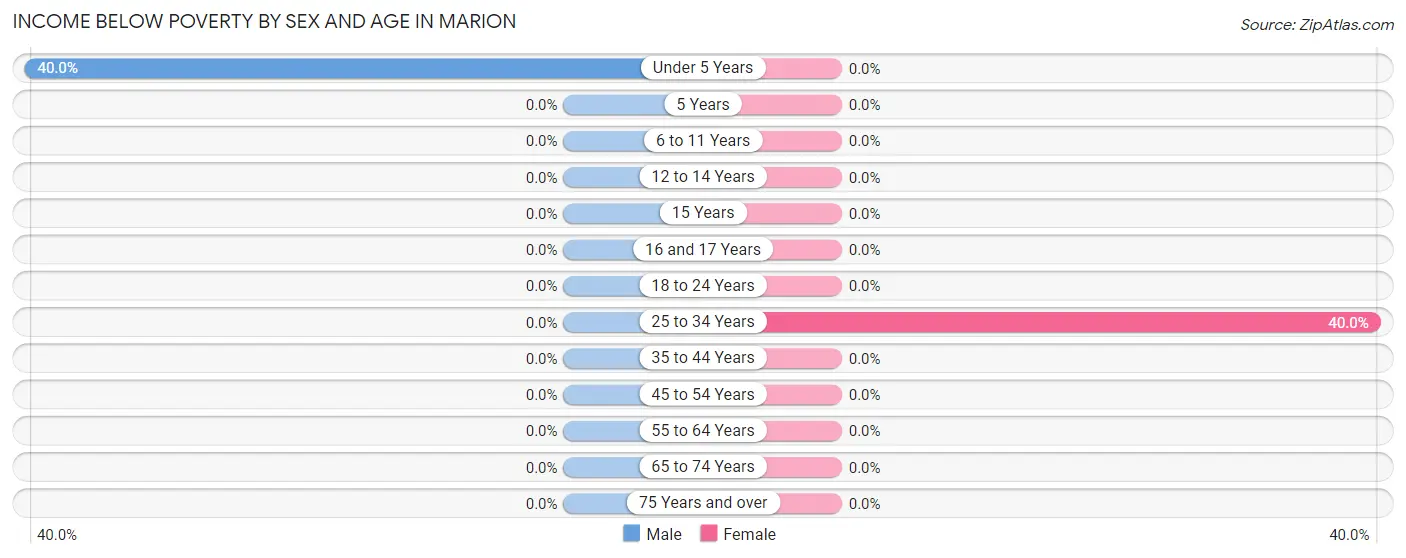
Income Below Poverty by Sex and Age in Marion
With 3.3% poverty level for males and 4.0% for females among the residents of Marion, under 5 year old males and 25 to 34 year old females are the most vulnerable to poverty, with 12 males (40.0%) and 10 females (40.0%) in their respective age groups living below the poverty level.
| Age Bracket | Male | Female |
| Under 5 Years | 12 (40.0%) | 0 (0.0%) |
| 5 Years | 0 (0.0%) | 0 (0.0%) |
| 6 to 11 Years | 0 (0.0%) | 0 (0.0%) |
| 12 to 14 Years | 0 (0.0%) | 0 (0.0%) |
| 15 Years | 0 (0.0%) | 0 (0.0%) |
| 16 and 17 Years | 0 (0.0%) | 0 (0.0%) |
| 18 to 24 Years | 0 (0.0%) | 0 (0.0%) |
| 25 to 34 Years | 0 (0.0%) | 10 (40.0%) |
| 35 to 44 Years | 0 (0.0%) | 0 (0.0%) |
| 45 to 54 Years | 0 (0.0%) | 0 (0.0%) |
| 55 to 64 Years | 0 (0.0%) | 0 (0.0%) |
| 65 to 74 Years | 0 (0.0%) | 0 (0.0%) |
| 75 Years and over | 0 (0.0%) | 0 (0.0%) |
| Total | 12 (3.3%) | 10 (4.0%) |
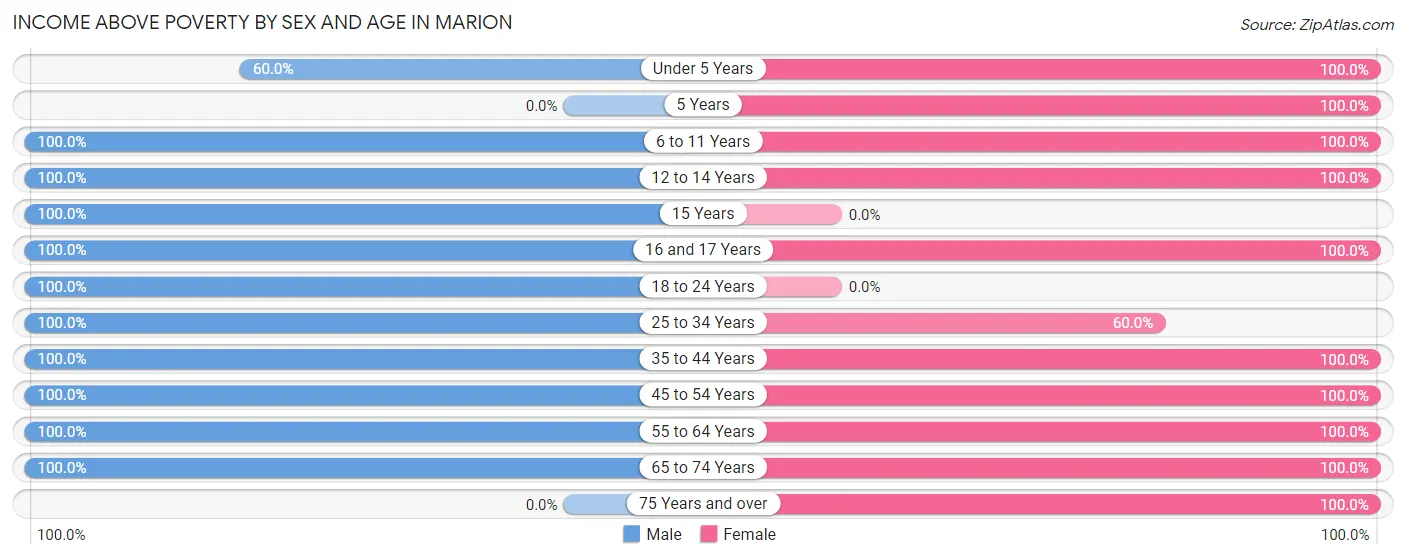
Income Above Poverty by Sex and Age in Marion
According to the poverty statistics in Marion, males aged 6 to 11 years and females aged under 5 years are the age groups that are most secure financially, with 100.0% of males and 100.0% of females in these age groups living above the poverty line.
| Age Bracket | Male | Female |
| Under 5 Years | 18 (60.0%) | 8 (100.0%) |
| 5 Years | 0 (0.0%) | 15 (100.0%) |
| 6 to 11 Years | 32 (100.0%) | 11 (100.0%) |
| 12 to 14 Years | 22 (100.0%) | 21 (100.0%) |
| 15 Years | 8 (100.0%) | 0 (0.0%) |
| 16 and 17 Years | 7 (100.0%) | 33 (100.0%) |
| 18 to 24 Years | 126 (100.0%) | 0 (0.0%) |
| 25 to 34 Years | 13 (100.0%) | 15 (60.0%) |
| 35 to 44 Years | 19 (100.0%) | 11 (100.0%) |
| 45 to 54 Years | 38 (100.0%) | 52 (100.0%) |
| 55 to 64 Years | 32 (100.0%) | 41 (100.0%) |
| 65 to 74 Years | 40 (100.0%) | 15 (100.0%) |
| 75 Years and over | 0 (0.0%) | 18 (100.0%) |
| Total | 355 (96.7%) | 240 (96.0%) |
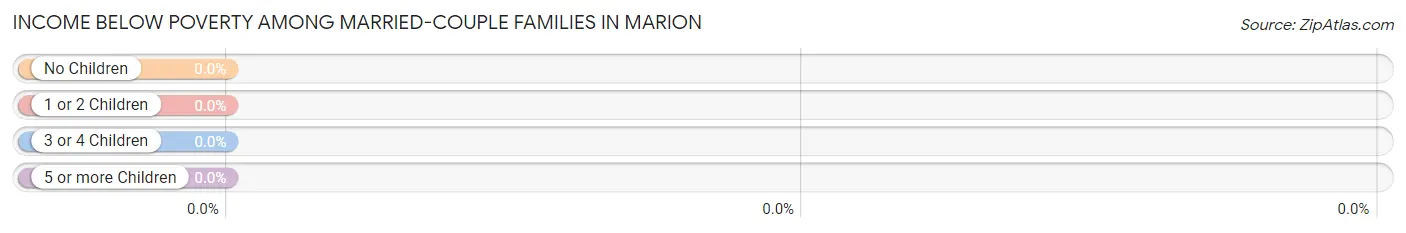
Income Below Poverty Among Married-Couple Families in Marion
| Children | Above Poverty | Below Poverty |
| No Children | 63 (100.0%) | 0 (0.0%) |
| 1 or 2 Children | 28 (100.0%) | 0 (0.0%) |
| 3 or 4 Children | 19 (100.0%) | 0 (0.0%) |
| 5 or more Children | 6 (100.0%) | 0 (0.0%) |
| Total | 116 (100.0%) | 0 (0.0%) |
Income Below Poverty Among Single-Parent Households in Marion
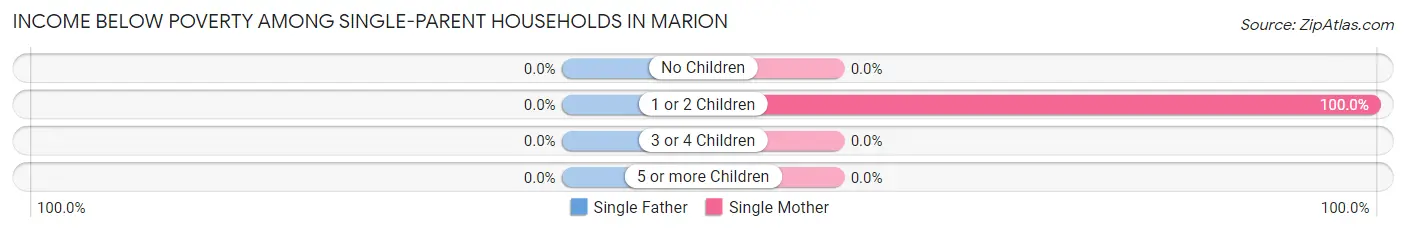
| Children | Single Father | Single Mother |
| No Children | 0 (0.0%) | 0 (0.0%) |
| 1 or 2 Children | 0 (0.0%) | 10 (100.0%) |
| 3 or 4 Children | 0 (0.0%) | 0 (0.0%) |
| 5 or more Children | 0 (0.0%) | 0 (0.0%) |
| Total | 0 (0.0%) | 10 (100.0%) |
Income Below Poverty Among Married-Couple vs Single-Parent Households in Marion
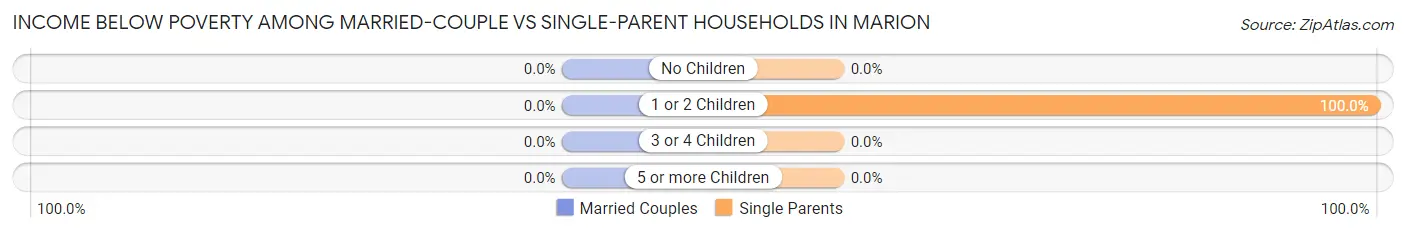
| Children | Married-Couple Families | Single-Parent Households |
| No Children | 0 (0.0%) | 0 (0.0%) |
| 1 or 2 Children | 0 (0.0%) | 10 (100.0%) |
| 3 or 4 Children | 0 (0.0%) | 0 (0.0%) |
| 5 or more Children | 0 (0.0%) | 0 (0.0%) |
| Total | 0 (0.0%) | 10 (100.0%) |
Race in Marion
The most populous races in Marion are , and White / Caucasian (617 | 100.0%).
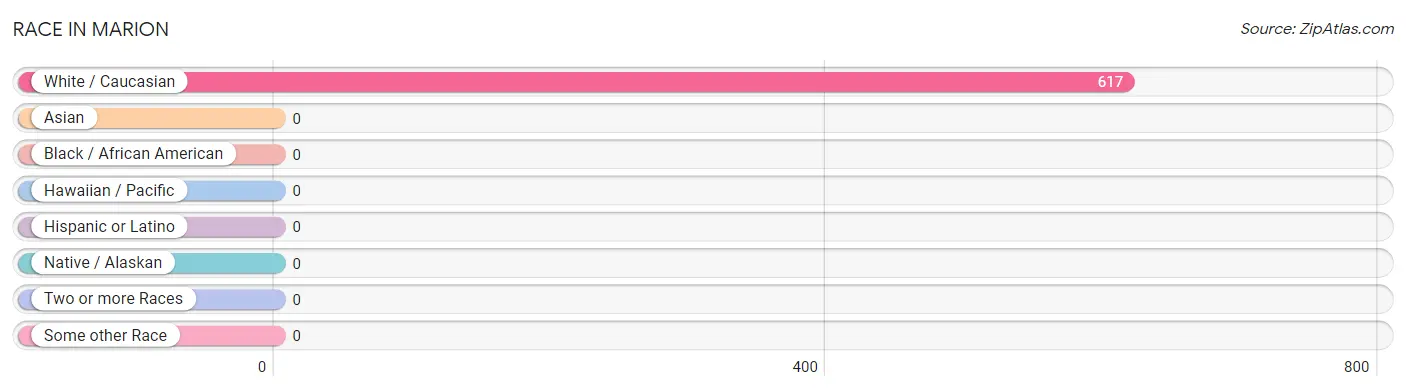
| Race | # Population | % Population |
| Asian | 0 | 0.0% |
| Black / African American | 0 | 0.0% |
| Hawaiian / Pacific | 0 | 0.0% |
| Hispanic or Latino | 0 | 0.0% |
| Native / Alaskan | 0 | 0.0% |
| White / Caucasian | 617 | 100.0% |
| Two or more Races | 0 | 0.0% |
| Some other Race | 0 | 0.0% |
| Total | 617 | 100.0% |
Ancestry in Marion
The most populous ancestries reported in Marion are English (285 | 46.2%), German (175 | 28.4%), Swedish (120 | 19.5%), Danish (96 | 15.6%), and Scottish (85 | 13.8%), together accounting for 123.3% of all Marion residents.
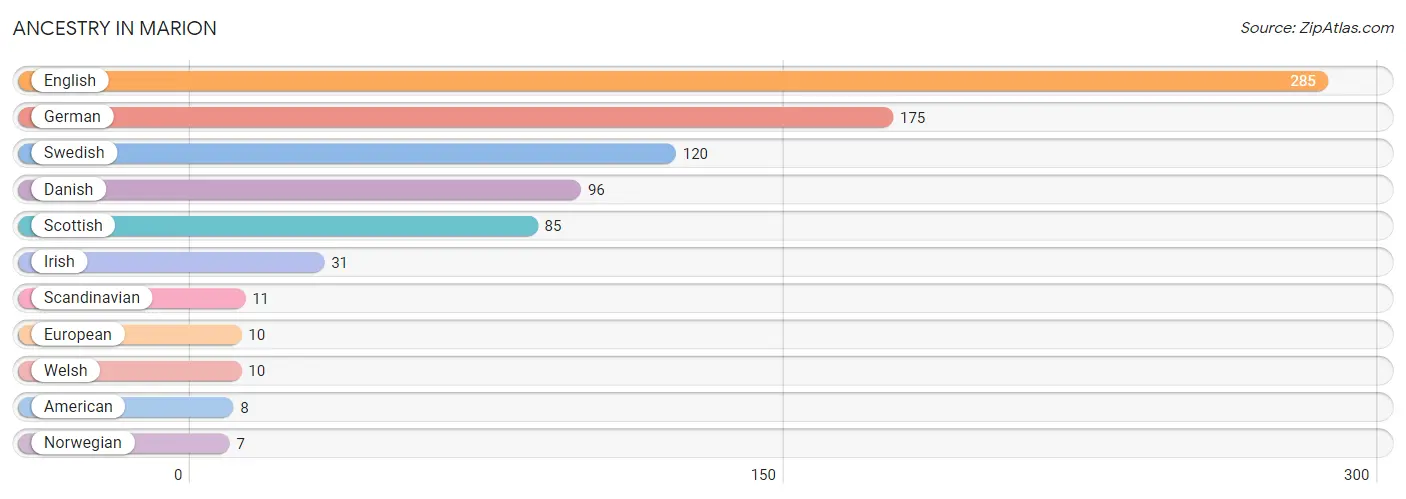
| Ancestry | # Population | % Population |
| American | 8 | 1.3% |
| Danish | 96 | 15.6% |
| English | 285 | 46.2% |
| European | 10 | 1.6% |
| German | 175 | 28.4% |
| Irish | 31 | 5.0% |
| Norwegian | 7 | 1.1% |
| Scandinavian | 11 | 1.8% |
| Scottish | 85 | 13.8% |
| Swedish | 120 | 19.5% |
| Welsh | 10 | 1.6% | View All 11 Rows |
Immigrants in Marion

| Immigration Origin | # Population | % Population | View All 0 Rows |
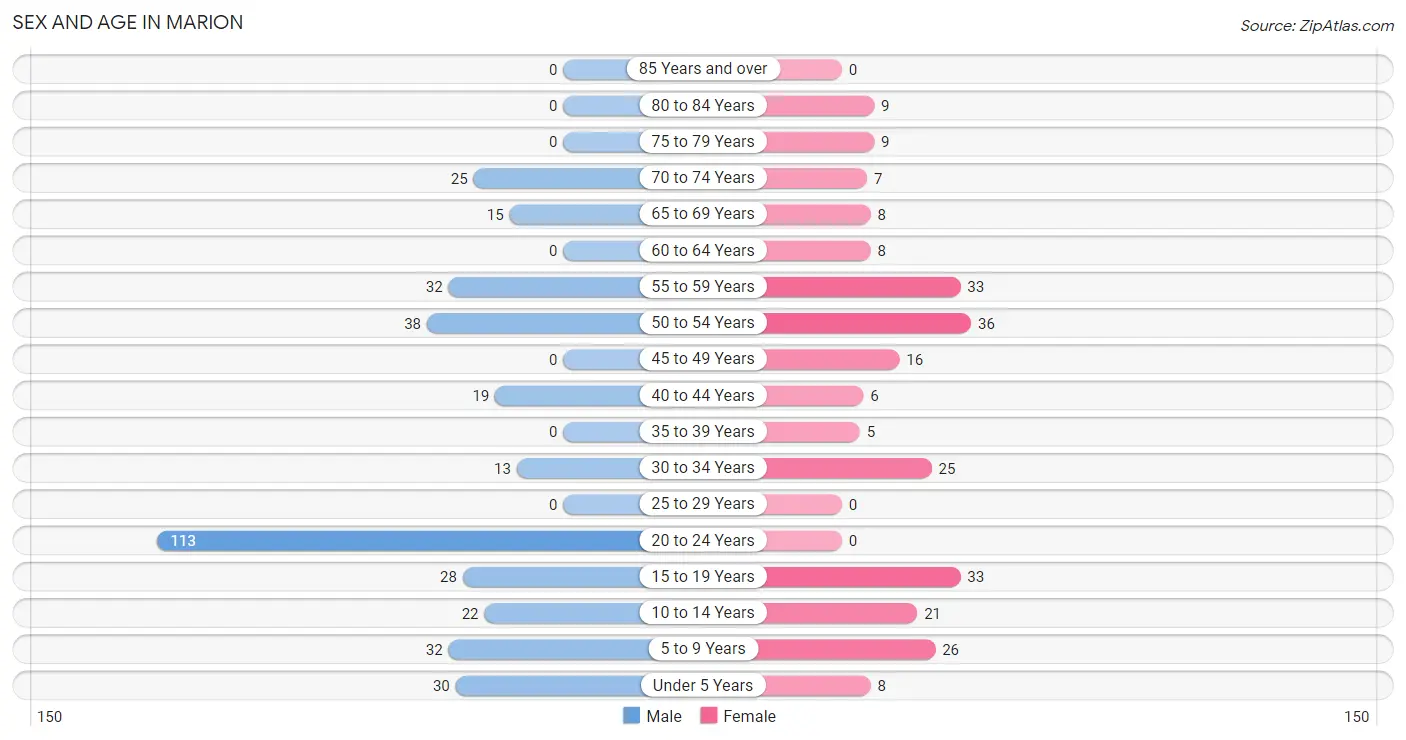
Sex and Age in Marion
Sex and Age in Marion
The most populous age groups in Marion are 20 to 24 Years (113 | 30.8%) for men and 50 to 54 Years (36 | 14.4%) for women.
| Age Bracket | Male | Female |
| Under 5 Years | 30 (8.2%) | 8 (3.2%) |
| 5 to 9 Years | 32 (8.7%) | 26 (10.4%) |
| 10 to 14 Years | 22 (6.0%) | 21 (8.4%) |
| 15 to 19 Years | 28 (7.6%) | 33 (13.2%) |
| 20 to 24 Years | 113 (30.8%) | 0 (0.0%) |
| 25 to 29 Years | 0 (0.0%) | 0 (0.0%) |
| 30 to 34 Years | 13 (3.5%) | 25 (10.0%) |
| 35 to 39 Years | 0 (0.0%) | 5 (2.0%) |
| 40 to 44 Years | 19 (5.2%) | 6 (2.4%) |
| 45 to 49 Years | 0 (0.0%) | 16 (6.4%) |
| 50 to 54 Years | 38 (10.3%) | 36 (14.4%) |
| 55 to 59 Years | 32 (8.7%) | 33 (13.2%) |
| 60 to 64 Years | 0 (0.0%) | 8 (3.2%) |
| 65 to 69 Years | 15 (4.1%) | 8 (3.2%) |
| 70 to 74 Years | 25 (6.8%) | 7 (2.8%) |
| 75 to 79 Years | 0 (0.0%) | 9 (3.6%) |
| 80 to 84 Years | 0 (0.0%) | 9 (3.6%) |
| 85 Years and over | 0 (0.0%) | 0 (0.0%) |
| Total | 367 (100.0%) | 250 (100.0%) |
Families and Households in Marion
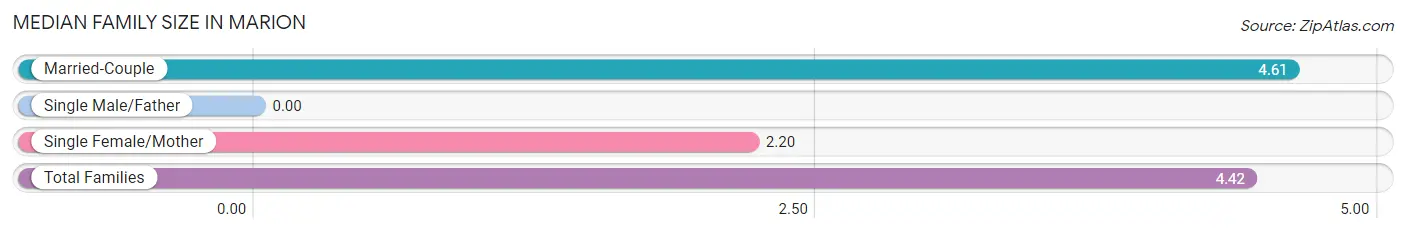
Median Family Size in Marion
| Family Type | # Families | Family Size |
| Married-Couple | 116 (92.1%) | 4.61 |
| Single Male/Father | 0 (0.0%) | - |
| Single Female/Mother | 10 (7.9%) | 2.20 |
| Total Families | 126 (100.0%) | 4.42 |
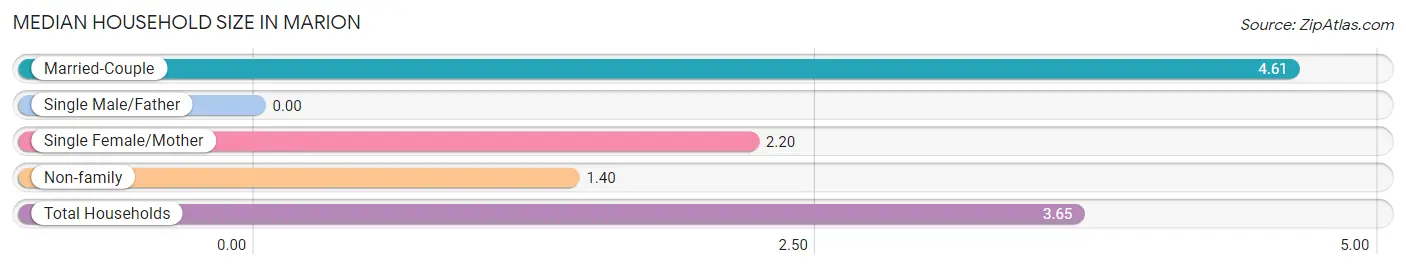
Median Household Size in Marion
| Household Type | # Households | Household Size |
| Married-Couple | 116 (68.6%) | 4.61 |
| Single Male/Father | 0 (0.0%) | - |
| Single Female/Mother | 10 (5.9%) | 2.20 |
| Non-family | 43 (25.4%) | 1.40 |
| Total Households | 169 (100.0%) | 3.65 |
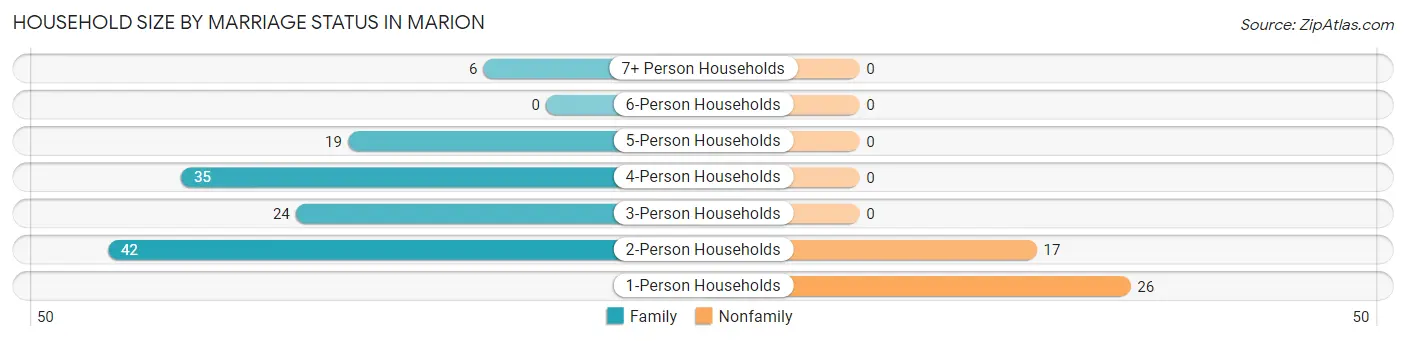
Household Size by Marriage Status in Marion
Out of a total of 169 households in Marion, 126 (74.6%) are family households, while 43 (25.4%) are nonfamily households. The most numerous type of family households are 2-person households, comprising 42, and the most common type of nonfamily households are 1-person households, comprising 26.
| Household Size | Family Households | Nonfamily Households |
| 1-Person Households | - | 26 (15.4%) |
| 2-Person Households | 42 (24.8%) | 17 (10.1%) |
| 3-Person Households | 24 (14.2%) | 0 (0.0%) |
| 4-Person Households | 35 (20.7%) | 0 (0.0%) |
| 5-Person Households | 19 (11.2%) | 0 (0.0%) |
| 6-Person Households | 0 (0.0%) | 0 (0.0%) |
| 7+ Person Households | 6 (3.5%) | 0 (0.0%) |
| Total | 126 (74.6%) | 43 (25.4%) |
Female Fertility in Marion
Fertility by Age in Marion
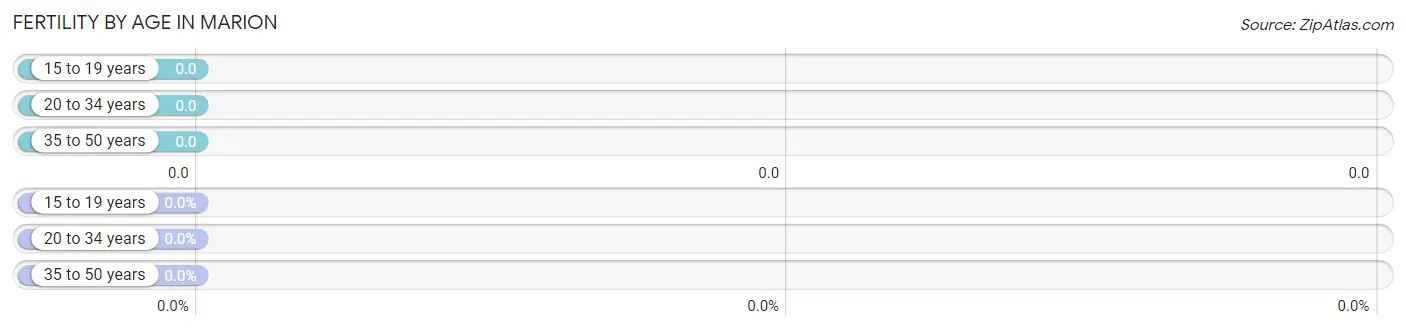
| Age Bracket | Women with Births | Births / 1,000 Women |
| 15 to 19 years | 0 (0.0%) | 0.0 |
| 20 to 34 years | 0 (0.0%) | 0.0 |
| 35 to 50 years | 0 (0.0%) | 0.0 |
| Total | 0 (0.0%) | 0.0 |
Fertility by Age by Marriage Status in Marion
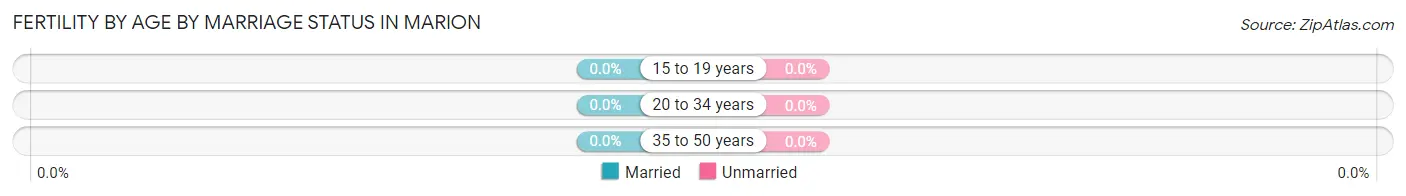
| Age Bracket | Married | Unmarried |
| 15 to 19 years | 0 (0.0%) | 0 (0.0%) |
| 20 to 34 years | 0 (0.0%) | 0 (0.0%) |
| 35 to 50 years | 0 (0.0%) | 0 (0.0%) |
| Total | 0 (0.0%) | 0 (0.0%) |
Fertility by Education in Marion
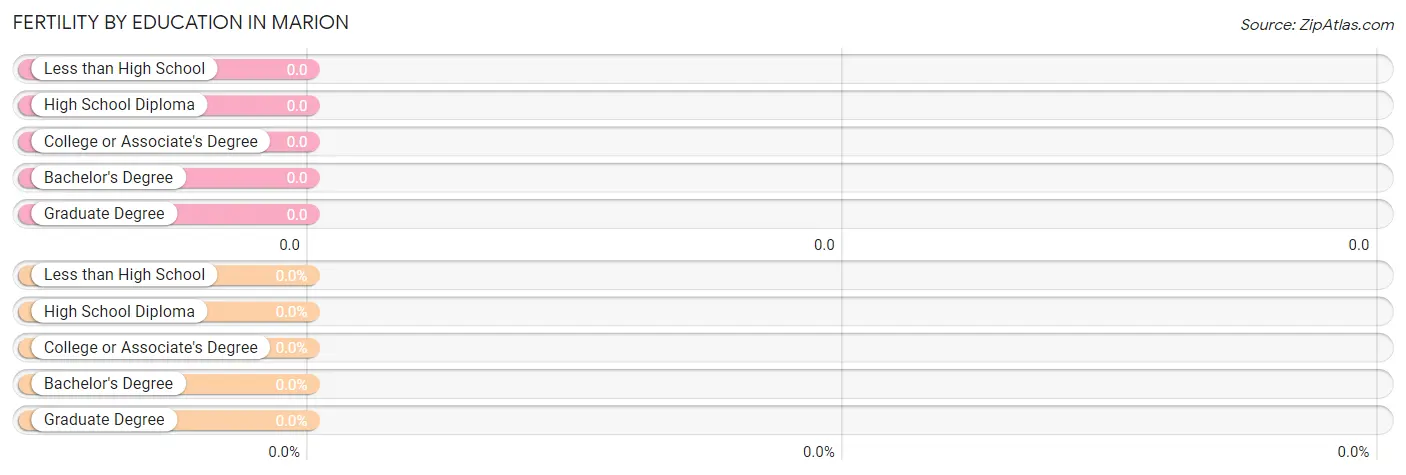
| Educational Attainment | Women with Births | Births / 1,000 Women |
| Less than High School | 0 (0.0%) | 0.0 |
| High School Diploma | 0 (0.0%) | 0.0 |
| College or Associate's Degree | 0 (0.0%) | 0.0 |
| Bachelor's Degree | 0 (0.0%) | 0.0 |
| Graduate Degree | 0 (0.0%) | 0.0 |
| Total | 0 (0.0%) | 0.0 |
Fertility by Education by Marriage Status in Marion
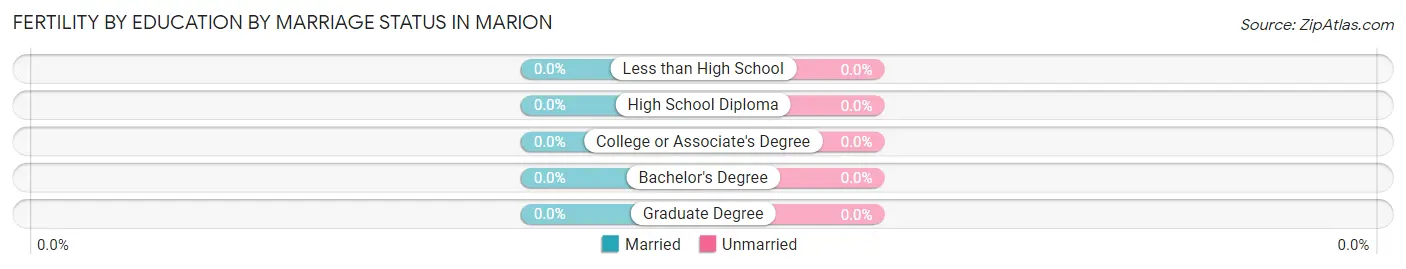
| Educational Attainment | Married | Unmarried |
| Less than High School | 0 (0.0%) | 0 (0.0%) |
| High School Diploma | 0 (0.0%) | 0 (0.0%) |
| College or Associate's Degree | 0 (0.0%) | 0 (0.0%) |
| Bachelor's Degree | 0 (0.0%) | 0 (0.0%) |
| Graduate Degree | 0 (0.0%) | 0 (0.0%) |
| Total | 0 (0.0%) | 0 (0.0%) |
Employment Characteristics in Marion
Employment by Class of Employer in Marion
Among the 240 employed individuals in Marion, private company employees (153 | 63.7%), self-employed (incorporated) (23 | 9.6%), and not-for-profit organizations (21 | 8.7%) make up the most common classes of employment.
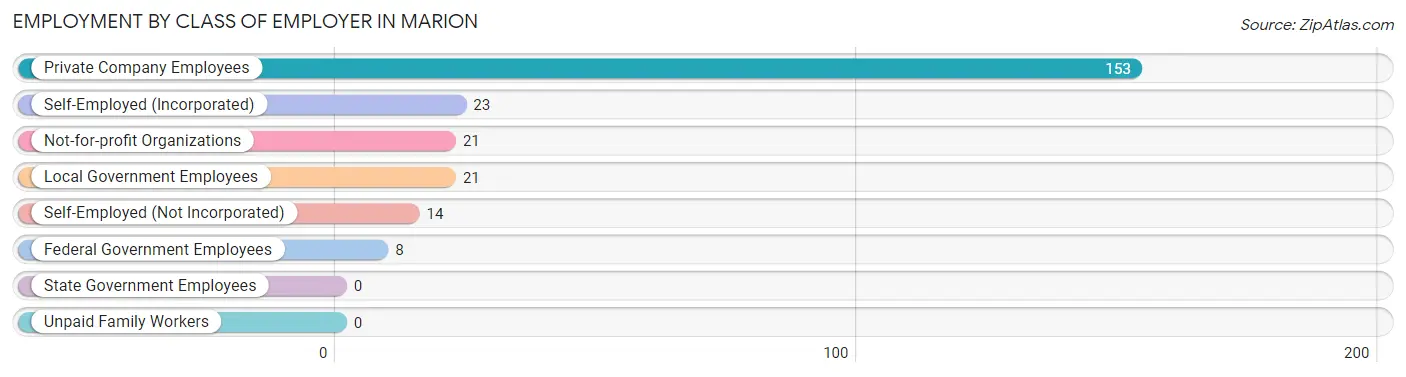
| Employer Class | # Employees | % Employees |
| Private Company Employees | 153 | 63.7% |
| Self-Employed (Incorporated) | 23 | 9.6% |
| Self-Employed (Not Incorporated) | 14 | 5.8% |
| Not-for-profit Organizations | 21 | 8.7% |
| Local Government Employees | 21 | 8.7% |
| State Government Employees | 0 | 0.0% |
| Federal Government Employees | 8 | 3.3% |
| Unpaid Family Workers | 0 | 0.0% |
| Total | 240 | 100.0% |
Employment Status by Age in Marion
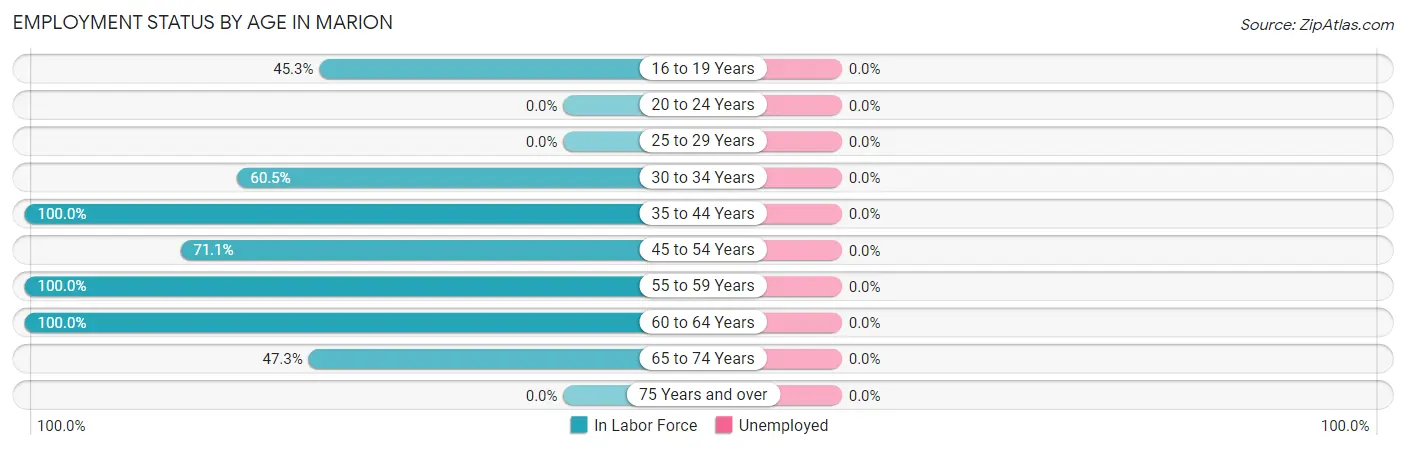
| Age Bracket | In Labor Force | Unemployed |
| 16 to 19 Years | 24 (45.3%) | 0 (0.0%) |
| 20 to 24 Years | 0 (0.0%) | 0 (0.0%) |
| 25 to 29 Years | 0 (0.0%) | 0 (0.0%) |
| 30 to 34 Years | 23 (60.5%) | 0 (0.0%) |
| 35 to 44 Years | 30 (100.0%) | 0 (0.0%) |
| 45 to 54 Years | 64 (71.1%) | 0 (0.0%) |
| 55 to 59 Years | 65 (100.0%) | 0 (0.0%) |
| 60 to 64 Years | 8 (100.0%) | 0 (0.0%) |
| 65 to 74 Years | 26 (47.3%) | 0 (0.0%) |
| 75 Years and over | 0 (0.0%) | 0 (0.0%) |
| Total | 240 (51.1%) | 0 (0.0%) |
Employment Status by Educational Attainment in Marion
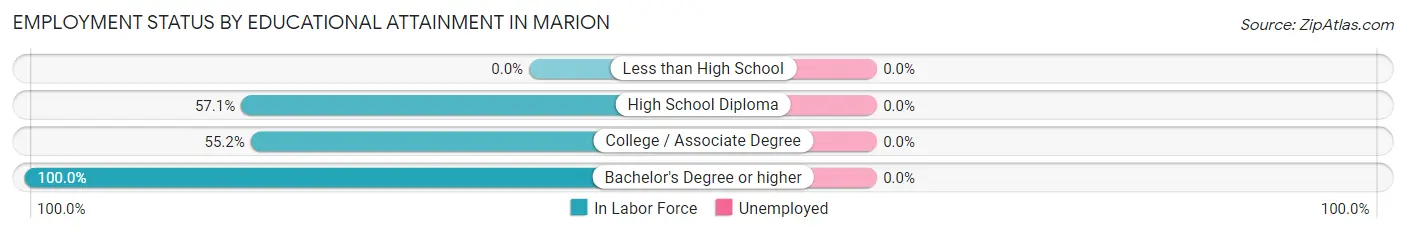
| Educational Attainment | In Labor Force | Unemployed |
| Less than High School | 0 (0.0%) | 0 (0.0%) |
| High School Diploma | 20 (57.1%) | 0 (0.0%) |
| College / Associate Degree | 32 (55.2%) | 0 (0.0%) |
| Bachelor's Degree or higher | 138 (100.0%) | 0 (0.0%) |
| Total | 190 (82.3%) | 0 (0.0%) |
Employment Occupations by Sex in Marion
Management, Business, Science and Arts Occupations
The most common Management, Business, Science and Arts occupations in Marion are Management (53 | 22.1%), Computers, Engineering & Science (21 | 8.7%), Architecture & Engineering (21 | 8.7%), Business & Financial (15 | 6.2%), and Health Diagnosing & Treating (10 | 4.2%).
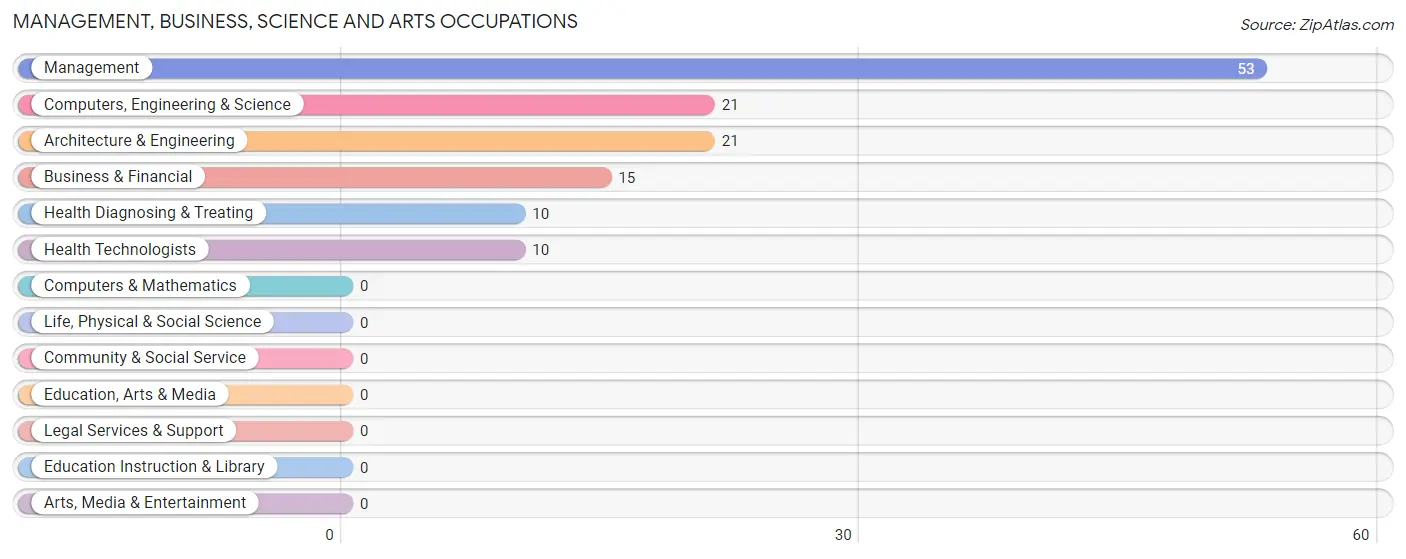
Management, Business, Science and Arts Occupations by Sex
Within the Management, Business, Science and Arts occupations in Marion, the most male-oriented occupations are Computers, Engineering & Science (100.0%), Architecture & Engineering (100.0%), and Management (39.6%), while the most female-oriented occupations are Business & Financial (100.0%), Health Diagnosing & Treating (100.0%), and Health Technologists (100.0%).
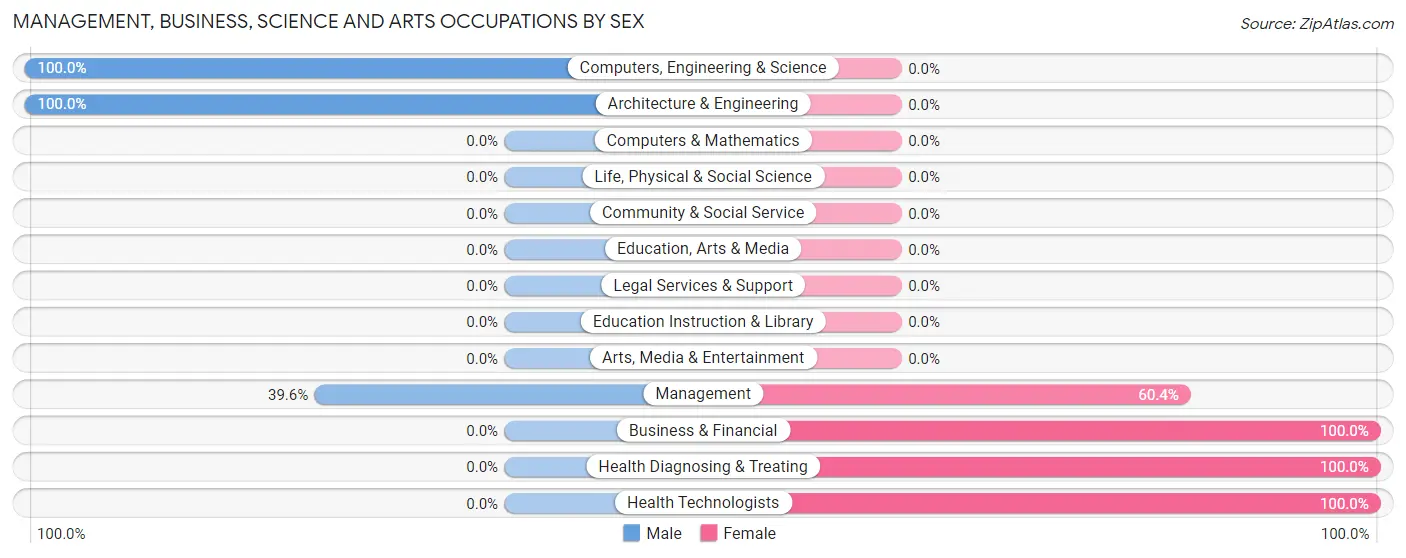
| Occupation | Male | Female |
| Management | 21 (39.6%) | 32 (60.4%) |
| Business & Financial | 0 (0.0%) | 15 (100.0%) |
| Computers, Engineering & Science | 21 (100.0%) | 0 (0.0%) |
| Computers & Mathematics | 0 (0.0%) | 0 (0.0%) |
| Architecture & Engineering | 21 (100.0%) | 0 (0.0%) |
| Life, Physical & Social Science | 0 (0.0%) | 0 (0.0%) |
| Community & Social Service | 0 (0.0%) | 0 (0.0%) |
| Education, Arts & Media | 0 (0.0%) | 0 (0.0%) |
| Legal Services & Support | 0 (0.0%) | 0 (0.0%) |
| Education Instruction & Library | 0 (0.0%) | 0 (0.0%) |
| Arts, Media & Entertainment | 0 (0.0%) | 0 (0.0%) |
| Health Diagnosing & Treating | 0 (0.0%) | 10 (100.0%) |
| Health Technologists | 0 (0.0%) | 10 (100.0%) |
| Total (Category) | 42 (42.4%) | 57 (57.6%) |
| Total (Overall) | 133 (55.4%) | 107 (44.6%) |
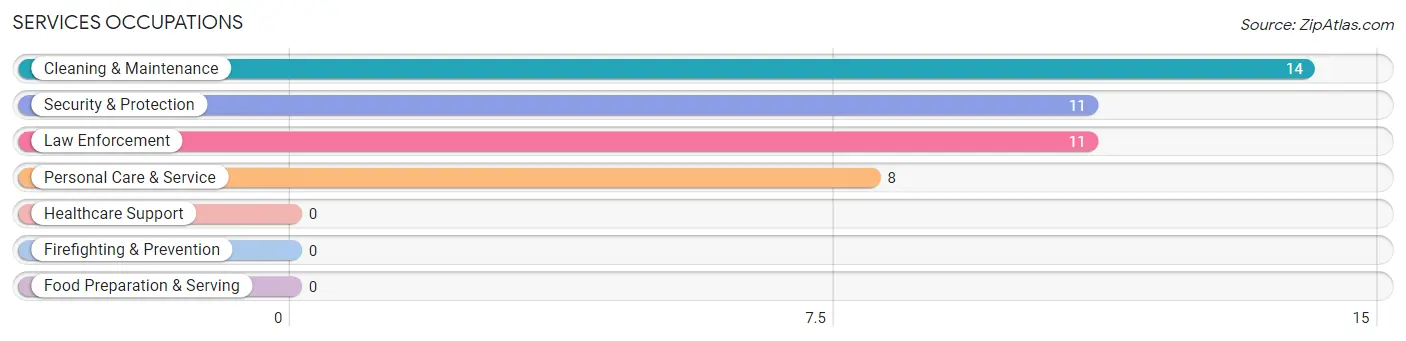
Services Occupations
The most common Services occupations in Marion are Cleaning & Maintenance (14 | 5.8%), Security & Protection (11 | 4.6%), Law Enforcement (11 | 4.6%), and Personal Care & Service (8 | 3.3%).
Services Occupations by Sex
Within the Services occupations in Marion, the most male-oriented occupations are Security & Protection (100.0%), and Law Enforcement (100.0%), while the most female-oriented occupations are Cleaning & Maintenance (100.0%), and Personal Care & Service (100.0%).
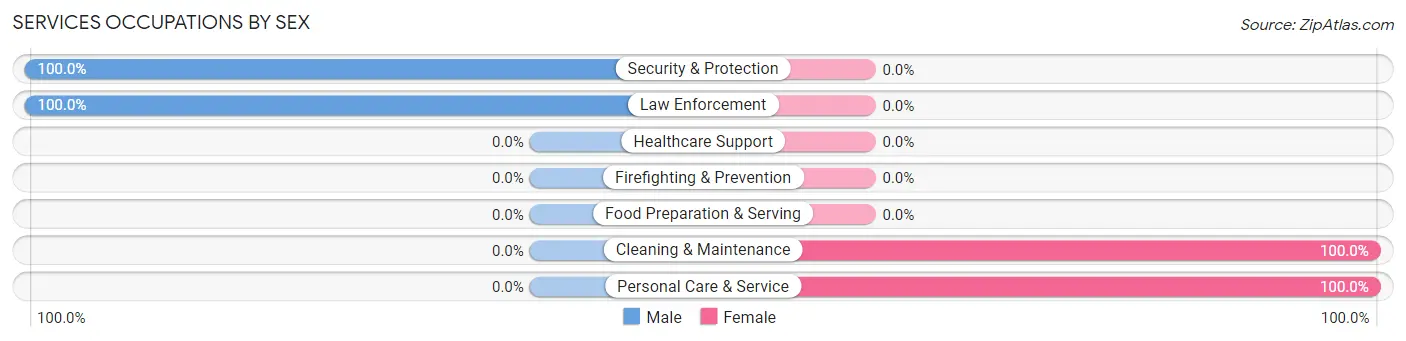
| Occupation | Male | Female |
| Healthcare Support | 0 (0.0%) | 0 (0.0%) |
| Security & Protection | 11 (100.0%) | 0 (0.0%) |
| Firefighting & Prevention | 0 (0.0%) | 0 (0.0%) |
| Law Enforcement | 11 (100.0%) | 0 (0.0%) |
| Food Preparation & Serving | 0 (0.0%) | 0 (0.0%) |
| Cleaning & Maintenance | 0 (0.0%) | 14 (100.0%) |
| Personal Care & Service | 0 (0.0%) | 8 (100.0%) |
| Total (Category) | 11 (33.3%) | 22 (66.7%) |
| Total (Overall) | 133 (55.4%) | 107 (44.6%) |
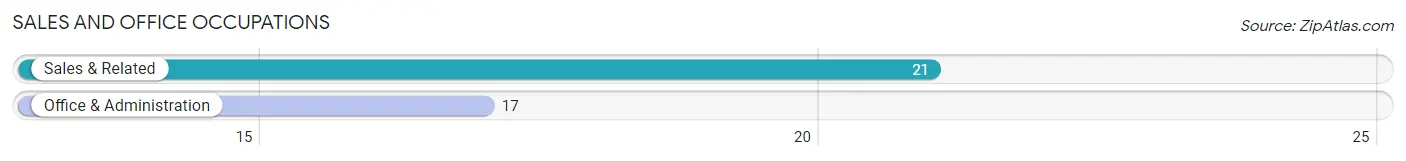
Sales and Office Occupations
The most common Sales and Office occupations in Marion are Sales & Related (21 | 8.7%), and Office & Administration (17 | 7.1%).
Sales and Office Occupations by Sex
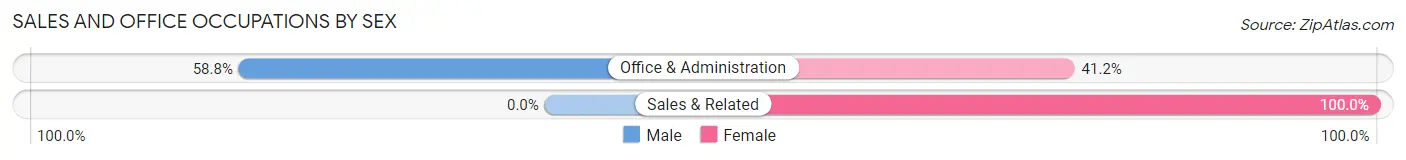
| Occupation | Male | Female |
| Sales & Related | 0 (0.0%) | 21 (100.0%) |
| Office & Administration | 10 (58.8%) | 7 (41.2%) |
| Total (Category) | 10 (26.3%) | 28 (73.7%) |
| Total (Overall) | 133 (55.4%) | 107 (44.6%) |
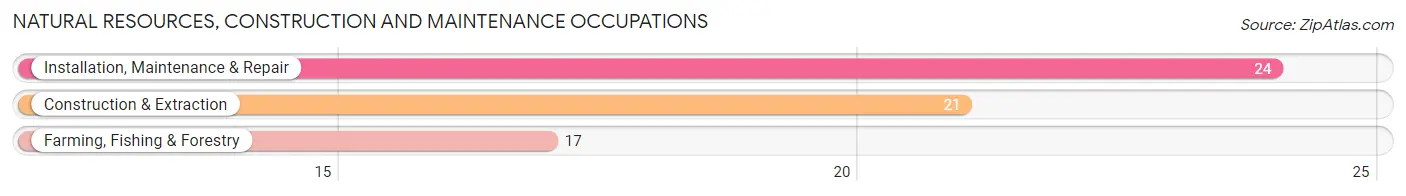
Natural Resources, Construction and Maintenance Occupations
The most common Natural Resources, Construction and Maintenance occupations in Marion are Installation, Maintenance & Repair (24 | 10.0%), Construction & Extraction (21 | 8.7%), and Farming, Fishing & Forestry (17 | 7.1%).
Natural Resources, Construction and Maintenance Occupations by Sex
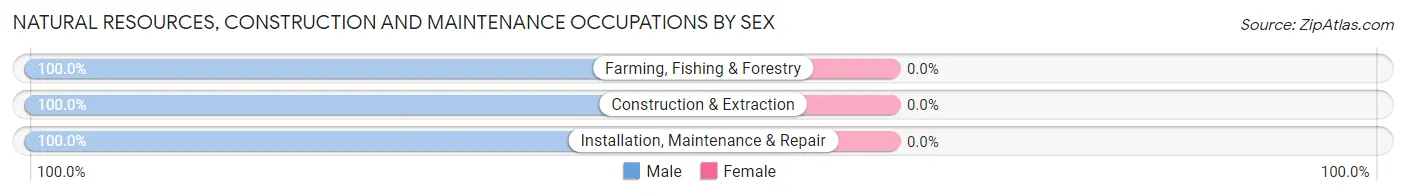
| Occupation | Male | Female |
| Farming, Fishing & Forestry | 17 (100.0%) | 0 (0.0%) |
| Construction & Extraction | 21 (100.0%) | 0 (0.0%) |
| Installation, Maintenance & Repair | 24 (100.0%) | 0 (0.0%) |
| Total (Category) | 62 (100.0%) | 0 (0.0%) |
| Total (Overall) | 133 (55.4%) | 107 (44.6%) |
Production, Transportation and Moving Occupations
The most common Production, Transportation and Moving occupations in Marion are , and Transportation (8 | 3.3%).
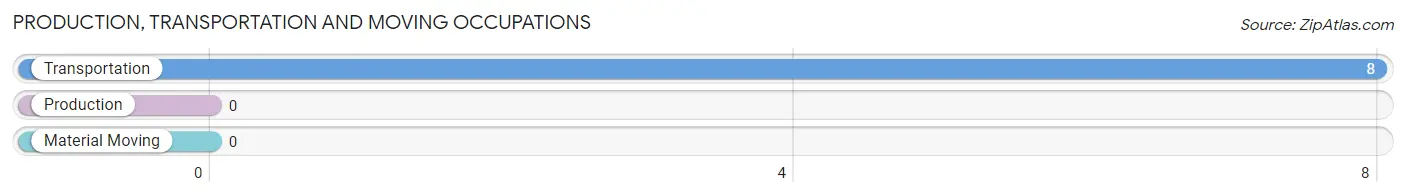
Production, Transportation and Moving Occupations by Sex
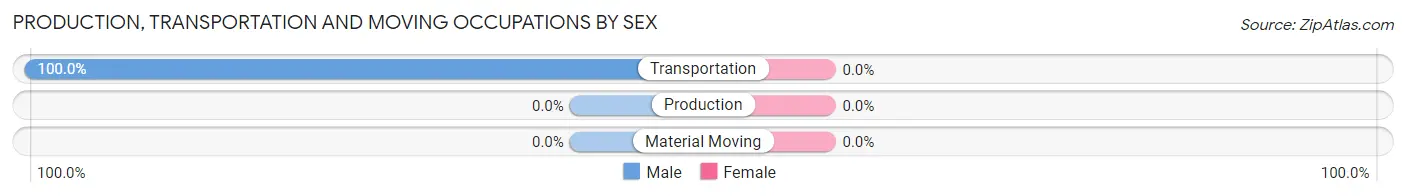
| Occupation | Male | Female |
| Production | 0 (0.0%) | 0 (0.0%) |
| Transportation | 8 (100.0%) | 0 (0.0%) |
| Material Moving | 0 (0.0%) | 0 (0.0%) |
| Total (Category) | 8 (100.0%) | 0 (0.0%) |
| Total (Overall) | 133 (55.4%) | 107 (44.6%) |
Employment Industries by Sex in Marion
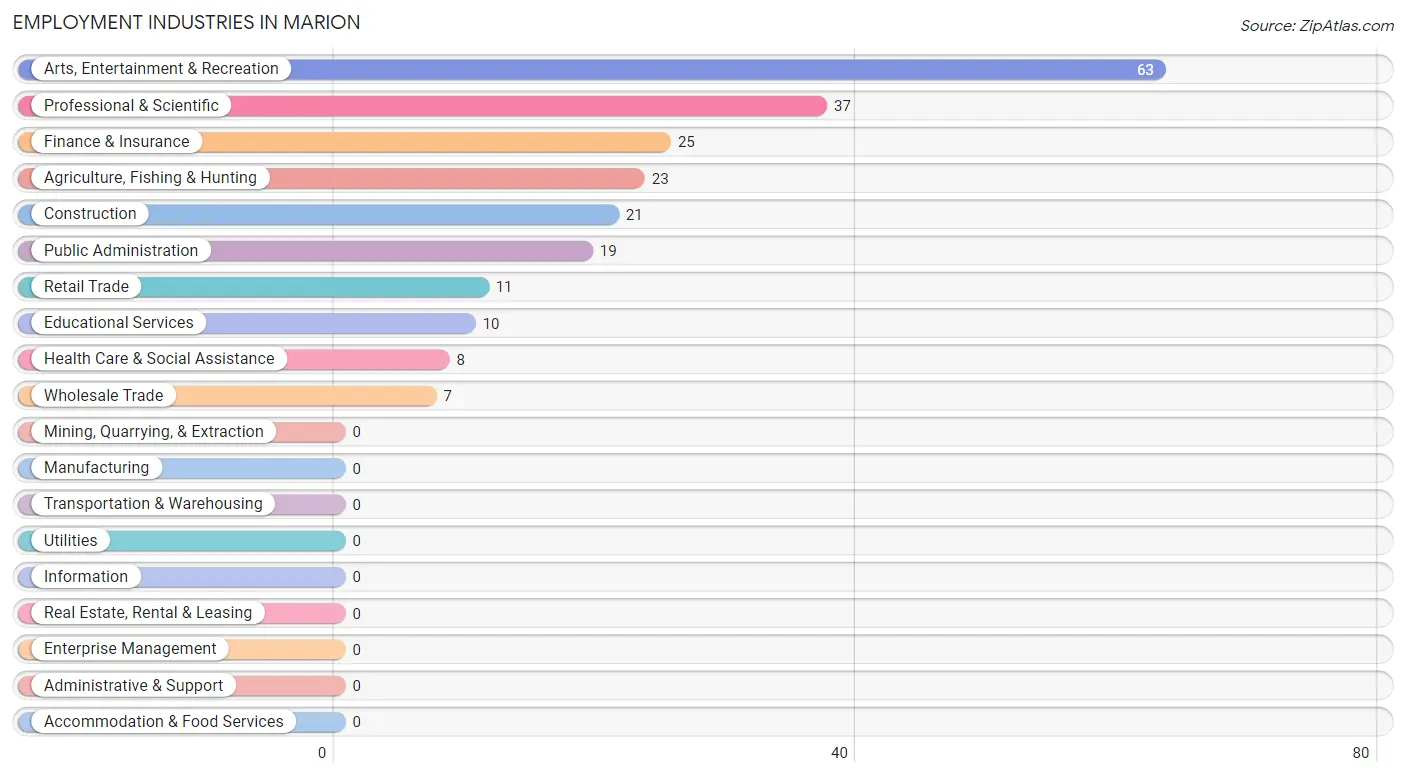
Employment Industries in Marion
The major employment industries in Marion include Arts, Entertainment & Recreation (63 | 26.3%), Professional & Scientific (37 | 15.4%), Finance & Insurance (25 | 10.4%), Agriculture, Fishing & Hunting (23 | 9.6%), and Construction (21 | 8.7%).
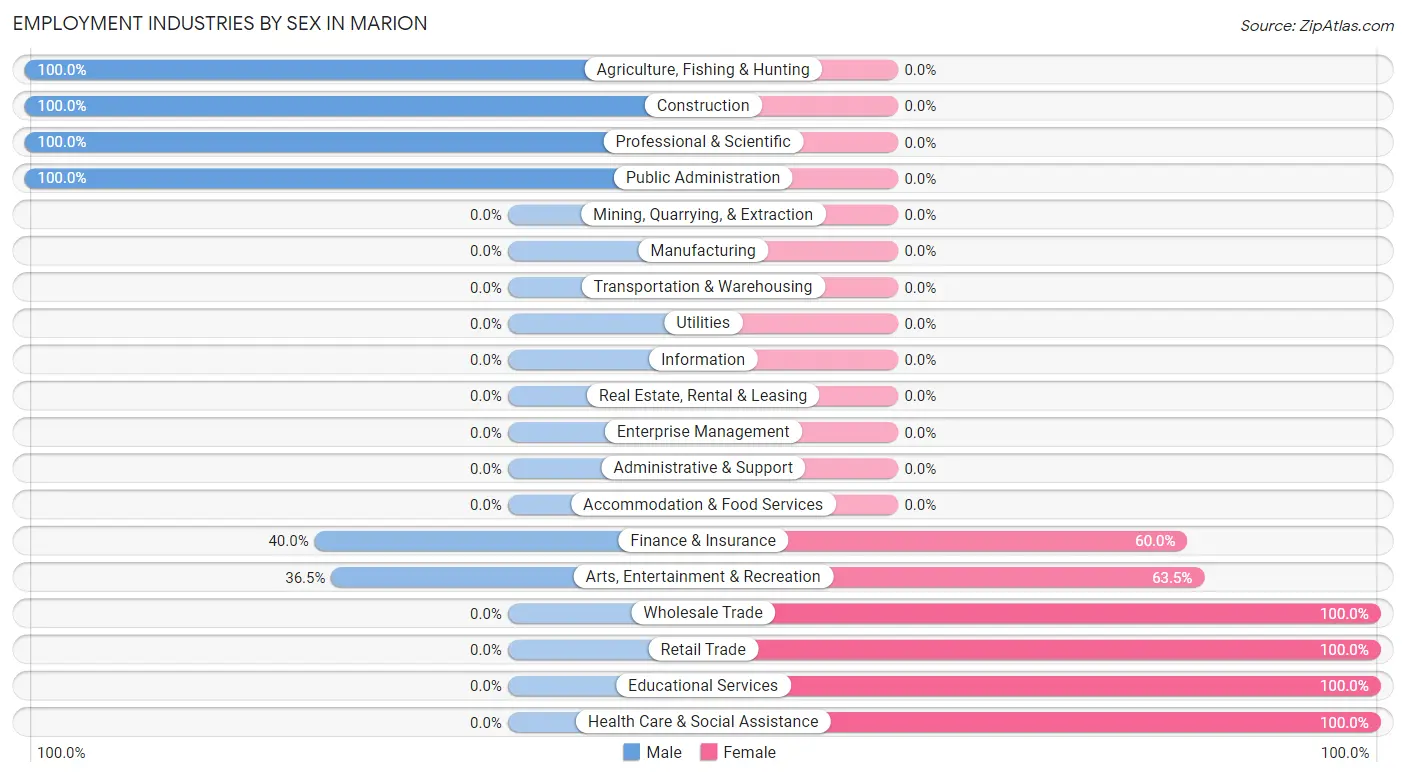
Employment Industries by Sex in Marion
The Marion industries that see more men than women are Agriculture, Fishing & Hunting (100.0%), Construction (100.0%), and Professional & Scientific (100.0%), whereas the industries that tend to have a higher number of women are Wholesale Trade (100.0%), Retail Trade (100.0%), and Educational Services (100.0%).
| Industry | Male | Female |
| Agriculture, Fishing & Hunting | 23 (100.0%) | 0 (0.0%) |
| Mining, Quarrying, & Extraction | 0 (0.0%) | 0 (0.0%) |
| Construction | 21 (100.0%) | 0 (0.0%) |
| Manufacturing | 0 (0.0%) | 0 (0.0%) |
| Wholesale Trade | 0 (0.0%) | 7 (100.0%) |
| Retail Trade | 0 (0.0%) | 11 (100.0%) |
| Transportation & Warehousing | 0 (0.0%) | 0 (0.0%) |
| Utilities | 0 (0.0%) | 0 (0.0%) |
| Information | 0 (0.0%) | 0 (0.0%) |
| Finance & Insurance | 10 (40.0%) | 15 (60.0%) |
| Real Estate, Rental & Leasing | 0 (0.0%) | 0 (0.0%) |
| Professional & Scientific | 37 (100.0%) | 0 (0.0%) |
| Enterprise Management | 0 (0.0%) | 0 (0.0%) |
| Administrative & Support | 0 (0.0%) | 0 (0.0%) |
| Educational Services | 0 (0.0%) | 10 (100.0%) |
| Health Care & Social Assistance | 0 (0.0%) | 8 (100.0%) |
| Arts, Entertainment & Recreation | 23 (36.5%) | 40 (63.5%) |
| Accommodation & Food Services | 0 (0.0%) | 0 (0.0%) |
| Public Administration | 19 (100.0%) | 0 (0.0%) |
| Total | 133 (55.4%) | 107 (44.6%) |
Education in Marion
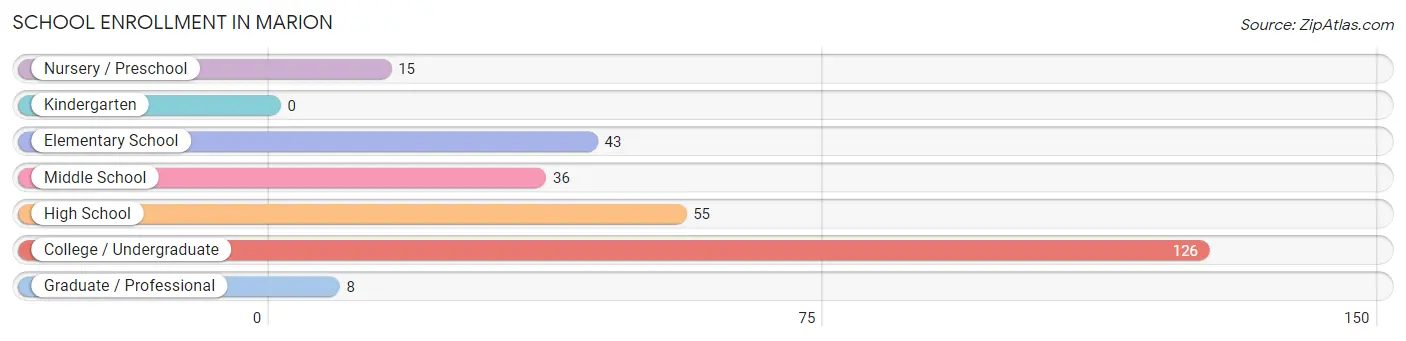
School Enrollment in Marion
The most common levels of schooling among the 283 students in Marion are college / undergraduate (126 | 44.5%), high school (55 | 19.4%), and elementary school (43 | 15.2%).
| School Level | # Students | % Students |
| Nursery / Preschool | 15 | 5.3% |
| Kindergarten | 0 | 0.0% |
| Elementary School | 43 | 15.2% |
| Middle School | 36 | 12.7% |
| High School | 55 | 19.4% |
| College / Undergraduate | 126 | 44.5% |
| Graduate / Professional | 8 | 2.8% |
| Total | 283 | 100.0% |
School Enrollment by Age by Funding Source in Marion
Out of a total of 283 students who are enrolled in schools in Marion, 135 (47.7%) attend a private institution, while the remaining 148 (52.3%) are enrolled in public schools. The age group of 20 to 24 year olds has the highest likelihood of being enrolled in private schools, with 113 (100.0% in the age bracket) enrolled. Conversely, the age group of 5 to 9 year old has the lowest likelihood of being enrolled in a private school, with 58 (100.0% in the age bracket) attending a public institution.
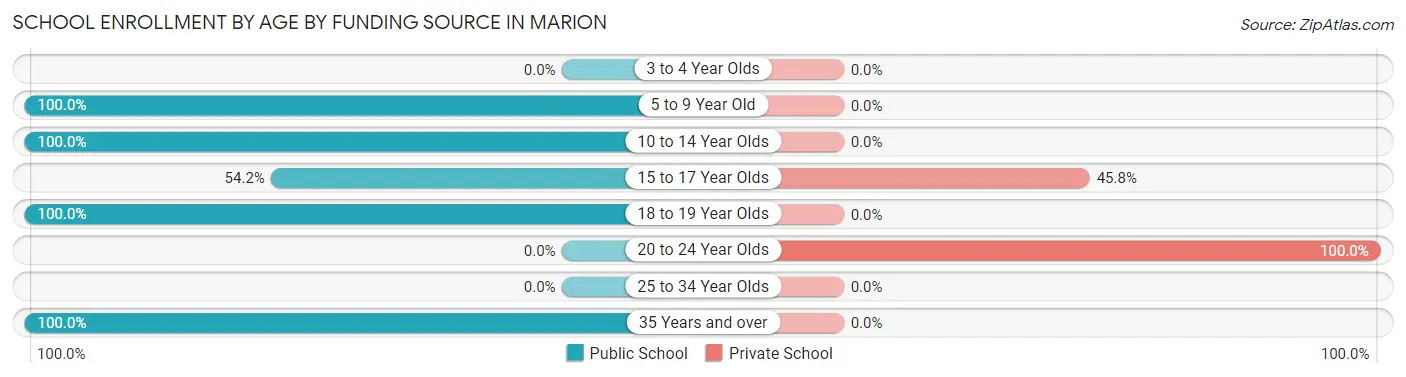
| Age Bracket | Public School | Private School |
| 3 to 4 Year Olds | 0 (0.0%) | 0 (0.0%) |
| 5 to 9 Year Old | 58 (100.0%) | 0 (0.0%) |
| 10 to 14 Year Olds | 43 (100.0%) | 0 (0.0%) |
| 15 to 17 Year Olds | 26 (54.2%) | 22 (45.8%) |
| 18 to 19 Year Olds | 13 (100.0%) | 0 (0.0%) |
| 20 to 24 Year Olds | 0 (0.0%) | 113 (100.0%) |
| 25 to 34 Year Olds | 0 (0.0%) | 0 (0.0%) |
| 35 Years and over | 8 (100.0%) | 0 (0.0%) |
| Total | 148 (52.3%) | 135 (47.7%) |
Educational Attainment by Field of Study in Marion
Business (57 | 31.0%), engineering (32 | 17.4%), education (20 | 10.9%), science & technology (19 | 10.3%), and social sciences (17 | 9.2%) are the most common fields of study among 184 individuals in Marion who have obtained a bachelor's degree or higher.
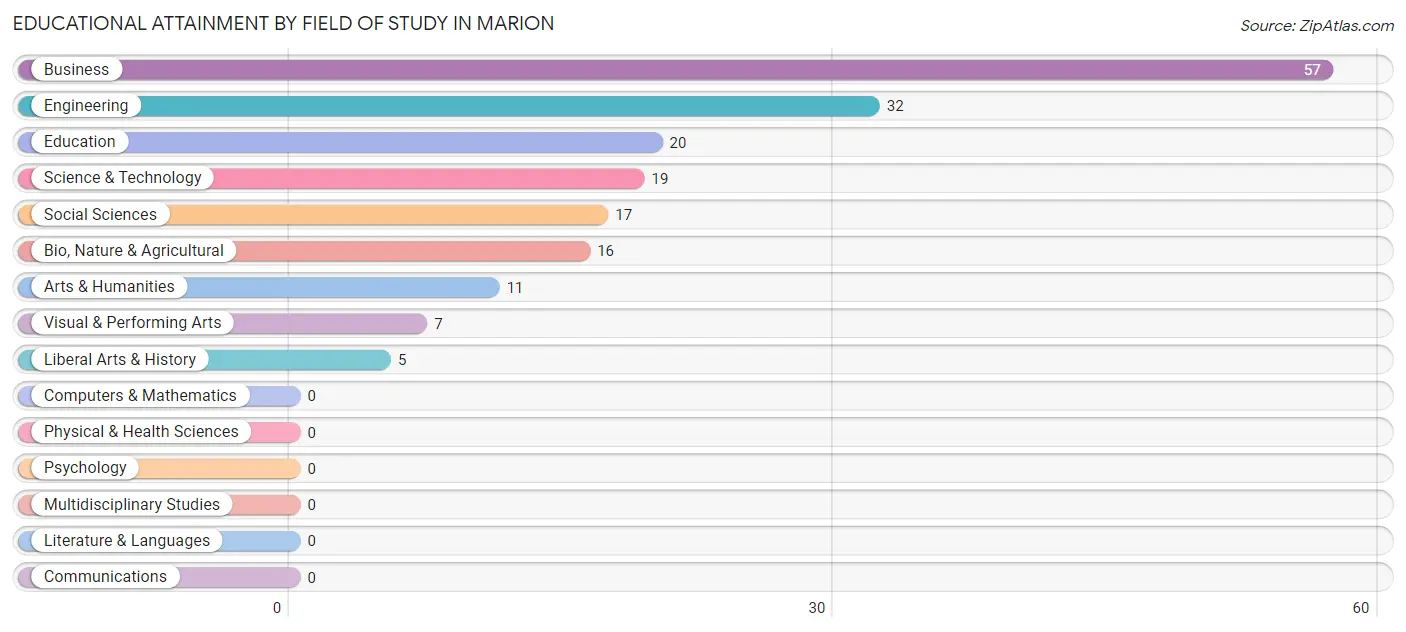
| Field of Study | # Graduates | % Graduates |
| Computers & Mathematics | 0 | 0.0% |
| Bio, Nature & Agricultural | 16 | 8.7% |
| Physical & Health Sciences | 0 | 0.0% |
| Psychology | 0 | 0.0% |
| Social Sciences | 17 | 9.2% |
| Engineering | 32 | 17.4% |
| Multidisciplinary Studies | 0 | 0.0% |
| Science & Technology | 19 | 10.3% |
| Business | 57 | 31.0% |
| Education | 20 | 10.9% |
| Literature & Languages | 0 | 0.0% |
| Liberal Arts & History | 5 | 2.7% |
| Visual & Performing Arts | 7 | 3.8% |
| Communications | 0 | 0.0% |
| Arts & Humanities | 11 | 6.0% |
| Total | 184 | 100.0% |
Transportation & Commute in Marion
Vehicle Availability by Sex in Marion
The most prevalent vehicle ownership categories in Marion are males with 2 vehicles (49, accounting for 36.8%) and females with 2 vehicles (41, making up 45.8%).
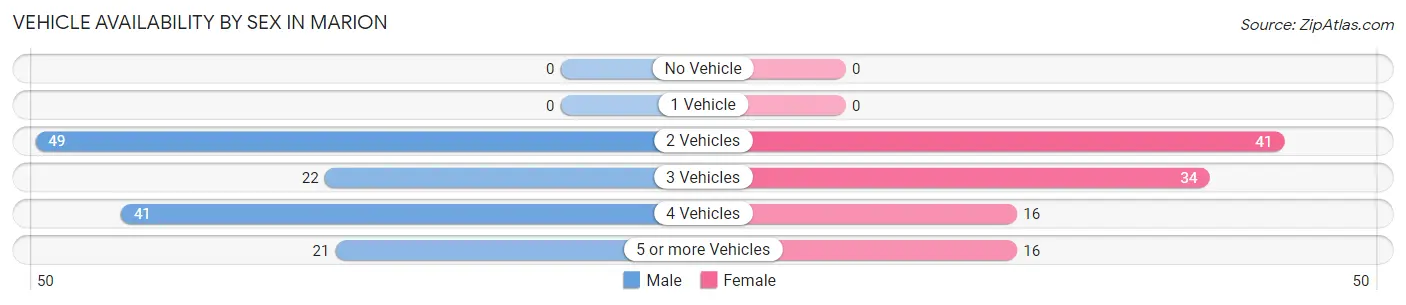
| Vehicles Available | Male | Female |
| No Vehicle | 0 (0.0%) | 0 (0.0%) |
| 1 Vehicle | 0 (0.0%) | 0 (0.0%) |
| 2 Vehicles | 49 (36.8%) | 41 (38.3%) |
| 3 Vehicles | 22 (16.5%) | 34 (31.8%) |
| 4 Vehicles | 41 (30.8%) | 16 (14.9%) |
| 5 or more Vehicles | 21 (15.8%) | 16 (14.9%) |
| Total | 133 (100.0%) | 107 (100.0%) |
Commute Time in Marion
The most frequently occuring commute durations in Marion are 60 to 89 minutes (53 commuters, 25.0%), 30 to 34 minutes (49 commuters, 23.1%), and 20 to 24 minutes (29 commuters, 13.7%).
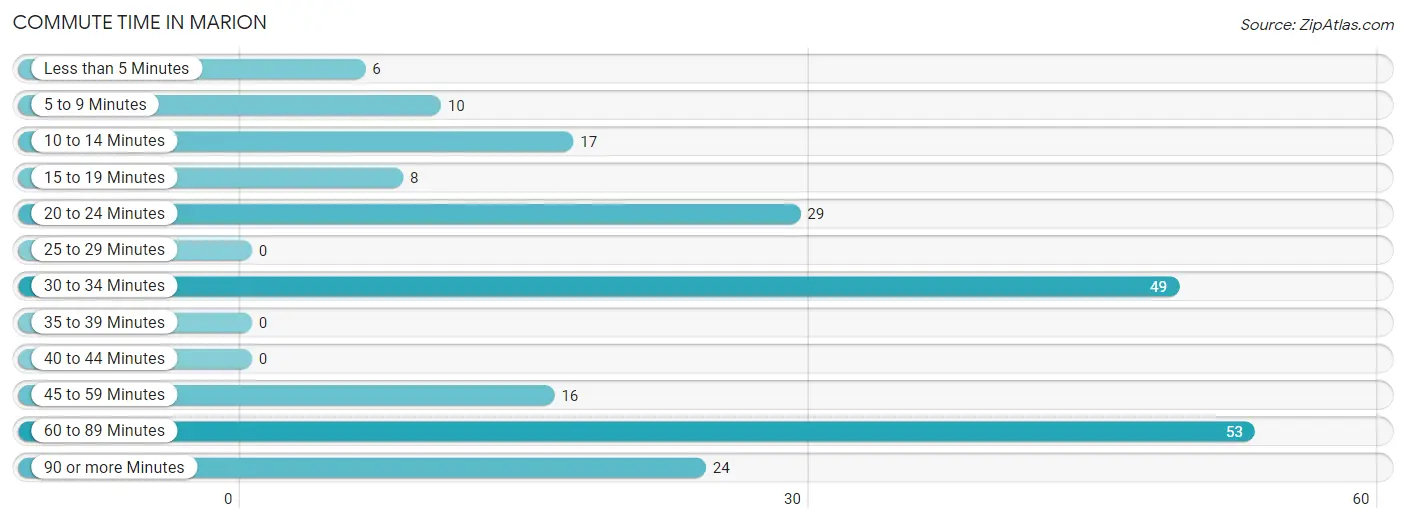
| Commute Time | # Commuters | % Commuters |
| Less than 5 Minutes | 6 | 2.8% |
| 5 to 9 Minutes | 10 | 4.7% |
| 10 to 14 Minutes | 17 | 8.0% |
| 15 to 19 Minutes | 8 | 3.8% |
| 20 to 24 Minutes | 29 | 13.7% |
| 25 to 29 Minutes | 0 | 0.0% |
| 30 to 34 Minutes | 49 | 23.1% |
| 35 to 39 Minutes | 0 | 0.0% |
| 40 to 44 Minutes | 0 | 0.0% |
| 45 to 59 Minutes | 16 | 7.5% |
| 60 to 89 Minutes | 53 | 25.0% |
| 90 or more Minutes | 24 | 11.3% |
Commute Time by Sex in Marion
The most common commute times in Marion are 60 to 89 minutes (37 commuters, 32.2%) for males and 30 to 34 minutes (18 commuters, 18.6%) for females.
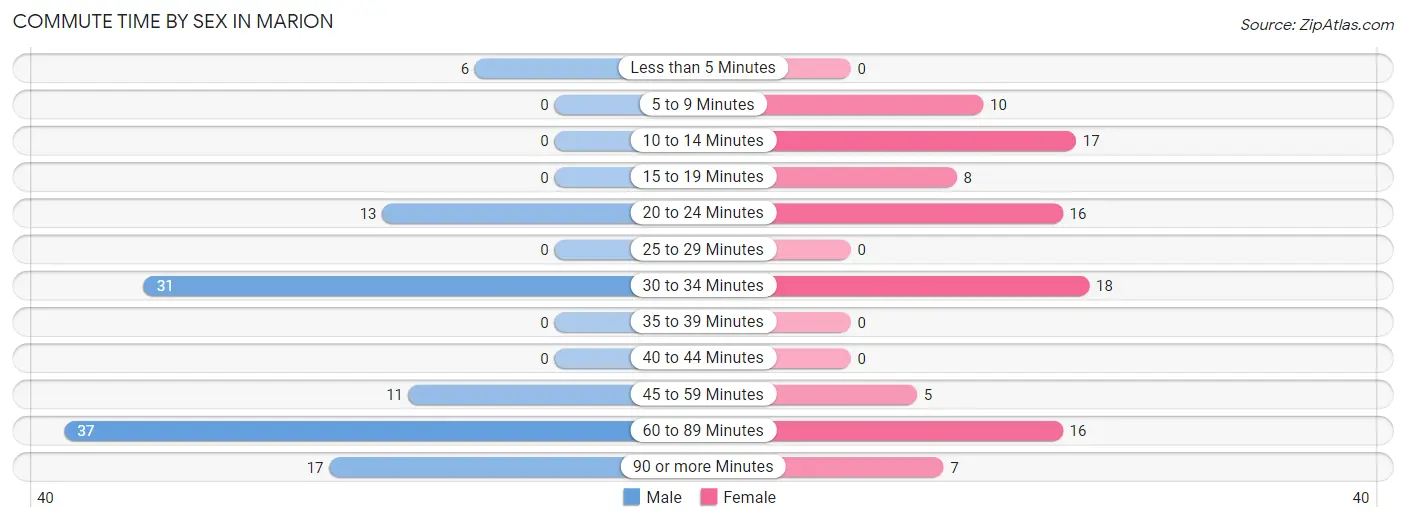
| Commute Time | Male | Female |
| Less than 5 Minutes | 6 (5.2%) | 0 (0.0%) |
| 5 to 9 Minutes | 0 (0.0%) | 10 (10.3%) |
| 10 to 14 Minutes | 0 (0.0%) | 17 (17.5%) |
| 15 to 19 Minutes | 0 (0.0%) | 8 (8.3%) |
| 20 to 24 Minutes | 13 (11.3%) | 16 (16.5%) |
| 25 to 29 Minutes | 0 (0.0%) | 0 (0.0%) |
| 30 to 34 Minutes | 31 (27.0%) | 18 (18.6%) |
| 35 to 39 Minutes | 0 (0.0%) | 0 (0.0%) |
| 40 to 44 Minutes | 0 (0.0%) | 0 (0.0%) |
| 45 to 59 Minutes | 11 (9.6%) | 5 (5.1%) |
| 60 to 89 Minutes | 37 (32.2%) | 16 (16.5%) |
| 90 or more Minutes | 17 (14.8%) | 7 (7.2%) |
Time of Departure to Work by Sex in Marion
The most frequent times of departure to work in Marion are 6:00 AM to 6:29 AM (35, 30.4%) for males and 8:00 AM to 8:29 AM (29, 29.9%) for females.
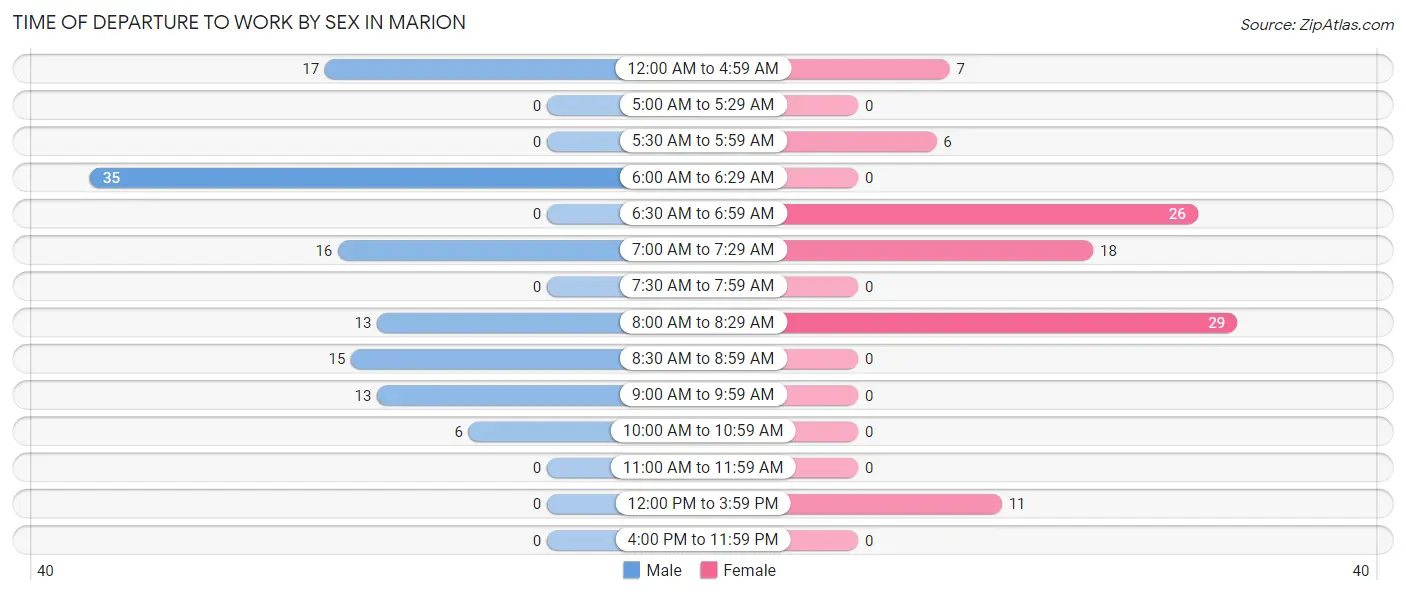
| Time of Departure | Male | Female |
| 12:00 AM to 4:59 AM | 17 (14.8%) | 7 (7.2%) |
| 5:00 AM to 5:29 AM | 0 (0.0%) | 0 (0.0%) |
| 5:30 AM to 5:59 AM | 0 (0.0%) | 6 (6.2%) |
| 6:00 AM to 6:29 AM | 35 (30.4%) | 0 (0.0%) |
| 6:30 AM to 6:59 AM | 0 (0.0%) | 26 (26.8%) |
| 7:00 AM to 7:29 AM | 16 (13.9%) | 18 (18.6%) |
| 7:30 AM to 7:59 AM | 0 (0.0%) | 0 (0.0%) |
| 8:00 AM to 8:29 AM | 13 (11.3%) | 29 (29.9%) |
| 8:30 AM to 8:59 AM | 15 (13.0%) | 0 (0.0%) |
| 9:00 AM to 9:59 AM | 13 (11.3%) | 0 (0.0%) |
| 10:00 AM to 10:59 AM | 6 (5.2%) | 0 (0.0%) |
| 11:00 AM to 11:59 AM | 0 (0.0%) | 0 (0.0%) |
| 12:00 PM to 3:59 PM | 0 (0.0%) | 11 (11.3%) |
| 4:00 PM to 11:59 PM | 0 (0.0%) | 0 (0.0%) |
| Total | 115 (100.0%) | 97 (100.0%) |
Housing Occupancy in Marion
Occupancy by Ownership in Marion
Of the total 169 dwellings in Marion, owner-occupied units account for 160 (94.7%), while renter-occupied units make up 9 (5.3%).
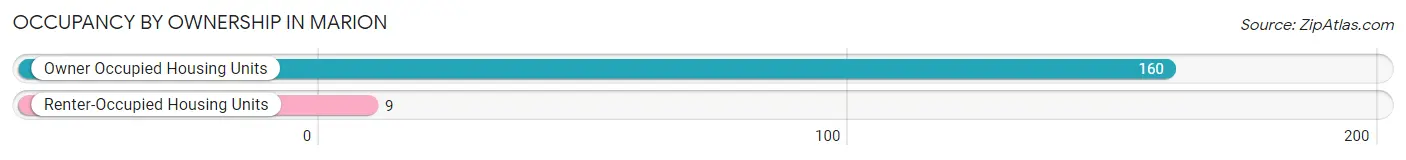
| Occupancy | # Housing Units | % Housing Units |
| Owner Occupied Housing Units | 160 | 94.7% |
| Renter-Occupied Housing Units | 9 | 5.3% |
| Total Occupied Housing Units | 169 | 100.0% |
Occupancy by Household Size in Marion
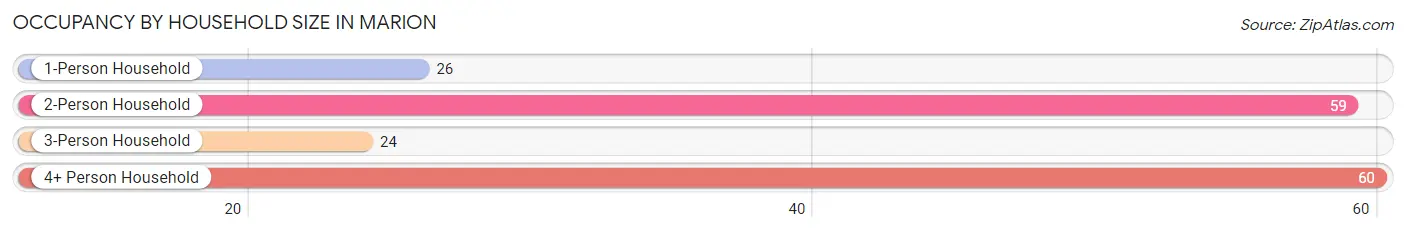
| Household Size | # Housing Units | % Housing Units |
| 1-Person Household | 26 | 15.4% |
| 2-Person Household | 59 | 34.9% |
| 3-Person Household | 24 | 14.2% |
| 4+ Person Household | 60 | 35.5% |
| Total Housing Units | 169 | 100.0% |
Occupancy by Ownership by Household Size in Marion
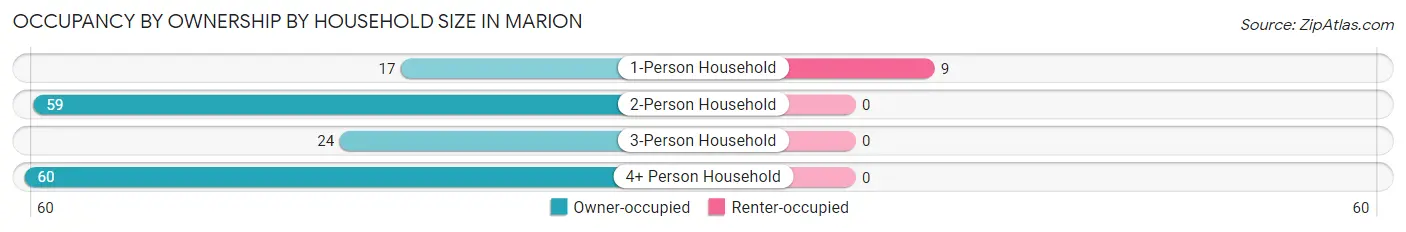
| Household Size | Owner-occupied | Renter-occupied |
| 1-Person Household | 17 (65.4%) | 9 (34.6%) |
| 2-Person Household | 59 (100.0%) | 0 (0.0%) |
| 3-Person Household | 24 (100.0%) | 0 (0.0%) |
| 4+ Person Household | 60 (100.0%) | 0 (0.0%) |
| Total Housing Units | 160 (94.7%) | 9 (5.3%) |
Occupancy by Educational Attainment in Marion
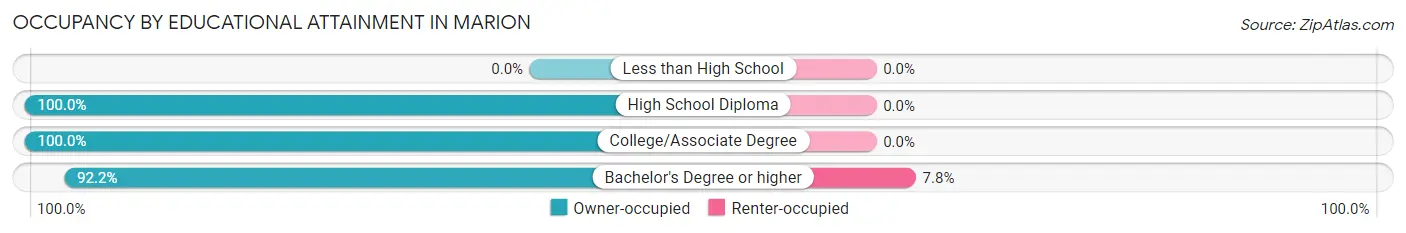
| Household Size | Owner-occupied | Renter-occupied |
| Less than High School | 0 (0.0%) | 0 (0.0%) |
| High School Diploma | 22 (100.0%) | 0 (0.0%) |
| College/Associate Degree | 32 (100.0%) | 0 (0.0%) |
| Bachelor's Degree or higher | 106 (92.2%) | 9 (7.8%) |
Occupancy by Age of Householder in Marion
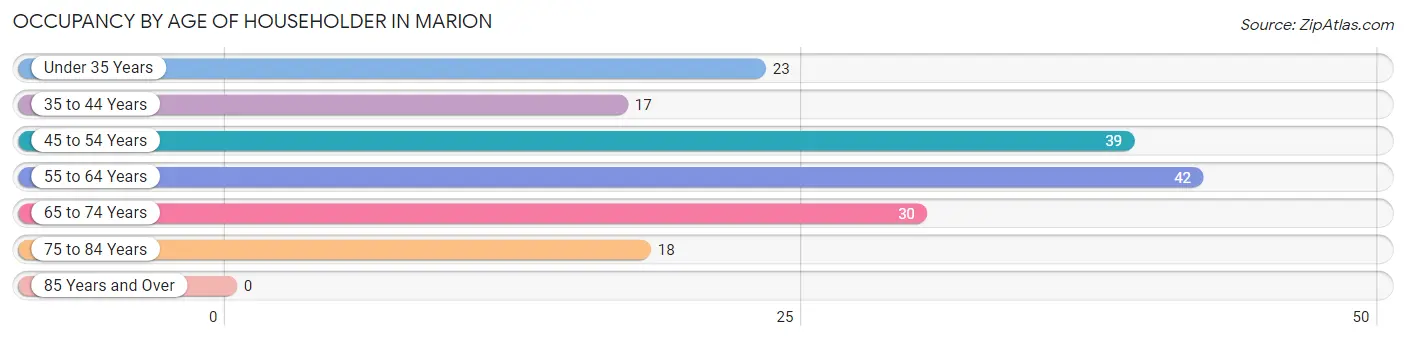
| Age Bracket | # Households | % Households |
| Under 35 Years | 23 | 13.6% |
| 35 to 44 Years | 17 | 10.1% |
| 45 to 54 Years | 39 | 23.1% |
| 55 to 64 Years | 42 | 24.8% |
| 65 to 74 Years | 30 | 17.7% |
| 75 to 84 Years | 18 | 10.6% |
| 85 Years and Over | 0 | 0.0% |
| Total | 169 | 100.0% |
Housing Finances in Marion
Median Income by Occupancy in Marion
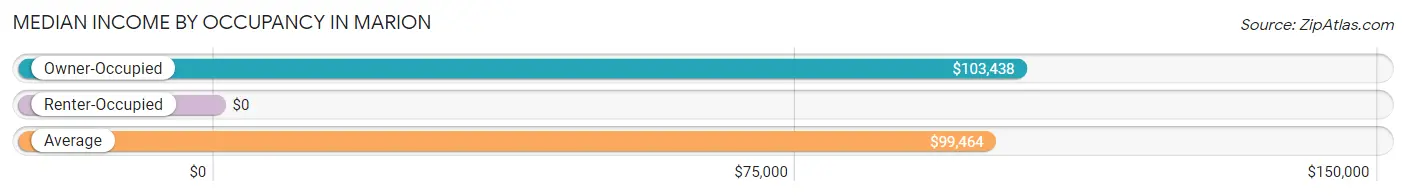
| Occupancy Type | # Households | Median Income |
| Owner-Occupied | 160 (94.7%) | $103,438 |
| Renter-Occupied | 9 (5.3%) | $0 |
| Average | 169 (100.0%) | $99,464 |
Occupancy by Householder Income Bracket in Marion
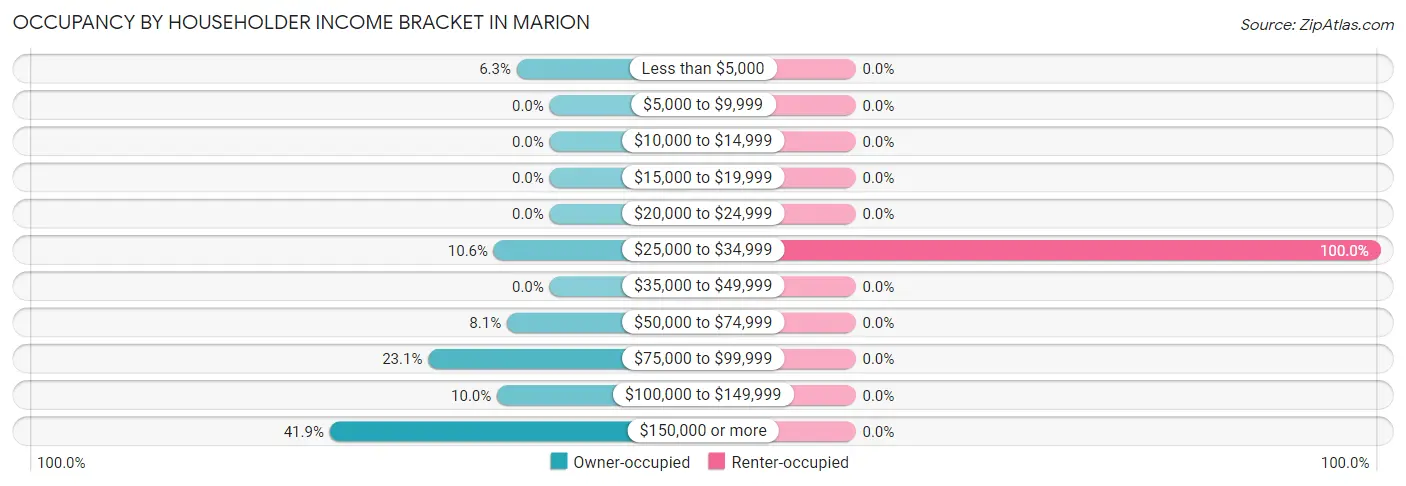
| Income Bracket | Owner-occupied | Renter-occupied |
| Less than $5,000 | 10 (6.2%) | 0 (0.0%) |
| $5,000 to $9,999 | 0 (0.0%) | 0 (0.0%) |
| $10,000 to $14,999 | 0 (0.0%) | 0 (0.0%) |
| $15,000 to $19,999 | 0 (0.0%) | 0 (0.0%) |
| $20,000 to $24,999 | 0 (0.0%) | 0 (0.0%) |
| $25,000 to $34,999 | 17 (10.6%) | 9 (100.0%) |
| $35,000 to $49,999 | 0 (0.0%) | 0 (0.0%) |
| $50,000 to $74,999 | 13 (8.1%) | 0 (0.0%) |
| $75,000 to $99,999 | 37 (23.1%) | 0 (0.0%) |
| $100,000 to $149,999 | 16 (10.0%) | 0 (0.0%) |
| $150,000 or more | 67 (41.9%) | 0 (0.0%) |
| Total | 160 (100.0%) | 9 (100.0%) |
Monthly Housing Cost Tiers in Marion
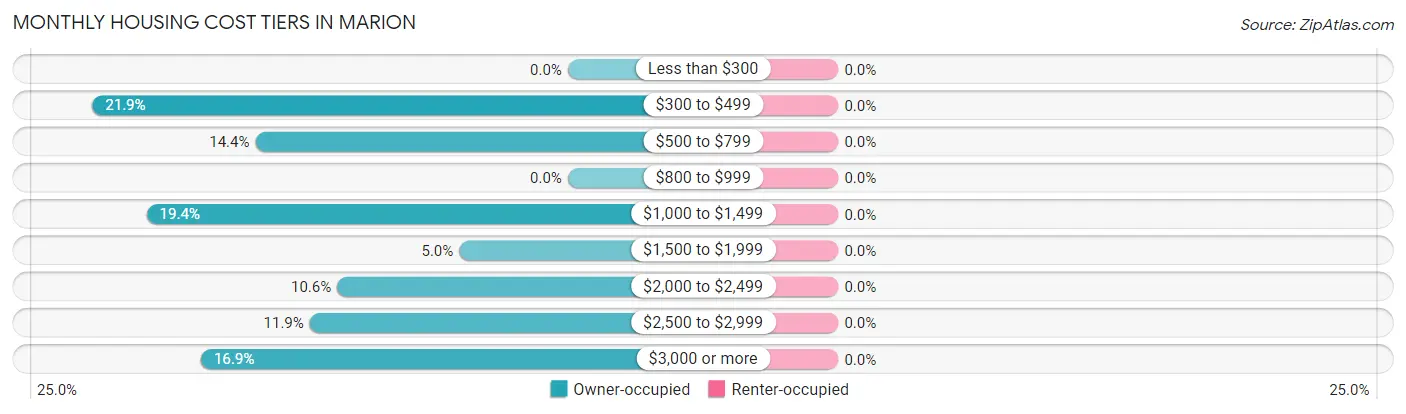
| Monthly Cost | Owner-occupied | Renter-occupied |
| Less than $300 | 0 (0.0%) | 0 (0.0%) |
| $300 to $499 | 35 (21.9%) | 0 (0.0%) |
| $500 to $799 | 23 (14.4%) | 0 (0.0%) |
| $800 to $999 | 0 (0.0%) | 0 (0.0%) |
| $1,000 to $1,499 | 31 (19.4%) | 0 (0.0%) |
| $1,500 to $1,999 | 8 (5.0%) | 0 (0.0%) |
| $2,000 to $2,499 | 17 (10.6%) | 0 (0.0%) |
| $2,500 to $2,999 | 19 (11.9%) | 0 (0.0%) |
| $3,000 or more | 27 (16.9%) | 0 (0.0%) |
| Total | 160 (100.0%) | 9 (100.0%) |
Physical Housing Characteristics in Marion
Housing Structures in Marion
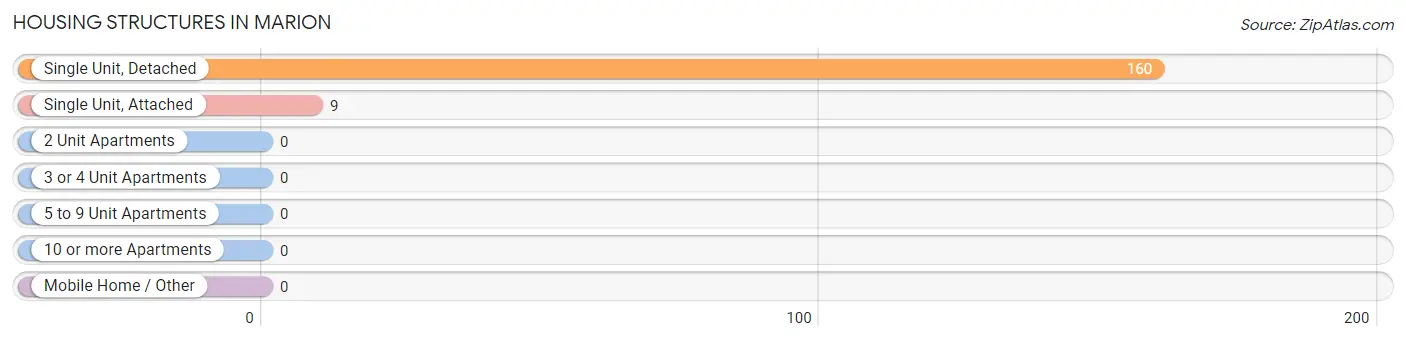
| Structure Type | # Housing Units | % Housing Units |
| Single Unit, Detached | 160 | 94.7% |
| Single Unit, Attached | 9 | 5.3% |
| 2 Unit Apartments | 0 | 0.0% |
| 3 or 4 Unit Apartments | 0 | 0.0% |
| 5 to 9 Unit Apartments | 0 | 0.0% |
| 10 or more Apartments | 0 | 0.0% |
| Mobile Home / Other | 0 | 0.0% |
| Total | 169 | 100.0% |
Housing Structures by Occupancy in Marion
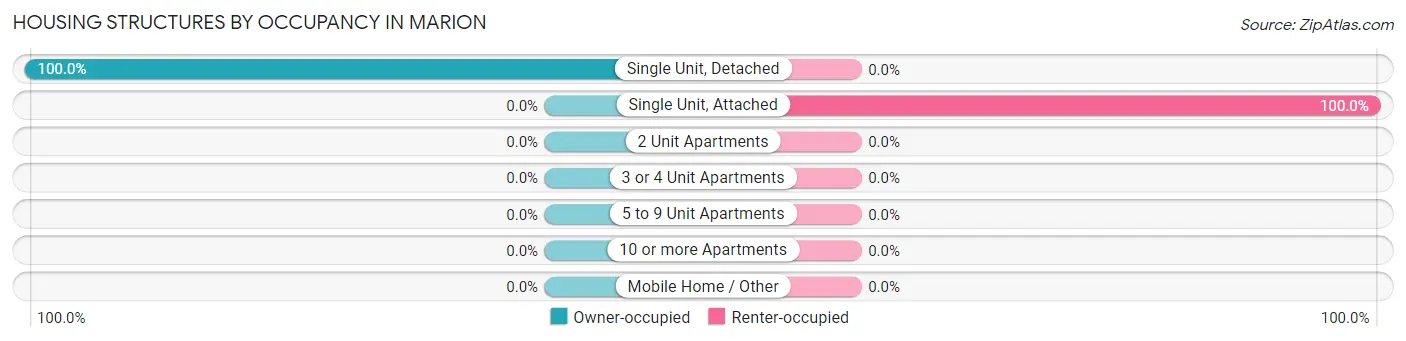
| Structure Type | Owner-occupied | Renter-occupied |
| Single Unit, Detached | 160 (100.0%) | 0 (0.0%) |
| Single Unit, Attached | 0 (0.0%) | 9 (100.0%) |
| 2 Unit Apartments | 0 (0.0%) | 0 (0.0%) |
| 3 or 4 Unit Apartments | 0 (0.0%) | 0 (0.0%) |
| 5 to 9 Unit Apartments | 0 (0.0%) | 0 (0.0%) |
| 10 or more Apartments | 0 (0.0%) | 0 (0.0%) |
| Mobile Home / Other | 0 (0.0%) | 0 (0.0%) |
| Total | 160 (94.7%) | 9 (5.3%) |
Housing Structures by Number of Rooms in Marion
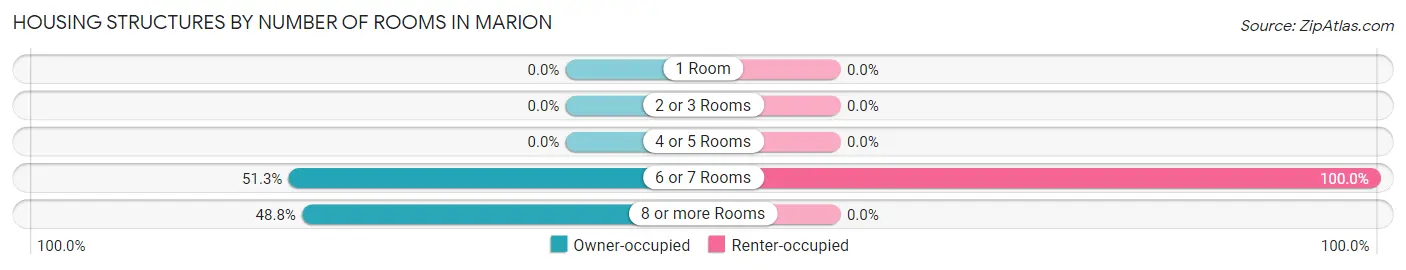
| Number of Rooms | Owner-occupied | Renter-occupied |
| 1 Room | 0 (0.0%) | 0 (0.0%) |
| 2 or 3 Rooms | 0 (0.0%) | 0 (0.0%) |
| 4 or 5 Rooms | 0 (0.0%) | 0 (0.0%) |
| 6 or 7 Rooms | 82 (51.2%) | 9 (100.0%) |
| 8 or more Rooms | 78 (48.7%) | 0 (0.0%) |
| Total | 160 (100.0%) | 9 (100.0%) |
Housing Structure by Heating Type in Marion
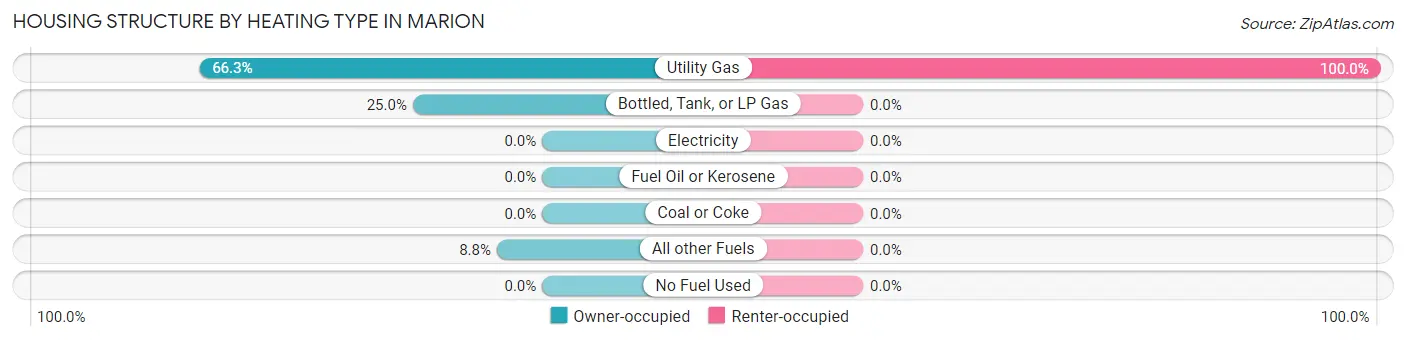
| Heating Type | Owner-occupied | Renter-occupied |
| Utility Gas | 106 (66.2%) | 9 (100.0%) |
| Bottled, Tank, or LP Gas | 40 (25.0%) | 0 (0.0%) |
| Electricity | 0 (0.0%) | 0 (0.0%) |
| Fuel Oil or Kerosene | 0 (0.0%) | 0 (0.0%) |
| Coal or Coke | 0 (0.0%) | 0 (0.0%) |
| All other Fuels | 14 (8.7%) | 0 (0.0%) |
| No Fuel Used | 0 (0.0%) | 0 (0.0%) |
| Total | 160 (100.0%) | 9 (100.0%) |
Household Vehicle Usage in Marion
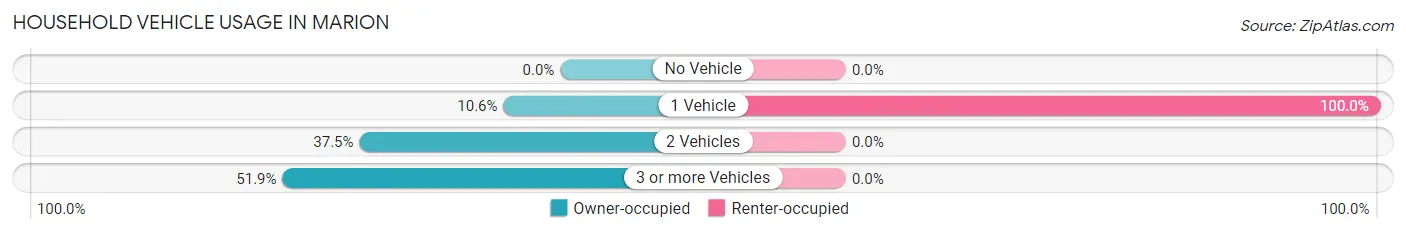
| Vehicles per Household | Owner-occupied | Renter-occupied |
| No Vehicle | 0 (0.0%) | 0 (0.0%) |
| 1 Vehicle | 17 (10.6%) | 9 (100.0%) |
| 2 Vehicles | 60 (37.5%) | 0 (0.0%) |
| 3 or more Vehicles | 83 (51.9%) | 0 (0.0%) |
| Total | 160 (100.0%) | 9 (100.0%) |
Real Estate & Mortgages in Marion
Real Estate and Mortgage Overview in Marion
| Characteristic | Without Mortgage | With Mortgage |
| Housing Units | 50 | 110 |
| Median Property Value | $575,000 | $640,200 |
| Median Household Income | - | - |
| Monthly Housing Costs | $460 | $27 |
| Real Estate Taxes | $1,778 | $0 |
Property Value by Mortgage Status in Marion
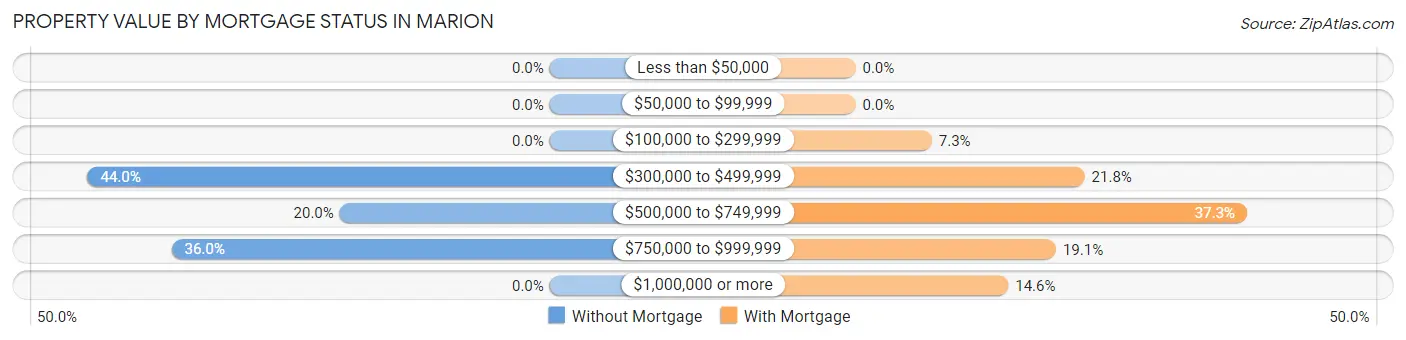
| Property Value | Without Mortgage | With Mortgage |
| Less than $50,000 | 0 (0.0%) | 0 (0.0%) |
| $50,000 to $99,999 | 0 (0.0%) | 0 (0.0%) |
| $100,000 to $299,999 | 0 (0.0%) | 8 (7.3%) |
| $300,000 to $499,999 | 22 (44.0%) | 24 (21.8%) |
| $500,000 to $749,999 | 10 (20.0%) | 41 (37.3%) |
| $750,000 to $999,999 | 18 (36.0%) | 21 (19.1%) |
| $1,000,000 or more | 0 (0.0%) | 16 (14.5%) |
| Total | 50 (100.0%) | 110 (100.0%) |
Household Income by Mortgage Status in Marion
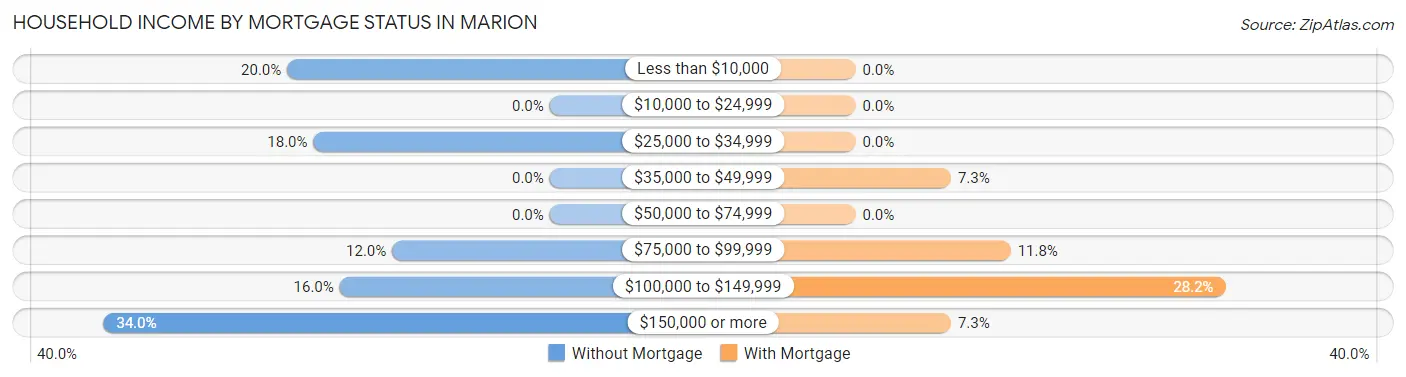
| Household Income | Without Mortgage | With Mortgage |
| Less than $10,000 | 10 (20.0%) | 0 (0.0%) |
| $10,000 to $24,999 | 0 (0.0%) | 0 (0.0%) |
| $25,000 to $34,999 | 9 (18.0%) | 0 (0.0%) |
| $35,000 to $49,999 | 0 (0.0%) | 8 (7.3%) |
| $50,000 to $74,999 | 0 (0.0%) | 0 (0.0%) |
| $75,000 to $99,999 | 6 (12.0%) | 13 (11.8%) |
| $100,000 to $149,999 | 8 (16.0%) | 31 (28.2%) |
| $150,000 or more | 17 (34.0%) | 8 (7.3%) |
| Total | 50 (100.0%) | 110 (100.0%) |
Property Value to Household Income Ratio in Marion
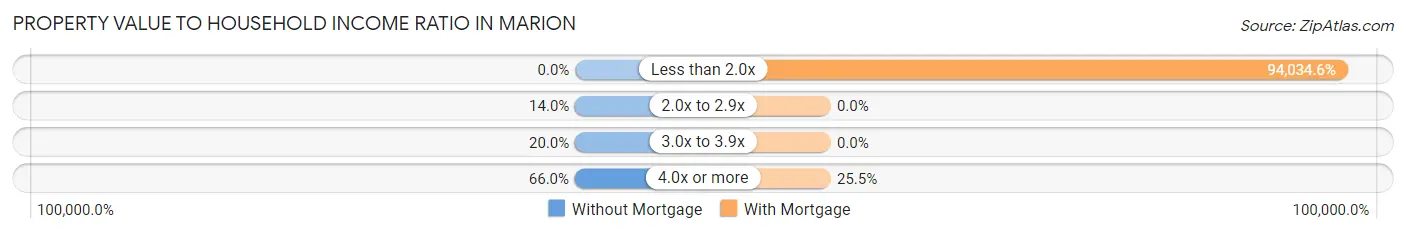
| Value-to-Income Ratio | Without Mortgage | With Mortgage |
| Less than 2.0x | 0 (0.0%) | 103,438 (94,034.6%) |
| 2.0x to 2.9x | 7 (14.0%) | 0 (0.0%) |
| 3.0x to 3.9x | 10 (20.0%) | 0 (0.0%) |
| 4.0x or more | 33 (66.0%) | 28 (25.5%) |
| Total | 50 (100.0%) | 110 (100.0%) |
Real Estate Taxes by Mortgage Status in Marion
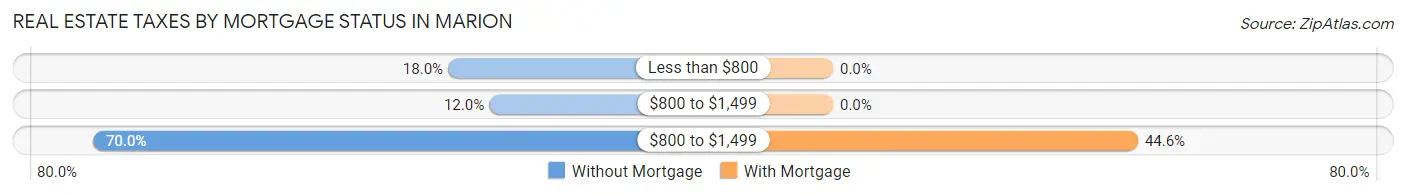
| Property Taxes | Without Mortgage | With Mortgage |
| Less than $800 | 9 (18.0%) | 0 (0.0%) |
| $800 to $1,499 | 6 (12.0%) | 0 (0.0%) |
| $800 to $1,499 | 35 (70.0%) | 49 (44.6%) |
| Total | 50 (100.0%) | 110 (100.0%) |
Health & Disability in Marion
Health Insurance Coverage by Age in Marion
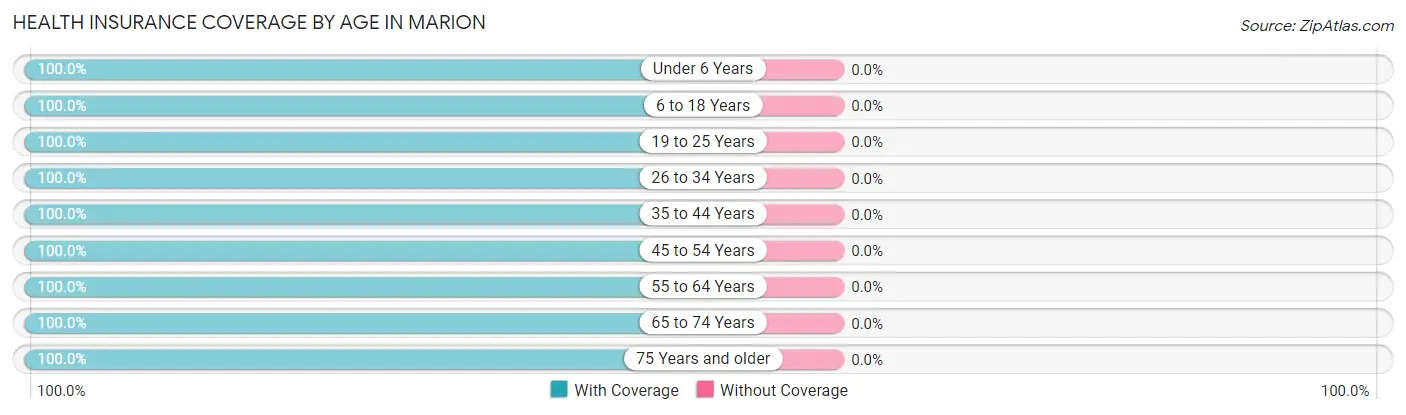
| Age Bracket | With Coverage | Without Coverage |
| Under 6 Years | 53 (100.0%) | 0 (0.0%) |
| 6 to 18 Years | 147 (100.0%) | 0 (0.0%) |
| 19 to 25 Years | 113 (100.0%) | 0 (0.0%) |
| 26 to 34 Years | 38 (100.0%) | 0 (0.0%) |
| 35 to 44 Years | 30 (100.0%) | 0 (0.0%) |
| 45 to 54 Years | 90 (100.0%) | 0 (0.0%) |
| 55 to 64 Years | 73 (100.0%) | 0 (0.0%) |
| 65 to 74 Years | 55 (100.0%) | 0 (0.0%) |
| 75 Years and older | 18 (100.0%) | 0 (0.0%) |
| Total | 617 (100.0%) | 0 (0.0%) |
Health Insurance Coverage by Citizenship Status in Marion
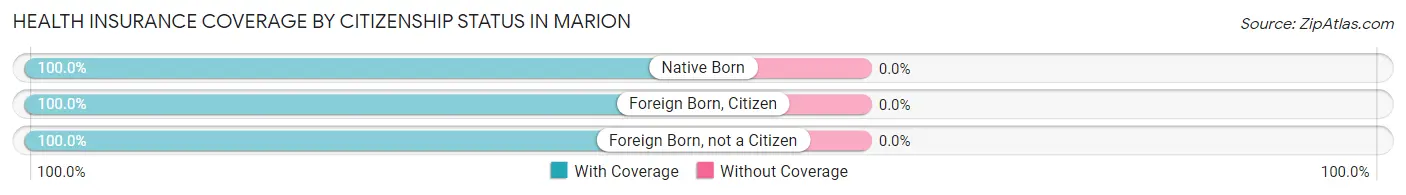
| Citizenship Status | With Coverage | Without Coverage |
| Native Born | 53 (100.0%) | 0 (0.0%) |
| Foreign Born, Citizen | 147 (100.0%) | 0 (0.0%) |
| Foreign Born, not a Citizen | 113 (100.0%) | 0 (0.0%) |
Health Insurance Coverage by Household Income in Marion
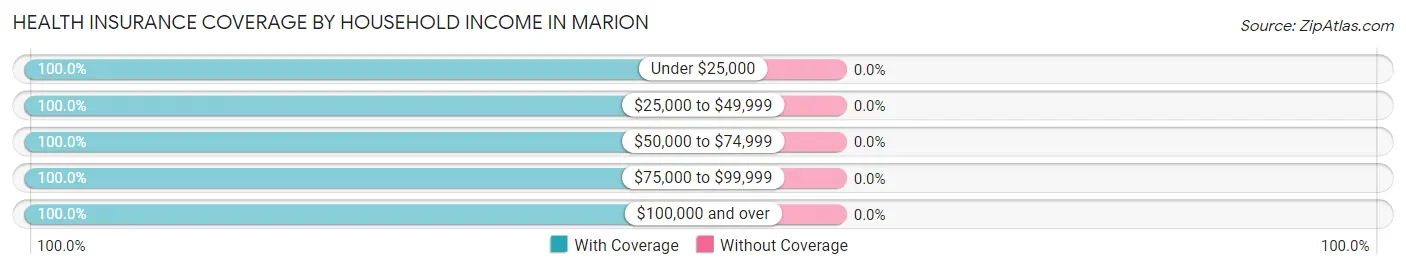
| Household Income | With Coverage | Without Coverage |
| Under $25,000 | 22 (100.0%) | 0 (0.0%) |
| $25,000 to $49,999 | 26 (100.0%) | 0 (0.0%) |
| $50,000 to $74,999 | 77 (100.0%) | 0 (0.0%) |
| $75,000 to $99,999 | 204 (100.0%) | 0 (0.0%) |
| $100,000 and over | 288 (100.0%) | 0 (0.0%) |
Public vs Private Health Insurance Coverage by Age in Marion
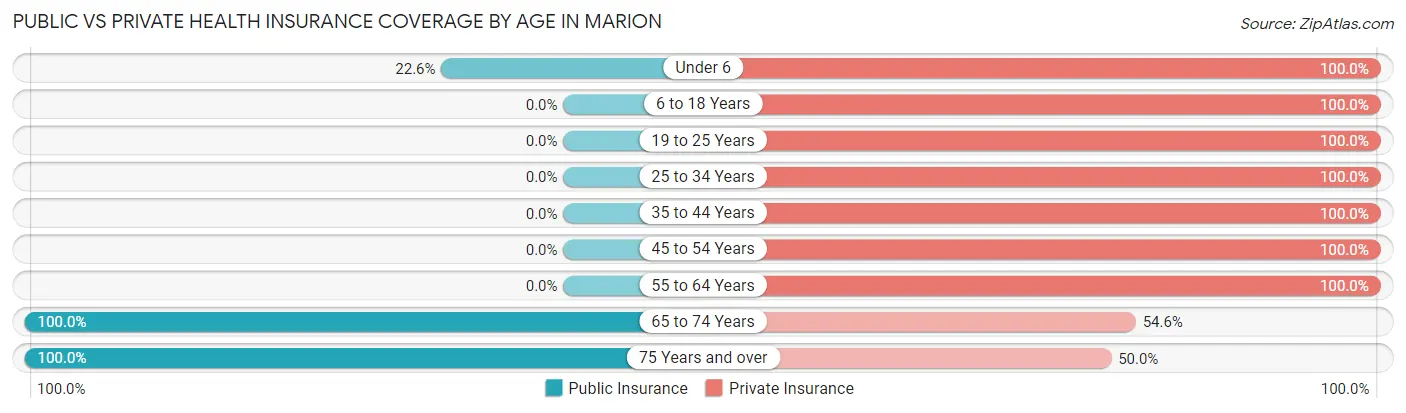
| Age Bracket | Public Insurance | Private Insurance |
| Under 6 | 12 (22.6%) | 53 (100.0%) |
| 6 to 18 Years | 0 (0.0%) | 147 (100.0%) |
| 19 to 25 Years | 0 (0.0%) | 113 (100.0%) |
| 25 to 34 Years | 0 (0.0%) | 38 (100.0%) |
| 35 to 44 Years | 0 (0.0%) | 30 (100.0%) |
| 45 to 54 Years | 0 (0.0%) | 90 (100.0%) |
| 55 to 64 Years | 0 (0.0%) | 73 (100.0%) |
| 65 to 74 Years | 55 (100.0%) | 30 (54.5%) |
| 75 Years and over | 18 (100.0%) | 9 (50.0%) |
| Total | 85 (13.8%) | 583 (94.5%) |
Disability Status by Sex by Age in Marion
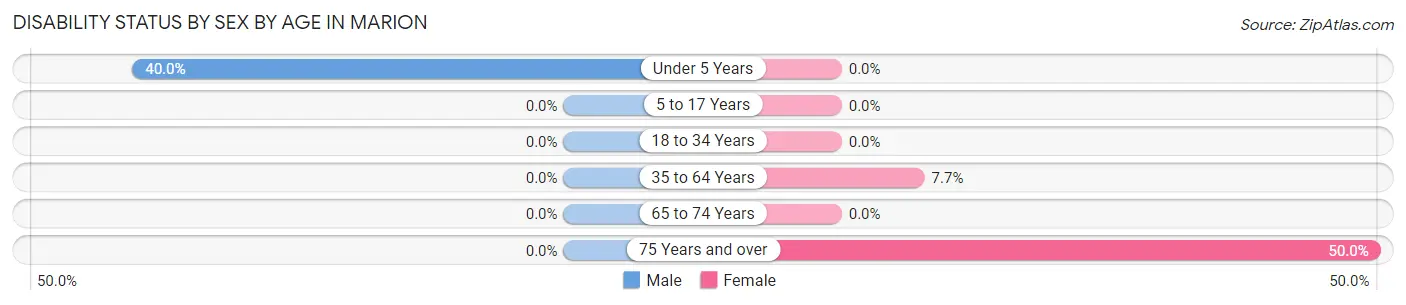
| Age Bracket | Male | Female |
| Under 5 Years | 12 (40.0%) | 0 (0.0%) |
| 5 to 17 Years | 0 (0.0%) | 0 (0.0%) |
| 18 to 34 Years | 0 (0.0%) | 0 (0.0%) |
| 35 to 64 Years | 0 (0.0%) | 8 (7.7%) |
| 65 to 74 Years | 0 (0.0%) | 0 (0.0%) |
| 75 Years and over | 0 (0.0%) | 9 (50.0%) |
Disability Class by Sex by Age in Marion
Disability Class: Hearing Difficulty
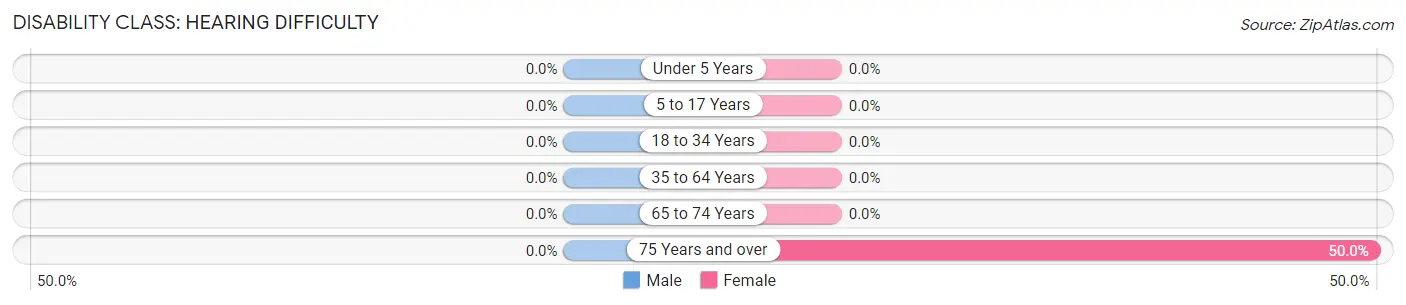
| Age Bracket | Male | Female |
| Under 5 Years | 0 (0.0%) | 0 (0.0%) |
| 5 to 17 Years | 0 (0.0%) | 0 (0.0%) |
| 18 to 34 Years | 0 (0.0%) | 0 (0.0%) |
| 35 to 64 Years | 0 (0.0%) | 0 (0.0%) |
| 65 to 74 Years | 0 (0.0%) | 0 (0.0%) |
| 75 Years and over | 0 (0.0%) | 9 (50.0%) |
Disability Class: Vision Difficulty
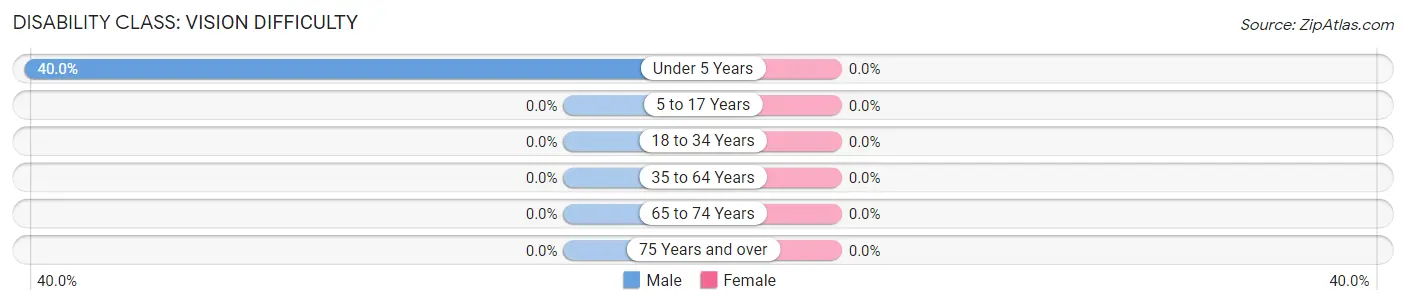
| Age Bracket | Male | Female |
| Under 5 Years | 12 (40.0%) | 0 (0.0%) |
| 5 to 17 Years | 0 (0.0%) | 0 (0.0%) |
| 18 to 34 Years | 0 (0.0%) | 0 (0.0%) |
| 35 to 64 Years | 0 (0.0%) | 0 (0.0%) |
| 65 to 74 Years | 0 (0.0%) | 0 (0.0%) |
| 75 Years and over | 0 (0.0%) | 0 (0.0%) |
Disability Class: Cognitive Difficulty
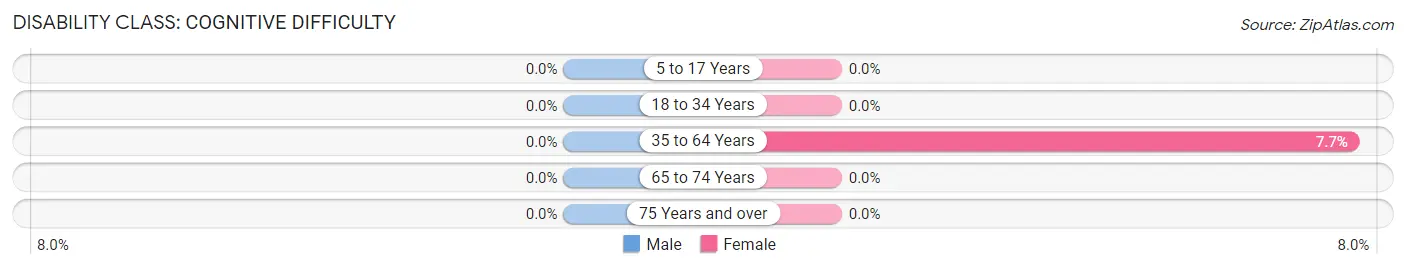
| Age Bracket | Male | Female |
| 5 to 17 Years | 0 (0.0%) | 0 (0.0%) |
| 18 to 34 Years | 0 (0.0%) | 0 (0.0%) |
| 35 to 64 Years | 0 (0.0%) | 8 (7.7%) |
| 65 to 74 Years | 0 (0.0%) | 0 (0.0%) |
| 75 Years and over | 0 (0.0%) | 0 (0.0%) |
Disability Class: Ambulatory Difficulty
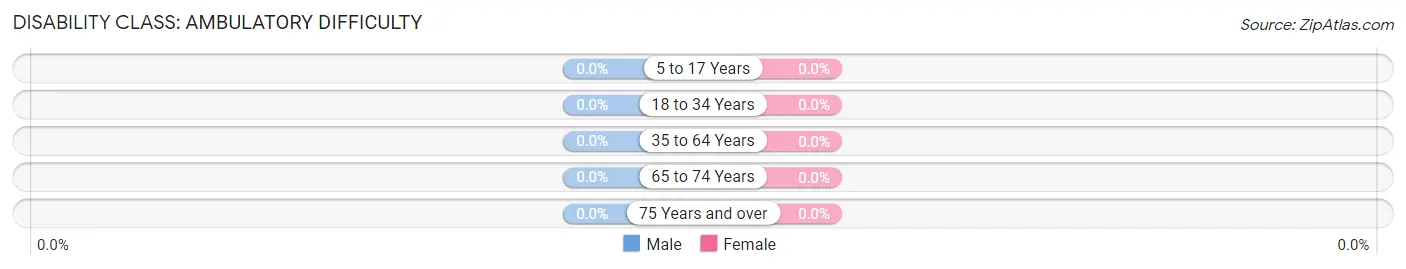
| Age Bracket | Male | Female |
| 5 to 17 Years | 0 (0.0%) | 0 (0.0%) |
| 18 to 34 Years | 0 (0.0%) | 0 (0.0%) |
| 35 to 64 Years | 0 (0.0%) | 0 (0.0%) |
| 65 to 74 Years | 0 (0.0%) | 0 (0.0%) |
| 75 Years and over | 0 (0.0%) | 0 (0.0%) |
Disability Class: Self-Care Difficulty
| Age Bracket | Male | Female |
| 5 to 17 Years | 0 (0.0%) | 0 (0.0%) |
| 18 to 34 Years | 0 (0.0%) | 0 (0.0%) |
| 35 to 64 Years | 0 (0.0%) | 0 (0.0%) |
| 65 to 74 Years | 0 (0.0%) | 0 (0.0%) |
| 75 Years and over | 0 (0.0%) | 0 (0.0%) |
Technology Access in Marion
Computing Device Access in Marion
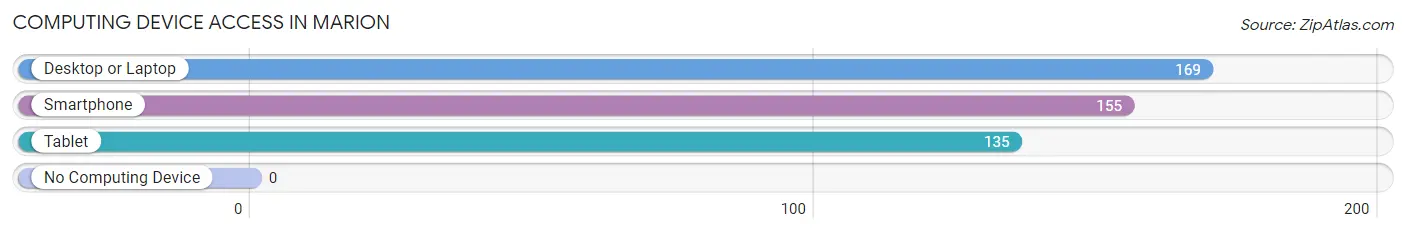
| Device Type | # Households | % Households |
| Desktop or Laptop | 169 | 100.0% |
| Smartphone | 155 | 91.7% |
| Tablet | 135 | 79.9% |
| No Computing Device | 0 | 0.0% |
| Total | 169 | 100.0% |
Internet Access in Marion
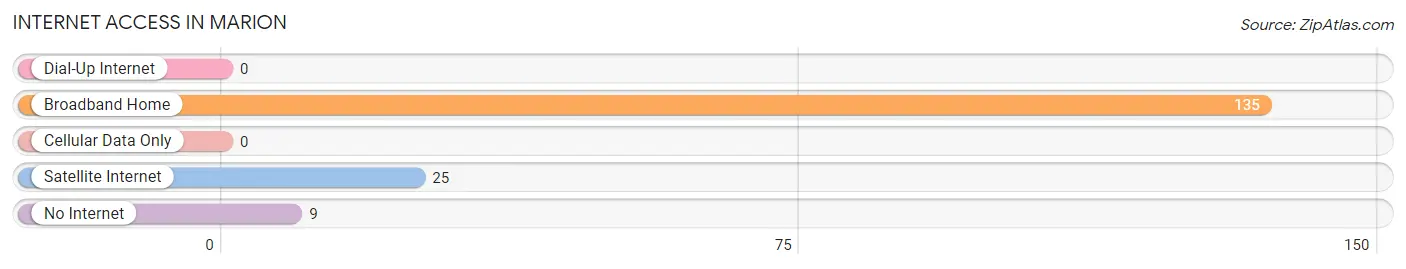
| Internet Type | # Households | % Households |
| Dial-Up Internet | 0 | 0.0% |
| Broadband Home | 135 | 79.9% |
| Cellular Data Only | 0 | 0.0% |
| Satellite Internet | 25 | 14.8% |
| No Internet | 9 | 5.3% |
| Total | 169 | 100.0% |
Marion Summary
Marion, Utah is a small town located in the southwestern corner of the state, near the Arizona border. It is part of the St. George Metropolitan Statistical Area and is located in Washington County. The town has a population of approximately 1,000 people and is known for its rural atmosphere and small-town charm.
Geography
Marion is located in the southwestern corner of Utah, near the Arizona border. It is situated in the Red Cliffs Desert Reserve, a protected area of desert and mountain terrain. The town is located at an elevation of 3,400 feet and is surrounded by the Pine Valley Mountains to the east and the Red Cliffs National Conservation Area to the west. The town is located in the Mojave Desert and is characterized by its dry climate and hot summers.
Economy
Marion’s economy is largely based on agriculture and tourism. The town is home to several farms and ranches, which produce a variety of crops, including alfalfa, hay, and wheat. The town is also home to several tourist attractions, including the Red Cliffs National Conservation Area, which offers hiking, camping, and other outdoor activities. Additionally, the town is home to several small businesses, including restaurants, shops, and other services.
Demographics
As of the 2010 census, Marion had a population of 1,000 people. The racial makeup of the town was 94.2% White, 0.7% African American, 0.7% Native American, 0.7% Asian, 0.3% Pacific Islander, and 2.7% from other races. The median household income was $37,500, and the median family income was $41,250. The per capita income was $17,000.
History
Marion was first settled in 1854 by Mormon pioneers. The town was named after Marion D. Hanks, a prominent Mormon leader. The town was originally a farming community, and the local economy was largely based on agriculture. In the early 1900s, the town began to grow and develop, and by the 1950s, it had become a popular tourist destination. Today, Marion is a small, rural town with a population of approximately 1,000 people. It is known for its rural atmosphere and small-town charm.
Common Questions
What is Per Capita Income in Marion?
Per Capita income in Marion is $44,006.
What is the Median Family Income in Marion?
Median Family Income in Marion is $110,625.
What is the Median Household income in Marion?
Median Household Income in Marion is $99,464.
What is Inequality or Gini Index in Marion?
Inequality or Gini Index in Marion is 0.51.
What is the Total Population of Marion?
Total Population of Marion is 617.
What is the Total Male Population of Marion?
Total Male Population of Marion is 367.
What is the Total Female Population of Marion?
Total Female Population of Marion is 250.
What is the Ratio of Males per 100 Females in Marion?
There are 146.80 Males per 100 Females in Marion.
What is the Ratio of Females per 100 Males in Marion?
There are 68.12 Females per 100 Males in Marion.
What is the Median Population Age in Marion?
Median Population Age in Marion is 22.7 Years.
What is the Average Family Size in Marion
Average Family Size in Marion is 4.4 People.
What is the Average Household Size in Marion
Average Household Size in Marion is 3.6 People.
How Large is the Labor Force in Marion?
There are 240 People in the Labor Forcein in Marion.
What is the Percentage of People in the Labor Force in Marion?
51.1% of People are in the Labor Force in Marion.