Zip Codes with the Highest Percentage of Population Employed in Security & Protection in Utah
RELATED REPORTS & OPTIONS
Security & Protection
Utah
Compare Zip Codes
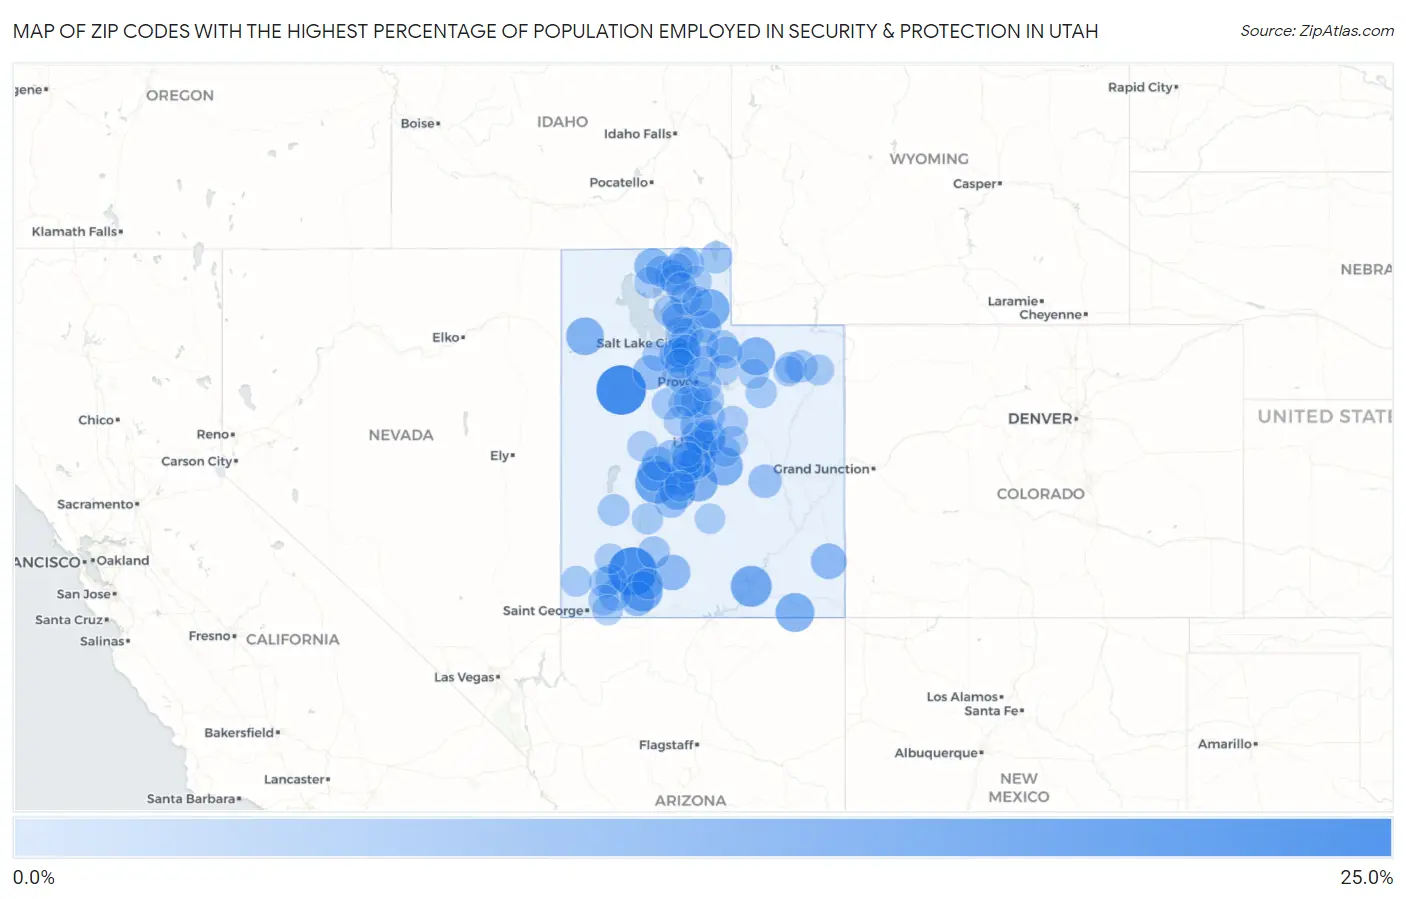
Map of Zip Codes with the Highest Percentage of Population Employed in Security & Protection in Utah
0.0%
25.0%
Zip Codes with the Highest Percentage of Population Employed in Security & Protection in Utah
| Zip Code | % Employed | vs State | vs National | |
| 1. | 84022 | 21.5% | 1.6%(+19.9)#1 | 2.1%(+19.3)#179 |
| 2. | 84719 | 20.0% | 1.6%(+18.4)#2 | 2.1%(+17.9)#195 |
| 3. | 84644 | 13.7% | 1.6%(+12.1)#3 | 2.1%(+11.6)#431 |
| 4. | 84533 | 12.5% | 1.6%(+10.9)#4 | 2.1%(+10.4)#509 |
| 5. | 84729 | 11.8% | 1.6%(+10.2)#5 | 2.1%(+9.69)#565 |
| 6. | 84018 | 10.8% | 1.6%(+9.17)#6 | 2.1%(+8.64)#668 |
| 7. | 84531 | 10.2% | 1.6%(+8.59)#7 | 2.1%(+8.06)#743 |
| 8. | 84523 | 9.7% | 1.6%(+8.09)#8 | 2.1%(+7.55)#804 |
| 9. | 84654 | 9.6% | 1.6%(+7.99)#9 | 2.1%(+7.46)#821 |
| 10. | 84031 | 9.6% | 1.6%(+7.96)#10 | 2.1%(+7.43)#828 |
| 11. | 84083 | 9.1% | 1.6%(+7.53)#11 | 2.1%(+6.99)#888 |
| 12. | 84730 | 8.5% | 1.6%(+6.91)#12 | 2.1%(+6.38)#1,004 |
| 13. | 84316 | 7.8% | 1.6%(+6.17)#13 | 2.1%(+5.64)#1,244 |
| 14. | 84535 | 7.2% | 1.6%(+5.57)#14 | 2.1%(+5.04)#1,449 |
| 15. | 84776 | 7.1% | 1.6%(+5.53)#15 | 2.1%(+4.99)#1,473 |
| 16. | 84631 | 7.1% | 1.6%(+5.46)#16 | 2.1%(+4.93)#1,500 |
| 17. | 84662 | 6.6% | 1.6%(+4.96)#17 | 2.1%(+4.42)#1,752 |
| 18. | 84069 | 6.0% | 1.6%(+4.43)#18 | 2.1%(+3.90)#2,048 |
| 19. | 84758 | 6.0% | 1.6%(+4.41)#19 | 2.1%(+3.88)#2,061 |
| 20. | 84642 | 5.8% | 1.6%(+4.18)#20 | 2.1%(+3.64)#2,214 |
| 21. | 84620 | 5.8% | 1.6%(+4.17)#21 | 2.1%(+3.63)#2,221 |
| 22. | 84636 | 5.6% | 1.6%(+3.94)#22 | 2.1%(+3.41)#2,409 |
| 23. | 84632 | 5.2% | 1.6%(+3.54)#23 | 2.1%(+3.01)#2,755 |
| 24. | 84525 | 5.0% | 1.6%(+3.38)#24 | 2.1%(+2.84)#2,937 |
| 25. | 84754 | 4.7% | 1.6%(+3.08)#25 | 2.1%(+2.54)#3,317 |
| 26. | 84627 | 4.7% | 1.6%(+3.04)#26 | 2.1%(+2.51)#3,358 |
| 27. | 84643 | 4.4% | 1.6%(+2.78)#27 | 2.1%(+2.25)#3,782 |
| 28. | 84056 | 4.0% | 1.6%(+2.41)#28 | 2.1%(+1.88)#4,439 |
| 29. | 84667 | 4.0% | 1.6%(+2.41)#29 | 2.1%(+1.88)#4,441 |
| 30. | 84033 | 4.0% | 1.6%(+2.37)#30 | 2.1%(+1.84)#4,525 |
| 31. | 84656 | 4.0% | 1.6%(+2.37)#31 | 2.1%(+1.83)#4,536 |
| 32. | 84055 | 3.9% | 1.6%(+2.28)#32 | 2.1%(+1.75)#4,693 |
| 33. | 84759 | 3.9% | 1.6%(+2.28)#33 | 2.1%(+1.74)#4,709 |
| 34. | 84039 | 3.9% | 1.6%(+2.28)#34 | 2.1%(+1.74)#4,713 |
| 35. | 84629 | 3.6% | 1.6%(+2.00)#35 | 2.1%(+1.46)#5,371 |
| 36. | 84038 | 3.6% | 1.6%(+1.96)#36 | 2.1%(+1.42)#5,473 |
| 37. | 84622 | 3.5% | 1.6%(+1.86)#37 | 2.1%(+1.32)#5,744 |
| 38. | 84036 | 3.5% | 1.6%(+1.85)#38 | 2.1%(+1.32)#5,770 |
| 39. | 84314 | 3.5% | 1.6%(+1.85)#39 | 2.1%(+1.31)#5,781 |
| 40. | 84087 | 3.4% | 1.6%(+1.80)#40 | 2.1%(+1.26)#5,906 |
| 41. | 84310 | 3.3% | 1.6%(+1.73)#41 | 2.1%(+1.20)#6,105 |
| 42. | 84779 | 3.3% | 1.6%(+1.65)#42 | 2.1%(+1.11)#6,368 |
| 43. | 84751 | 3.3% | 1.6%(+1.64)#43 | 2.1%(+1.11)#6,384 |
| 44. | 84307 | 3.2% | 1.6%(+1.56)#44 | 2.1%(+1.03)#6,616 |
| 45. | 84742 | 3.1% | 1.6%(+1.51)#45 | 2.1%(+0.977)#6,800 |
| 46. | 84081 | 3.1% | 1.6%(+1.47)#46 | 2.1%(+0.936)#6,938 |
| 47. | 84318 | 3.1% | 1.6%(+1.47)#47 | 2.1%(+0.931)#6,959 |
| 48. | 84647 | 3.1% | 1.6%(+1.44)#48 | 2.1%(+0.904)#7,032 |
| 49. | 84337 | 3.0% | 1.6%(+1.40)#49 | 2.1%(+0.863)#7,189 |
| 50. | 84010 | 3.0% | 1.6%(+1.38)#50 | 2.1%(+0.842)#7,261 |
| 51. | 84053 | 3.0% | 1.6%(+1.38)#51 | 2.1%(+0.842)#7,265 |
| 52. | 84628 | 3.0% | 1.6%(+1.36)#52 | 2.1%(+0.828)#7,317 |
| 53. | 84630 | 2.9% | 1.6%(+1.29)#53 | 2.1%(+0.759)#7,609 |
| 54. | 84653 | 2.9% | 1.6%(+1.28)#54 | 2.1%(+0.748)#7,659 |
| 55. | 84107 | 2.9% | 1.6%(+1.28)#55 | 2.1%(+0.743)#7,686 |
| 56. | 84021 | 2.8% | 1.6%(+1.21)#56 | 2.1%(+0.680)#7,981 |
| 57. | 84634 | 2.8% | 1.6%(+1.21)#57 | 2.1%(+0.673)#8,013 |
| 58. | 84710 | 2.8% | 1.6%(+1.20)#58 | 2.1%(+0.668)#8,039 |
| 59. | 84720 | 2.8% | 1.6%(+1.18)#59 | 2.1%(+0.641)#8,155 |
| 60. | 84335 | 2.8% | 1.6%(+1.14)#60 | 2.1%(+0.605)#8,302 |
| 61. | 84713 | 2.8% | 1.6%(+1.14)#61 | 2.1%(+0.602)#8,313 |
| 62. | 84633 | 2.6% | 1.6%(+1.04)#62 | 2.1%(+0.501)#8,767 |
| 63. | 84651 | 2.6% | 1.6%(+0.998)#63 | 2.1%(+0.463)#8,953 |
| 64. | 84005 | 2.6% | 1.6%(+0.970)#64 | 2.1%(+0.436)#9,081 |
| 65. | 84319 | 2.6% | 1.6%(+0.956)#65 | 2.1%(+0.422)#9,154 |
| 66. | 84657 | 2.5% | 1.6%(+0.922)#66 | 2.1%(+0.388)#9,320 |
| 67. | 84009 | 2.5% | 1.6%(+0.859)#67 | 2.1%(+0.324)#9,662 |
| 68. | 84725 | 2.5% | 1.6%(+0.839)#68 | 2.1%(+0.304)#9,767 |
| 69. | 84537 | 2.4% | 1.6%(+0.833)#69 | 2.1%(+0.299)#9,805 |
| 70. | 84094 | 2.4% | 1.6%(+0.814)#70 | 2.1%(+0.280)#9,914 |
| 71. | 84078 | 2.4% | 1.6%(+0.773)#71 | 2.1%(+0.239)#10,115 |
| 72. | 84302 | 2.4% | 1.6%(+0.738)#72 | 2.1%(+0.204)#10,315 |
| 73. | 84325 | 2.3% | 1.6%(+0.721)#73 | 2.1%(+0.187)#10,432 |
| 74. | 84526 | 2.3% | 1.6%(+0.712)#74 | 2.1%(+0.177)#10,483 |
| 75. | 84528 | 2.3% | 1.6%(+0.684)#75 | 2.1%(+0.150)#10,660 |
| 76. | 84774 | 2.3% | 1.6%(+0.674)#76 | 2.1%(+0.139)#10,720 |
| 77. | 84324 | 2.2% | 1.6%(+0.613)#77 | 2.1%(+0.078)#11,100 |
| 78. | 84660 | 2.2% | 1.6%(+0.600)#78 | 2.1%(+0.065)#11,174 |
| 79. | 84737 | 2.2% | 1.6%(+0.564)#79 | 2.1%(+0.030)#11,379 |
| 80. | 84315 | 2.2% | 1.6%(+0.564)#80 | 2.1%(+0.029)#11,385 |
| 81. | 84074 | 2.1% | 1.6%(+0.501)#81 | 2.1%(-0.034)#11,812 |
| 82. | 84111 | 2.1% | 1.6%(+0.451)#82 | 2.1%(-0.084)#12,158 |
| 83. | 84049 | 2.0% | 1.6%(+0.431)#83 | 2.1%(-0.104)#12,285 |
| 84. | 84721 | 2.0% | 1.6%(+0.384)#84 | 2.1%(-0.151)#12,570 |
| 85. | 84041 | 2.0% | 1.6%(+0.373)#85 | 2.1%(-0.162)#12,645 |
| 86. | 84749 | 2.0% | 1.6%(+0.366)#86 | 2.1%(-0.168)#12,692 |
| 87. | 84317 | 2.0% | 1.6%(+0.358)#87 | 2.1%(-0.176)#12,746 |
| 88. | 84045 | 1.9% | 1.6%(+0.332)#88 | 2.1%(-0.202)#12,911 |
| 89. | 84624 | 1.9% | 1.6%(+0.327)#89 | 2.1%(-0.208)#12,946 |
| 90. | 84066 | 1.9% | 1.6%(+0.280)#90 | 2.1%(-0.255)#13,275 |
| 91. | 84084 | 1.9% | 1.6%(+0.259)#91 | 2.1%(-0.275)#13,420 |
| 92. | 84655 | 1.9% | 1.6%(+0.243)#92 | 2.1%(-0.291)#13,507 |
| 93. | 84032 | 1.8% | 1.6%(+0.223)#93 | 2.1%(-0.311)#13,667 |
| 94. | 84663 | 1.8% | 1.6%(+0.220)#94 | 2.1%(-0.315)#13,690 |
| 95. | 84648 | 1.8% | 1.6%(+0.209)#95 | 2.1%(-0.326)#13,762 |
| 96. | 84117 | 1.8% | 1.6%(+0.209)#96 | 2.1%(-0.326)#13,765 |
| 97. | 84065 | 1.8% | 1.6%(+0.206)#97 | 2.1%(-0.329)#13,789 |
| 98. | 84098 | 1.8% | 1.6%(+0.199)#98 | 2.1%(-0.335)#13,833 |
| 99. | 84604 | 1.8% | 1.6%(+0.194)#99 | 2.1%(-0.340)#13,882 |
| 100. | 84072 | 1.8% | 1.6%(+0.193)#100 | 2.1%(-0.341)#13,886 |
Common Questions
What are the Top 10 Zip Codes with the Highest Percentage of Population Employed in Security & Protection in Utah?
Top 10 Zip Codes with the Highest Percentage of Population Employed in Security & Protection in Utah are:
What zip code has the Highest Percentage of Population Employed in Security & Protection in Utah?
84022 has the Highest Percentage of Population Employed in Security & Protection in Utah with 21.5%.
What is the Percentage of Population Employed in Security & Protection in the State of Utah?
Percentage of Population Employed in Security & Protection in Utah is 1.6%.
What is the Percentage of Population Employed in Security & Protection in the United States?
Percentage of Population Employed in Security & Protection in the United States is 2.1%.