Woodland, UT Map & Demographics
Woodland Map
Woodland Overview
$24,328
PER CAPITA INCOME
$80,699
AVG FAMILY INCOME
$80,331
AVG HOUSEHOLD INCOME
0.30
INEQUALITY / GINI INDEX
471
TOTAL POPULATION
239
MALE POPULATION
232
FEMALE POPULATION
103.02
MALES / 100 FEMALES
97.07
FEMALES / 100 MALES
31.4
MEDIAN AGE
3.4
AVG FAMILY SIZE
3.0
AVG HOUSEHOLD SIZE
140
LABOR FORCE [ PEOPLE ]
43.6%
PERCENT IN LABOR FORCE
10.0%
UNEMPLOYMENT RATE
Income in Woodland
Income Overview in Woodland
Per Capita Income in Woodland is $24,328, while median incomes of families and households are $80,699 and $80,331 respectively.
| Characteristic | Number | Measure |
| Per Capita Income | 471 | $24,328 |
| Median Family Income | 133 | $80,699 |
| Mean Family Income | 133 | $74,146 |
| Median Household Income | 159 | $80,331 |
| Mean Household Income | 159 | $71,265 |
| Income Deficit | 133 | $0 |
| Wage / Income Gap (%) | 471 | 0.00% |
| Wage / Income Gap ($) | 471 | 100.00¢ per $1 |
| Gini / Inequality Index | 471 | 0.30 |
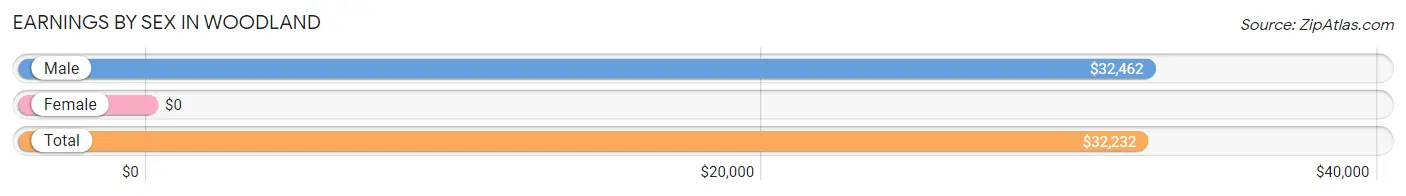
Earnings by Sex in Woodland
| Sex | Number | Average Earnings |
| Male | 83 (52.2%) | $32,462 |
| Female | 76 (47.8%) | $0 |
| Total | 159 (100.0%) | $32,232 |
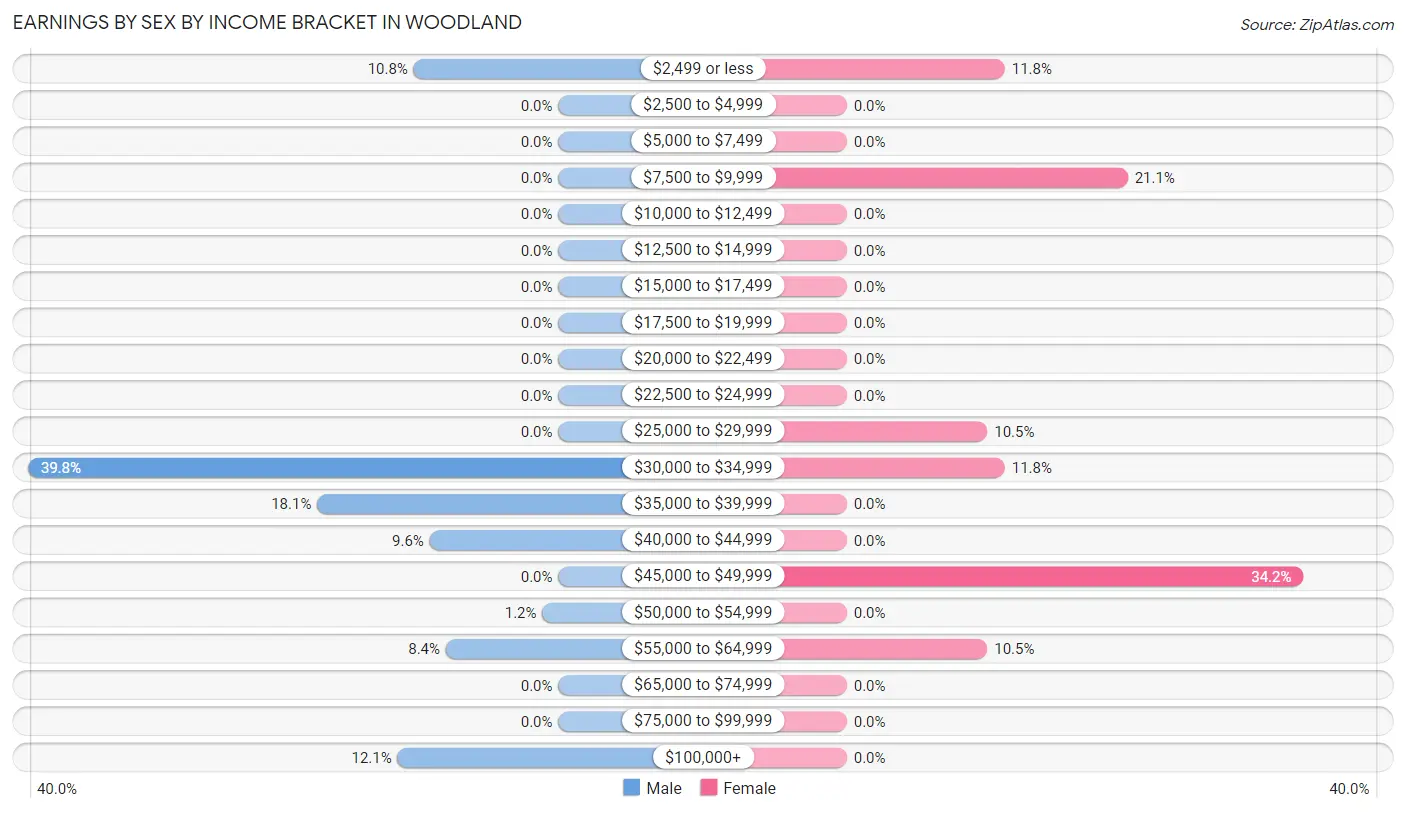
Earnings by Sex by Income Bracket in Woodland
The most common earnings brackets in Woodland are $30,000 to $34,999 for men (33 | 39.8%) and $45,000 to $49,999 for women (26 | 34.2%).
| Income | Male | Female |
| $2,499 or less | 9 (10.8%) | 9 (11.8%) |
| $2,500 to $4,999 | 0 (0.0%) | 0 (0.0%) |
| $5,000 to $7,499 | 0 (0.0%) | 0 (0.0%) |
| $7,500 to $9,999 | 0 (0.0%) | 16 (21.0%) |
| $10,000 to $12,499 | 0 (0.0%) | 0 (0.0%) |
| $12,500 to $14,999 | 0 (0.0%) | 0 (0.0%) |
| $15,000 to $17,499 | 0 (0.0%) | 0 (0.0%) |
| $17,500 to $19,999 | 0 (0.0%) | 0 (0.0%) |
| $20,000 to $22,499 | 0 (0.0%) | 0 (0.0%) |
| $22,500 to $24,999 | 0 (0.0%) | 0 (0.0%) |
| $25,000 to $29,999 | 0 (0.0%) | 8 (10.5%) |
| $30,000 to $34,999 | 33 (39.8%) | 9 (11.8%) |
| $35,000 to $39,999 | 15 (18.1%) | 0 (0.0%) |
| $40,000 to $44,999 | 8 (9.6%) | 0 (0.0%) |
| $45,000 to $49,999 | 0 (0.0%) | 26 (34.2%) |
| $50,000 to $54,999 | 1 (1.2%) | 0 (0.0%) |
| $55,000 to $64,999 | 7 (8.4%) | 8 (10.5%) |
| $65,000 to $74,999 | 0 (0.0%) | 0 (0.0%) |
| $75,000 to $99,999 | 0 (0.0%) | 0 (0.0%) |
| $100,000+ | 10 (12.0%) | 0 (0.0%) |
| Total | 83 (100.0%) | 76 (100.0%) |
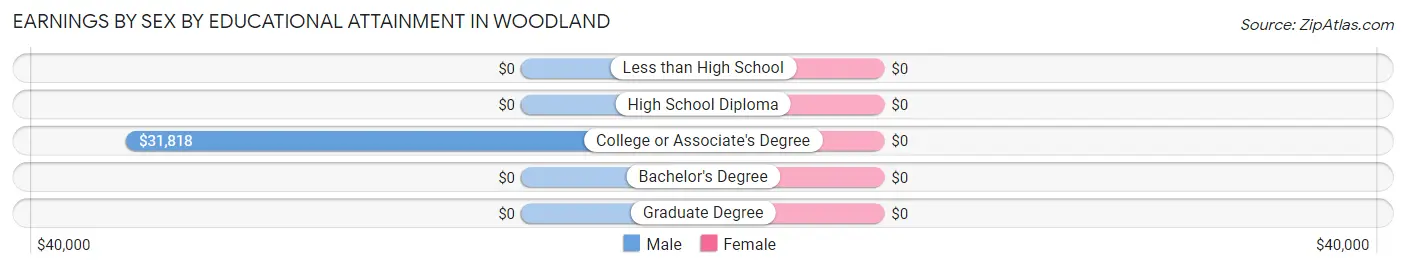
Earnings by Sex by Educational Attainment in Woodland
| Educational Attainment | Male Income | Female Income |
| Less than High School | - | - |
| High School Diploma | - | - |
| College or Associate's Degree | $31,818 | $0 |
| Bachelor's Degree | - | - |
| Graduate Degree | - | - |
| Total | $31,894 | $47,885 |
Family Income in Woodland
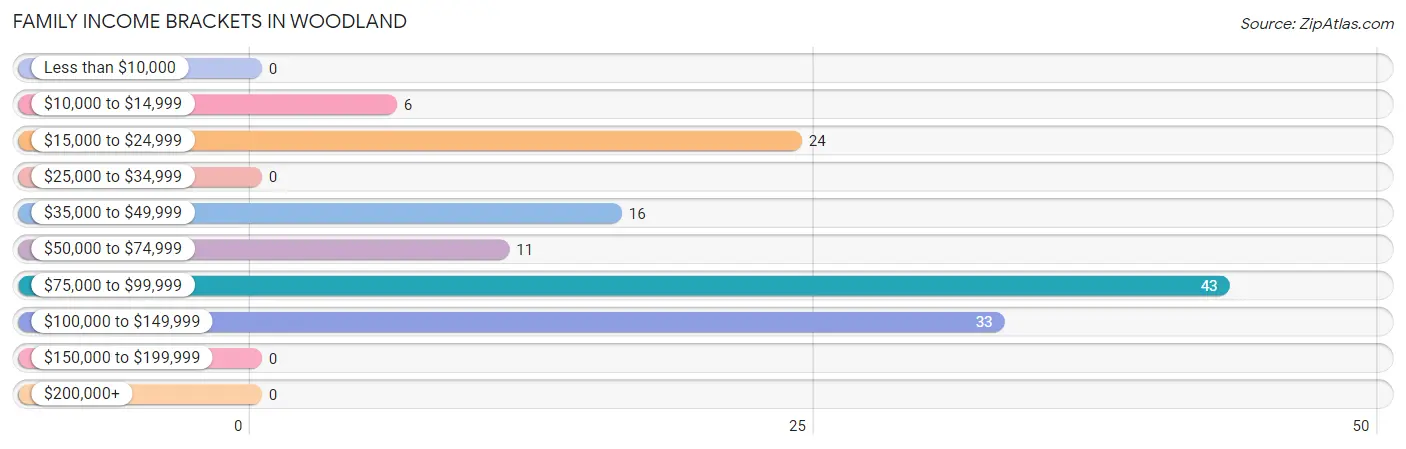
Family Income Brackets in Woodland
According to the Woodland family income data, there are 43 families falling into the $75,000 to $99,999 income range, which is the most common income bracket and makes up 32.3% of all families.
| Income Bracket | # Families | % Families |
| Less than $10,000 | 0 | 0.0% |
| $10,000 to $14,999 | 6 | 4.5% |
| $15,000 to $24,999 | 24 | 18.0% |
| $25,000 to $34,999 | 0 | 0.0% |
| $35,000 to $49,999 | 16 | 12.0% |
| $50,000 to $74,999 | 11 | 8.3% |
| $75,000 to $99,999 | 43 | 32.3% |
| $100,000 to $149,999 | 33 | 24.8% |
| $150,000 to $199,999 | 0 | 0.0% |
| $200,000+ | 0 | 0.0% |
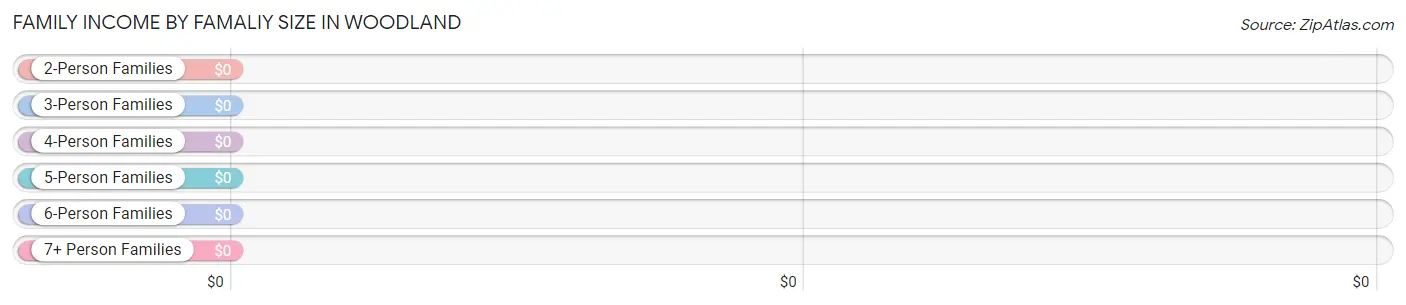
Family Income by Famaliy Size in Woodland
| Income Bracket | # Families | Median Income |
| 2-Person Families | 64 (48.1%) | $0 |
| 3-Person Families | 38 (28.6%) | $0 |
| 4-Person Families | 31 (23.3%) | $0 |
| 5-Person Families | 0 (0.0%) | $0 |
| 6-Person Families | 0 (0.0%) | $0 |
| 7+ Person Families | 0 (0.0%) | $0 |
| Total | 133 (100.0%) | $80,699 |
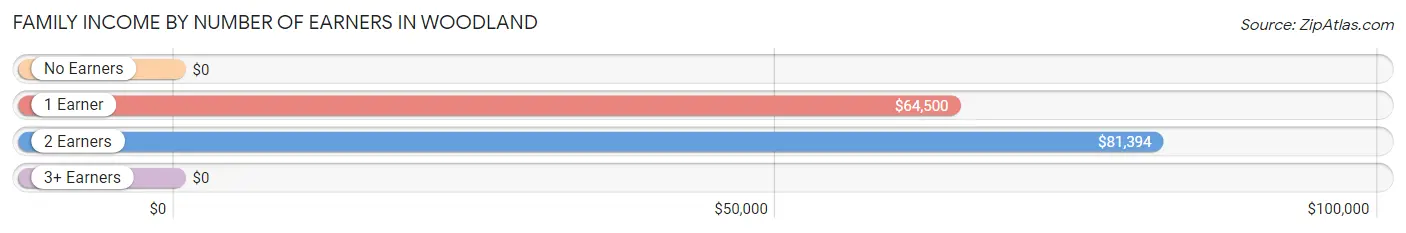
Family Income by Number of Earners in Woodland
| Number of Earners | # Families | Median Income |
| No Earners | 52 (39.1%) | $0 |
| 1 Earner | 20 (15.0%) | $64,500 |
| 2 Earners | 61 (45.9%) | $81,394 |
| 3+ Earners | 0 (0.0%) | $0 |
| Total | 133 (100.0%) | $80,699 |
Household Income in Woodland
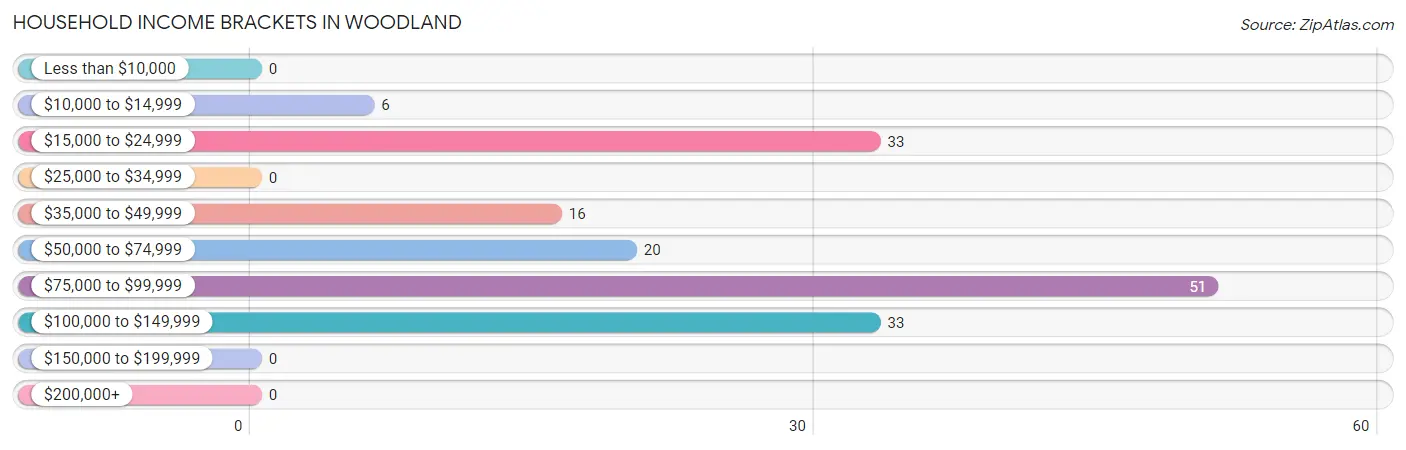
Household Income Brackets in Woodland
With 51 households falling in the category, the $75,000 to $99,999 income range is the most frequent in Woodland, accounting for 32.1% of all households.
| Income Bracket | # Households | % Households |
| Less than $10,000 | 0 | 0.0% |
| $10,000 to $14,999 | 6 | 3.8% |
| $15,000 to $24,999 | 33 | 20.8% |
| $25,000 to $34,999 | 0 | 0.0% |
| $35,000 to $49,999 | 16 | 10.1% |
| $50,000 to $74,999 | 20 | 12.6% |
| $75,000 to $99,999 | 51 | 32.1% |
| $100,000 to $149,999 | 33 | 20.8% |
| $150,000 to $199,999 | 0 | 0.0% |
| $200,000+ | 0 | 0.0% |
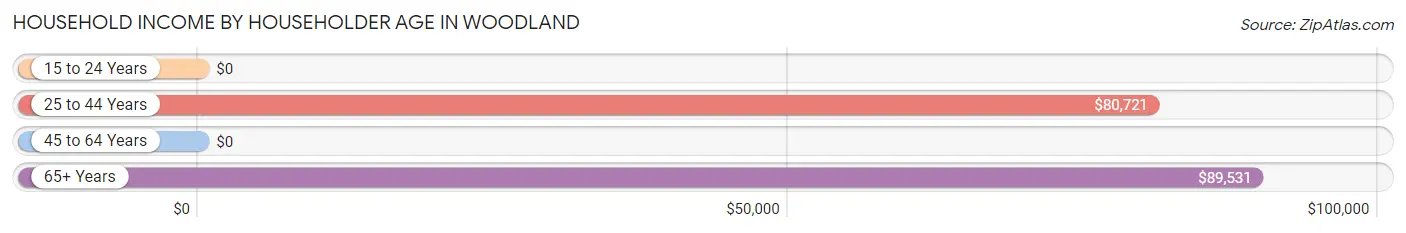
Household Income by Householder Age in Woodland
The median household income in Woodland is $80,331, with the highest median household income of $89,531 found in the 65+ years age bracket for the primary householder. A total of 65 households (40.9%) fall into this category. Meanwhile, the 15 to 24 years age bracket for the primary householder has the lowest median household income of $0, with 16 households (10.1%) in this group.
| Income Bracket | # Households | Median Income |
| 15 to 24 Years | 16 (10.1%) | $0 |
| 25 to 44 Years | 37 (23.3%) | $80,721 |
| 45 to 64 Years | 41 (25.8%) | $0 |
| 65+ Years | 65 (40.9%) | $89,531 |
| Total | 159 (100.0%) | $80,331 |
Poverty in Woodland
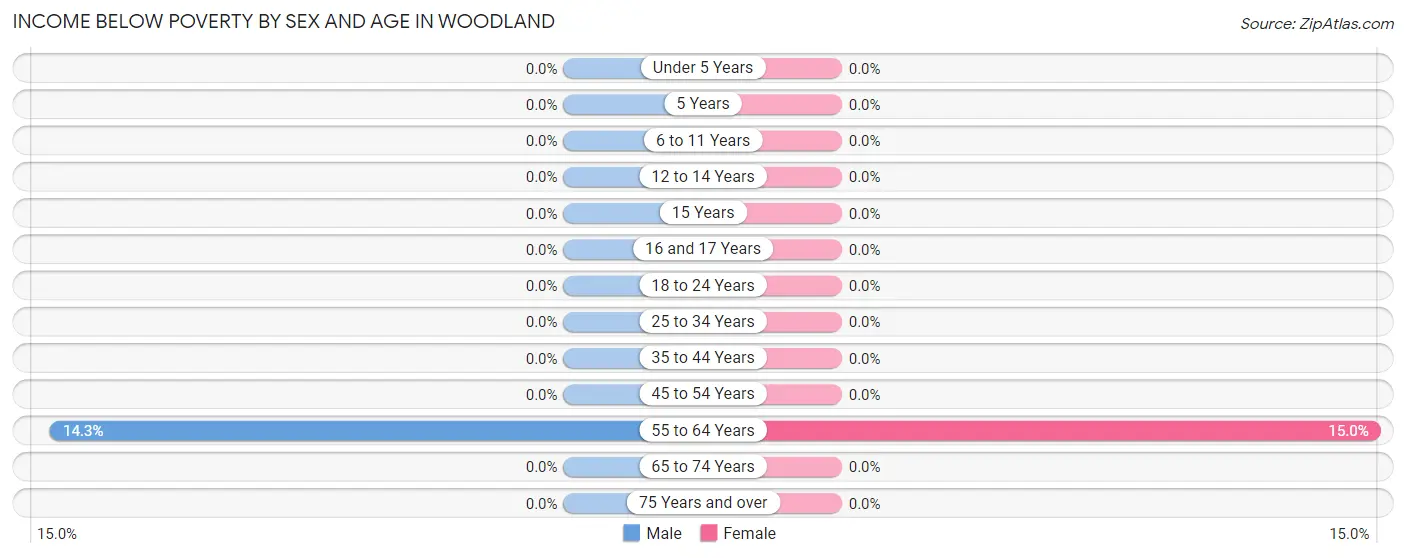
Income Below Poverty by Sex and Age in Woodland
With 2.5% poverty level for males and 2.6% for females among the residents of Woodland, 55 to 64 year old males and 55 to 64 year old females are the most vulnerable to poverty, with 6 males (14.3%) and 6 females (15.0%) in their respective age groups living below the poverty level.
| Age Bracket | Male | Female |
| Under 5 Years | 0 (0.0%) | 0 (0.0%) |
| 5 Years | 0 (0.0%) | 0 (0.0%) |
| 6 to 11 Years | 0 (0.0%) | 0 (0.0%) |
| 12 to 14 Years | 0 (0.0%) | 0 (0.0%) |
| 15 Years | 0 (0.0%) | 0 (0.0%) |
| 16 and 17 Years | 0 (0.0%) | 0 (0.0%) |
| 18 to 24 Years | 0 (0.0%) | 0 (0.0%) |
| 25 to 34 Years | 0 (0.0%) | 0 (0.0%) |
| 35 to 44 Years | 0 (0.0%) | 0 (0.0%) |
| 45 to 54 Years | 0 (0.0%) | 0 (0.0%) |
| 55 to 64 Years | 6 (14.3%) | 6 (15.0%) |
| 65 to 74 Years | 0 (0.0%) | 0 (0.0%) |
| 75 Years and over | 0 (0.0%) | 0 (0.0%) |
| Total | 6 (2.5%) | 6 (2.6%) |
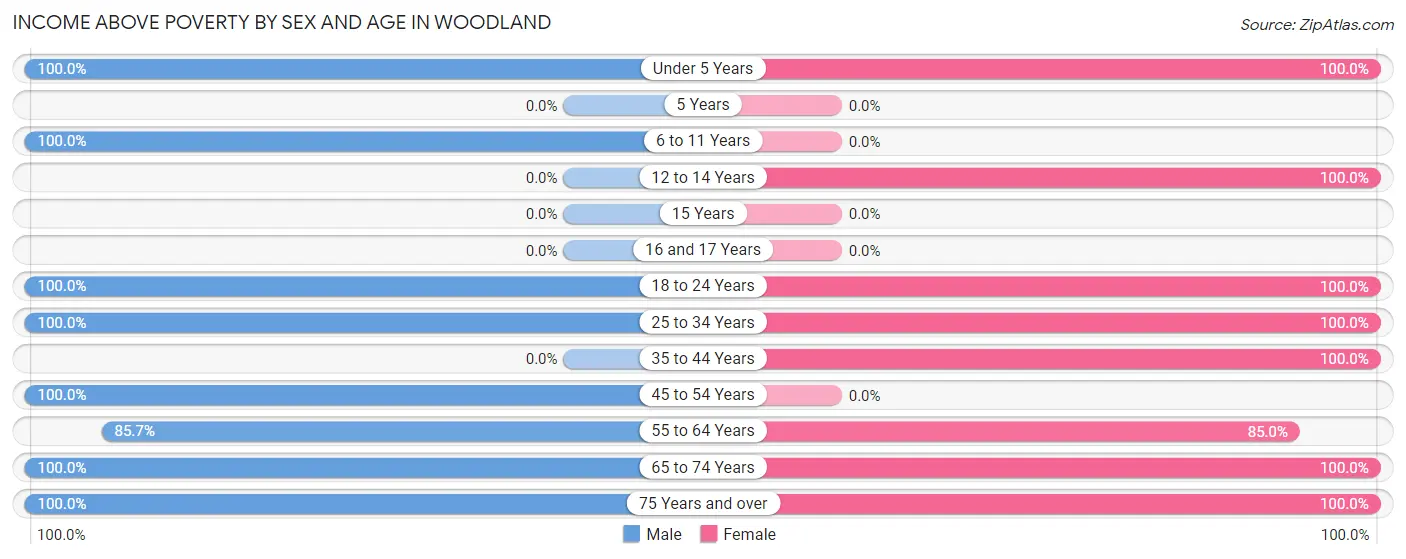
Income Above Poverty by Sex and Age in Woodland
According to the poverty statistics in Woodland, males aged under 5 years and females aged under 5 years are the age groups that are most secure financially, with 100.0% of males and 100.0% of females in these age groups living above the poverty line.
| Age Bracket | Male | Female |
| Under 5 Years | 57 (100.0%) | 72 (100.0%) |
| 5 Years | 0 (0.0%) | 0 (0.0%) |
| 6 to 11 Years | 13 (100.0%) | 0 (0.0%) |
| 12 to 14 Years | 0 (0.0%) | 8 (100.0%) |
| 15 Years | 0 (0.0%) | 0 (0.0%) |
| 16 and 17 Years | 0 (0.0%) | 0 (0.0%) |
| 18 to 24 Years | 15 (100.0%) | 16 (100.0%) |
| 25 to 34 Years | 38 (100.0%) | 35 (100.0%) |
| 35 to 44 Years | 0 (0.0%) | 6 (100.0%) |
| 45 to 54 Years | 24 (100.0%) | 0 (0.0%) |
| 55 to 64 Years | 36 (85.7%) | 34 (85.0%) |
| 65 to 74 Years | 16 (100.0%) | 40 (100.0%) |
| 75 Years and over | 34 (100.0%) | 15 (100.0%) |
| Total | 233 (97.5%) | 226 (97.4%) |
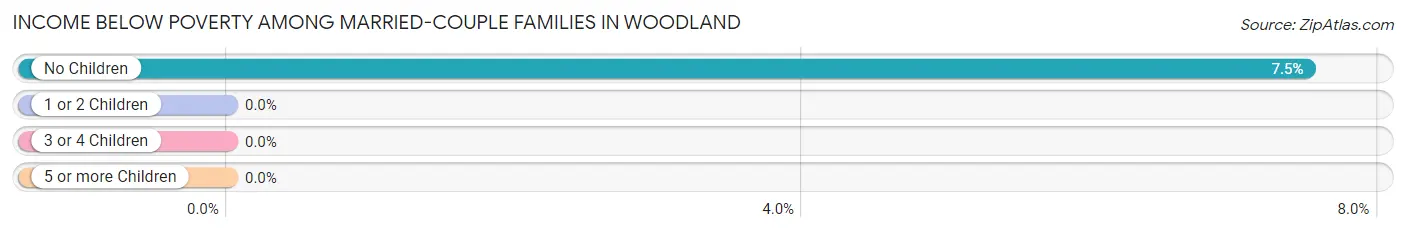
Income Below Poverty Among Married-Couple Families in Woodland
The poverty statistics for married-couple families in Woodland show that 4.7% or 6 of the total 127 families live below the poverty line. Families with no children have the highest poverty rate of 7.5%, comprising of 6 families. On the other hand, families with 1 or 2 children have the lowest poverty rate of 0.0%, which includes 0 families.
| Children | Above Poverty | Below Poverty |
| No Children | 74 (92.5%) | 6 (7.5%) |
| 1 or 2 Children | 47 (100.0%) | 0 (0.0%) |
| 3 or 4 Children | 0 (0.0%) | 0 (0.0%) |
| 5 or more Children | 0 (0.0%) | 0 (0.0%) |
| Total | 121 (95.3%) | 6 (4.7%) |
Income Below Poverty Among Single-Parent Households in Woodland
| Children | Single Father | Single Mother |
| No Children | 0 (0.0%) | 0 (0.0%) |
| 1 or 2 Children | 0 (0.0%) | 0 (0.0%) |
| 3 or 4 Children | 0 (0.0%) | 0 (0.0%) |
| 5 or more Children | 0 (0.0%) | 0 (0.0%) |
| Total | 0 (0.0%) | 0 (0.0%) |
Income Below Poverty Among Married-Couple vs Single-Parent Households in Woodland
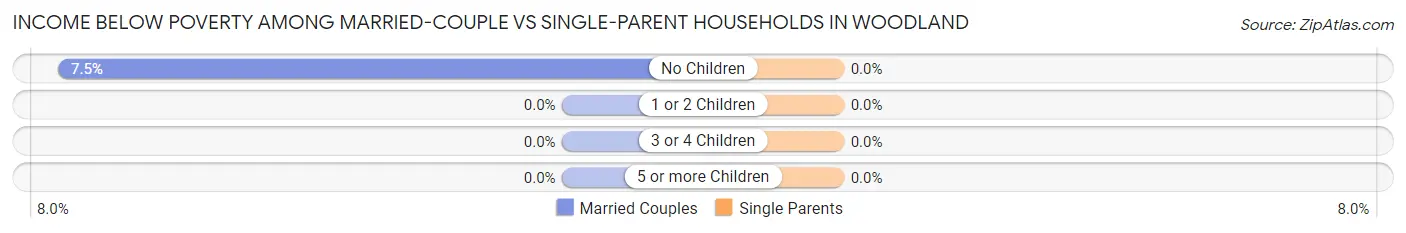
| Children | Married-Couple Families | Single-Parent Households |
| No Children | 6 (7.5%) | 0 (0.0%) |
| 1 or 2 Children | 0 (0.0%) | 0 (0.0%) |
| 3 or 4 Children | 0 (0.0%) | 0 (0.0%) |
| 5 or more Children | 0 (0.0%) | 0 (0.0%) |
| Total | 6 (4.7%) | 0 (0.0%) |
Race in Woodland
The most populous races in Woodland are , and White / Caucasian (471 | 100.0%).
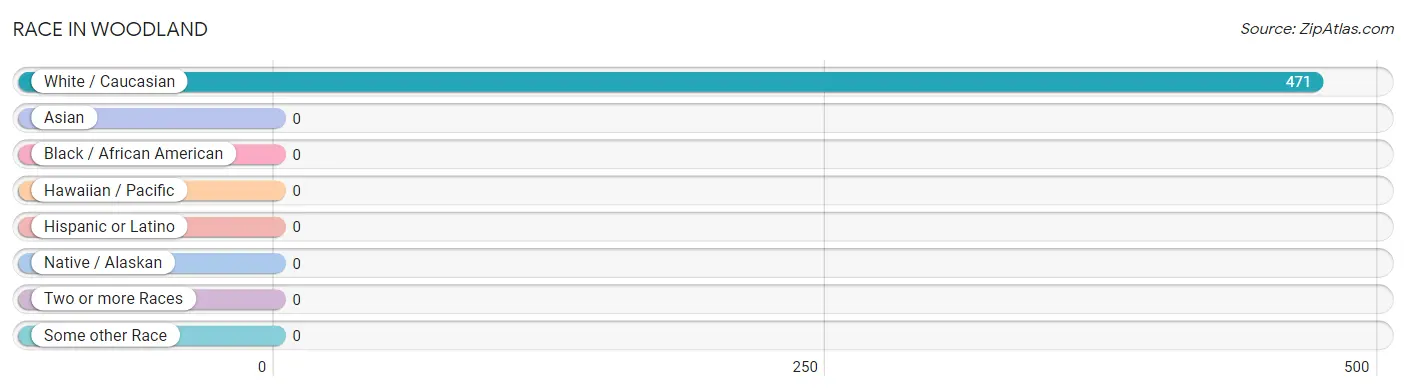
| Race | # Population | % Population |
| Asian | 0 | 0.0% |
| Black / African American | 0 | 0.0% |
| Hawaiian / Pacific | 0 | 0.0% |
| Hispanic or Latino | 0 | 0.0% |
| Native / Alaskan | 0 | 0.0% |
| White / Caucasian | 471 | 100.0% |
| Two or more Races | 0 | 0.0% |
| Some other Race | 0 | 0.0% |
| Total | 471 | 100.0% |
Ancestry in Woodland
The most populous ancestries reported in Woodland are English (95 | 20.2%), Scotch-Irish (37 | 7.9%), German (24 | 5.1%), Irish (21 | 4.5%), and Italian (18 | 3.8%), together accounting for 41.4% of all Woodland residents.
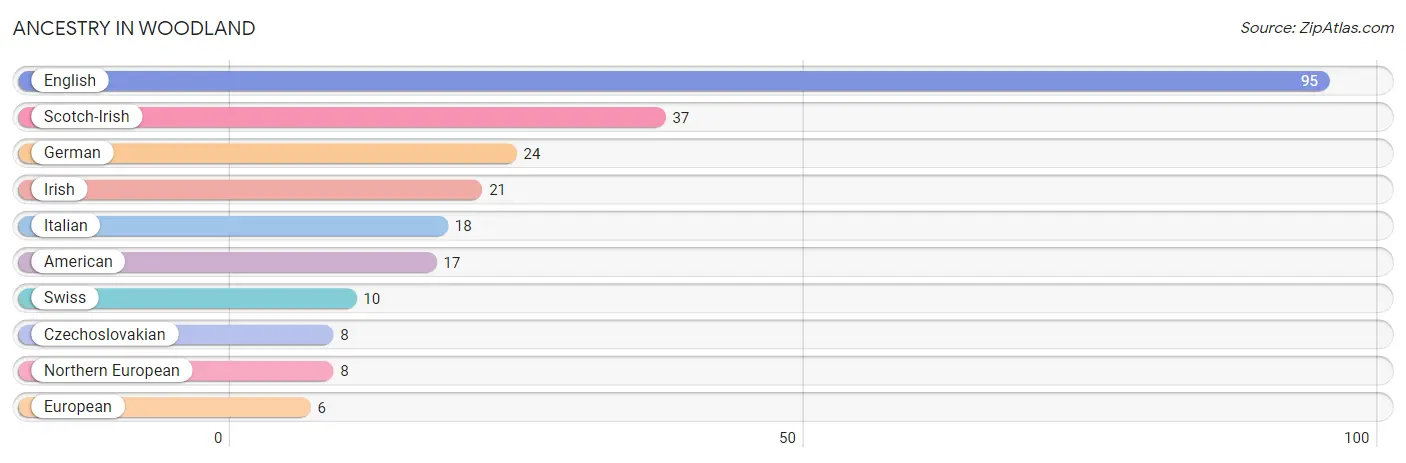
| Ancestry | # Population | % Population |
| American | 17 | 3.6% |
| Czechoslovakian | 8 | 1.7% |
| English | 95 | 20.2% |
| European | 6 | 1.3% |
| German | 24 | 5.1% |
| Irish | 21 | 4.5% |
| Italian | 18 | 3.8% |
| Northern European | 8 | 1.7% |
| Scotch-Irish | 37 | 7.9% |
| Swiss | 10 | 2.1% | View All 10 Rows |
Immigrants in Woodland

| Immigration Origin | # Population | % Population | View All 0 Rows |
Sex and Age in Woodland
Sex and Age in Woodland
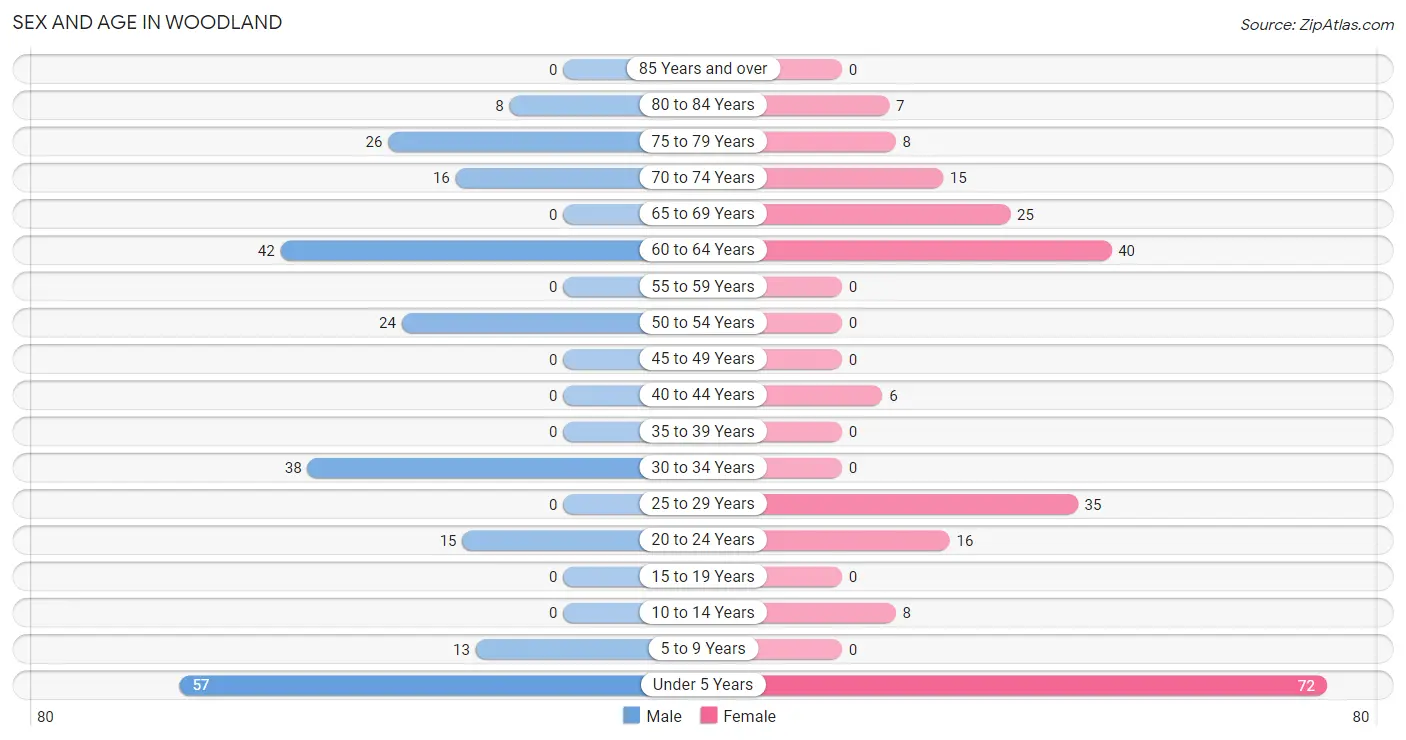
The most populous age groups in Woodland are Under 5 Years (57 | 23.8%) for men and Under 5 Years (72 | 31.0%) for women.
| Age Bracket | Male | Female |
| Under 5 Years | 57 (23.8%) | 72 (31.0%) |
| 5 to 9 Years | 13 (5.4%) | 0 (0.0%) |
| 10 to 14 Years | 0 (0.0%) | 8 (3.5%) |
| 15 to 19 Years | 0 (0.0%) | 0 (0.0%) |
| 20 to 24 Years | 15 (6.3%) | 16 (6.9%) |
| 25 to 29 Years | 0 (0.0%) | 35 (15.1%) |
| 30 to 34 Years | 38 (15.9%) | 0 (0.0%) |
| 35 to 39 Years | 0 (0.0%) | 0 (0.0%) |
| 40 to 44 Years | 0 (0.0%) | 6 (2.6%) |
| 45 to 49 Years | 0 (0.0%) | 0 (0.0%) |
| 50 to 54 Years | 24 (10.0%) | 0 (0.0%) |
| 55 to 59 Years | 0 (0.0%) | 0 (0.0%) |
| 60 to 64 Years | 42 (17.6%) | 40 (17.2%) |
| 65 to 69 Years | 0 (0.0%) | 25 (10.8%) |
| 70 to 74 Years | 16 (6.7%) | 15 (6.5%) |
| 75 to 79 Years | 26 (10.9%) | 8 (3.5%) |
| 80 to 84 Years | 8 (3.4%) | 7 (3.0%) |
| 85 Years and over | 0 (0.0%) | 0 (0.0%) |
| Total | 239 (100.0%) | 232 (100.0%) |
Families and Households in Woodland
Median Family Size in Woodland
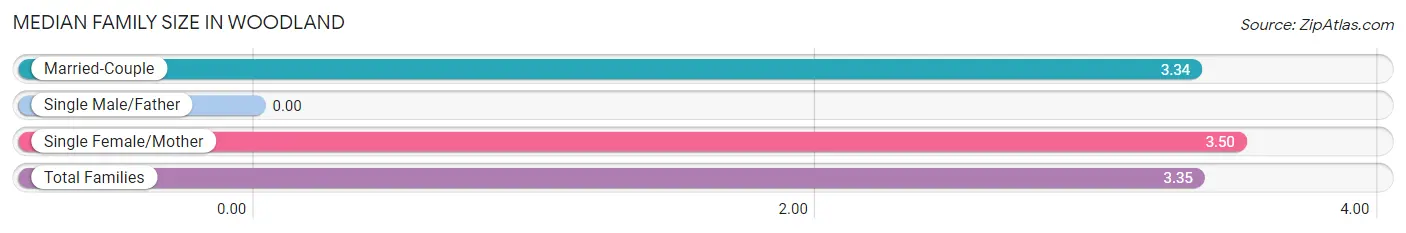
| Family Type | # Families | Family Size |
| Married-Couple | 127 (95.5%) | 3.34 |
| Single Male/Father | 0 (0.0%) | - |
| Single Female/Mother | 6 (4.5%) | 3.50 |
| Total Families | 133 (100.0%) | 3.35 |
Median Household Size in Woodland
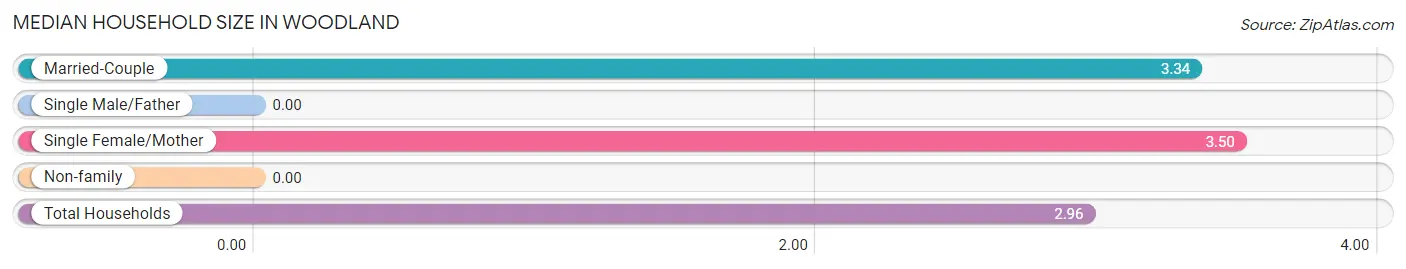
| Household Type | # Households | Household Size |
| Married-Couple | 127 (79.9%) | 3.34 |
| Single Male/Father | 0 (0.0%) | - |
| Single Female/Mother | 6 (3.8%) | 3.50 |
| Non-family | 26 (16.4%) | - |
| Total Households | 159 (100.0%) | 2.96 |
Household Size by Marriage Status in Woodland
Out of a total of 159 households in Woodland, 133 (83.7%) are family households, while 26 (16.4%) are nonfamily households. The most numerous type of family households are 2-person households, comprising 64, and the most common type of nonfamily households are 1-person households, comprising 26.
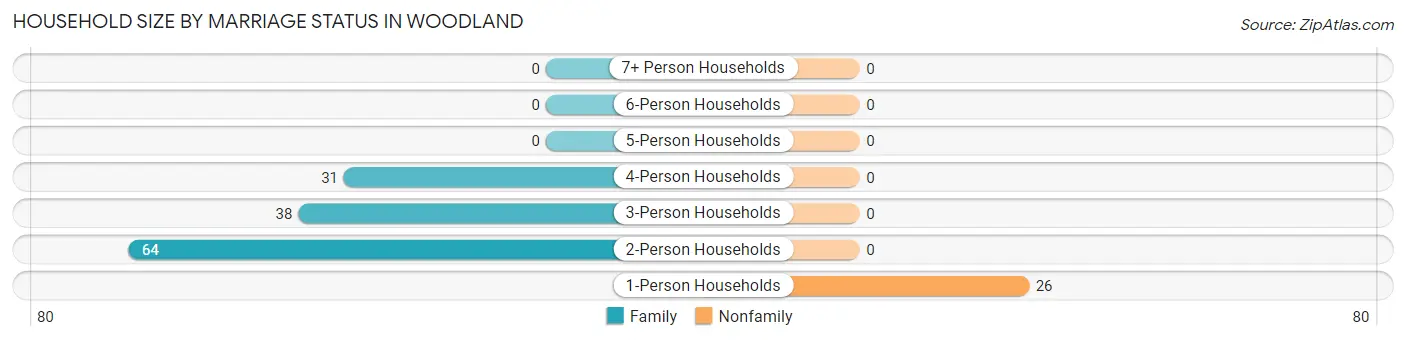
| Household Size | Family Households | Nonfamily Households |
| 1-Person Households | - | 26 (16.4%) |
| 2-Person Households | 64 (40.3%) | 0 (0.0%) |
| 3-Person Households | 38 (23.9%) | 0 (0.0%) |
| 4-Person Households | 31 (19.5%) | 0 (0.0%) |
| 5-Person Households | 0 (0.0%) | 0 (0.0%) |
| 6-Person Households | 0 (0.0%) | 0 (0.0%) |
| 7+ Person Households | 0 (0.0%) | 0 (0.0%) |
| Total | 133 (83.7%) | 26 (16.4%) |
Female Fertility in Woodland
Fertility by Age in Woodland
Average fertility rate in Woodland is 281.0 births per 1,000 women. Women in the age bracket of 20 to 34 years have the highest fertility rate with 314.0 births per 1,000 women. Women in the age bracket of 20 to 34 years acount for 100.0% of all women with births.
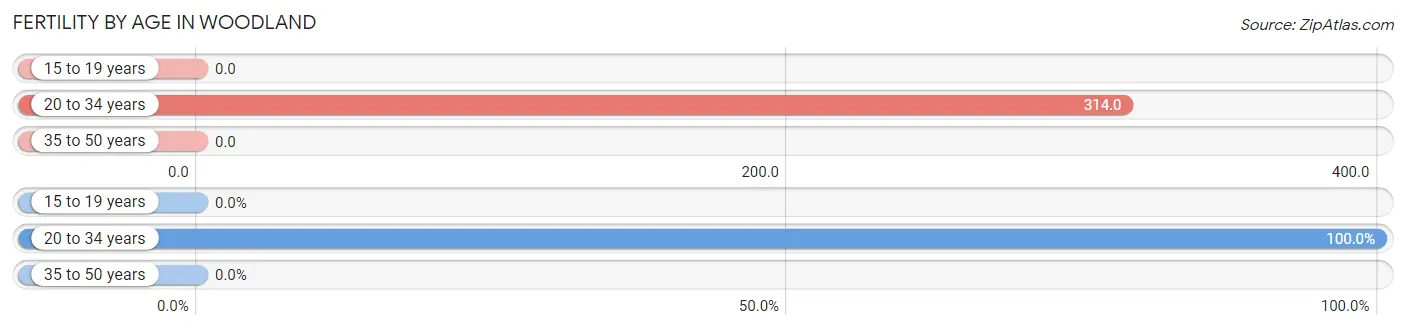
| Age Bracket | Women with Births | Births / 1,000 Women |
| 15 to 19 years | 0 (0.0%) | 0.0 |
| 20 to 34 years | 16 (100.0%) | 314.0 |
| 35 to 50 years | 0 (0.0%) | 0.0 |
| Total | 16 (100.0%) | 281.0 |
Fertility by Age by Marriage Status in Woodland
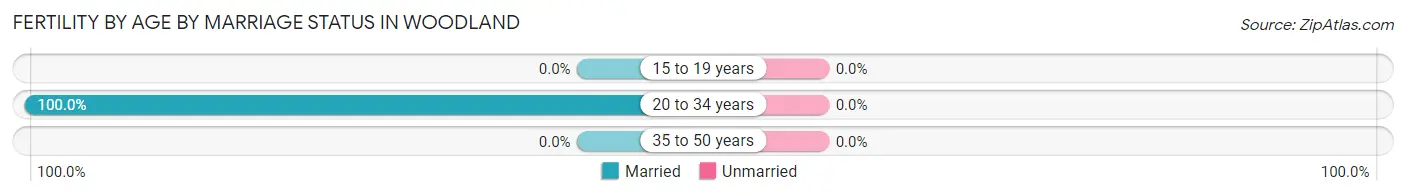
| Age Bracket | Married | Unmarried |
| 15 to 19 years | 0 (0.0%) | 0 (0.0%) |
| 20 to 34 years | 16 (100.0%) | 0 (0.0%) |
| 35 to 50 years | 0 (0.0%) | 0 (0.0%) |
| Total | 16 (100.0%) | 0 (0.0%) |
Fertility by Education in Woodland
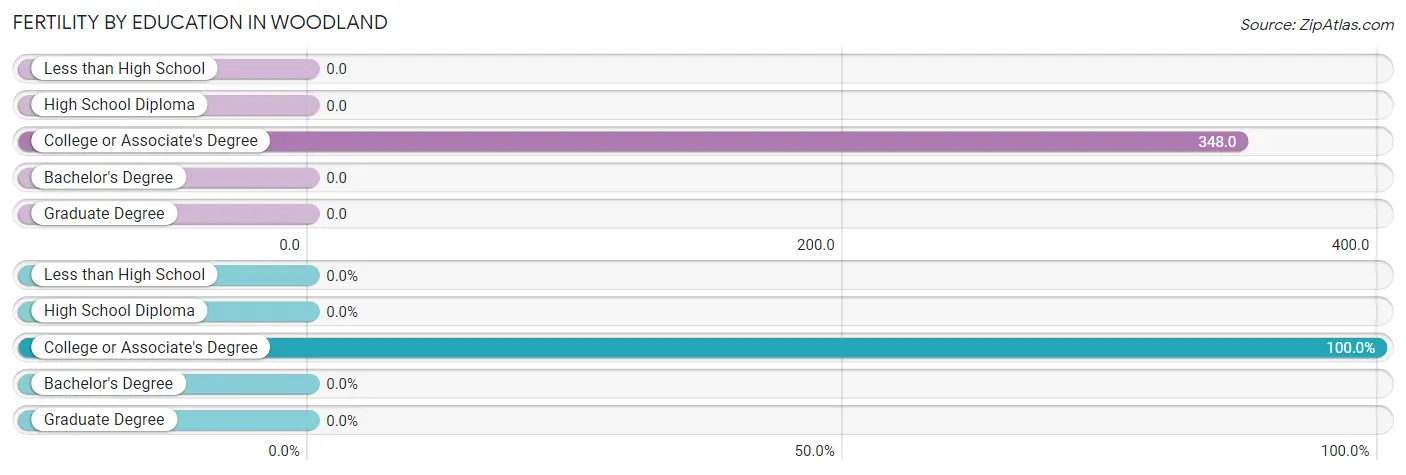
| Educational Attainment | Women with Births | Births / 1,000 Women |
| Less than High School | 0 (0.0%) | 0.0 |
| High School Diploma | 0 (0.0%) | 0.0 |
| College or Associate's Degree | 16 (100.0%) | 348.0 |
| Bachelor's Degree | 0 (0.0%) | 0.0 |
| Graduate Degree | 0 (0.0%) | 0.0 |
| Total | 16 (100.0%) | 281.0 |
Fertility by Education by Marriage Status in Woodland
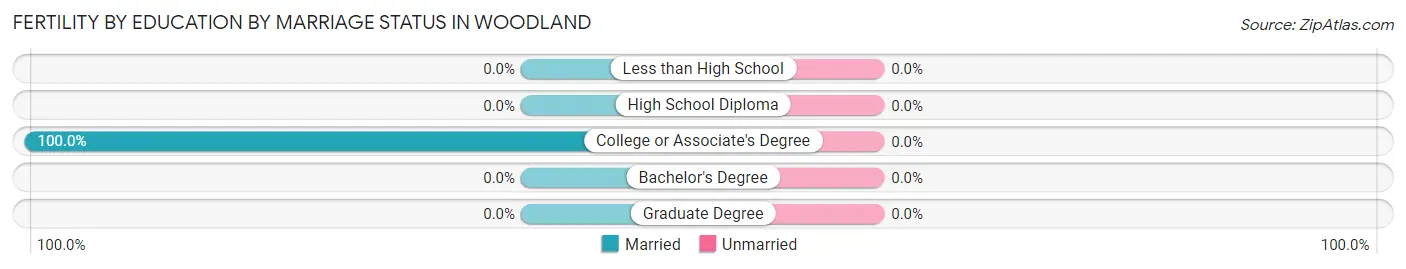
| Educational Attainment | Married | Unmarried |
| Less than High School | 0 (0.0%) | 0 (0.0%) |
| High School Diploma | 0 (0.0%) | 0 (0.0%) |
| College or Associate's Degree | 16 (100.0%) | 0 (0.0%) |
| Bachelor's Degree | 0 (0.0%) | 0 (0.0%) |
| Graduate Degree | 0 (0.0%) | 0 (0.0%) |
| Total | 16 (100.0%) | 0 (0.0%) |
Employment Characteristics in Woodland
Employment by Class of Employer in Woodland
Among the 126 employed individuals in Woodland, local government employees (67 | 53.2%), private company employees (25 | 19.8%), and not-for-profit organizations (15 | 11.9%) make up the most common classes of employment.
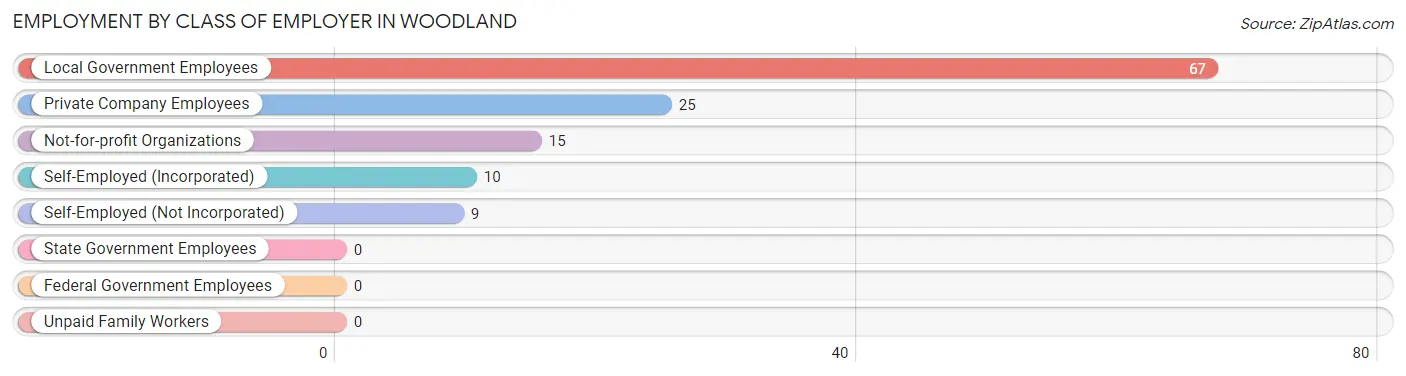
| Employer Class | # Employees | % Employees |
| Private Company Employees | 25 | 19.8% |
| Self-Employed (Incorporated) | 10 | 7.9% |
| Self-Employed (Not Incorporated) | 9 | 7.1% |
| Not-for-profit Organizations | 15 | 11.9% |
| Local Government Employees | 67 | 53.2% |
| State Government Employees | 0 | 0.0% |
| Federal Government Employees | 0 | 0.0% |
| Unpaid Family Workers | 0 | 0.0% |
| Total | 126 | 100.0% |
Employment Status by Age in Woodland
According to the labor force statistics for Woodland, out of the total population over 16 years of age (321), 43.6% or 140 individuals are in the labor force, with 10.0% or 14 of them unemployed. The age group with the highest labor force participation rate is 30 to 34 years, with 100.0% or 38 individuals in the labor force. Within the labor force, the 65 to 74 years age range has the highest percentage of unemployed individuals, with 33.3% or 9 of them being unemployed.
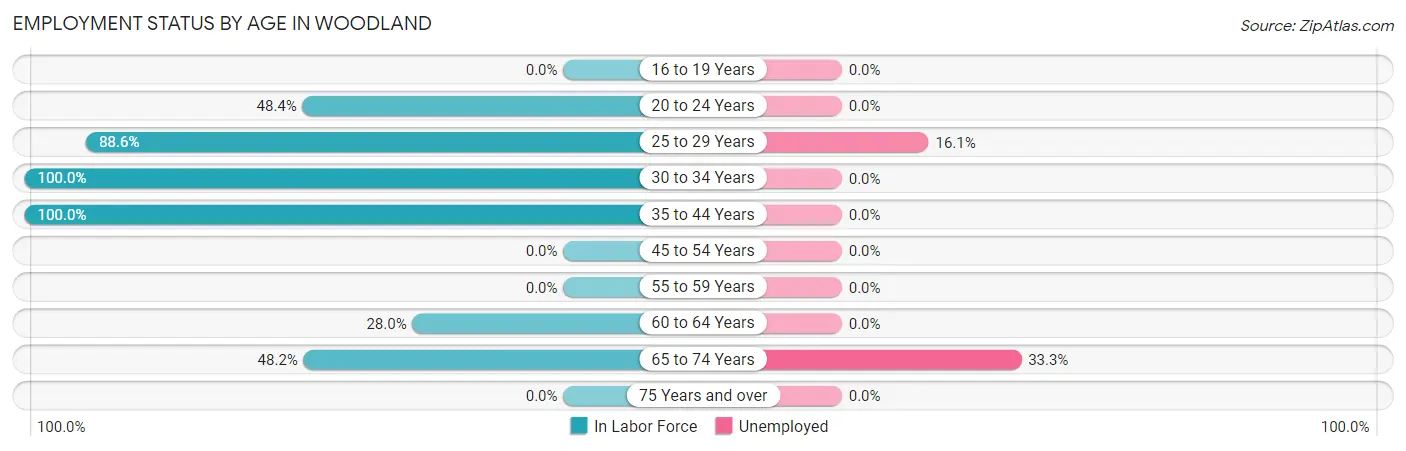
| Age Bracket | In Labor Force | Unemployed |
| 16 to 19 Years | 0 (0.0%) | 0 (0.0%) |
| 20 to 24 Years | 15 (48.4%) | 0 (0.0%) |
| 25 to 29 Years | 31 (88.6%) | 5 (16.1%) |
| 30 to 34 Years | 38 (100.0%) | 0 (0.0%) |
| 35 to 44 Years | 6 (100.0%) | 0 (0.0%) |
| 45 to 54 Years | 0 (0.0%) | 0 (0.0%) |
| 55 to 59 Years | 0 (0.0%) | 0 (0.0%) |
| 60 to 64 Years | 23 (28.0%) | 0 (0.0%) |
| 65 to 74 Years | 27 (48.2%) | 9 (33.3%) |
| 75 Years and over | 0 (0.0%) | 0 (0.0%) |
| Total | 140 (43.6%) | 14 (10.0%) |
Employment Status by Educational Attainment in Woodland
According to labor force statistics for Woodland, 53.0% of individuals (98) out of the total population between 25 and 64 years of age (185) are in the labor force, with 5.1% or 5 of them being unemployed. The group with the highest labor force participation rate are those with the educational attainment of less than high school, with 100.0% or 5 individuals in the labor force. Within the labor force, individuals with less than high school education have the highest percentage of unemployment, with 100.0% or 5 of them being unemployed.
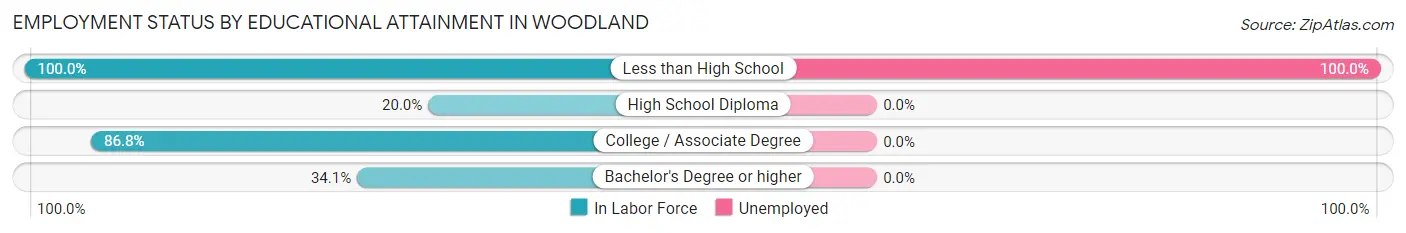
| Educational Attainment | In Labor Force | Unemployed |
| Less than High School | 5 (100.0%) | 5 (100.0%) |
| High School Diploma | 12 (20.0%) | 0 (0.0%) |
| College / Associate Degree | 66 (86.8%) | 0 (0.0%) |
| Bachelor's Degree or higher | 15 (34.1%) | 0 (0.0%) |
| Total | 98 (53.0%) | 9 (5.1%) |
Employment Occupations by Sex in Woodland
Management, Business, Science and Arts Occupations
The most common Management, Business, Science and Arts occupations in Woodland are Management (12 | 9.5%), Business & Financial (9 | 7.1%), Community & Social Service (6 | 4.8%), and Education Instruction & Library (6 | 4.8%).
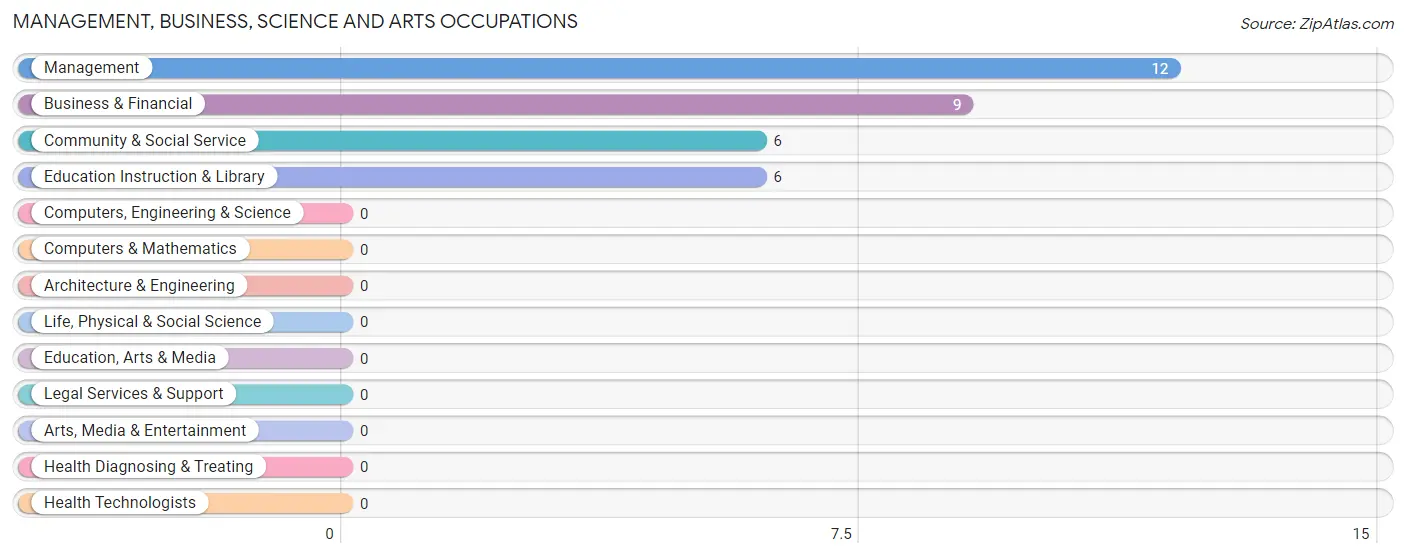
Management, Business, Science and Arts Occupations by Sex
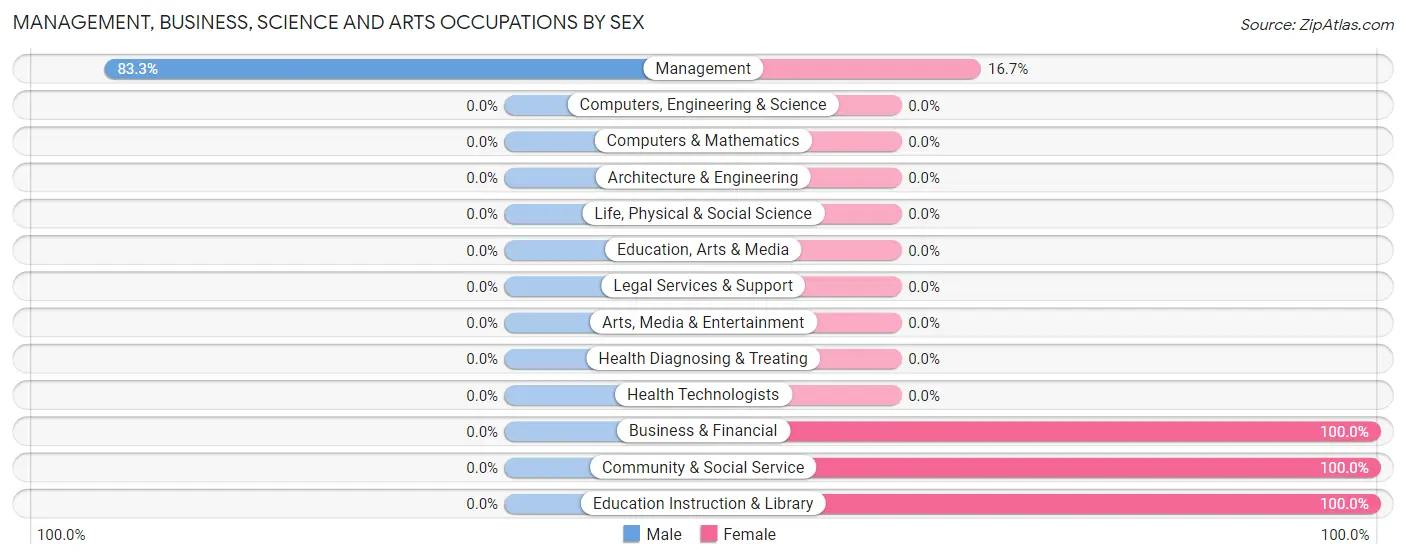
| Occupation | Male | Female |
| Management | 10 (83.3%) | 2 (16.7%) |
| Business & Financial | 0 (0.0%) | 9 (100.0%) |
| Computers, Engineering & Science | 0 (0.0%) | 0 (0.0%) |
| Computers & Mathematics | 0 (0.0%) | 0 (0.0%) |
| Architecture & Engineering | 0 (0.0%) | 0 (0.0%) |
| Life, Physical & Social Science | 0 (0.0%) | 0 (0.0%) |
| Community & Social Service | 0 (0.0%) | 6 (100.0%) |
| Education, Arts & Media | 0 (0.0%) | 0 (0.0%) |
| Legal Services & Support | 0 (0.0%) | 0 (0.0%) |
| Education Instruction & Library | 0 (0.0%) | 6 (100.0%) |
| Arts, Media & Entertainment | 0 (0.0%) | 0 (0.0%) |
| Health Diagnosing & Treating | 0 (0.0%) | 0 (0.0%) |
| Health Technologists | 0 (0.0%) | 0 (0.0%) |
| Total (Category) | 10 (37.0%) | 17 (63.0%) |
| Total (Overall) | 66 (52.4%) | 60 (47.6%) |
Services Occupations
The most common Services occupations in Woodland are Security & Protection (26 | 20.6%), and Law Enforcement (26 | 20.6%).
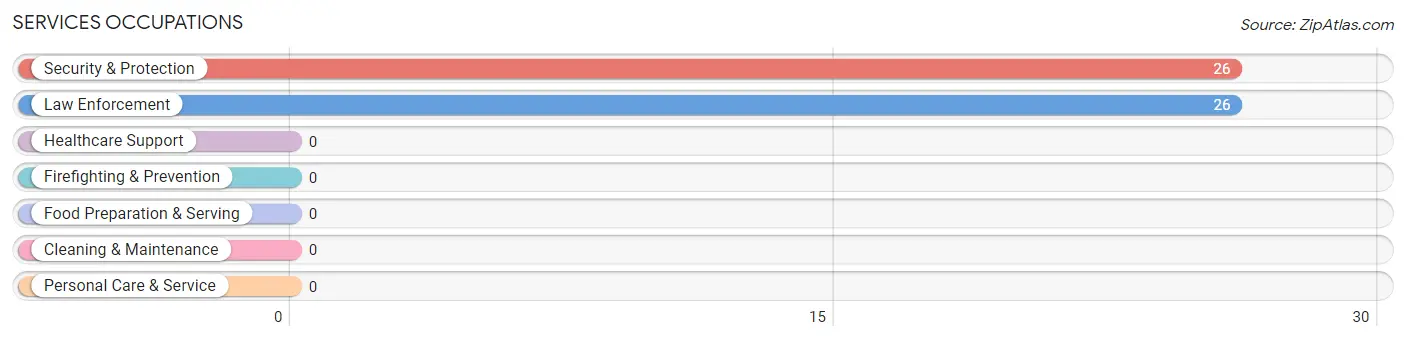
Services Occupations by Sex
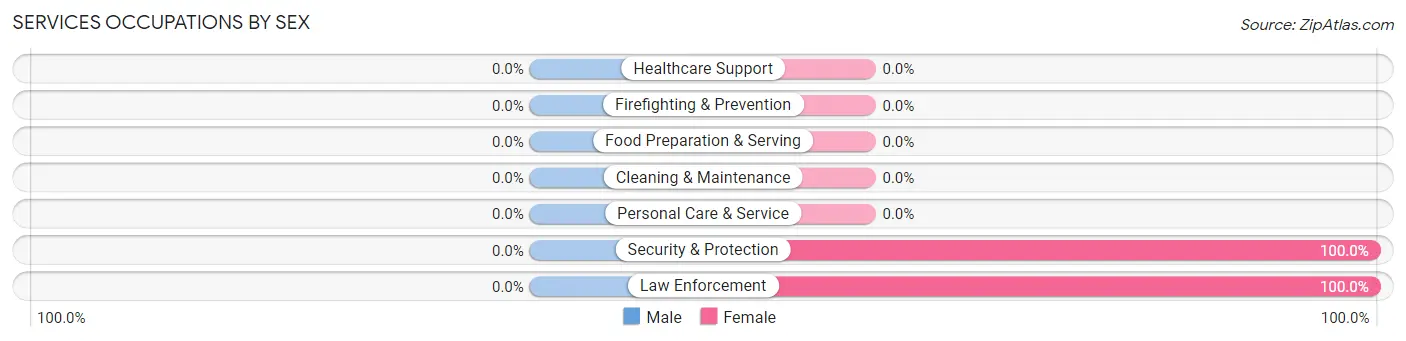
| Occupation | Male | Female |
| Healthcare Support | 0 (0.0%) | 0 (0.0%) |
| Security & Protection | 0 (0.0%) | 26 (100.0%) |
| Firefighting & Prevention | 0 (0.0%) | 0 (0.0%) |
| Law Enforcement | 0 (0.0%) | 26 (100.0%) |
| Food Preparation & Serving | 0 (0.0%) | 0 (0.0%) |
| Cleaning & Maintenance | 0 (0.0%) | 0 (0.0%) |
| Personal Care & Service | 0 (0.0%) | 0 (0.0%) |
| Total (Category) | 0 (0.0%) | 26 (100.0%) |
| Total (Overall) | 66 (52.4%) | 60 (47.6%) |
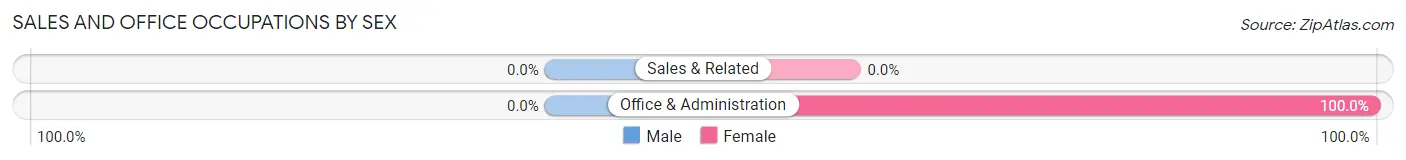
Sales and Office Occupations
The most common Sales and Office occupations in Woodland are , and Office & Administration (17 | 13.5%).
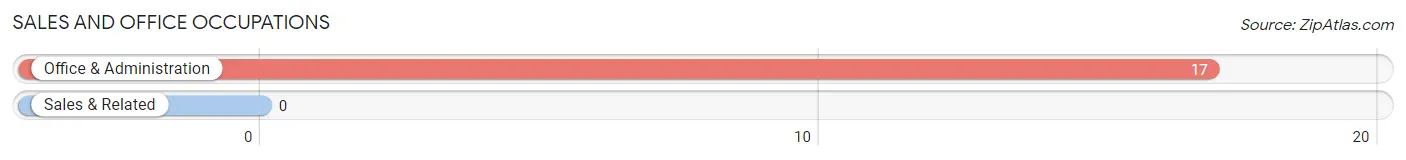
Sales and Office Occupations by Sex
| Occupation | Male | Female |
| Sales & Related | 0 (0.0%) | 0 (0.0%) |
| Office & Administration | 0 (0.0%) | 17 (100.0%) |
| Total (Category) | 0 (0.0%) | 17 (100.0%) |
| Total (Overall) | 66 (52.4%) | 60 (47.6%) |
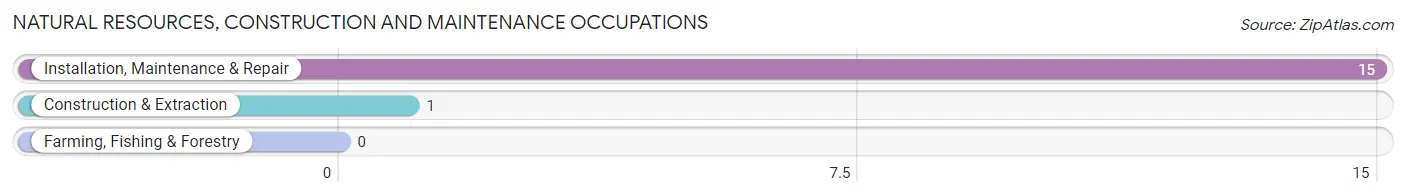
Natural Resources, Construction and Maintenance Occupations
The most common Natural Resources, Construction and Maintenance occupations in Woodland are Installation, Maintenance & Repair (15 | 11.9%), and Construction & Extraction (1 | 0.8%).
Natural Resources, Construction and Maintenance Occupations by Sex
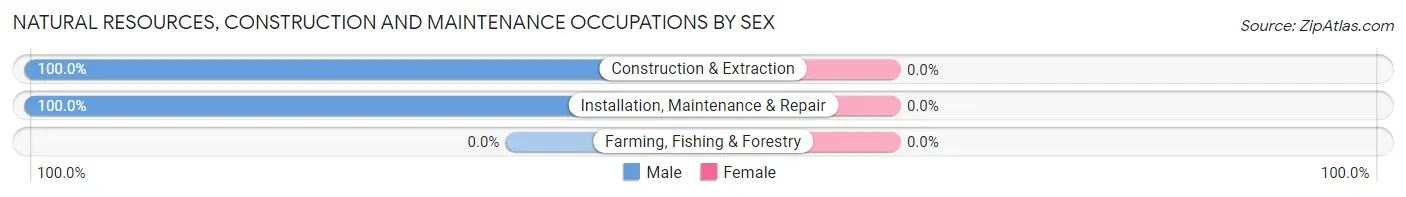
| Occupation | Male | Female |
| Farming, Fishing & Forestry | 0 (0.0%) | 0 (0.0%) |
| Construction & Extraction | 1 (100.0%) | 0 (0.0%) |
| Installation, Maintenance & Repair | 15 (100.0%) | 0 (0.0%) |
| Total (Category) | 16 (100.0%) | 0 (0.0%) |
| Total (Overall) | 66 (52.4%) | 60 (47.6%) |
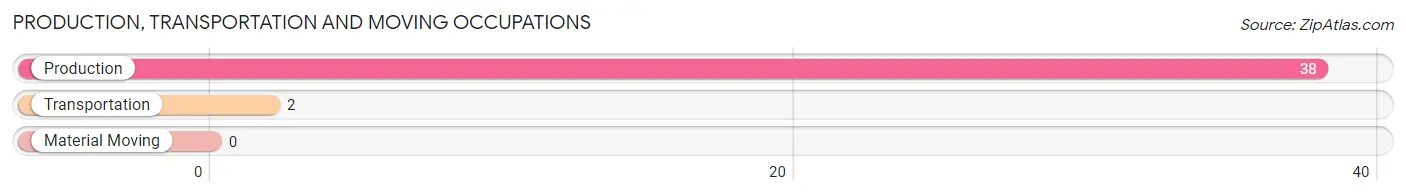
Production, Transportation and Moving Occupations
The most common Production, Transportation and Moving occupations in Woodland are Production (38 | 30.2%), and Transportation (2 | 1.6%).
Production, Transportation and Moving Occupations by Sex
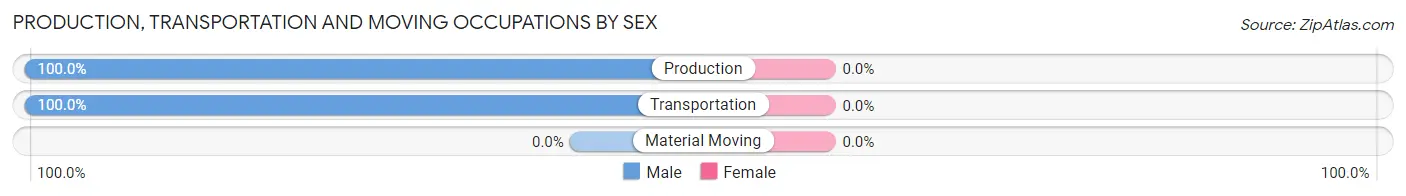
| Occupation | Male | Female |
| Production | 38 (100.0%) | 0 (0.0%) |
| Transportation | 2 (100.0%) | 0 (0.0%) |
| Material Moving | 0 (0.0%) | 0 (0.0%) |
| Total (Category) | 40 (100.0%) | 0 (0.0%) |
| Total (Overall) | 66 (52.4%) | 60 (47.6%) |
Employment Industries by Sex in Woodland
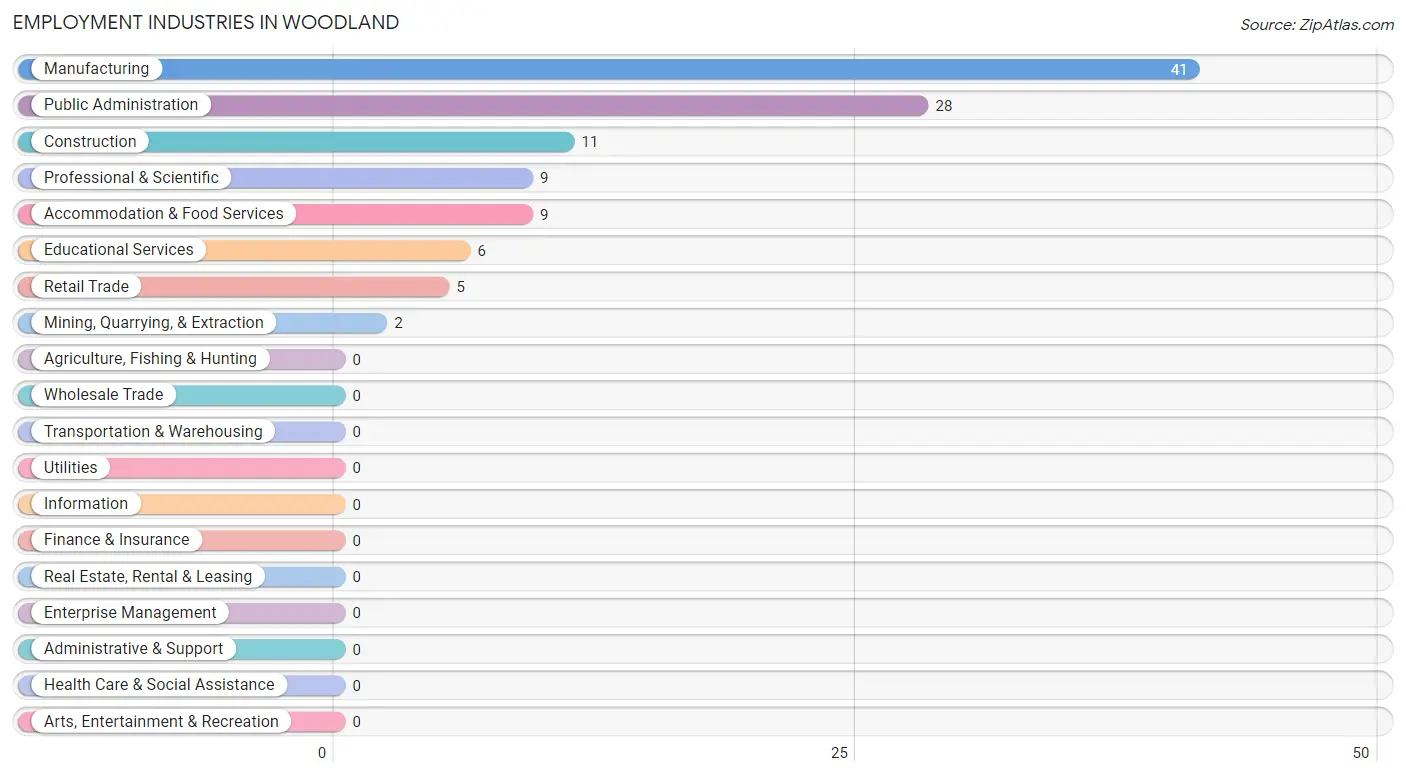
Employment Industries in Woodland
The major employment industries in Woodland include Manufacturing (41 | 32.5%), Public Administration (28 | 22.2%), Construction (11 | 8.7%), Professional & Scientific (9 | 7.1%), and Accommodation & Food Services (9 | 7.1%).
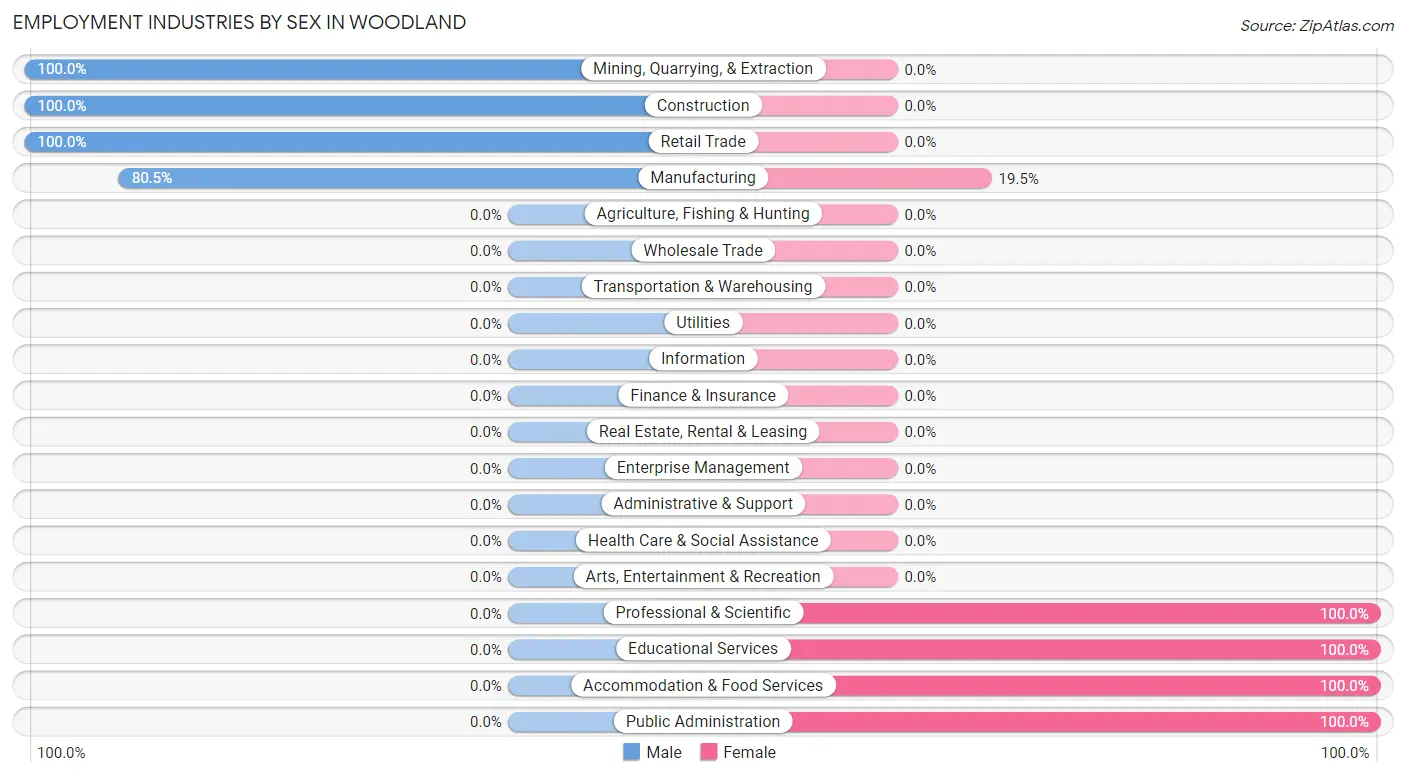
Employment Industries by Sex in Woodland
The Woodland industries that see more men than women are Mining, Quarrying, & Extraction (100.0%), Construction (100.0%), and Retail Trade (100.0%), whereas the industries that tend to have a higher number of women are Professional & Scientific (100.0%), Educational Services (100.0%), and Accommodation & Food Services (100.0%).
| Industry | Male | Female |
| Agriculture, Fishing & Hunting | 0 (0.0%) | 0 (0.0%) |
| Mining, Quarrying, & Extraction | 2 (100.0%) | 0 (0.0%) |
| Construction | 11 (100.0%) | 0 (0.0%) |
| Manufacturing | 33 (80.5%) | 8 (19.5%) |
| Wholesale Trade | 0 (0.0%) | 0 (0.0%) |
| Retail Trade | 5 (100.0%) | 0 (0.0%) |
| Transportation & Warehousing | 0 (0.0%) | 0 (0.0%) |
| Utilities | 0 (0.0%) | 0 (0.0%) |
| Information | 0 (0.0%) | 0 (0.0%) |
| Finance & Insurance | 0 (0.0%) | 0 (0.0%) |
| Real Estate, Rental & Leasing | 0 (0.0%) | 0 (0.0%) |
| Professional & Scientific | 0 (0.0%) | 9 (100.0%) |
| Enterprise Management | 0 (0.0%) | 0 (0.0%) |
| Administrative & Support | 0 (0.0%) | 0 (0.0%) |
| Educational Services | 0 (0.0%) | 6 (100.0%) |
| Health Care & Social Assistance | 0 (0.0%) | 0 (0.0%) |
| Arts, Entertainment & Recreation | 0 (0.0%) | 0 (0.0%) |
| Accommodation & Food Services | 0 (0.0%) | 9 (100.0%) |
| Public Administration | 0 (0.0%) | 28 (100.0%) |
| Total | 66 (52.4%) | 60 (47.6%) |
Education in Woodland
School Enrollment in Woodland
The most common levels of schooling among the 70 students in Woodland are nursery / preschool (49 | 70.0%), middle school (8 | 11.4%), and elementary school (7 | 10.0%).
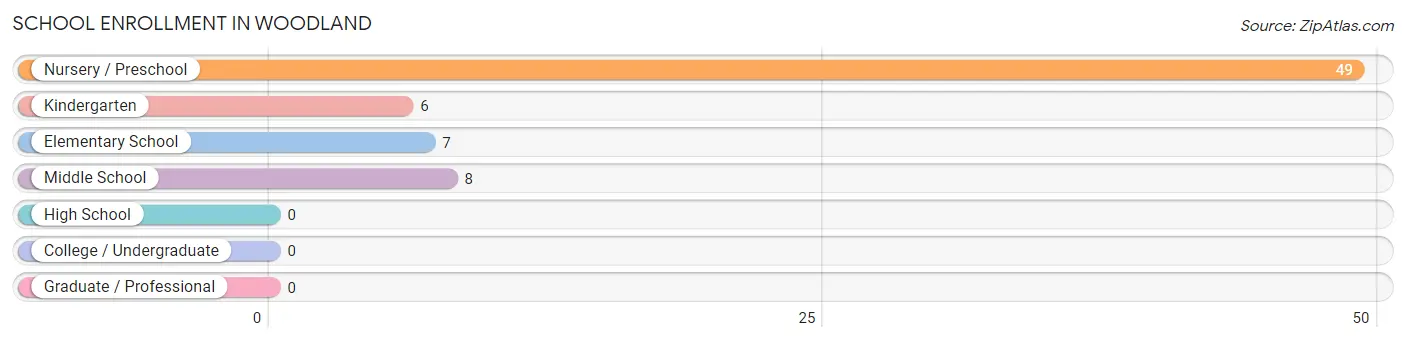
| School Level | # Students | % Students |
| Nursery / Preschool | 49 | 70.0% |
| Kindergarten | 6 | 8.6% |
| Elementary School | 7 | 10.0% |
| Middle School | 8 | 11.4% |
| High School | 0 | 0.0% |
| College / Undergraduate | 0 | 0.0% |
| Graduate / Professional | 0 | 0.0% |
| Total | 70 | 100.0% |
School Enrollment by Age by Funding Source in Woodland
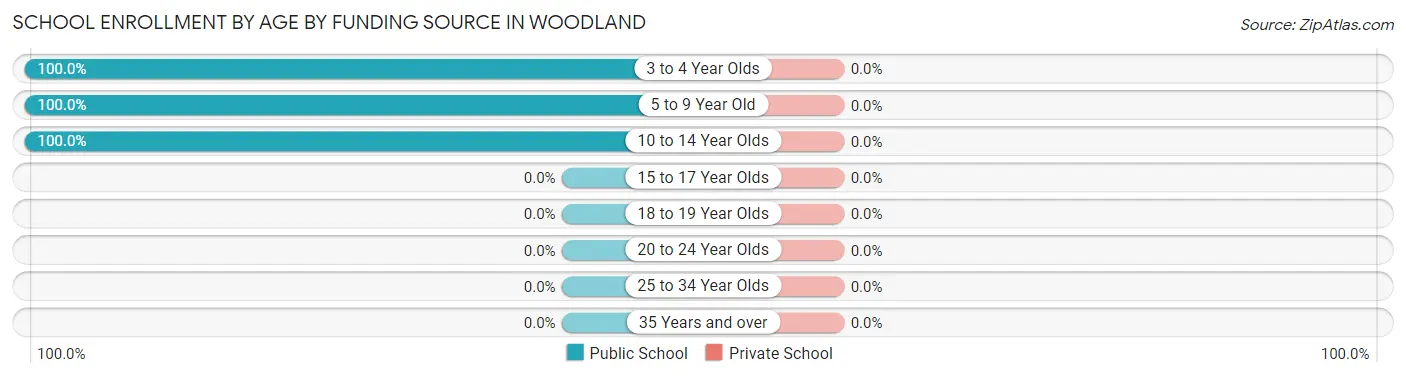
| Age Bracket | Public School | Private School |
| 3 to 4 Year Olds | 49 (100.0%) | 0 (0.0%) |
| 5 to 9 Year Old | 13 (100.0%) | 0 (0.0%) |
| 10 to 14 Year Olds | 8 (100.0%) | 0 (0.0%) |
| 15 to 17 Year Olds | 0 (0.0%) | 0 (0.0%) |
| 18 to 19 Year Olds | 0 (0.0%) | 0 (0.0%) |
| 20 to 24 Year Olds | 0 (0.0%) | 0 (0.0%) |
| 25 to 34 Year Olds | 0 (0.0%) | 0 (0.0%) |
| 35 Years and over | 0 (0.0%) | 0 (0.0%) |
| Total | 70 (100.0%) | 0 (0.0%) |
Educational Attainment by Field of Study in Woodland
Education (46 | 36.8%), literature & languages (26 | 20.8%), arts & humanities (9 | 7.2%), computers & mathematics (8 | 6.4%), and physical & health sciences (8 | 6.4%) are the most common fields of study among 125 individuals in Woodland who have obtained a bachelor's degree or higher.
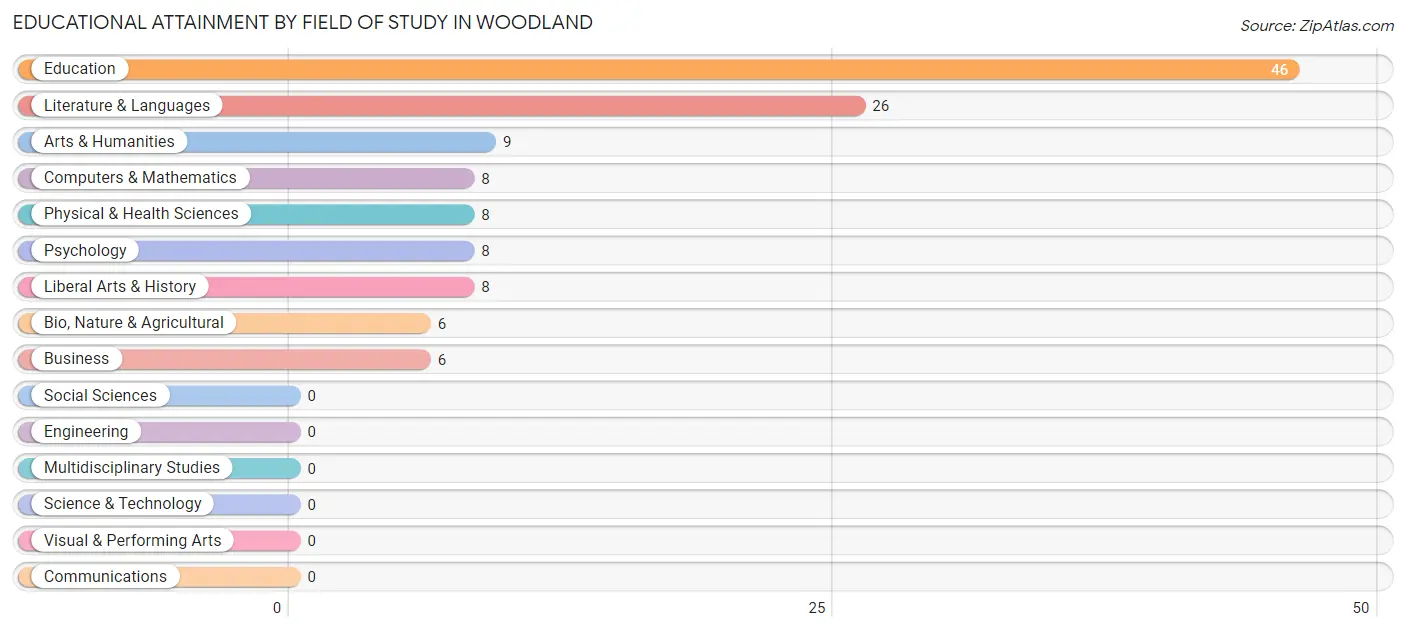
| Field of Study | # Graduates | % Graduates |
| Computers & Mathematics | 8 | 6.4% |
| Bio, Nature & Agricultural | 6 | 4.8% |
| Physical & Health Sciences | 8 | 6.4% |
| Psychology | 8 | 6.4% |
| Social Sciences | 0 | 0.0% |
| Engineering | 0 | 0.0% |
| Multidisciplinary Studies | 0 | 0.0% |
| Science & Technology | 0 | 0.0% |
| Business | 6 | 4.8% |
| Education | 46 | 36.8% |
| Literature & Languages | 26 | 20.8% |
| Liberal Arts & History | 8 | 6.4% |
| Visual & Performing Arts | 0 | 0.0% |
| Communications | 0 | 0.0% |
| Arts & Humanities | 9 | 7.2% |
| Total | 125 | 100.0% |
Transportation & Commute in Woodland
Vehicle Availability by Sex in Woodland
The most prevalent vehicle ownership categories in Woodland are males with 2 vehicles (63, accounting for 95.5%) and females with 2 vehicles (35, making up 105.0%).
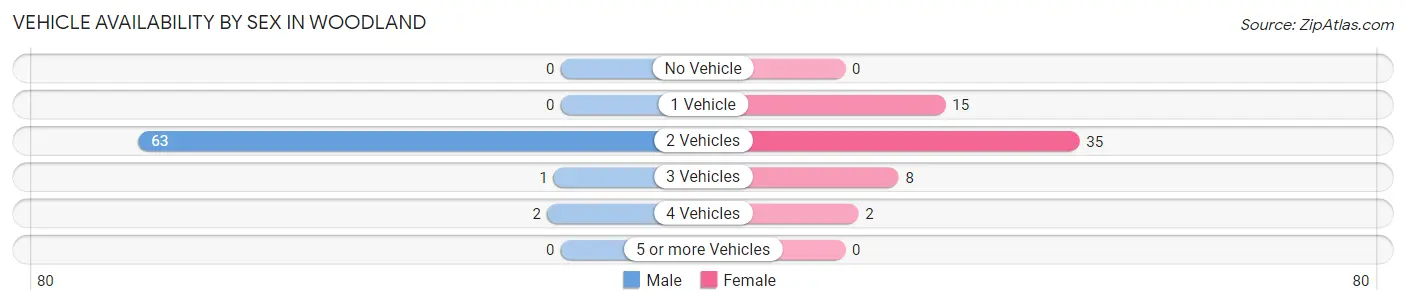
| Vehicles Available | Male | Female |
| No Vehicle | 0 (0.0%) | 0 (0.0%) |
| 1 Vehicle | 0 (0.0%) | 15 (25.0%) |
| 2 Vehicles | 63 (95.5%) | 35 (58.3%) |
| 3 Vehicles | 1 (1.5%) | 8 (13.3%) |
| 4 Vehicles | 2 (3.0%) | 2 (3.3%) |
| 5 or more Vehicles | 0 (0.0%) | 0 (0.0%) |
| Total | 66 (100.0%) | 60 (100.0%) |
Commute Time in Woodland
The most frequently occuring commute durations in Woodland are 20 to 24 minutes (33 commuters, 30.3%), 25 to 29 minutes (26 commuters, 23.8%), and 10 to 14 minutes (15 commuters, 13.8%).
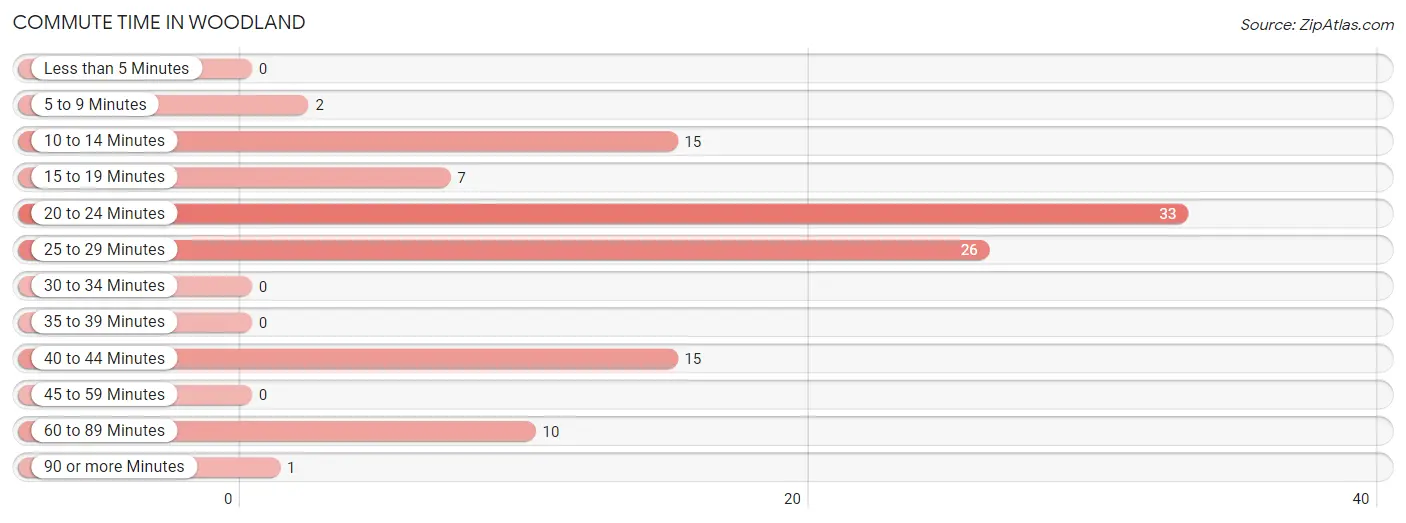
| Commute Time | # Commuters | % Commuters |
| Less than 5 Minutes | 0 | 0.0% |
| 5 to 9 Minutes | 2 | 1.8% |
| 10 to 14 Minutes | 15 | 13.8% |
| 15 to 19 Minutes | 7 | 6.4% |
| 20 to 24 Minutes | 33 | 30.3% |
| 25 to 29 Minutes | 26 | 23.8% |
| 30 to 34 Minutes | 0 | 0.0% |
| 35 to 39 Minutes | 0 | 0.0% |
| 40 to 44 Minutes | 15 | 13.8% |
| 45 to 59 Minutes | 0 | 0.0% |
| 60 to 89 Minutes | 10 | 9.2% |
| 90 or more Minutes | 1 | 0.9% |
Commute Time by Sex in Woodland
The most common commute times in Woodland are 20 to 24 minutes (33 commuters, 50.0%) for males and 25 to 29 minutes (26 commuters, 60.5%) for females.
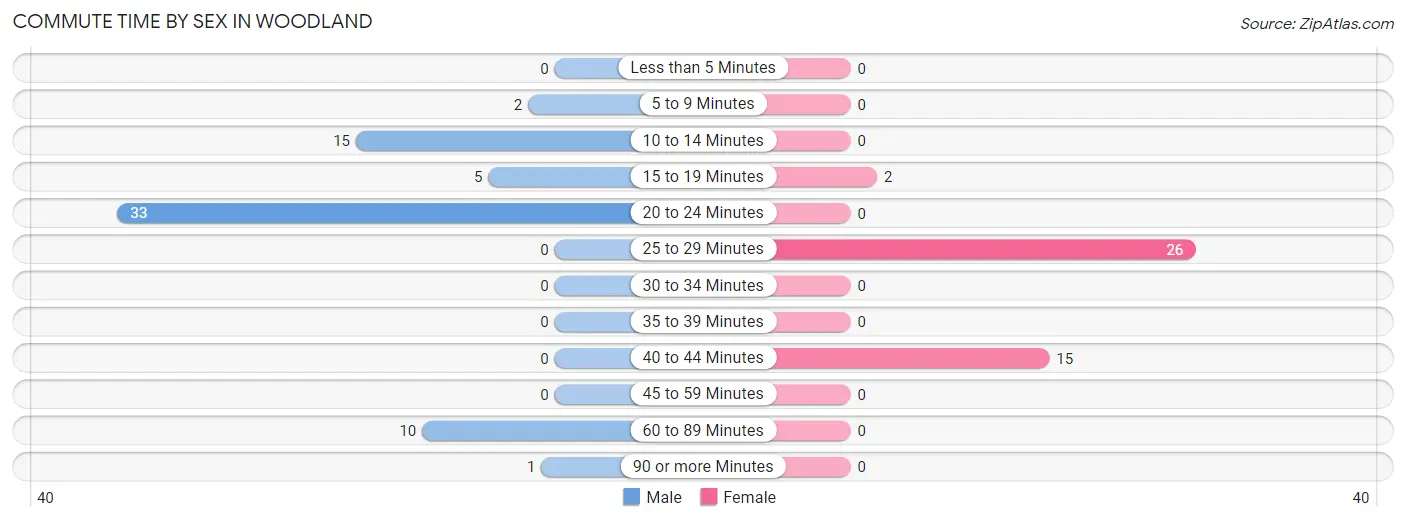
| Commute Time | Male | Female |
| Less than 5 Minutes | 0 (0.0%) | 0 (0.0%) |
| 5 to 9 Minutes | 2 (3.0%) | 0 (0.0%) |
| 10 to 14 Minutes | 15 (22.7%) | 0 (0.0%) |
| 15 to 19 Minutes | 5 (7.6%) | 2 (4.6%) |
| 20 to 24 Minutes | 33 (50.0%) | 0 (0.0%) |
| 25 to 29 Minutes | 0 (0.0%) | 26 (60.5%) |
| 30 to 34 Minutes | 0 (0.0%) | 0 (0.0%) |
| 35 to 39 Minutes | 0 (0.0%) | 0 (0.0%) |
| 40 to 44 Minutes | 0 (0.0%) | 15 (34.9%) |
| 45 to 59 Minutes | 0 (0.0%) | 0 (0.0%) |
| 60 to 89 Minutes | 10 (15.1%) | 0 (0.0%) |
| 90 or more Minutes | 1 (1.5%) | 0 (0.0%) |
Time of Departure to Work by Sex in Woodland
The most frequent times of departure to work in Woodland are 8:00 AM to 8:29 AM (38, 57.6%) for males and 7:00 AM to 7:29 AM (26, 60.5%) for females.
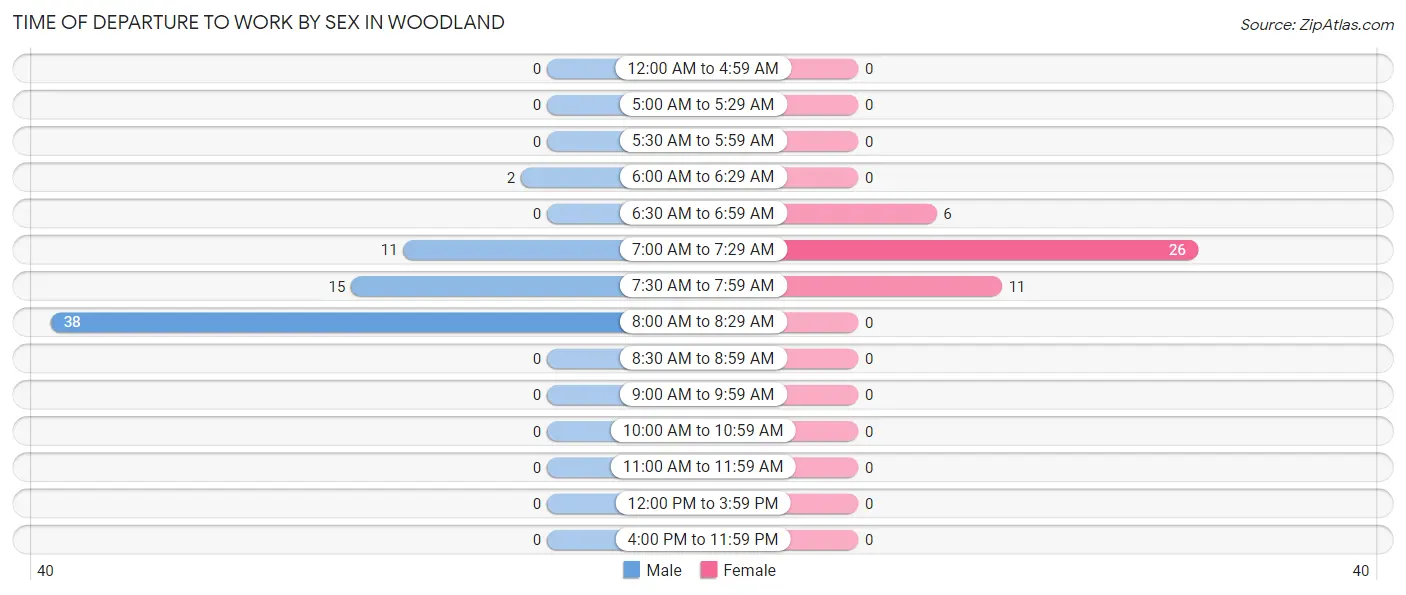
| Time of Departure | Male | Female |
| 12:00 AM to 4:59 AM | 0 (0.0%) | 0 (0.0%) |
| 5:00 AM to 5:29 AM | 0 (0.0%) | 0 (0.0%) |
| 5:30 AM to 5:59 AM | 0 (0.0%) | 0 (0.0%) |
| 6:00 AM to 6:29 AM | 2 (3.0%) | 0 (0.0%) |
| 6:30 AM to 6:59 AM | 0 (0.0%) | 6 (14.0%) |
| 7:00 AM to 7:29 AM | 11 (16.7%) | 26 (60.5%) |
| 7:30 AM to 7:59 AM | 15 (22.7%) | 11 (25.6%) |
| 8:00 AM to 8:29 AM | 38 (57.6%) | 0 (0.0%) |
| 8:30 AM to 8:59 AM | 0 (0.0%) | 0 (0.0%) |
| 9:00 AM to 9:59 AM | 0 (0.0%) | 0 (0.0%) |
| 10:00 AM to 10:59 AM | 0 (0.0%) | 0 (0.0%) |
| 11:00 AM to 11:59 AM | 0 (0.0%) | 0 (0.0%) |
| 12:00 PM to 3:59 PM | 0 (0.0%) | 0 (0.0%) |
| 4:00 PM to 11:59 PM | 0 (0.0%) | 0 (0.0%) |
| Total | 66 (100.0%) | 43 (100.0%) |
Housing Occupancy in Woodland
Occupancy by Ownership in Woodland
Of the total 159 dwellings in Woodland, owner-occupied units account for 132 (83.0%), while renter-occupied units make up 27 (17.0%).
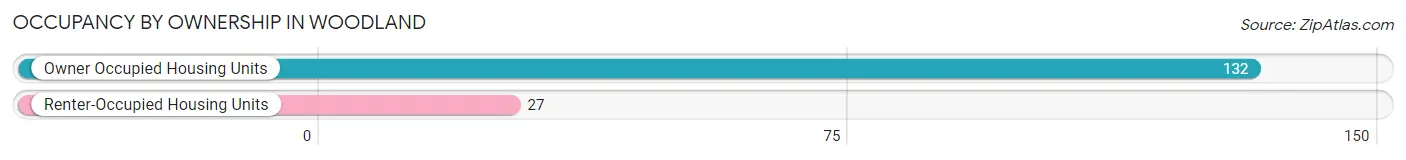
| Occupancy | # Housing Units | % Housing Units |
| Owner Occupied Housing Units | 132 | 83.0% |
| Renter-Occupied Housing Units | 27 | 17.0% |
| Total Occupied Housing Units | 159 | 100.0% |
Occupancy by Household Size in Woodland
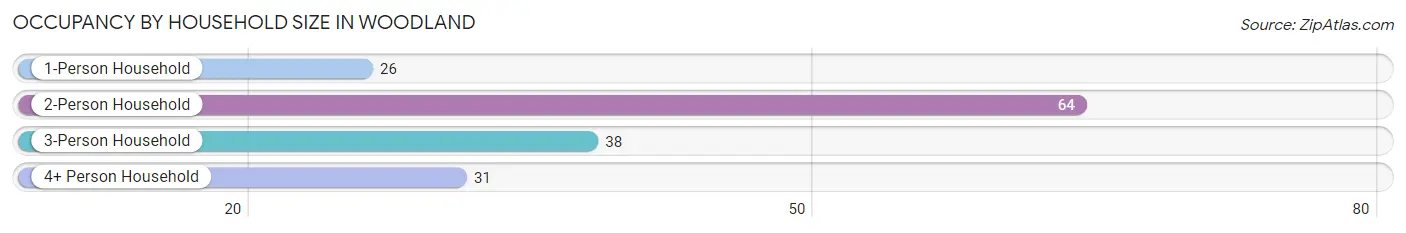
| Household Size | # Housing Units | % Housing Units |
| 1-Person Household | 26 | 16.4% |
| 2-Person Household | 64 | 40.3% |
| 3-Person Household | 38 | 23.9% |
| 4+ Person Household | 31 | 19.5% |
| Total Housing Units | 159 | 100.0% |
Occupancy by Ownership by Household Size in Woodland
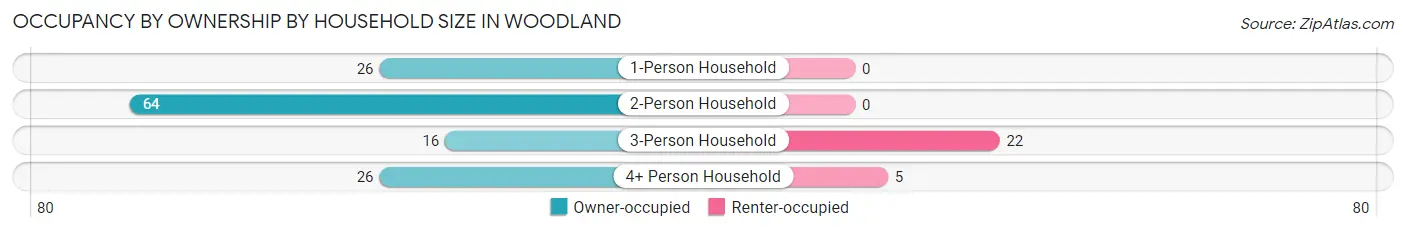
| Household Size | Owner-occupied | Renter-occupied |
| 1-Person Household | 26 (100.0%) | 0 (0.0%) |
| 2-Person Household | 64 (100.0%) | 0 (0.0%) |
| 3-Person Household | 16 (42.1%) | 22 (57.9%) |
| 4+ Person Household | 26 (83.9%) | 5 (16.1%) |
| Total Housing Units | 132 (83.0%) | 27 (17.0%) |
Occupancy by Educational Attainment in Woodland
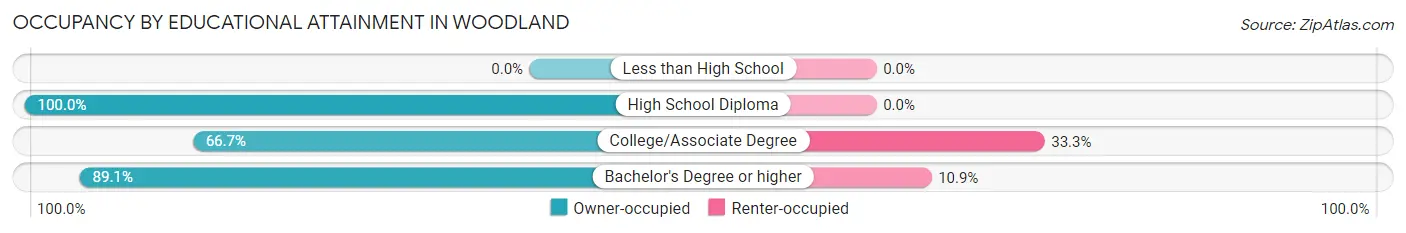
| Household Size | Owner-occupied | Renter-occupied |
| Less than High School | 0 (0.0%) | 0 (0.0%) |
| High School Diploma | 41 (100.0%) | 0 (0.0%) |
| College/Associate Degree | 42 (66.7%) | 21 (33.3%) |
| Bachelor's Degree or higher | 49 (89.1%) | 6 (10.9%) |
Occupancy by Age of Householder in Woodland
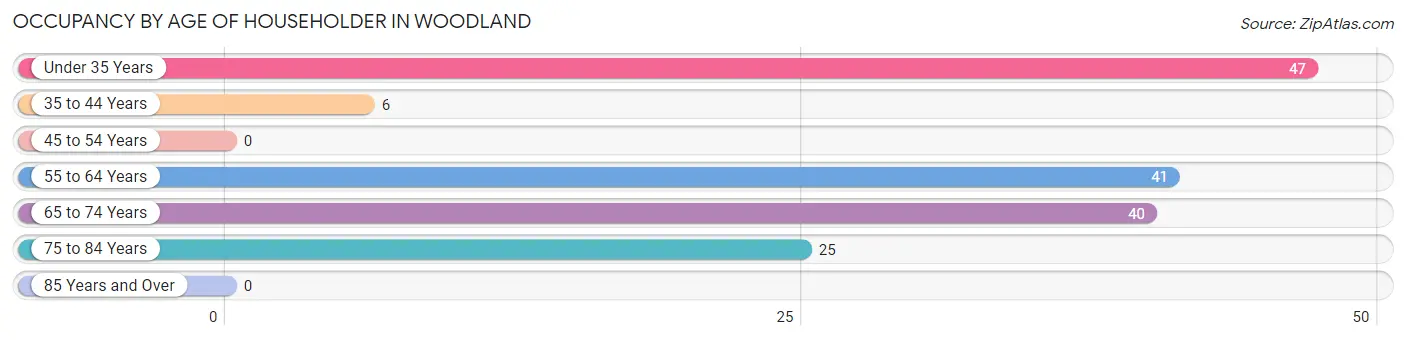
| Age Bracket | # Households | % Households |
| Under 35 Years | 47 | 29.6% |
| 35 to 44 Years | 6 | 3.8% |
| 45 to 54 Years | 0 | 0.0% |
| 55 to 64 Years | 41 | 25.8% |
| 65 to 74 Years | 40 | 25.2% |
| 75 to 84 Years | 25 | 15.7% |
| 85 Years and Over | 0 | 0.0% |
| Total | 159 | 100.0% |
Housing Finances in Woodland
Median Income by Occupancy in Woodland
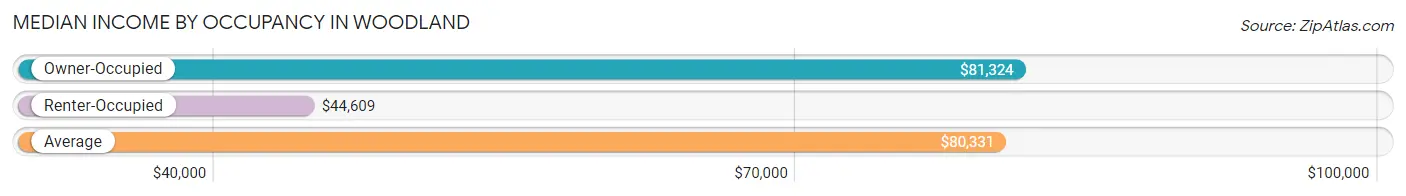
| Occupancy Type | # Households | Median Income |
| Owner-Occupied | 132 (83.0%) | $81,324 |
| Renter-Occupied | 27 (17.0%) | $44,609 |
| Average | 159 (100.0%) | $80,331 |
Occupancy by Householder Income Bracket in Woodland
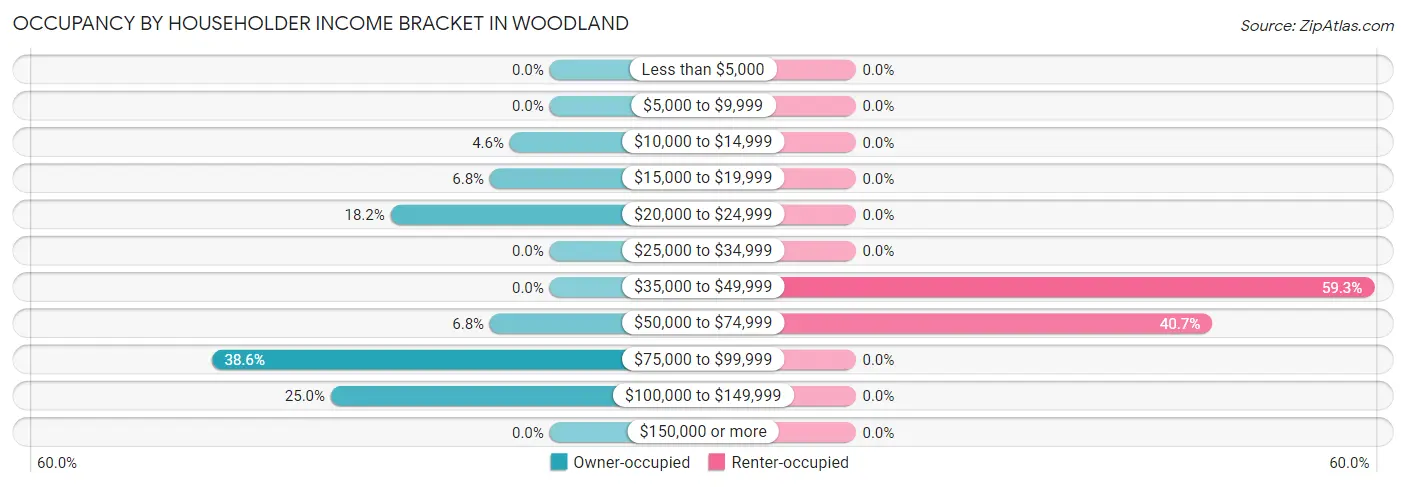
| Income Bracket | Owner-occupied | Renter-occupied |
| Less than $5,000 | 0 (0.0%) | 0 (0.0%) |
| $5,000 to $9,999 | 0 (0.0%) | 0 (0.0%) |
| $10,000 to $14,999 | 6 (4.5%) | 0 (0.0%) |
| $15,000 to $19,999 | 9 (6.8%) | 0 (0.0%) |
| $20,000 to $24,999 | 24 (18.2%) | 0 (0.0%) |
| $25,000 to $34,999 | 0 (0.0%) | 0 (0.0%) |
| $35,000 to $49,999 | 0 (0.0%) | 16 (59.3%) |
| $50,000 to $74,999 | 9 (6.8%) | 11 (40.7%) |
| $75,000 to $99,999 | 51 (38.6%) | 0 (0.0%) |
| $100,000 to $149,999 | 33 (25.0%) | 0 (0.0%) |
| $150,000 or more | 0 (0.0%) | 0 (0.0%) |
| Total | 132 (100.0%) | 27 (100.0%) |
Monthly Housing Cost Tiers in Woodland
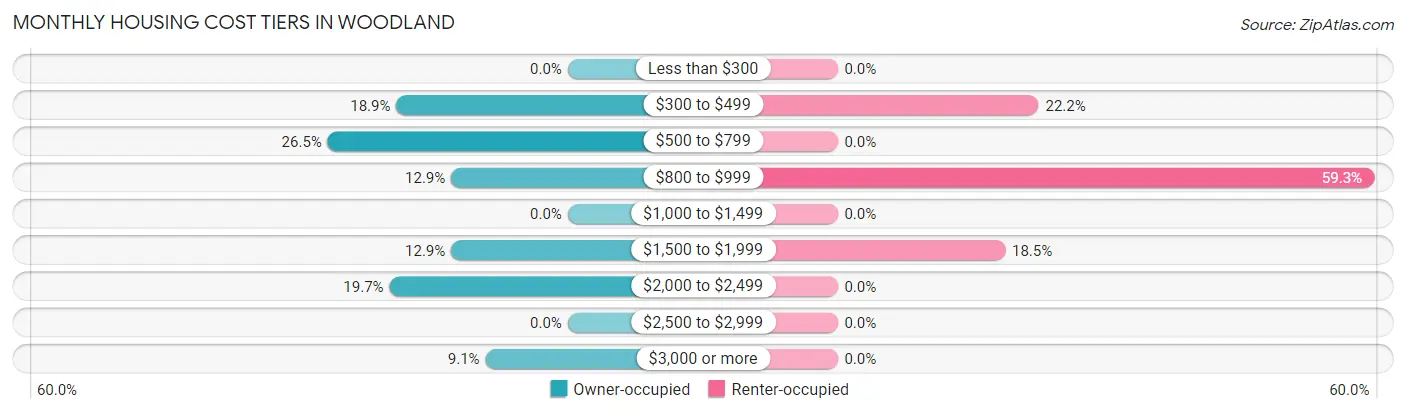
| Monthly Cost | Owner-occupied | Renter-occupied |
| Less than $300 | 0 (0.0%) | 0 (0.0%) |
| $300 to $499 | 25 (18.9%) | 6 (22.2%) |
| $500 to $799 | 35 (26.5%) | 0 (0.0%) |
| $800 to $999 | 17 (12.9%) | 16 (59.3%) |
| $1,000 to $1,499 | 0 (0.0%) | 0 (0.0%) |
| $1,500 to $1,999 | 17 (12.9%) | 5 (18.5%) |
| $2,000 to $2,499 | 26 (19.7%) | 0 (0.0%) |
| $2,500 to $2,999 | 0 (0.0%) | 0 (0.0%) |
| $3,000 or more | 12 (9.1%) | 0 (0.0%) |
| Total | 132 (100.0%) | 27 (100.0%) |
Physical Housing Characteristics in Woodland
Housing Structures in Woodland
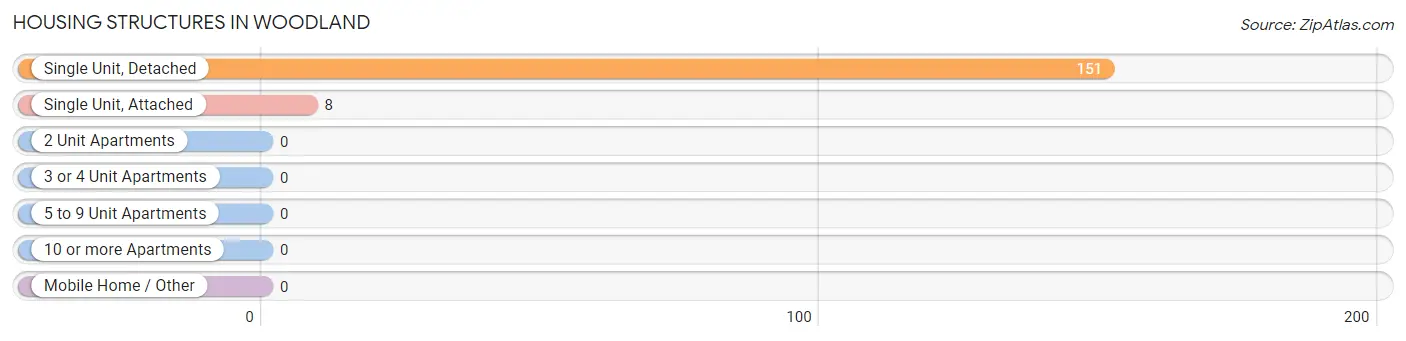
| Structure Type | # Housing Units | % Housing Units |
| Single Unit, Detached | 151 | 95.0% |
| Single Unit, Attached | 8 | 5.0% |
| 2 Unit Apartments | 0 | 0.0% |
| 3 or 4 Unit Apartments | 0 | 0.0% |
| 5 to 9 Unit Apartments | 0 | 0.0% |
| 10 or more Apartments | 0 | 0.0% |
| Mobile Home / Other | 0 | 0.0% |
| Total | 159 | 100.0% |
Housing Structures by Occupancy in Woodland
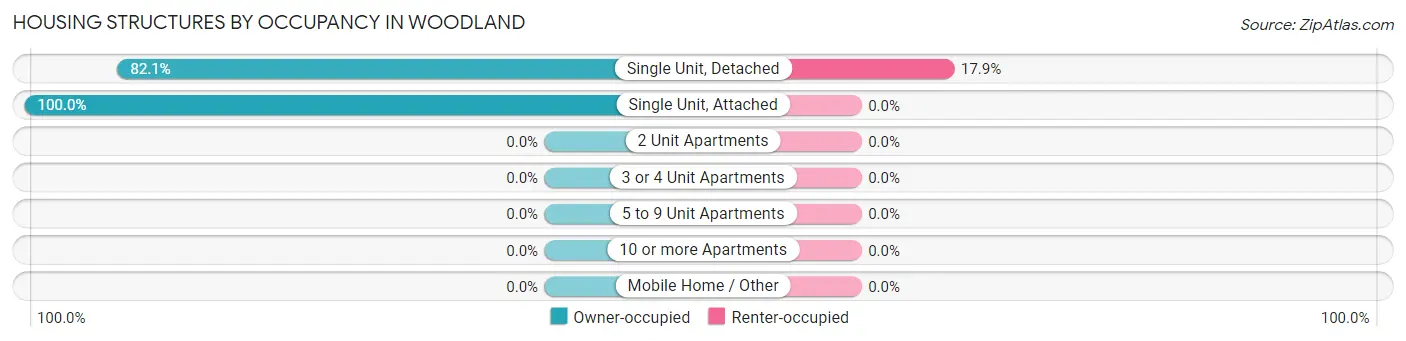
| Structure Type | Owner-occupied | Renter-occupied |
| Single Unit, Detached | 124 (82.1%) | 27 (17.9%) |
| Single Unit, Attached | 8 (100.0%) | 0 (0.0%) |
| 2 Unit Apartments | 0 (0.0%) | 0 (0.0%) |
| 3 or 4 Unit Apartments | 0 (0.0%) | 0 (0.0%) |
| 5 to 9 Unit Apartments | 0 (0.0%) | 0 (0.0%) |
| 10 or more Apartments | 0 (0.0%) | 0 (0.0%) |
| Mobile Home / Other | 0 (0.0%) | 0 (0.0%) |
| Total | 132 (83.0%) | 27 (17.0%) |
Housing Structures by Number of Rooms in Woodland
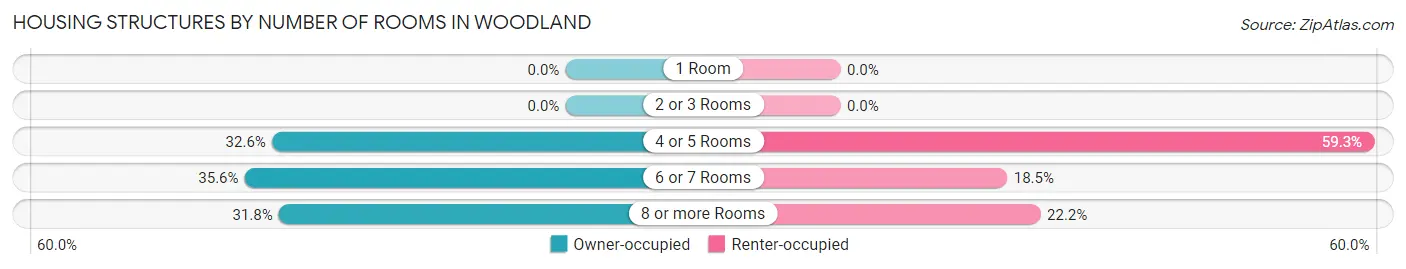
| Number of Rooms | Owner-occupied | Renter-occupied |
| 1 Room | 0 (0.0%) | 0 (0.0%) |
| 2 or 3 Rooms | 0 (0.0%) | 0 (0.0%) |
| 4 or 5 Rooms | 43 (32.6%) | 16 (59.3%) |
| 6 or 7 Rooms | 47 (35.6%) | 5 (18.5%) |
| 8 or more Rooms | 42 (31.8%) | 6 (22.2%) |
| Total | 132 (100.0%) | 27 (100.0%) |
Housing Structure by Heating Type in Woodland
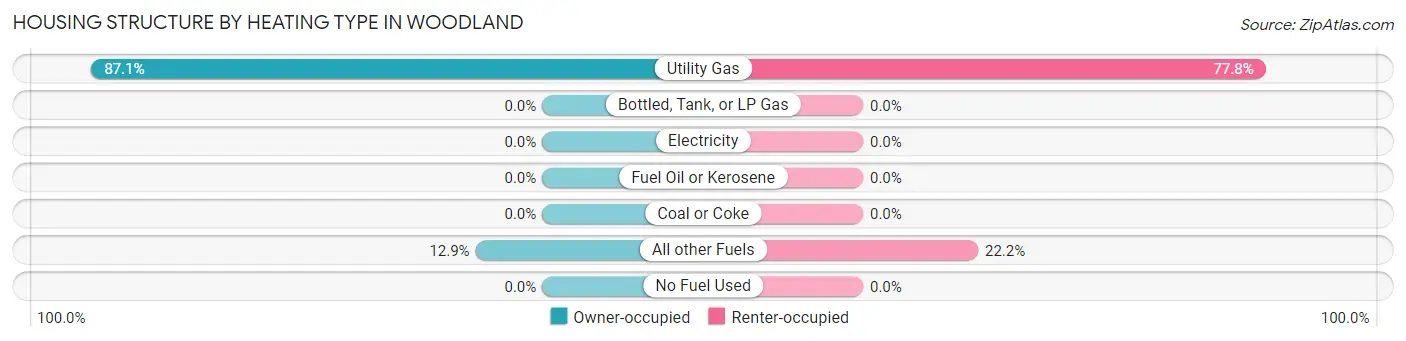
| Heating Type | Owner-occupied | Renter-occupied |
| Utility Gas | 115 (87.1%) | 21 (77.8%) |
| Bottled, Tank, or LP Gas | 0 (0.0%) | 0 (0.0%) |
| Electricity | 0 (0.0%) | 0 (0.0%) |
| Fuel Oil or Kerosene | 0 (0.0%) | 0 (0.0%) |
| Coal or Coke | 0 (0.0%) | 0 (0.0%) |
| All other Fuels | 17 (12.9%) | 6 (22.2%) |
| No Fuel Used | 0 (0.0%) | 0 (0.0%) |
| Total | 132 (100.0%) | 27 (100.0%) |
Household Vehicle Usage in Woodland
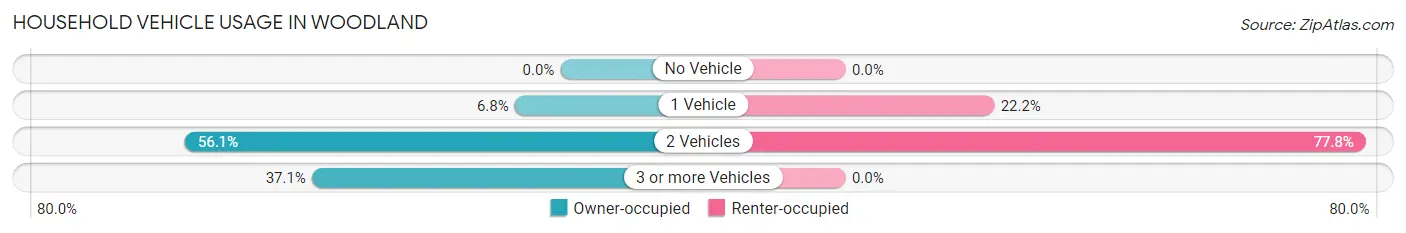
| Vehicles per Household | Owner-occupied | Renter-occupied |
| No Vehicle | 0 (0.0%) | 0 (0.0%) |
| 1 Vehicle | 9 (6.8%) | 6 (22.2%) |
| 2 Vehicles | 74 (56.1%) | 21 (77.8%) |
| 3 or more Vehicles | 49 (37.1%) | 0 (0.0%) |
| Total | 132 (100.0%) | 27 (100.0%) |
Real Estate & Mortgages in Woodland
Real Estate and Mortgage Overview in Woodland
| Characteristic | Without Mortgage | With Mortgage |
| Housing Units | 45 | 87 |
| Median Property Value | $479,400 | $544,600 |
| Median Household Income | $91,528 | $0 |
| Monthly Housing Costs | $469 | $12 |
| Real Estate Taxes | $2,662 | $0 |
Property Value by Mortgage Status in Woodland
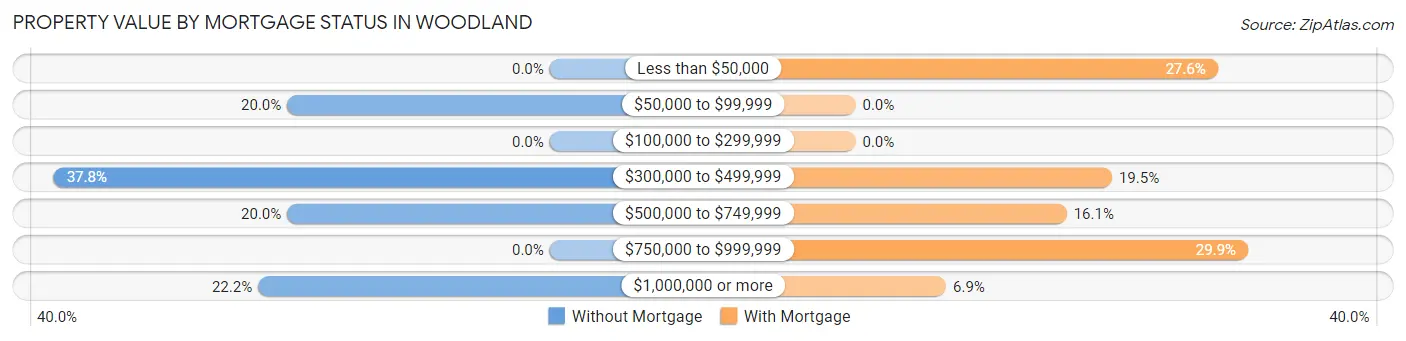
| Property Value | Without Mortgage | With Mortgage |
| Less than $50,000 | 0 (0.0%) | 24 (27.6%) |
| $50,000 to $99,999 | 9 (20.0%) | 0 (0.0%) |
| $100,000 to $299,999 | 0 (0.0%) | 0 (0.0%) |
| $300,000 to $499,999 | 17 (37.8%) | 17 (19.5%) |
| $500,000 to $749,999 | 9 (20.0%) | 14 (16.1%) |
| $750,000 to $999,999 | 0 (0.0%) | 26 (29.9%) |
| $1,000,000 or more | 10 (22.2%) | 6 (6.9%) |
| Total | 45 (100.0%) | 87 (100.0%) |
Household Income by Mortgage Status in Woodland
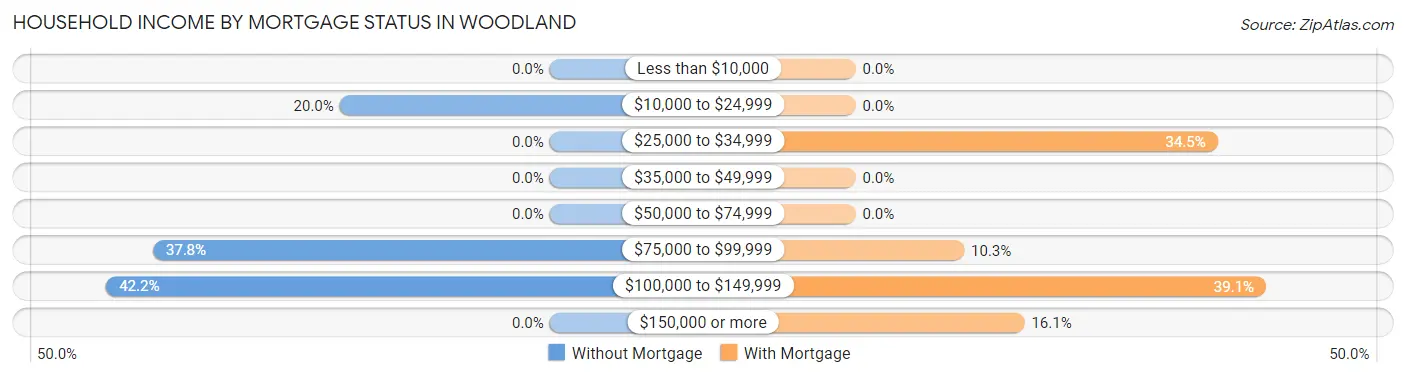
| Household Income | Without Mortgage | With Mortgage |
| Less than $10,000 | 0 (0.0%) | 0 (0.0%) |
| $10,000 to $24,999 | 9 (20.0%) | 0 (0.0%) |
| $25,000 to $34,999 | 0 (0.0%) | 30 (34.5%) |
| $35,000 to $49,999 | 0 (0.0%) | 0 (0.0%) |
| $50,000 to $74,999 | 0 (0.0%) | 0 (0.0%) |
| $75,000 to $99,999 | 17 (37.8%) | 9 (10.3%) |
| $100,000 to $149,999 | 19 (42.2%) | 34 (39.1%) |
| $150,000 or more | 0 (0.0%) | 14 (16.1%) |
| Total | 45 (100.0%) | 87 (100.0%) |
Property Value to Household Income Ratio in Woodland
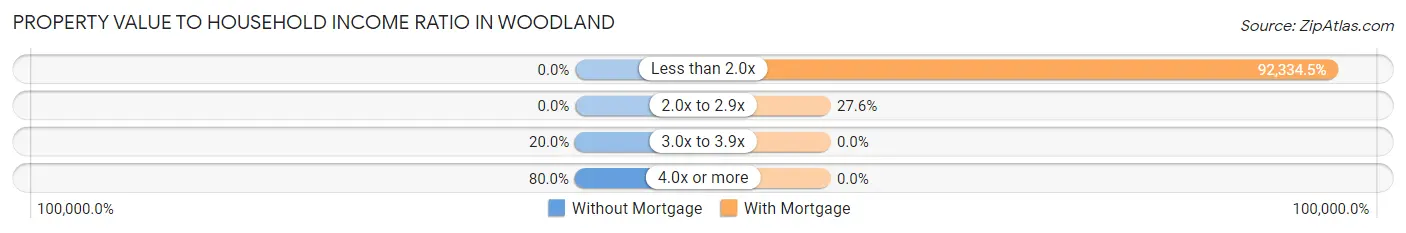
| Value-to-Income Ratio | Without Mortgage | With Mortgage |
| Less than 2.0x | 0 (0.0%) | 80,331 (92,334.5%) |
| 2.0x to 2.9x | 0 (0.0%) | 24 (27.6%) |
| 3.0x to 3.9x | 9 (20.0%) | 0 (0.0%) |
| 4.0x or more | 36 (80.0%) | 0 (0.0%) |
| Total | 45 (100.0%) | 87 (100.0%) |
Real Estate Taxes by Mortgage Status in Woodland
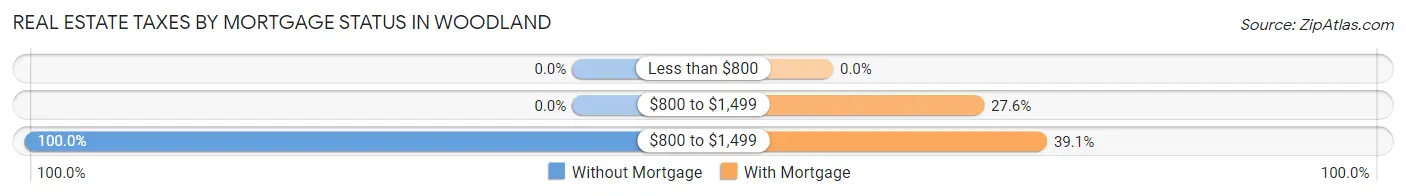
| Property Taxes | Without Mortgage | With Mortgage |
| Less than $800 | 0 (0.0%) | 0 (0.0%) |
| $800 to $1,499 | 0 (0.0%) | 24 (27.6%) |
| $800 to $1,499 | 45 (100.0%) | 34 (39.1%) |
| Total | 45 (100.0%) | 87 (100.0%) |
Health & Disability in Woodland
Health Insurance Coverage by Age in Woodland
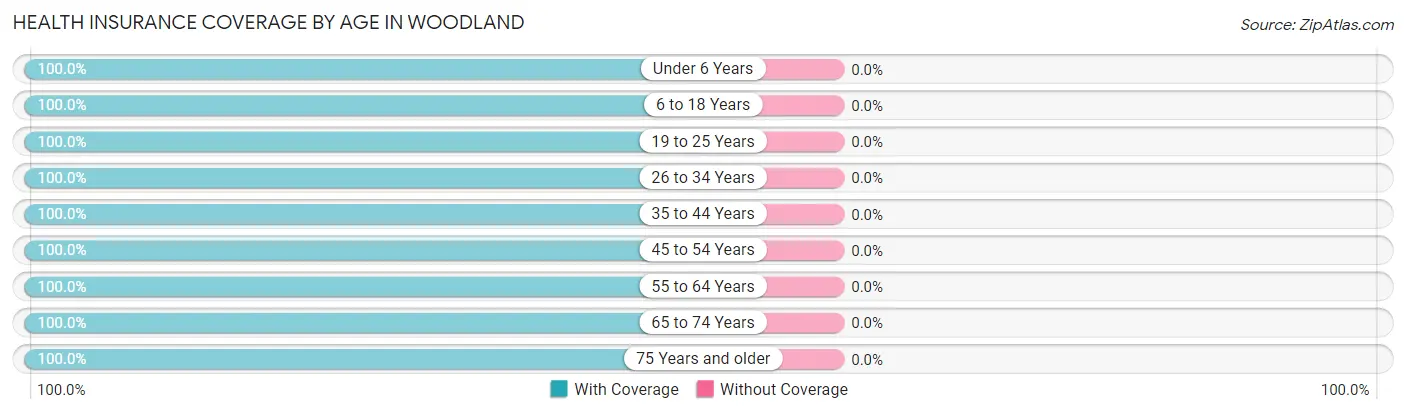
| Age Bracket | With Coverage | Without Coverage |
| Under 6 Years | 129 (100.0%) | 0 (0.0%) |
| 6 to 18 Years | 21 (100.0%) | 0 (0.0%) |
| 19 to 25 Years | 31 (100.0%) | 0 (0.0%) |
| 26 to 34 Years | 73 (100.0%) | 0 (0.0%) |
| 35 to 44 Years | 6 (100.0%) | 0 (0.0%) |
| 45 to 54 Years | 24 (100.0%) | 0 (0.0%) |
| 55 to 64 Years | 82 (100.0%) | 0 (0.0%) |
| 65 to 74 Years | 56 (100.0%) | 0 (0.0%) |
| 75 Years and older | 49 (100.0%) | 0 (0.0%) |
| Total | 471 (100.0%) | 0 (0.0%) |
Health Insurance Coverage by Citizenship Status in Woodland
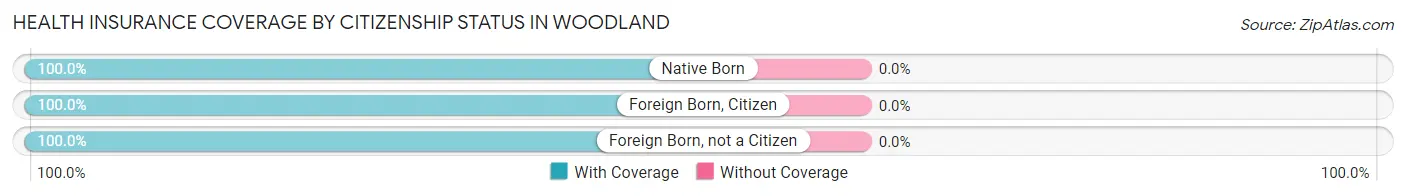
| Citizenship Status | With Coverage | Without Coverage |
| Native Born | 129 (100.0%) | 0 (0.0%) |
| Foreign Born, Citizen | 21 (100.0%) | 0 (0.0%) |
| Foreign Born, not a Citizen | 31 (100.0%) | 0 (0.0%) |
Health Insurance Coverage by Household Income in Woodland
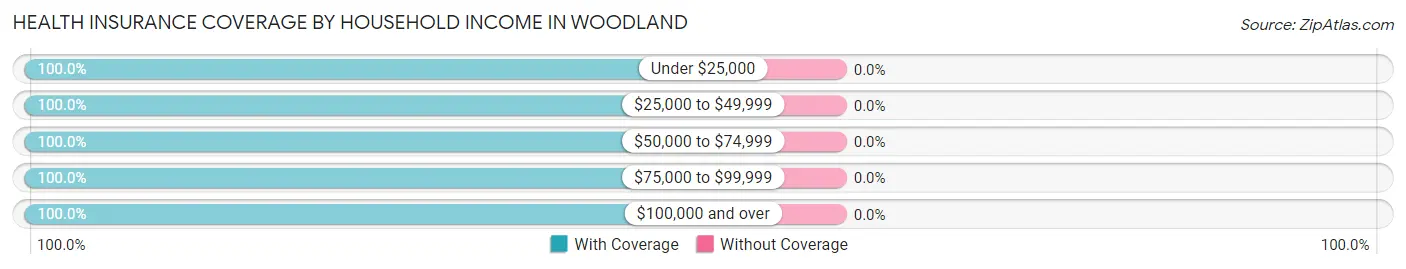
| Household Income | With Coverage | Without Coverage |
| Under $25,000 | 68 (100.0%) | 0 (0.0%) |
| $25,000 to $49,999 | 57 (100.0%) | 0 (0.0%) |
| $50,000 to $74,999 | 53 (100.0%) | 0 (0.0%) |
| $75,000 to $99,999 | 196 (100.0%) | 0 (0.0%) |
| $100,000 and over | 97 (100.0%) | 0 (0.0%) |
Public vs Private Health Insurance Coverage by Age in Woodland
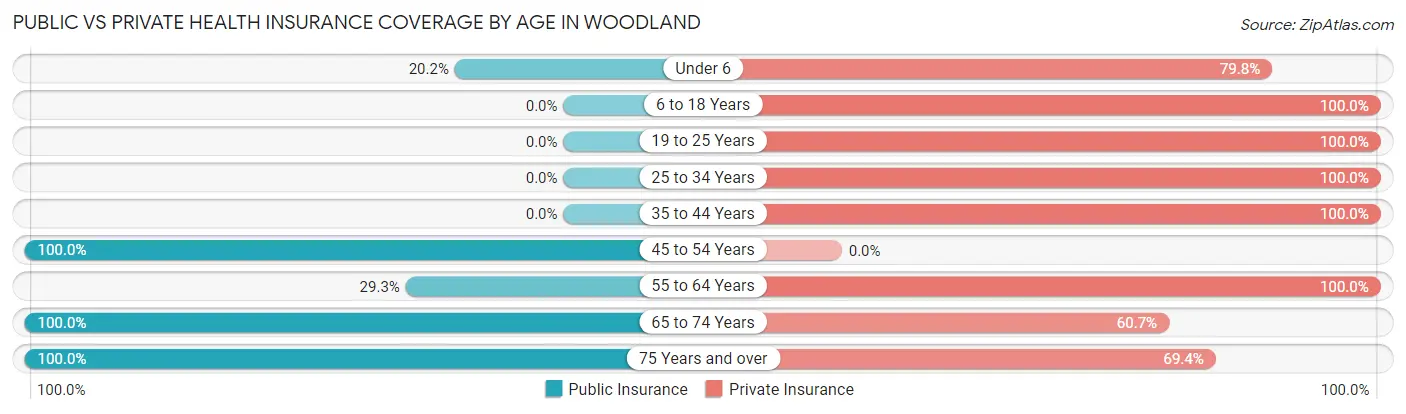
| Age Bracket | Public Insurance | Private Insurance |
| Under 6 | 26 (20.2%) | 103 (79.8%) |
| 6 to 18 Years | 0 (0.0%) | 21 (100.0%) |
| 19 to 25 Years | 0 (0.0%) | 31 (100.0%) |
| 25 to 34 Years | 0 (0.0%) | 73 (100.0%) |
| 35 to 44 Years | 0 (0.0%) | 6 (100.0%) |
| 45 to 54 Years | 24 (100.0%) | 0 (0.0%) |
| 55 to 64 Years | 24 (29.3%) | 82 (100.0%) |
| 65 to 74 Years | 56 (100.0%) | 34 (60.7%) |
| 75 Years and over | 49 (100.0%) | 34 (69.4%) |
| Total | 179 (38.0%) | 384 (81.5%) |
Disability Status by Sex by Age in Woodland
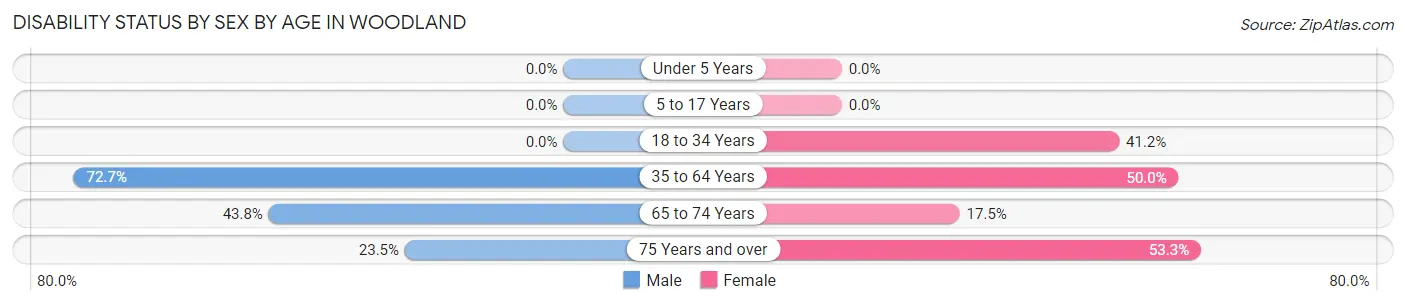
| Age Bracket | Male | Female |
| Under 5 Years | 0 (0.0%) | 0 (0.0%) |
| 5 to 17 Years | 0 (0.0%) | 0 (0.0%) |
| 18 to 34 Years | 0 (0.0%) | 21 (41.2%) |
| 35 to 64 Years | 48 (72.7%) | 23 (50.0%) |
| 65 to 74 Years | 7 (43.8%) | 7 (17.5%) |
| 75 Years and over | 8 (23.5%) | 8 (53.3%) |
Disability Class by Sex by Age in Woodland
Disability Class: Hearing Difficulty
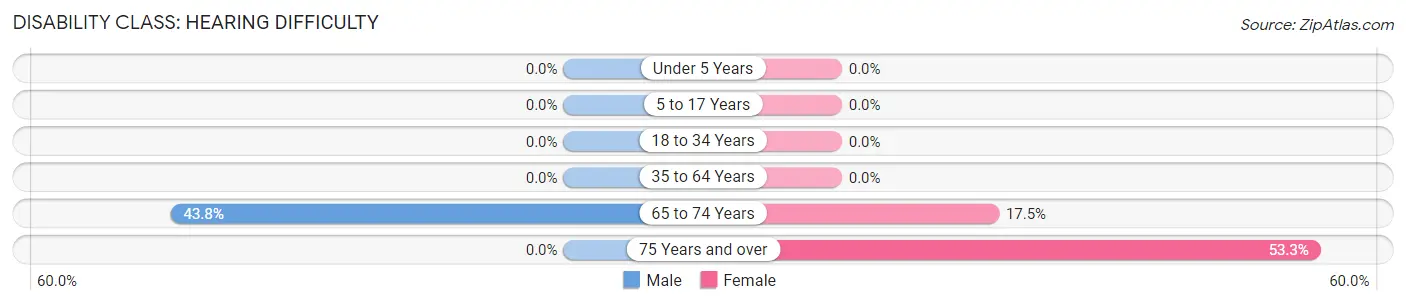
| Age Bracket | Male | Female |
| Under 5 Years | 0 (0.0%) | 0 (0.0%) |
| 5 to 17 Years | 0 (0.0%) | 0 (0.0%) |
| 18 to 34 Years | 0 (0.0%) | 0 (0.0%) |
| 35 to 64 Years | 0 (0.0%) | 0 (0.0%) |
| 65 to 74 Years | 7 (43.8%) | 7 (17.5%) |
| 75 Years and over | 0 (0.0%) | 8 (53.3%) |
Disability Class: Vision Difficulty
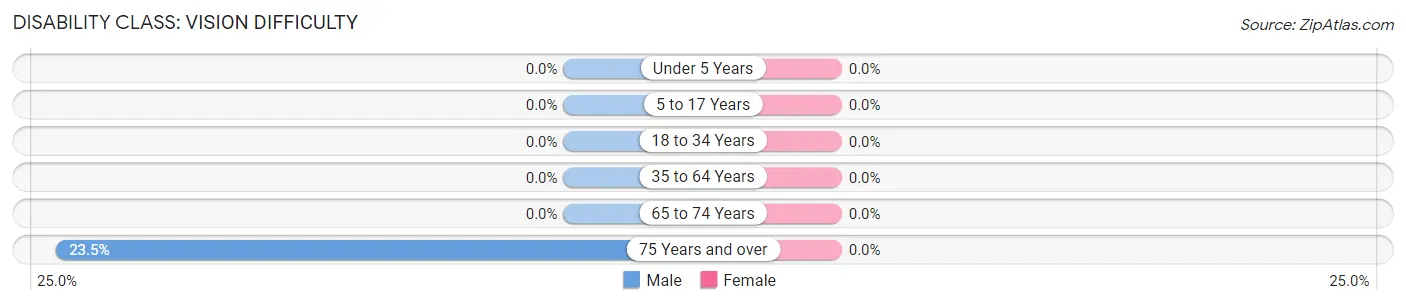
| Age Bracket | Male | Female |
| Under 5 Years | 0 (0.0%) | 0 (0.0%) |
| 5 to 17 Years | 0 (0.0%) | 0 (0.0%) |
| 18 to 34 Years | 0 (0.0%) | 0 (0.0%) |
| 35 to 64 Years | 0 (0.0%) | 0 (0.0%) |
| 65 to 74 Years | 0 (0.0%) | 0 (0.0%) |
| 75 Years and over | 8 (23.5%) | 0 (0.0%) |
Disability Class: Cognitive Difficulty
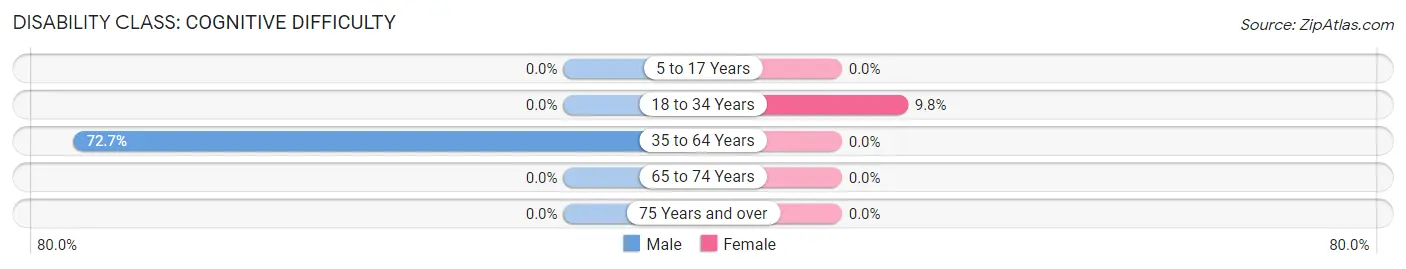
| Age Bracket | Male | Female |
| 5 to 17 Years | 0 (0.0%) | 0 (0.0%) |
| 18 to 34 Years | 0 (0.0%) | 5 (9.8%) |
| 35 to 64 Years | 48 (72.7%) | 0 (0.0%) |
| 65 to 74 Years | 0 (0.0%) | 0 (0.0%) |
| 75 Years and over | 0 (0.0%) | 0 (0.0%) |
Disability Class: Ambulatory Difficulty
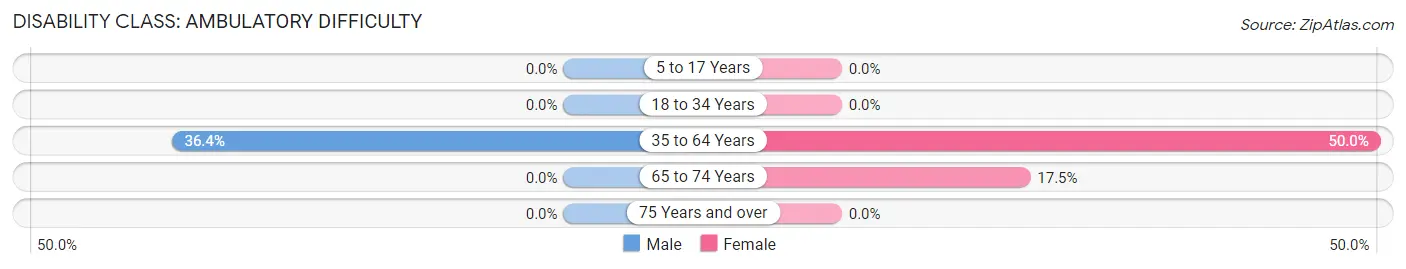
| Age Bracket | Male | Female |
| 5 to 17 Years | 0 (0.0%) | 0 (0.0%) |
| 18 to 34 Years | 0 (0.0%) | 0 (0.0%) |
| 35 to 64 Years | 24 (36.4%) | 23 (50.0%) |
| 65 to 74 Years | 0 (0.0%) | 7 (17.5%) |
| 75 Years and over | 0 (0.0%) | 0 (0.0%) |
Disability Class: Self-Care Difficulty
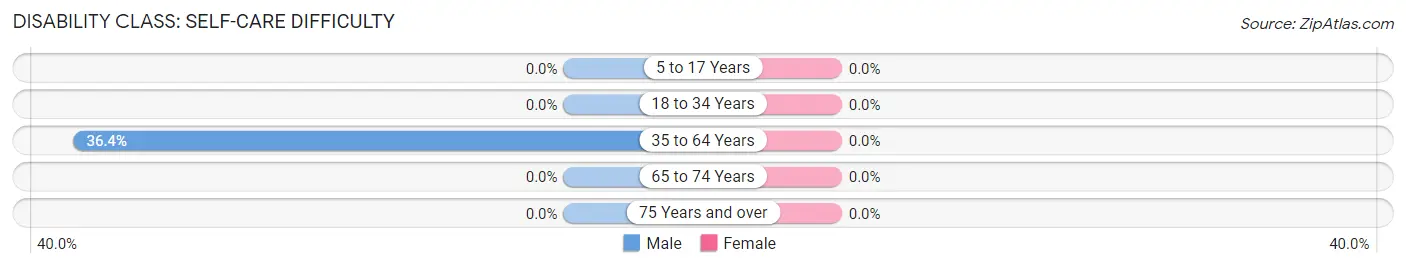
| Age Bracket | Male | Female |
| 5 to 17 Years | 0 (0.0%) | 0 (0.0%) |
| 18 to 34 Years | 0 (0.0%) | 0 (0.0%) |
| 35 to 64 Years | 24 (36.4%) | 0 (0.0%) |
| 65 to 74 Years | 0 (0.0%) | 0 (0.0%) |
| 75 Years and over | 0 (0.0%) | 0 (0.0%) |
Technology Access in Woodland
Computing Device Access in Woodland
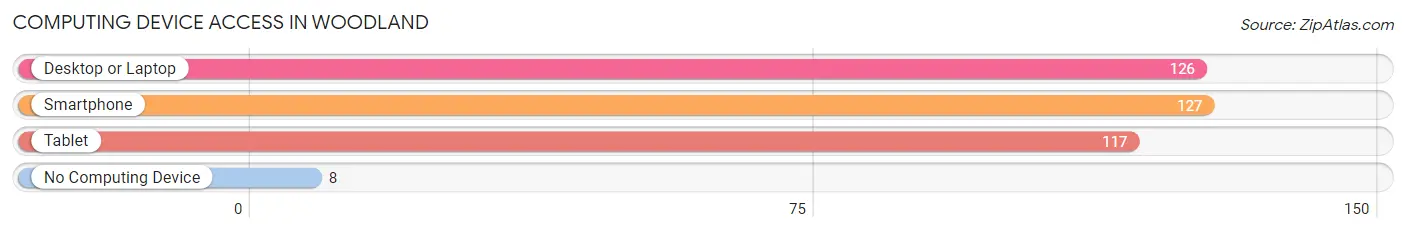
| Device Type | # Households | % Households |
| Desktop or Laptop | 126 | 79.2% |
| Smartphone | 127 | 79.9% |
| Tablet | 117 | 73.6% |
| No Computing Device | 8 | 5.0% |
| Total | 159 | 100.0% |
Internet Access in Woodland
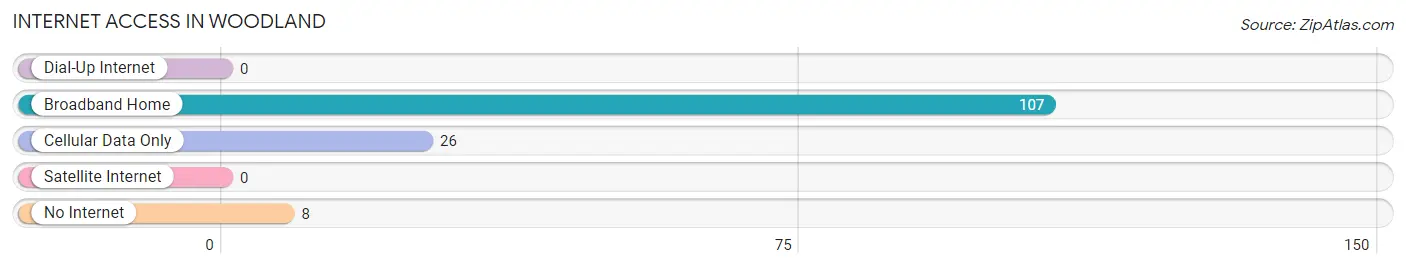
| Internet Type | # Households | % Households |
| Dial-Up Internet | 0 | 0.0% |
| Broadband Home | 107 | 67.3% |
| Cellular Data Only | 26 | 16.4% |
| Satellite Internet | 0 | 0.0% |
| No Internet | 8 | 5.0% |
| Total | 159 | 100.0% |
Woodland Summary
Woodland is a small town located in the state of Utah, in the United States. It is situated in the southwestern part of the state, in the county of Washington. The town is located in the foothills of the Wasatch Mountains, and is surrounded by the beautiful red rock formations of the area. The town has a population of approximately 1,000 people, and is a popular destination for outdoor recreation.
Geography
Woodland is located in the southwestern part of Utah, in the county of Washington. It is situated in the foothills of the Wasatch Mountains, and is surrounded by the beautiful red rock formations of the area. The town is located at an elevation of 4,400 feet, and is surrounded by the Pine Valley Mountains to the east, the Red Cliffs National Conservation Area to the west, and the Zion National Park to the south. The town is located in a semi-arid climate, with hot summers and cold winters.
Economy
The economy of Woodland is largely based on tourism and outdoor recreation. The town is a popular destination for hikers, campers, and other outdoor enthusiasts. The town is also home to several small businesses, including restaurants, shops, and other services. The town is also home to a number of small farms, which produce a variety of fruits and vegetables.
Demographics
As of the 2010 census, the population of Woodland was 1,000 people. The racial makeup of the town was 95.2% White, 0.7% African American, 0.3% Native American, 0.3% Asian, 0.1% Pacific Islander, 1.2% from other races, and 2.5% from two or more races. The median household income in Woodland was $41,250, and the median family income was $45,625.
History
Woodland was first settled in the late 1800s by Mormon pioneers. The town was originally known as “Woodland City”, and was later renamed to its current name. The town was incorporated in 1909, and has since grown to its current population of 1,000 people. The town is home to several historic buildings, including the Woodland City Hall, which was built in 1912.
Woodland is a small town with a rich history and a vibrant economy. The town is a popular destination for outdoor recreation, and is home to a number of small businesses and farms. The town has a diverse population, and is a great place to live and visit.
Common Questions
What is Per Capita Income in Woodland?
Per Capita income in Woodland is $24,328.
What is the Median Family Income in Woodland?
Median Family Income in Woodland is $80,699.
What is the Median Household income in Woodland?
Median Household Income in Woodland is $80,331.
What is Inequality or Gini Index in Woodland?
Inequality or Gini Index in Woodland is 0.30.
What is the Total Population of Woodland?
Total Population of Woodland is 471.
What is the Total Male Population of Woodland?
Total Male Population of Woodland is 239.
What is the Total Female Population of Woodland?
Total Female Population of Woodland is 232.
What is the Ratio of Males per 100 Females in Woodland?
There are 103.02 Males per 100 Females in Woodland.
What is the Ratio of Females per 100 Males in Woodland?
There are 97.07 Females per 100 Males in Woodland.
What is the Median Population Age in Woodland?
Median Population Age in Woodland is 31.4 Years.
What is the Average Family Size in Woodland
Average Family Size in Woodland is 3.4 People.
What is the Average Household Size in Woodland
Average Household Size in Woodland is 3.0 People.
How Large is the Labor Force in Woodland?
There are 140 People in the Labor Forcein in Woodland.
What is the Percentage of People in the Labor Force in Woodland?
43.6% of People are in the Labor Force in Woodland.
What is the Unemployment Rate in Woodland?
Unemployment Rate in Woodland is 10.0%.