Zip Codes with the Highest Percentage of Population Employed in Security & Protection in Layton, UT
RELATED REPORTS & OPTIONS
Security & Protection
Layton
Compare Zip Codes
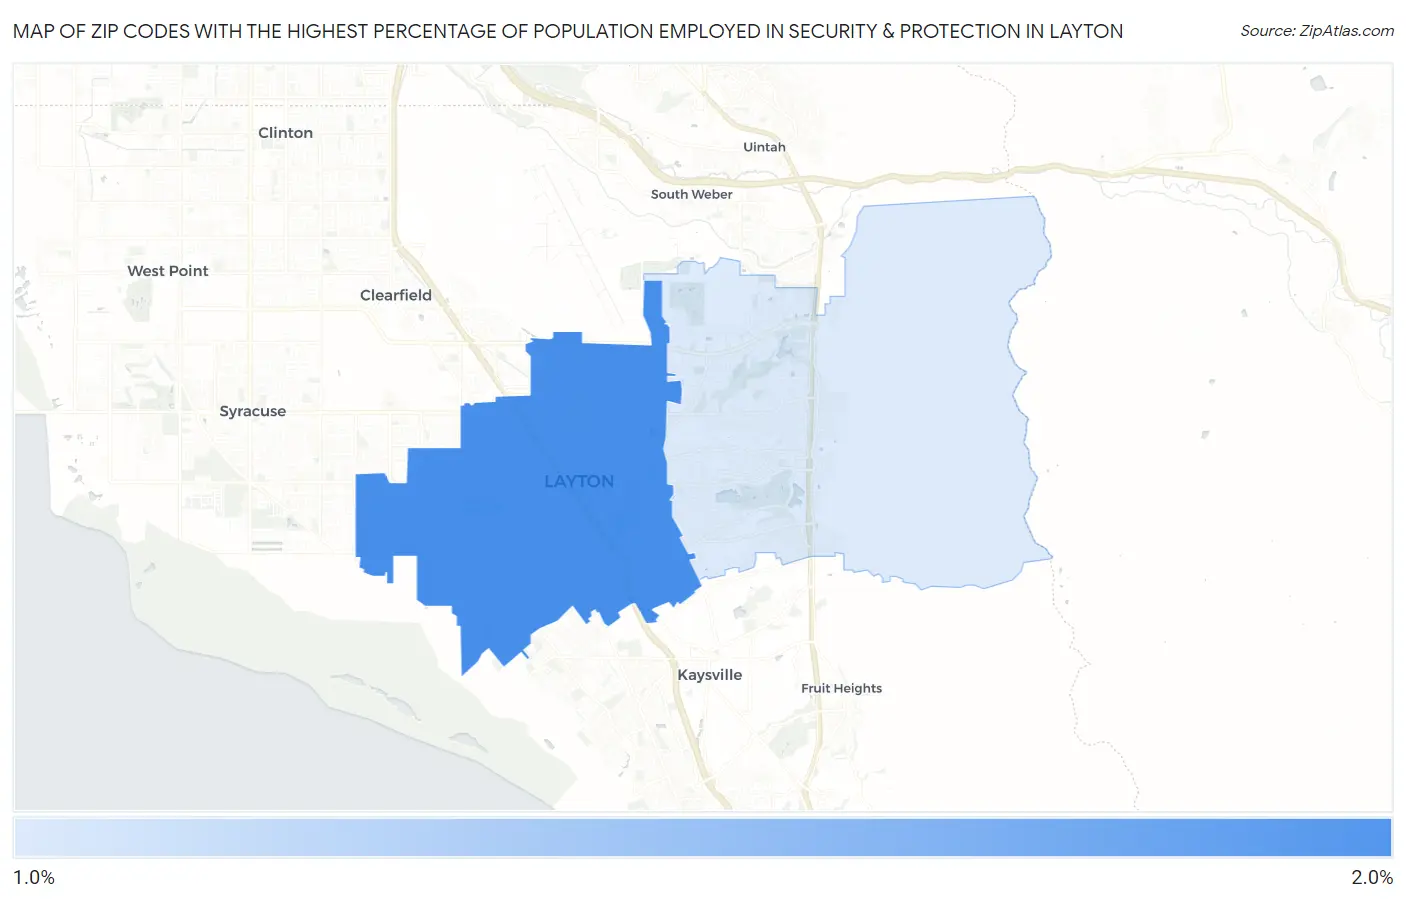
Map of Zip Codes with the Highest Percentage of Population Employed in Security & Protection in Layton
1.5%
2.0%
Zip Codes with the Highest Percentage of Population Employed in Security & Protection in Layton, UT
| Zip Code | % Employed | vs State | vs National | |
| 1. | 84041 | 2.0% | 1.6%(+0.373)#85 | 2.1%(-0.162)#12,645 |
| 2. | 84040 | 1.5% | 1.6%(-0.075)#123 | 2.1%(-0.610)#15,893 |
1
Common Questions
What are the Top Zip Codes with the Highest Percentage of Population Employed in Security & Protection in Layton, UT?
Top Zip Codes with the Highest Percentage of Population Employed in Security & Protection in Layton, UT are:
What zip code has the Highest Percentage of Population Employed in Security & Protection in Layton, UT?
84041 has the Highest Percentage of Population Employed in Security & Protection in Layton, UT with 2.0%.
What is the Percentage of Population Employed in Security & Protection in Layton, UT?
Percentage of Population Employed in Security & Protection in Layton is 1.8%.
What is the Percentage of Population Employed in Security & Protection in Utah?
Percentage of Population Employed in Security & Protection in Utah is 1.6%.
What is the Percentage of Population Employed in Security & Protection in the United States?
Percentage of Population Employed in Security & Protection in the United States is 2.1%.