Rosita, TX Map & Demographics
Rosita Map
Rosita Overview
$16,934
PER CAPITA INCOME
$60,584
AVG FAMILY INCOME
$54,432
AVG HOUSEHOLD INCOME
12.6%
WAGE / INCOME GAP [ % ]
87.4¢/ $1
WAGE / INCOME GAP [ $ ]
0.34
INEQUALITY / GINI INDEX
3,717
TOTAL POPULATION
1,704
MALE POPULATION
2,013
FEMALE POPULATION
84.65
MALES / 100 FEMALES
118.13
FEMALES / 100 MALES
24.3
MEDIAN AGE
4.6
AVG FAMILY SIZE
4.4
AVG HOUSEHOLD SIZE
1,600
LABOR FORCE [ PEOPLE ]
56.5%
PERCENT IN LABOR FORCE
13.8%
UNEMPLOYMENT RATE
Income in Rosita
Income Overview in Rosita
Per Capita Income in Rosita is $16,934, while median incomes of families and households are $60,584 and $54,432 respectively.
| Characteristic | Number | Measure |
| Per Capita Income | 3,717 | $16,934 |
| Median Family Income | 749 | $60,584 |
| Mean Family Income | 749 | $66,808 |
| Median Household Income | 841 | $54,432 |
| Mean Household Income | 841 | $64,749 |
| Income Deficit | 749 | $0 |
| Wage / Income Gap (%) | 3,717 | 12.56% |
| Wage / Income Gap ($) | 3,717 | 87.44¢ per $1 |
| Gini / Inequality Index | 3,717 | 0.34 |
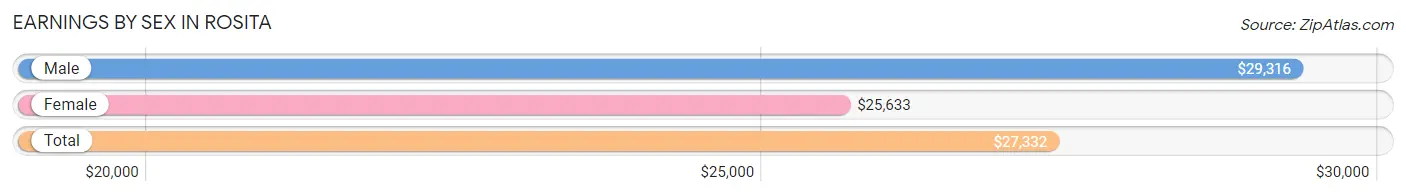
Earnings by Sex in Rosita
Average Earnings in Rosita are $27,332, $29,316 for men and $25,633 for women, a difference of 12.6%.
| Sex | Number | Average Earnings |
| Male | 941 (59.0%) | $29,316 |
| Female | 653 (41.0%) | $25,633 |
| Total | 1,594 (100.0%) | $27,332 |
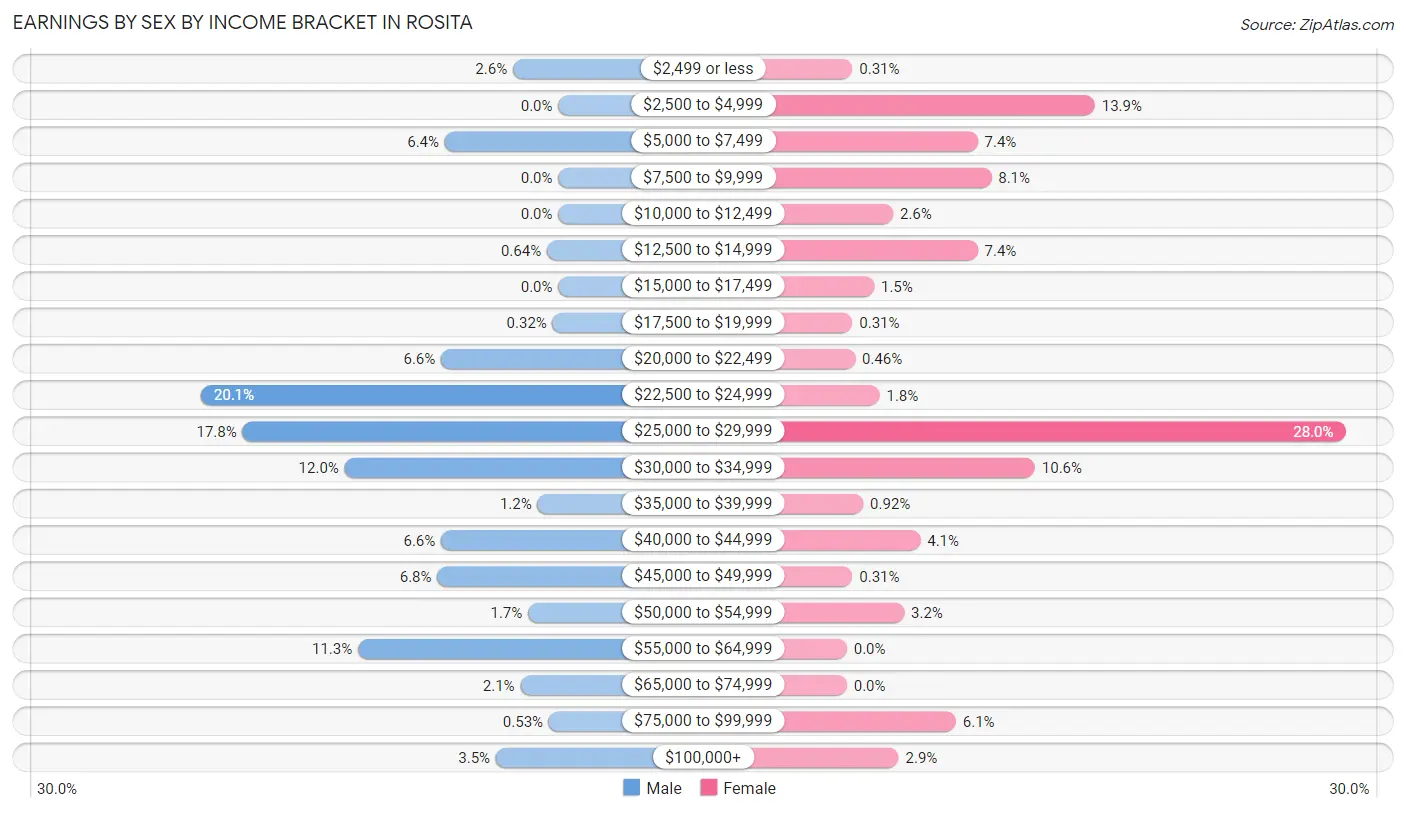
Earnings by Sex by Income Bracket in Rosita
The most common earnings brackets in Rosita are $22,500 to $24,999 for men (189 | 20.1%) and $25,000 to $29,999 for women (183 | 28.0%).
| Income | Male | Female |
| $2,499 or less | 24 (2.5%) | 2 (0.3%) |
| $2,500 to $4,999 | 0 (0.0%) | 91 (13.9%) |
| $5,000 to $7,499 | 60 (6.4%) | 48 (7.3%) |
| $7,500 to $9,999 | 0 (0.0%) | 53 (8.1%) |
| $10,000 to $12,499 | 0 (0.0%) | 17 (2.6%) |
| $12,500 to $14,999 | 6 (0.6%) | 48 (7.3%) |
| $15,000 to $17,499 | 0 (0.0%) | 10 (1.5%) |
| $17,500 to $19,999 | 3 (0.3%) | 2 (0.3%) |
| $20,000 to $22,499 | 62 (6.6%) | 3 (0.5%) |
| $22,500 to $24,999 | 189 (20.1%) | 12 (1.8%) |
| $25,000 to $29,999 | 167 (17.7%) | 183 (28.0%) |
| $30,000 to $34,999 | 113 (12.0%) | 69 (10.6%) |
| $35,000 to $39,999 | 11 (1.2%) | 6 (0.9%) |
| $40,000 to $44,999 | 62 (6.6%) | 27 (4.1%) |
| $45,000 to $49,999 | 64 (6.8%) | 2 (0.3%) |
| $50,000 to $54,999 | 16 (1.7%) | 21 (3.2%) |
| $55,000 to $64,999 | 106 (11.3%) | 0 (0.0%) |
| $65,000 to $74,999 | 20 (2.1%) | 0 (0.0%) |
| $75,000 to $99,999 | 5 (0.5%) | 40 (6.1%) |
| $100,000+ | 33 (3.5%) | 19 (2.9%) |
| Total | 941 (100.0%) | 653 (100.0%) |
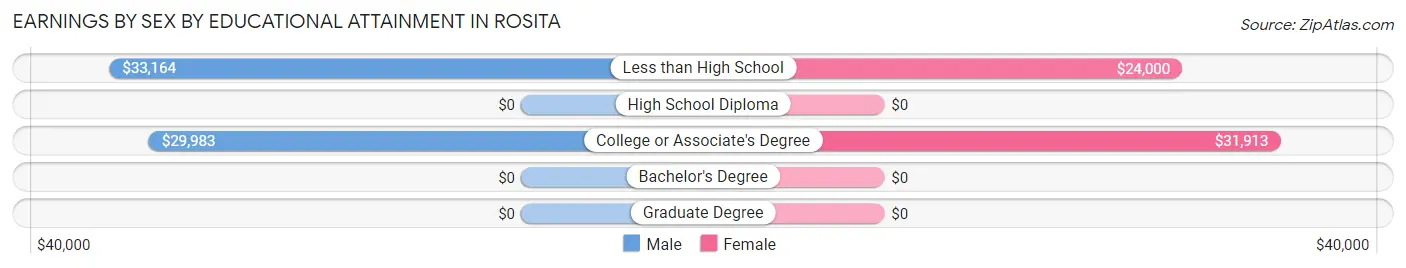
Earnings by Sex by Educational Attainment in Rosita
Average earnings in Rosita are $33,828 for men and $26,067 for women, a difference of 22.9%. Men with an educational attainment of less than high school enjoy the highest average annual earnings of $33,164, while those with college or associate's degree education earn the least with $29,983. Women with an educational attainment of college or associate's degree earn the most with the average annual earnings of $31,913, while those with less than high school education have the smallest earnings of $24,000.
| Educational Attainment | Male Income | Female Income |
| Less than High School | $33,164 | $24,000 |
| High School Diploma | - | - |
| College or Associate's Degree | $29,983 | $31,913 |
| Bachelor's Degree | - | - |
| Graduate Degree | - | - |
| Total | $33,828 | $26,067 |
Family Income in Rosita
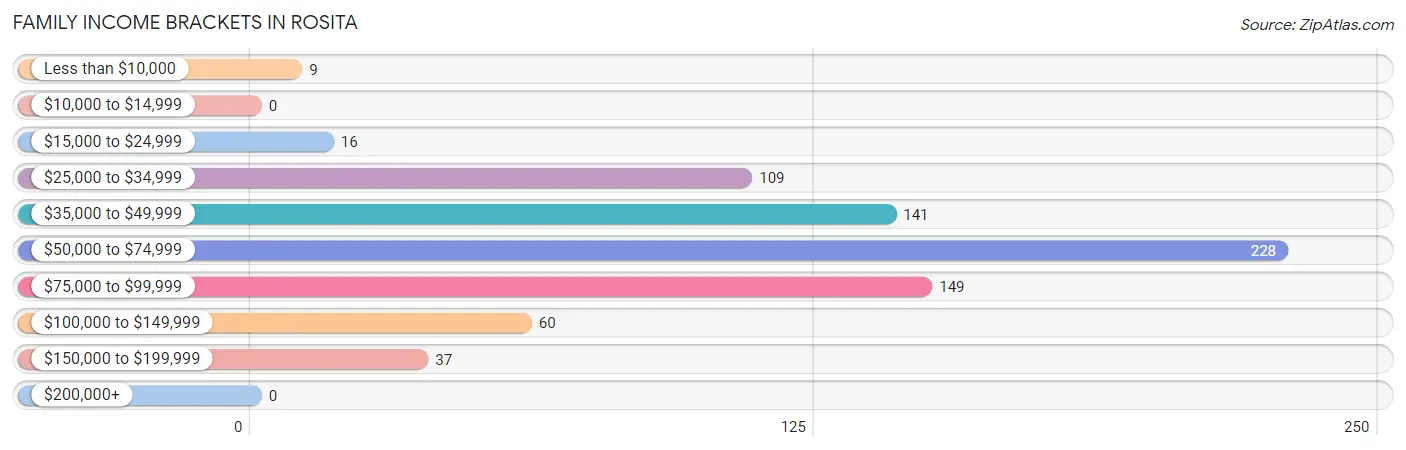
Family Income Brackets in Rosita
According to the Rosita family income data, there are 228 families falling into the $50,000 to $74,999 income range, which is the most common income bracket and makes up 30.4% of all families.
| Income Bracket | # Families | % Families |
| Less than $10,000 | 9 | 1.2% |
| $10,000 to $14,999 | 0 | 0.0% |
| $15,000 to $24,999 | 16 | 2.1% |
| $25,000 to $34,999 | 109 | 14.6% |
| $35,000 to $49,999 | 141 | 18.8% |
| $50,000 to $74,999 | 228 | 30.4% |
| $75,000 to $99,999 | 149 | 19.9% |
| $100,000 to $149,999 | 60 | 8.0% |
| $150,000 to $199,999 | 37 | 4.9% |
| $200,000+ | 0 | 0.0% |
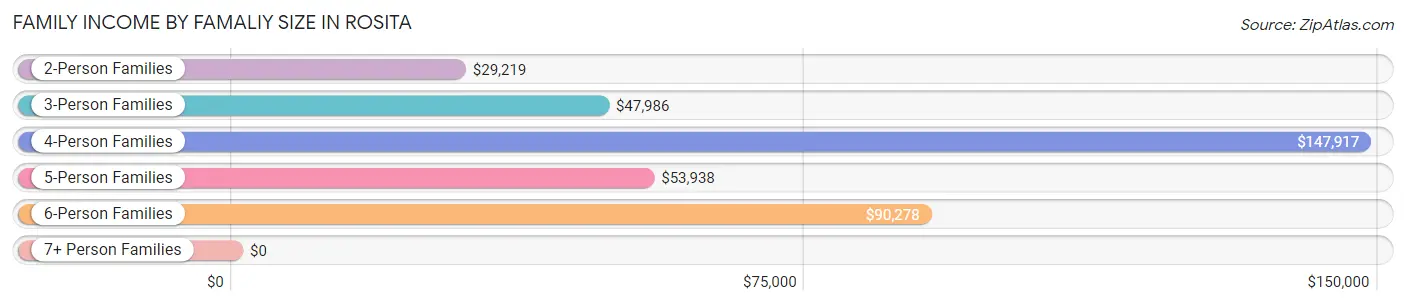
Family Income by Famaliy Size in Rosita
4-person families (61 | 8.1%) account for the highest median family income in Rosita with $147,917 per family, while 4-person families (61 | 8.1%) have the highest median income of $36,979 per family member.
| Income Bracket | # Families | Median Income |
| 2-Person Families | 68 (9.1%) | $29,219 |
| 3-Person Families | 307 (41.0%) | $47,986 |
| 4-Person Families | 61 (8.1%) | $147,917 |
| 5-Person Families | 164 (21.9%) | $53,938 |
| 6-Person Families | 64 (8.5%) | $90,278 |
| 7+ Person Families | 85 (11.4%) | $0 |
| Total | 749 (100.0%) | $60,584 |
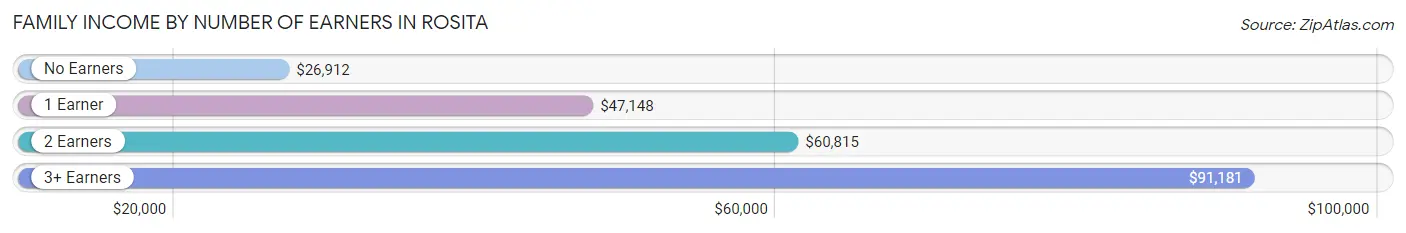
Family Income by Number of Earners in Rosita
The median family income in Rosita is $60,584, with families comprising 3+ earners (90) having the highest median family income of $91,181, while families with no earners (40) have the lowest median family income of $26,912, accounting for 12.0% and 5.3% of families, respectively.
| Number of Earners | # Families | Median Income |
| No Earners | 40 (5.3%) | $26,912 |
| 1 Earner | 302 (40.3%) | $47,148 |
| 2 Earners | 317 (42.3%) | $60,815 |
| 3+ Earners | 90 (12.0%) | $91,181 |
| Total | 749 (100.0%) | $60,584 |
Household Income in Rosita
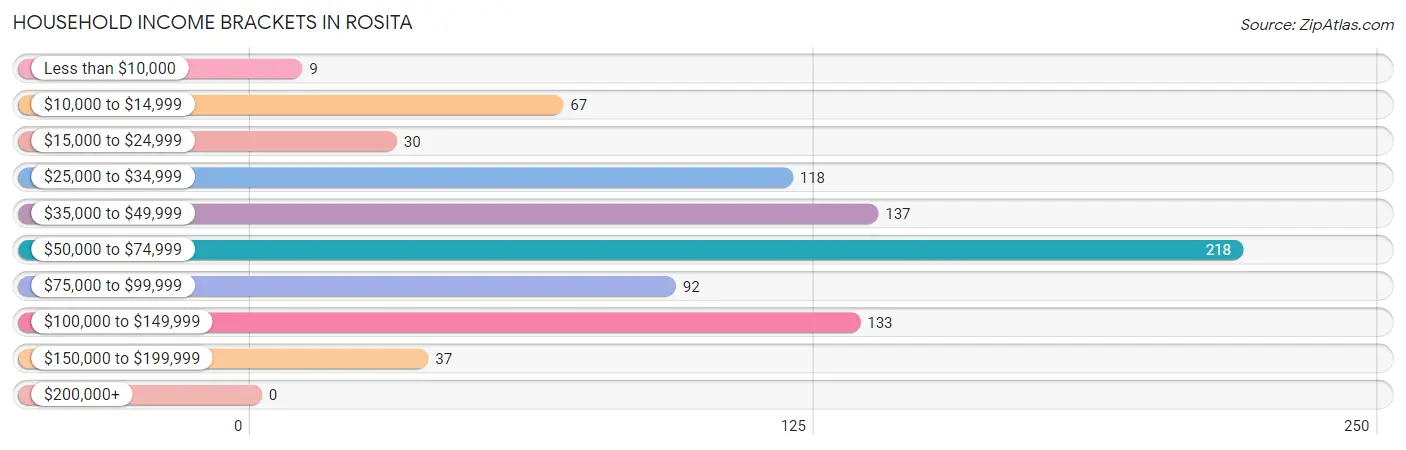
Household Income Brackets in Rosita
With 218 households falling in the category, the $50,000 to $74,999 income range is the most frequent in Rosita, accounting for 25.9% of all households.
| Income Bracket | # Households | % Households |
| Less than $10,000 | 9 | 1.1% |
| $10,000 to $14,999 | 67 | 8.0% |
| $15,000 to $24,999 | 30 | 3.6% |
| $25,000 to $34,999 | 118 | 14.0% |
| $35,000 to $49,999 | 137 | 16.3% |
| $50,000 to $74,999 | 218 | 25.9% |
| $75,000 to $99,999 | 92 | 10.9% |
| $100,000 to $149,999 | 133 | 15.8% |
| $150,000 to $199,999 | 37 | 4.4% |
| $200,000+ | 0 | 0.0% |
Household Income by Householder Age in Rosita
The median household income in Rosita is $54,432, with the highest median household income of $64,336 found in the 25 to 44 years age bracket for the primary householder. A total of 291 households (34.6%) fall into this category. Meanwhile, the 15 to 24 years age bracket for the primary householder has the lowest median household income of $0, with 12 households (1.4%) in this group.
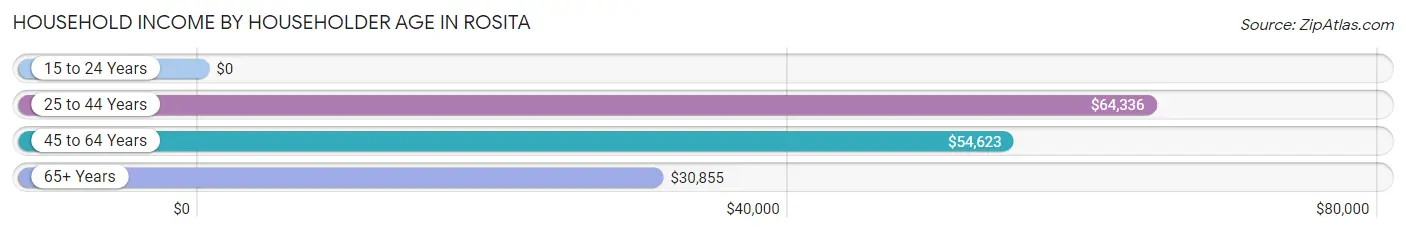
| Income Bracket | # Households | Median Income |
| 15 to 24 Years | 12 (1.4%) | $0 |
| 25 to 44 Years | 291 (34.6%) | $64,336 |
| 45 to 64 Years | 378 (45.0%) | $54,623 |
| 65+ Years | 160 (19.0%) | $30,855 |
| Total | 841 (100.0%) | $54,432 |
Poverty in Rosita
Income Below Poverty by Sex and Age in Rosita
With 1.1% poverty level for males and 7.6% for females among the residents of Rosita, 12 to 14 year old males and 5 year old females are the most vulnerable to poverty, with 4 males (14.3%) and 2 females (100.0%) in their respective age groups living below the poverty level.
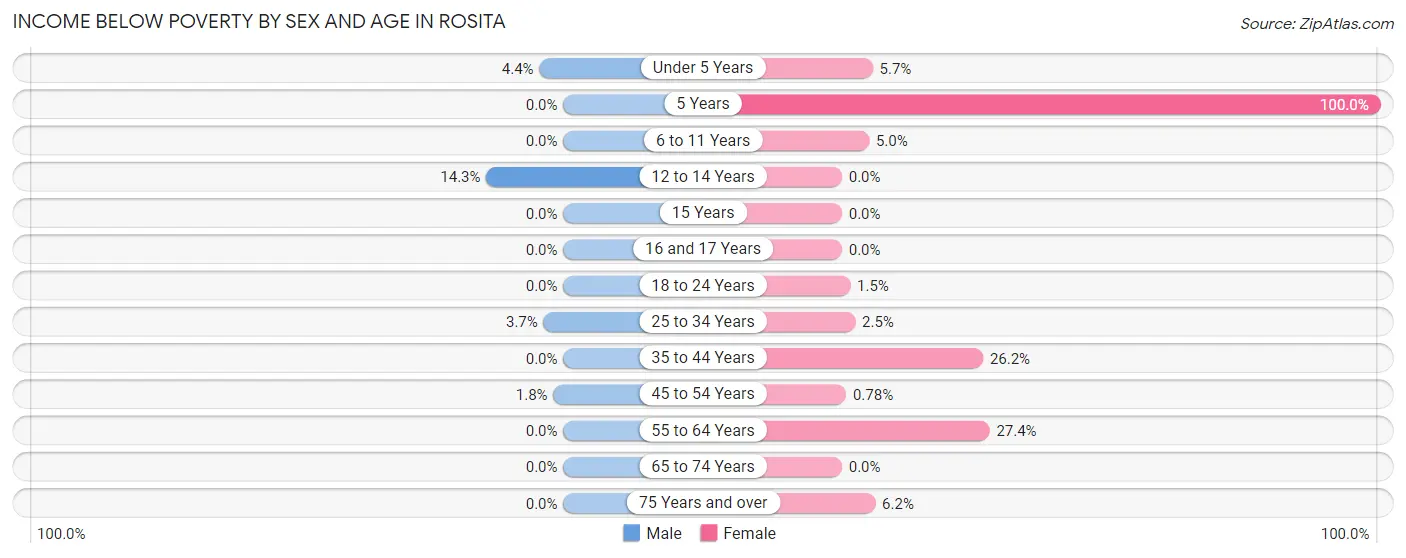
| Age Bracket | Male | Female |
| Under 5 Years | 6 (4.4%) | 8 (5.7%) |
| 5 Years | 0 (0.0%) | 2 (100.0%) |
| 6 to 11 Years | 0 (0.0%) | 12 (5.0%) |
| 12 to 14 Years | 4 (14.3%) | 0 (0.0%) |
| 15 Years | 0 (0.0%) | 0 (0.0%) |
| 16 and 17 Years | 0 (0.0%) | 0 (0.0%) |
| 18 to 24 Years | 0 (0.0%) | 7 (1.5%) |
| 25 to 34 Years | 6 (3.7%) | 2 (2.5%) |
| 35 to 44 Years | 0 (0.0%) | 60 (26.2%) |
| 45 to 54 Years | 3 (1.8%) | 2 (0.8%) |
| 55 to 64 Years | 0 (0.0%) | 54 (27.4%) |
| 65 to 74 Years | 0 (0.0%) | 0 (0.0%) |
| 75 Years and over | 0 (0.0%) | 7 (6.2%) |
| Total | 19 (1.1%) | 154 (7.6%) |
Income Above Poverty by Sex and Age in Rosita
According to the poverty statistics in Rosita, males aged 5 years and females aged 12 to 14 years are the age groups that are most secure financially, with 100.0% of males and 100.0% of females in these age groups living above the poverty line.
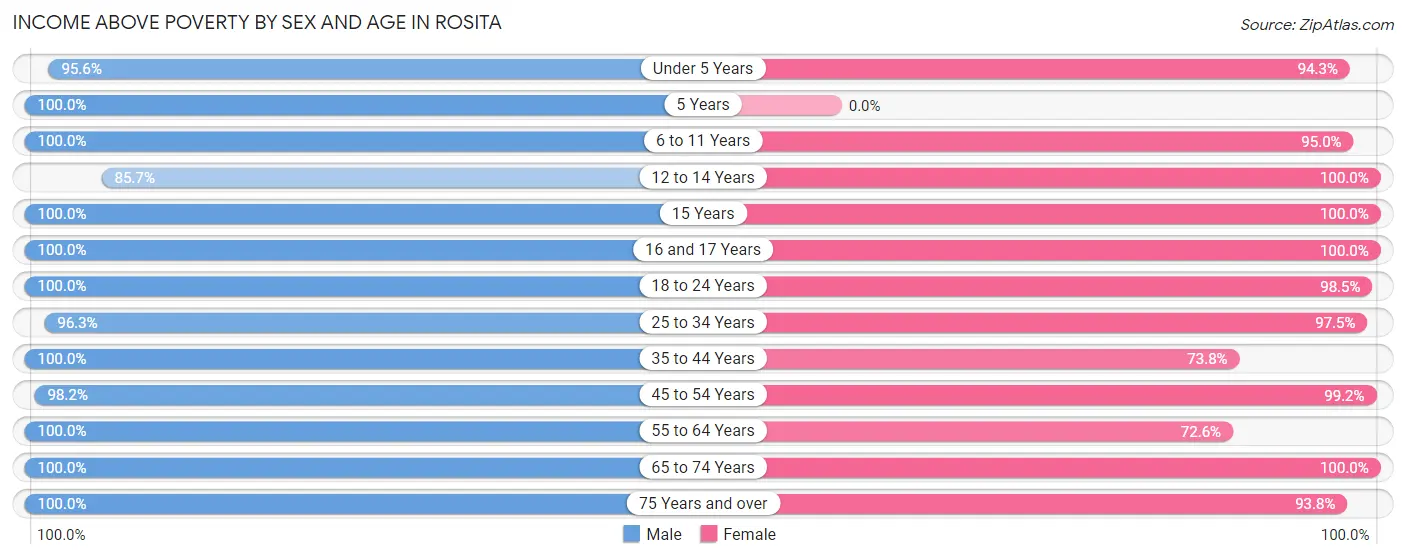
| Age Bracket | Male | Female |
| Under 5 Years | 129 (95.6%) | 132 (94.3%) |
| 5 Years | 9 (100.0%) | 0 (0.0%) |
| 6 to 11 Years | 115 (100.0%) | 226 (95.0%) |
| 12 to 14 Years | 24 (85.7%) | 145 (100.0%) |
| 15 Years | 27 (100.0%) | 47 (100.0%) |
| 16 and 17 Years | 59 (100.0%) | 33 (100.0%) |
| 18 to 24 Years | 474 (100.0%) | 449 (98.5%) |
| 25 to 34 Years | 158 (96.3%) | 79 (97.5%) |
| 35 to 44 Years | 212 (100.0%) | 169 (73.8%) |
| 45 to 54 Years | 160 (98.2%) | 253 (99.2%) |
| 55 to 64 Years | 164 (100.0%) | 143 (72.6%) |
| 65 to 74 Years | 62 (100.0%) | 77 (100.0%) |
| 75 Years and over | 92 (100.0%) | 106 (93.8%) |
| Total | 1,685 (98.9%) | 1,859 (92.3%) |
Income Below Poverty Among Married-Couple Families in Rosita
The poverty statistics for married-couple families in Rosita show that 0.9% or 4 of the total 469 families live below the poverty line. Families with 3 or 4 children have the highest poverty rate of 2.0%, comprising of 2 families. On the other hand, families with 1 or 2 children have the lowest poverty rate of 0.0%, which includes 0 families.
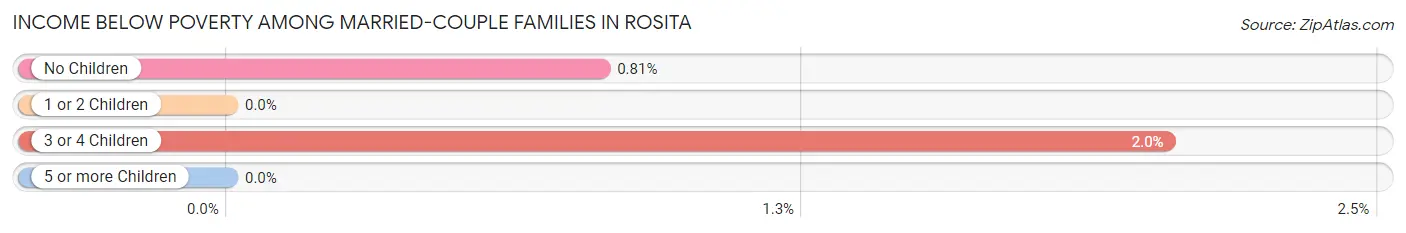
| Children | Above Poverty | Below Poverty |
| No Children | 245 (99.2%) | 2 (0.8%) |
| 1 or 2 Children | 124 (100.0%) | 0 (0.0%) |
| 3 or 4 Children | 96 (98.0%) | 2 (2.0%) |
| 5 or more Children | 0 (0.0%) | 0 (0.0%) |
| Total | 465 (99.2%) | 4 (0.9%) |
Income Below Poverty Among Single-Parent Households in Rosita
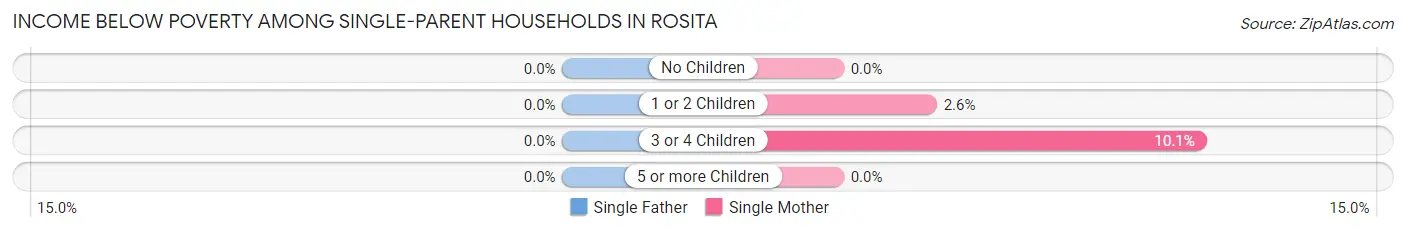
| Children | Single Father | Single Mother |
| No Children | 0 (0.0%) | 0 (0.0%) |
| 1 or 2 Children | 0 (0.0%) | 2 (2.6%) |
| 3 or 4 Children | 0 (0.0%) | 7 (10.1%) |
| 5 or more Children | 0 (0.0%) | 0 (0.0%) |
| Total | 0 (0.0%) | 9 (5.2%) |
Income Below Poverty Among Married-Couple vs Single-Parent Households in Rosita
The poverty data for Rosita shows that 4 of the married-couple family households (0.9%) and 9 of the single-parent households (3.2%) are living below the poverty level. Within the married-couple family households, those with 3 or 4 children have the highest poverty rate, with 2 households (2.0%) falling below the poverty line. Among the single-parent households, those with 3 or 4 children have the highest poverty rate, with 7 household (10.1%) living below poverty.
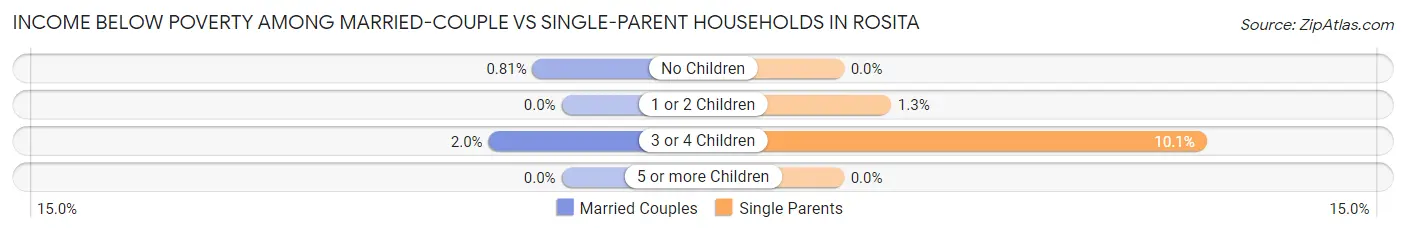
| Children | Married-Couple Families | Single-Parent Households |
| No Children | 2 (0.8%) | 0 (0.0%) |
| 1 or 2 Children | 0 (0.0%) | 2 (1.3%) |
| 3 or 4 Children | 2 (2.0%) | 7 (10.1%) |
| 5 or more Children | 0 (0.0%) | 0 (0.0%) |
| Total | 4 (0.9%) | 9 (3.2%) |
Race in Rosita
The most populous races in Rosita are Hispanic or Latino (2,820 | 75.9%), White / Caucasian (1,723 | 46.4%), and Native / Alaskan (958 | 25.8%).
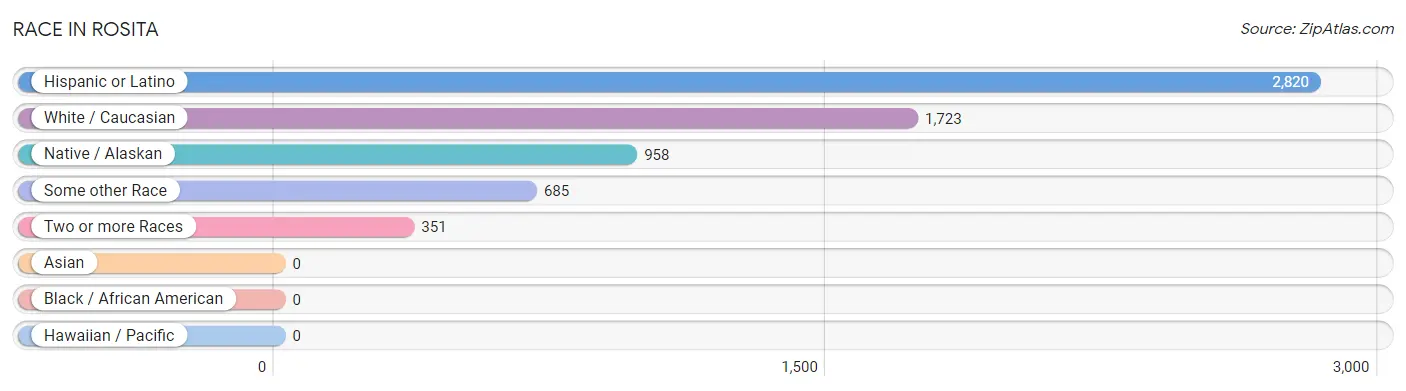
| Race | # Population | % Population |
| Asian | 0 | 0.0% |
| Black / African American | 0 | 0.0% |
| Hawaiian / Pacific | 0 | 0.0% |
| Hispanic or Latino | 2,820 | 75.9% |
| Native / Alaskan | 958 | 25.8% |
| White / Caucasian | 1,723 | 46.4% |
| Two or more Races | 351 | 9.4% |
| Some other Race | 685 | 18.4% |
| Total | 3,717 | 100.0% |
Ancestry in Rosita
The most populous ancestries reported in Rosita are Mexican (2,312 | 62.2%), American (33 | 0.9%), Italian (20 | 0.5%), and Potawatomi (3 | 0.1%), together accounting for 63.7% of all Rosita residents.
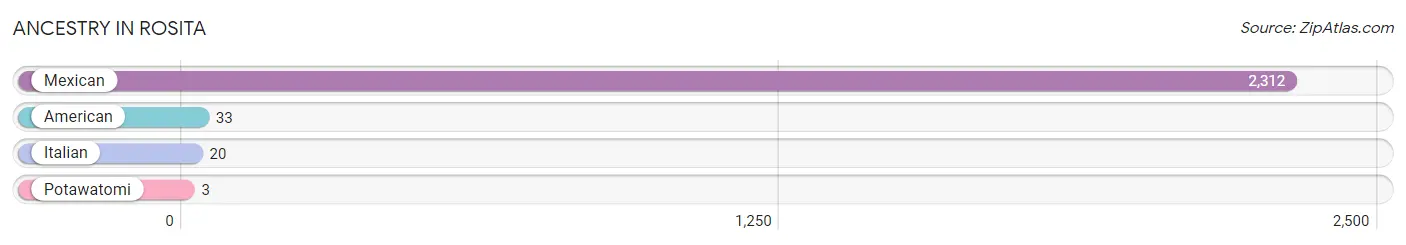
| Ancestry | # Population | % Population |
| American | 33 | 0.9% |
| Italian | 20 | 0.5% |
| Mexican | 2,312 | 62.2% |
| Potawatomi | 3 | 0.1% | View All 4 Rows |
Immigrants in Rosita
The most numerous immigrant groups reported in Rosita came from Central America (895 | 24.1%), Latin America (895 | 24.1%), and Mexico (895 | 24.1%), together accounting for 72.2% of all Rosita residents.
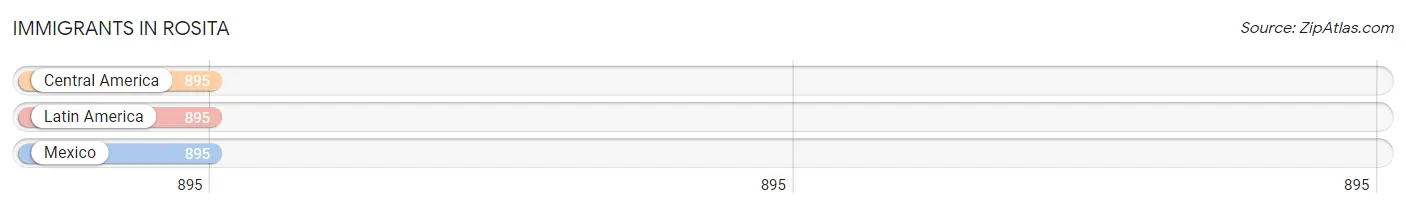
| Immigration Origin | # Population | % Population |
| Central America | 895 | 24.1% |
| Latin America | 895 | 24.1% |
| Mexico | 895 | 24.1% | View All 3 Rows |
Sex and Age in Rosita
Sex and Age in Rosita
The most populous age groups in Rosita are 20 to 24 Years (439 | 25.8%) for men and 20 to 24 Years (359 | 17.8%) for women.
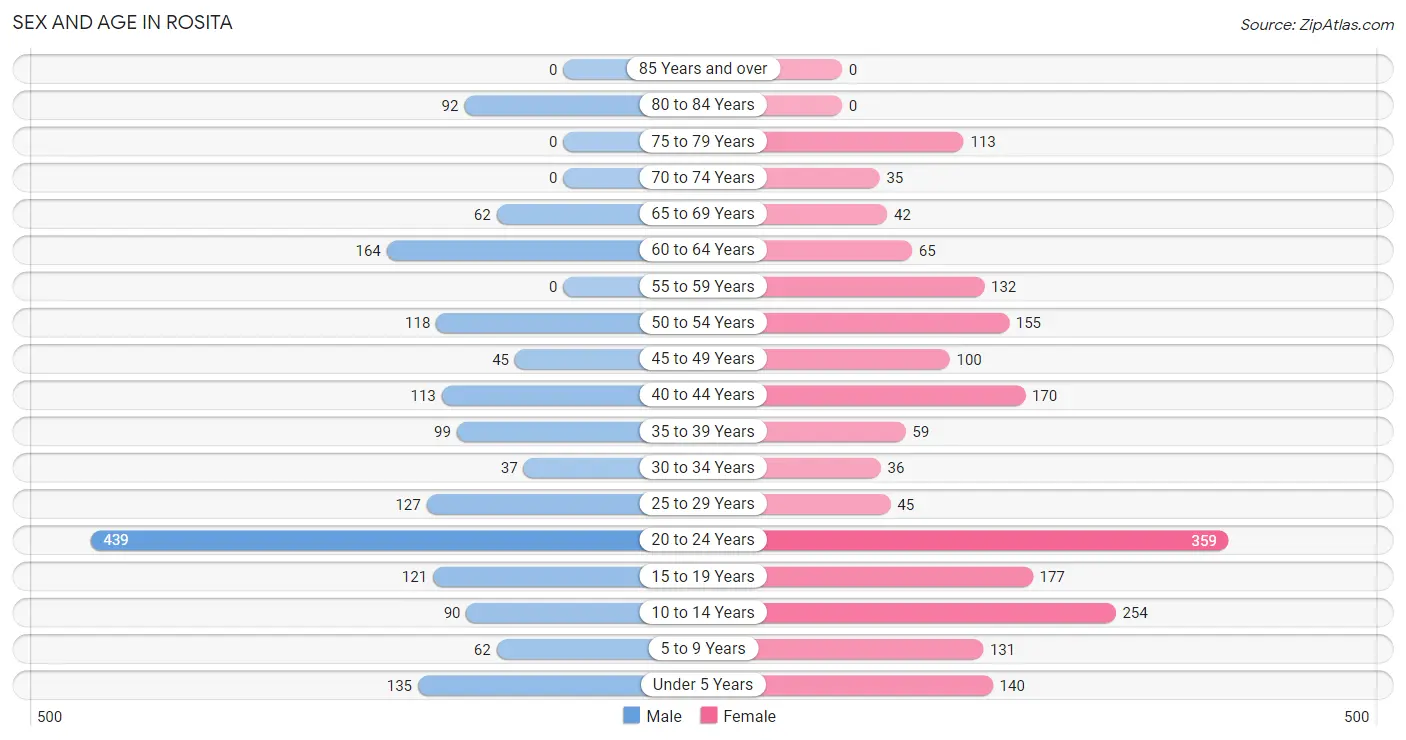
| Age Bracket | Male | Female |
| Under 5 Years | 135 (7.9%) | 140 (7.0%) |
| 5 to 9 Years | 62 (3.6%) | 131 (6.5%) |
| 10 to 14 Years | 90 (5.3%) | 254 (12.6%) |
| 15 to 19 Years | 121 (7.1%) | 177 (8.8%) |
| 20 to 24 Years | 439 (25.8%) | 359 (17.8%) |
| 25 to 29 Years | 127 (7.4%) | 45 (2.2%) |
| 30 to 34 Years | 37 (2.2%) | 36 (1.8%) |
| 35 to 39 Years | 99 (5.8%) | 59 (2.9%) |
| 40 to 44 Years | 113 (6.6%) | 170 (8.5%) |
| 45 to 49 Years | 45 (2.6%) | 100 (5.0%) |
| 50 to 54 Years | 118 (6.9%) | 155 (7.7%) |
| 55 to 59 Years | 0 (0.0%) | 132 (6.6%) |
| 60 to 64 Years | 164 (9.6%) | 65 (3.2%) |
| 65 to 69 Years | 62 (3.6%) | 42 (2.1%) |
| 70 to 74 Years | 0 (0.0%) | 35 (1.7%) |
| 75 to 79 Years | 0 (0.0%) | 113 (5.6%) |
| 80 to 84 Years | 92 (5.4%) | 0 (0.0%) |
| 85 Years and over | 0 (0.0%) | 0 (0.0%) |
| Total | 1,704 (100.0%) | 2,013 (100.0%) |
Families and Households in Rosita
Median Family Size in Rosita
The median family size in Rosita is 4.62 persons per family, with single female/mother families (172 | 23.0%) accounting for the largest median family size of 5.19 persons per family. On the other hand, single male/father families (108 | 14.4%) represent the smallest median family size with 2.53 persons per family.
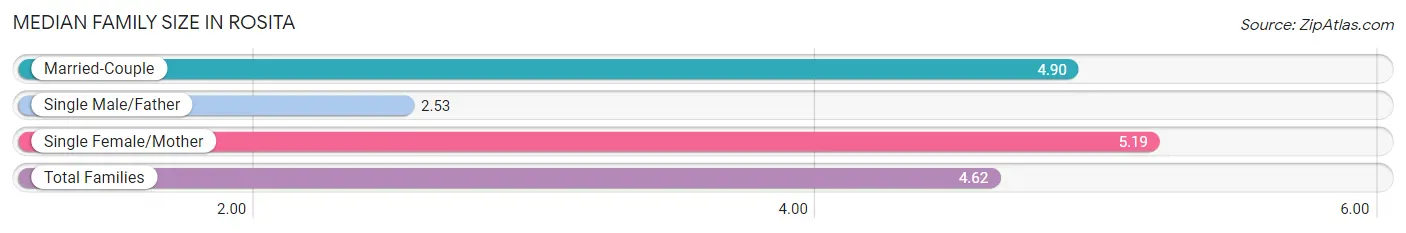
| Family Type | # Families | Family Size |
| Married-Couple | 469 (62.6%) | 4.90 |
| Single Male/Father | 108 (14.4%) | 2.53 |
| Single Female/Mother | 172 (23.0%) | 5.19 |
| Total Families | 749 (100.0%) | 4.62 |
Median Household Size in Rosita
The median household size in Rosita is 4.42 persons per household, with single female/mother households (172 | 20.4%) accounting for the largest median household size of 5.28 persons per household. non-family households (92 | 10.9%) represent the smallest median household size with 1.10 persons per household.
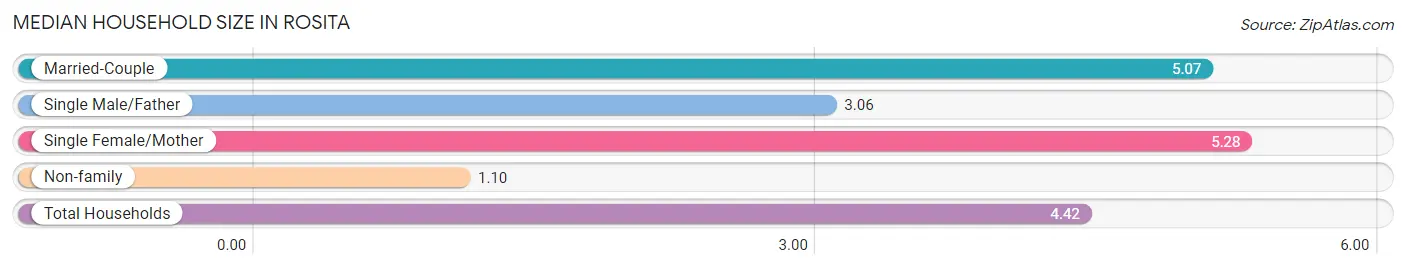
| Household Type | # Households | Household Size |
| Married-Couple | 469 (55.8%) | 5.07 |
| Single Male/Father | 108 (12.8%) | 3.06 |
| Single Female/Mother | 172 (20.4%) | 5.28 |
| Non-family | 92 (10.9%) | 1.10 |
| Total Households | 841 (100.0%) | 4.42 |
Household Size by Marriage Status in Rosita
Out of a total of 841 households in Rosita, 749 (89.1%) are family households, while 92 (10.9%) are nonfamily households. The most numerous type of family households are 3-person households, comprising 236, and the most common type of nonfamily households are 1-person households, comprising 85.
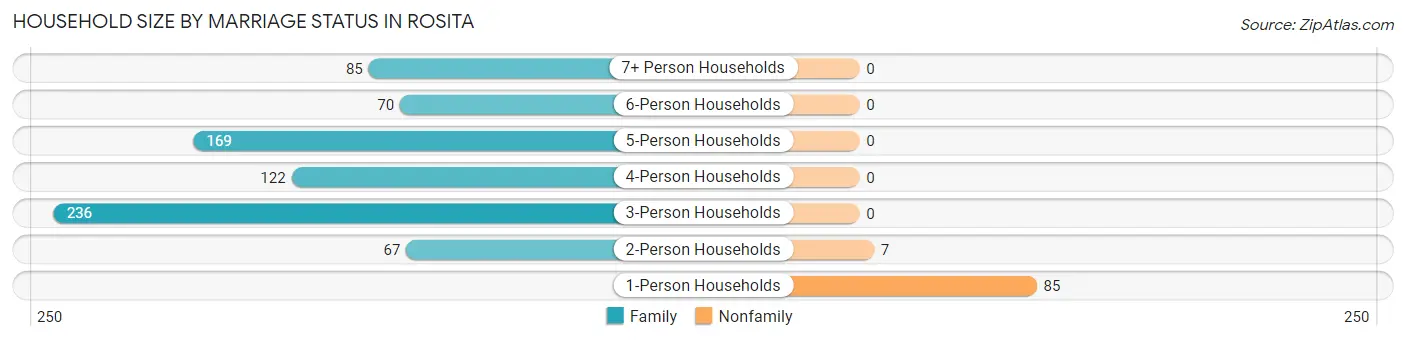
| Household Size | Family Households | Nonfamily Households |
| 1-Person Households | - | 85 (10.1%) |
| 2-Person Households | 67 (8.0%) | 7 (0.8%) |
| 3-Person Households | 236 (28.1%) | 0 (0.0%) |
| 4-Person Households | 122 (14.5%) | 0 (0.0%) |
| 5-Person Households | 169 (20.1%) | 0 (0.0%) |
| 6-Person Households | 70 (8.3%) | 0 (0.0%) |
| 7+ Person Households | 85 (10.1%) | 0 (0.0%) |
| Total | 749 (89.1%) | 92 (10.9%) |
Female Fertility in Rosita
Fertility by Age in Rosita
Average fertility rate in Rosita is 89.0 births per 1,000 women. Women in the age bracket of 20 to 34 years have the highest fertility rate with 182.0 births per 1,000 women. Women in the age bracket of 20 to 34 years acount for 89.9% of all women with births.
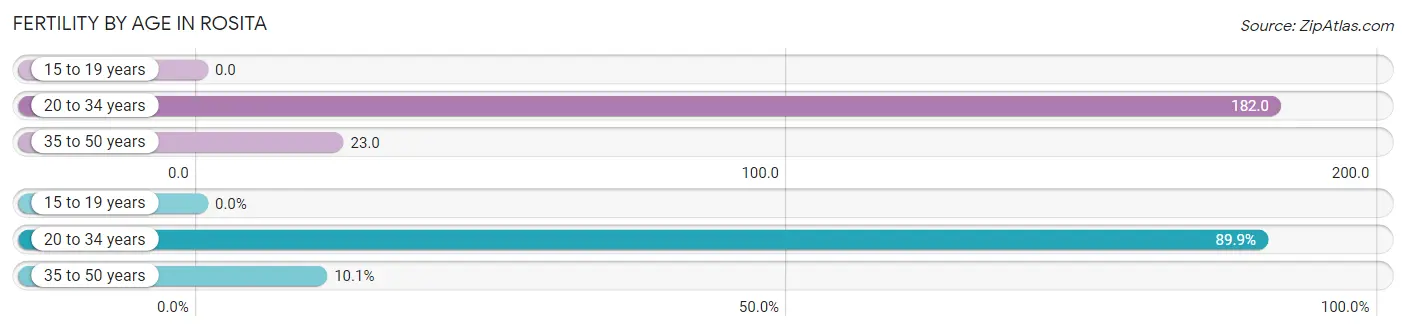
| Age Bracket | Women with Births | Births / 1,000 Women |
| 15 to 19 years | 0 (0.0%) | 0.0 |
| 20 to 34 years | 80 (89.9%) | 182.0 |
| 35 to 50 years | 9 (10.1%) | 23.0 |
| Total | 89 (100.0%) | 89.0 |
Fertility by Age by Marriage Status in Rosita
1.1% of women with births (89) in Rosita are married. The highest percentage of unmarried women with births falls into 35 to 50 years age bracket with 100.0% of them unmarried at the time of birth, while the lowest percentage of unmarried women with births belong to 20 to 34 years age bracket with 98.8% of them unmarried.
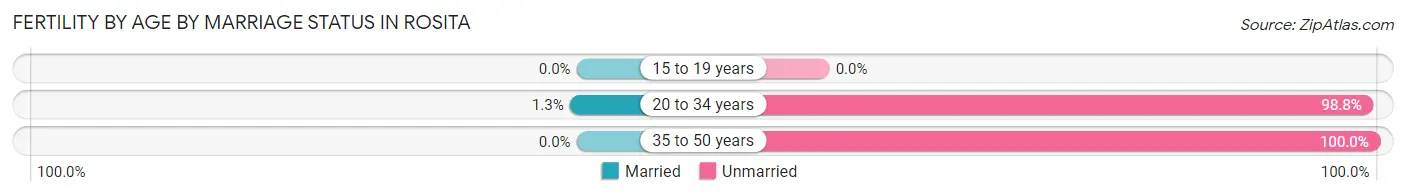
| Age Bracket | Married | Unmarried |
| 15 to 19 years | 0 (0.0%) | 0 (0.0%) |
| 20 to 34 years | 1 (1.3%) | 79 (98.8%) |
| 35 to 50 years | 0 (0.0%) | 9 (100.0%) |
| Total | 1 (1.1%) | 88 (98.9%) |
Fertility by Education in Rosita
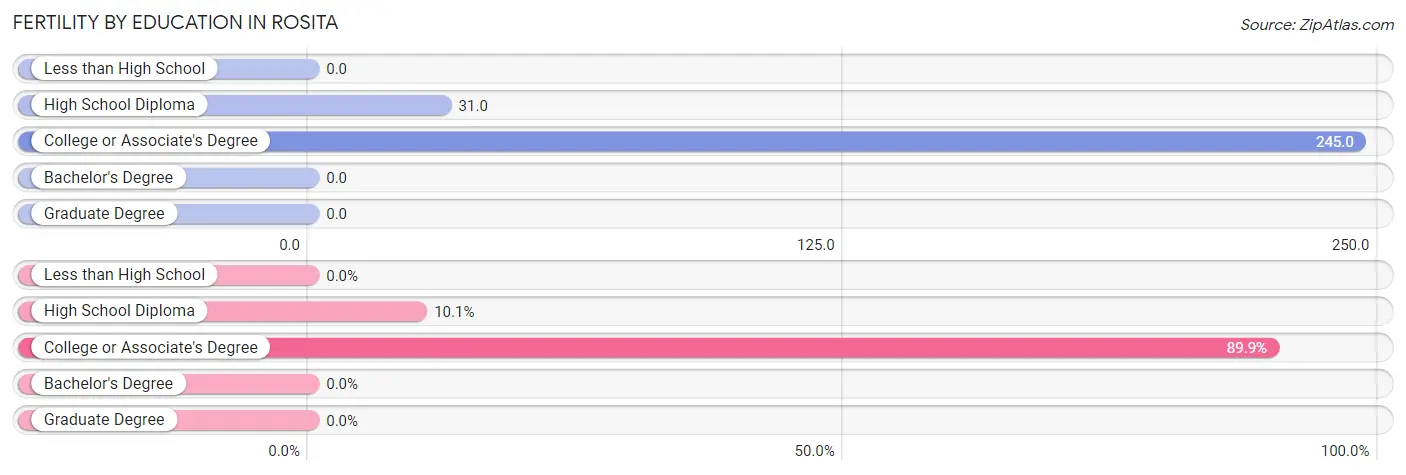
| Educational Attainment | Women with Births | Births / 1,000 Women |
| Less than High School | 0 (0.0%) | 0.0 |
| High School Diploma | 9 (10.1%) | 31.0 |
| College or Associate's Degree | 80 (89.9%) | 245.0 |
| Bachelor's Degree | 0 (0.0%) | 0.0 |
| Graduate Degree | 0 (0.0%) | 0.0 |
| Total | 89 (100.0%) | 89.0 |
Fertility by Education by Marriage Status in Rosita
98.9% of women with births in Rosita are unmarried. Women with the educational attainment of college or associate's degree are most likely to be married with 1.3% of them married at childbirth, while women with the educational attainment of high school diploma are least likely to be married with 100.0% of them unmarried at childbirth.
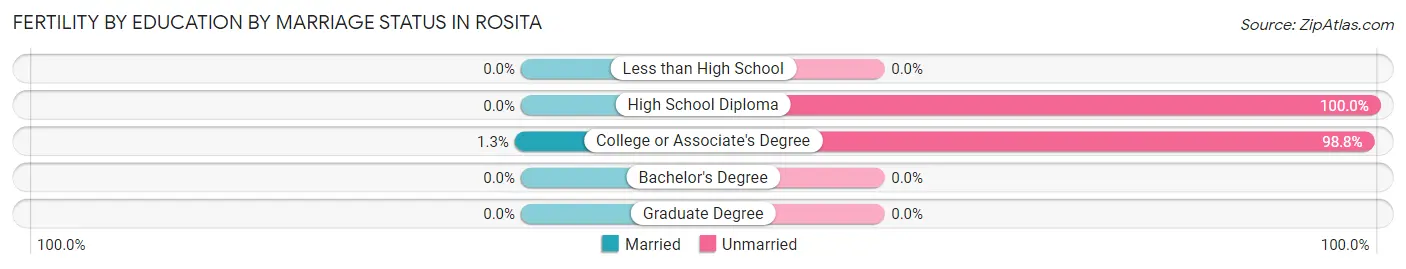
| Educational Attainment | Married | Unmarried |
| Less than High School | 0 (0.0%) | 0 (0.0%) |
| High School Diploma | 0 (0.0%) | 9 (100.0%) |
| College or Associate's Degree | 1 (1.3%) | 79 (98.8%) |
| Bachelor's Degree | 0 (0.0%) | 0 (0.0%) |
| Graduate Degree | 0 (0.0%) | 0 (0.0%) |
| Total | 1 (1.1%) | 88 (98.9%) |
Employment Characteristics in Rosita
Employment by Class of Employer in Rosita
Among the 1,356 employed individuals in Rosita, private company employees (920 | 67.8%), local government employees (235 | 17.3%), and federal government employees (111 | 8.2%) make up the most common classes of employment.
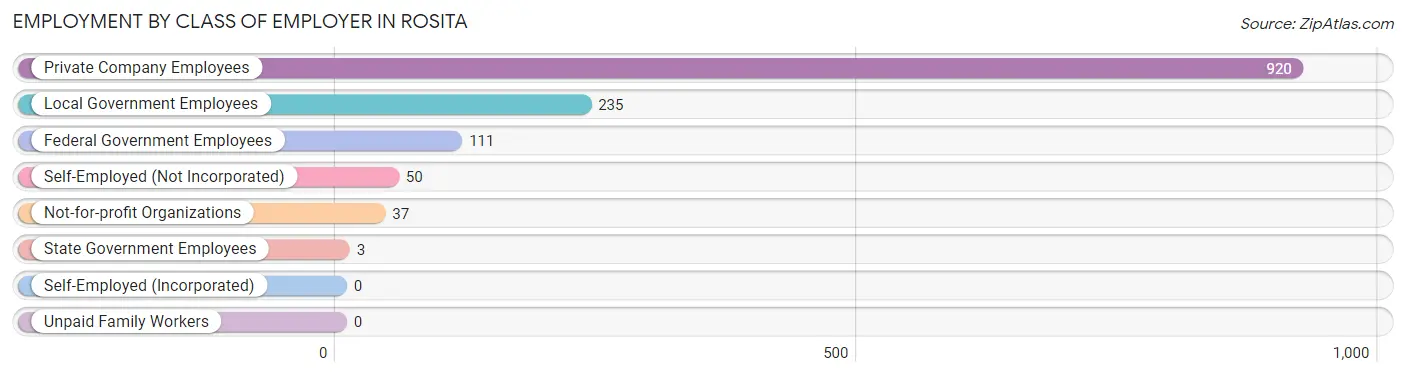
| Employer Class | # Employees | % Employees |
| Private Company Employees | 920 | 67.8% |
| Self-Employed (Incorporated) | 0 | 0.0% |
| Self-Employed (Not Incorporated) | 50 | 3.7% |
| Not-for-profit Organizations | 37 | 2.7% |
| Local Government Employees | 235 | 17.3% |
| State Government Employees | 3 | 0.2% |
| Federal Government Employees | 111 | 8.2% |
| Unpaid Family Workers | 0 | 0.0% |
| Total | 1,356 | 100.0% |
Employment Status by Age in Rosita
According to the labor force statistics for Rosita, out of the total population over 16 years of age (2,831), 56.5% or 1,600 individuals are in the labor force, with 13.8% or 221 of them unemployed. The age group with the highest labor force participation rate is 25 to 29 years, with 100.0% or 172 individuals in the labor force. Within the labor force, the 30 to 34 years age range has the highest percentage of unemployed individuals, with 40.4% or 23 of them being unemployed.
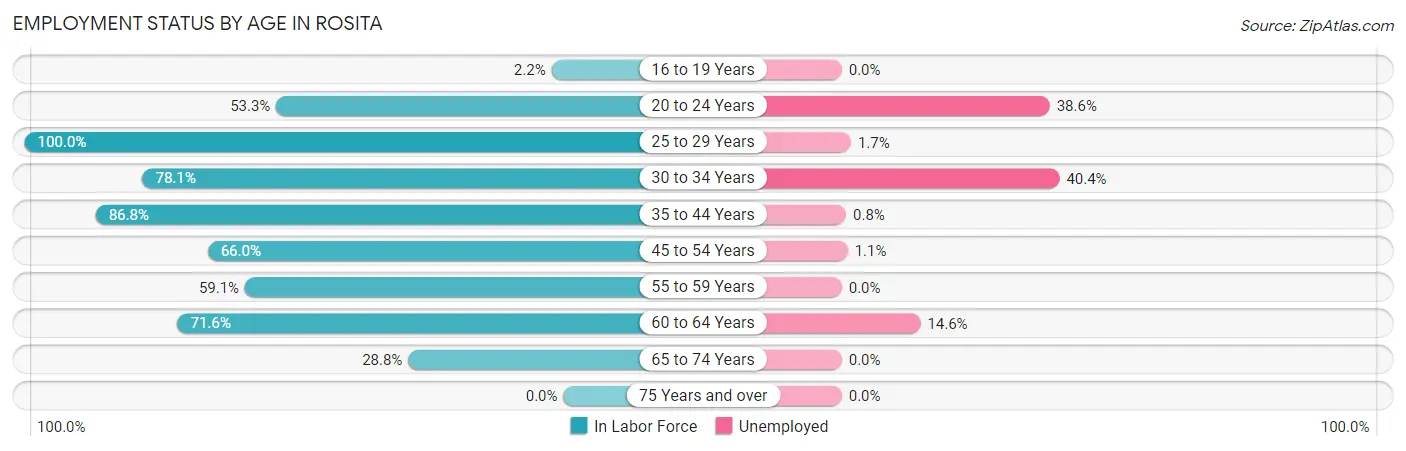
| Age Bracket | In Labor Force | Unemployed |
| 16 to 19 Years | 5 (2.2%) | 0 (0.0%) |
| 20 to 24 Years | 425 (53.3%) | 164 (38.6%) |
| 25 to 29 Years | 172 (100.0%) | 3 (1.7%) |
| 30 to 34 Years | 57 (78.1%) | 23 (40.4%) |
| 35 to 44 Years | 383 (86.8%) | 3 (0.8%) |
| 45 to 54 Years | 276 (66.0%) | 3 (1.1%) |
| 55 to 59 Years | 78 (59.1%) | 0 (0.0%) |
| 60 to 64 Years | 164 (71.6%) | 24 (14.6%) |
| 65 to 74 Years | 40 (28.8%) | 0 (0.0%) |
| 75 Years and over | 0 (0.0%) | 0 (0.0%) |
| Total | 1,600 (56.5%) | 221 (13.8%) |
Employment Status by Educational Attainment in Rosita
According to labor force statistics for Rosita, 77.1% of individuals (1,130) out of the total population between 25 and 64 years of age (1,465) are in the labor force, with 5.0% or 56 of them being unemployed. The group with the highest labor force participation rate are those with the educational attainment of bachelor's degree or higher, with 100.0% or 30 individuals in the labor force. Within the labor force, individuals with less than high school education have the highest percentage of unemployment, with 6.9% or 27 of them being unemployed.
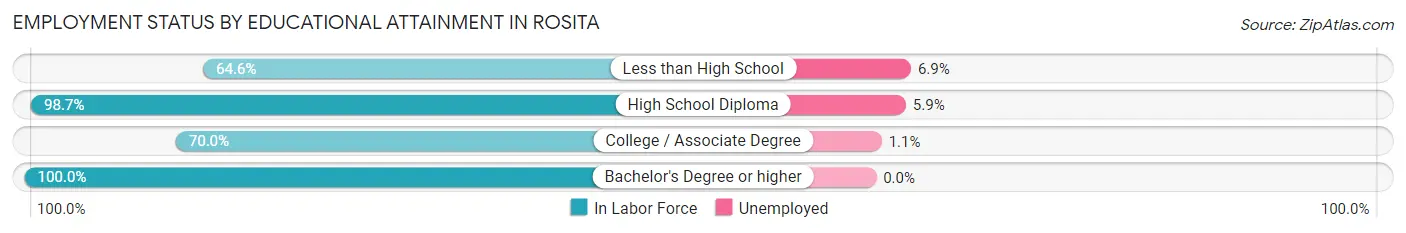
| Educational Attainment | In Labor Force | Unemployed |
| Less than High School | 390 (64.6%) | 42 (6.9%) |
| High School Diploma | 442 (98.7%) | 26 (5.9%) |
| College / Associate Degree | 268 (70.0%) | 4 (1.1%) |
| Bachelor's Degree or higher | 30 (100.0%) | 0 (0.0%) |
| Total | 1,130 (77.1%) | 73 (5.0%) |
Employment Occupations by Sex in Rosita
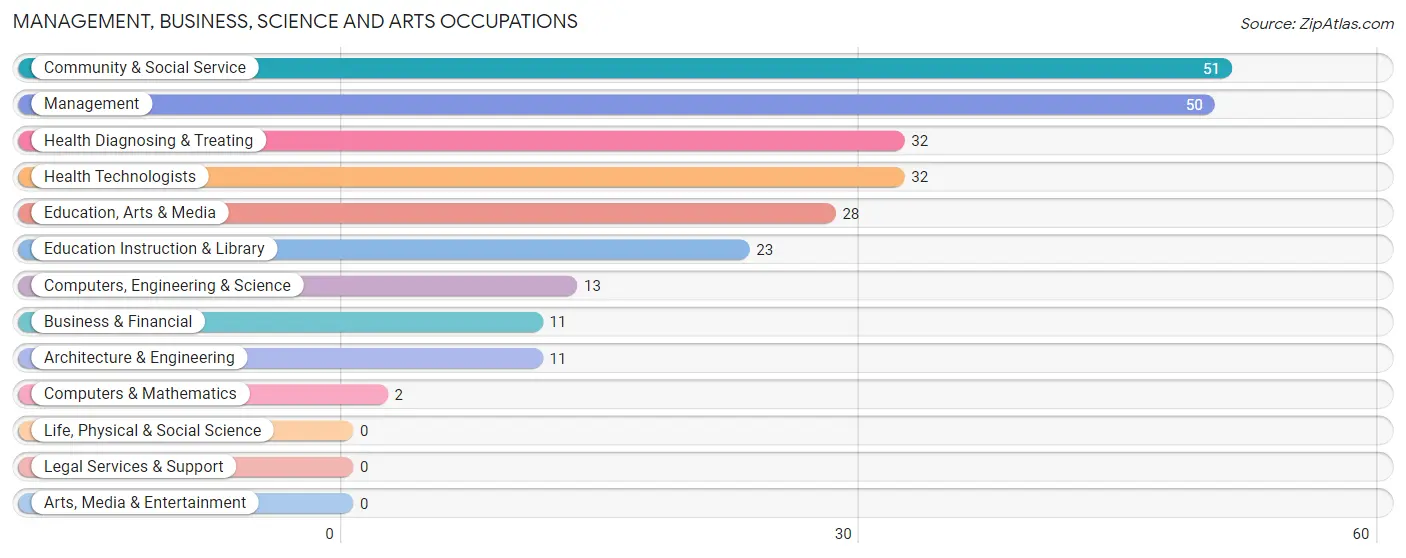
Management, Business, Science and Arts Occupations
The most common Management, Business, Science and Arts occupations in Rosita are Community & Social Service (51 | 3.7%), Management (50 | 3.6%), Health Diagnosing & Treating (32 | 2.3%), Health Technologists (32 | 2.3%), and Education, Arts & Media (28 | 2.0%).
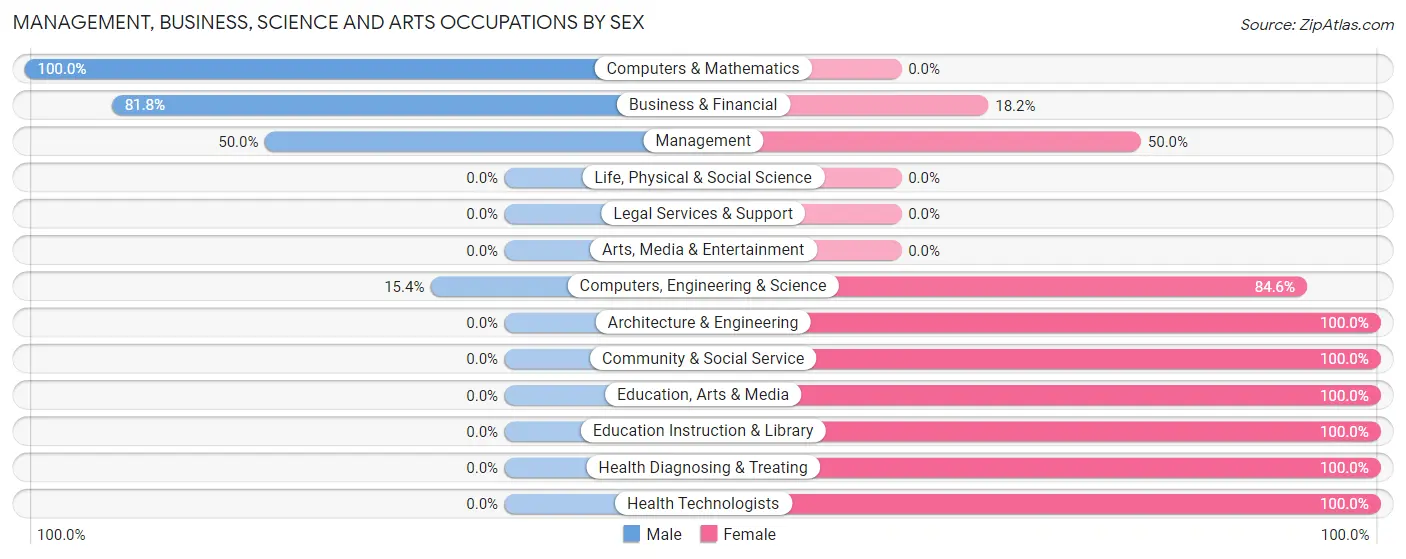
Management, Business, Science and Arts Occupations by Sex
Within the Management, Business, Science and Arts occupations in Rosita, the most male-oriented occupations are Computers & Mathematics (100.0%), Business & Financial (81.8%), and Management (50.0%), while the most female-oriented occupations are Architecture & Engineering (100.0%), Community & Social Service (100.0%), and Education, Arts & Media (100.0%).
| Occupation | Male | Female |
| Management | 25 (50.0%) | 25 (50.0%) |
| Business & Financial | 9 (81.8%) | 2 (18.2%) |
| Computers, Engineering & Science | 2 (15.4%) | 11 (84.6%) |
| Computers & Mathematics | 2 (100.0%) | 0 (0.0%) |
| Architecture & Engineering | 0 (0.0%) | 11 (100.0%) |
| Life, Physical & Social Science | 0 (0.0%) | 0 (0.0%) |
| Community & Social Service | 0 (0.0%) | 51 (100.0%) |
| Education, Arts & Media | 0 (0.0%) | 28 (100.0%) |
| Legal Services & Support | 0 (0.0%) | 0 (0.0%) |
| Education Instruction & Library | 0 (0.0%) | 23 (100.0%) |
| Arts, Media & Entertainment | 0 (0.0%) | 0 (0.0%) |
| Health Diagnosing & Treating | 0 (0.0%) | 32 (100.0%) |
| Health Technologists | 0 (0.0%) | 32 (100.0%) |
| Total (Category) | 36 (22.9%) | 121 (77.1%) |
| Total (Overall) | 766 (55.5%) | 614 (44.5%) |
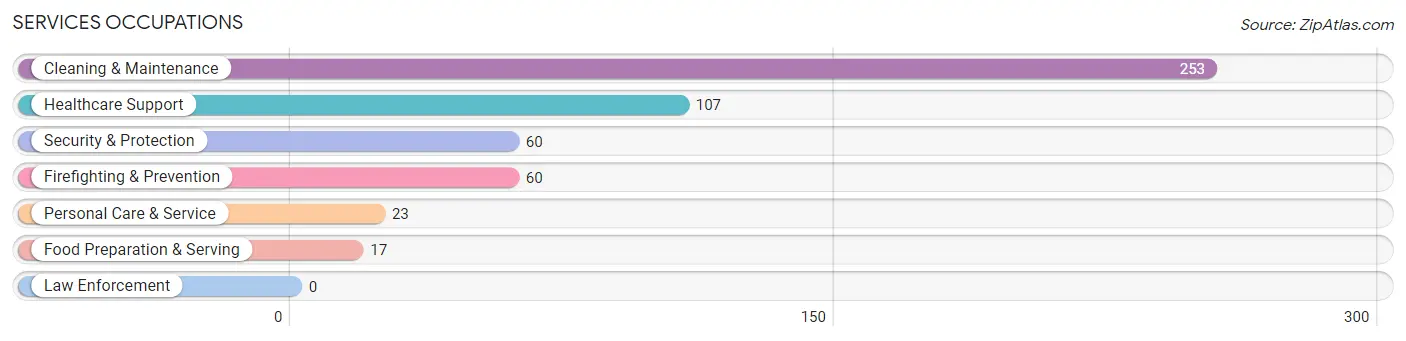
Services Occupations
The most common Services occupations in Rosita are Cleaning & Maintenance (253 | 18.3%), Healthcare Support (107 | 7.7%), Security & Protection (60 | 4.3%), Firefighting & Prevention (60 | 4.3%), and Personal Care & Service (23 | 1.7%).
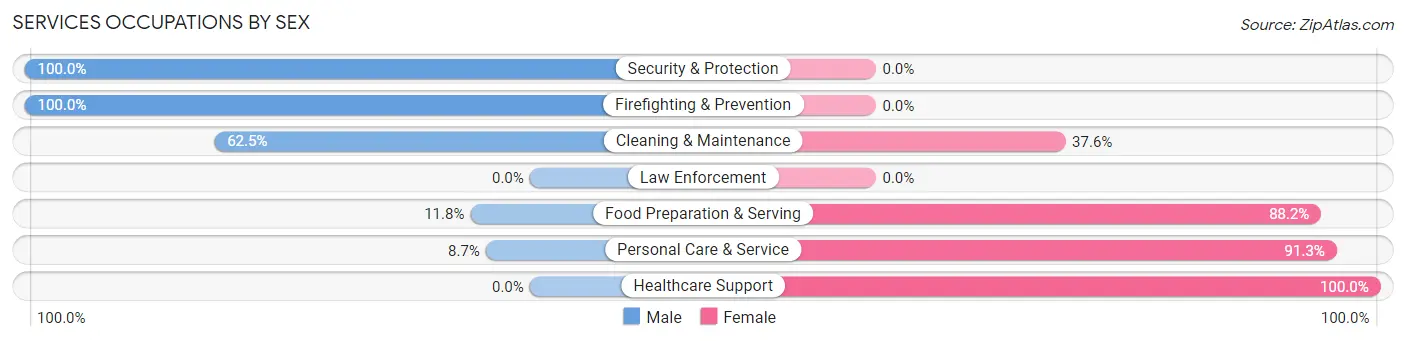
Services Occupations by Sex
Within the Services occupations in Rosita, the most male-oriented occupations are Security & Protection (100.0%), Firefighting & Prevention (100.0%), and Cleaning & Maintenance (62.5%), while the most female-oriented occupations are Healthcare Support (100.0%), Personal Care & Service (91.3%), and Food Preparation & Serving (88.2%).
| Occupation | Male | Female |
| Healthcare Support | 0 (0.0%) | 107 (100.0%) |
| Security & Protection | 60 (100.0%) | 0 (0.0%) |
| Firefighting & Prevention | 60 (100.0%) | 0 (0.0%) |
| Law Enforcement | 0 (0.0%) | 0 (0.0%) |
| Food Preparation & Serving | 2 (11.8%) | 15 (88.2%) |
| Cleaning & Maintenance | 158 (62.5%) | 95 (37.6%) |
| Personal Care & Service | 2 (8.7%) | 21 (91.3%) |
| Total (Category) | 222 (48.3%) | 238 (51.7%) |
| Total (Overall) | 766 (55.5%) | 614 (44.5%) |
Sales and Office Occupations
The most common Sales and Office occupations in Rosita are Sales & Related (148 | 10.7%), and Office & Administration (98 | 7.1%).
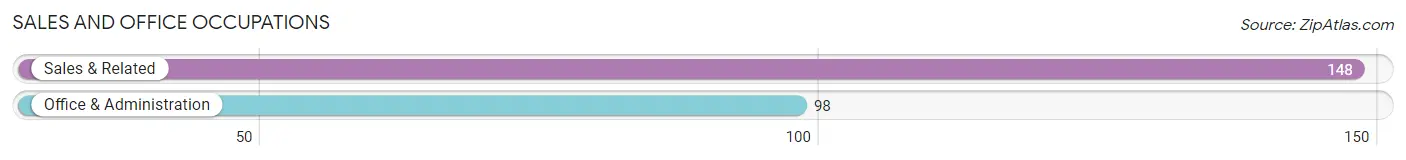
Sales and Office Occupations by Sex
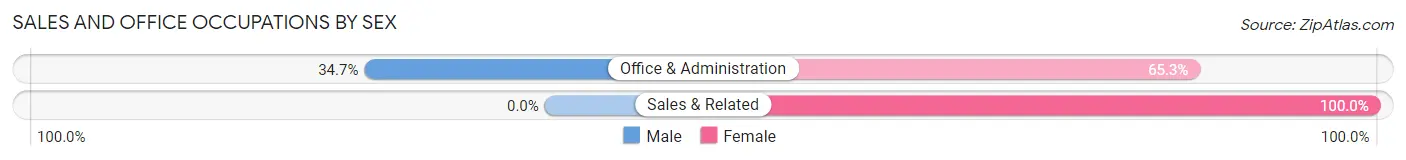
| Occupation | Male | Female |
| Sales & Related | 0 (0.0%) | 148 (100.0%) |
| Office & Administration | 34 (34.7%) | 64 (65.3%) |
| Total (Category) | 34 (13.8%) | 212 (86.2%) |
| Total (Overall) | 766 (55.5%) | 614 (44.5%) |
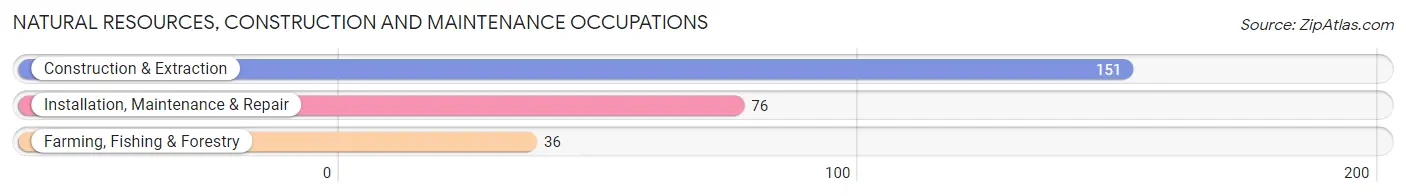
Natural Resources, Construction and Maintenance Occupations
The most common Natural Resources, Construction and Maintenance occupations in Rosita are Construction & Extraction (151 | 10.9%), Installation, Maintenance & Repair (76 | 5.5%), and Farming, Fishing & Forestry (36 | 2.6%).
Natural Resources, Construction and Maintenance Occupations by Sex
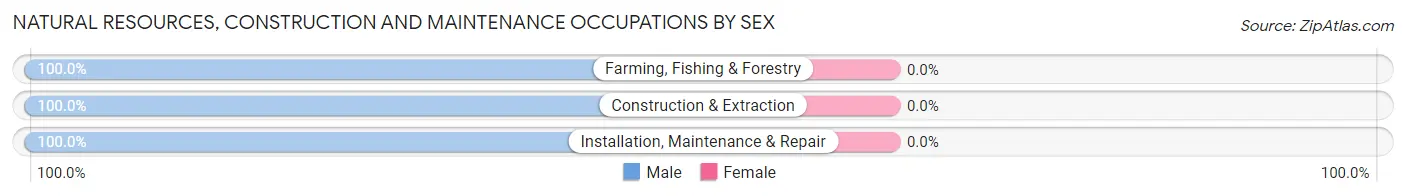
| Occupation | Male | Female |
| Farming, Fishing & Forestry | 36 (100.0%) | 0 (0.0%) |
| Construction & Extraction | 151 (100.0%) | 0 (0.0%) |
| Installation, Maintenance & Repair | 76 (100.0%) | 0 (0.0%) |
| Total (Category) | 263 (100.0%) | 0 (0.0%) |
| Total (Overall) | 766 (55.5%) | 614 (44.5%) |
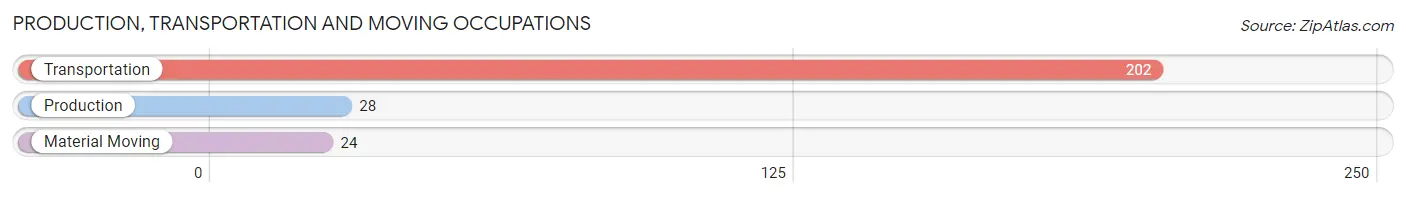
Production, Transportation and Moving Occupations
The most common Production, Transportation and Moving occupations in Rosita are Transportation (202 | 14.6%), Production (28 | 2.0%), and Material Moving (24 | 1.7%).
Production, Transportation and Moving Occupations by Sex
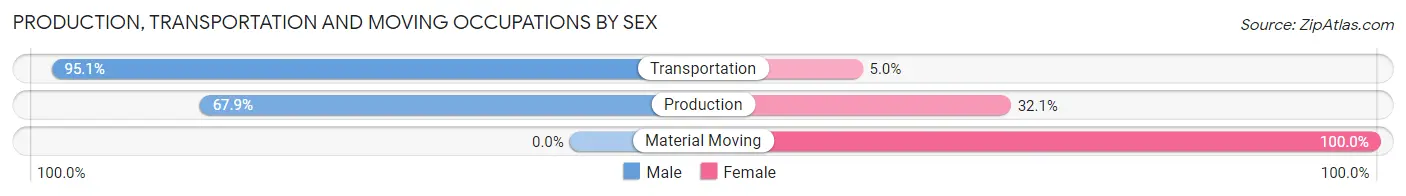
| Occupation | Male | Female |
| Production | 19 (67.9%) | 9 (32.1%) |
| Transportation | 192 (95.1%) | 10 (5.0%) |
| Material Moving | 0 (0.0%) | 24 (100.0%) |
| Total (Category) | 211 (83.1%) | 43 (16.9%) |
| Total (Overall) | 766 (55.5%) | 614 (44.5%) |
Employment Industries by Sex in Rosita
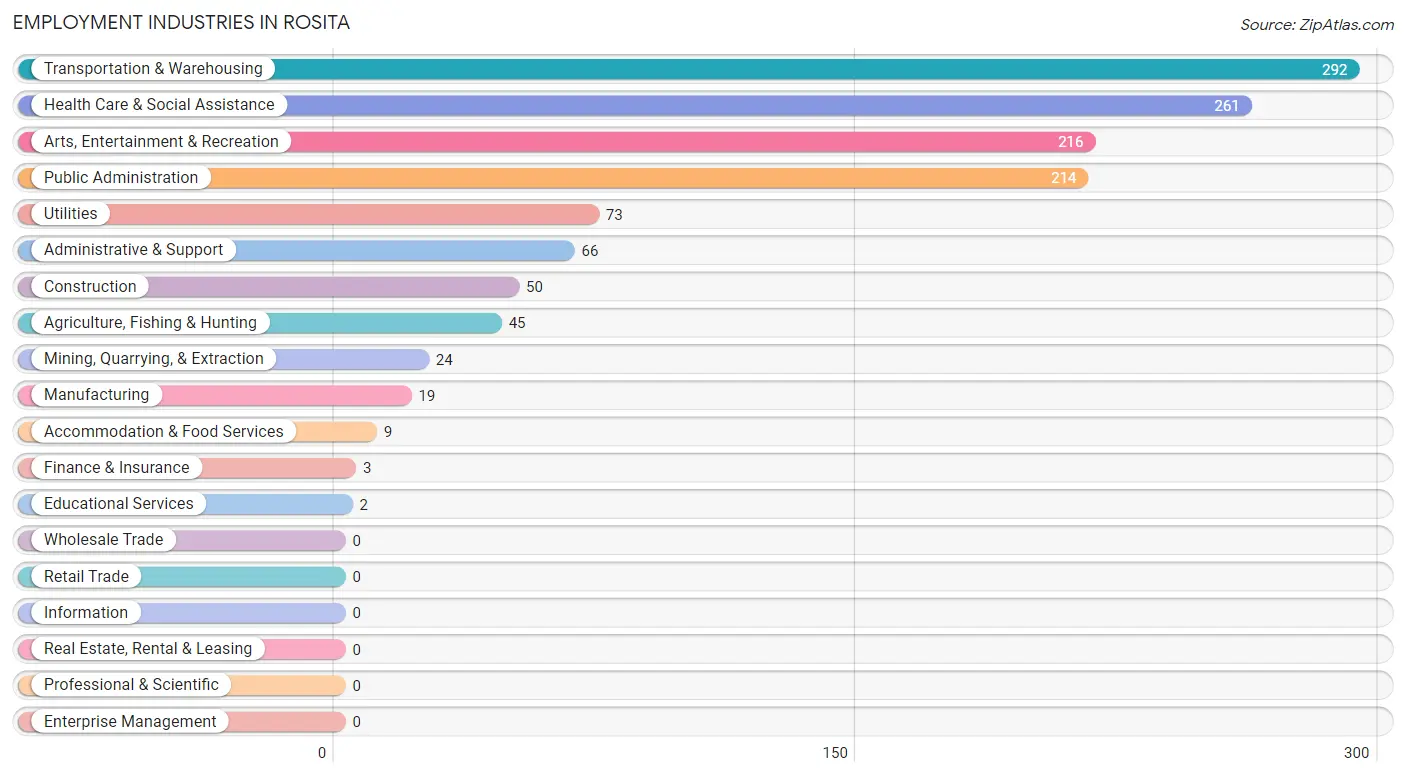
Employment Industries in Rosita
The major employment industries in Rosita include Transportation & Warehousing (292 | 21.2%), Health Care & Social Assistance (261 | 18.9%), Arts, Entertainment & Recreation (216 | 15.7%), Public Administration (214 | 15.5%), and Utilities (73 | 5.3%).
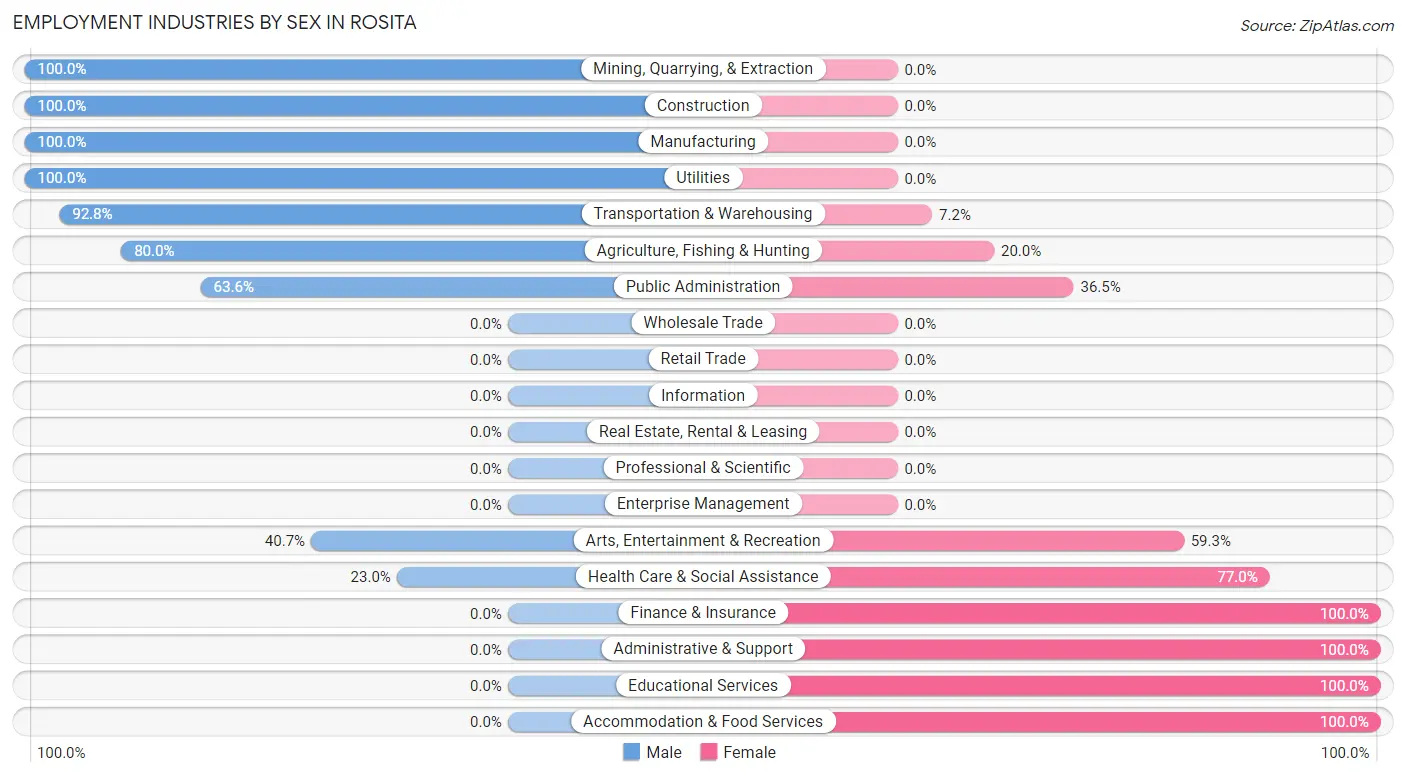
Employment Industries by Sex in Rosita
The Rosita industries that see more men than women are Mining, Quarrying, & Extraction (100.0%), Construction (100.0%), and Manufacturing (100.0%), whereas the industries that tend to have a higher number of women are Finance & Insurance (100.0%), Administrative & Support (100.0%), and Educational Services (100.0%).
| Industry | Male | Female |
| Agriculture, Fishing & Hunting | 36 (80.0%) | 9 (20.0%) |
| Mining, Quarrying, & Extraction | 24 (100.0%) | 0 (0.0%) |
| Construction | 50 (100.0%) | 0 (0.0%) |
| Manufacturing | 19 (100.0%) | 0 (0.0%) |
| Wholesale Trade | 0 (0.0%) | 0 (0.0%) |
| Retail Trade | 0 (0.0%) | 0 (0.0%) |
| Transportation & Warehousing | 271 (92.8%) | 21 (7.2%) |
| Utilities | 73 (100.0%) | 0 (0.0%) |
| Information | 0 (0.0%) | 0 (0.0%) |
| Finance & Insurance | 0 (0.0%) | 3 (100.0%) |
| Real Estate, Rental & Leasing | 0 (0.0%) | 0 (0.0%) |
| Professional & Scientific | 0 (0.0%) | 0 (0.0%) |
| Enterprise Management | 0 (0.0%) | 0 (0.0%) |
| Administrative & Support | 0 (0.0%) | 66 (100.0%) |
| Educational Services | 0 (0.0%) | 2 (100.0%) |
| Health Care & Social Assistance | 60 (23.0%) | 201 (77.0%) |
| Arts, Entertainment & Recreation | 88 (40.7%) | 128 (59.3%) |
| Accommodation & Food Services | 0 (0.0%) | 9 (100.0%) |
| Public Administration | 136 (63.5%) | 78 (36.4%) |
| Total | 766 (55.5%) | 614 (44.5%) |
Education in Rosita
School Enrollment in Rosita
The most common levels of schooling among the 949 students in Rosita are middle school (298 | 31.4%), high school (278 | 29.3%), and elementary school (170 | 17.9%).
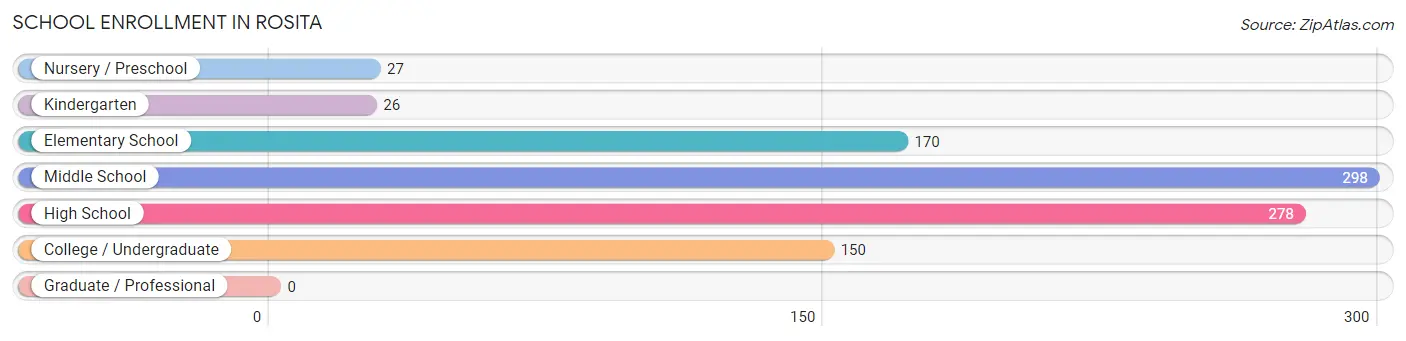
| School Level | # Students | % Students |
| Nursery / Preschool | 27 | 2.9% |
| Kindergarten | 26 | 2.7% |
| Elementary School | 170 | 17.9% |
| Middle School | 298 | 31.4% |
| High School | 278 | 29.3% |
| College / Undergraduate | 150 | 15.8% |
| Graduate / Professional | 0 | 0.0% |
| Total | 949 | 100.0% |
School Enrollment by Age by Funding Source in Rosita
Out of a total of 949 students who are enrolled in schools in Rosita, 47 (5.0%) attend a private institution, while the remaining 902 (95.0%) are enrolled in public schools. The age group of 3 to 4 year olds has the highest likelihood of being enrolled in private schools, with 12 (66.7% in the age bracket) enrolled. Conversely, the age group of 5 to 9 year old has the lowest likelihood of being enrolled in a private school, with 167 (100.0% in the age bracket) attending a public institution.
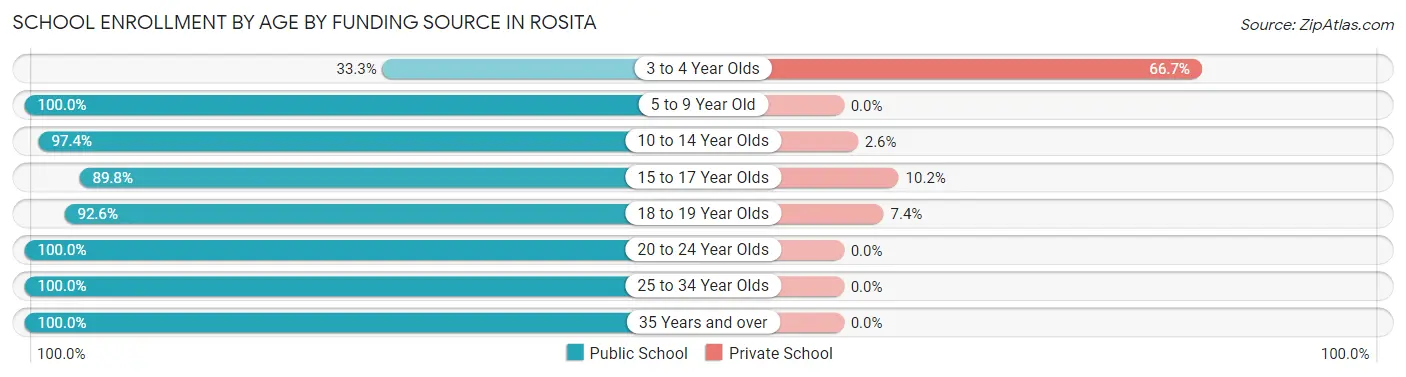
| Age Bracket | Public School | Private School |
| 3 to 4 Year Olds | 6 (33.3%) | 12 (66.7%) |
| 5 to 9 Year Old | 167 (100.0%) | 0 (0.0%) |
| 10 to 14 Year Olds | 333 (97.4%) | 9 (2.6%) |
| 15 to 17 Year Olds | 149 (89.8%) | 17 (10.2%) |
| 18 to 19 Year Olds | 112 (92.6%) | 9 (7.4%) |
| 20 to 24 Year Olds | 54 (100.0%) | 0 (0.0%) |
| 25 to 34 Year Olds | 77 (100.0%) | 0 (0.0%) |
| 35 Years and over | 4 (100.0%) | 0 (0.0%) |
| Total | 902 (95.0%) | 47 (5.0%) |
Educational Attainment by Field of Study in Rosita
Science & technology (29 | 96.7%), and business (1 | 3.3%) are the most common fields of study among 30 individuals in Rosita who have obtained a bachelor's degree or higher.
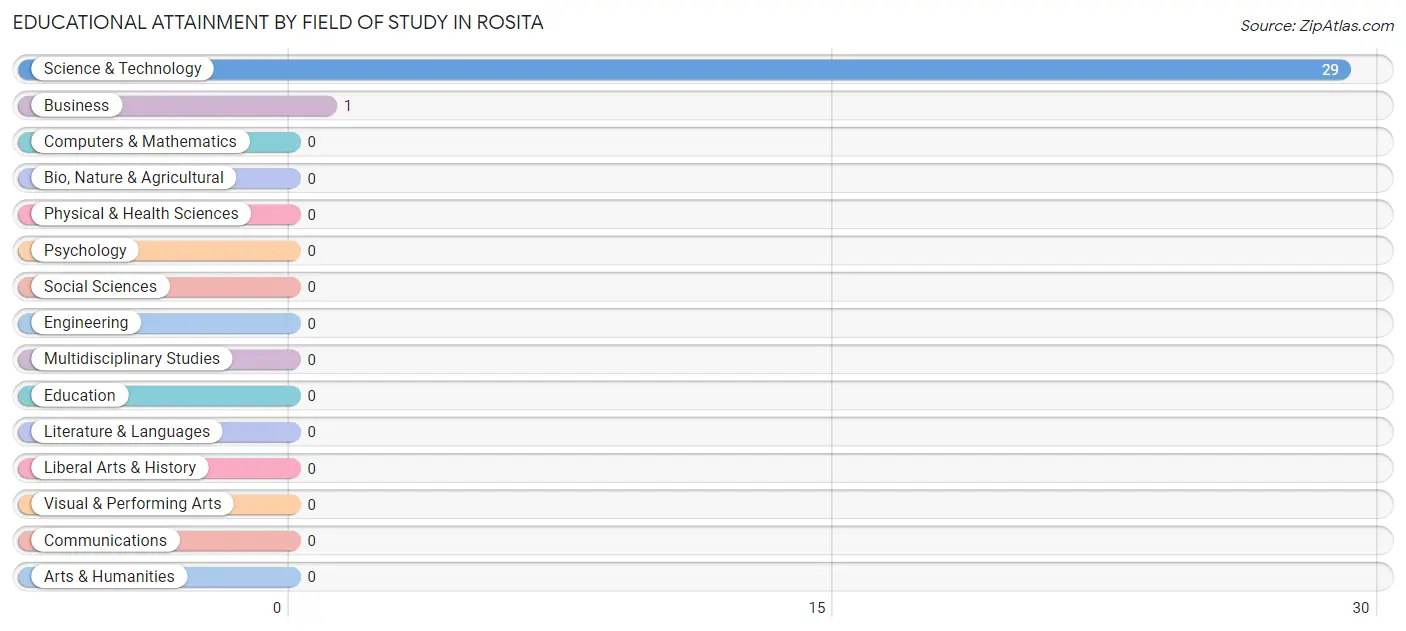
| Field of Study | # Graduates | % Graduates |
| Computers & Mathematics | 0 | 0.0% |
| Bio, Nature & Agricultural | 0 | 0.0% |
| Physical & Health Sciences | 0 | 0.0% |
| Psychology | 0 | 0.0% |
| Social Sciences | 0 | 0.0% |
| Engineering | 0 | 0.0% |
| Multidisciplinary Studies | 0 | 0.0% |
| Science & Technology | 29 | 96.7% |
| Business | 1 | 3.3% |
| Education | 0 | 0.0% |
| Literature & Languages | 0 | 0.0% |
| Liberal Arts & History | 0 | 0.0% |
| Visual & Performing Arts | 0 | 0.0% |
| Communications | 0 | 0.0% |
| Arts & Humanities | 0 | 0.0% |
| Total | 30 | 100.0% |
Transportation & Commute in Rosita
Vehicle Availability by Sex in Rosita
The most prevalent vehicle ownership categories in Rosita are males with 2 vehicles (331, accounting for 43.7%) and females with 2 vehicles (211, making up 55.3%).
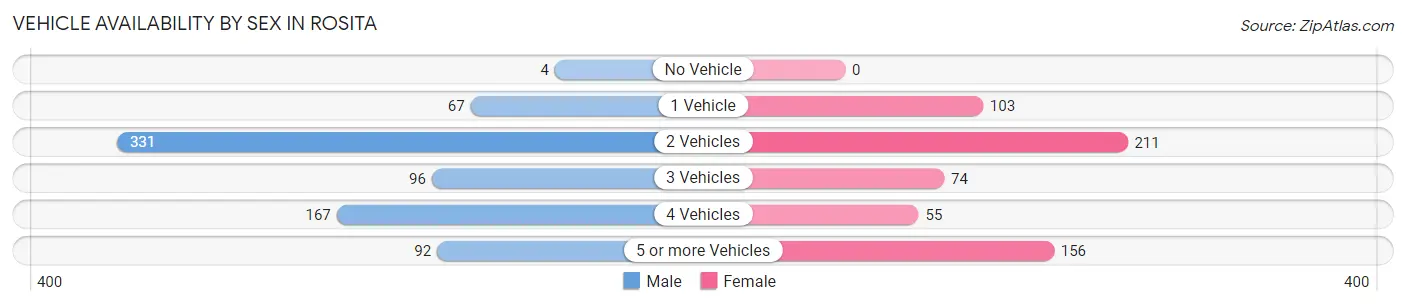
| Vehicles Available | Male | Female |
| No Vehicle | 4 (0.5%) | 0 (0.0%) |
| 1 Vehicle | 67 (8.8%) | 103 (17.2%) |
| 2 Vehicles | 331 (43.7%) | 211 (35.2%) |
| 3 Vehicles | 96 (12.7%) | 74 (12.3%) |
| 4 Vehicles | 167 (22.1%) | 55 (9.2%) |
| 5 or more Vehicles | 92 (12.1%) | 156 (26.0%) |
| Total | 757 (100.0%) | 599 (100.0%) |
Commute Time in Rosita
The most frequently occuring commute durations in Rosita are 30 to 34 minutes (338 commuters, 24.9%), 5 to 9 minutes (302 commuters, 22.3%), and 15 to 19 minutes (174 commuters, 12.8%).
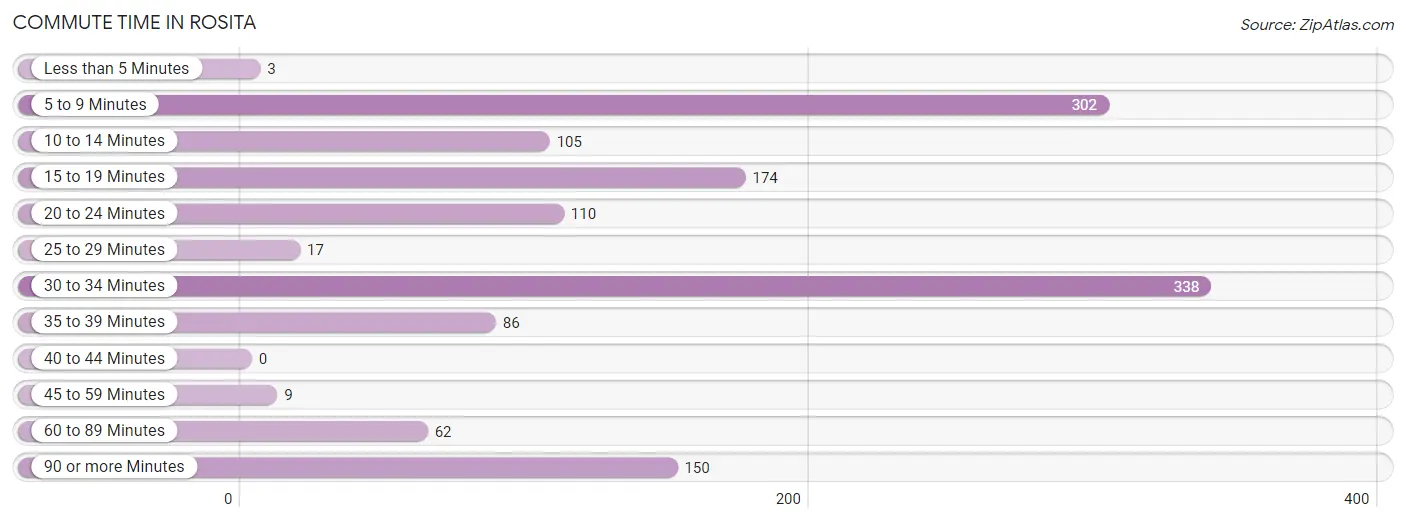
| Commute Time | # Commuters | % Commuters |
| Less than 5 Minutes | 3 | 0.2% |
| 5 to 9 Minutes | 302 | 22.3% |
| 10 to 14 Minutes | 105 | 7.7% |
| 15 to 19 Minutes | 174 | 12.8% |
| 20 to 24 Minutes | 110 | 8.1% |
| 25 to 29 Minutes | 17 | 1.3% |
| 30 to 34 Minutes | 338 | 24.9% |
| 35 to 39 Minutes | 86 | 6.3% |
| 40 to 44 Minutes | 0 | 0.0% |
| 45 to 59 Minutes | 9 | 0.7% |
| 60 to 89 Minutes | 62 | 4.6% |
| 90 or more Minutes | 150 | 11.1% |
Commute Time by Sex in Rosita
The most common commute times in Rosita are 30 to 34 minutes (170 commuters, 22.5%) for males and 5 to 9 minutes (225 commuters, 37.6%) for females.
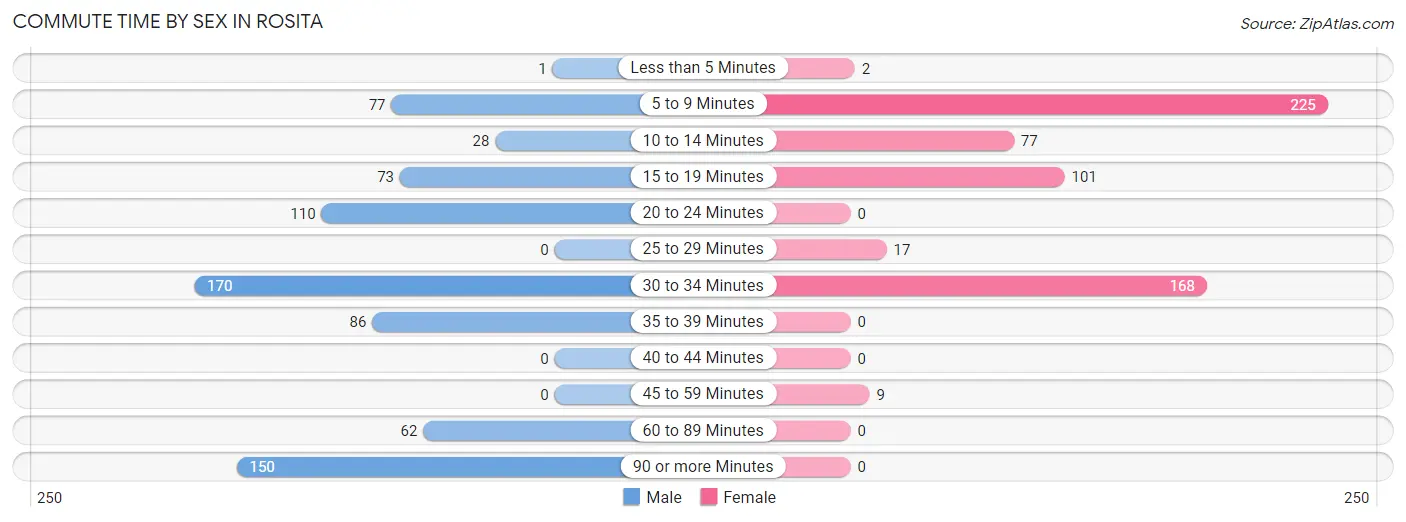
| Commute Time | Male | Female |
| Less than 5 Minutes | 1 (0.1%) | 2 (0.3%) |
| 5 to 9 Minutes | 77 (10.2%) | 225 (37.6%) |
| 10 to 14 Minutes | 28 (3.7%) | 77 (12.9%) |
| 15 to 19 Minutes | 73 (9.6%) | 101 (16.9%) |
| 20 to 24 Minutes | 110 (14.5%) | 0 (0.0%) |
| 25 to 29 Minutes | 0 (0.0%) | 17 (2.8%) |
| 30 to 34 Minutes | 170 (22.5%) | 168 (28.1%) |
| 35 to 39 Minutes | 86 (11.4%) | 0 (0.0%) |
| 40 to 44 Minutes | 0 (0.0%) | 0 (0.0%) |
| 45 to 59 Minutes | 0 (0.0%) | 9 (1.5%) |
| 60 to 89 Minutes | 62 (8.2%) | 0 (0.0%) |
| 90 or more Minutes | 150 (19.8%) | 0 (0.0%) |
Time of Departure to Work by Sex in Rosita
The most frequent times of departure to work in Rosita are 5:00 AM to 5:29 AM (161, 21.3%) for males and 8:00 AM to 8:29 AM (130, 21.7%) for females.
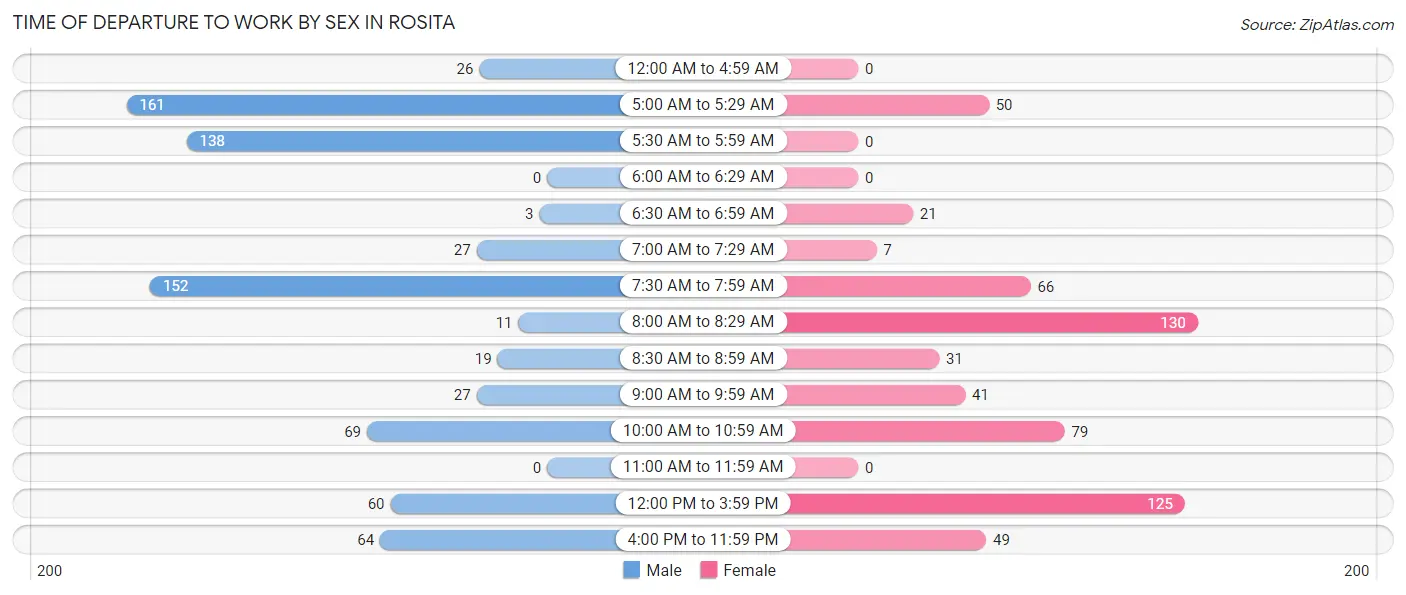
| Time of Departure | Male | Female |
| 12:00 AM to 4:59 AM | 26 (3.4%) | 0 (0.0%) |
| 5:00 AM to 5:29 AM | 161 (21.3%) | 50 (8.4%) |
| 5:30 AM to 5:59 AM | 138 (18.2%) | 0 (0.0%) |
| 6:00 AM to 6:29 AM | 0 (0.0%) | 0 (0.0%) |
| 6:30 AM to 6:59 AM | 3 (0.4%) | 21 (3.5%) |
| 7:00 AM to 7:29 AM | 27 (3.6%) | 7 (1.2%) |
| 7:30 AM to 7:59 AM | 152 (20.1%) | 66 (11.0%) |
| 8:00 AM to 8:29 AM | 11 (1.5%) | 130 (21.7%) |
| 8:30 AM to 8:59 AM | 19 (2.5%) | 31 (5.2%) |
| 9:00 AM to 9:59 AM | 27 (3.6%) | 41 (6.8%) |
| 10:00 AM to 10:59 AM | 69 (9.1%) | 79 (13.2%) |
| 11:00 AM to 11:59 AM | 0 (0.0%) | 0 (0.0%) |
| 12:00 PM to 3:59 PM | 60 (7.9%) | 125 (20.9%) |
| 4:00 PM to 11:59 PM | 64 (8.5%) | 49 (8.2%) |
| Total | 757 (100.0%) | 599 (100.0%) |
Housing Occupancy in Rosita
Occupancy by Ownership in Rosita
Of the total 841 dwellings in Rosita, owner-occupied units account for 756 (89.9%), while renter-occupied units make up 85 (10.1%).
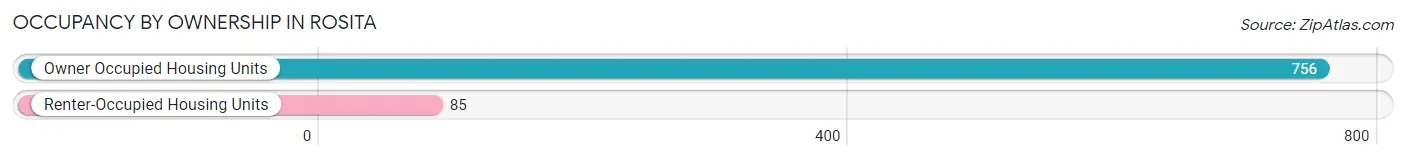
| Occupancy | # Housing Units | % Housing Units |
| Owner Occupied Housing Units | 756 | 89.9% |
| Renter-Occupied Housing Units | 85 | 10.1% |
| Total Occupied Housing Units | 841 | 100.0% |
Occupancy by Household Size in Rosita
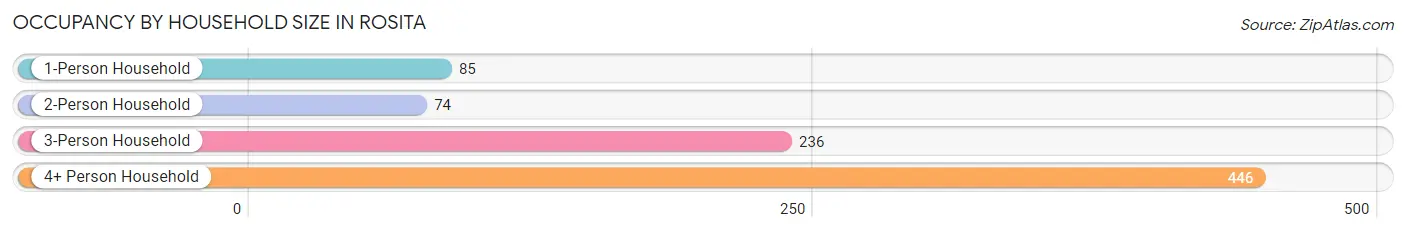
| Household Size | # Housing Units | % Housing Units |
| 1-Person Household | 85 | 10.1% |
| 2-Person Household | 74 | 8.8% |
| 3-Person Household | 236 | 28.1% |
| 4+ Person Household | 446 | 53.0% |
| Total Housing Units | 841 | 100.0% |
Occupancy by Ownership by Household Size in Rosita
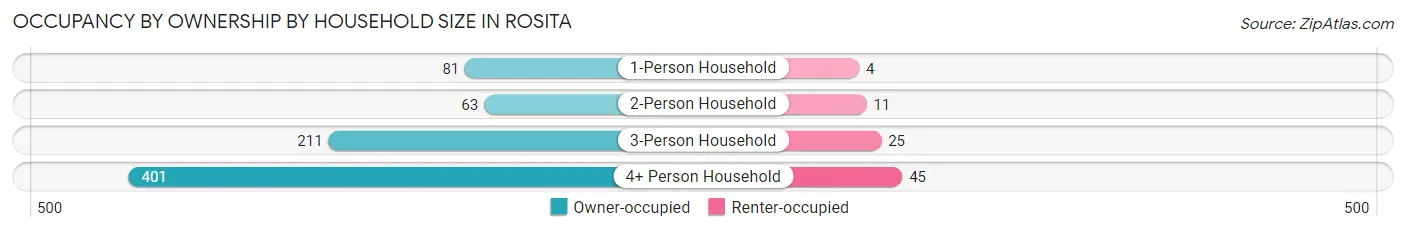
| Household Size | Owner-occupied | Renter-occupied |
| 1-Person Household | 81 (95.3%) | 4 (4.7%) |
| 2-Person Household | 63 (85.1%) | 11 (14.9%) |
| 3-Person Household | 211 (89.4%) | 25 (10.6%) |
| 4+ Person Household | 401 (89.9%) | 45 (10.1%) |
| Total Housing Units | 756 (89.9%) | 85 (10.1%) |
Occupancy by Educational Attainment in Rosita
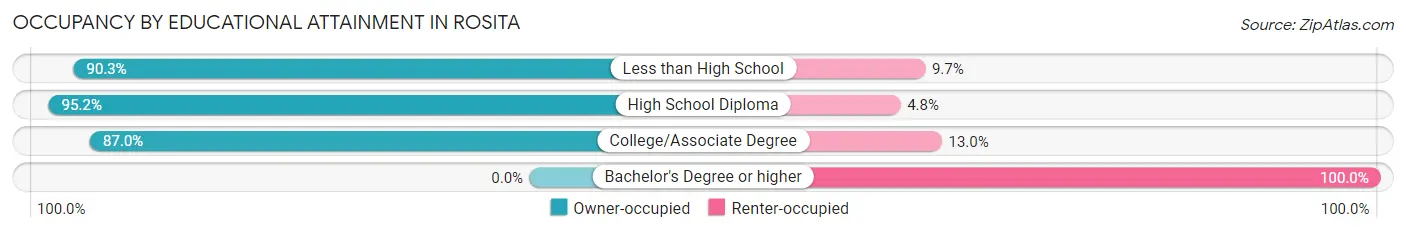
| Household Size | Owner-occupied | Renter-occupied |
| Less than High School | 401 (90.3%) | 43 (9.7%) |
| High School Diploma | 120 (95.2%) | 6 (4.8%) |
| College/Associate Degree | 235 (87.0%) | 35 (13.0%) |
| Bachelor's Degree or higher | 0 (0.0%) | 1 (100.0%) |
Occupancy by Age of Householder in Rosita
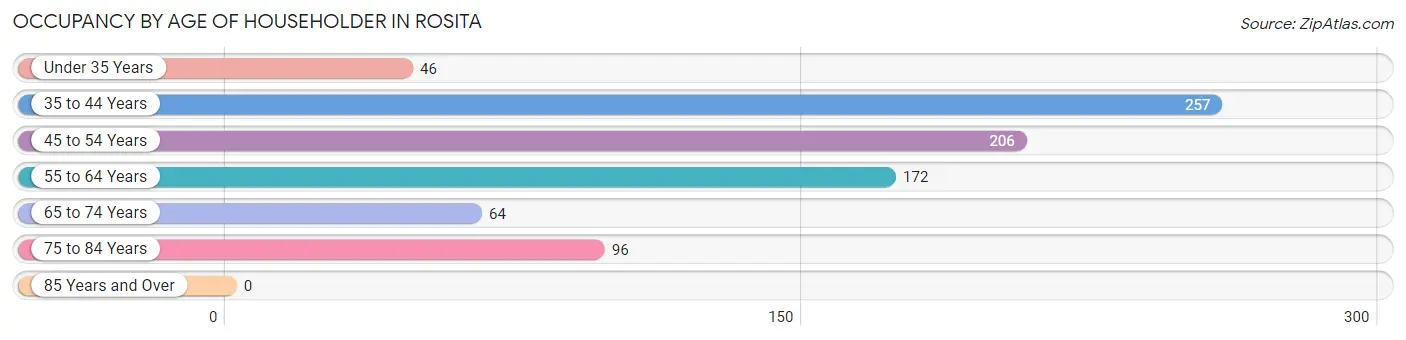
| Age Bracket | # Households | % Households |
| Under 35 Years | 46 | 5.5% |
| 35 to 44 Years | 257 | 30.6% |
| 45 to 54 Years | 206 | 24.5% |
| 55 to 64 Years | 172 | 20.4% |
| 65 to 74 Years | 64 | 7.6% |
| 75 to 84 Years | 96 | 11.4% |
| 85 Years and Over | 0 | 0.0% |
| Total | 841 | 100.0% |
Housing Finances in Rosita
Median Income by Occupancy in Rosita
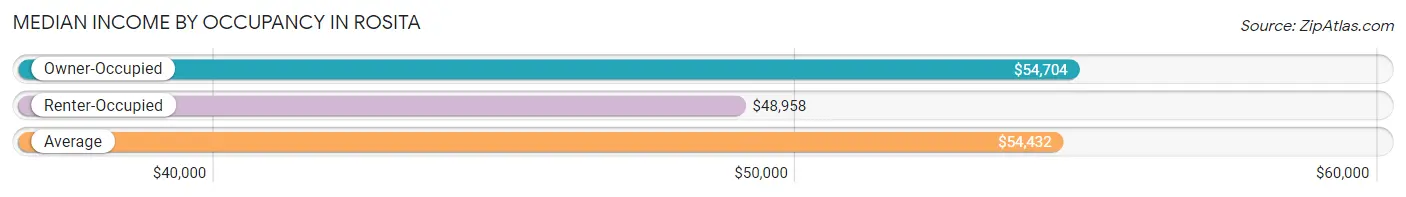
| Occupancy Type | # Households | Median Income |
| Owner-Occupied | 756 (89.9%) | $54,704 |
| Renter-Occupied | 85 (10.1%) | $48,958 |
| Average | 841 (100.0%) | $54,432 |
Occupancy by Householder Income Bracket in Rosita
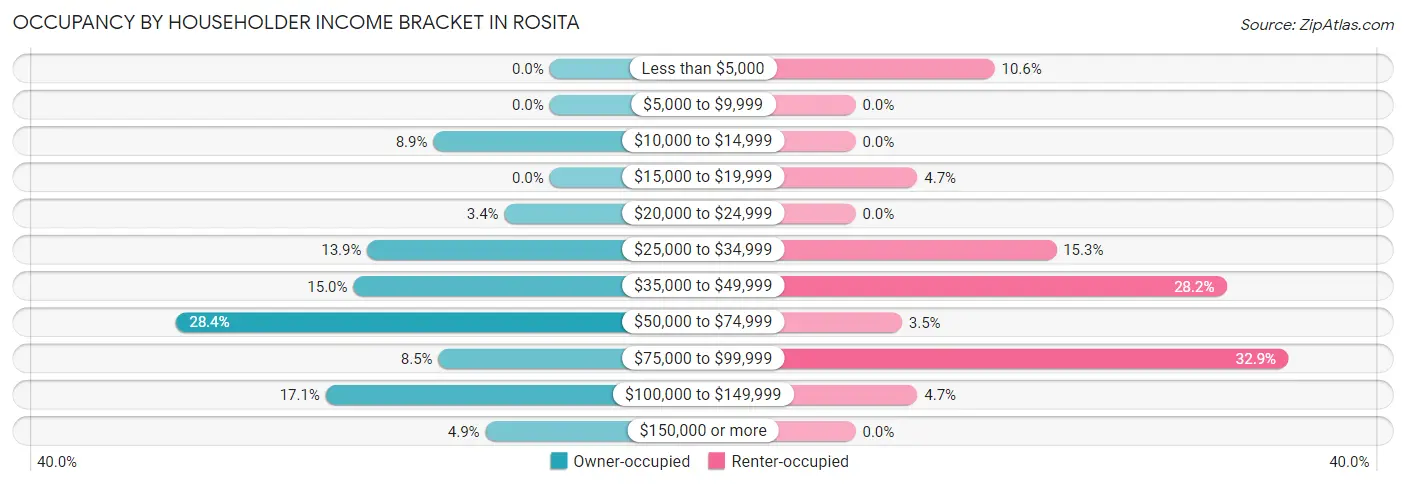
| Income Bracket | Owner-occupied | Renter-occupied |
| Less than $5,000 | 0 (0.0%) | 9 (10.6%) |
| $5,000 to $9,999 | 0 (0.0%) | 0 (0.0%) |
| $10,000 to $14,999 | 67 (8.9%) | 0 (0.0%) |
| $15,000 to $19,999 | 0 (0.0%) | 4 (4.7%) |
| $20,000 to $24,999 | 26 (3.4%) | 0 (0.0%) |
| $25,000 to $34,999 | 105 (13.9%) | 13 (15.3%) |
| $35,000 to $49,999 | 113 (14.9%) | 24 (28.2%) |
| $50,000 to $74,999 | 215 (28.4%) | 3 (3.5%) |
| $75,000 to $99,999 | 64 (8.5%) | 28 (32.9%) |
| $100,000 to $149,999 | 129 (17.1%) | 4 (4.7%) |
| $150,000 or more | 37 (4.9%) | 0 (0.0%) |
| Total | 756 (100.0%) | 85 (100.0%) |
Monthly Housing Cost Tiers in Rosita
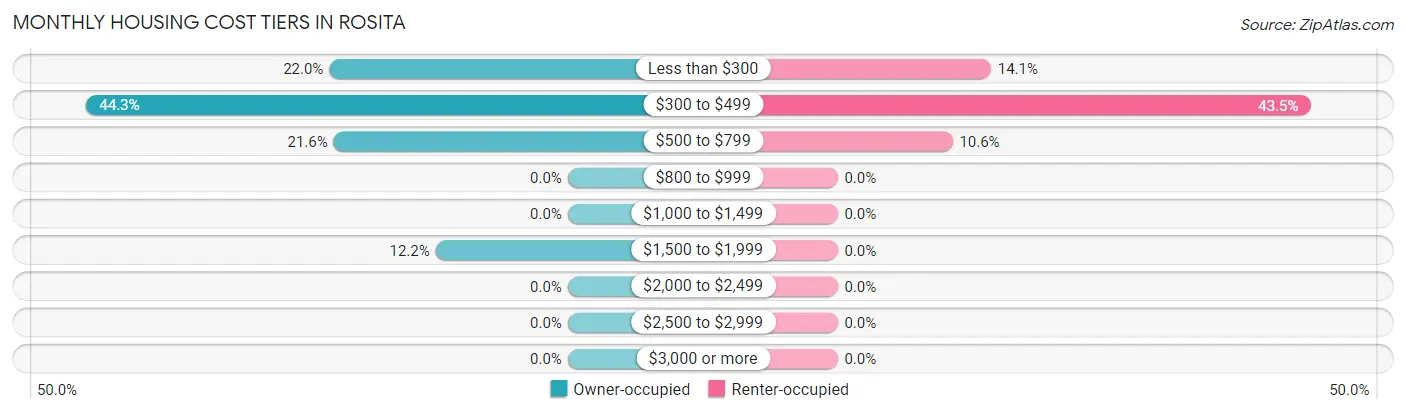
| Monthly Cost | Owner-occupied | Renter-occupied |
| Less than $300 | 166 (22.0%) | 12 (14.1%) |
| $300 to $499 | 335 (44.3%) | 37 (43.5%) |
| $500 to $799 | 163 (21.6%) | 9 (10.6%) |
| $800 to $999 | 0 (0.0%) | 0 (0.0%) |
| $1,000 to $1,499 | 0 (0.0%) | 0 (0.0%) |
| $1,500 to $1,999 | 92 (12.2%) | 0 (0.0%) |
| $2,000 to $2,499 | 0 (0.0%) | 0 (0.0%) |
| $2,500 to $2,999 | 0 (0.0%) | 0 (0.0%) |
| $3,000 or more | 0 (0.0%) | 0 (0.0%) |
| Total | 756 (100.0%) | 85 (100.0%) |
Physical Housing Characteristics in Rosita
Housing Structures in Rosita
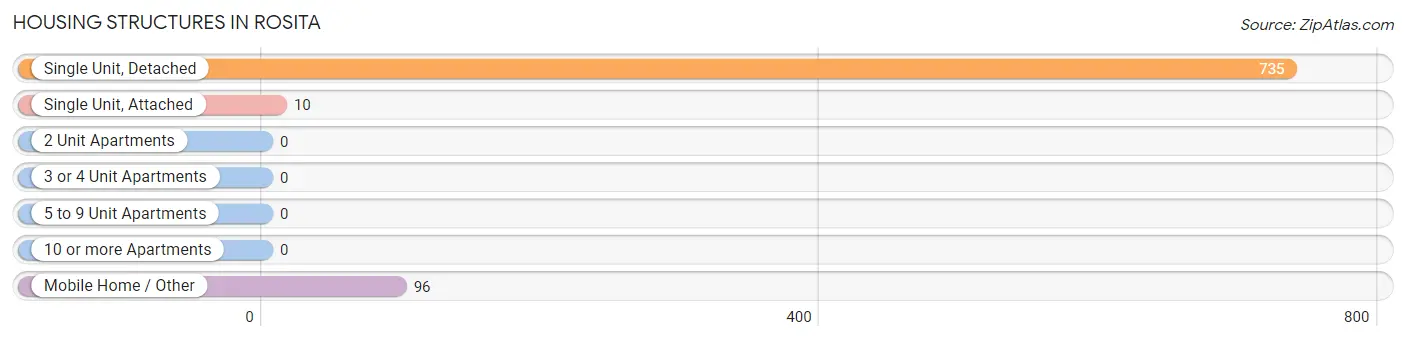
| Structure Type | # Housing Units | % Housing Units |
| Single Unit, Detached | 735 | 87.4% |
| Single Unit, Attached | 10 | 1.2% |
| 2 Unit Apartments | 0 | 0.0% |
| 3 or 4 Unit Apartments | 0 | 0.0% |
| 5 to 9 Unit Apartments | 0 | 0.0% |
| 10 or more Apartments | 0 | 0.0% |
| Mobile Home / Other | 96 | 11.4% |
| Total | 841 | 100.0% |
Housing Structures by Occupancy in Rosita
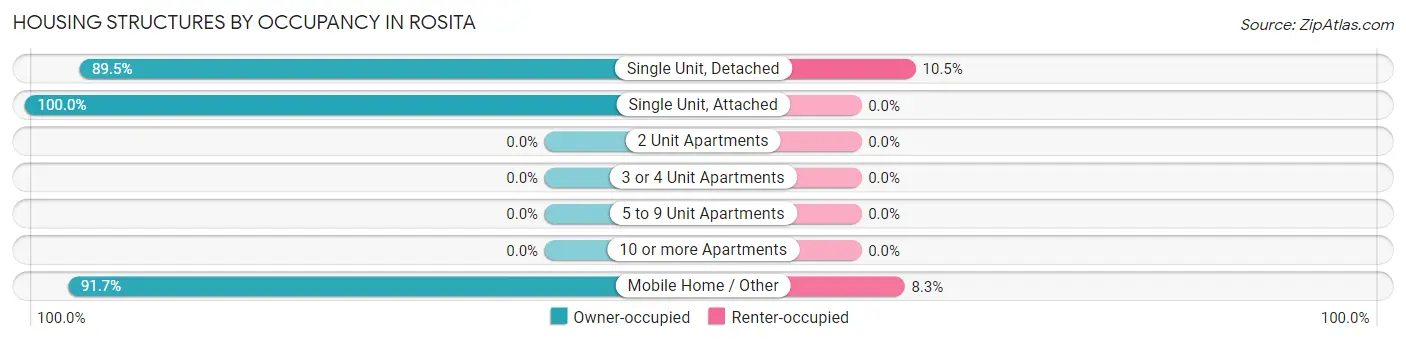
| Structure Type | Owner-occupied | Renter-occupied |
| Single Unit, Detached | 658 (89.5%) | 77 (10.5%) |
| Single Unit, Attached | 10 (100.0%) | 0 (0.0%) |
| 2 Unit Apartments | 0 (0.0%) | 0 (0.0%) |
| 3 or 4 Unit Apartments | 0 (0.0%) | 0 (0.0%) |
| 5 to 9 Unit Apartments | 0 (0.0%) | 0 (0.0%) |
| 10 or more Apartments | 0 (0.0%) | 0 (0.0%) |
| Mobile Home / Other | 88 (91.7%) | 8 (8.3%) |
| Total | 756 (89.9%) | 85 (10.1%) |
Housing Structures by Number of Rooms in Rosita
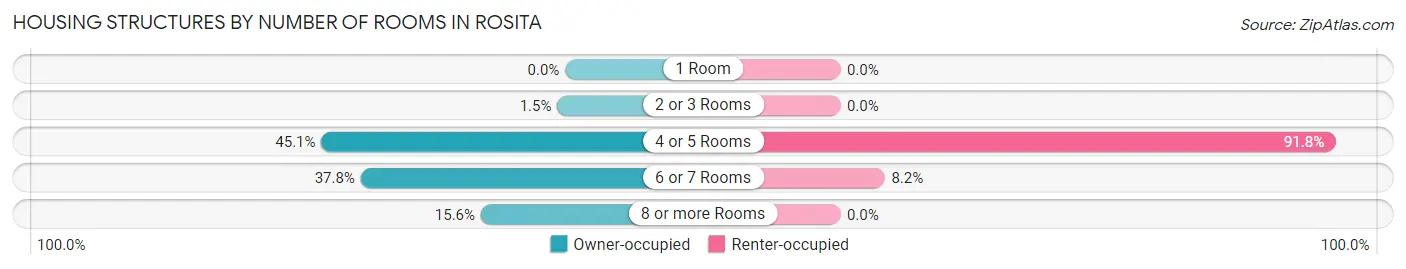
| Number of Rooms | Owner-occupied | Renter-occupied |
| 1 Room | 0 (0.0%) | 0 (0.0%) |
| 2 or 3 Rooms | 11 (1.5%) | 0 (0.0%) |
| 4 or 5 Rooms | 341 (45.1%) | 78 (91.8%) |
| 6 or 7 Rooms | 286 (37.8%) | 7 (8.2%) |
| 8 or more Rooms | 118 (15.6%) | 0 (0.0%) |
| Total | 756 (100.0%) | 85 (100.0%) |
Housing Structure by Heating Type in Rosita
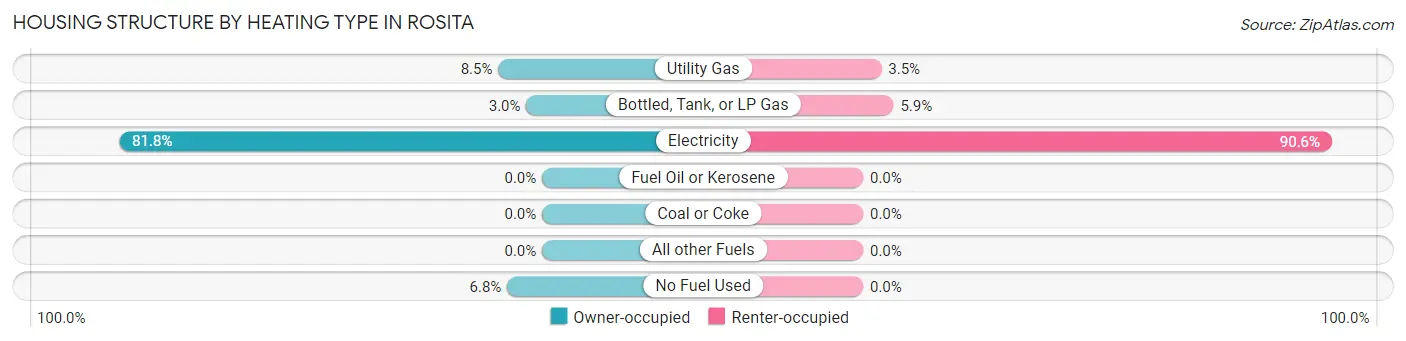
| Heating Type | Owner-occupied | Renter-occupied |
| Utility Gas | 64 (8.5%) | 3 (3.5%) |
| Bottled, Tank, or LP Gas | 23 (3.0%) | 5 (5.9%) |
| Electricity | 618 (81.8%) | 77 (90.6%) |
| Fuel Oil or Kerosene | 0 (0.0%) | 0 (0.0%) |
| Coal or Coke | 0 (0.0%) | 0 (0.0%) |
| All other Fuels | 0 (0.0%) | 0 (0.0%) |
| No Fuel Used | 51 (6.8%) | 0 (0.0%) |
| Total | 756 (100.0%) | 85 (100.0%) |
Household Vehicle Usage in Rosita
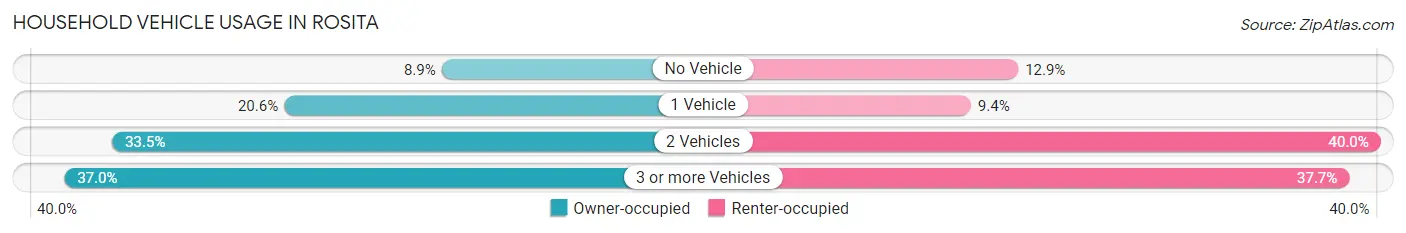
| Vehicles per Household | Owner-occupied | Renter-occupied |
| No Vehicle | 67 (8.9%) | 11 (12.9%) |
| 1 Vehicle | 156 (20.6%) | 8 (9.4%) |
| 2 Vehicles | 253 (33.5%) | 34 (40.0%) |
| 3 or more Vehicles | 280 (37.0%) | 32 (37.7%) |
| Total | 756 (100.0%) | 85 (100.0%) |
Real Estate & Mortgages in Rosita
Real Estate and Mortgage Overview in Rosita
| Characteristic | Without Mortgage | With Mortgage |
| Housing Units | 628 | 128 |
| Median Property Value | $120,600 | $0 |
| Median Household Income | $60,516 | $0 |
| Monthly Housing Costs | $411 | $0 |
| Real Estate Taxes | $1,290 | $0 |
Property Value by Mortgage Status in Rosita
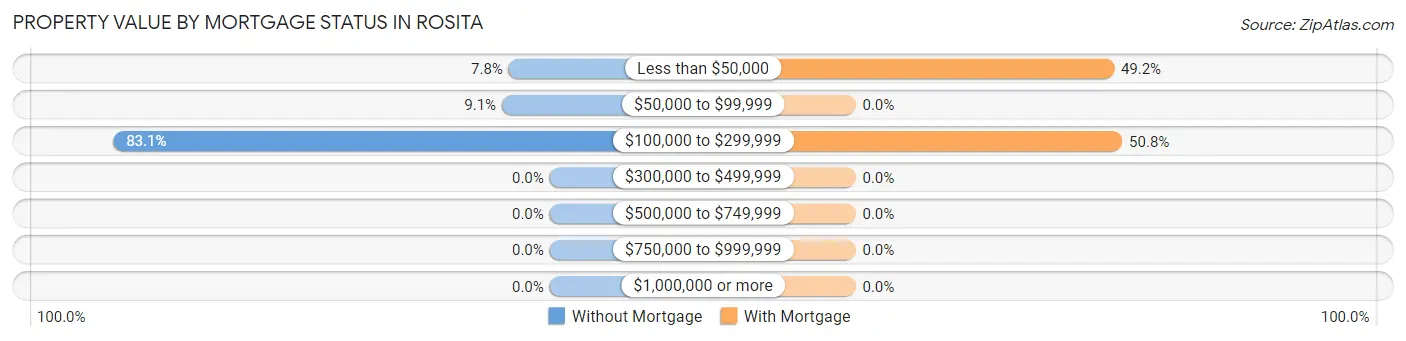
| Property Value | Without Mortgage | With Mortgage |
| Less than $50,000 | 49 (7.8%) | 63 (49.2%) |
| $50,000 to $99,999 | 57 (9.1%) | 0 (0.0%) |
| $100,000 to $299,999 | 522 (83.1%) | 65 (50.8%) |
| $300,000 to $499,999 | 0 (0.0%) | 0 (0.0%) |
| $500,000 to $749,999 | 0 (0.0%) | 0 (0.0%) |
| $750,000 to $999,999 | 0 (0.0%) | 0 (0.0%) |
| $1,000,000 or more | 0 (0.0%) | 0 (0.0%) |
| Total | 628 (100.0%) | 128 (100.0%) |
Household Income by Mortgage Status in Rosita
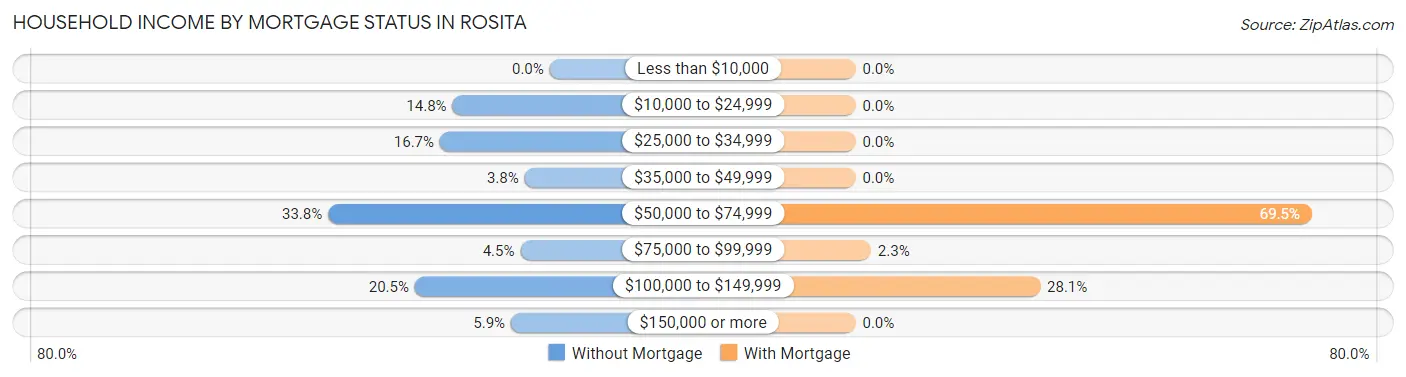
| Household Income | Without Mortgage | With Mortgage |
| Less than $10,000 | 0 (0.0%) | 0 (0.0%) |
| $10,000 to $24,999 | 93 (14.8%) | 0 (0.0%) |
| $25,000 to $34,999 | 105 (16.7%) | 0 (0.0%) |
| $35,000 to $49,999 | 24 (3.8%) | 0 (0.0%) |
| $50,000 to $74,999 | 212 (33.8%) | 89 (69.5%) |
| $75,000 to $99,999 | 28 (4.5%) | 3 (2.3%) |
| $100,000 to $149,999 | 129 (20.5%) | 36 (28.1%) |
| $150,000 or more | 37 (5.9%) | 0 (0.0%) |
| Total | 628 (100.0%) | 128 (100.0%) |
Property Value to Household Income Ratio in Rosita
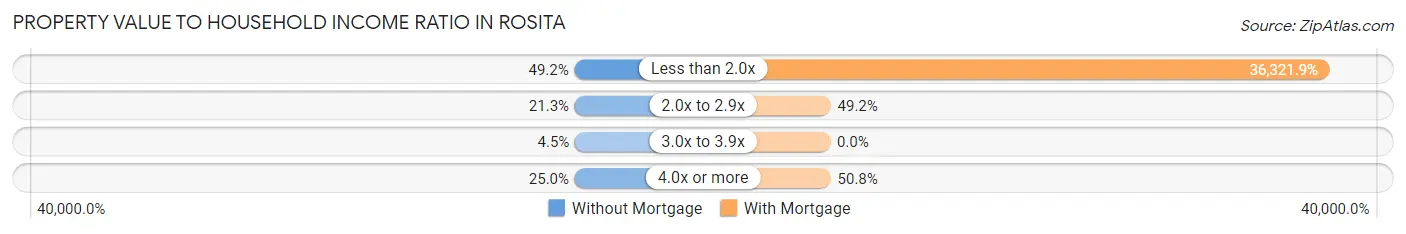
| Value-to-Income Ratio | Without Mortgage | With Mortgage |
| Less than 2.0x | 309 (49.2%) | 46,492 (36,321.9%) |
| 2.0x to 2.9x | 134 (21.3%) | 63 (49.2%) |
| 3.0x to 3.9x | 28 (4.5%) | 0 (0.0%) |
| 4.0x or more | 157 (25.0%) | 65 (50.8%) |
| Total | 628 (100.0%) | 128 (100.0%) |
Real Estate Taxes by Mortgage Status in Rosita
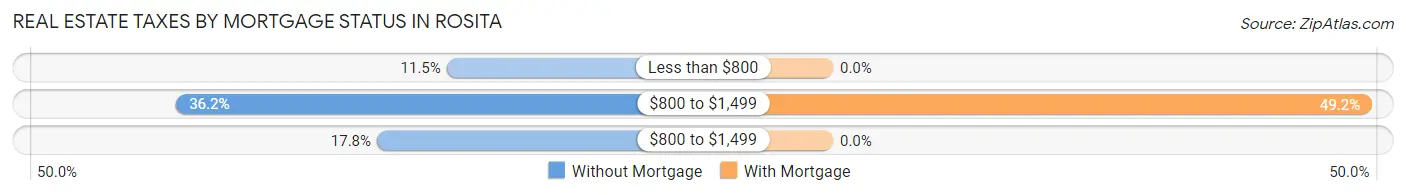
| Property Taxes | Without Mortgage | With Mortgage |
| Less than $800 | 72 (11.5%) | 0 (0.0%) |
| $800 to $1,499 | 227 (36.1%) | 63 (49.2%) |
| $800 to $1,499 | 112 (17.8%) | 0 (0.0%) |
| Total | 628 (100.0%) | 128 (100.0%) |
Health & Disability in Rosita
Health Insurance Coverage by Age in Rosita
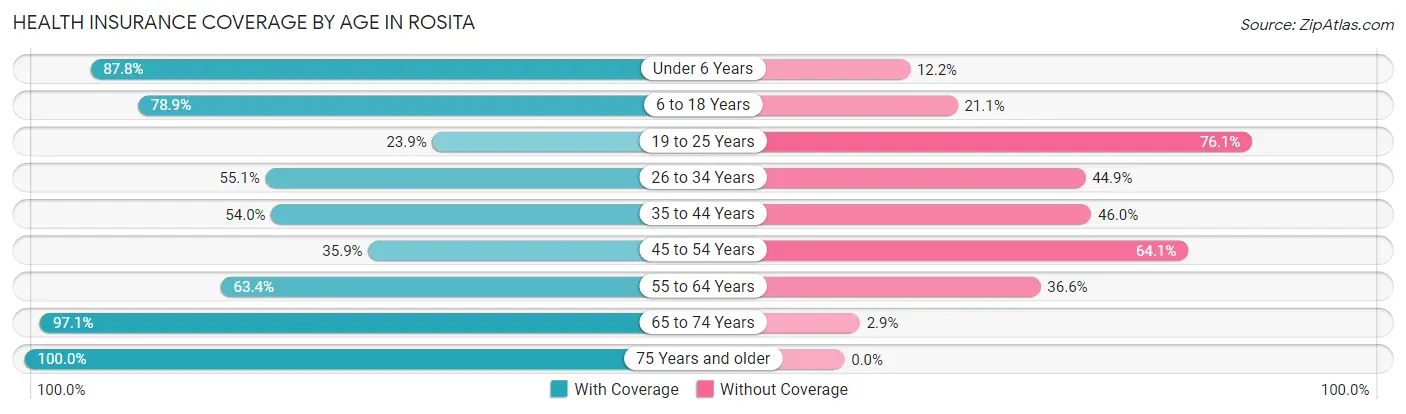
| Age Bracket | With Coverage | Without Coverage |
| Under 6 Years | 251 (87.8%) | 35 (12.2%) |
| 6 to 18 Years | 624 (78.9%) | 167 (21.1%) |
| 19 to 25 Years | 208 (23.9%) | 661 (76.1%) |
| 26 to 34 Years | 114 (55.1%) | 93 (44.9%) |
| 35 to 44 Years | 238 (54.0%) | 203 (46.0%) |
| 45 to 54 Years | 150 (35.9%) | 268 (64.1%) |
| 55 to 64 Years | 229 (63.4%) | 132 (36.6%) |
| 65 to 74 Years | 135 (97.1%) | 4 (2.9%) |
| 75 Years and older | 205 (100.0%) | 0 (0.0%) |
| Total | 2,154 (58.0%) | 1,563 (42.0%) |
Health Insurance Coverage by Citizenship Status in Rosita
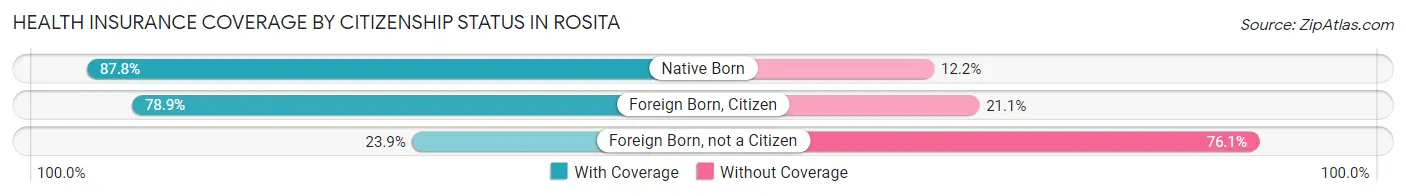
| Citizenship Status | With Coverage | Without Coverage |
| Native Born | 251 (87.8%) | 35 (12.2%) |
| Foreign Born, Citizen | 624 (78.9%) | 167 (21.1%) |
| Foreign Born, not a Citizen | 208 (23.9%) | 661 (76.1%) |
Health Insurance Coverage by Household Income in Rosita
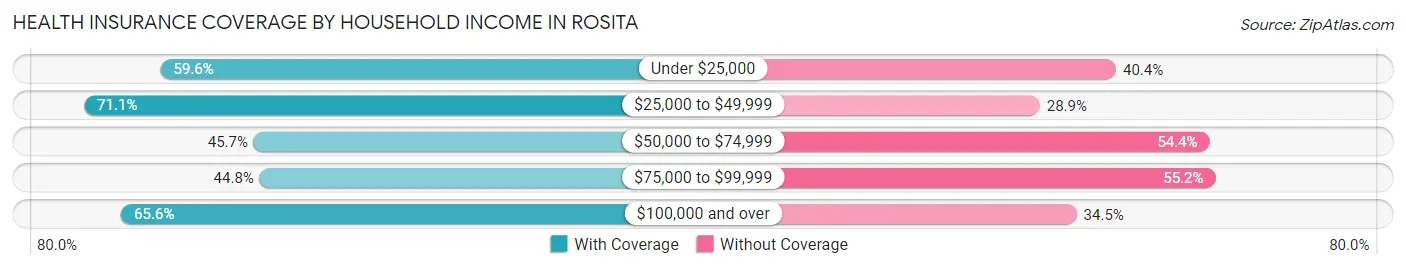
| Household Income | With Coverage | Without Coverage |
| Under $25,000 | 99 (59.6%) | 67 (40.4%) |
| $25,000 to $49,999 | 565 (71.1%) | 230 (28.9%) |
| $50,000 to $74,999 | 462 (45.7%) | 550 (54.3%) |
| $75,000 to $99,999 | 248 (44.8%) | 306 (55.2%) |
| $100,000 and over | 780 (65.5%) | 410 (34.4%) |
Public vs Private Health Insurance Coverage by Age in Rosita
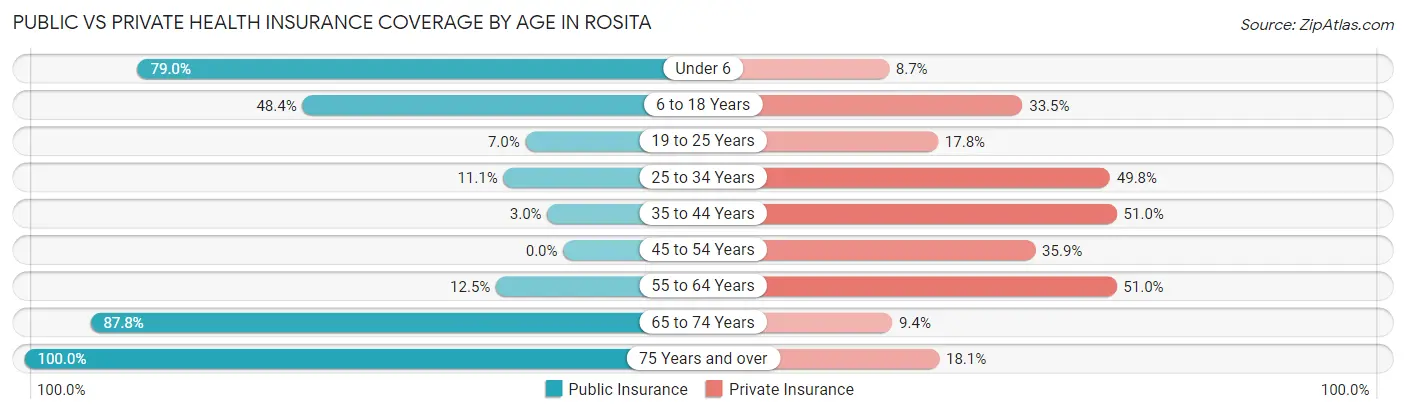
| Age Bracket | Public Insurance | Private Insurance |
| Under 6 | 226 (79.0%) | 25 (8.7%) |
| 6 to 18 Years | 383 (48.4%) | 265 (33.5%) |
| 19 to 25 Years | 61 (7.0%) | 155 (17.8%) |
| 25 to 34 Years | 23 (11.1%) | 103 (49.8%) |
| 35 to 44 Years | 13 (2.9%) | 225 (51.0%) |
| 45 to 54 Years | 0 (0.0%) | 150 (35.9%) |
| 55 to 64 Years | 45 (12.5%) | 184 (51.0%) |
| 65 to 74 Years | 122 (87.8%) | 13 (9.3%) |
| 75 Years and over | 205 (100.0%) | 37 (18.0%) |
| Total | 1,078 (29.0%) | 1,157 (31.1%) |
Disability Status by Sex by Age in Rosita
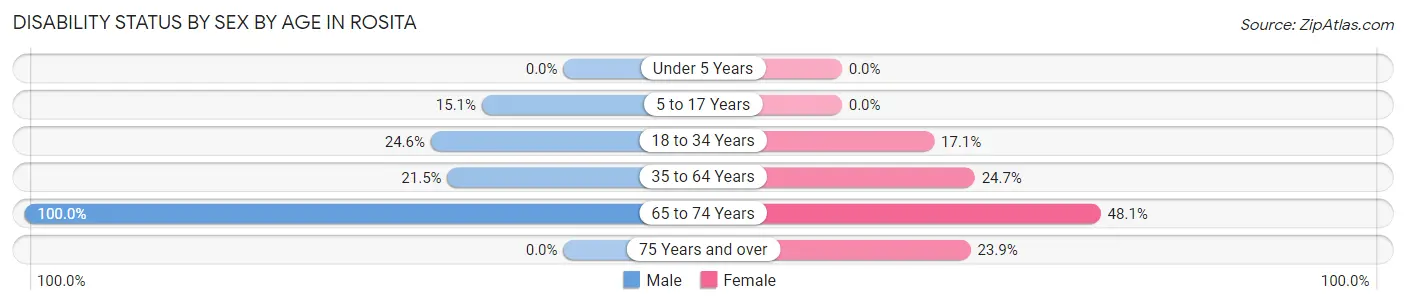
| Age Bracket | Male | Female |
| Under 5 Years | 0 (0.0%) | 0 (0.0%) |
| 5 to 17 Years | 36 (15.1%) | 0 (0.0%) |
| 18 to 34 Years | 157 (24.6%) | 92 (17.1%) |
| 35 to 64 Years | 116 (21.5%) | 168 (24.7%) |
| 65 to 74 Years | 62 (100.0%) | 37 (48.0%) |
| 75 Years and over | 0 (0.0%) | 27 (23.9%) |
Disability Class by Sex by Age in Rosita
Disability Class: Hearing Difficulty
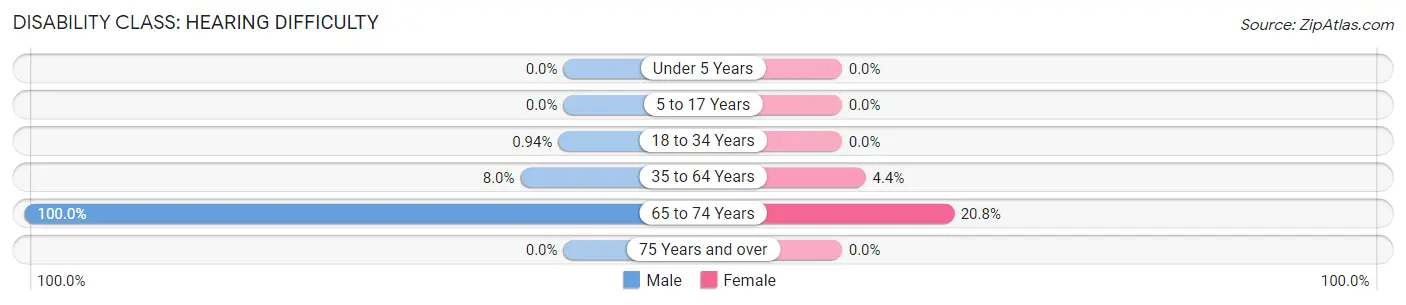
| Age Bracket | Male | Female |
| Under 5 Years | 0 (0.0%) | 0 (0.0%) |
| 5 to 17 Years | 0 (0.0%) | 0 (0.0%) |
| 18 to 34 Years | 6 (0.9%) | 0 (0.0%) |
| 35 to 64 Years | 43 (8.0%) | 30 (4.4%) |
| 65 to 74 Years | 62 (100.0%) | 16 (20.8%) |
| 75 Years and over | 0 (0.0%) | 0 (0.0%) |
Disability Class: Vision Difficulty
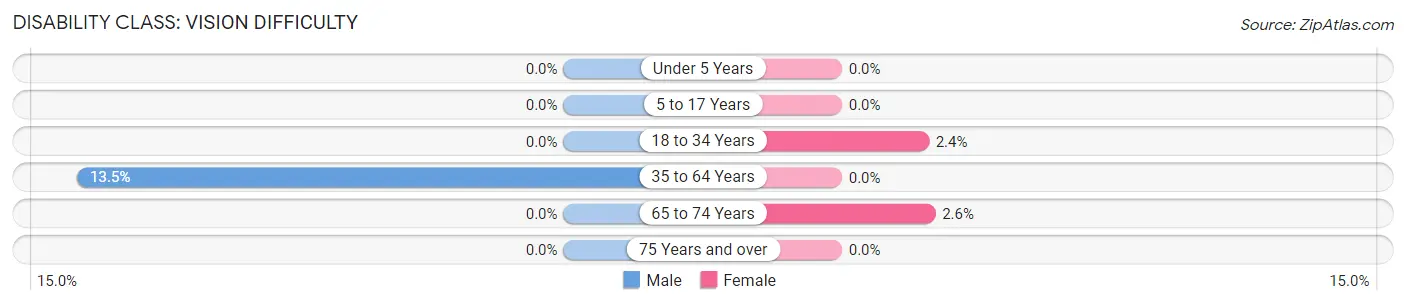
| Age Bracket | Male | Female |
| Under 5 Years | 0 (0.0%) | 0 (0.0%) |
| 5 to 17 Years | 0 (0.0%) | 0 (0.0%) |
| 18 to 34 Years | 0 (0.0%) | 13 (2.4%) |
| 35 to 64 Years | 73 (13.5%) | 0 (0.0%) |
| 65 to 74 Years | 0 (0.0%) | 2 (2.6%) |
| 75 Years and over | 0 (0.0%) | 0 (0.0%) |
Disability Class: Cognitive Difficulty
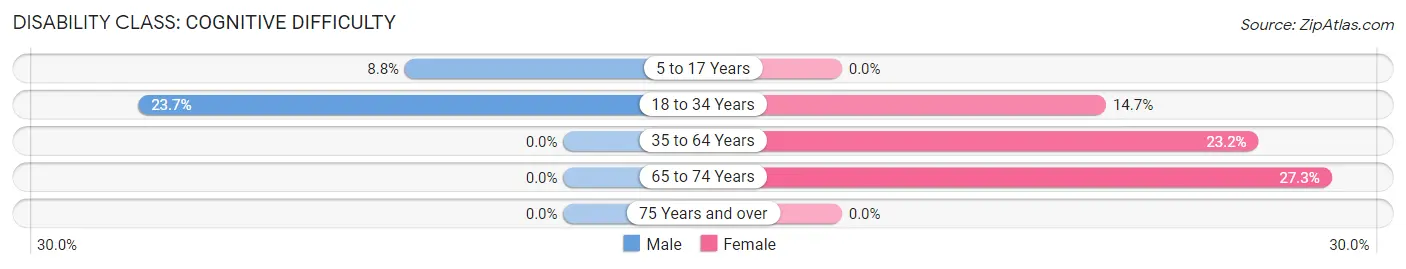
| Age Bracket | Male | Female |
| 5 to 17 Years | 21 (8.8%) | 0 (0.0%) |
| 18 to 34 Years | 151 (23.7%) | 79 (14.7%) |
| 35 to 64 Years | 0 (0.0%) | 158 (23.2%) |
| 65 to 74 Years | 0 (0.0%) | 21 (27.3%) |
| 75 Years and over | 0 (0.0%) | 0 (0.0%) |
Disability Class: Ambulatory Difficulty
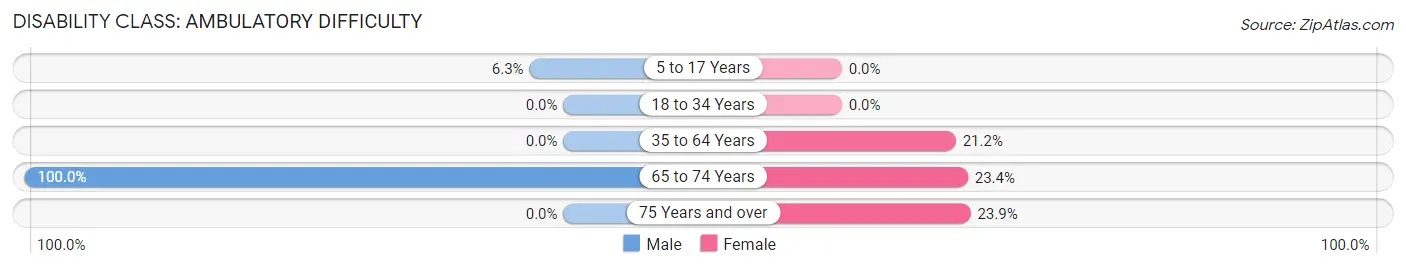
| Age Bracket | Male | Female |
| 5 to 17 Years | 15 (6.3%) | 0 (0.0%) |
| 18 to 34 Years | 0 (0.0%) | 0 (0.0%) |
| 35 to 64 Years | 0 (0.0%) | 144 (21.1%) |
| 65 to 74 Years | 62 (100.0%) | 18 (23.4%) |
| 75 Years and over | 0 (0.0%) | 27 (23.9%) |
Disability Class: Self-Care Difficulty
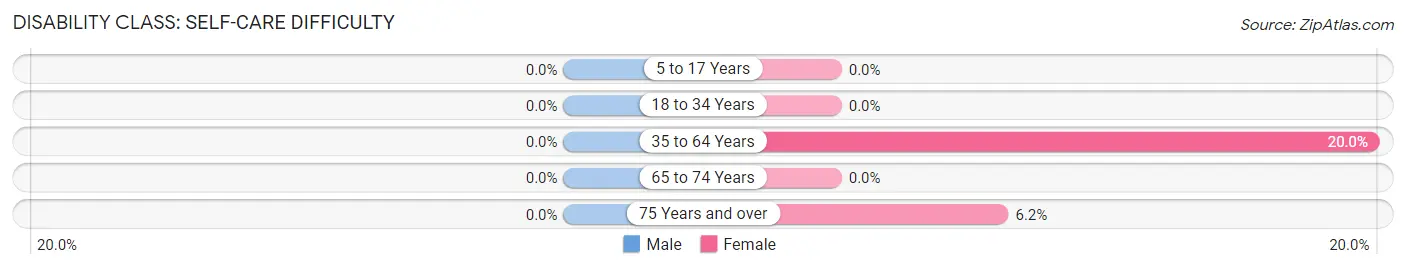
| Age Bracket | Male | Female |
| 5 to 17 Years | 0 (0.0%) | 0 (0.0%) |
| 18 to 34 Years | 0 (0.0%) | 0 (0.0%) |
| 35 to 64 Years | 0 (0.0%) | 136 (20.0%) |
| 65 to 74 Years | 0 (0.0%) | 0 (0.0%) |
| 75 Years and over | 0 (0.0%) | 7 (6.2%) |
Technology Access in Rosita
Computing Device Access in Rosita
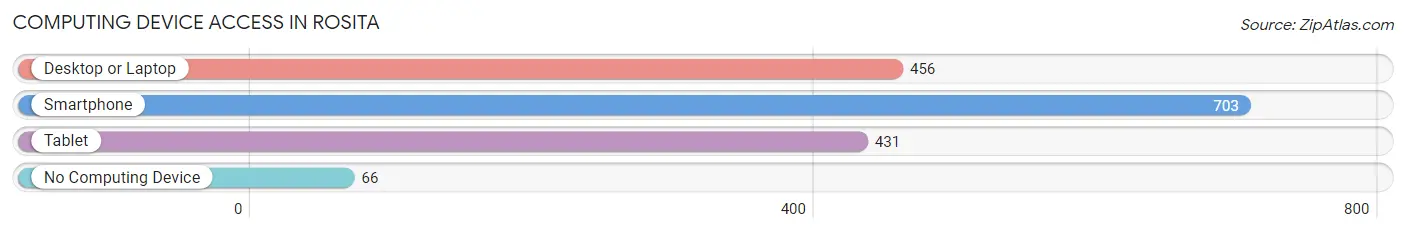
| Device Type | # Households | % Households |
| Desktop or Laptop | 456 | 54.2% |
| Smartphone | 703 | 83.6% |
| Tablet | 431 | 51.2% |
| No Computing Device | 66 | 7.9% |
| Total | 841 | 100.0% |
Internet Access in Rosita
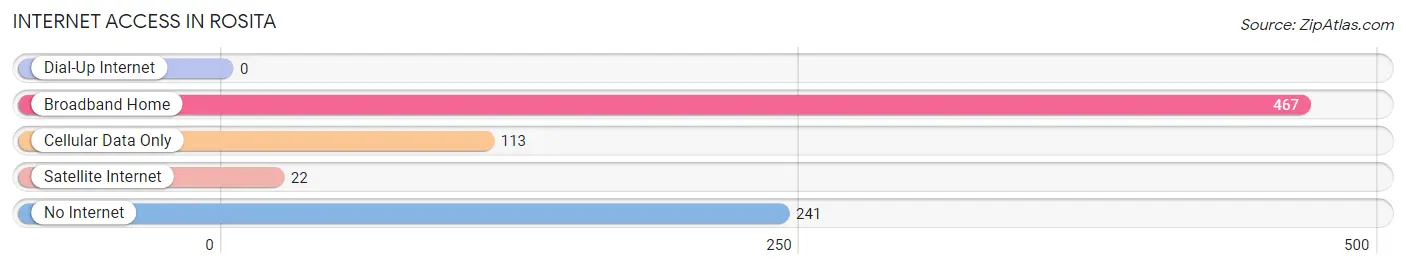
| Internet Type | # Households | % Households |
| Dial-Up Internet | 0 | 0.0% |
| Broadband Home | 467 | 55.5% |
| Cellular Data Only | 113 | 13.4% |
| Satellite Internet | 22 | 2.6% |
| No Internet | 241 | 28.7% |
| Total | 841 | 100.0% |
Rosita Summary
Rosita, Texas is a small unincorporated community located in Maverick County, Texas. It is situated on the banks of the Rio Grande River, approximately 20 miles south of Eagle Pass. The population of Rosita was estimated to be around 1,000 people in 2020.
Geography
Rosita is located in Maverick County, Texas, on the banks of the Rio Grande River. The Rio Grande forms the border between the United States and Mexico. The terrain in the area is mostly flat, with some rolling hills. The climate is semi-arid, with hot summers and mild winters. The average annual temperature is around 70 degrees Fahrenheit.
History
Rosita was founded in the late 19th century by Mexican settlers. The town was named after a local rancher, Rosita de la Garza. The town grew slowly, but steadily, and by the early 20th century, it had become a thriving community.
In the early 1900s, Rosita was a popular destination for tourists, who came to enjoy the area’s natural beauty and the nearby Rio Grande. The town was also known for its vibrant culture, with many festivals and celebrations taking place throughout the year.
In the mid-20th century, Rosita began to decline as the population shifted away from the area. The town was largely abandoned by the late 1970s, and the population had dropped to around 500 people.
Economy
The economy of Rosita is largely based on agriculture and ranching. The area is known for its cattle and sheep ranches, as well as its production of cotton, corn, and wheat. The town also has a small tourism industry, with visitors coming to enjoy the area’s natural beauty and the nearby Rio Grande.
Demographics
The population of Rosita was estimated to be around 1,000 people in 2020. The majority of the population is of Hispanic or Latino descent. The median household income is around $25,000, and the median age is around 35 years old.
Rosita is a small, unincorporated community in Maverick County, Texas. It is situated on the banks of the Rio Grande River, approximately 20 miles south of Eagle Pass. The town has a rich history, with its roots in Mexican settlement in the late 19th century. The economy of Rosita is largely based on agriculture and ranching, and the town also has a small tourism industry. The population of Rosita was estimated to be around 1,000 people in 2020, with the majority of the population being of Hispanic or Latino descent.
Common Questions
What is Per Capita Income in Rosita?
Per Capita income in Rosita is $16,934.
What is the Median Family Income in Rosita?
Median Family Income in Rosita is $60,584.
What is the Median Household income in Rosita?
Median Household Income in Rosita is $54,432.
What is Income or Wage Gap in Rosita?
Income or Wage Gap in Rosita is 12.6%.
Women in Rosita earn 87.4 cents for every dollar earned by a man.
What is Inequality or Gini Index in Rosita?
Inequality or Gini Index in Rosita is 0.34.
What is the Total Population of Rosita?
Total Population of Rosita is 3,717.
What is the Total Male Population of Rosita?
Total Male Population of Rosita is 1,704.
What is the Total Female Population of Rosita?
Total Female Population of Rosita is 2,013.
What is the Ratio of Males per 100 Females in Rosita?
There are 84.65 Males per 100 Females in Rosita.
What is the Ratio of Females per 100 Males in Rosita?
There are 118.13 Females per 100 Males in Rosita.
What is the Median Population Age in Rosita?
Median Population Age in Rosita is 24.3 Years.
What is the Average Family Size in Rosita
Average Family Size in Rosita is 4.6 People.
What is the Average Household Size in Rosita
Average Household Size in Rosita is 4.4 People.
How Large is the Labor Force in Rosita?
There are 1,600 People in the Labor Forcein in Rosita.
What is the Percentage of People in the Labor Force in Rosita?
56.5% of People are in the Labor Force in Rosita.
What is the Unemployment Rate in Rosita?
Unemployment Rate in Rosita is 13.8%.