Zip Codes with the Lowest Poverty Level Among Children Under the Age of 5 in San Antonio, TX

RELATED REPORTS & OPTIONS

Lowest Poverty | Child 0-5
Population
Families and Households
Female Fertility
Female Fertility (Unmarried)
Race (Community Size)
Race (Percentage)
Ancestry (Community Size)
AfghanAfricanAlbanianAleutAlsatianAmericanApacheArabArgentineanArmenianAustralianAustrianBahamianBangladeshiBarbadianBasqueBelgianBelizeanBhutaneseBlackfeetBolivianBrazilianBritishBritish West IndianBulgarianBurmeseCajunCambodianCanadianCape VerdeanCelticCentral AmericanCentral American IndianCherokeeCheyenneChickasawChileanChineseChippewaChoctawColombianComancheCosta RicanCreekCroatianCubanCzechCzechoslovakianDanishDelawareDominicanDutchDutch West IndianEastern EuropeanEcuadorianEgyptianEnglishEstonianEthiopianEuropeanFilipinoFinnishFrenchFrench American IndianFrench CanadianGermanGerman RussianGhanaianGreekGuamanian / ChamorroGuatemalanGuyaneseHaitianHonduranHopiHungarianIcelanderIndian (Asian)IndonesianInupiatIranianIraqiIrishIroquoisIsraeliItalianJamaicanJapaneseJordanianKenyanKoreanLaotianLatvianLebaneseLiberianLithuanianLumbeeLuxembourgerMacedonianMalaysianMexicanMexican American IndianMongolianMoroccanNative HawaiianNavajoNew ZealanderNicaraguanNigerianNorthern EuropeanNorwegianOkinawanOsageOttawaPakistaniPalestinianPanamanianParaguayanPennsylvania GermanPeruvianPimaPolishPortuguesePotawatomiPuebloPuerto RicanRomanianRussianSalvadoranSamoanScandinavianScotch-IrishScottishSeminoleSerbianShoshoneSierra LeoneanSiouxSlavicSlovakSloveneSomaliSouth AfricanSouth AmericanSouth American IndianSoviet UnionSpaniardSpanishSpanish AmericanSpanish American IndianSri LankanSubsaharan AfricanSudaneseSwedishSwissSyrianThaiTrinidadian and TobagonianTurkishU.S. Virgin IslanderUgandanUkrainianUruguayanUteVenezuelanVietnameseWelshWest IndianYaquiYugoslavian
Ancestry (Percentage)
AfghanAfricanAlbanianAleutAlsatianAmericanApacheArabArgentineanArmenianAustralianAustrianBahamianBangladeshiBarbadianBasqueBelgianBelizeanBhutaneseBlackfeetBolivianBrazilianBritishBritish West IndianBulgarianBurmeseCajunCambodianCanadianCape VerdeanCelticCentral AmericanCentral American IndianCherokeeCheyenneChickasawChileanChineseChippewaChoctawColombianComancheCosta RicanCreekCroatianCubanCzechCzechoslovakianDanishDelawareDominicanDutchDutch West IndianEastern EuropeanEcuadorianEgyptianEnglishEstonianEthiopianEuropeanFilipinoFinnishFrenchFrench American IndianFrench CanadianGermanGerman RussianGhanaianGreekGuamanian / ChamorroGuatemalanGuyaneseHaitianHonduranHopiHungarianIcelanderIndian (Asian)IndonesianInupiatIranianIraqiIrishIroquoisIsraeliItalianJamaicanJapaneseJordanianKenyanKoreanLaotianLatvianLebaneseLiberianLithuanianLumbeeLuxembourgerMacedonianMalaysianMexicanMexican American IndianMongolianMoroccanNative HawaiianNavajoNew ZealanderNicaraguanNigerianNorthern EuropeanNorwegianOkinawanOsageOttawaPakistaniPalestinianPanamanianParaguayanPennsylvania GermanPeruvianPimaPolishPortuguesePotawatomiPuebloPuerto RicanRomanianRussianSalvadoranSamoanScandinavianScotch-IrishScottishSeminoleSerbianShoshoneSierra LeoneanSiouxSlavicSlovakSloveneSomaliSouth AfricanSouth AmericanSouth American IndianSoviet UnionSpaniardSpanishSpanish AmericanSpanish American IndianSri LankanSubsaharan AfricanSudaneseSwedishSwissSyrianThaiTrinidadian and TobagonianTurkishU.S. Virgin IslanderUgandanUkrainianUruguayanUteVenezuelanVietnameseWelshWest IndianYaquiYugoslavian
Immigrant Origin (Total)
AfghanistanAfricaArgentinaAsiaAustraliaAustriaBangladeshBarbadosBelizeBoliviaBrazilBulgariaBurma / MyanmarCambodiaCameroonCanadaCaribbeanCentral AmericaChileChinaColombiaCongoCosta RicaCubaCzechoslovakiaDenmarkDominican RepublicEastern AfricaEastern AsiaEastern EuropeEcuadorEgyptEl SalvadorEnglandEritreaEthiopiaEuropeFijiFranceGermanyGhanaGreeceGuatemalaGuyanaHaitiHondurasHong KongHungaryIndiaIndonesiaIranIraqIrelandIsraelItalyJamaicaJapanJordanKazakhstanKenyaKoreaKuwaitLaosLatin AmericaLatviaLebanonLiberiaLithuaniaMalaysiaMexicoMiddle AfricaMoldovaMoroccoNepalNetherlandsNicaraguaNigeriaNorthern AfricaNorthern EuropeNorwayOceaniaPakistanPanamaPeruPhilippinesPolandPortugalRomaniaRussiaSaudi ArabiaScotlandSerbiaSierra LeoneSingaporeSomaliaSouth AfricaSouth AmericaSouth Central AsiaSouth Eastern AsiaSouthern EuropeSpainSri LankaSudanSwedenSwitzerlandSyriaTaiwanThailandTrinidad and TobagoTurkeyUgandaUkraineUruguayUzbekistanVenezuelaVietnamWestern AfricaWestern AsiaWestern EuropeZaireZimbabwe
Immigrant Origin (Percentage)
AfghanistanAfricaArgentinaAsiaAustraliaAustriaBangladeshBarbadosBelizeBoliviaBrazilBulgariaBurma / MyanmarCambodiaCameroonCanadaCaribbeanCentral AmericaChileChinaColombiaCongoCosta RicaCubaCzechoslovakiaDenmarkDominican RepublicEastern AfricaEastern AsiaEastern EuropeEcuadorEgyptEl SalvadorEnglandEritreaEthiopiaEuropeFijiFranceGermanyGhanaGreeceGuatemalaGuyanaHaitiHondurasHong KongHungaryIndiaIndonesiaIranIraqIrelandIsraelItalyJamaicaJapanJordanKazakhstanKenyaKoreaKuwaitLaosLatin AmericaLatviaLebanonLiberiaLithuaniaMalaysiaMexicoMiddle AfricaMoldovaMoroccoNepalNetherlandsNicaraguaNigeriaNorthern AfricaNorthern EuropeNorwayOceaniaPakistanPanamaPeruPhilippinesPolandPortugalRomaniaRussiaSaudi ArabiaScotlandSerbiaSierra LeoneSingaporeSomaliaSouth AfricaSouth AmericaSouth Central AsiaSouth Eastern AsiaSouthern EuropeSpainSri LankaSudanSwedenSwitzerlandSyriaTaiwanThailandTrinidad and TobagoTurkeyUgandaUkraineUruguayUzbekistanVenezuelaVietnamWestern AfricaWestern AsiaWestern EuropeZaireZimbabwe
Income
Income (Families)
Income (Households)
Poverty
Poverty (Families)
Unemployment
Employment Occupations
Employment Industries
Employer Class
Commute Time
Commute Means
School Enrollment
Education by Degree Field
Occupancy
Finances
Physical Characteristics
San Antonio
Compare Zip Codes
Comparison Subject

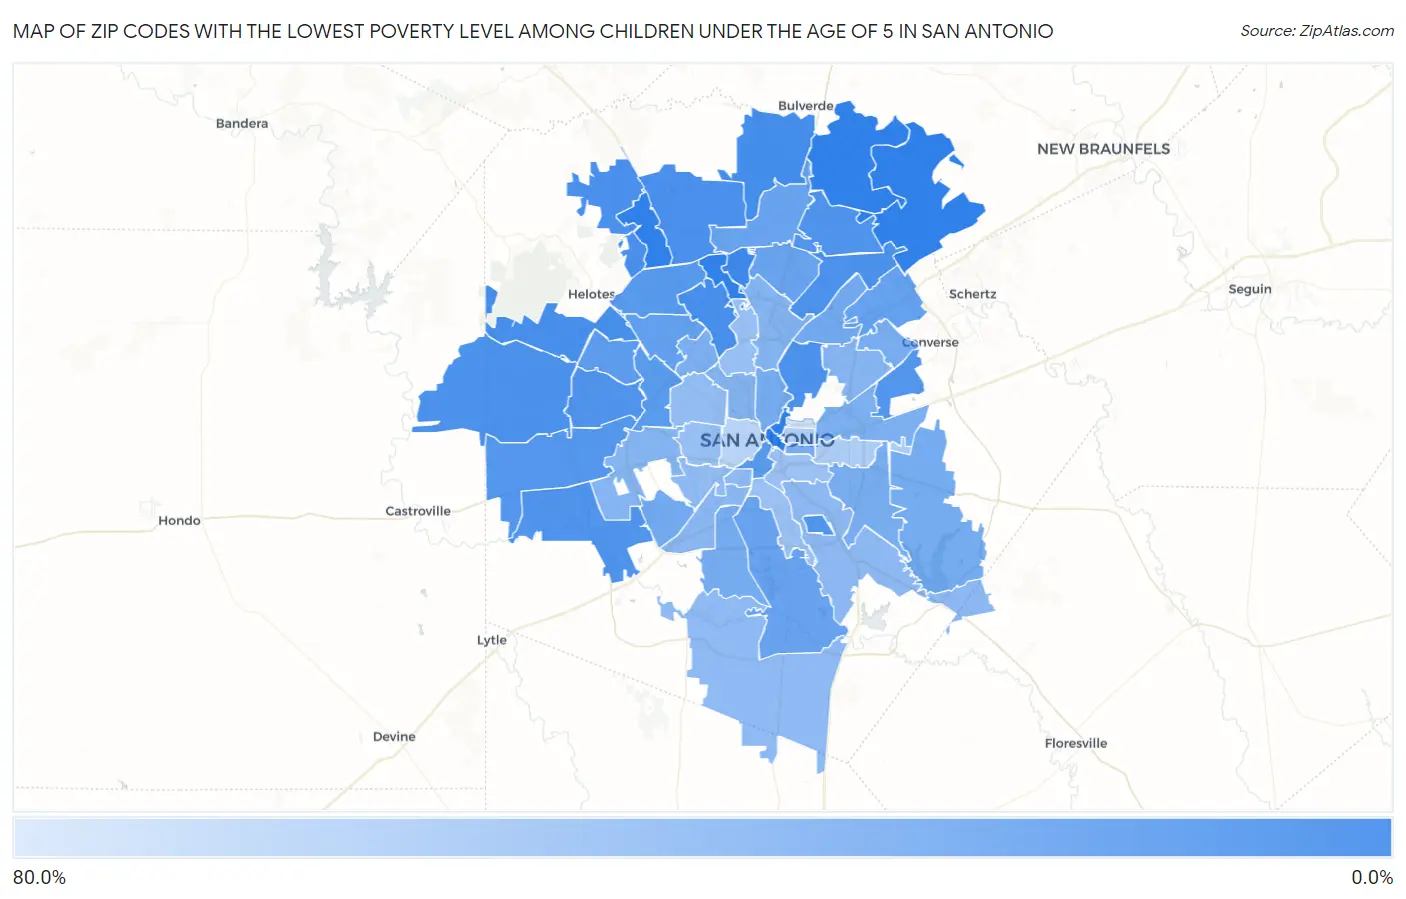
Map of Zip Codes with the Lowest Poverty Level Among Children Under the Age of 5 in San Antonio

80.0%
0.0%
Zip Codes with the Lowest Poverty Level Among Children Under the Age of 5 in San Antonio Map

Zip Codes with the Lowest Poverty Level Among Children Under the Age of 5 in San Antonio, TX

Zip Code Child Poverty vs State vs National
1.782481.6%21.1%(-19.5)#2518.1%(-16.5)#594
2.782605.2%21.1%(-15.9)#13918.1%(-12.9)#3,009
3.782545.7%21.1%(-15.4)#14918.1%(-12.4)#3,381
4.782306.3%21.1%(-14.8)#17818.1%(-11.7)#3,834
5.782557.3%21.1%(-13.8)#21418.1%(-10.8)#4,456
6.782577.3%21.1%(-13.8)#21518.1%(-10.8)#4,460
7.782477.7%21.1%(-13.4)#23018.1%(-10.4)#4,701
8.782098.2%21.1%(-12.8)#24618.1%(-9.82)#5,069
9.782538.4%21.1%(-12.7)#25018.1%(-9.69)#5,165
10.782528.6%21.1%(-12.5)#25418.1%(-9.48)#5,313
11.782599.1%21.1%(-12.0)#27218.1%(-9.00)#5,654
12.782519.9%21.1%(-11.1)#30018.1%(-8.11)#6,215
13.7823510.3%21.1%(-10.8)#31518.1%(-7.77)#6,442
14.7824410.7%21.1%(-10.4)#33218.1%(-7.35)#6,684
15.7824511.6%21.1%(-9.52)#36618.1%(-6.49)#7,186
16.7824912.8%21.1%(-8.32)#41118.1%(-5.30)#7,899
17.7823813.7%21.1%(-7.39)#44218.1%(-4.37)#8,452
18.7820413.8%21.1%(-7.25)#44818.1%(-4.22)#8,536
19.7825015.8%21.1%(-5.29)#52118.1%(-2.26)#9,653
20.7824017.6%21.1%(-3.48)#57718.1%(-0.461)#10,518
21.7823318.9%21.1%(-2.21)#61518.1%(+0.816)#11,118
22.7822120.4%21.1%(-0.716)#65418.1%(+2.31)#11,814
23.7823220.4%21.1%(-0.663)#65618.1%(+2.36)#11,834
24.7825821.3%21.1%(+0.168)#67818.1%(+3.19)#12,165
25.7821724.8%21.1%(+3.68)#76918.1%(+6.70)#13,575
26.7824224.8%21.1%(+3.74)#77218.1%(+6.77)#13,594
27.7822426.0%21.1%(+4.87)#80018.1%(+7.89)#14,017
28.7826326.0%21.1%(+4.88)#80118.1%(+7.90)#14,018
29.7821226.5%21.1%(+5.46)#81618.1%(+8.49)#14,209
30.7822227.3%21.1%(+6.24)#83718.1%(+9.26)#14,471
31.7823927.8%21.1%(+6.69)#85318.1%(+9.71)#14,630
32.7820327.8%21.1%(+6.75)#85818.1%(+9.78)#14,663
33.7822930.1%21.1%(+8.98)#92018.1%(+12.0)#15,344
34.7821931.3%21.1%(+10.2)#94918.1%(+13.2)#15,673
35.7820133.0%21.1%(+11.9)#98518.1%(+14.9)#16,087
36.7821633.4%21.1%(+12.3)#99018.1%(+15.3)#16,249
37.7821834.1%21.1%(+13.0)#1,00918.1%(+16.0)#16,395
38.7822734.3%21.1%(+13.2)#1,01218.1%(+16.2)#16,434
39.7821136.6%21.1%(+15.5)#1,05318.1%(+18.6)#17,004
40.7822337.5%21.1%(+16.4)#1,06618.1%(+19.4)#17,162
41.7822538.5%21.1%(+17.4)#1,07918.1%(+20.4)#17,369
42.7826439.3%21.1%(+18.2)#1,09618.1%(+21.2)#17,513
43.7822639.9%21.1%(+18.8)#1,10618.1%(+21.9)#17,624
44.7822841.8%21.1%(+20.8)#1,14218.1%(+23.8)#17,992
45.7821344.0%21.1%(+22.9)#1,16918.1%(+25.9)#18,332
46.7823744.5%21.1%(+23.4)#1,17618.1%(+26.5)#18,426
47.7821444.8%21.1%(+23.7)#1,17918.1%(+26.7)#18,462
48.7821045.2%21.1%(+24.1)#1,18418.1%(+27.1)#18,514
49.7822056.3%21.1%(+35.2)#1,25718.1%(+38.3)#19,708
50.7820257.1%21.1%(+36.0)#1,26218.1%(+39.0)#19,773
51.7820764.2%21.1%(+43.1)#1,29418.1%(+46.2)#20,235
52.7820879.2%21.1%(+58.1)#1,32618.1%(+61.1)#20,832

Common Questions

What are the Top 10 Zip Codes with the Lowest Poverty Level Among Children Under the Age of 5 in San Antonio, TX?
Top 10 Zip Codes with the Lowest Poverty Level Among Children Under the Age of 5 in San Antonio, TX are:
#1
0.0%
#2
0.0%
#3
0.0%
#4
0.0%
#5
0.0%
#6
0.0%
#7
1.6%
#8
5.2%
#9
5.7%
#10
6.3%
What zip code has the Lowest Poverty Level Among Children Under the Age of 5 in San Antonio, TX?
78248 has the Lowest Poverty Level Among Children Under the Age of 5 in San Antonio, TX with 1.6%.
What is the Poverty Level Among Children Under the Age of 5 in San Antonio, TX?
Poverty Level Among Children Under the Age of 5 in San Antonio is 27.0%.
What is the Poverty Level Among Children Under the Age of 5 in Texas?
Poverty Level Among Children Under the Age of 5 in Texas is 21.1%.
What is the Poverty Level Among Children Under the Age of 5 in the United States?
Poverty Level Among Children Under the Age of 5 in the United States is 18.1%.