Warren City, TX Map & Demographics
Warren City Map
Warren City Overview
$31,154
PER CAPITA INCOME
$109,219
AVG FAMILY INCOME
$78,958
AVG HOUSEHOLD INCOME
50.5%
WAGE / INCOME GAP [ % ]
49.5¢/ $1
WAGE / INCOME GAP [ $ ]
0.38
INEQUALITY / GINI INDEX
378
TOTAL POPULATION
184
MALE POPULATION
194
FEMALE POPULATION
94.85
MALES / 100 FEMALES
105.43
FEMALES / 100 MALES
49.0
MEDIAN AGE
2.9
AVG FAMILY SIZE
2.4
AVG HOUSEHOLD SIZE
199
LABOR FORCE [ PEOPLE ]
67.0%
PERCENT IN LABOR FORCE
5.5%
UNEMPLOYMENT RATE
Income in Warren City
Income Overview in Warren City
Per Capita Income in Warren City is $31,154, while median incomes of families and households are $109,219 and $78,958 respectively.
| Characteristic | Number | Measure |
| Per Capita Income | 378 | $31,154 |
| Median Family Income | 109 | $109,219 |
| Mean Family Income | 109 | $101,517 |
| Median Household Income | 155 | $78,958 |
| Mean Household Income | 155 | $83,044 |
| Income Deficit | 109 | $0 |
| Wage / Income Gap (%) | 378 | 50.50% |
| Wage / Income Gap ($) | 378 | 49.50¢ per $1 |
| Gini / Inequality Index | 378 | 0.38 |
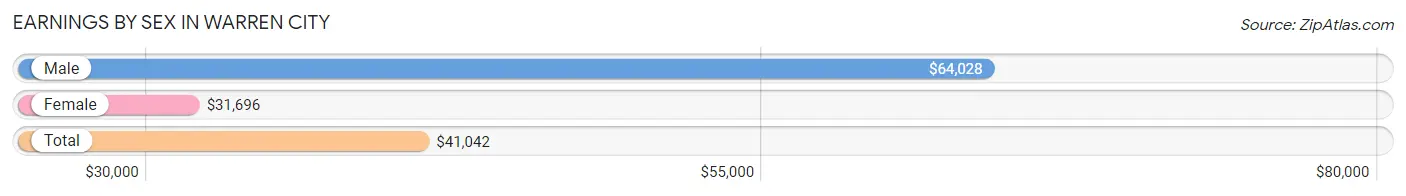
Earnings by Sex in Warren City
Average Earnings in Warren City are $41,042, $64,028 for men and $31,696 for women, a difference of 50.5%.
| Sex | Number | Average Earnings |
| Male | 91 (45.3%) | $64,028 |
| Female | 110 (54.7%) | $31,696 |
| Total | 201 (100.0%) | $41,042 |
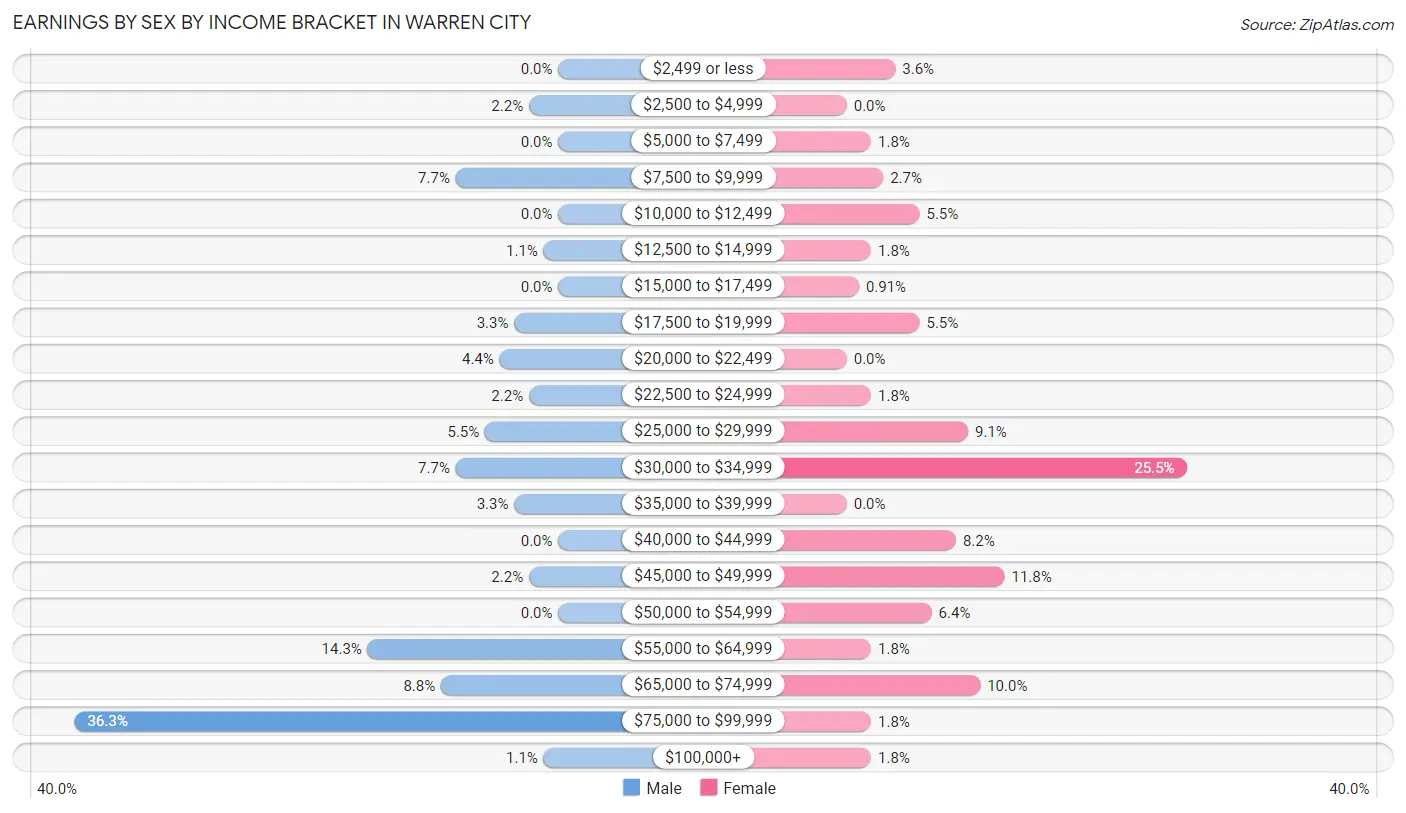
Earnings by Sex by Income Bracket in Warren City
The most common earnings brackets in Warren City are $75,000 to $99,999 for men (33 | 36.3%) and $30,000 to $34,999 for women (28 | 25.5%).
| Income | Male | Female |
| $2,499 or less | 0 (0.0%) | 4 (3.6%) |
| $2,500 to $4,999 | 2 (2.2%) | 0 (0.0%) |
| $5,000 to $7,499 | 0 (0.0%) | 2 (1.8%) |
| $7,500 to $9,999 | 7 (7.7%) | 3 (2.7%) |
| $10,000 to $12,499 | 0 (0.0%) | 6 (5.4%) |
| $12,500 to $14,999 | 1 (1.1%) | 2 (1.8%) |
| $15,000 to $17,499 | 0 (0.0%) | 1 (0.9%) |
| $17,500 to $19,999 | 3 (3.3%) | 6 (5.4%) |
| $20,000 to $22,499 | 4 (4.4%) | 0 (0.0%) |
| $22,500 to $24,999 | 2 (2.2%) | 2 (1.8%) |
| $25,000 to $29,999 | 5 (5.5%) | 10 (9.1%) |
| $30,000 to $34,999 | 7 (7.7%) | 28 (25.5%) |
| $35,000 to $39,999 | 3 (3.3%) | 0 (0.0%) |
| $40,000 to $44,999 | 0 (0.0%) | 9 (8.2%) |
| $45,000 to $49,999 | 2 (2.2%) | 13 (11.8%) |
| $50,000 to $54,999 | 0 (0.0%) | 7 (6.4%) |
| $55,000 to $64,999 | 13 (14.3%) | 2 (1.8%) |
| $65,000 to $74,999 | 8 (8.8%) | 11 (10.0%) |
| $75,000 to $99,999 | 33 (36.3%) | 2 (1.8%) |
| $100,000+ | 1 (1.1%) | 2 (1.8%) |
| Total | 91 (100.0%) | 110 (100.0%) |
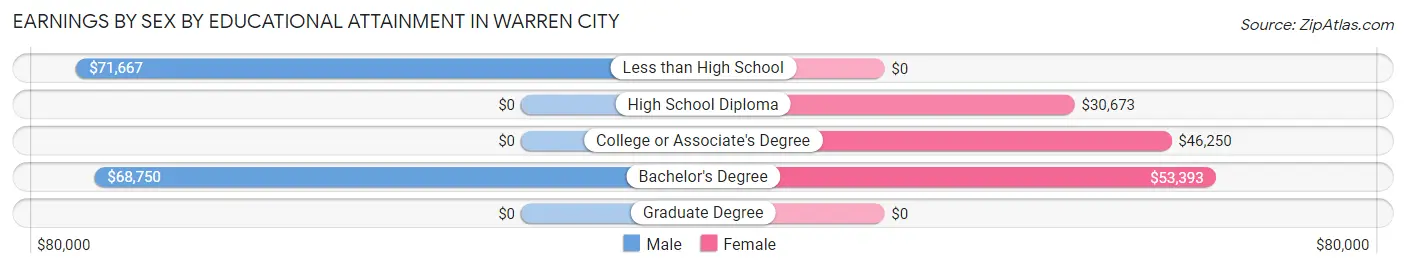
Earnings by Sex by Educational Attainment in Warren City
Average earnings in Warren City are $70,208 for men and $31,696 for women, a difference of 54.8%. Men with an educational attainment of less than high school enjoy the highest average annual earnings of $71,667, while those with bachelor's degree education earn the least with $68,750. Women with an educational attainment of bachelor's degree earn the most with the average annual earnings of $53,393, while those with high school diploma education have the smallest earnings of $30,673.
| Educational Attainment | Male Income | Female Income |
| Less than High School | $71,667 | $0 |
| High School Diploma | - | - |
| College or Associate's Degree | - | - |
| Bachelor's Degree | $68,750 | $53,393 |
| Graduate Degree | - | - |
| Total | $70,208 | $31,696 |
Family Income in Warren City
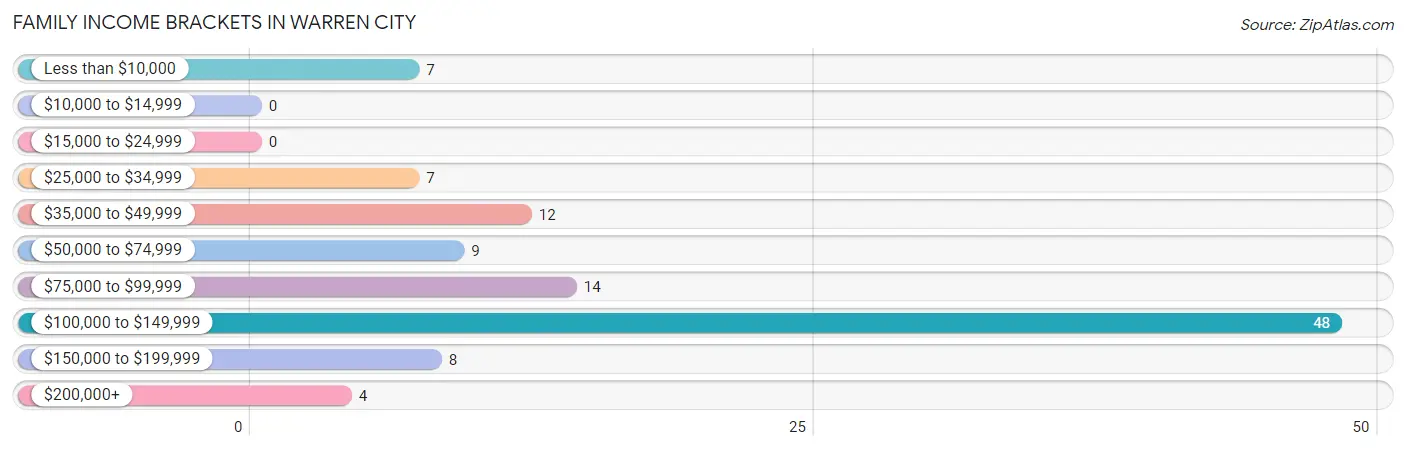
Family Income Brackets in Warren City
According to the Warren City family income data, there are 48 families falling into the $100,000 to $149,999 income range, which is the most common income bracket and makes up 44.0% of all families.
| Income Bracket | # Families | % Families |
| Less than $10,000 | 7 | 6.4% |
| $10,000 to $14,999 | 0 | 0.0% |
| $15,000 to $24,999 | 0 | 0.0% |
| $25,000 to $34,999 | 7 | 6.4% |
| $35,000 to $49,999 | 12 | 11.0% |
| $50,000 to $74,999 | 9 | 8.3% |
| $75,000 to $99,999 | 14 | 12.8% |
| $100,000 to $149,999 | 48 | 44.0% |
| $150,000 to $199,999 | 8 | 7.3% |
| $200,000+ | 4 | 3.7% |
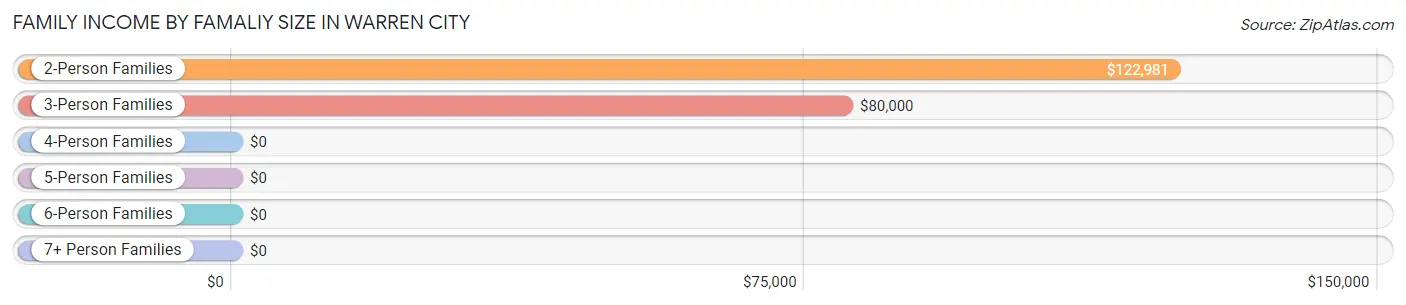
Family Income by Famaliy Size in Warren City
2-person families (56 | 51.4%) account for the highest median family income in Warren City with $122,981 per family, while 2-person families (56 | 51.4%) have the highest median income of $61,490 per family member.
| Income Bracket | # Families | Median Income |
| 2-Person Families | 56 (51.4%) | $122,981 |
| 3-Person Families | 22 (20.2%) | $80,000 |
| 4-Person Families | 10 (9.2%) | $0 |
| 5-Person Families | 5 (4.6%) | $0 |
| 6-Person Families | 16 (14.7%) | $0 |
| 7+ Person Families | 0 (0.0%) | $0 |
| Total | 109 (100.0%) | $109,219 |
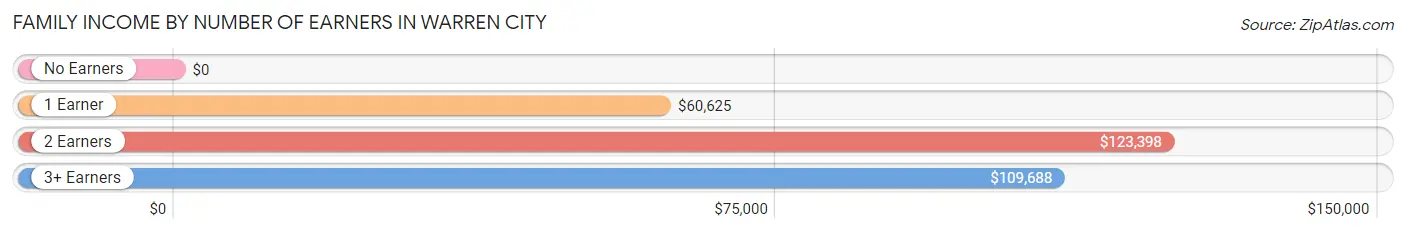
Family Income by Number of Earners in Warren City
| Number of Earners | # Families | Median Income |
| No Earners | 7 (6.4%) | $0 |
| 1 Earner | 33 (30.3%) | $60,625 |
| 2 Earners | 51 (46.8%) | $123,398 |
| 3+ Earners | 18 (16.5%) | $109,688 |
| Total | 109 (100.0%) | $109,219 |
Household Income in Warren City
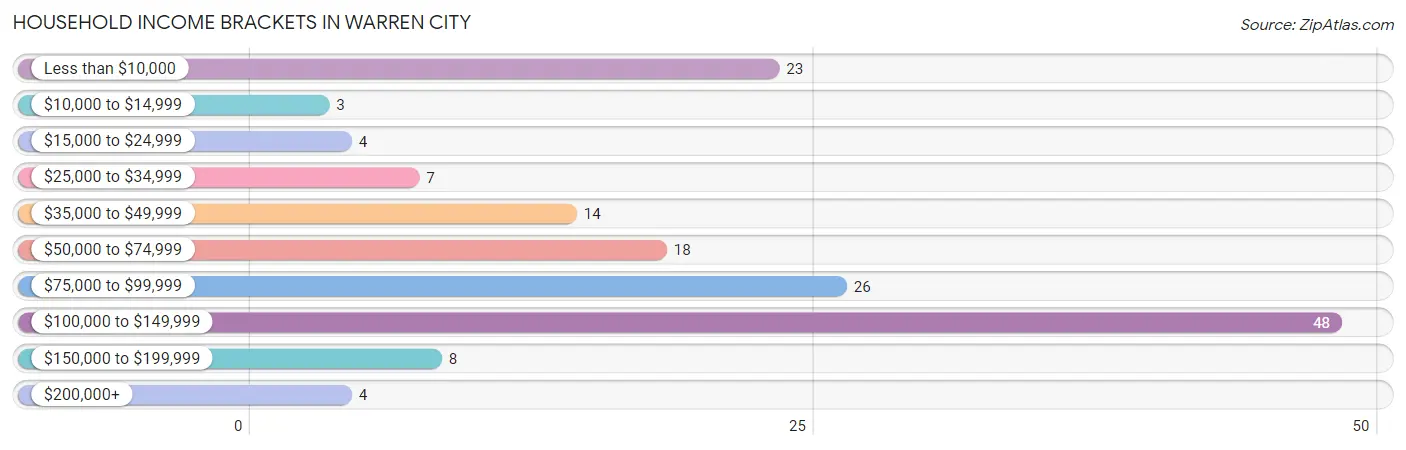
Household Income Brackets in Warren City
With 48 households falling in the category, the $100,000 to $149,999 income range is the most frequent in Warren City, accounting for 31.0% of all households. In contrast, only 3 households (1.9%) fall into the $10,000 to $14,999 income bracket, making it the least populous group.
| Income Bracket | # Households | % Households |
| Less than $10,000 | 23 | 14.8% |
| $10,000 to $14,999 | 3 | 1.9% |
| $15,000 to $24,999 | 4 | 2.6% |
| $25,000 to $34,999 | 7 | 4.5% |
| $35,000 to $49,999 | 14 | 9.0% |
| $50,000 to $74,999 | 18 | 11.6% |
| $75,000 to $99,999 | 26 | 16.8% |
| $100,000 to $149,999 | 48 | 31.0% |
| $150,000 to $199,999 | 8 | 5.2% |
| $200,000+ | 4 | 2.6% |
Household Income by Householder Age in Warren City
The median household income in Warren City is $78,958, with the highest median household income of $122,548 found in the 45 to 64 years age bracket for the primary householder. A total of 73 households (47.1%) fall into this category.
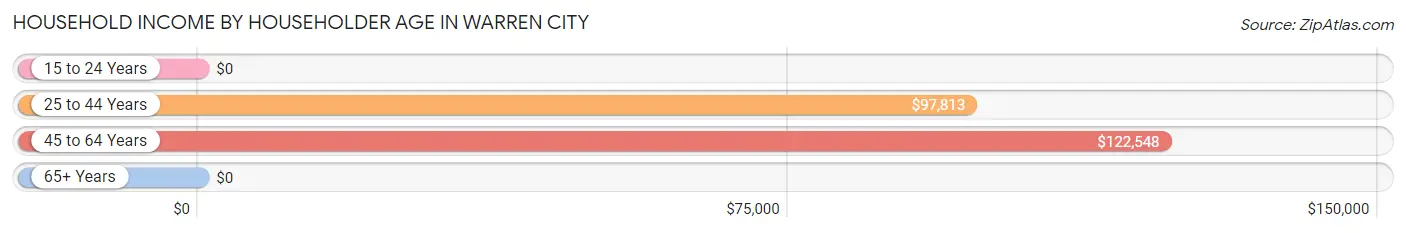
| Income Bracket | # Households | Median Income |
| 15 to 24 Years | 0 (0.0%) | $0 |
| 25 to 44 Years | 31 (20.0%) | $97,813 |
| 45 to 64 Years | 73 (47.1%) | $122,548 |
| 65+ Years | 51 (32.9%) | $0 |
| Total | 155 (100.0%) | $78,958 |
Poverty in Warren City
Income Below Poverty by Sex and Age in Warren City
With 13.6% poverty level for males and 13.4% for females among the residents of Warren City, 75 year old and over males and 75 year old and over females are the most vulnerable to poverty, with 8 males (44.4%) and 10 females (83.3%) in their respective age groups living below the poverty level.
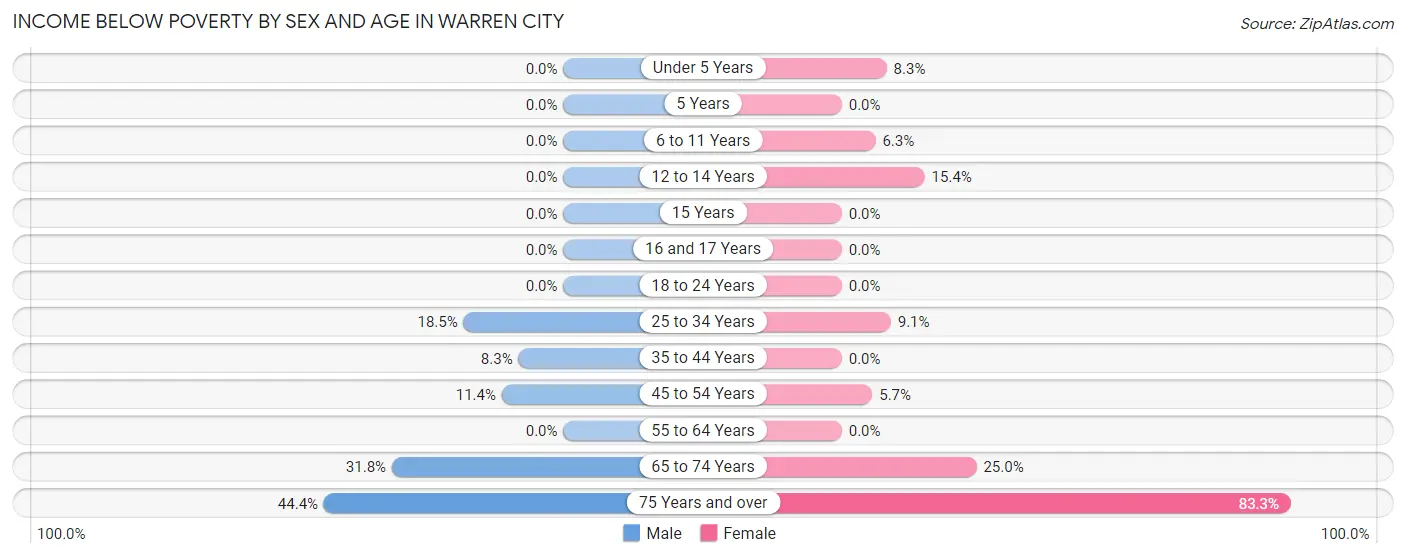
| Age Bracket | Male | Female |
| Under 5 Years | 0 (0.0%) | 1 (8.3%) |
| 5 Years | 0 (0.0%) | 0 (0.0%) |
| 6 to 11 Years | 0 (0.0%) | 1 (6.2%) |
| 12 to 14 Years | 0 (0.0%) | 2 (15.4%) |
| 15 Years | 0 (0.0%) | 0 (0.0%) |
| 16 and 17 Years | 0 (0.0%) | 0 (0.0%) |
| 18 to 24 Years | 0 (0.0%) | 0 (0.0%) |
| 25 to 34 Years | 5 (18.5%) | 3 (9.1%) |
| 35 to 44 Years | 1 (8.3%) | 0 (0.0%) |
| 45 to 54 Years | 4 (11.4%) | 3 (5.7%) |
| 55 to 64 Years | 0 (0.0%) | 0 (0.0%) |
| 65 to 74 Years | 7 (31.8%) | 6 (25.0%) |
| 75 Years and over | 8 (44.4%) | 10 (83.3%) |
| Total | 25 (13.6%) | 26 (13.4%) |
Income Above Poverty by Sex and Age in Warren City
According to the poverty statistics in Warren City, males aged under 5 years and females aged 5 years are the age groups that are most secure financially, with 100.0% of males and 100.0% of females in these age groups living above the poverty line.
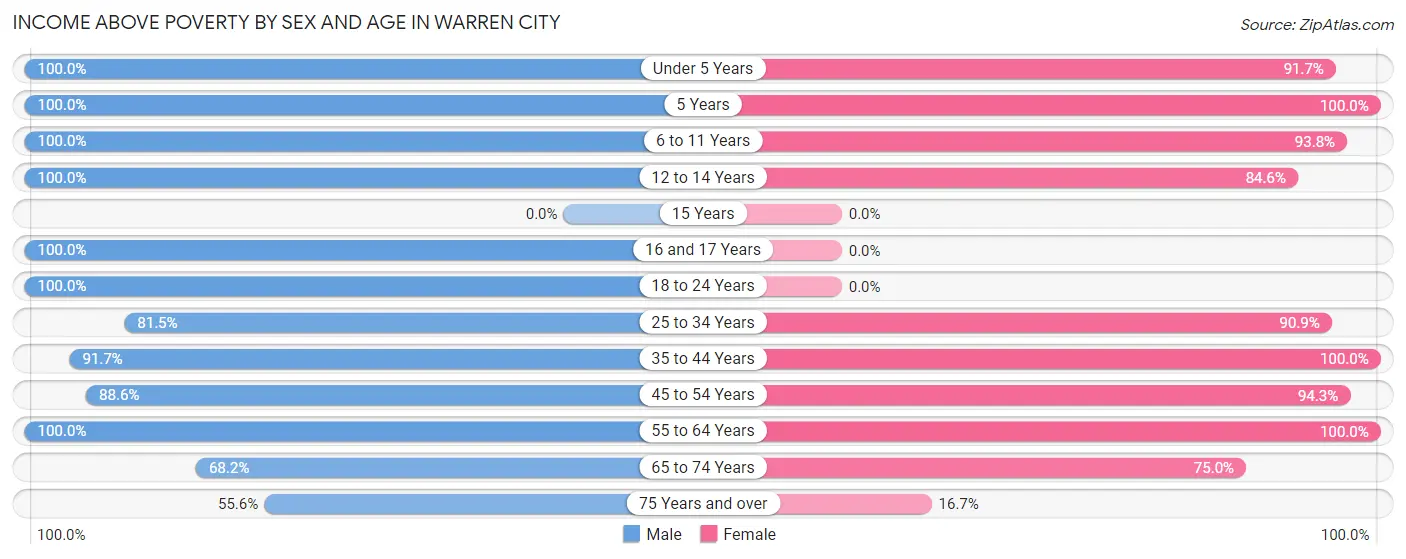
| Age Bracket | Male | Female |
| Under 5 Years | 15 (100.0%) | 11 (91.7%) |
| 5 Years | 8 (100.0%) | 2 (100.0%) |
| 6 to 11 Years | 14 (100.0%) | 15 (93.8%) |
| 12 to 14 Years | 1 (100.0%) | 11 (84.6%) |
| 15 Years | 0 (0.0%) | 0 (0.0%) |
| 16 and 17 Years | 3 (100.0%) | 0 (0.0%) |
| 18 to 24 Years | 12 (100.0%) | 0 (0.0%) |
| 25 to 34 Years | 22 (81.5%) | 30 (90.9%) |
| 35 to 44 Years | 11 (91.7%) | 11 (100.0%) |
| 45 to 54 Years | 31 (88.6%) | 50 (94.3%) |
| 55 to 64 Years | 17 (100.0%) | 18 (100.0%) |
| 65 to 74 Years | 15 (68.2%) | 18 (75.0%) |
| 75 Years and over | 10 (55.6%) | 2 (16.7%) |
| Total | 159 (86.4%) | 168 (86.6%) |
Income Below Poverty Among Married-Couple Families in Warren City
The poverty statistics for married-couple families in Warren City show that 6.1% or 6 of the total 98 families live below the poverty line. Families with no children have the highest poverty rate of 7.0%, comprising of 4 families. On the other hand, families with 3 or 4 children have the lowest poverty rate of 0.0%, which includes 0 families.
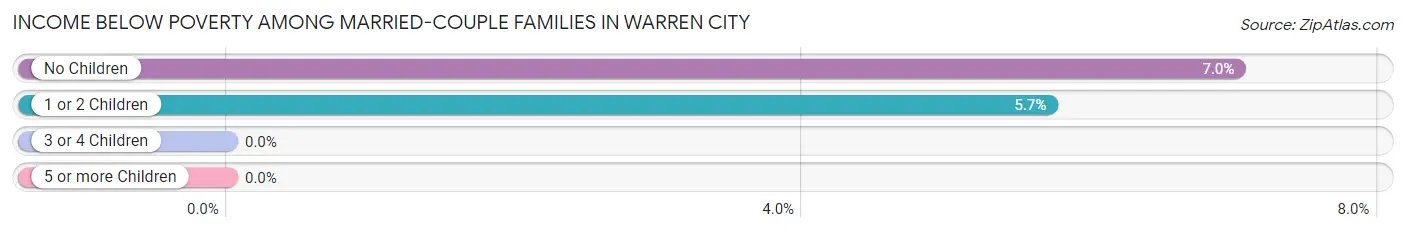
| Children | Above Poverty | Below Poverty |
| No Children | 53 (93.0%) | 4 (7.0%) |
| 1 or 2 Children | 33 (94.3%) | 2 (5.7%) |
| 3 or 4 Children | 6 (100.0%) | 0 (0.0%) |
| 5 or more Children | 0 (0.0%) | 0 (0.0%) |
| Total | 92 (93.9%) | 6 (6.1%) |
Income Below Poverty Among Single-Parent Households in Warren City
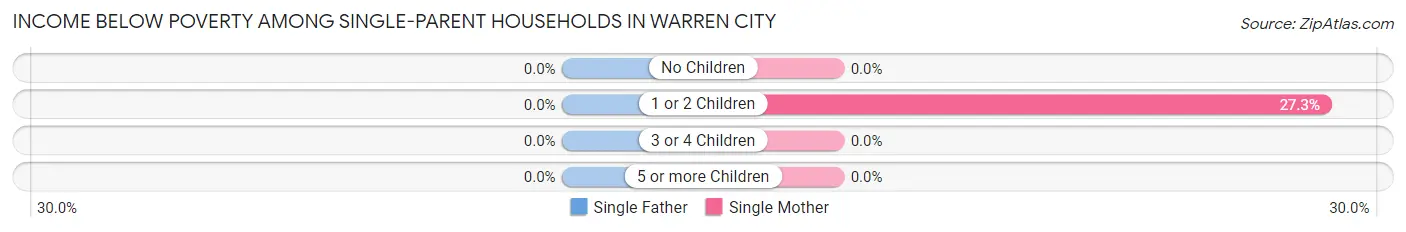
| Children | Single Father | Single Mother |
| No Children | 0 (0.0%) | 0 (0.0%) |
| 1 or 2 Children | 0 (0.0%) | 3 (27.3%) |
| 3 or 4 Children | 0 (0.0%) | 0 (0.0%) |
| 5 or more Children | 0 (0.0%) | 0 (0.0%) |
| Total | 0 (0.0%) | 3 (27.3%) |
Income Below Poverty Among Married-Couple vs Single-Parent Households in Warren City
The poverty data for Warren City shows that 6 of the married-couple family households (6.1%) and 3 of the single-parent households (27.3%) are living below the poverty level. Within the married-couple family households, those with no children have the highest poverty rate, with 4 households (7.0%) falling below the poverty line. Among the single-parent households, those with 1 or 2 children have the highest poverty rate, with 3 household (27.3%) living below poverty.
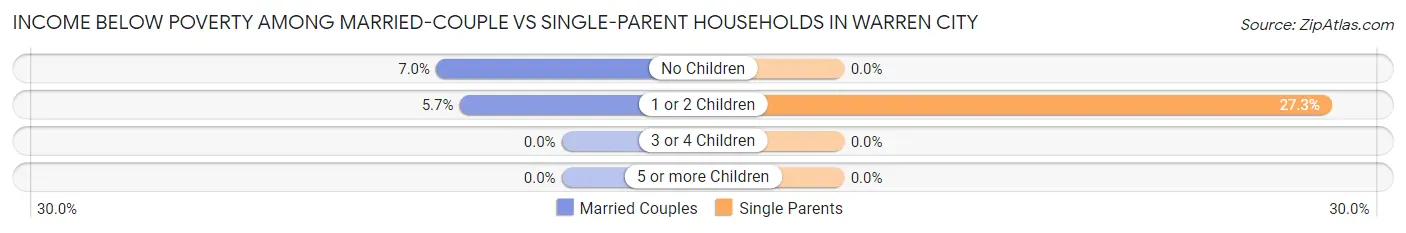
| Children | Married-Couple Families | Single-Parent Households |
| No Children | 4 (7.0%) | 0 (0.0%) |
| 1 or 2 Children | 2 (5.7%) | 3 (27.3%) |
| 3 or 4 Children | 0 (0.0%) | 0 (0.0%) |
| 5 or more Children | 0 (0.0%) | 0 (0.0%) |
| Total | 6 (6.1%) | 3 (27.3%) |
Race in Warren City
The most populous races in Warren City are White / Caucasian (324 | 85.7%), Black / African American (39 | 10.3%), and Hispanic or Latino (30 | 7.9%).
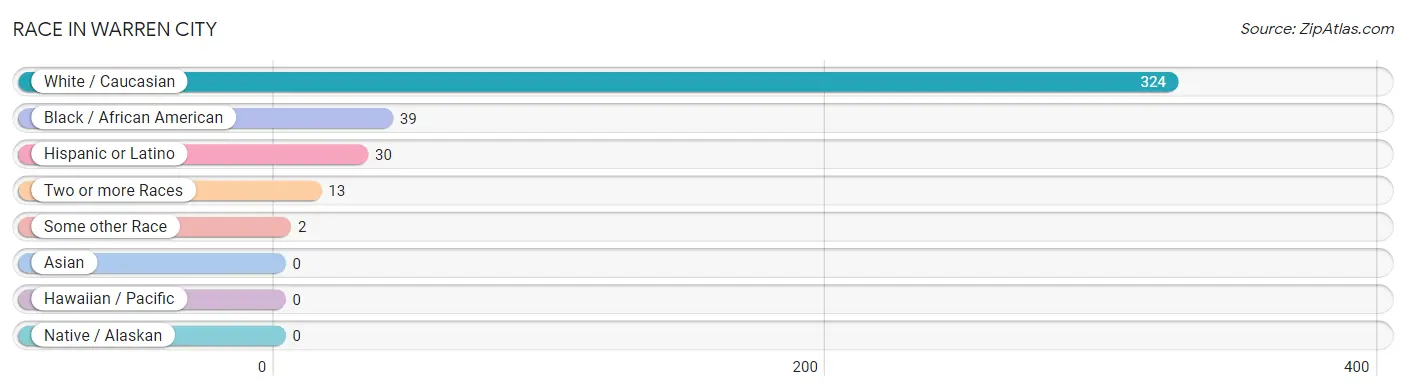
| Race | # Population | % Population |
| Asian | 0 | 0.0% |
| Black / African American | 39 | 10.3% |
| Hawaiian / Pacific | 0 | 0.0% |
| Hispanic or Latino | 30 | 7.9% |
| Native / Alaskan | 0 | 0.0% |
| White / Caucasian | 324 | 85.7% |
| Two or more Races | 13 | 3.4% |
| Some other Race | 2 | 0.5% |
| Total | 378 | 100.0% |
Ancestry in Warren City
The most populous ancestries reported in Warren City are English (89 | 23.5%), Irish (60 | 15.9%), American (51 | 13.5%), German (33 | 8.7%), and French (20 | 5.3%), together accounting for 66.9% of all Warren City residents.
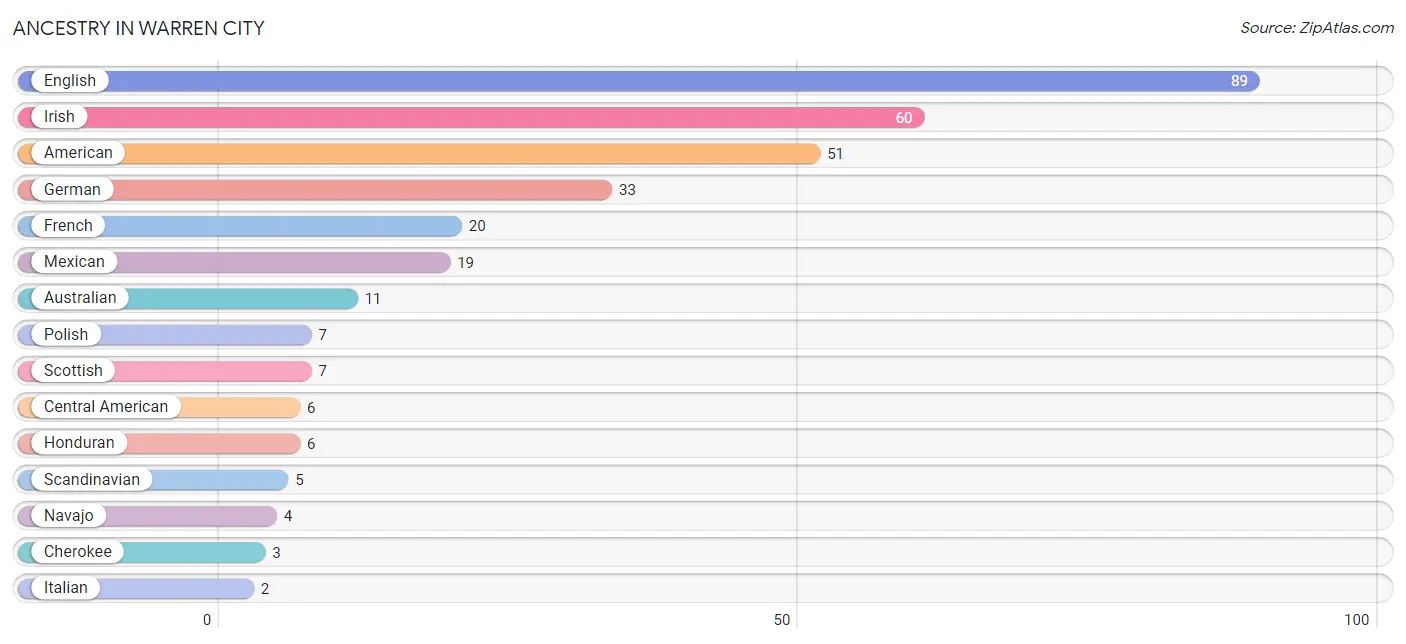
| Ancestry | # Population | % Population |
| American | 51 | 13.5% |
| Australian | 11 | 2.9% |
| Central American | 6 | 1.6% |
| Cherokee | 3 | 0.8% |
| English | 89 | 23.5% |
| French | 20 | 5.3% |
| German | 33 | 8.7% |
| Honduran | 6 | 1.6% |
| Irish | 60 | 15.9% |
| Italian | 2 | 0.5% |
| Mexican | 19 | 5.0% |
| Navajo | 4 | 1.1% |
| Norwegian | 1 | 0.3% |
| Polish | 7 | 1.8% |
| Scandinavian | 5 | 1.3% |
| Scottish | 7 | 1.8% |
| Swedish | 1 | 0.3% | View All 17 Rows |
Immigrants in Warren City
The most numerous immigrant groups reported in Warren City came from Central America (9 | 2.4%), Latin America (9 | 2.4%), Mexico (7 | 1.8%), Belize (2 | 0.5%), and Europe (2 | 0.5%), together accounting for 7.7% of all Warren City residents.
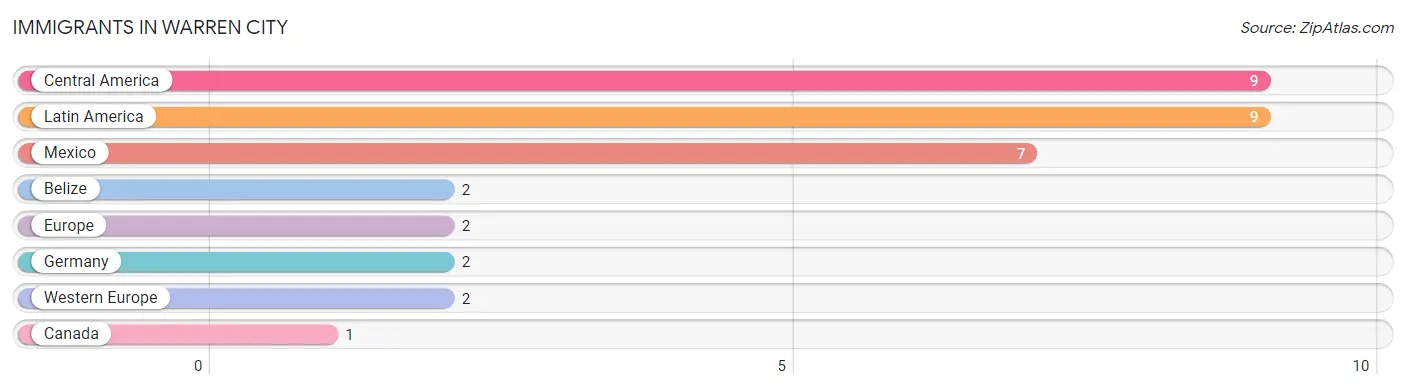
| Immigration Origin | # Population | % Population |
| Belize | 2 | 0.5% |
| Canada | 1 | 0.3% |
| Central America | 9 | 2.4% |
| Europe | 2 | 0.5% |
| Germany | 2 | 0.5% |
| Latin America | 9 | 2.4% |
| Mexico | 7 | 1.8% |
| Western Europe | 2 | 0.5% | View All 8 Rows |
Sex and Age in Warren City
Sex and Age in Warren City
The most populous age groups in Warren City are 50 to 54 Years (32 | 17.4%) for men and 45 to 49 Years (32 | 16.5%) for women.
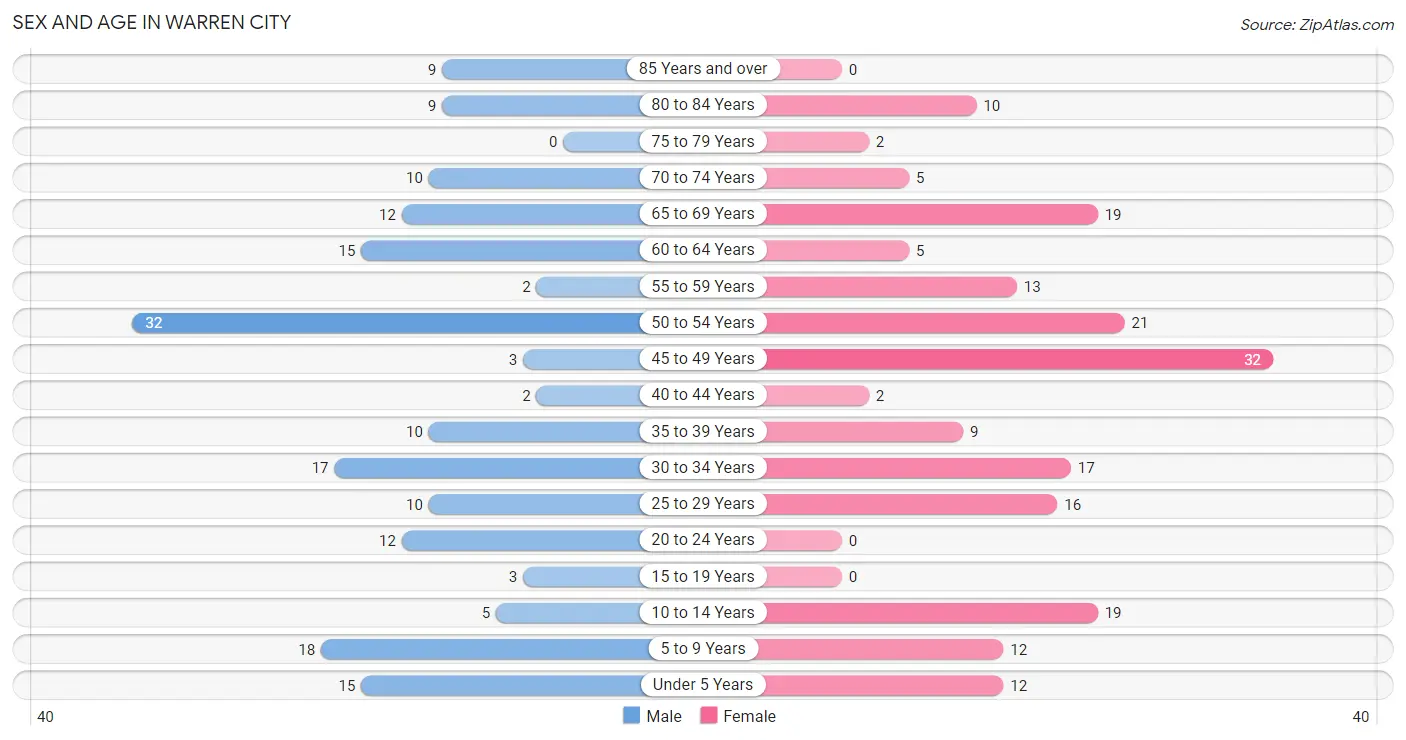
| Age Bracket | Male | Female |
| Under 5 Years | 15 (8.2%) | 12 (6.2%) |
| 5 to 9 Years | 18 (9.8%) | 12 (6.2%) |
| 10 to 14 Years | 5 (2.7%) | 19 (9.8%) |
| 15 to 19 Years | 3 (1.6%) | 0 (0.0%) |
| 20 to 24 Years | 12 (6.5%) | 0 (0.0%) |
| 25 to 29 Years | 10 (5.4%) | 16 (8.3%) |
| 30 to 34 Years | 17 (9.2%) | 17 (8.8%) |
| 35 to 39 Years | 10 (5.4%) | 9 (4.6%) |
| 40 to 44 Years | 2 (1.1%) | 2 (1.0%) |
| 45 to 49 Years | 3 (1.6%) | 32 (16.5%) |
| 50 to 54 Years | 32 (17.4%) | 21 (10.8%) |
| 55 to 59 Years | 2 (1.1%) | 13 (6.7%) |
| 60 to 64 Years | 15 (8.2%) | 5 (2.6%) |
| 65 to 69 Years | 12 (6.5%) | 19 (9.8%) |
| 70 to 74 Years | 10 (5.4%) | 5 (2.6%) |
| 75 to 79 Years | 0 (0.0%) | 2 (1.0%) |
| 80 to 84 Years | 9 (4.9%) | 10 (5.1%) |
| 85 Years and over | 9 (4.9%) | 0 (0.0%) |
| Total | 184 (100.0%) | 194 (100.0%) |
Families and Households in Warren City
Median Family Size in Warren City
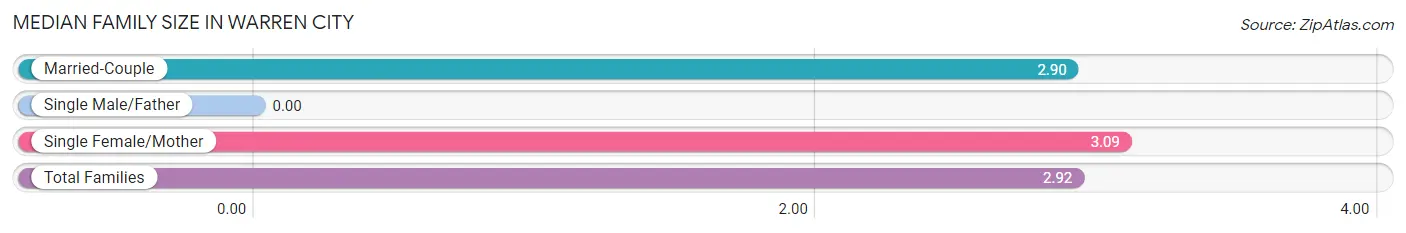
| Family Type | # Families | Family Size |
| Married-Couple | 98 (89.9%) | 2.90 |
| Single Male/Father | 0 (0.0%) | - |
| Single Female/Mother | 11 (10.1%) | 3.09 |
| Total Families | 109 (100.0%) | 2.92 |
Median Household Size in Warren City
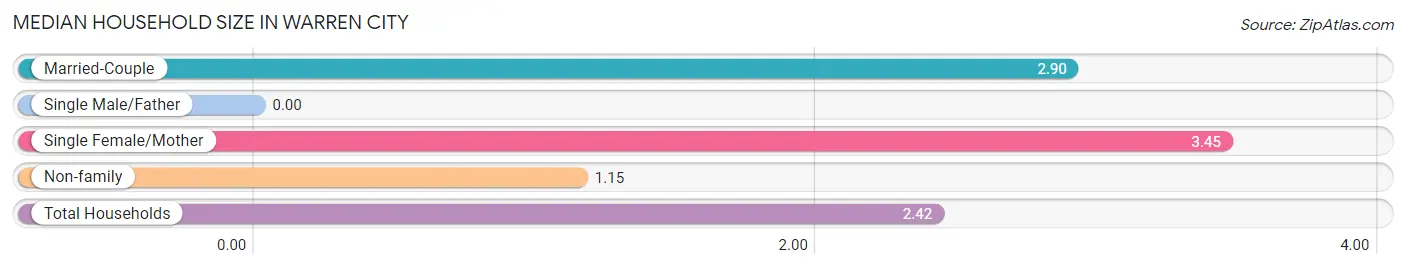
| Household Type | # Households | Household Size |
| Married-Couple | 98 (63.2%) | 2.90 |
| Single Male/Father | 0 (0.0%) | - |
| Single Female/Mother | 11 (7.1%) | 3.45 |
| Non-family | 46 (29.7%) | 1.15 |
| Total Households | 155 (100.0%) | 2.42 |
Household Size by Marriage Status in Warren City
Out of a total of 155 households in Warren City, 109 (70.3%) are family households, while 46 (29.7%) are nonfamily households. The most numerous type of family households are 2-person households, comprising 56, and the most common type of nonfamily households are 1-person households, comprising 38.
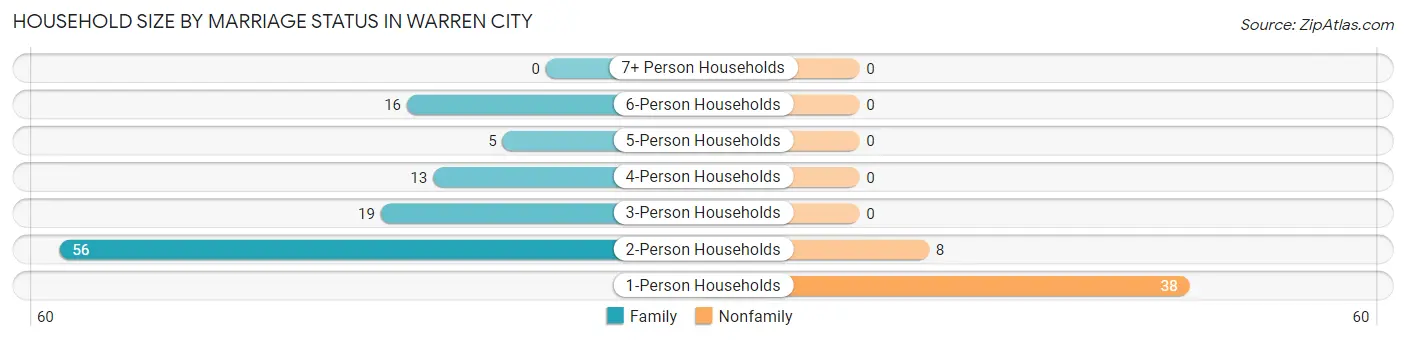
| Household Size | Family Households | Nonfamily Households |
| 1-Person Households | - | 38 (24.5%) |
| 2-Person Households | 56 (36.1%) | 8 (5.2%) |
| 3-Person Households | 19 (12.3%) | 0 (0.0%) |
| 4-Person Households | 13 (8.4%) | 0 (0.0%) |
| 5-Person Households | 5 (3.2%) | 0 (0.0%) |
| 6-Person Households | 16 (10.3%) | 0 (0.0%) |
| 7+ Person Households | 0 (0.0%) | 0 (0.0%) |
| Total | 109 (70.3%) | 46 (29.7%) |
Female Fertility in Warren City
Fertility by Age in Warren City
| Age Bracket | Women with Births | Births / 1,000 Women |
| 15 to 19 years | 0 (0.0%) | 0.0 |
| 20 to 34 years | 0 (0.0%) | 0.0 |
| 35 to 50 years | 0 (0.0%) | 0.0 |
| Total | 0 (0.0%) | 0.0 |
Fertility by Age by Marriage Status in Warren City
| Age Bracket | Married | Unmarried |
| 15 to 19 years | 0 (0.0%) | 0 (0.0%) |
| 20 to 34 years | 0 (0.0%) | 0 (0.0%) |
| 35 to 50 years | 0 (0.0%) | 0 (0.0%) |
| Total | 0 (0.0%) | 0 (0.0%) |
Fertility by Education in Warren City
| Educational Attainment | Women with Births | Births / 1,000 Women |
| Less than High School | 0 (0.0%) | 0.0 |
| High School Diploma | 0 (0.0%) | 0.0 |
| College or Associate's Degree | 0 (0.0%) | 0.0 |
| Bachelor's Degree | 0 (0.0%) | 0.0 |
| Graduate Degree | 0 (0.0%) | 0.0 |
| Total | 0 (0.0%) | 0.0 |
Fertility by Education by Marriage Status in Warren City
| Educational Attainment | Married | Unmarried |
| Less than High School | 0 (0.0%) | 0 (0.0%) |
| High School Diploma | 0 (0.0%) | 0 (0.0%) |
| College or Associate's Degree | 0 (0.0%) | 0 (0.0%) |
| Bachelor's Degree | 0 (0.0%) | 0 (0.0%) |
| Graduate Degree | 0 (0.0%) | 0 (0.0%) |
| Total | 0 (0.0%) | 0 (0.0%) |
Employment Characteristics in Warren City
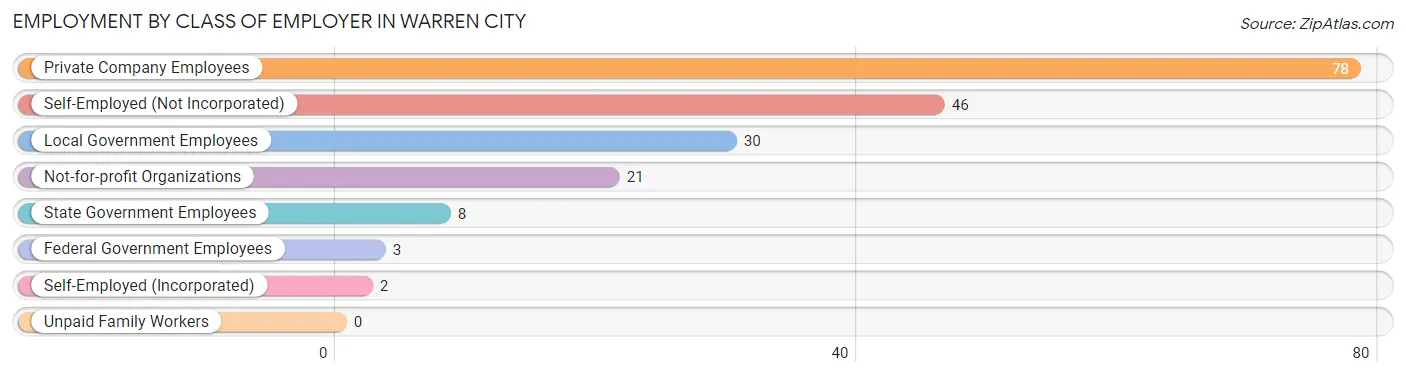
Employment by Class of Employer in Warren City
Among the 188 employed individuals in Warren City, private company employees (78 | 41.5%), self-employed (not incorporated) (46 | 24.5%), and local government employees (30 | 16.0%) make up the most common classes of employment.
| Employer Class | # Employees | % Employees |
| Private Company Employees | 78 | 41.5% |
| Self-Employed (Incorporated) | 2 | 1.1% |
| Self-Employed (Not Incorporated) | 46 | 24.5% |
| Not-for-profit Organizations | 21 | 11.2% |
| Local Government Employees | 30 | 16.0% |
| State Government Employees | 8 | 4.3% |
| Federal Government Employees | 3 | 1.6% |
| Unpaid Family Workers | 0 | 0.0% |
| Total | 188 | 100.0% |
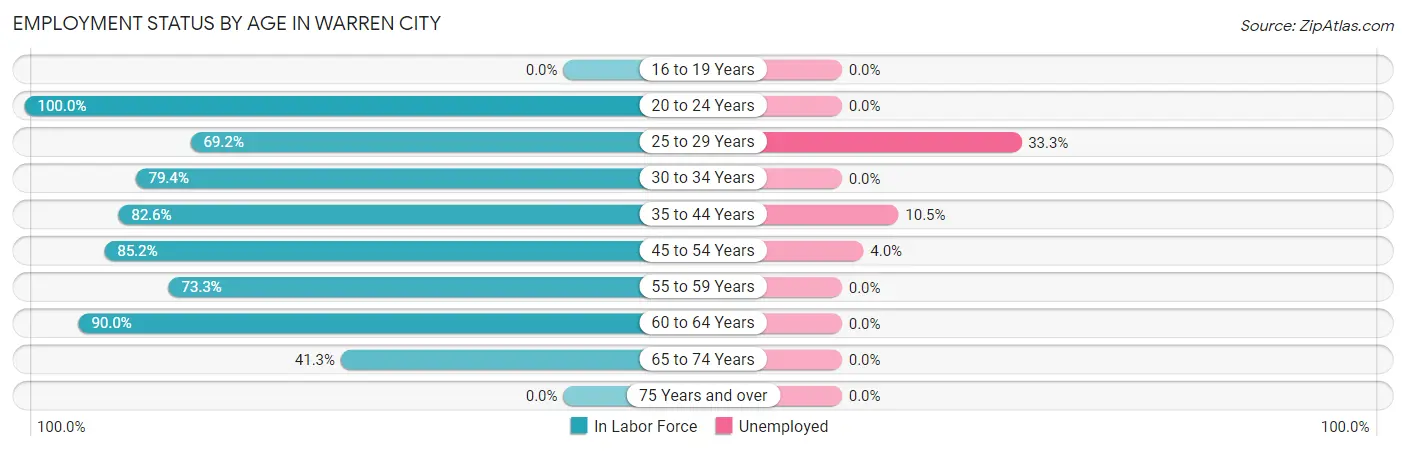
Employment Status by Age in Warren City
According to the labor force statistics for Warren City, out of the total population over 16 years of age (297), 67.0% or 199 individuals are in the labor force, with 5.5% or 11 of them unemployed. The age group with the highest labor force participation rate is 20 to 24 years, with 100.0% or 12 individuals in the labor force. Within the labor force, the 25 to 29 years age range has the highest percentage of unemployed individuals, with 33.3% or 6 of them being unemployed.
| Age Bracket | In Labor Force | Unemployed |
| 16 to 19 Years | 0 (0.0%) | 0 (0.0%) |
| 20 to 24 Years | 12 (100.0%) | 0 (0.0%) |
| 25 to 29 Years | 18 (69.2%) | 6 (33.3%) |
| 30 to 34 Years | 27 (79.4%) | 0 (0.0%) |
| 35 to 44 Years | 19 (82.6%) | 2 (10.5%) |
| 45 to 54 Years | 75 (85.2%) | 3 (4.0%) |
| 55 to 59 Years | 11 (73.3%) | 0 (0.0%) |
| 60 to 64 Years | 18 (90.0%) | 0 (0.0%) |
| 65 to 74 Years | 19 (41.3%) | 0 (0.0%) |
| 75 Years and over | 0 (0.0%) | 0 (0.0%) |
| Total | 199 (67.0%) | 11 (5.5%) |
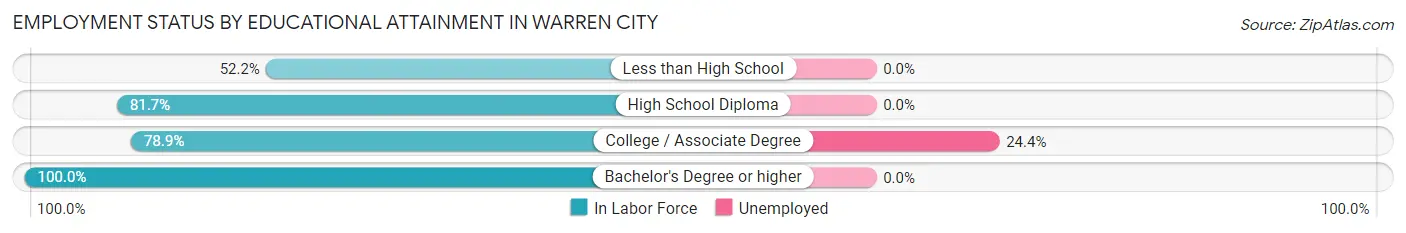
Employment Status by Educational Attainment in Warren City
According to labor force statistics for Warren City, 81.6% of individuals (168) out of the total population between 25 and 64 years of age (206) are in the labor force, with 6.5% or 11 of them being unemployed. The group with the highest labor force participation rate are those with the educational attainment of bachelor's degree or higher, with 100.0% or 44 individuals in the labor force. Within the labor force, individuals with college / associate degree education have the highest percentage of unemployment, with 24.4% or 11 of them being unemployed.
| Educational Attainment | In Labor Force | Unemployed |
| Less than High School | 12 (52.2%) | 0 (0.0%) |
| High School Diploma | 67 (81.7%) | 0 (0.0%) |
| College / Associate Degree | 45 (78.9%) | 14 (24.4%) |
| Bachelor's Degree or higher | 44 (100.0%) | 0 (0.0%) |
| Total | 168 (81.6%) | 13 (6.5%) |
Employment Occupations by Sex in Warren City
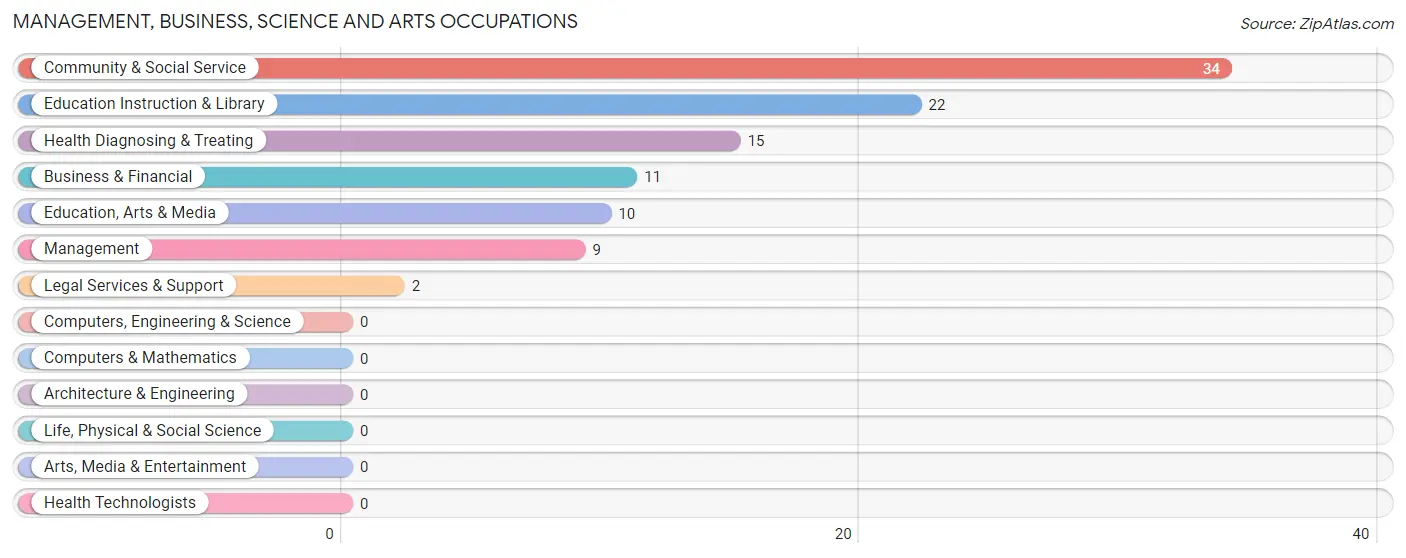
Management, Business, Science and Arts Occupations
The most common Management, Business, Science and Arts occupations in Warren City are Community & Social Service (34 | 18.1%), Education Instruction & Library (22 | 11.7%), Health Diagnosing & Treating (15 | 8.0%), Business & Financial (11 | 5.9%), and Education, Arts & Media (10 | 5.3%).
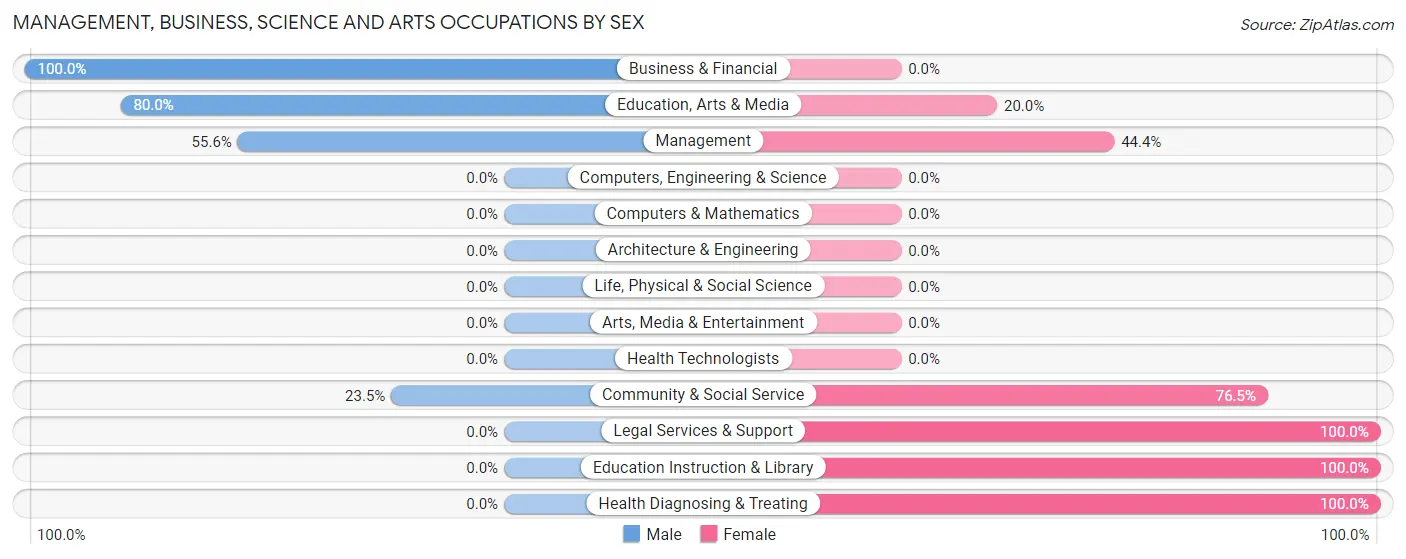
Management, Business, Science and Arts Occupations by Sex
Within the Management, Business, Science and Arts occupations in Warren City, the most male-oriented occupations are Business & Financial (100.0%), Education, Arts & Media (80.0%), and Management (55.6%), while the most female-oriented occupations are Legal Services & Support (100.0%), Education Instruction & Library (100.0%), and Health Diagnosing & Treating (100.0%).
| Occupation | Male | Female |
| Management | 5 (55.6%) | 4 (44.4%) |
| Business & Financial | 11 (100.0%) | 0 (0.0%) |
| Computers, Engineering & Science | 0 (0.0%) | 0 (0.0%) |
| Computers & Mathematics | 0 (0.0%) | 0 (0.0%) |
| Architecture & Engineering | 0 (0.0%) | 0 (0.0%) |
| Life, Physical & Social Science | 0 (0.0%) | 0 (0.0%) |
| Community & Social Service | 8 (23.5%) | 26 (76.5%) |
| Education, Arts & Media | 8 (80.0%) | 2 (20.0%) |
| Legal Services & Support | 0 (0.0%) | 2 (100.0%) |
| Education Instruction & Library | 0 (0.0%) | 22 (100.0%) |
| Arts, Media & Entertainment | 0 (0.0%) | 0 (0.0%) |
| Health Diagnosing & Treating | 0 (0.0%) | 15 (100.0%) |
| Health Technologists | 0 (0.0%) | 0 (0.0%) |
| Total (Category) | 24 (34.8%) | 45 (65.2%) |
| Total (Overall) | 82 (43.6%) | 106 (56.4%) |
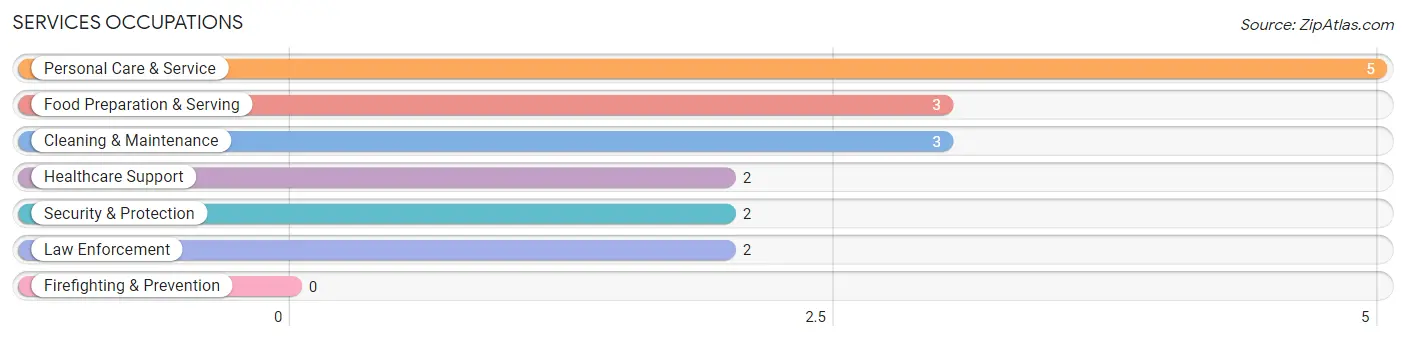
Services Occupations
The most common Services occupations in Warren City are Personal Care & Service (5 | 2.7%), Food Preparation & Serving (3 | 1.6%), Cleaning & Maintenance (3 | 1.6%), Healthcare Support (2 | 1.1%), and Security & Protection (2 | 1.1%).
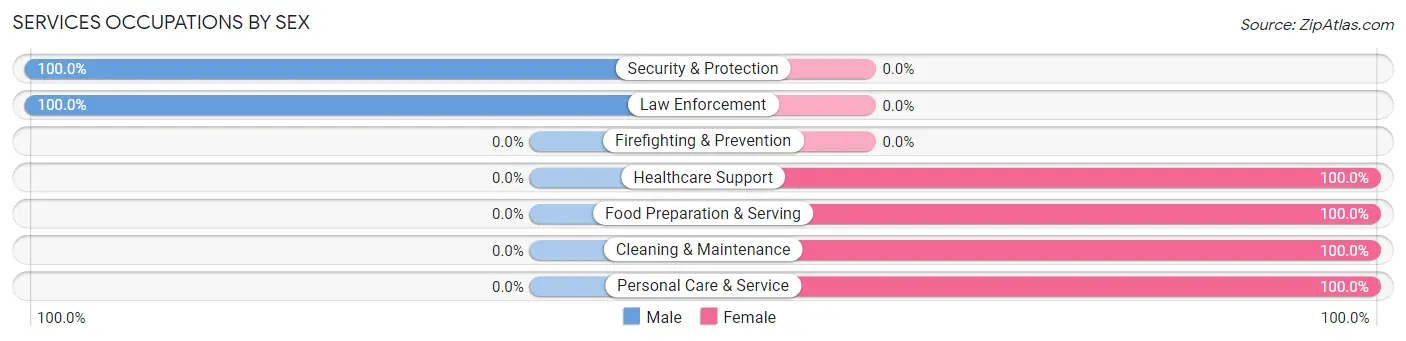
Services Occupations by Sex
Within the Services occupations in Warren City, the most male-oriented occupations are Security & Protection (100.0%), and Law Enforcement (100.0%), while the most female-oriented occupations are Healthcare Support (100.0%), Food Preparation & Serving (100.0%), and Cleaning & Maintenance (100.0%).
| Occupation | Male | Female |
| Healthcare Support | 0 (0.0%) | 2 (100.0%) |
| Security & Protection | 2 (100.0%) | 0 (0.0%) |
| Firefighting & Prevention | 0 (0.0%) | 0 (0.0%) |
| Law Enforcement | 2 (100.0%) | 0 (0.0%) |
| Food Preparation & Serving | 0 (0.0%) | 3 (100.0%) |
| Cleaning & Maintenance | 0 (0.0%) | 3 (100.0%) |
| Personal Care & Service | 0 (0.0%) | 5 (100.0%) |
| Total (Category) | 2 (13.3%) | 13 (86.7%) |
| Total (Overall) | 82 (43.6%) | 106 (56.4%) |
Sales and Office Occupations
The most common Sales and Office occupations in Warren City are Office & Administration (15 | 8.0%), and Sales & Related (3 | 1.6%).
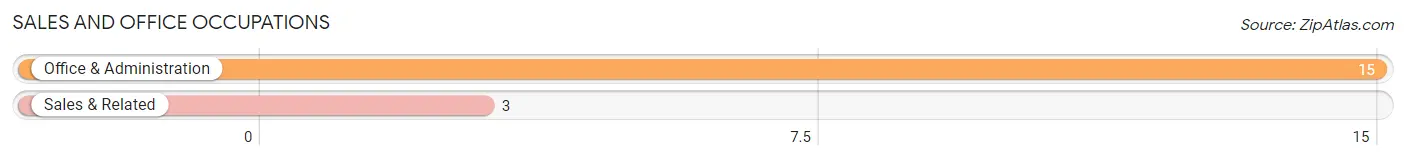
Sales and Office Occupations by Sex
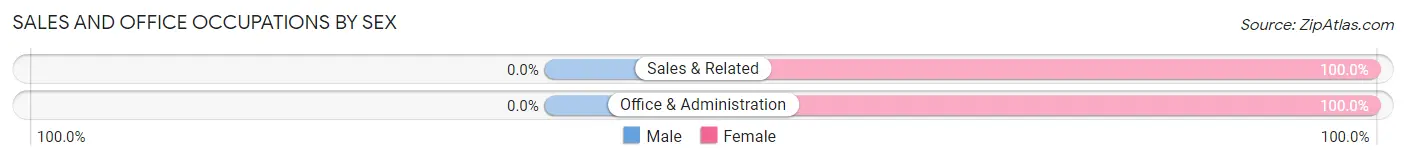
| Occupation | Male | Female |
| Sales & Related | 0 (0.0%) | 3 (100.0%) |
| Office & Administration | 0 (0.0%) | 15 (100.0%) |
| Total (Category) | 0 (0.0%) | 18 (100.0%) |
| Total (Overall) | 82 (43.6%) | 106 (56.4%) |
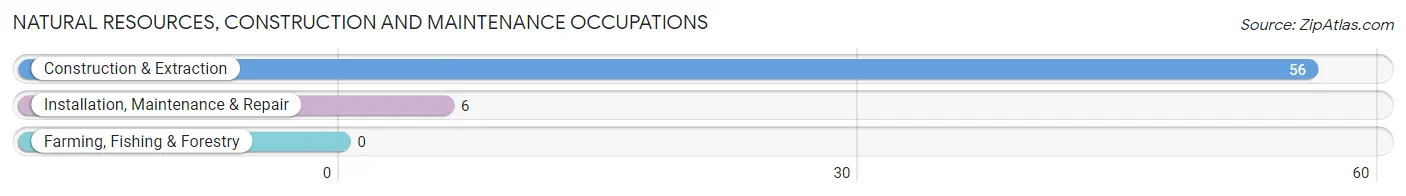
Natural Resources, Construction and Maintenance Occupations
The most common Natural Resources, Construction and Maintenance occupations in Warren City are Construction & Extraction (56 | 29.8%), and Installation, Maintenance & Repair (6 | 3.2%).
Natural Resources, Construction and Maintenance Occupations by Sex
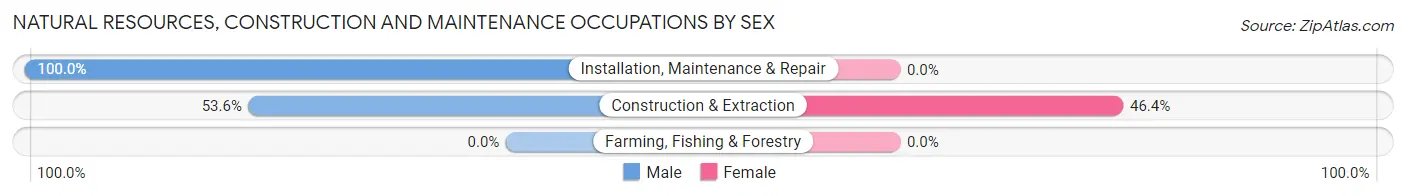
| Occupation | Male | Female |
| Farming, Fishing & Forestry | 0 (0.0%) | 0 (0.0%) |
| Construction & Extraction | 30 (53.6%) | 26 (46.4%) |
| Installation, Maintenance & Repair | 6 (100.0%) | 0 (0.0%) |
| Total (Category) | 36 (58.1%) | 26 (41.9%) |
| Total (Overall) | 82 (43.6%) | 106 (56.4%) |
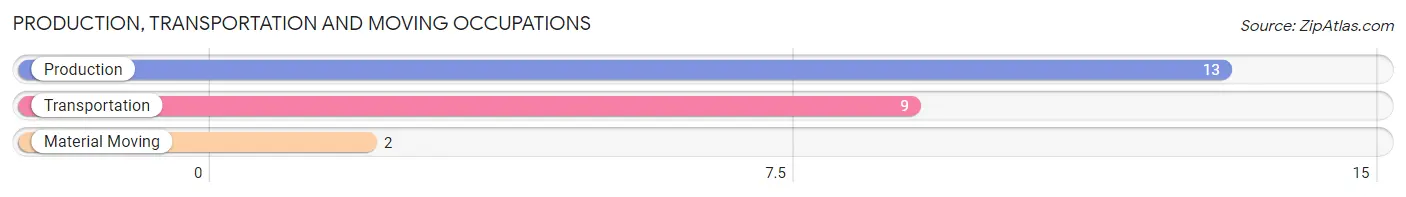
Production, Transportation and Moving Occupations
The most common Production, Transportation and Moving occupations in Warren City are Production (13 | 6.9%), Transportation (9 | 4.8%), and Material Moving (2 | 1.1%).
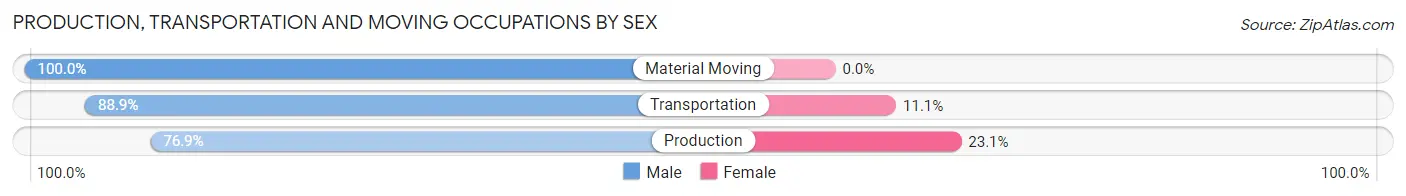
Production, Transportation and Moving Occupations by Sex
| Occupation | Male | Female |
| Production | 10 (76.9%) | 3 (23.1%) |
| Transportation | 8 (88.9%) | 1 (11.1%) |
| Material Moving | 2 (100.0%) | 0 (0.0%) |
| Total (Category) | 20 (83.3%) | 4 (16.7%) |
| Total (Overall) | 82 (43.6%) | 106 (56.4%) |
Employment Industries by Sex in Warren City
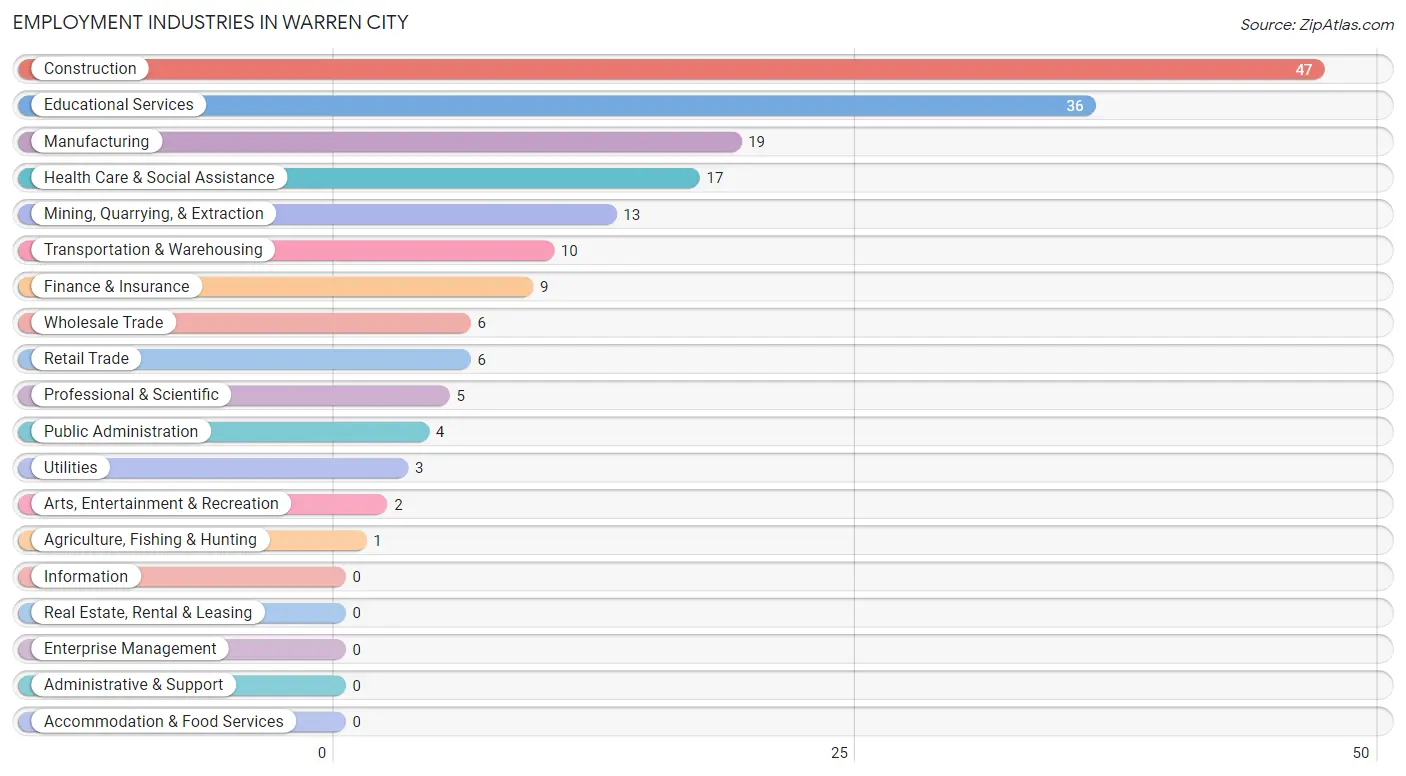
Employment Industries in Warren City
The major employment industries in Warren City include Construction (47 | 25.0%), Educational Services (36 | 19.2%), Manufacturing (19 | 10.1%), Health Care & Social Assistance (17 | 9.0%), and Mining, Quarrying, & Extraction (13 | 6.9%).
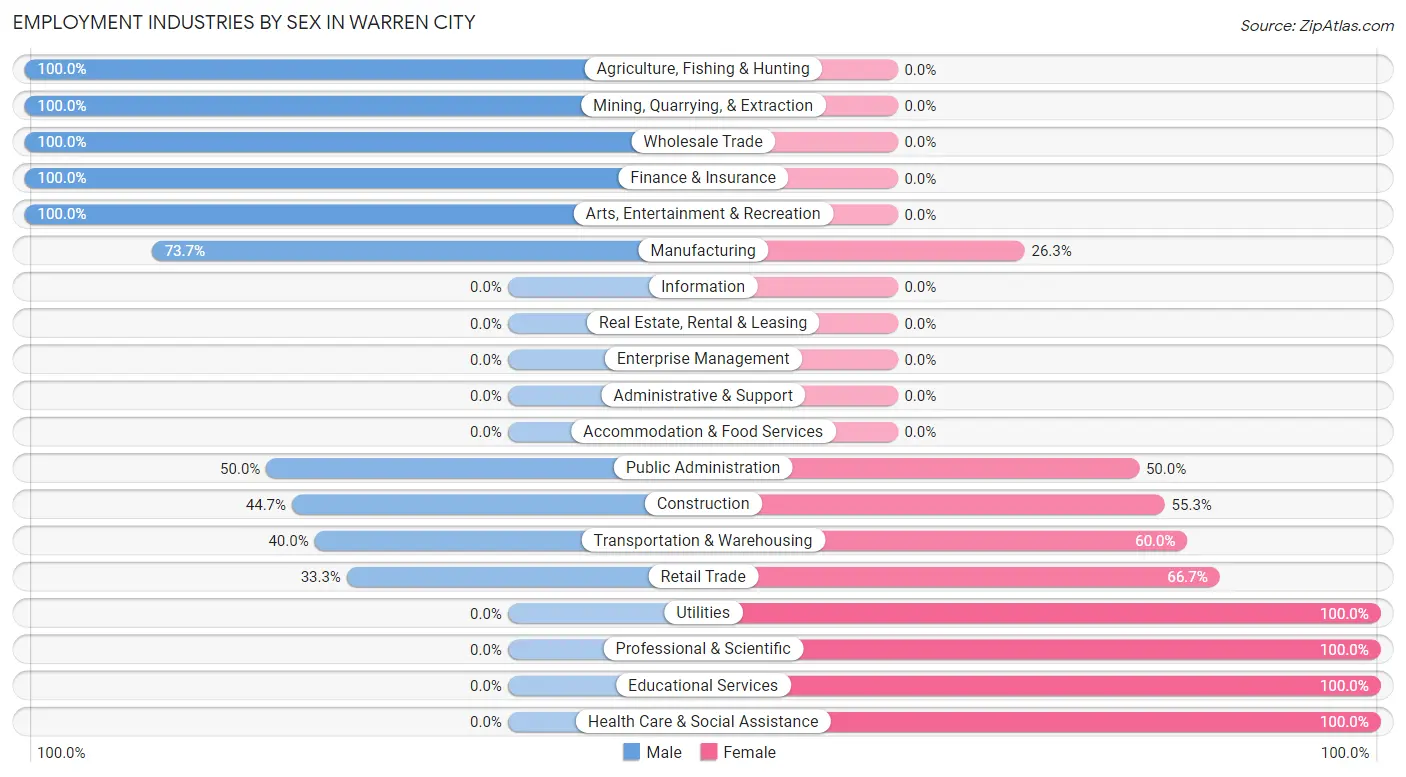
Employment Industries by Sex in Warren City
The Warren City industries that see more men than women are Agriculture, Fishing & Hunting (100.0%), Mining, Quarrying, & Extraction (100.0%), and Wholesale Trade (100.0%), whereas the industries that tend to have a higher number of women are Utilities (100.0%), Professional & Scientific (100.0%), and Educational Services (100.0%).
| Industry | Male | Female |
| Agriculture, Fishing & Hunting | 1 (100.0%) | 0 (0.0%) |
| Mining, Quarrying, & Extraction | 13 (100.0%) | 0 (0.0%) |
| Construction | 21 (44.7%) | 26 (55.3%) |
| Manufacturing | 14 (73.7%) | 5 (26.3%) |
| Wholesale Trade | 6 (100.0%) | 0 (0.0%) |
| Retail Trade | 2 (33.3%) | 4 (66.7%) |
| Transportation & Warehousing | 4 (40.0%) | 6 (60.0%) |
| Utilities | 0 (0.0%) | 3 (100.0%) |
| Information | 0 (0.0%) | 0 (0.0%) |
| Finance & Insurance | 9 (100.0%) | 0 (0.0%) |
| Real Estate, Rental & Leasing | 0 (0.0%) | 0 (0.0%) |
| Professional & Scientific | 0 (0.0%) | 5 (100.0%) |
| Enterprise Management | 0 (0.0%) | 0 (0.0%) |
| Administrative & Support | 0 (0.0%) | 0 (0.0%) |
| Educational Services | 0 (0.0%) | 36 (100.0%) |
| Health Care & Social Assistance | 0 (0.0%) | 17 (100.0%) |
| Arts, Entertainment & Recreation | 2 (100.0%) | 0 (0.0%) |
| Accommodation & Food Services | 0 (0.0%) | 0 (0.0%) |
| Public Administration | 2 (50.0%) | 2 (50.0%) |
| Total | 82 (43.6%) | 106 (56.4%) |
Education in Warren City
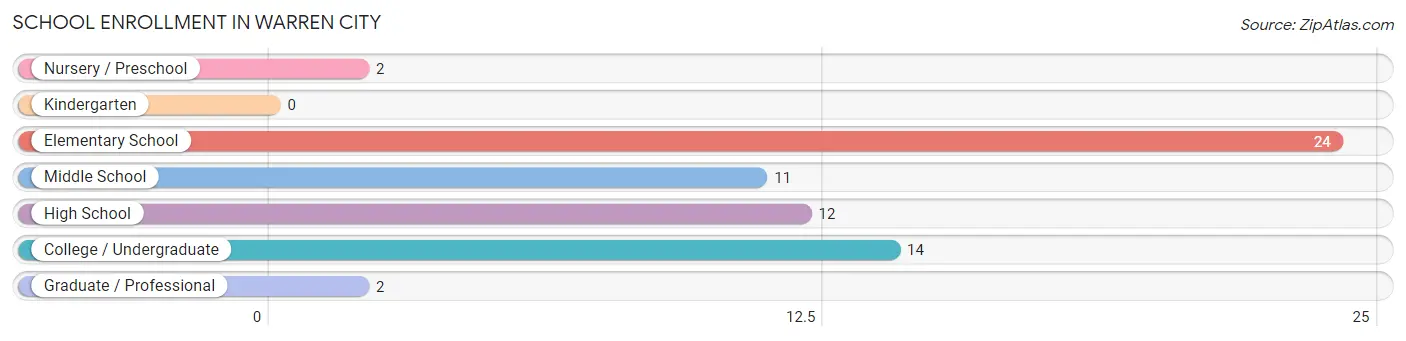
School Enrollment in Warren City
The most common levels of schooling among the 65 students in Warren City are elementary school (24 | 36.9%), college / undergraduate (14 | 21.5%), and high school (12 | 18.5%).
| School Level | # Students | % Students |
| Nursery / Preschool | 2 | 3.1% |
| Kindergarten | 0 | 0.0% |
| Elementary School | 24 | 36.9% |
| Middle School | 11 | 16.9% |
| High School | 12 | 18.5% |
| College / Undergraduate | 14 | 21.5% |
| Graduate / Professional | 2 | 3.1% |
| Total | 65 | 100.0% |
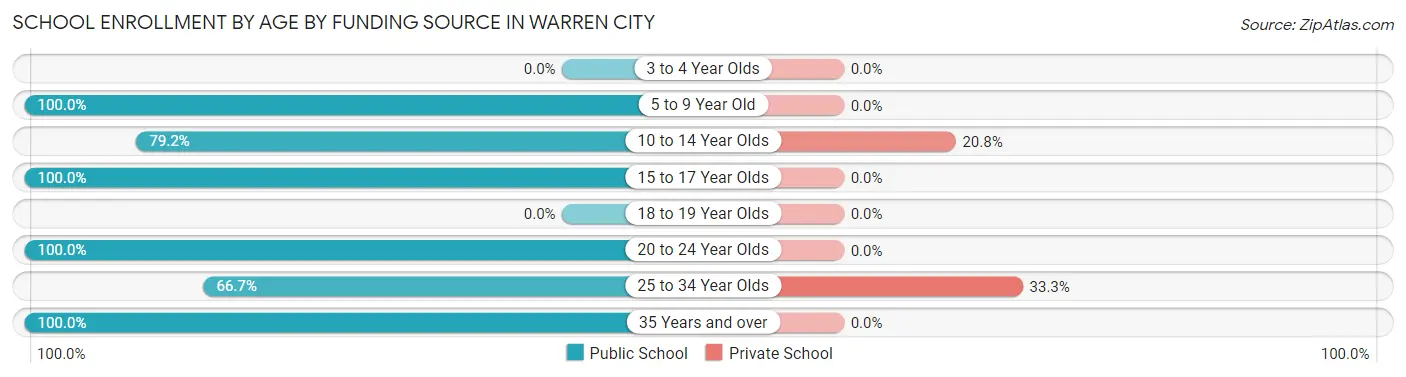
School Enrollment by Age by Funding Source in Warren City
Out of a total of 65 students who are enrolled in schools in Warren City, 8 (12.3%) attend a private institution, while the remaining 57 (87.7%) are enrolled in public schools. The age group of 25 to 34 year olds has the highest likelihood of being enrolled in private schools, with 3 (33.3% in the age bracket) enrolled. Conversely, the age group of 5 to 9 year old has the lowest likelihood of being enrolled in a private school, with 22 (100.0% in the age bracket) attending a public institution.
| Age Bracket | Public School | Private School |
| 3 to 4 Year Olds | 0 (0.0%) | 0 (0.0%) |
| 5 to 9 Year Old | 22 (100.0%) | 0 (0.0%) |
| 10 to 14 Year Olds | 19 (79.2%) | 5 (20.8%) |
| 15 to 17 Year Olds | 3 (100.0%) | 0 (0.0%) |
| 18 to 19 Year Olds | 0 (0.0%) | 0 (0.0%) |
| 20 to 24 Year Olds | 3 (100.0%) | 0 (0.0%) |
| 25 to 34 Year Olds | 6 (66.7%) | 3 (33.3%) |
| 35 Years and over | 4 (100.0%) | 0 (0.0%) |
| Total | 57 (87.7%) | 8 (12.3%) |
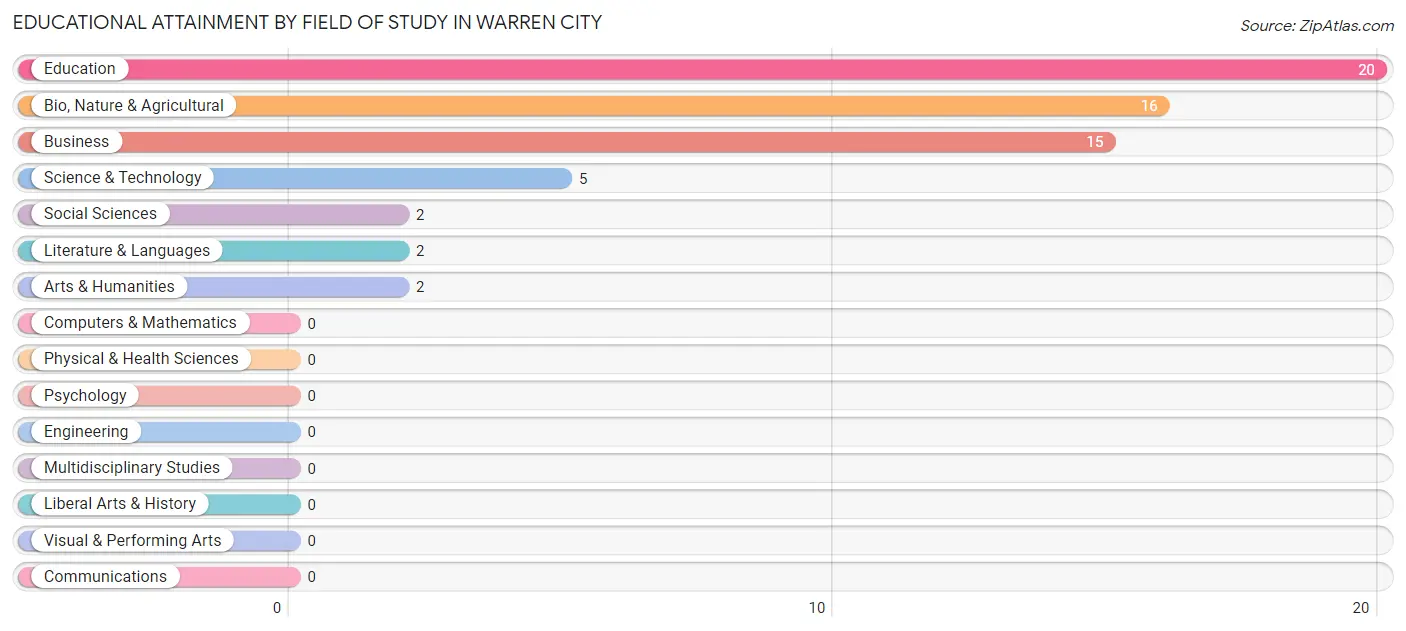
Educational Attainment by Field of Study in Warren City
Education (20 | 32.3%), bio, nature & agricultural (16 | 25.8%), business (15 | 24.2%), science & technology (5 | 8.1%), and social sciences (2 | 3.2%) are the most common fields of study among 62 individuals in Warren City who have obtained a bachelor's degree or higher.
| Field of Study | # Graduates | % Graduates |
| Computers & Mathematics | 0 | 0.0% |
| Bio, Nature & Agricultural | 16 | 25.8% |
| Physical & Health Sciences | 0 | 0.0% |
| Psychology | 0 | 0.0% |
| Social Sciences | 2 | 3.2% |
| Engineering | 0 | 0.0% |
| Multidisciplinary Studies | 0 | 0.0% |
| Science & Technology | 5 | 8.1% |
| Business | 15 | 24.2% |
| Education | 20 | 32.3% |
| Literature & Languages | 2 | 3.2% |
| Liberal Arts & History | 0 | 0.0% |
| Visual & Performing Arts | 0 | 0.0% |
| Communications | 0 | 0.0% |
| Arts & Humanities | 2 | 3.2% |
| Total | 62 | 100.0% |
Transportation & Commute in Warren City
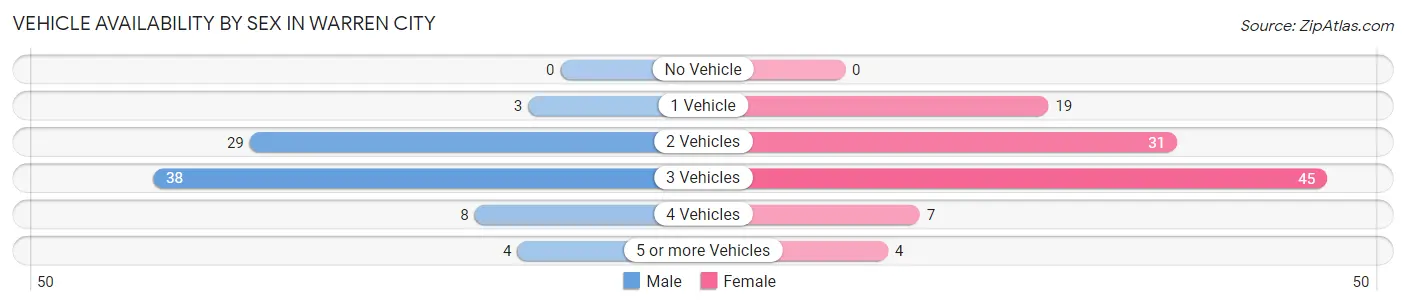
Vehicle Availability by Sex in Warren City
The most prevalent vehicle ownership categories in Warren City are males with 3 vehicles (38, accounting for 46.3%) and females with 3 vehicles (45, making up 35.8%).
| Vehicles Available | Male | Female |
| No Vehicle | 0 (0.0%) | 0 (0.0%) |
| 1 Vehicle | 3 (3.7%) | 19 (17.9%) |
| 2 Vehicles | 29 (35.4%) | 31 (29.2%) |
| 3 Vehicles | 38 (46.3%) | 45 (42.4%) |
| 4 Vehicles | 8 (9.8%) | 7 (6.6%) |
| 5 or more Vehicles | 4 (4.9%) | 4 (3.8%) |
| Total | 82 (100.0%) | 106 (100.0%) |
Commute Time in Warren City
The most frequently occuring commute durations in Warren City are 5 to 9 minutes (54 commuters, 29.0%), 20 to 24 minutes (27 commuters, 14.5%), and 25 to 29 minutes (27 commuters, 14.5%).
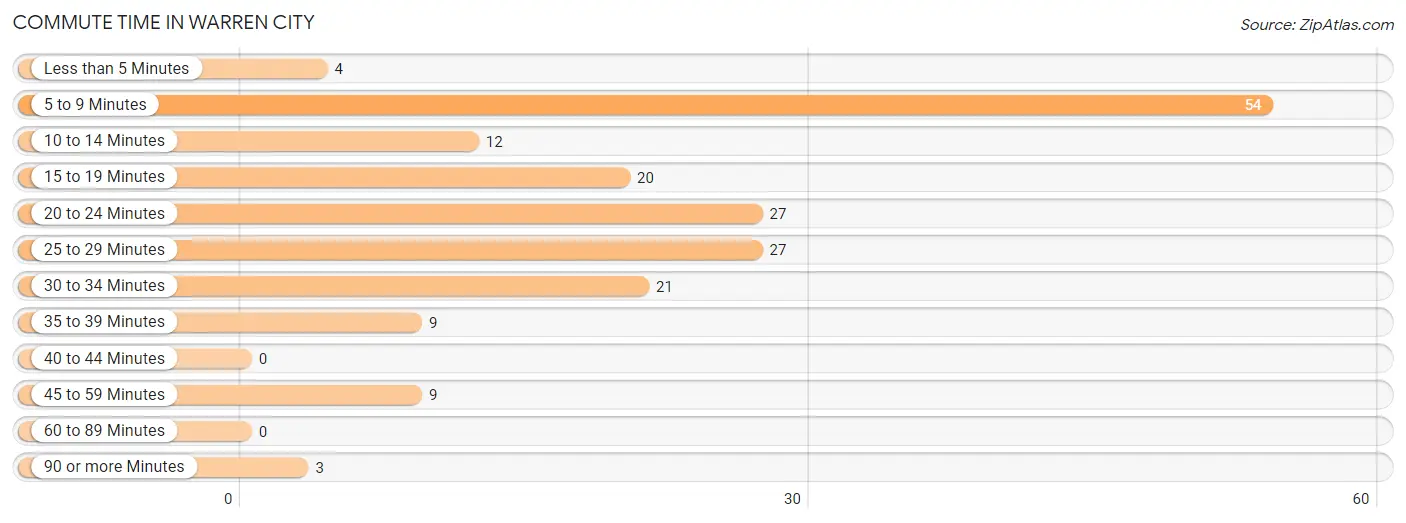
| Commute Time | # Commuters | % Commuters |
| Less than 5 Minutes | 4 | 2.1% |
| 5 to 9 Minutes | 54 | 29.0% |
| 10 to 14 Minutes | 12 | 6.5% |
| 15 to 19 Minutes | 20 | 10.7% |
| 20 to 24 Minutes | 27 | 14.5% |
| 25 to 29 Minutes | 27 | 14.5% |
| 30 to 34 Minutes | 21 | 11.3% |
| 35 to 39 Minutes | 9 | 4.8% |
| 40 to 44 Minutes | 0 | 0.0% |
| 45 to 59 Minutes | 9 | 4.8% |
| 60 to 89 Minutes | 0 | 0.0% |
| 90 or more Minutes | 3 | 1.6% |
Commute Time by Sex in Warren City
The most common commute times in Warren City are 5 to 9 minutes (28 commuters, 34.2%) for males and 5 to 9 minutes (26 commuters, 25.0%) for females.
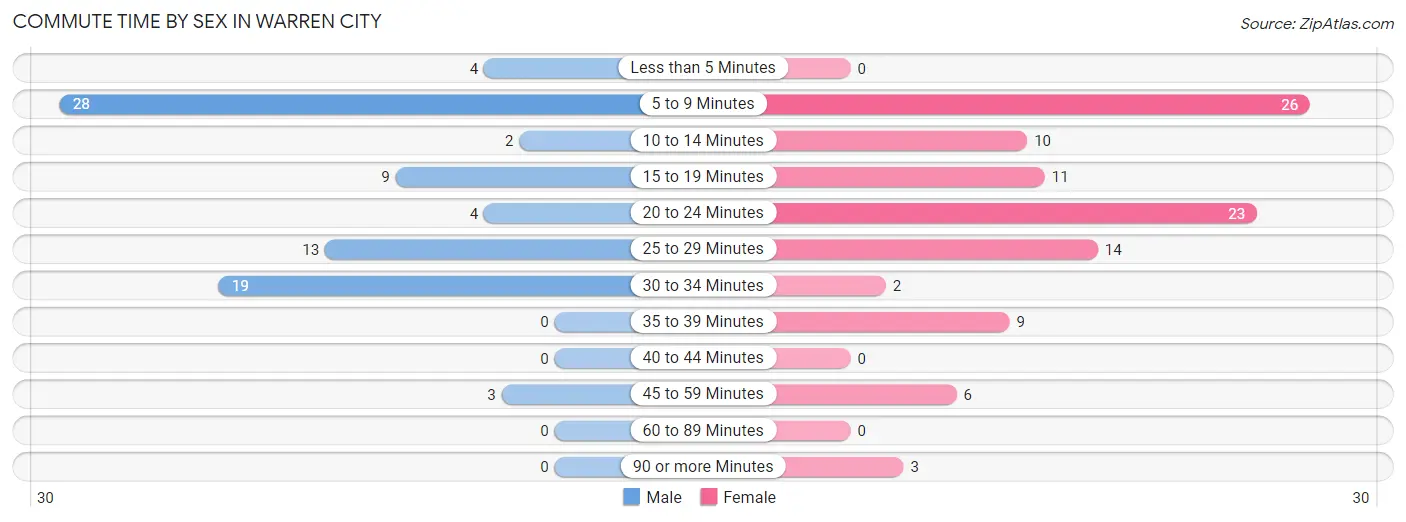
| Commute Time | Male | Female |
| Less than 5 Minutes | 4 (4.9%) | 0 (0.0%) |
| 5 to 9 Minutes | 28 (34.2%) | 26 (25.0%) |
| 10 to 14 Minutes | 2 (2.4%) | 10 (9.6%) |
| 15 to 19 Minutes | 9 (11.0%) | 11 (10.6%) |
| 20 to 24 Minutes | 4 (4.9%) | 23 (22.1%) |
| 25 to 29 Minutes | 13 (15.9%) | 14 (13.5%) |
| 30 to 34 Minutes | 19 (23.2%) | 2 (1.9%) |
| 35 to 39 Minutes | 0 (0.0%) | 9 (8.6%) |
| 40 to 44 Minutes | 0 (0.0%) | 0 (0.0%) |
| 45 to 59 Minutes | 3 (3.7%) | 6 (5.8%) |
| 60 to 89 Minutes | 0 (0.0%) | 0 (0.0%) |
| 90 or more Minutes | 0 (0.0%) | 3 (2.9%) |
Time of Departure to Work by Sex in Warren City
The most frequent times of departure to work in Warren City are 7:00 AM to 7:29 AM (23, 28.1%) for males and 7:00 AM to 7:29 AM (49, 47.1%) for females.
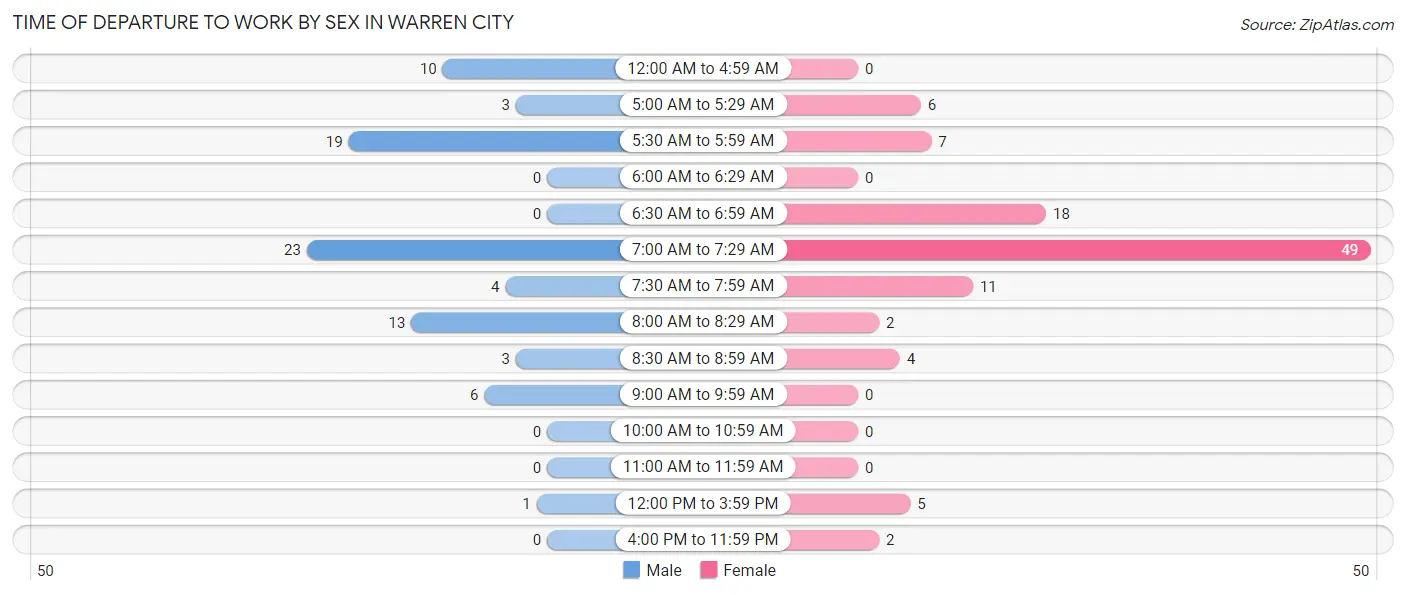
| Time of Departure | Male | Female |
| 12:00 AM to 4:59 AM | 10 (12.2%) | 0 (0.0%) |
| 5:00 AM to 5:29 AM | 3 (3.7%) | 6 (5.8%) |
| 5:30 AM to 5:59 AM | 19 (23.2%) | 7 (6.7%) |
| 6:00 AM to 6:29 AM | 0 (0.0%) | 0 (0.0%) |
| 6:30 AM to 6:59 AM | 0 (0.0%) | 18 (17.3%) |
| 7:00 AM to 7:29 AM | 23 (28.1%) | 49 (47.1%) |
| 7:30 AM to 7:59 AM | 4 (4.9%) | 11 (10.6%) |
| 8:00 AM to 8:29 AM | 13 (15.9%) | 2 (1.9%) |
| 8:30 AM to 8:59 AM | 3 (3.7%) | 4 (3.8%) |
| 9:00 AM to 9:59 AM | 6 (7.3%) | 0 (0.0%) |
| 10:00 AM to 10:59 AM | 0 (0.0%) | 0 (0.0%) |
| 11:00 AM to 11:59 AM | 0 (0.0%) | 0 (0.0%) |
| 12:00 PM to 3:59 PM | 1 (1.2%) | 5 (4.8%) |
| 4:00 PM to 11:59 PM | 0 (0.0%) | 2 (1.9%) |
| Total | 82 (100.0%) | 104 (100.0%) |
Housing Occupancy in Warren City
Occupancy by Ownership in Warren City
Of the total 155 dwellings in Warren City, owner-occupied units account for 108 (69.7%), while renter-occupied units make up 47 (30.3%).
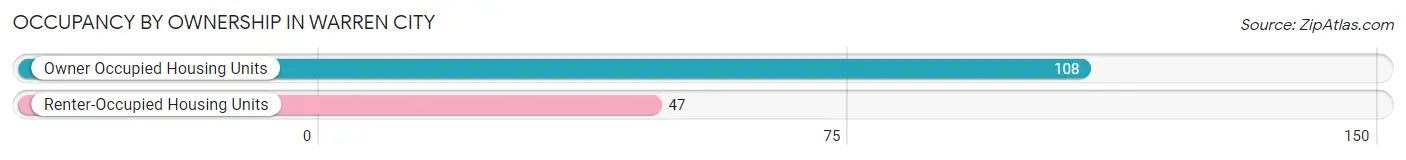
| Occupancy | # Housing Units | % Housing Units |
| Owner Occupied Housing Units | 108 | 69.7% |
| Renter-Occupied Housing Units | 47 | 30.3% |
| Total Occupied Housing Units | 155 | 100.0% |
Occupancy by Household Size in Warren City
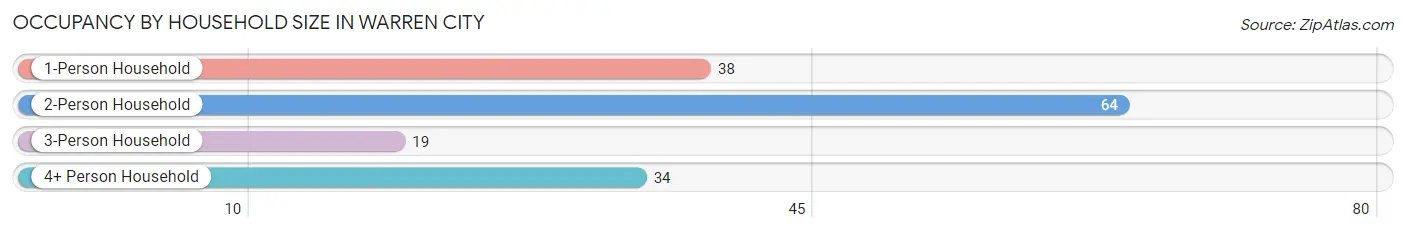
| Household Size | # Housing Units | % Housing Units |
| 1-Person Household | 38 | 24.5% |
| 2-Person Household | 64 | 41.3% |
| 3-Person Household | 19 | 12.3% |
| 4+ Person Household | 34 | 21.9% |
| Total Housing Units | 155 | 100.0% |
Occupancy by Ownership by Household Size in Warren City
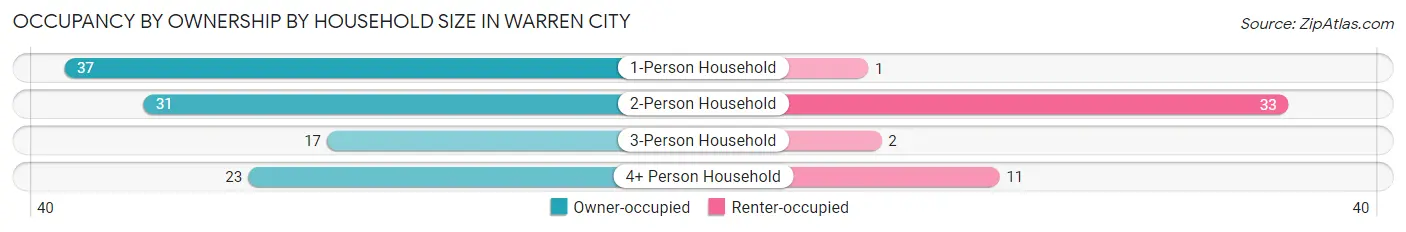
| Household Size | Owner-occupied | Renter-occupied |
| 1-Person Household | 37 (97.4%) | 1 (2.6%) |
| 2-Person Household | 31 (48.4%) | 33 (51.6%) |
| 3-Person Household | 17 (89.5%) | 2 (10.5%) |
| 4+ Person Household | 23 (67.6%) | 11 (32.4%) |
| Total Housing Units | 108 (69.7%) | 47 (30.3%) |
Occupancy by Educational Attainment in Warren City
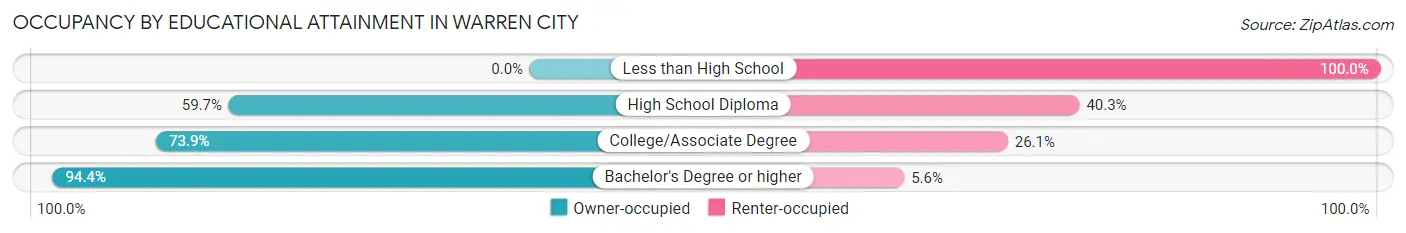
| Household Size | Owner-occupied | Renter-occupied |
| Less than High School | 0 (0.0%) | 6 (100.0%) |
| High School Diploma | 40 (59.7%) | 27 (40.3%) |
| College/Associate Degree | 34 (73.9%) | 12 (26.1%) |
| Bachelor's Degree or higher | 34 (94.4%) | 2 (5.6%) |
Occupancy by Age of Householder in Warren City
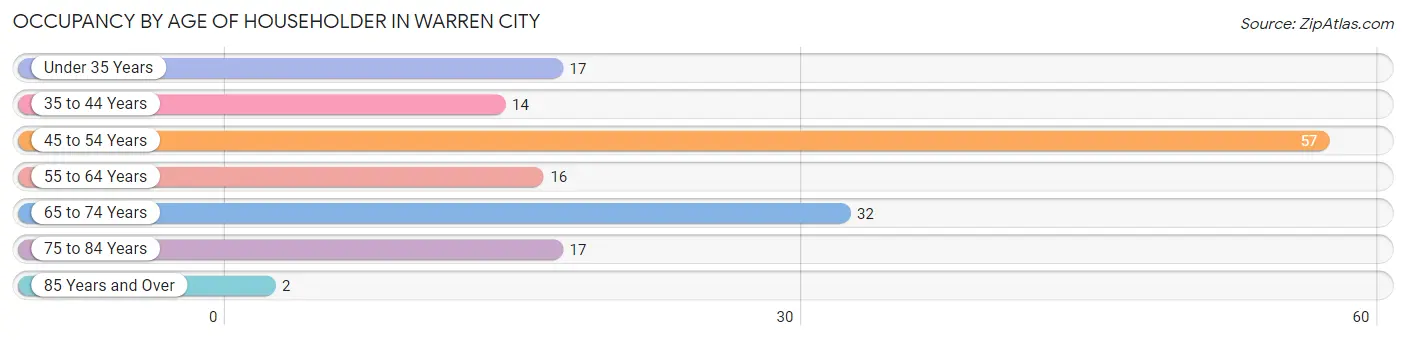
| Age Bracket | # Households | % Households |
| Under 35 Years | 17 | 11.0% |
| 35 to 44 Years | 14 | 9.0% |
| 45 to 54 Years | 57 | 36.8% |
| 55 to 64 Years | 16 | 10.3% |
| 65 to 74 Years | 32 | 20.6% |
| 75 to 84 Years | 17 | 11.0% |
| 85 Years and Over | 2 | 1.3% |
| Total | 155 | 100.0% |
Housing Finances in Warren City
Median Income by Occupancy in Warren City
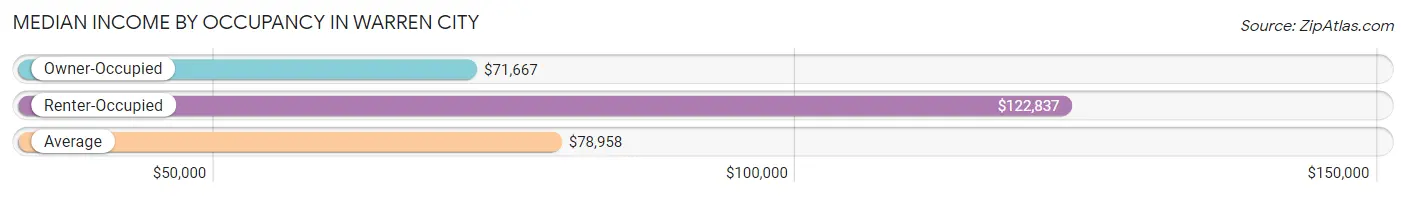
| Occupancy Type | # Households | Median Income |
| Owner-Occupied | 108 (69.7%) | $71,667 |
| Renter-Occupied | 47 (30.3%) | $122,837 |
| Average | 155 (100.0%) | $78,958 |
Occupancy by Householder Income Bracket in Warren City
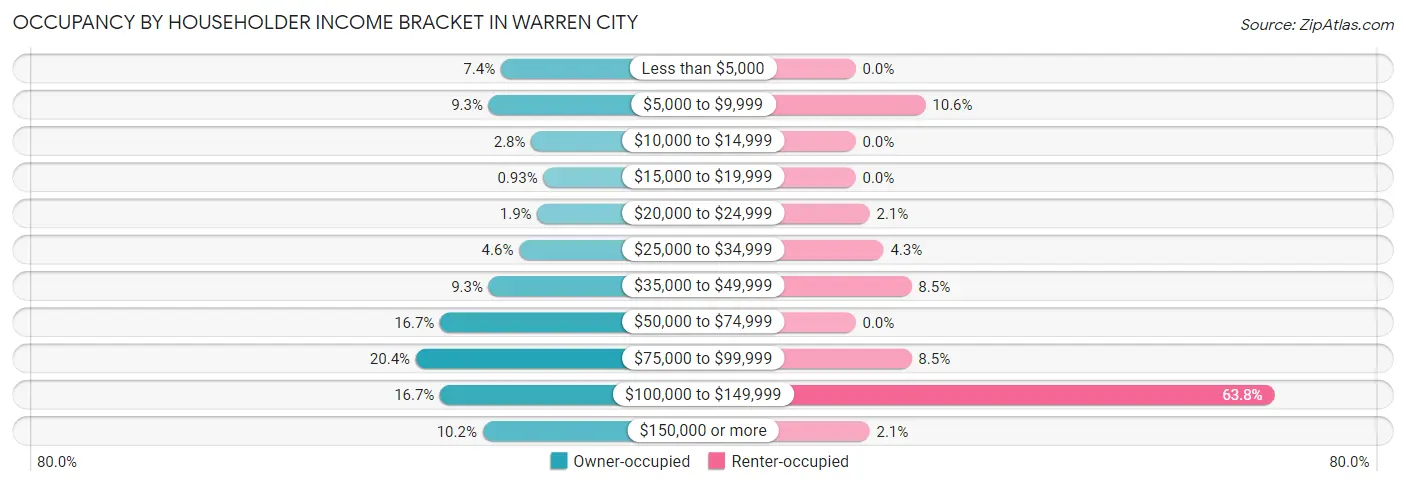
| Income Bracket | Owner-occupied | Renter-occupied |
| Less than $5,000 | 8 (7.4%) | 0 (0.0%) |
| $5,000 to $9,999 | 10 (9.3%) | 5 (10.6%) |
| $10,000 to $14,999 | 3 (2.8%) | 0 (0.0%) |
| $15,000 to $19,999 | 1 (0.9%) | 0 (0.0%) |
| $20,000 to $24,999 | 2 (1.8%) | 1 (2.1%) |
| $25,000 to $34,999 | 5 (4.6%) | 2 (4.3%) |
| $35,000 to $49,999 | 10 (9.3%) | 4 (8.5%) |
| $50,000 to $74,999 | 18 (16.7%) | 0 (0.0%) |
| $75,000 to $99,999 | 22 (20.4%) | 4 (8.5%) |
| $100,000 to $149,999 | 18 (16.7%) | 30 (63.8%) |
| $150,000 or more | 11 (10.2%) | 1 (2.1%) |
| Total | 108 (100.0%) | 47 (100.0%) |
Monthly Housing Cost Tiers in Warren City
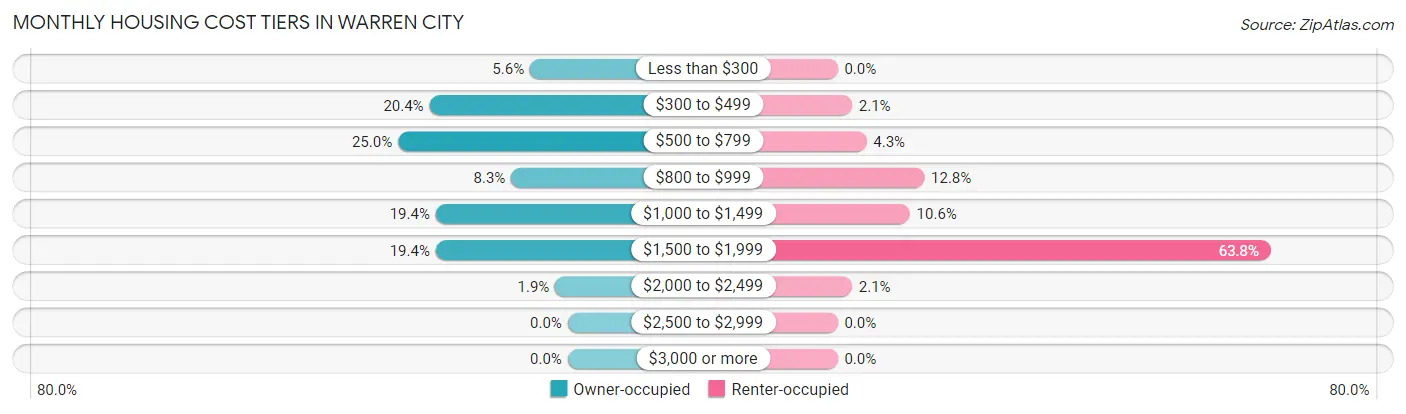
| Monthly Cost | Owner-occupied | Renter-occupied |
| Less than $300 | 6 (5.6%) | 0 (0.0%) |
| $300 to $499 | 22 (20.4%) | 1 (2.1%) |
| $500 to $799 | 27 (25.0%) | 2 (4.3%) |
| $800 to $999 | 9 (8.3%) | 6 (12.8%) |
| $1,000 to $1,499 | 21 (19.4%) | 5 (10.6%) |
| $1,500 to $1,999 | 21 (19.4%) | 30 (63.8%) |
| $2,000 to $2,499 | 2 (1.8%) | 1 (2.1%) |
| $2,500 to $2,999 | 0 (0.0%) | 0 (0.0%) |
| $3,000 or more | 0 (0.0%) | 0 (0.0%) |
| Total | 108 (100.0%) | 47 (100.0%) |
Physical Housing Characteristics in Warren City
Housing Structures in Warren City
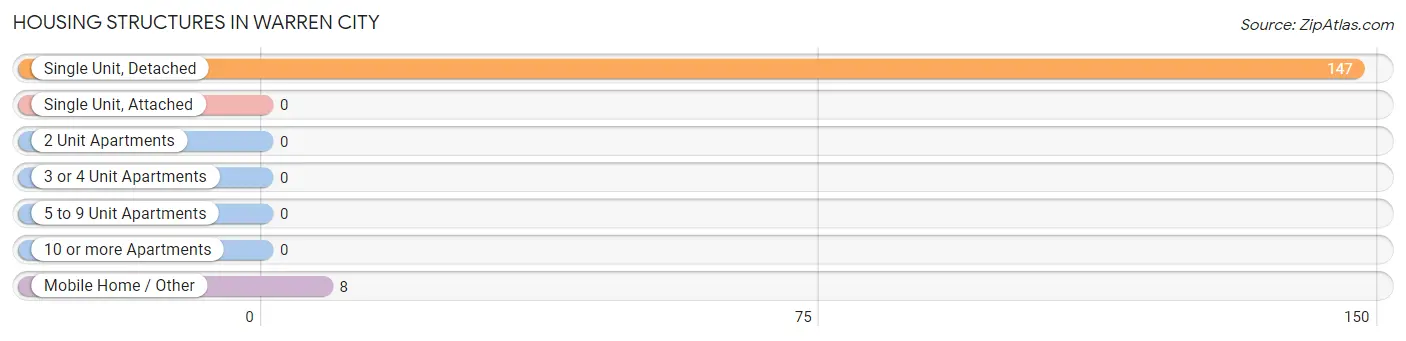
| Structure Type | # Housing Units | % Housing Units |
| Single Unit, Detached | 147 | 94.8% |
| Single Unit, Attached | 0 | 0.0% |
| 2 Unit Apartments | 0 | 0.0% |
| 3 or 4 Unit Apartments | 0 | 0.0% |
| 5 to 9 Unit Apartments | 0 | 0.0% |
| 10 or more Apartments | 0 | 0.0% |
| Mobile Home / Other | 8 | 5.2% |
| Total | 155 | 100.0% |
Housing Structures by Occupancy in Warren City
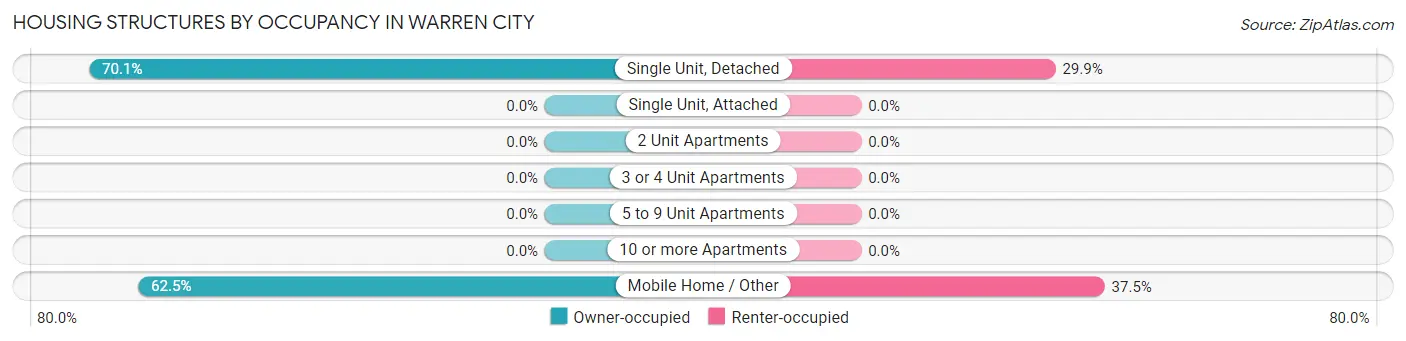
| Structure Type | Owner-occupied | Renter-occupied |
| Single Unit, Detached | 103 (70.1%) | 44 (29.9%) |
| Single Unit, Attached | 0 (0.0%) | 0 (0.0%) |
| 2 Unit Apartments | 0 (0.0%) | 0 (0.0%) |
| 3 or 4 Unit Apartments | 0 (0.0%) | 0 (0.0%) |
| 5 to 9 Unit Apartments | 0 (0.0%) | 0 (0.0%) |
| 10 or more Apartments | 0 (0.0%) | 0 (0.0%) |
| Mobile Home / Other | 5 (62.5%) | 3 (37.5%) |
| Total | 108 (69.7%) | 47 (30.3%) |
Housing Structures by Number of Rooms in Warren City
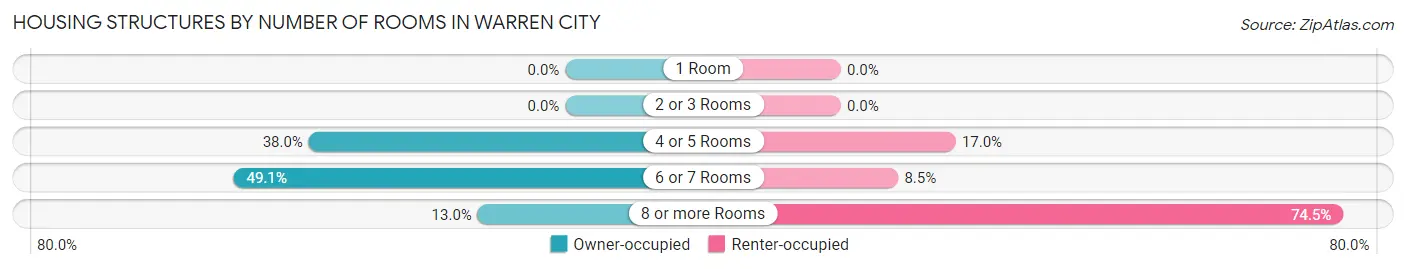
| Number of Rooms | Owner-occupied | Renter-occupied |
| 1 Room | 0 (0.0%) | 0 (0.0%) |
| 2 or 3 Rooms | 0 (0.0%) | 0 (0.0%) |
| 4 or 5 Rooms | 41 (38.0%) | 8 (17.0%) |
| 6 or 7 Rooms | 53 (49.1%) | 4 (8.5%) |
| 8 or more Rooms | 14 (13.0%) | 35 (74.5%) |
| Total | 108 (100.0%) | 47 (100.0%) |
Housing Structure by Heating Type in Warren City
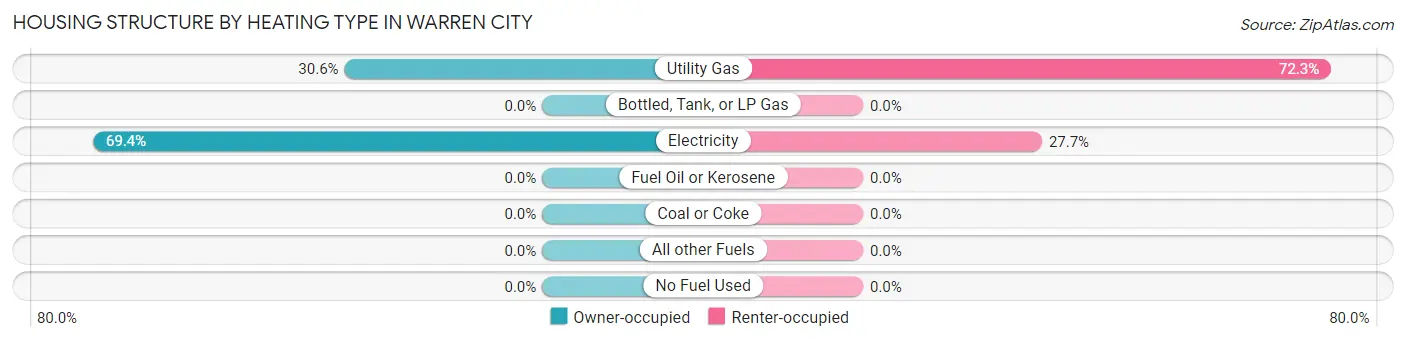
| Heating Type | Owner-occupied | Renter-occupied |
| Utility Gas | 33 (30.6%) | 34 (72.3%) |
| Bottled, Tank, or LP Gas | 0 (0.0%) | 0 (0.0%) |
| Electricity | 75 (69.4%) | 13 (27.7%) |
| Fuel Oil or Kerosene | 0 (0.0%) | 0 (0.0%) |
| Coal or Coke | 0 (0.0%) | 0 (0.0%) |
| All other Fuels | 0 (0.0%) | 0 (0.0%) |
| No Fuel Used | 0 (0.0%) | 0 (0.0%) |
| Total | 108 (100.0%) | 47 (100.0%) |
Household Vehicle Usage in Warren City
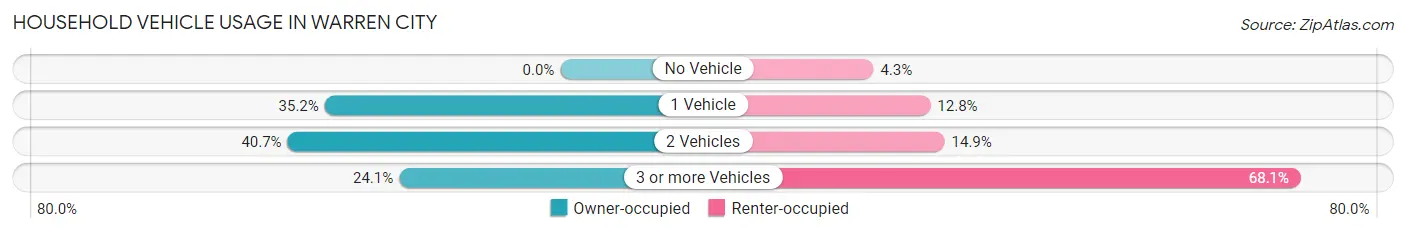
| Vehicles per Household | Owner-occupied | Renter-occupied |
| No Vehicle | 0 (0.0%) | 2 (4.3%) |
| 1 Vehicle | 38 (35.2%) | 6 (12.8%) |
| 2 Vehicles | 44 (40.7%) | 7 (14.9%) |
| 3 or more Vehicles | 26 (24.1%) | 32 (68.1%) |
| Total | 108 (100.0%) | 47 (100.0%) |
Real Estate & Mortgages in Warren City
Real Estate and Mortgage Overview in Warren City
| Characteristic | Without Mortgage | With Mortgage |
| Housing Units | 56 | 52 |
| Median Property Value | $95,000 | $157,800 |
| Median Household Income | - | - |
| Monthly Housing Costs | $500 | $0 |
| Real Estate Taxes | $1,750 | $2 |
Property Value by Mortgage Status in Warren City
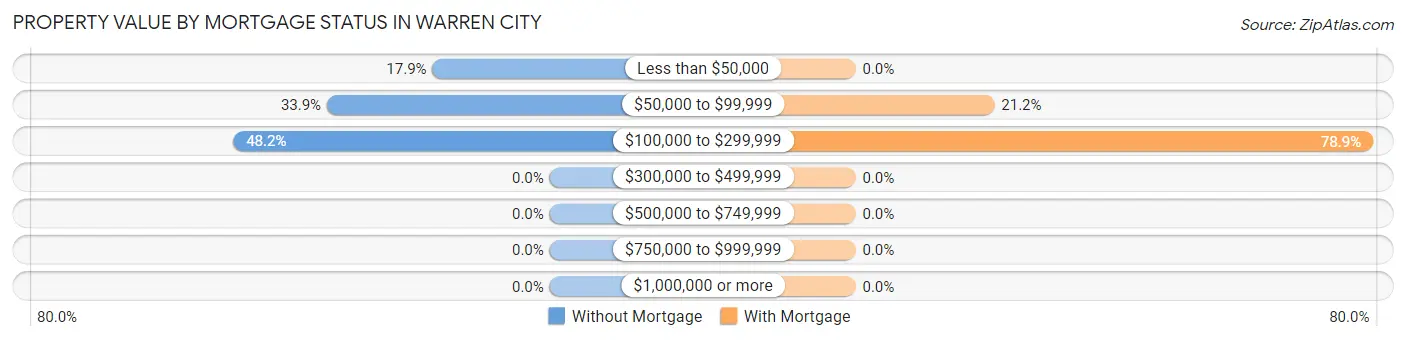
| Property Value | Without Mortgage | With Mortgage |
| Less than $50,000 | 10 (17.9%) | 0 (0.0%) |
| $50,000 to $99,999 | 19 (33.9%) | 11 (21.1%) |
| $100,000 to $299,999 | 27 (48.2%) | 41 (78.8%) |
| $300,000 to $499,999 | 0 (0.0%) | 0 (0.0%) |
| $500,000 to $749,999 | 0 (0.0%) | 0 (0.0%) |
| $750,000 to $999,999 | 0 (0.0%) | 0 (0.0%) |
| $1,000,000 or more | 0 (0.0%) | 0 (0.0%) |
| Total | 56 (100.0%) | 52 (100.0%) |
Household Income by Mortgage Status in Warren City
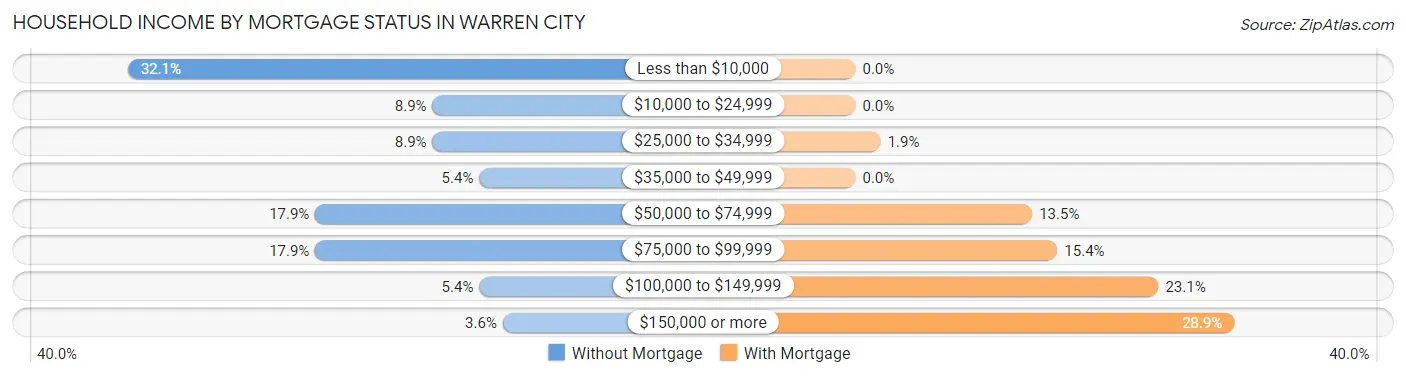
| Household Income | Without Mortgage | With Mortgage |
| Less than $10,000 | 18 (32.1%) | 0 (0.0%) |
| $10,000 to $24,999 | 5 (8.9%) | 0 (0.0%) |
| $25,000 to $34,999 | 5 (8.9%) | 1 (1.9%) |
| $35,000 to $49,999 | 3 (5.4%) | 0 (0.0%) |
| $50,000 to $74,999 | 10 (17.9%) | 7 (13.5%) |
| $75,000 to $99,999 | 10 (17.9%) | 8 (15.4%) |
| $100,000 to $149,999 | 3 (5.4%) | 12 (23.1%) |
| $150,000 or more | 2 (3.6%) | 15 (28.8%) |
| Total | 56 (100.0%) | 52 (100.0%) |
Property Value to Household Income Ratio in Warren City
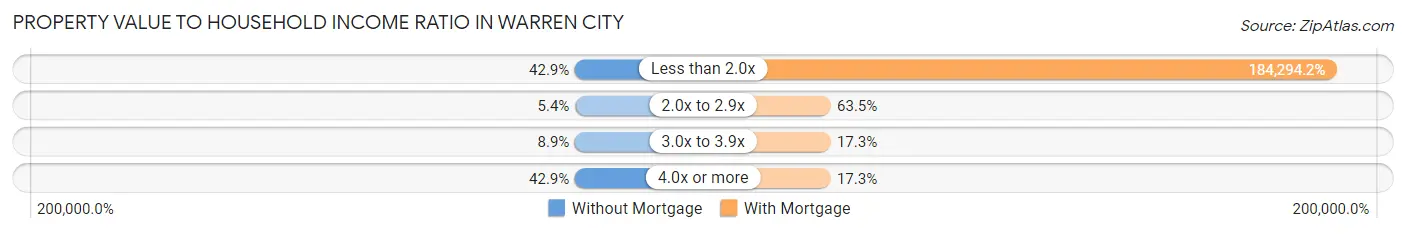
| Value-to-Income Ratio | Without Mortgage | With Mortgage |
| Less than 2.0x | 24 (42.9%) | 95,833 (184,294.2%) |
| 2.0x to 2.9x | 3 (5.4%) | 33 (63.5%) |
| 3.0x to 3.9x | 5 (8.9%) | 9 (17.3%) |
| 4.0x or more | 24 (42.9%) | 9 (17.3%) |
| Total | 56 (100.0%) | 52 (100.0%) |
Real Estate Taxes by Mortgage Status in Warren City
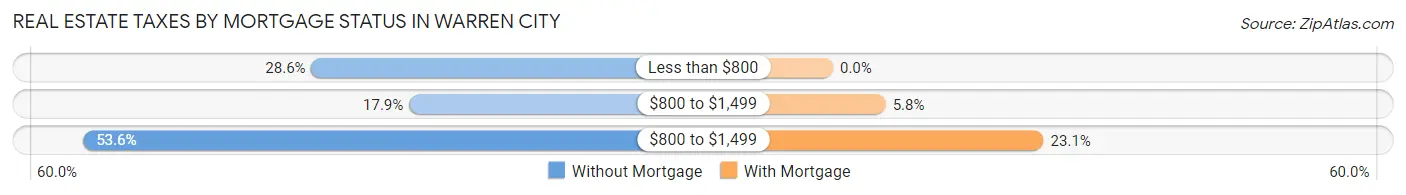
| Property Taxes | Without Mortgage | With Mortgage |
| Less than $800 | 16 (28.6%) | 0 (0.0%) |
| $800 to $1,499 | 10 (17.9%) | 3 (5.8%) |
| $800 to $1,499 | 30 (53.6%) | 12 (23.1%) |
| Total | 56 (100.0%) | 52 (100.0%) |
Health & Disability in Warren City
Health Insurance Coverage by Age in Warren City
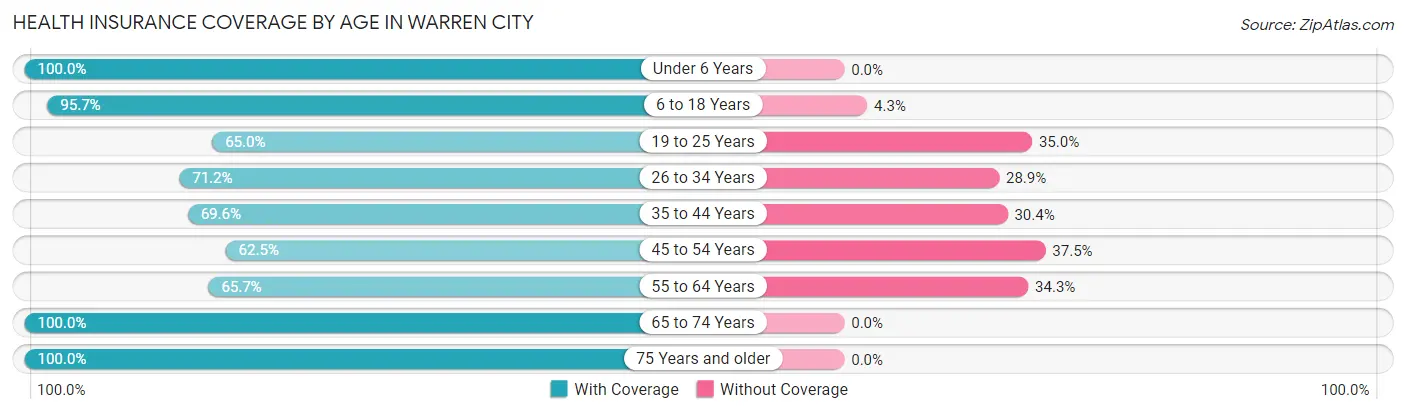
| Age Bracket | With Coverage | Without Coverage |
| Under 6 Years | 37 (100.0%) | 0 (0.0%) |
| 6 to 18 Years | 45 (95.7%) | 2 (4.3%) |
| 19 to 25 Years | 13 (65.0%) | 7 (35.0%) |
| 26 to 34 Years | 37 (71.2%) | 15 (28.8%) |
| 35 to 44 Years | 16 (69.6%) | 7 (30.4%) |
| 45 to 54 Years | 55 (62.5%) | 33 (37.5%) |
| 55 to 64 Years | 23 (65.7%) | 12 (34.3%) |
| 65 to 74 Years | 46 (100.0%) | 0 (0.0%) |
| 75 Years and older | 30 (100.0%) | 0 (0.0%) |
| Total | 302 (79.9%) | 76 (20.1%) |
Health Insurance Coverage by Citizenship Status in Warren City
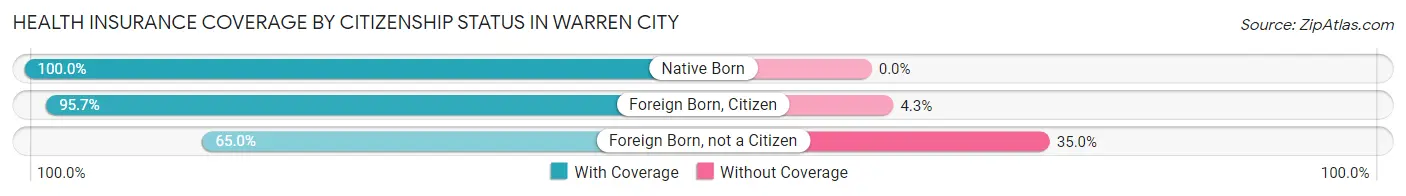
| Citizenship Status | With Coverage | Without Coverage |
| Native Born | 37 (100.0%) | 0 (0.0%) |
| Foreign Born, Citizen | 45 (95.7%) | 2 (4.3%) |
| Foreign Born, not a Citizen | 13 (65.0%) | 7 (35.0%) |
Health Insurance Coverage by Household Income in Warren City
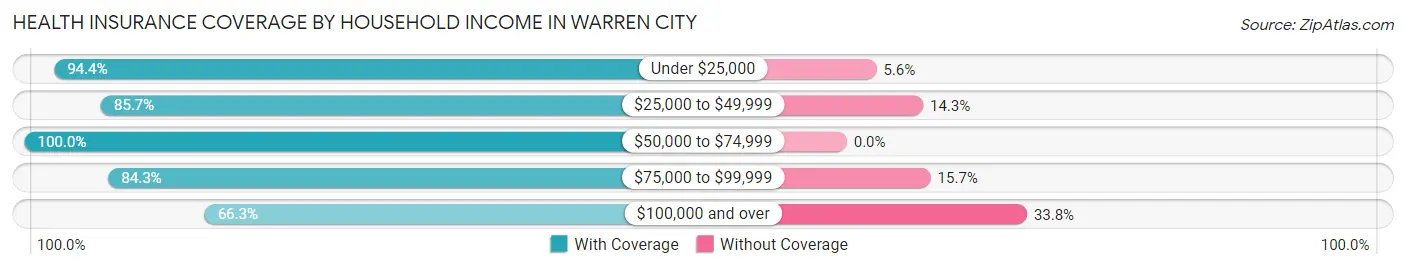
| Household Income | With Coverage | Without Coverage |
| Under $25,000 | 34 (94.4%) | 2 (5.6%) |
| $25,000 to $49,999 | 54 (85.7%) | 9 (14.3%) |
| $50,000 to $74,999 | 46 (100.0%) | 0 (0.0%) |
| $75,000 to $99,999 | 59 (84.3%) | 11 (15.7%) |
| $100,000 and over | 106 (66.2%) | 54 (33.8%) |
Public vs Private Health Insurance Coverage by Age in Warren City
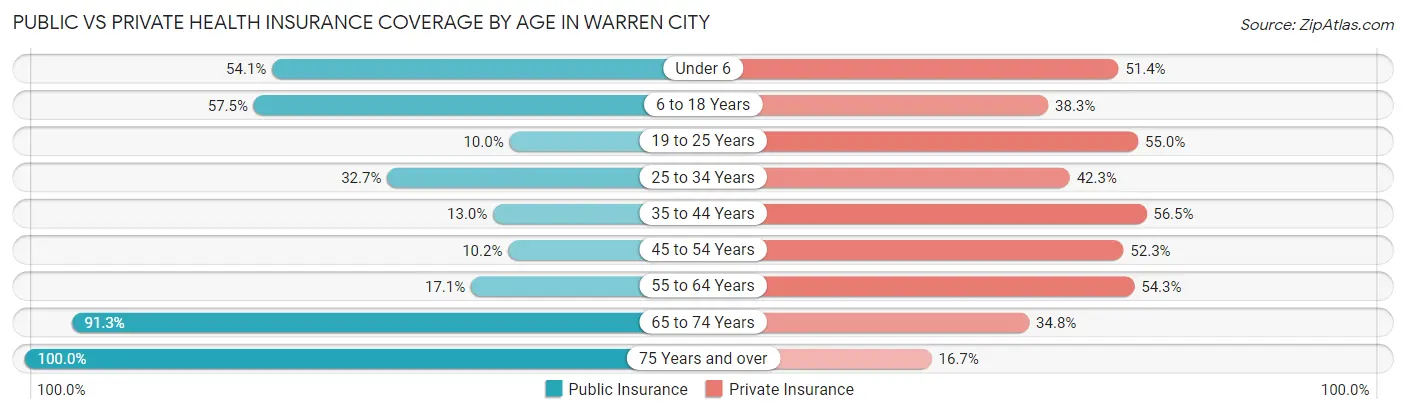
| Age Bracket | Public Insurance | Private Insurance |
| Under 6 | 20 (54.0%) | 19 (51.3%) |
| 6 to 18 Years | 27 (57.5%) | 18 (38.3%) |
| 19 to 25 Years | 2 (10.0%) | 11 (55.0%) |
| 25 to 34 Years | 17 (32.7%) | 22 (42.3%) |
| 35 to 44 Years | 3 (13.0%) | 13 (56.5%) |
| 45 to 54 Years | 9 (10.2%) | 46 (52.3%) |
| 55 to 64 Years | 6 (17.1%) | 19 (54.3%) |
| 65 to 74 Years | 42 (91.3%) | 16 (34.8%) |
| 75 Years and over | 30 (100.0%) | 5 (16.7%) |
| Total | 156 (41.3%) | 169 (44.7%) |
Disability Status by Sex by Age in Warren City
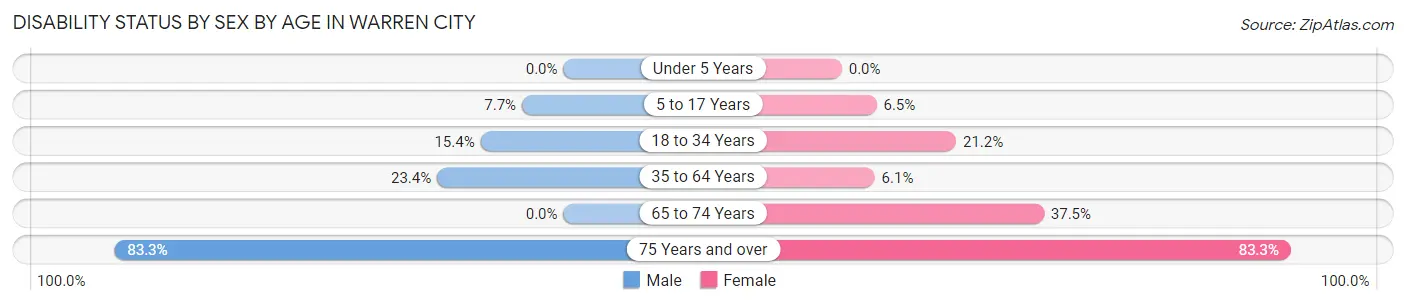
| Age Bracket | Male | Female |
| Under 5 Years | 0 (0.0%) | 0 (0.0%) |
| 5 to 17 Years | 2 (7.7%) | 2 (6.5%) |
| 18 to 34 Years | 6 (15.4%) | 7 (21.2%) |
| 35 to 64 Years | 15 (23.4%) | 5 (6.1%) |
| 65 to 74 Years | 0 (0.0%) | 9 (37.5%) |
| 75 Years and over | 15 (83.3%) | 10 (83.3%) |
Disability Class by Sex by Age in Warren City
Disability Class: Hearing Difficulty
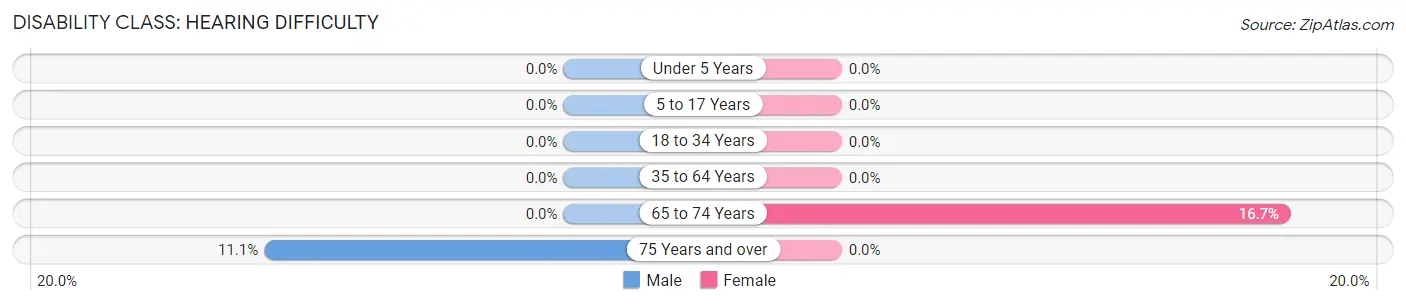
| Age Bracket | Male | Female |
| Under 5 Years | 0 (0.0%) | 0 (0.0%) |
| 5 to 17 Years | 0 (0.0%) | 0 (0.0%) |
| 18 to 34 Years | 0 (0.0%) | 0 (0.0%) |
| 35 to 64 Years | 0 (0.0%) | 0 (0.0%) |
| 65 to 74 Years | 0 (0.0%) | 4 (16.7%) |
| 75 Years and over | 2 (11.1%) | 0 (0.0%) |
Disability Class: Vision Difficulty
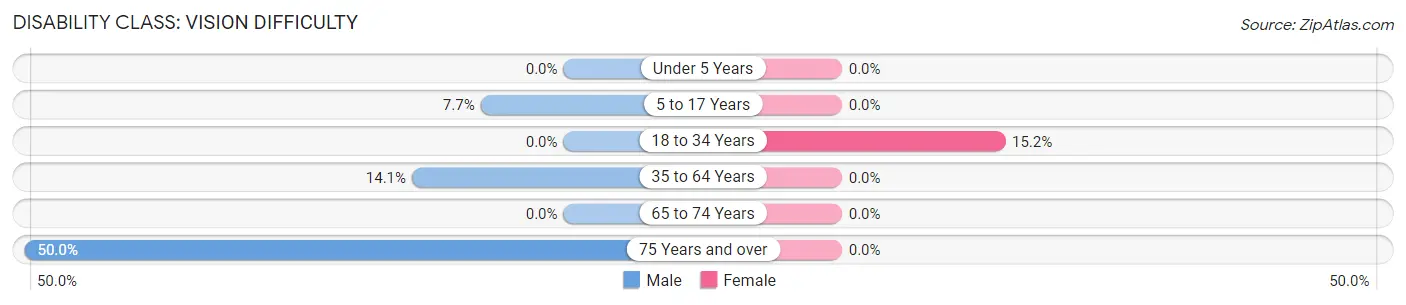
| Age Bracket | Male | Female |
| Under 5 Years | 0 (0.0%) | 0 (0.0%) |
| 5 to 17 Years | 2 (7.7%) | 0 (0.0%) |
| 18 to 34 Years | 0 (0.0%) | 5 (15.1%) |
| 35 to 64 Years | 9 (14.1%) | 0 (0.0%) |
| 65 to 74 Years | 0 (0.0%) | 0 (0.0%) |
| 75 Years and over | 9 (50.0%) | 0 (0.0%) |
Disability Class: Cognitive Difficulty
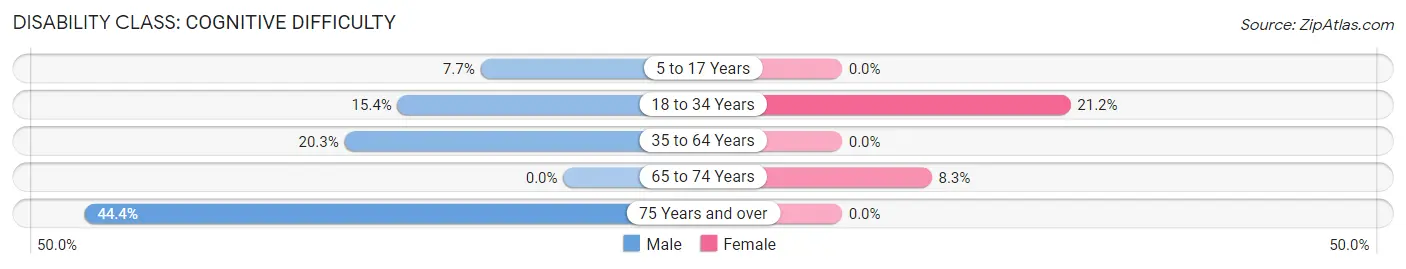
| Age Bracket | Male | Female |
| 5 to 17 Years | 2 (7.7%) | 0 (0.0%) |
| 18 to 34 Years | 6 (15.4%) | 7 (21.2%) |
| 35 to 64 Years | 13 (20.3%) | 0 (0.0%) |
| 65 to 74 Years | 0 (0.0%) | 2 (8.3%) |
| 75 Years and over | 8 (44.4%) | 0 (0.0%) |
Disability Class: Ambulatory Difficulty
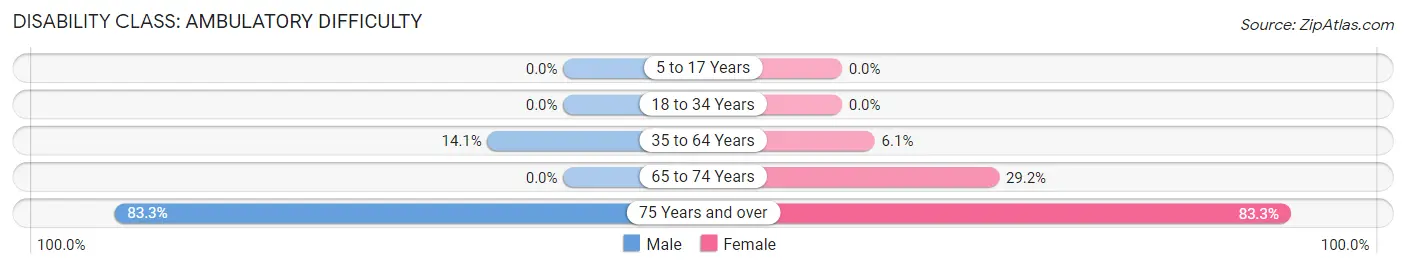
| Age Bracket | Male | Female |
| 5 to 17 Years | 0 (0.0%) | 0 (0.0%) |
| 18 to 34 Years | 0 (0.0%) | 0 (0.0%) |
| 35 to 64 Years | 9 (14.1%) | 5 (6.1%) |
| 65 to 74 Years | 0 (0.0%) | 7 (29.2%) |
| 75 Years and over | 15 (83.3%) | 10 (83.3%) |
Disability Class: Self-Care Difficulty
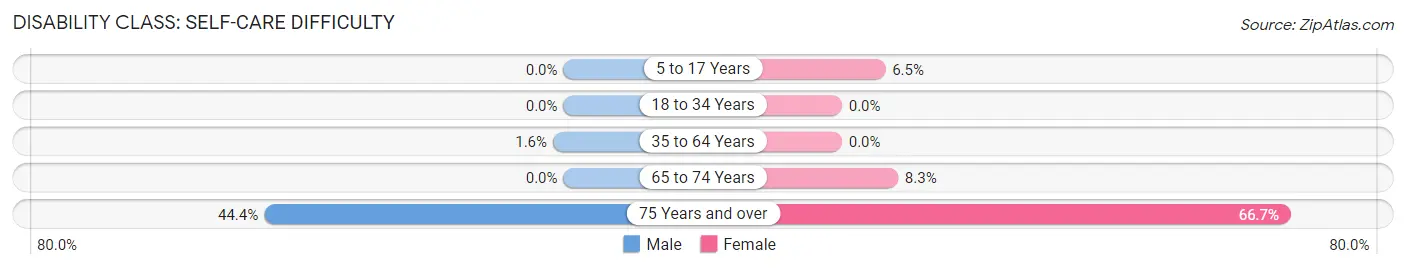
| Age Bracket | Male | Female |
| 5 to 17 Years | 0 (0.0%) | 2 (6.5%) |
| 18 to 34 Years | 0 (0.0%) | 0 (0.0%) |
| 35 to 64 Years | 1 (1.6%) | 0 (0.0%) |
| 65 to 74 Years | 0 (0.0%) | 2 (8.3%) |
| 75 Years and over | 8 (44.4%) | 8 (66.7%) |
Technology Access in Warren City
Computing Device Access in Warren City
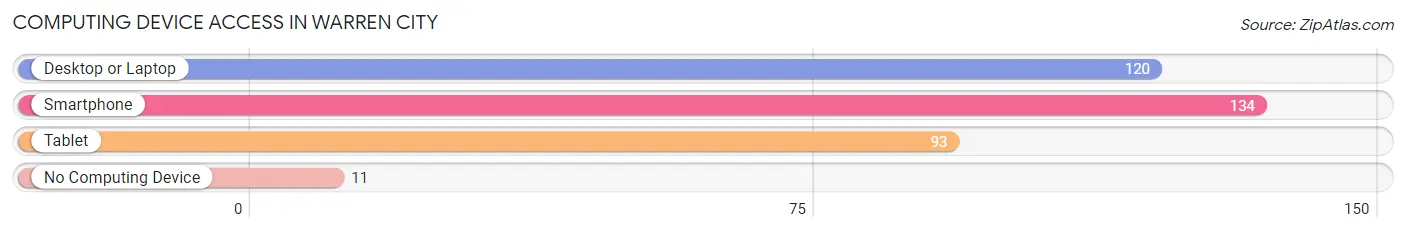
| Device Type | # Households | % Households |
| Desktop or Laptop | 120 | 77.4% |
| Smartphone | 134 | 86.5% |
| Tablet | 93 | 60.0% |
| No Computing Device | 11 | 7.1% |
| Total | 155 | 100.0% |
Internet Access in Warren City
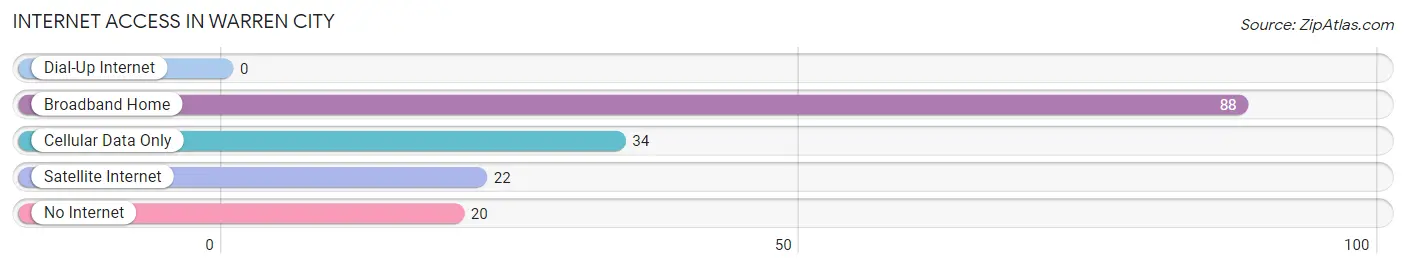
| Internet Type | # Households | % Households |
| Dial-Up Internet | 0 | 0.0% |
| Broadband Home | 88 | 56.8% |
| Cellular Data Only | 34 | 21.9% |
| Satellite Internet | 22 | 14.2% |
| No Internet | 20 | 12.9% |
| Total | 155 | 100.0% |
Warren City Summary
City of Warren Texas
The City of Warren, Texas is located in the southeastern corner of Texas in Tyler County. It is situated on the banks of the Neches River, approximately 25 miles from the Gulf of Mexico. The city is home to a population of approximately 1,000 people and is the county seat of Tyler County.
History
The City of Warren was founded in 1845 by a group of settlers from the United States. The settlers were led by William Warren, who was a veteran of the Texas Revolution. The town was named after him and was originally known as Warren’s Settlement. The town was officially incorporated in 1854 and was the first town in Tyler County.
In the late 1800s, the town began to grow and prosper due to the lumber industry. The town was home to several sawmills and lumber companies, which provided employment for many of the town’s residents. The town also had a thriving agricultural industry, which included cotton, corn, and other crops.
In the early 1900s, the town began to decline due to the decline of the lumber industry. The town’s population began to decline as well, and by the 1950s, the population had dropped to just over 500 people.
In the late 1970s, the town began to experience a resurgence due to the discovery of oil and gas in the area. This led to an influx of new residents and businesses, and the population began to grow again.
Geography
The City of Warren is located in the southeastern corner of Texas in Tyler County. It is situated on the banks of the Neches River, approximately 25 miles from the Gulf of Mexico. The city is located in a humid subtropical climate zone, with hot summers and mild winters. The average annual temperature is around 70 degrees Fahrenheit.
The city is surrounded by several small towns and communities, including Hillister, Spurger, and Fred. The nearest major city is Beaumont, which is located approximately 40 miles away.
Economy
The City of Warren has a diverse economy, with a variety of industries providing employment for its residents. The largest industry in the city is oil and gas, which accounts for approximately 40% of the city’s total employment. Other major industries include manufacturing, retail, and healthcare.
The city also has a thriving tourism industry, with several attractions, including the Tyler County Museum, the Warren Historical Museum, and the Neches River Wildlife Refuge.
Demographics
As of the 2010 census, the City of Warren had a population of 1,000 people. The racial makeup of the city was 79.2% White, 16.2% African American, 0.7% Native American, 0.7% Asian, and 3.2% from other races. The median household income was $31,250, and the median family income was $37,500.
The city is served by the Tyler County School District, which includes two elementary schools, one middle school, and one high school. The city also has several private schools, including Warren Christian Academy and Warren Academy.
Conclusion
The City of Warren, Texas is a small town located in the southeastern corner of Texas in Tyler County. It is situated on the banks of the Neches River, approximately 25 miles from the Gulf of Mexico. The city is home to a population of approximately 1,000 people and is the county seat of Tyler County. The city has a diverse economy, with a variety of industries providing employment for its residents. The city also has a thriving tourism industry, with several attractions, including the Tyler County Museum, the Warren Historical Museum, and the Neches River Wildlife Refuge. The city is served by the Tyler County School District, which includes two elementary schools, one middle school, and one high school.
Common Questions
What is Per Capita Income in Warren City?
Per Capita income in Warren City is $31,154.
What is the Median Family Income in Warren City?
Median Family Income in Warren City is $109,219.
What is the Median Household income in Warren City?
Median Household Income in Warren City is $78,958.
What is Income or Wage Gap in Warren City?
Income or Wage Gap in Warren City is 50.5%.
Women in Warren City earn 49.5 cents for every dollar earned by a man.
What is Inequality or Gini Index in Warren City?
Inequality or Gini Index in Warren City is 0.38.
What is the Total Population of Warren City?
Total Population of Warren City is 378.
What is the Total Male Population of Warren City?
Total Male Population of Warren City is 184.
What is the Total Female Population of Warren City?
Total Female Population of Warren City is 194.
What is the Ratio of Males per 100 Females in Warren City?
There are 94.85 Males per 100 Females in Warren City.
What is the Ratio of Females per 100 Males in Warren City?
There are 105.43 Females per 100 Males in Warren City.
What is the Median Population Age in Warren City?
Median Population Age in Warren City is 49.0 Years.
What is the Average Family Size in Warren City
Average Family Size in Warren City is 2.9 People.
What is the Average Household Size in Warren City
Average Household Size in Warren City is 2.4 People.
How Large is the Labor Force in Warren City?
There are 199 People in the Labor Forcein in Warren City.
What is the Percentage of People in the Labor Force in Warren City?
67.0% of People are in the Labor Force in Warren City.
What is the Unemployment Rate in Warren City?
Unemployment Rate in Warren City is 5.5%.