Reno city Lamar County, TX Map & Demographics
Reno city Lamar County Overview
$29,803
PER CAPITA INCOME
$88,219
AVG FAMILY INCOME
$62,284
AVG HOUSEHOLD INCOME
62.7%
WAGE / INCOME GAP [ % ]
37.3¢/ $1
WAGE / INCOME GAP [ $ ]
0.42
INEQUALITY / GINI INDEX
3,449
TOTAL POPULATION
1,819
MALE POPULATION
1,630
FEMALE POPULATION
111.60
MALES / 100 FEMALES
89.61
FEMALES / 100 MALES
36.0
MEDIAN AGE
3.2
AVG FAMILY SIZE
2.6
AVG HOUSEHOLD SIZE
1,608
LABOR FORCE [ PEOPLE ]
64.7%
PERCENT IN LABOR FORCE
8.7%
UNEMPLOYMENT RATE
Income in Reno city Lamar County
Income Overview in Reno city Lamar County
Per Capita Income in Reno city Lamar County is $29,803, while median incomes of families and households are $88,219 and $62,284 respectively.
| Characteristic | Number | Measure |
| Per Capita Income | 3,449 | $29,803 |
| Median Family Income | 986 | $88,219 |
| Mean Family Income | 986 | $90,805 |
| Median Household Income | 1,304 | $62,284 |
| Mean Household Income | 1,304 | $77,097 |
| Income Deficit | 986 | $0 |
| Wage / Income Gap (%) | 3,449 | 62.74% |
| Wage / Income Gap ($) | 3,449 | 37.26¢ per $1 |
| Gini / Inequality Index | 3,449 | 0.42 |
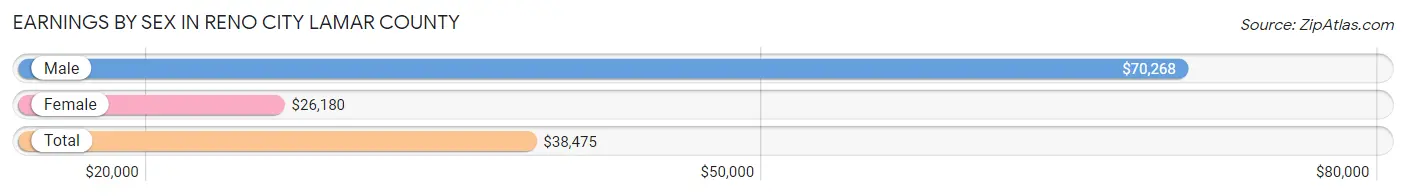
Earnings by Sex in Reno city Lamar County
Average Earnings in Reno city Lamar County are $38,475, $70,268 for men and $26,180 for women, a difference of 62.7%.
| Sex | Number | Average Earnings |
| Male | 803 (46.4%) | $70,268 |
| Female | 926 (53.6%) | $26,180 |
| Total | 1,729 (100.0%) | $38,475 |
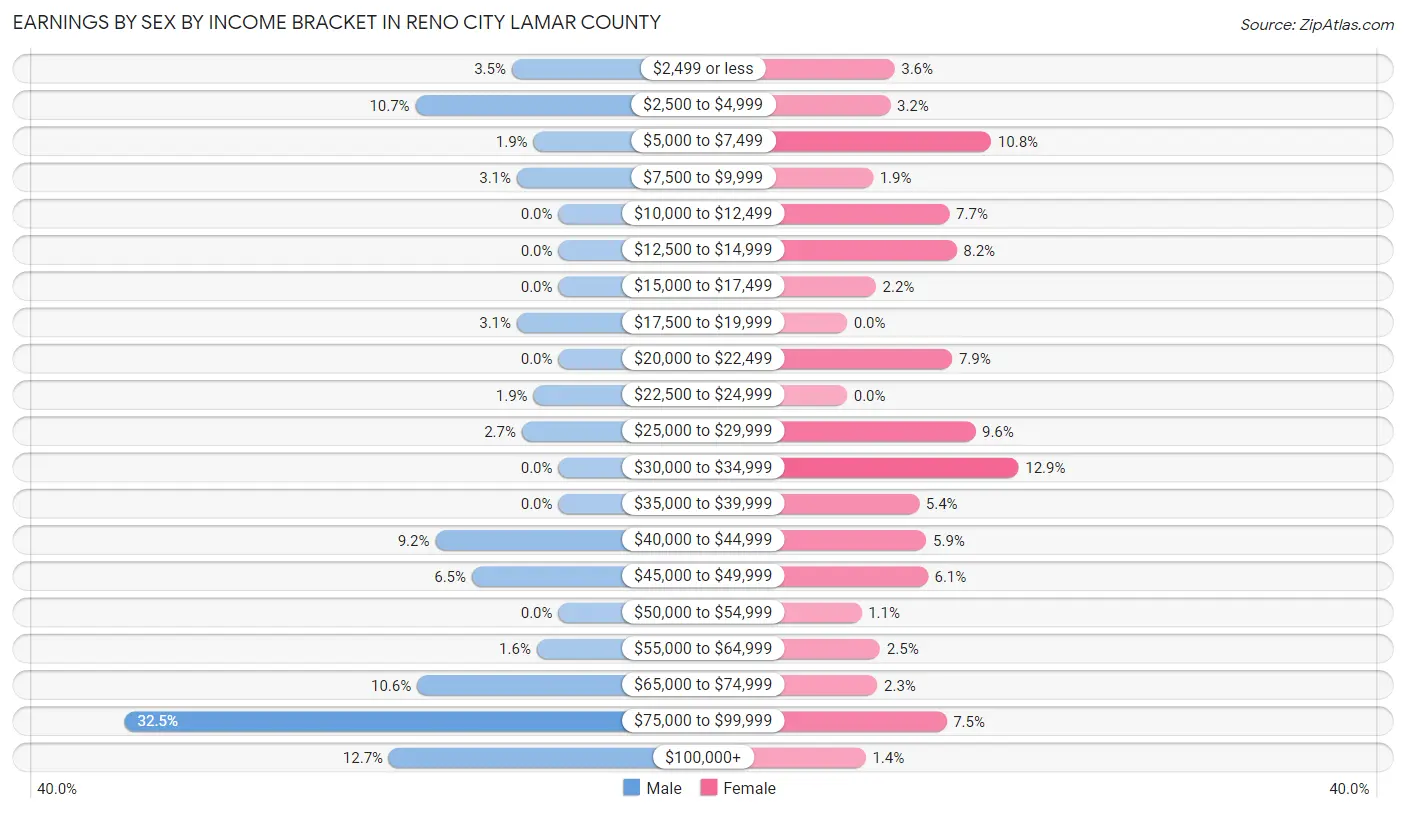
Earnings by Sex by Income Bracket in Reno city Lamar County
The most common earnings brackets in Reno city Lamar County are $75,000 to $99,999 for men (261 | 32.5%) and $30,000 to $34,999 for women (119 | 12.9%).
| Income | Male | Female |
| $2,499 or less | 28 (3.5%) | 33 (3.6%) |
| $2,500 to $4,999 | 86 (10.7%) | 30 (3.2%) |
| $5,000 to $7,499 | 15 (1.9%) | 100 (10.8%) |
| $7,500 to $9,999 | 25 (3.1%) | 18 (1.9%) |
| $10,000 to $12,499 | 0 (0.0%) | 71 (7.7%) |
| $12,500 to $14,999 | 0 (0.0%) | 76 (8.2%) |
| $15,000 to $17,499 | 0 (0.0%) | 20 (2.2%) |
| $17,500 to $19,999 | 25 (3.1%) | 0 (0.0%) |
| $20,000 to $22,499 | 0 (0.0%) | 73 (7.9%) |
| $22,500 to $24,999 | 15 (1.9%) | 0 (0.0%) |
| $25,000 to $29,999 | 22 (2.7%) | 89 (9.6%) |
| $30,000 to $34,999 | 0 (0.0%) | 119 (12.9%) |
| $35,000 to $39,999 | 0 (0.0%) | 50 (5.4%) |
| $40,000 to $44,999 | 74 (9.2%) | 55 (5.9%) |
| $45,000 to $49,999 | 52 (6.5%) | 56 (6.0%) |
| $50,000 to $54,999 | 0 (0.0%) | 10 (1.1%) |
| $55,000 to $64,999 | 13 (1.6%) | 23 (2.5%) |
| $65,000 to $74,999 | 85 (10.6%) | 21 (2.3%) |
| $75,000 to $99,999 | 261 (32.5%) | 69 (7.4%) |
| $100,000+ | 102 (12.7%) | 13 (1.4%) |
| Total | 803 (100.0%) | 926 (100.0%) |
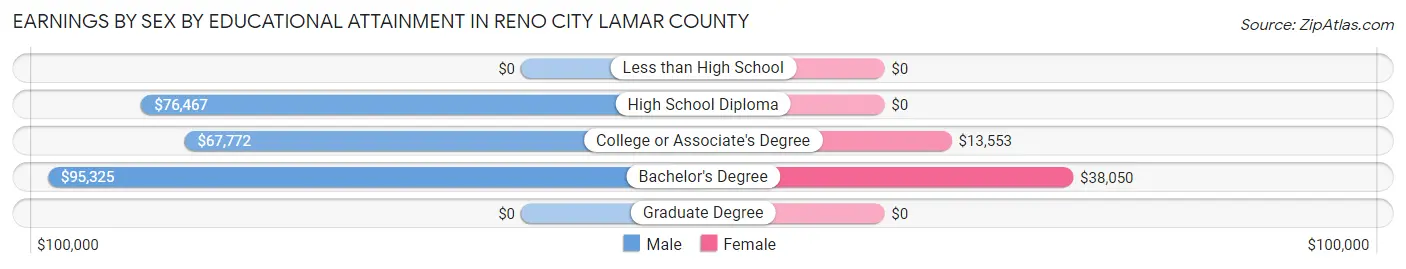
Earnings by Sex by Educational Attainment in Reno city Lamar County
Average earnings in Reno city Lamar County are $72,837 for men and $22,175 for women, a difference of 69.6%. Men with an educational attainment of bachelor's degree enjoy the highest average annual earnings of $95,325, while those with college or associate's degree education earn the least with $67,772. Women with an educational attainment of bachelor's degree earn the most with the average annual earnings of $38,050, while those with college or associate's degree education have the smallest earnings of $13,553.
| Educational Attainment | Male Income | Female Income |
| Less than High School | - | - |
| High School Diploma | $76,467 | $0 |
| College or Associate's Degree | $67,772 | $13,553 |
| Bachelor's Degree | $95,325 | $38,050 |
| Graduate Degree | - | - |
| Total | $72,837 | $22,175 |
Family Income in Reno city Lamar County
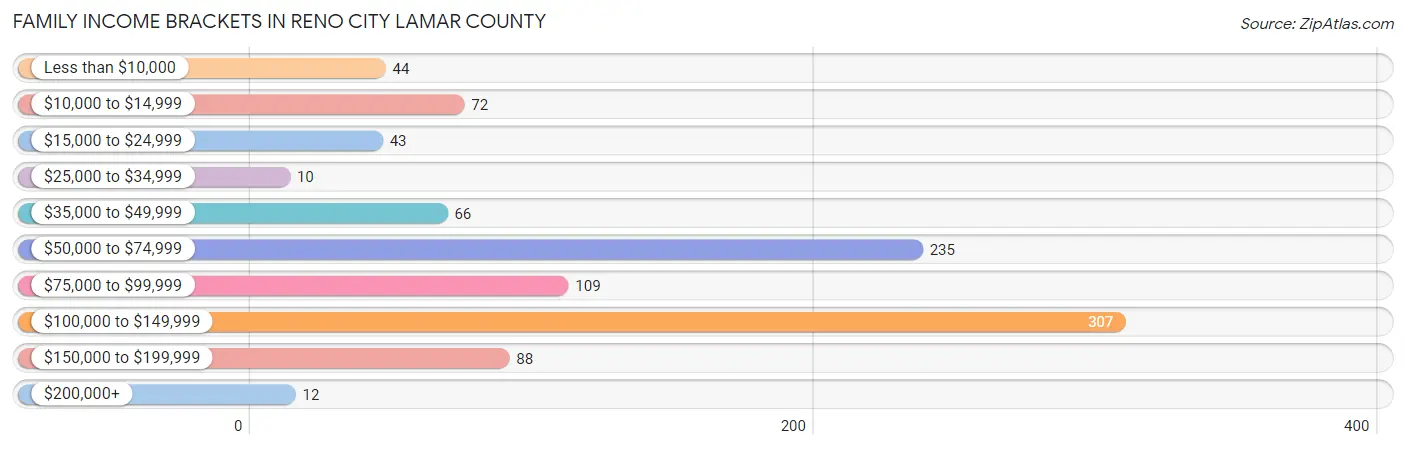
Family Income Brackets in Reno city Lamar County
According to the Reno city Lamar County family income data, there are 307 families falling into the $100,000 to $149,999 income range, which is the most common income bracket and makes up 31.1% of all families. Conversely, the $25,000 to $34,999 income bracket is the least frequent group with only 10 families (1.0%) belonging to this category.
| Income Bracket | # Families | % Families |
| Less than $10,000 | 44 | 4.5% |
| $10,000 to $14,999 | 72 | 7.3% |
| $15,000 to $24,999 | 43 | 4.4% |
| $25,000 to $34,999 | 10 | 1.0% |
| $35,000 to $49,999 | 66 | 6.7% |
| $50,000 to $74,999 | 235 | 23.8% |
| $75,000 to $99,999 | 109 | 11.1% |
| $100,000 to $149,999 | 307 | 31.1% |
| $150,000 to $199,999 | 88 | 8.9% |
| $200,000+ | 12 | 1.2% |
Family Income by Famaliy Size in Reno city Lamar County
5-person families (126 | 12.8%) account for the highest median family income in Reno city Lamar County with $135,788 per family, while 2-person families (474 | 48.1%) have the highest median income of $30,639 per family member.
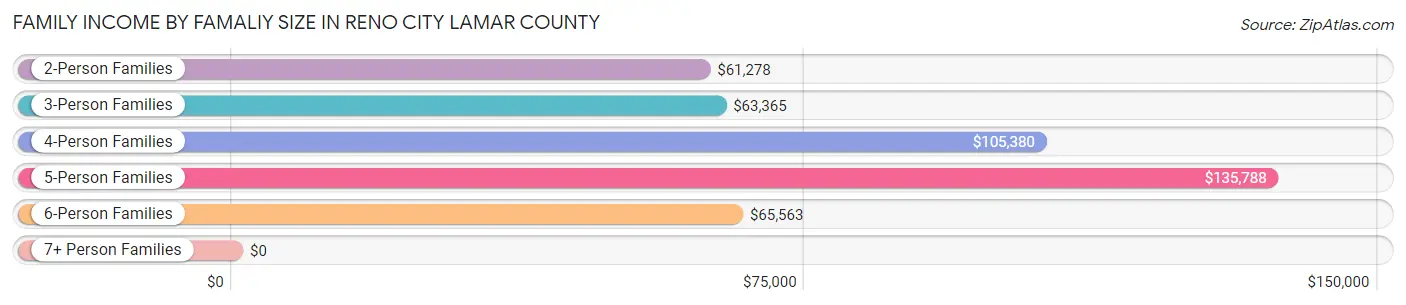
| Income Bracket | # Families | Median Income |
| 2-Person Families | 474 (48.1%) | $61,278 |
| 3-Person Families | 155 (15.7%) | $63,365 |
| 4-Person Families | 149 (15.1%) | $105,380 |
| 5-Person Families | 126 (12.8%) | $135,788 |
| 6-Person Families | 63 (6.4%) | $65,563 |
| 7+ Person Families | 19 (1.9%) | $0 |
| Total | 986 (100.0%) | $88,219 |
Family Income by Number of Earners in Reno city Lamar County
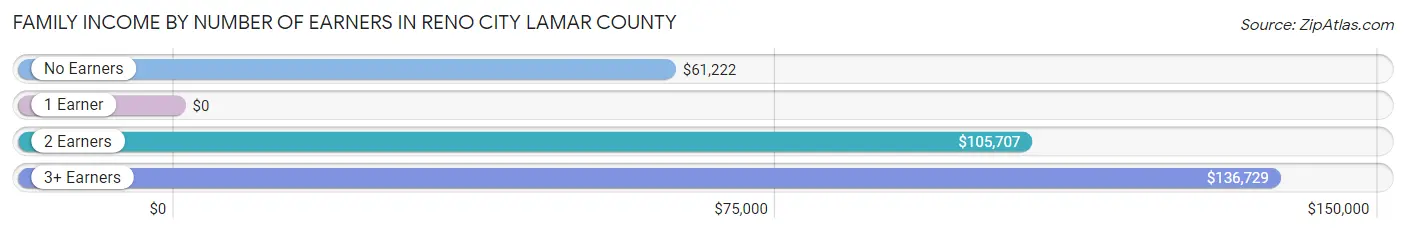
| Number of Earners | # Families | Median Income |
| No Earners | 108 (11.0%) | $61,222 |
| 1 Earner | 302 (30.6%) | $0 |
| 2 Earners | 429 (43.5%) | $105,707 |
| 3+ Earners | 147 (14.9%) | $136,729 |
| Total | 986 (100.0%) | $88,219 |
Household Income in Reno city Lamar County
Household Income Brackets in Reno city Lamar County
With 306 households falling in the category, the $100,000 to $149,999 income range is the most frequent in Reno city Lamar County, accounting for 23.5% of all households. In contrast, only 12 households (0.9%) fall into the $200,000+ income bracket, making it the least populous group.
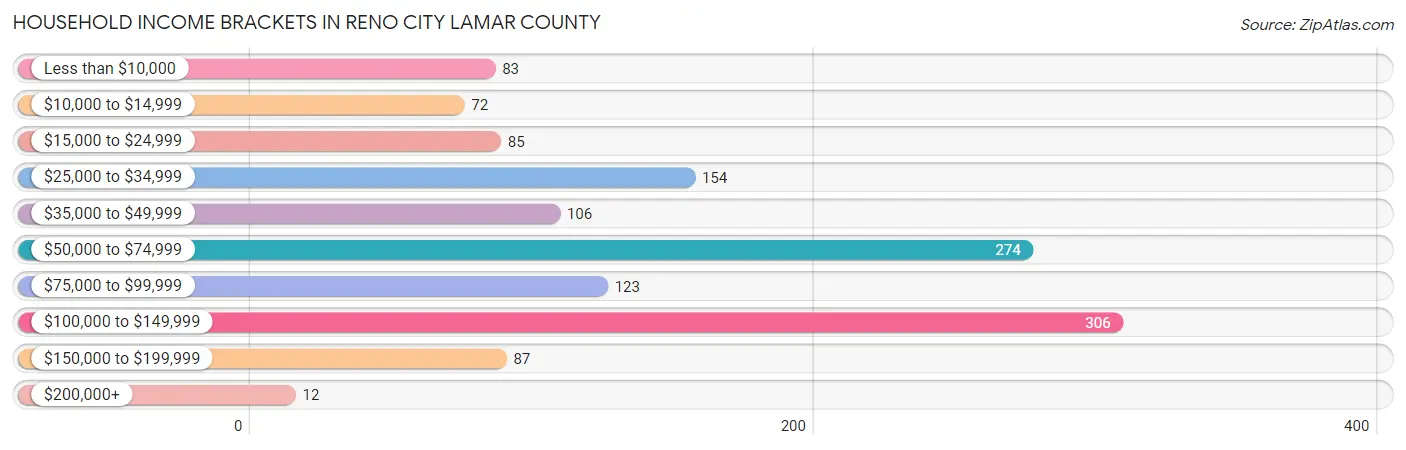
| Income Bracket | # Households | % Households |
| Less than $10,000 | 83 | 6.4% |
| $10,000 to $14,999 | 72 | 5.5% |
| $15,000 to $24,999 | 85 | 6.5% |
| $25,000 to $34,999 | 154 | 11.8% |
| $35,000 to $49,999 | 106 | 8.1% |
| $50,000 to $74,999 | 274 | 21.0% |
| $75,000 to $99,999 | 123 | 9.4% |
| $100,000 to $149,999 | 306 | 23.5% |
| $150,000 to $199,999 | 87 | 6.7% |
| $200,000+ | 12 | 0.9% |
Household Income by Householder Age in Reno city Lamar County
The median household income in Reno city Lamar County is $62,284, with the highest median household income of $100,707 found in the 25 to 44 years age bracket for the primary householder. A total of 499 households (38.3%) fall into this category.
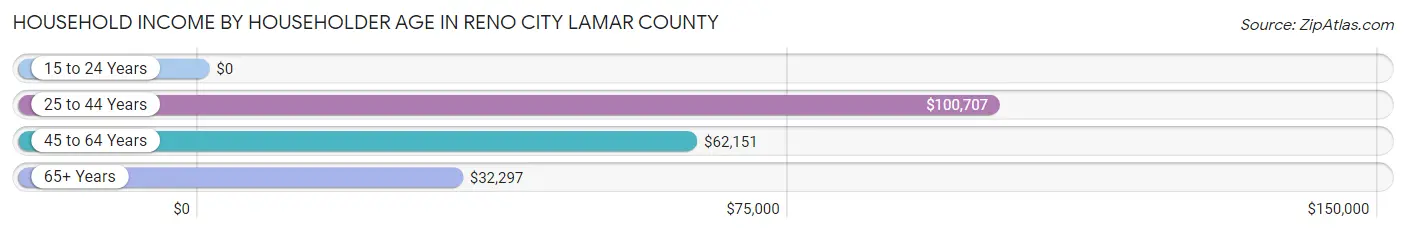
| Income Bracket | # Households | Median Income |
| 15 to 24 Years | 0 (0.0%) | $0 |
| 25 to 44 Years | 499 (38.3%) | $100,707 |
| 45 to 64 Years | 415 (31.8%) | $62,151 |
| 65+ Years | 390 (29.9%) | $32,297 |
| Total | 1,304 (100.0%) | $62,284 |
Poverty in Reno city Lamar County
Income Below Poverty by Sex and Age in Reno city Lamar County
With 5.7% poverty level for males and 12.1% for females among the residents of Reno city Lamar County, 16 and 17 year old males and 6 to 11 year old females are the most vulnerable to poverty, with 69 males (48.9%) and 36 females (34.0%) in their respective age groups living below the poverty level.
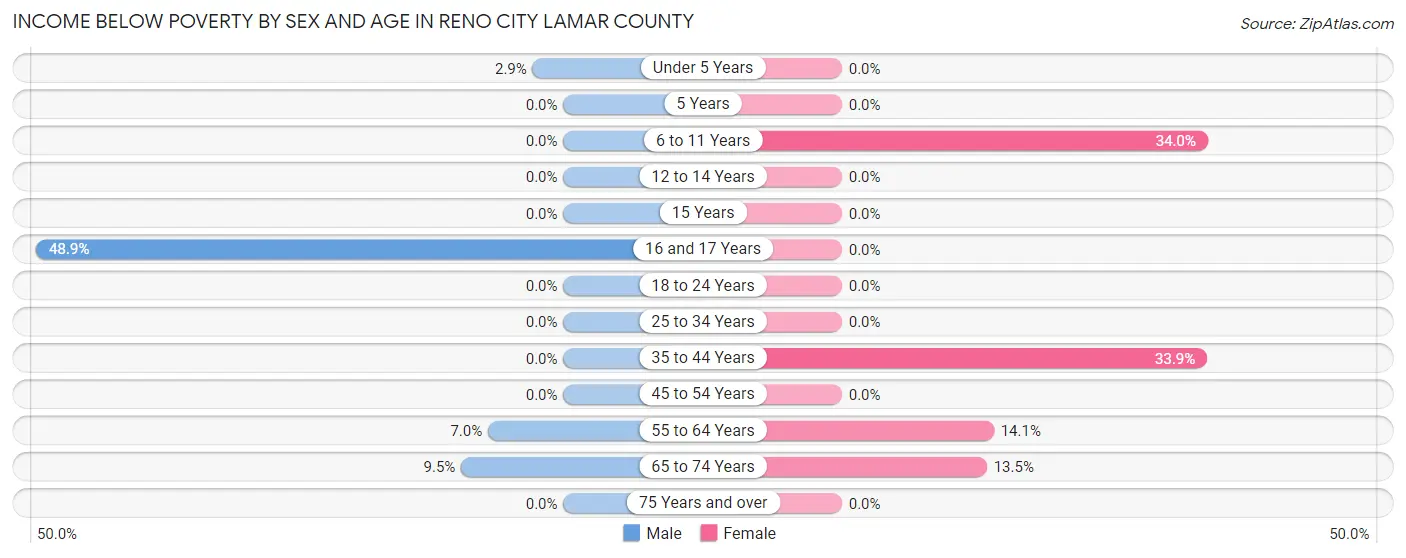
| Age Bracket | Male | Female |
| Under 5 Years | 8 (2.9%) | 0 (0.0%) |
| 5 Years | 0 (0.0%) | 0 (0.0%) |
| 6 to 11 Years | 0 (0.0%) | 36 (34.0%) |
| 12 to 14 Years | 0 (0.0%) | 0 (0.0%) |
| 15 Years | 0 (0.0%) | 0 (0.0%) |
| 16 and 17 Years | 69 (48.9%) | 0 (0.0%) |
| 18 to 24 Years | 0 (0.0%) | 0 (0.0%) |
| 25 to 34 Years | 0 (0.0%) | 0 (0.0%) |
| 35 to 44 Years | 0 (0.0%) | 100 (33.9%) |
| 45 to 54 Years | 0 (0.0%) | 0 (0.0%) |
| 55 to 64 Years | 16 (7.0%) | 32 (14.1%) |
| 65 to 74 Years | 11 (9.5%) | 30 (13.5%) |
| 75 Years and over | 0 (0.0%) | 0 (0.0%) |
| Total | 104 (5.7%) | 198 (12.1%) |
Income Above Poverty by Sex and Age in Reno city Lamar County
According to the poverty statistics in Reno city Lamar County, males aged 6 to 11 years and females aged under 5 years are the age groups that are most secure financially, with 100.0% of males and 100.0% of females in these age groups living above the poverty line.
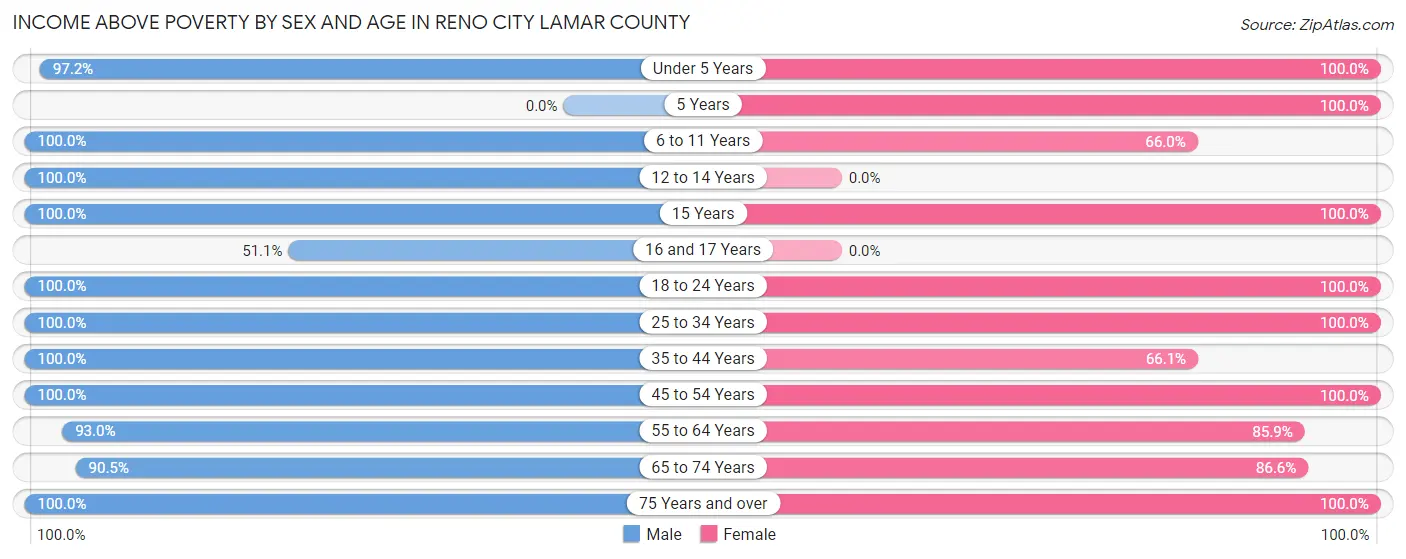
| Age Bracket | Male | Female |
| Under 5 Years | 273 (97.2%) | 93 (100.0%) |
| 5 Years | 0 (0.0%) | 93 (100.0%) |
| 6 to 11 Years | 160 (100.0%) | 70 (66.0%) |
| 12 to 14 Years | 179 (100.0%) | 0 (0.0%) |
| 15 Years | 23 (100.0%) | 29 (100.0%) |
| 16 and 17 Years | 72 (51.1%) | 0 (0.0%) |
| 18 to 24 Years | 60 (100.0%) | 103 (100.0%) |
| 25 to 34 Years | 143 (100.0%) | 227 (100.0%) |
| 35 to 44 Years | 320 (100.0%) | 195 (66.1%) |
| 45 to 54 Years | 102 (100.0%) | 140 (100.0%) |
| 55 to 64 Years | 213 (93.0%) | 195 (85.9%) |
| 65 to 74 Years | 105 (90.5%) | 193 (86.6%) |
| 75 Years and over | 65 (100.0%) | 94 (100.0%) |
| Total | 1,715 (94.3%) | 1,432 (87.8%) |
Income Below Poverty Among Married-Couple Families in Reno city Lamar County
The poverty statistics for married-couple families in Reno city Lamar County show that 3.9% or 27 of the total 699 families live below the poverty line. Families with no children have the highest poverty rate of 8.1%, comprising of 27 families. On the other hand, families with 1 or 2 children have the lowest poverty rate of 0.0%, which includes 0 families.
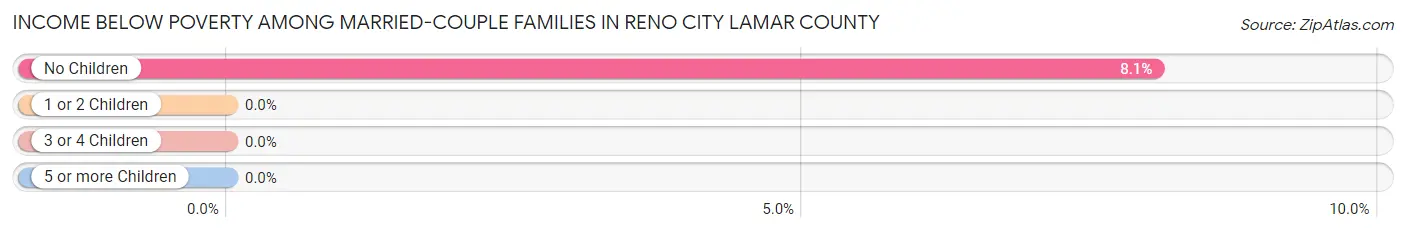
| Children | Above Poverty | Below Poverty |
| No Children | 308 (91.9%) | 27 (8.1%) |
| 1 or 2 Children | 281 (100.0%) | 0 (0.0%) |
| 3 or 4 Children | 83 (100.0%) | 0 (0.0%) |
| 5 or more Children | 0 (0.0%) | 0 (0.0%) |
| Total | 672 (96.1%) | 27 (3.9%) |
Income Below Poverty Among Single-Parent Households in Reno city Lamar County
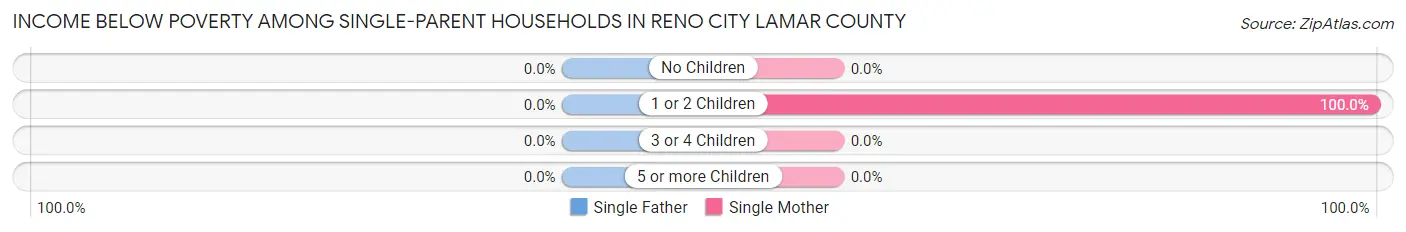
| Children | Single Father | Single Mother |
| No Children | 0 (0.0%) | 0 (0.0%) |
| 1 or 2 Children | 0 (0.0%) | 100 (100.0%) |
| 3 or 4 Children | 0 (0.0%) | 0 (0.0%) |
| 5 or more Children | 0 (0.0%) | 0 (0.0%) |
| Total | 0 (0.0%) | 100 (56.2%) |
Income Below Poverty Among Married-Couple vs Single-Parent Households in Reno city Lamar County
The poverty data for Reno city Lamar County shows that 27 of the married-couple family households (3.9%) and 100 of the single-parent households (34.8%) are living below the poverty level. Within the married-couple family households, those with no children have the highest poverty rate, with 27 households (8.1%) falling below the poverty line. Among the single-parent households, those with 1 or 2 children have the highest poverty rate, with 100 household (53.2%) living below poverty.
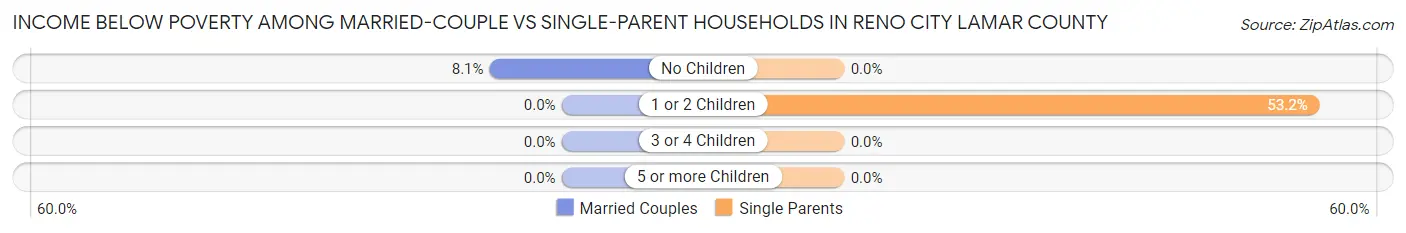
| Children | Married-Couple Families | Single-Parent Households |
| No Children | 27 (8.1%) | 0 (0.0%) |
| 1 or 2 Children | 0 (0.0%) | 100 (53.2%) |
| 3 or 4 Children | 0 (0.0%) | 0 (0.0%) |
| 5 or more Children | 0 (0.0%) | 0 (0.0%) |
| Total | 27 (3.9%) | 100 (34.8%) |
Race in Reno city Lamar County
The most populous races in Reno city Lamar County are White / Caucasian (3,023 | 87.6%), Two or more Races (201 | 5.8%), and Black / African American (143 | 4.2%).
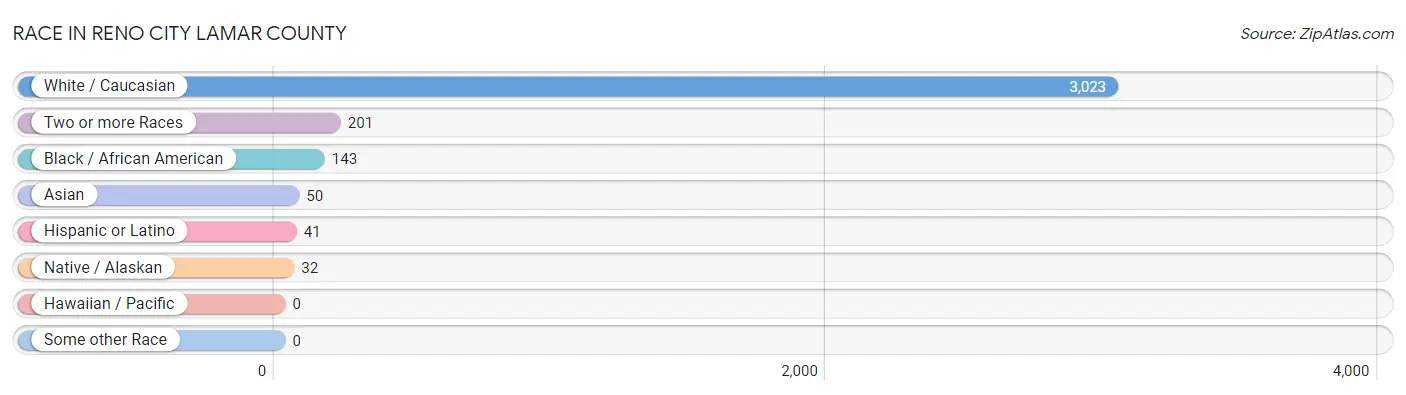
| Race | # Population | % Population |
| Asian | 50 | 1.5% |
| Black / African American | 143 | 4.2% |
| Hawaiian / Pacific | 0 | 0.0% |
| Hispanic or Latino | 41 | 1.2% |
| Native / Alaskan | 32 | 0.9% |
| White / Caucasian | 3,023 | 87.6% |
| Two or more Races | 201 | 5.8% |
| Some other Race | 0 | 0.0% |
| Total | 3,449 | 100.0% |
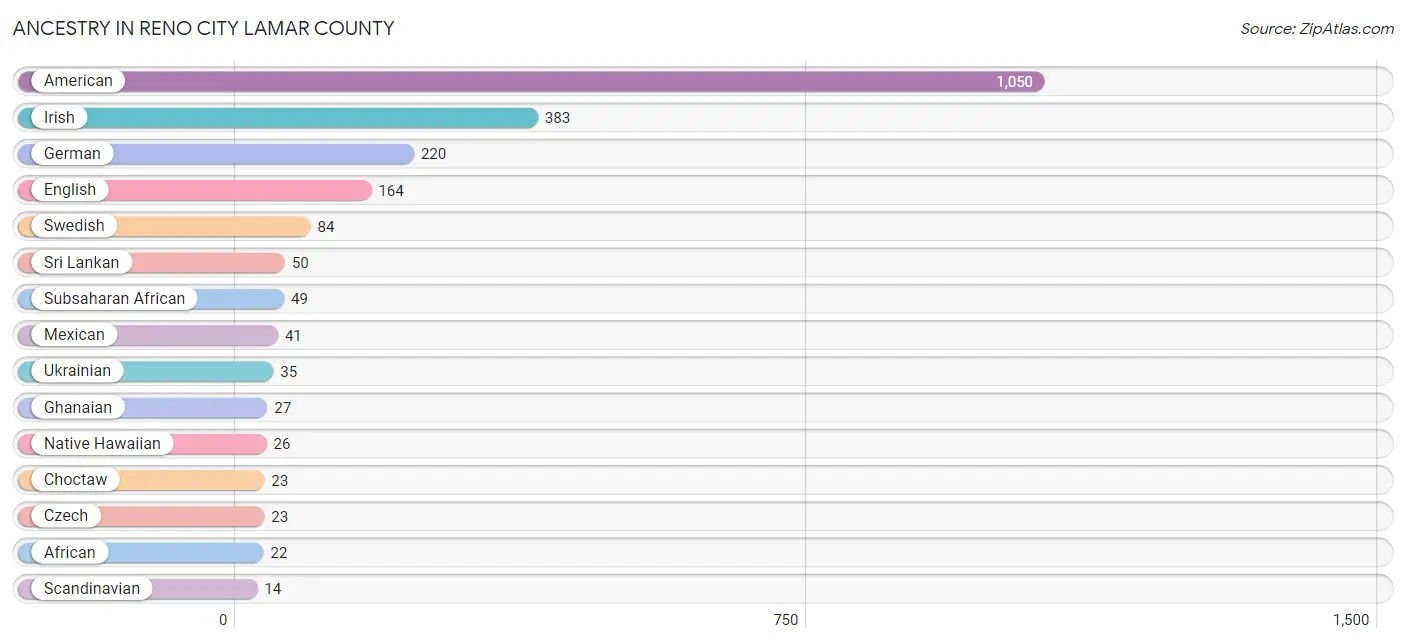
Ancestry in Reno city Lamar County
The most populous ancestries reported in Reno city Lamar County are American (1,050 | 30.4%), Irish (383 | 11.1%), German (220 | 6.4%), English (164 | 4.8%), and Swedish (84 | 2.4%), together accounting for 55.1% of all Reno city Lamar County residents.
| Ancestry | # Population | % Population |
| African | 22 | 0.6% |
| American | 1,050 | 30.4% |
| Cherokee | 9 | 0.3% |
| Choctaw | 23 | 0.7% |
| Czech | 23 | 0.7% |
| English | 164 | 4.8% |
| European | 11 | 0.3% |
| French | 10 | 0.3% |
| German | 220 | 6.4% |
| Ghanaian | 27 | 0.8% |
| Irish | 383 | 11.1% |
| Mexican | 41 | 1.2% |
| Native Hawaiian | 26 | 0.7% |
| Northern European | 12 | 0.4% |
| Polish | 10 | 0.3% |
| Scandinavian | 14 | 0.4% |
| Sri Lankan | 50 | 1.5% |
| Subsaharan African | 49 | 1.4% |
| Swedish | 84 | 2.4% |
| Ukrainian | 35 | 1.0% | View All 20 Rows |
Immigrants in Reno city Lamar County
The most numerous immigrant groups reported in Reno city Lamar County came from Africa (49 | 1.4%), Ghana (49 | 1.4%), Western Africa (49 | 1.4%), Asia (25 | 0.7%), and South Eastern Asia (25 | 0.7%), together accounting for 5.7% of all Reno city Lamar County residents.
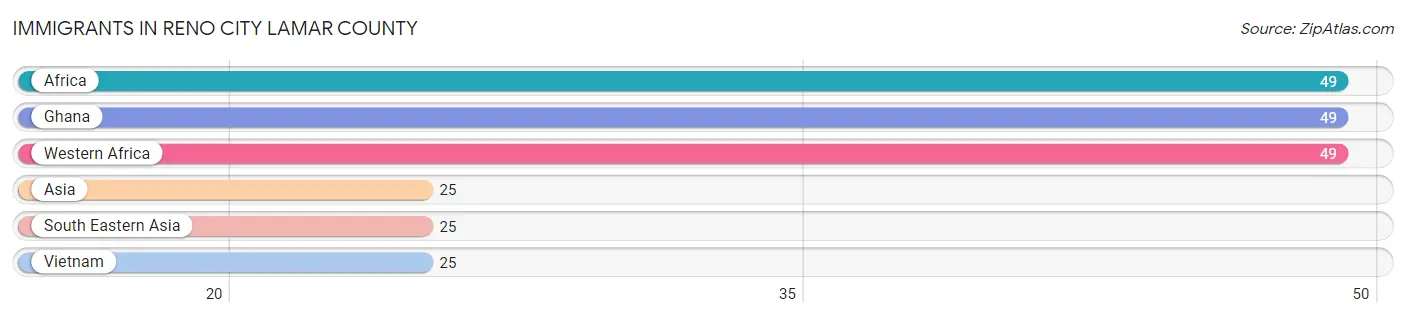
| Immigration Origin | # Population | % Population |
| Africa | 49 | 1.4% |
| Asia | 25 | 0.7% |
| Ghana | 49 | 1.4% |
| South Eastern Asia | 25 | 0.7% |
| Vietnam | 25 | 0.7% |
| Western Africa | 49 | 1.4% | View All 6 Rows |
Sex and Age in Reno city Lamar County
Sex and Age in Reno city Lamar County
The most populous age groups in Reno city Lamar County are Under 5 Years (281 | 15.4%) for men and 40 to 44 Years (279 | 17.1%) for women.
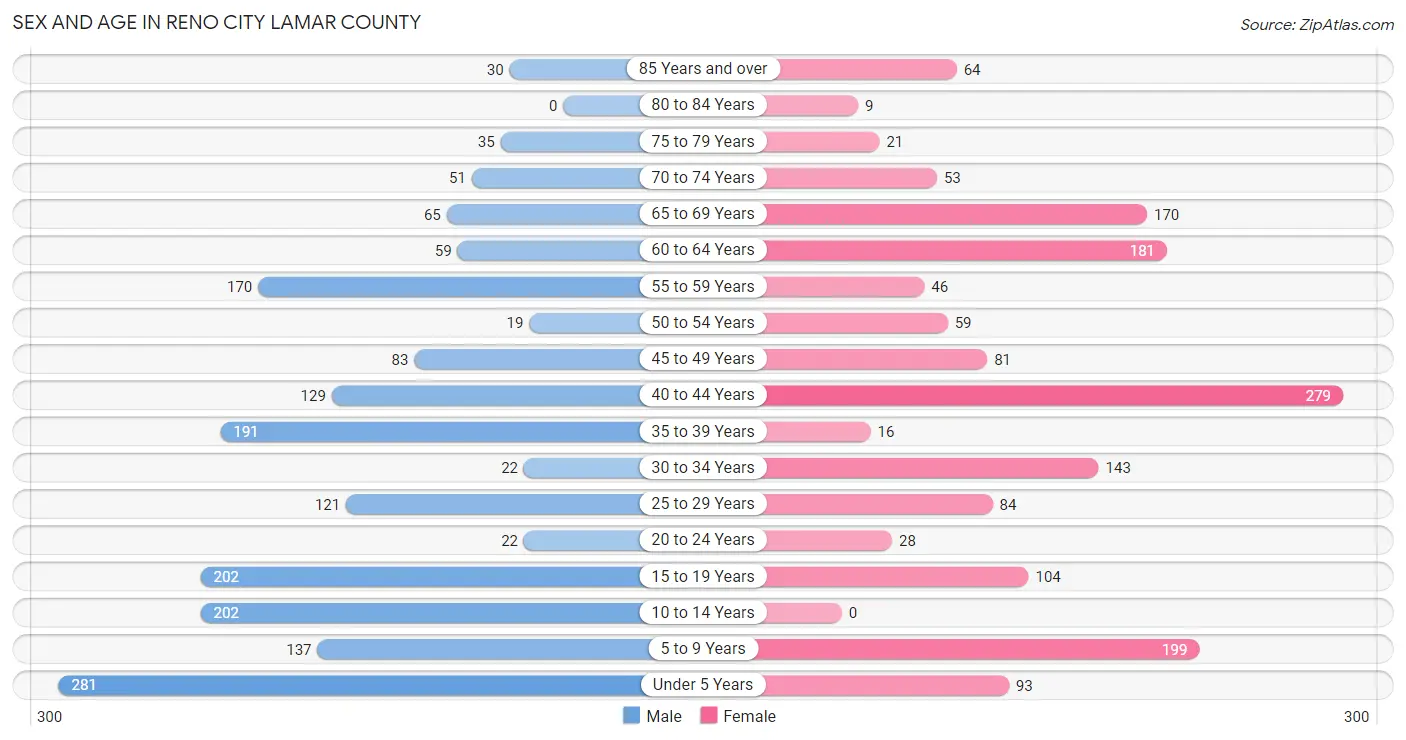
| Age Bracket | Male | Female |
| Under 5 Years | 281 (15.4%) | 93 (5.7%) |
| 5 to 9 Years | 137 (7.5%) | 199 (12.2%) |
| 10 to 14 Years | 202 (11.1%) | 0 (0.0%) |
| 15 to 19 Years | 202 (11.1%) | 104 (6.4%) |
| 20 to 24 Years | 22 (1.2%) | 28 (1.7%) |
| 25 to 29 Years | 121 (6.7%) | 84 (5.1%) |
| 30 to 34 Years | 22 (1.2%) | 143 (8.8%) |
| 35 to 39 Years | 191 (10.5%) | 16 (1.0%) |
| 40 to 44 Years | 129 (7.1%) | 279 (17.1%) |
| 45 to 49 Years | 83 (4.6%) | 81 (5.0%) |
| 50 to 54 Years | 19 (1.0%) | 59 (3.6%) |
| 55 to 59 Years | 170 (9.3%) | 46 (2.8%) |
| 60 to 64 Years | 59 (3.2%) | 181 (11.1%) |
| 65 to 69 Years | 65 (3.6%) | 170 (10.4%) |
| 70 to 74 Years | 51 (2.8%) | 53 (3.3%) |
| 75 to 79 Years | 35 (1.9%) | 21 (1.3%) |
| 80 to 84 Years | 0 (0.0%) | 9 (0.5%) |
| 85 Years and over | 30 (1.7%) | 64 (3.9%) |
| Total | 1,819 (100.0%) | 1,630 (100.0%) |
Families and Households in Reno city Lamar County
Median Family Size in Reno city Lamar County
The median family size in Reno city Lamar County is 3.16 persons per family, with married-couple families (699 | 70.9%) accounting for the largest median family size of 3.37 persons per family. On the other hand, single male/father families (109 | 11.1%) represent the smallest median family size with 1.81 persons per family.
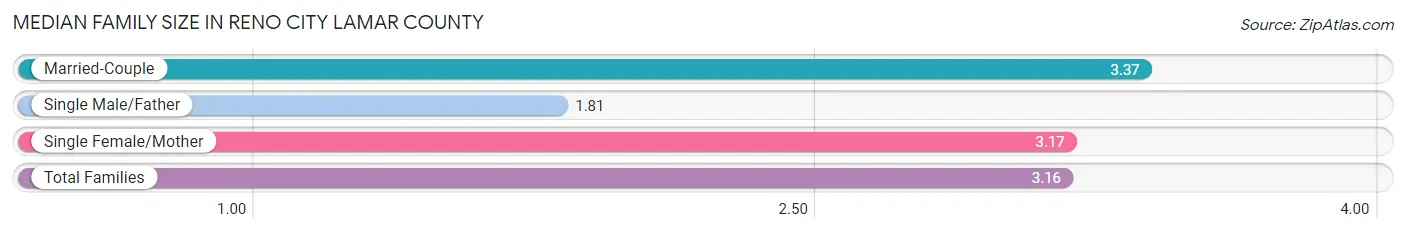
| Family Type | # Families | Family Size |
| Married-Couple | 699 (70.9%) | 3.37 |
| Single Male/Father | 109 (11.1%) | 1.81 |
| Single Female/Mother | 178 (18.0%) | 3.17 |
| Total Families | 986 (100.0%) | 3.16 |
Median Household Size in Reno city Lamar County
The median household size in Reno city Lamar County is 2.64 persons per household, with married-couple households (699 | 53.6%) accounting for the largest median household size of 3.37 persons per household. non-family households (318 | 24.4%) represent the smallest median household size with 1.03 persons per household.
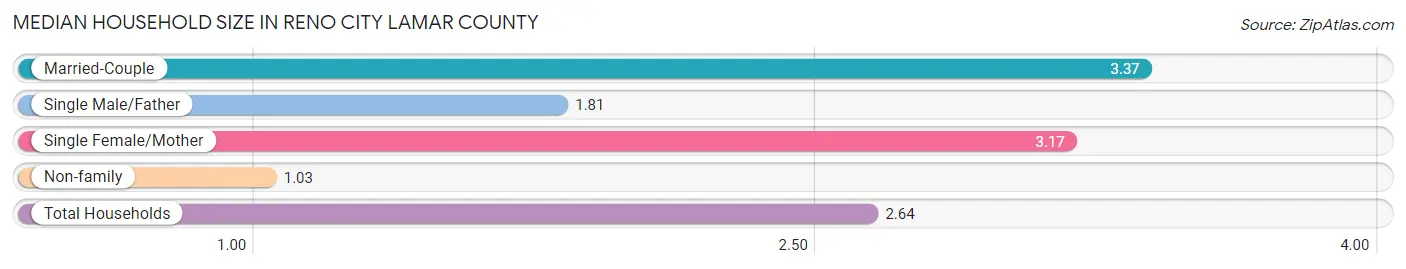
| Household Type | # Households | Household Size |
| Married-Couple | 699 (53.6%) | 3.37 |
| Single Male/Father | 109 (8.4%) | 1.81 |
| Single Female/Mother | 178 (13.7%) | 3.17 |
| Non-family | 318 (24.4%) | 1.03 |
| Total Households | 1,304 (100.0%) | 2.64 |
Household Size by Marriage Status in Reno city Lamar County
Out of a total of 1,304 households in Reno city Lamar County, 986 (75.6%) are family households, while 318 (24.4%) are nonfamily households. The most numerous type of family households are 2-person households, comprising 474, and the most common type of nonfamily households are 1-person households, comprising 307.
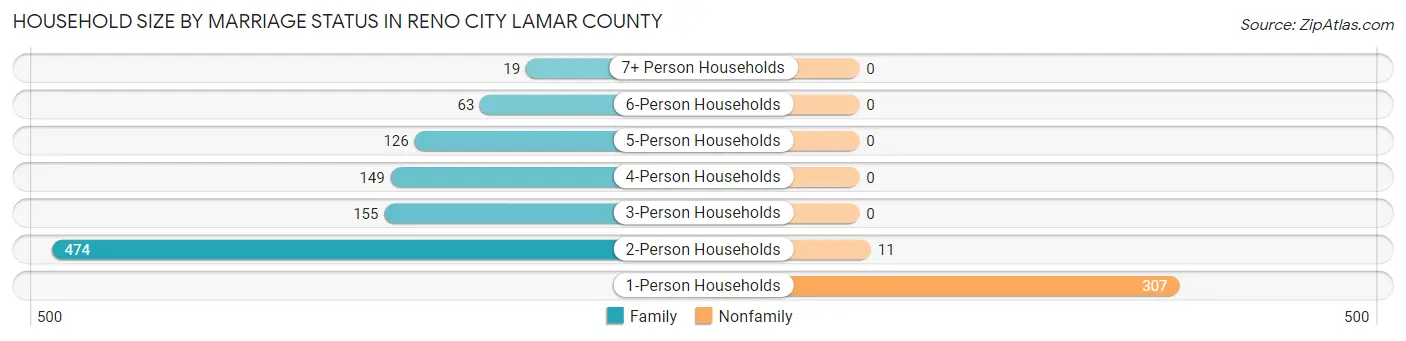
| Household Size | Family Households | Nonfamily Households |
| 1-Person Households | - | 307 (23.5%) |
| 2-Person Households | 474 (36.3%) | 11 (0.8%) |
| 3-Person Households | 155 (11.9%) | 0 (0.0%) |
| 4-Person Households | 149 (11.4%) | 0 (0.0%) |
| 5-Person Households | 126 (9.7%) | 0 (0.0%) |
| 6-Person Households | 63 (4.8%) | 0 (0.0%) |
| 7+ Person Households | 19 (1.5%) | 0 (0.0%) |
| Total | 986 (75.6%) | 318 (24.4%) |
Female Fertility in Reno city Lamar County
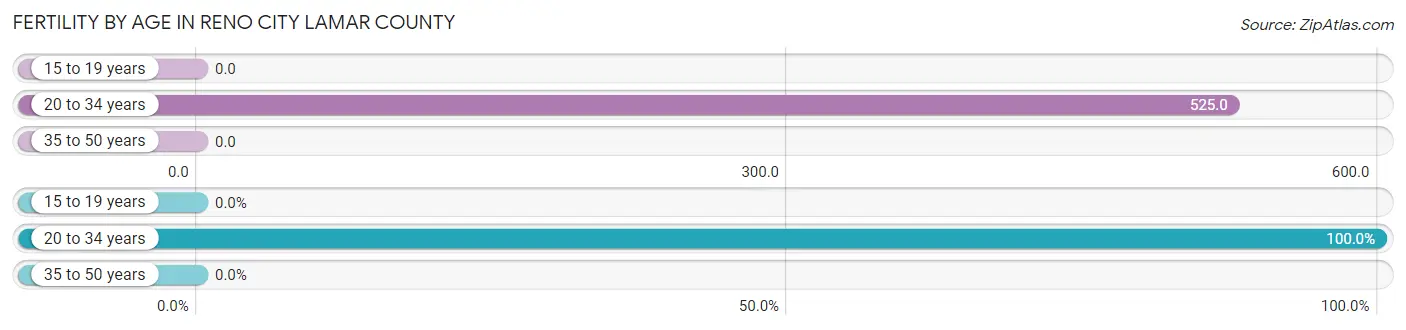
Fertility by Age in Reno city Lamar County
Average fertility rate in Reno city Lamar County is 182.0 births per 1,000 women. Women in the age bracket of 20 to 34 years have the highest fertility rate with 525.0 births per 1,000 women. Women in the age bracket of 20 to 34 years acount for 100.0% of all women with births.
| Age Bracket | Women with Births | Births / 1,000 Women |
| 15 to 19 years | 0 (0.0%) | 0.0 |
| 20 to 34 years | 134 (100.0%) | 525.0 |
| 35 to 50 years | 0 (0.0%) | 0.0 |
| Total | 134 (100.0%) | 182.0 |
Fertility by Age by Marriage Status in Reno city Lamar County

| Age Bracket | Married | Unmarried |
| 15 to 19 years | 0 (0.0%) | 0 (0.0%) |
| 20 to 34 years | 134 (100.0%) | 0 (0.0%) |
| 35 to 50 years | 0 (0.0%) | 0 (0.0%) |
| Total | 134 (100.0%) | 0 (0.0%) |
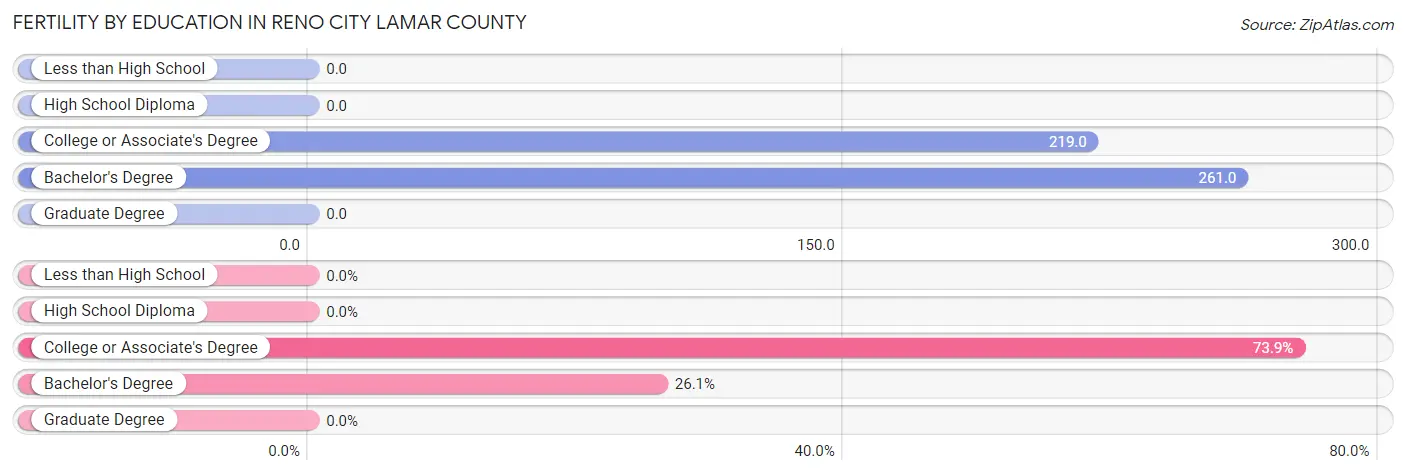
Fertility by Education in Reno city Lamar County
| Educational Attainment | Women with Births | Births / 1,000 Women |
| Less than High School | 0 (0.0%) | 0.0 |
| High School Diploma | 0 (0.0%) | 0.0 |
| College or Associate's Degree | 99 (73.9%) | 219.0 |
| Bachelor's Degree | 35 (26.1%) | 261.0 |
| Graduate Degree | 0 (0.0%) | 0.0 |
| Total | 134 (100.0%) | 182.0 |
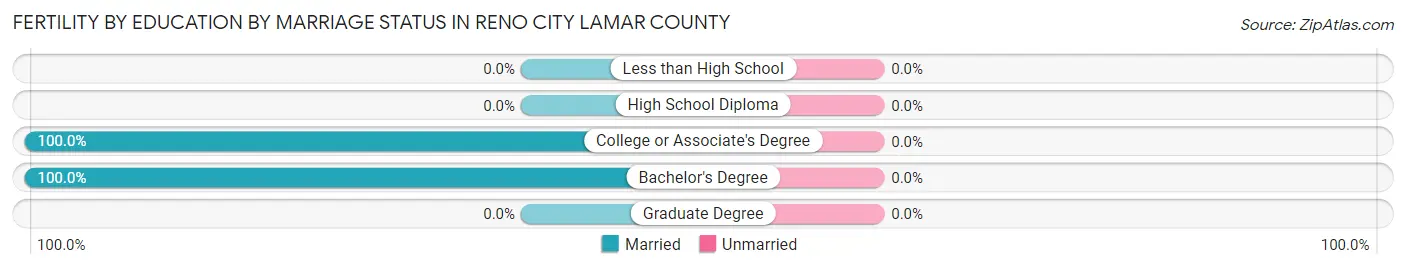
Fertility by Education by Marriage Status in Reno city Lamar County
| Educational Attainment | Married | Unmarried |
| Less than High School | 0 (0.0%) | 0 (0.0%) |
| High School Diploma | 0 (0.0%) | 0 (0.0%) |
| College or Associate's Degree | 99 (100.0%) | 0 (0.0%) |
| Bachelor's Degree | 35 (100.0%) | 0 (0.0%) |
| Graduate Degree | 0 (0.0%) | 0 (0.0%) |
| Total | 134 (100.0%) | 0 (0.0%) |
Employment Characteristics in Reno city Lamar County
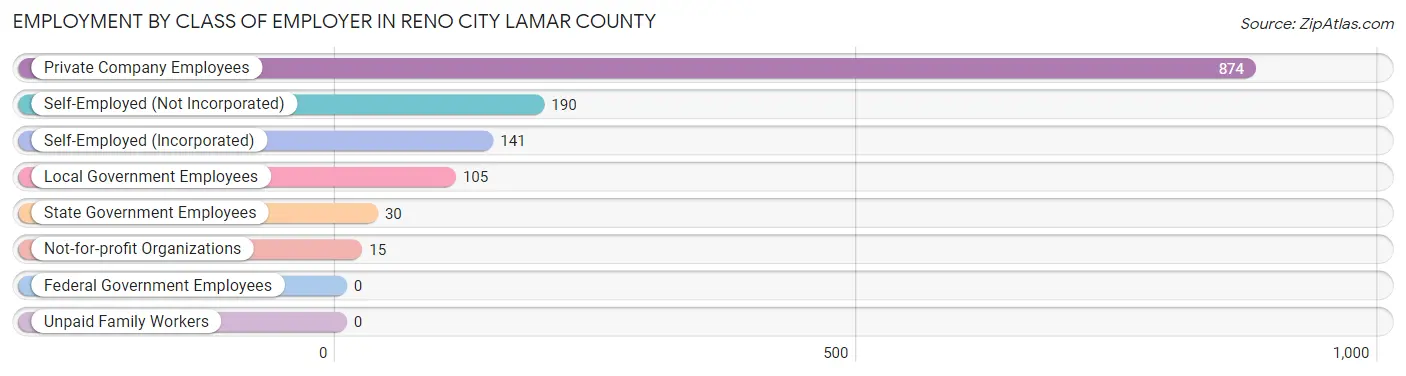
Employment by Class of Employer in Reno city Lamar County
Among the 1,355 employed individuals in Reno city Lamar County, private company employees (874 | 64.5%), self-employed (not incorporated) (190 | 14.0%), and self-employed (incorporated) (141 | 10.4%) make up the most common classes of employment.
| Employer Class | # Employees | % Employees |
| Private Company Employees | 874 | 64.5% |
| Self-Employed (Incorporated) | 141 | 10.4% |
| Self-Employed (Not Incorporated) | 190 | 14.0% |
| Not-for-profit Organizations | 15 | 1.1% |
| Local Government Employees | 105 | 7.7% |
| State Government Employees | 30 | 2.2% |
| Federal Government Employees | 0 | 0.0% |
| Unpaid Family Workers | 0 | 0.0% |
| Total | 1,355 | 100.0% |
Employment Status by Age in Reno city Lamar County
According to the labor force statistics for Reno city Lamar County, out of the total population over 16 years of age (2,485), 64.7% or 1,608 individuals are in the labor force, with 8.7% or 140 of them unemployed. The age group with the highest labor force participation rate is 20 to 24 years, with 100.0% or 50 individuals in the labor force. Within the labor force, the 65 to 74 years age range has the highest percentage of unemployed individuals, with 24.8% or 27 of them being unemployed.
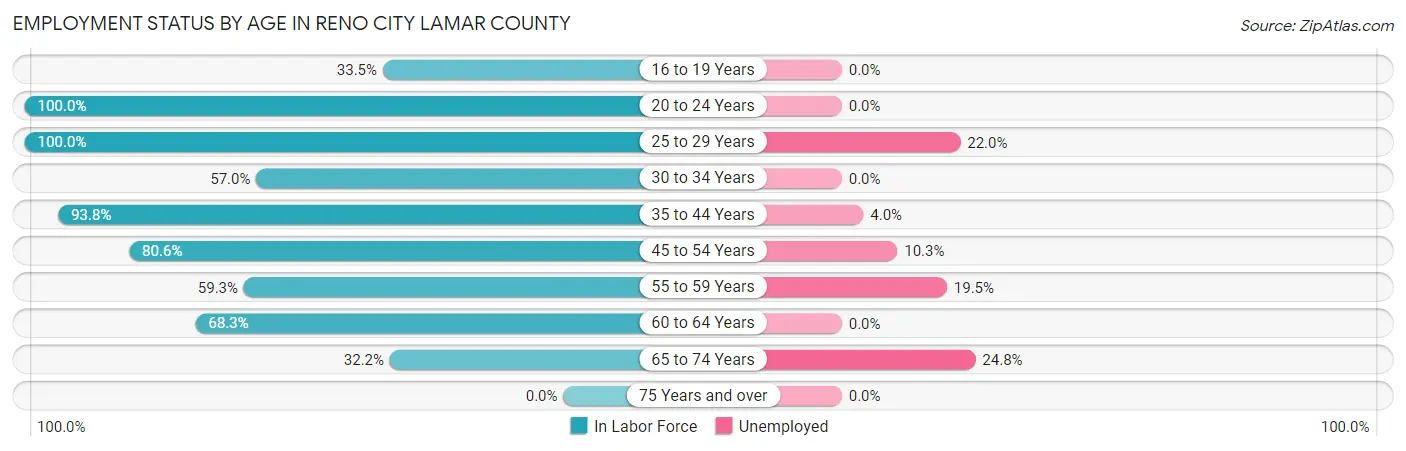
| Age Bracket | In Labor Force | Unemployed |
| 16 to 19 Years | 85 (33.5%) | 0 (0.0%) |
| 20 to 24 Years | 50 (100.0%) | 0 (0.0%) |
| 25 to 29 Years | 205 (100.0%) | 45 (22.0%) |
| 30 to 34 Years | 94 (57.0%) | 0 (0.0%) |
| 35 to 44 Years | 577 (93.8%) | 23 (4.0%) |
| 45 to 54 Years | 195 (80.6%) | 20 (10.3%) |
| 55 to 59 Years | 128 (59.3%) | 25 (19.5%) |
| 60 to 64 Years | 164 (68.3%) | 0 (0.0%) |
| 65 to 74 Years | 109 (32.2%) | 27 (24.8%) |
| 75 Years and over | 0 (0.0%) | 0 (0.0%) |
| Total | 1,608 (64.7%) | 140 (8.7%) |
Employment Status by Educational Attainment in Reno city Lamar County
According to labor force statistics for Reno city Lamar County, 81.0% of individuals (1,363) out of the total population between 25 and 64 years of age (1,683) are in the labor force, with 8.3% or 113 of them being unemployed. The group with the highest labor force participation rate are those with the educational attainment of bachelor's degree or higher, with 95.2% or 316 individuals in the labor force. Within the labor force, individuals with less than high school education have the highest percentage of unemployment, with 29.0% or 20 of them being unemployed.
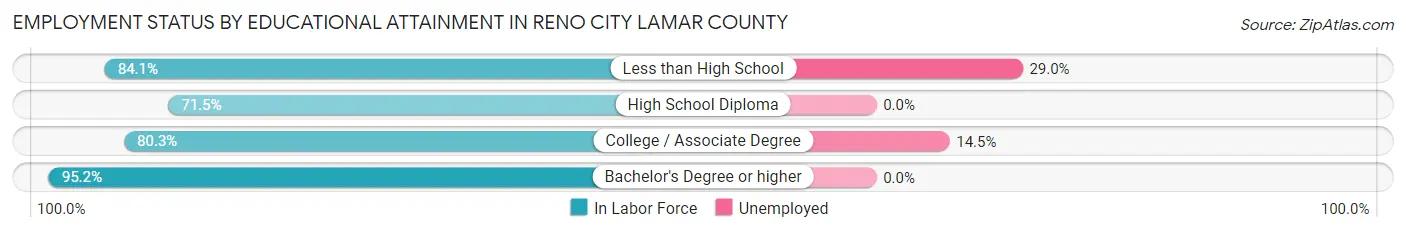
| Educational Attainment | In Labor Force | Unemployed |
| Less than High School | 69 (84.1%) | 24 (29.0%) |
| High School Diploma | 337 (71.5%) | 0 (0.0%) |
| College / Associate Degree | 641 (80.3%) | 116 (14.5%) |
| Bachelor's Degree or higher | 316 (95.2%) | 0 (0.0%) |
| Total | 1,363 (81.0%) | 140 (8.3%) |
Employment Occupations by Sex in Reno city Lamar County
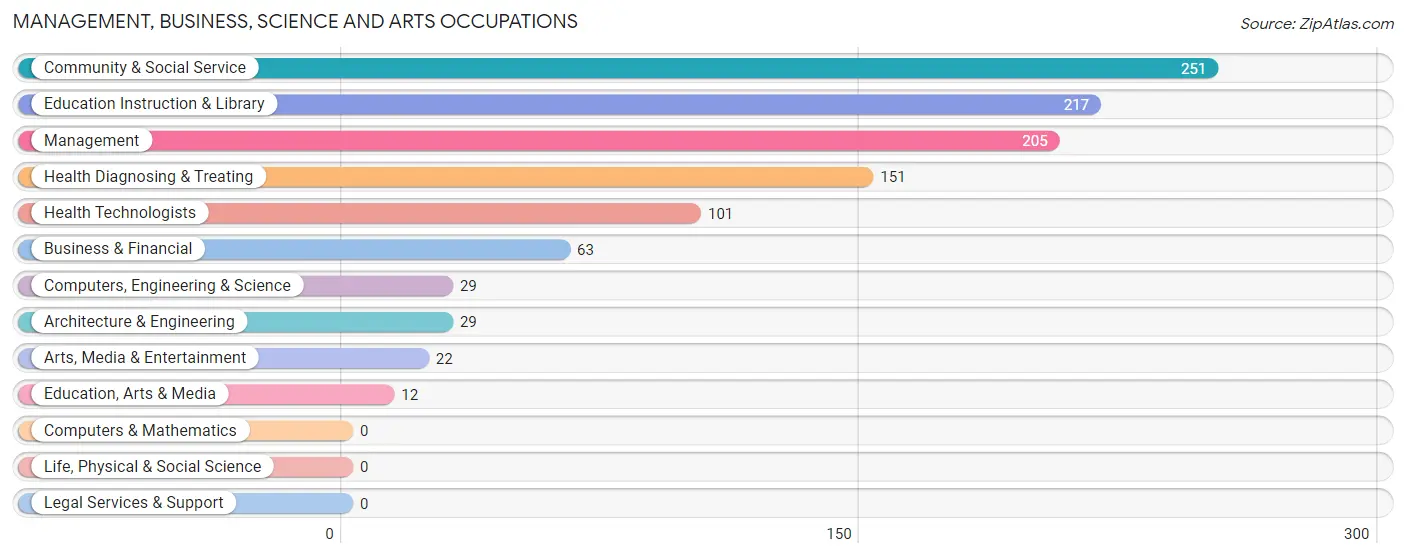
Management, Business, Science and Arts Occupations
The most common Management, Business, Science and Arts occupations in Reno city Lamar County are Community & Social Service (251 | 17.1%), Education Instruction & Library (217 | 14.8%), Management (205 | 14.0%), Health Diagnosing & Treating (151 | 10.3%), and Health Technologists (101 | 6.9%).
Management, Business, Science and Arts Occupations by Sex
Within the Management, Business, Science and Arts occupations in Reno city Lamar County, the most male-oriented occupations are Computers, Engineering & Science (100.0%), Architecture & Engineering (100.0%), and Arts, Media & Entertainment (100.0%), while the most female-oriented occupations are Education, Arts & Media (100.0%), Education Instruction & Library (88.0%), and Community & Social Service (80.9%).
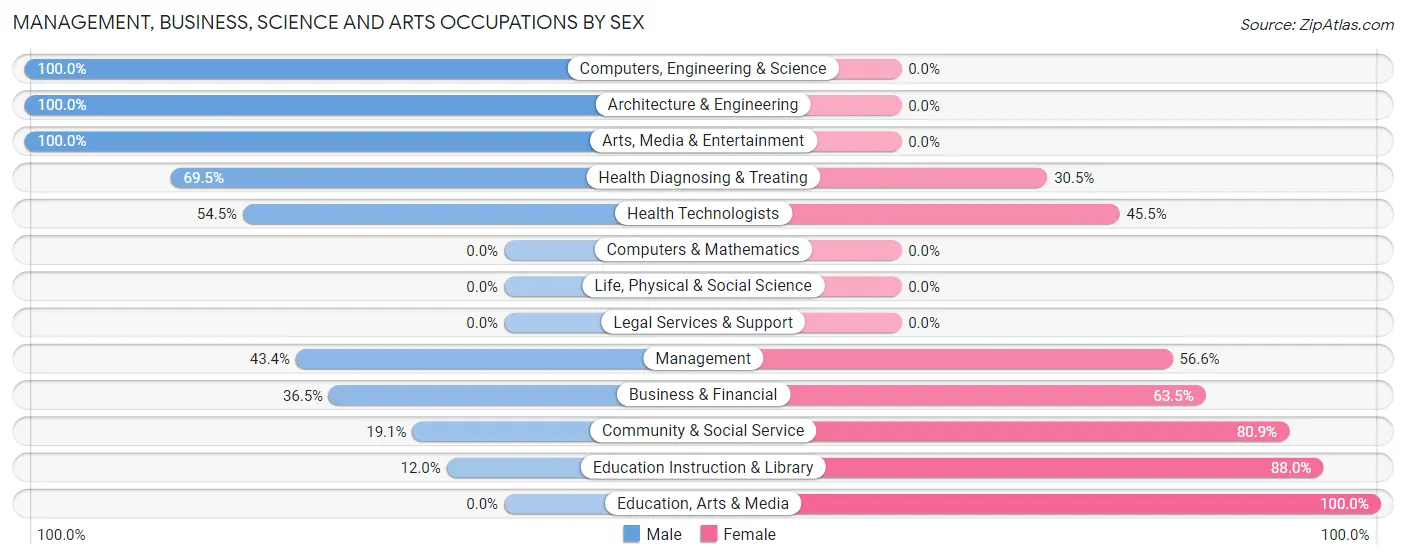
| Occupation | Male | Female |
| Management | 89 (43.4%) | 116 (56.6%) |
| Business & Financial | 23 (36.5%) | 40 (63.5%) |
| Computers, Engineering & Science | 29 (100.0%) | 0 (0.0%) |
| Computers & Mathematics | 0 (0.0%) | 0 (0.0%) |
| Architecture & Engineering | 29 (100.0%) | 0 (0.0%) |
| Life, Physical & Social Science | 0 (0.0%) | 0 (0.0%) |
| Community & Social Service | 48 (19.1%) | 203 (80.9%) |
| Education, Arts & Media | 0 (0.0%) | 12 (100.0%) |
| Legal Services & Support | 0 (0.0%) | 0 (0.0%) |
| Education Instruction & Library | 26 (12.0%) | 191 (88.0%) |
| Arts, Media & Entertainment | 22 (100.0%) | 0 (0.0%) |
| Health Diagnosing & Treating | 105 (69.5%) | 46 (30.5%) |
| Health Technologists | 55 (54.5%) | 46 (45.5%) |
| Total (Category) | 294 (42.1%) | 405 (57.9%) |
| Total (Overall) | 675 (46.0%) | 792 (54.0%) |
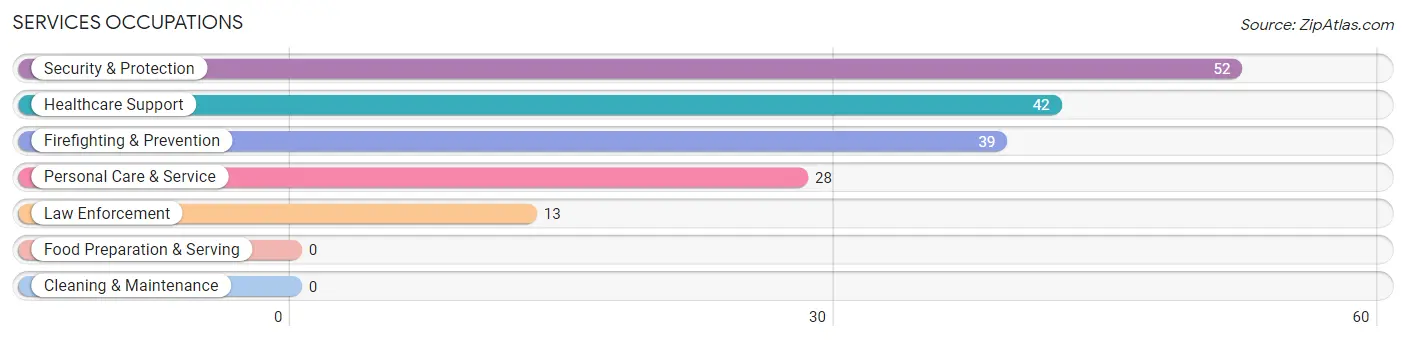
Services Occupations
The most common Services occupations in Reno city Lamar County are Security & Protection (52 | 3.5%), Healthcare Support (42 | 2.9%), Firefighting & Prevention (39 | 2.7%), Personal Care & Service (28 | 1.9%), and Law Enforcement (13 | 0.9%).
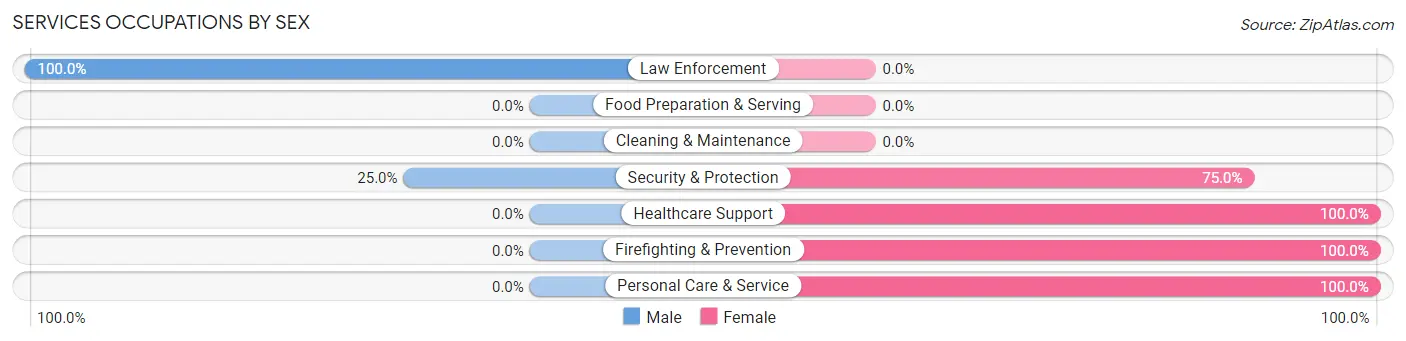
Services Occupations by Sex
Within the Services occupations in Reno city Lamar County, the most male-oriented occupations are Law Enforcement (100.0%), and Security & Protection (25.0%), while the most female-oriented occupations are Healthcare Support (100.0%), Firefighting & Prevention (100.0%), and Personal Care & Service (100.0%).
| Occupation | Male | Female |
| Healthcare Support | 0 (0.0%) | 42 (100.0%) |
| Security & Protection | 13 (25.0%) | 39 (75.0%) |
| Firefighting & Prevention | 0 (0.0%) | 39 (100.0%) |
| Law Enforcement | 13 (100.0%) | 0 (0.0%) |
| Food Preparation & Serving | 0 (0.0%) | 0 (0.0%) |
| Cleaning & Maintenance | 0 (0.0%) | 0 (0.0%) |
| Personal Care & Service | 0 (0.0%) | 28 (100.0%) |
| Total (Category) | 13 (10.7%) | 109 (89.3%) |
| Total (Overall) | 675 (46.0%) | 792 (54.0%) |
Sales and Office Occupations
The most common Sales and Office occupations in Reno city Lamar County are Office & Administration (155 | 10.6%), and Sales & Related (81 | 5.5%).

Sales and Office Occupations by Sex

| Occupation | Male | Female |
| Sales & Related | 35 (43.2%) | 46 (56.8%) |
| Office & Administration | 23 (14.8%) | 132 (85.2%) |
| Total (Category) | 58 (24.6%) | 178 (75.4%) |
| Total (Overall) | 675 (46.0%) | 792 (54.0%) |
Natural Resources, Construction and Maintenance Occupations
The most common Natural Resources, Construction and Maintenance occupations in Reno city Lamar County are Installation, Maintenance & Repair (113 | 7.7%), Construction & Extraction (36 | 2.5%), and Farming, Fishing & Forestry (19 | 1.3%).

Natural Resources, Construction and Maintenance Occupations by Sex

| Occupation | Male | Female |
| Farming, Fishing & Forestry | 19 (100.0%) | 0 (0.0%) |
| Construction & Extraction | 36 (100.0%) | 0 (0.0%) |
| Installation, Maintenance & Repair | 113 (100.0%) | 0 (0.0%) |
| Total (Category) | 168 (100.0%) | 0 (0.0%) |
| Total (Overall) | 675 (46.0%) | 792 (54.0%) |
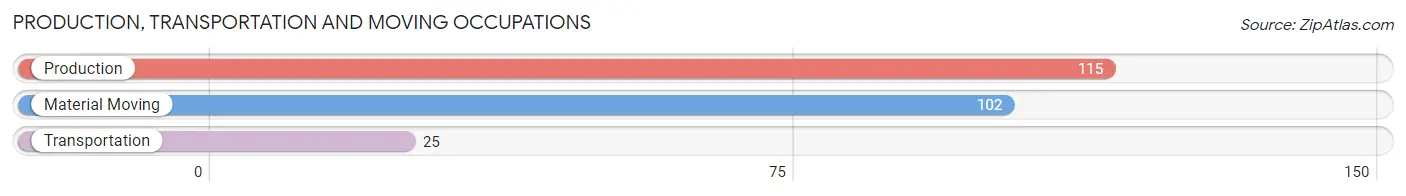
Production, Transportation and Moving Occupations
The most common Production, Transportation and Moving occupations in Reno city Lamar County are Production (115 | 7.8%), Material Moving (102 | 7.0%), and Transportation (25 | 1.7%).
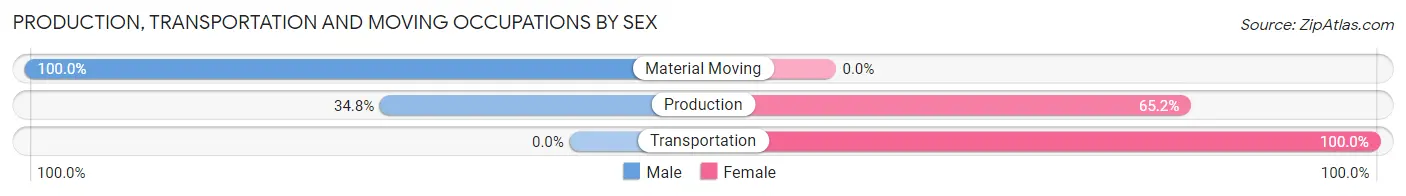
Production, Transportation and Moving Occupations by Sex
| Occupation | Male | Female |
| Production | 40 (34.8%) | 75 (65.2%) |
| Transportation | 0 (0.0%) | 25 (100.0%) |
| Material Moving | 102 (100.0%) | 0 (0.0%) |
| Total (Category) | 142 (58.7%) | 100 (41.3%) |
| Total (Overall) | 675 (46.0%) | 792 (54.0%) |
Employment Industries by Sex in Reno city Lamar County
Employment Industries in Reno city Lamar County
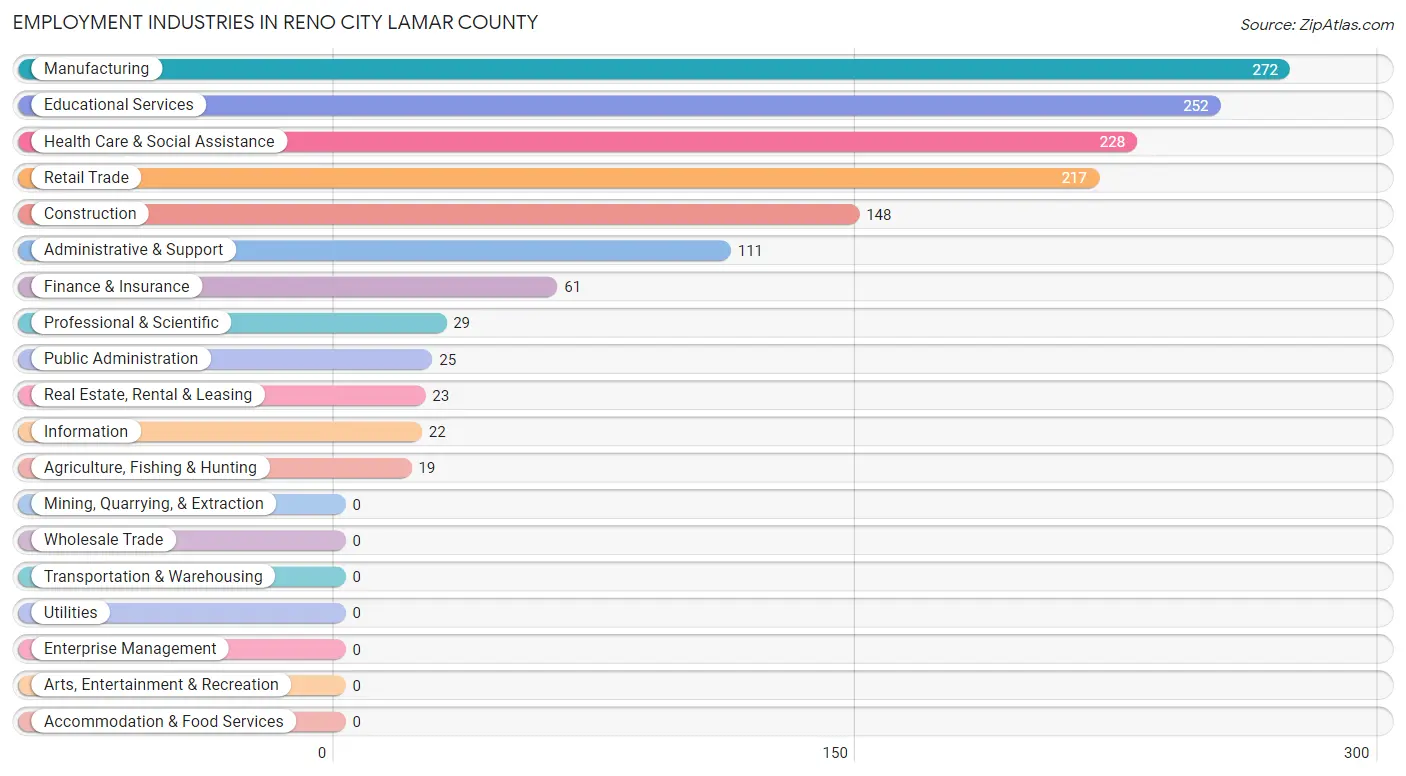
The major employment industries in Reno city Lamar County include Manufacturing (272 | 18.5%), Educational Services (252 | 17.2%), Health Care & Social Assistance (228 | 15.5%), Retail Trade (217 | 14.8%), and Construction (148 | 10.1%).
Employment Industries by Sex in Reno city Lamar County
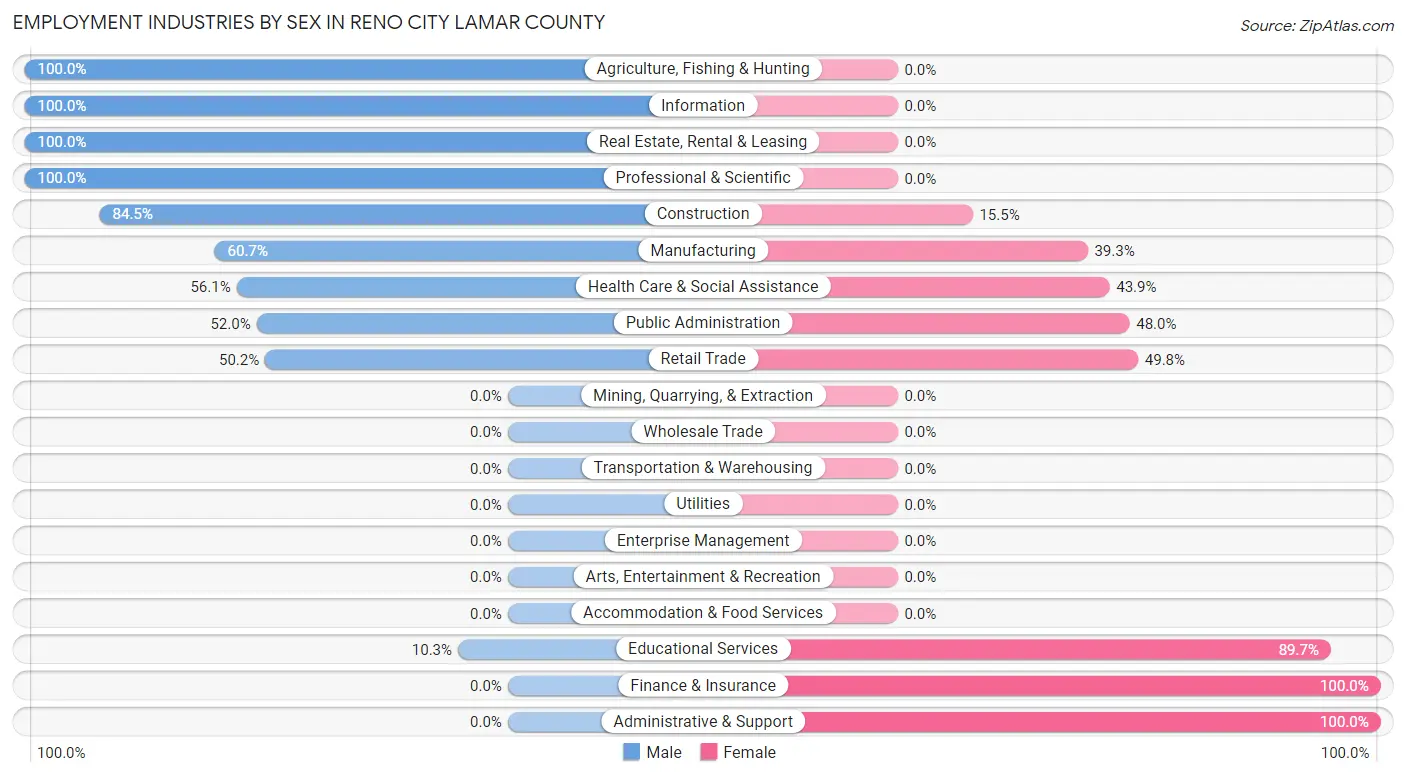
The Reno city Lamar County industries that see more men than women are Agriculture, Fishing & Hunting (100.0%), Information (100.0%), and Real Estate, Rental & Leasing (100.0%), whereas the industries that tend to have a higher number of women are Finance & Insurance (100.0%), Administrative & Support (100.0%), and Educational Services (89.7%).
| Industry | Male | Female |
| Agriculture, Fishing & Hunting | 19 (100.0%) | 0 (0.0%) |
| Mining, Quarrying, & Extraction | 0 (0.0%) | 0 (0.0%) |
| Construction | 125 (84.5%) | 23 (15.5%) |
| Manufacturing | 165 (60.7%) | 107 (39.3%) |
| Wholesale Trade | 0 (0.0%) | 0 (0.0%) |
| Retail Trade | 109 (50.2%) | 108 (49.8%) |
| Transportation & Warehousing | 0 (0.0%) | 0 (0.0%) |
| Utilities | 0 (0.0%) | 0 (0.0%) |
| Information | 22 (100.0%) | 0 (0.0%) |
| Finance & Insurance | 0 (0.0%) | 61 (100.0%) |
| Real Estate, Rental & Leasing | 23 (100.0%) | 0 (0.0%) |
| Professional & Scientific | 29 (100.0%) | 0 (0.0%) |
| Enterprise Management | 0 (0.0%) | 0 (0.0%) |
| Administrative & Support | 0 (0.0%) | 111 (100.0%) |
| Educational Services | 26 (10.3%) | 226 (89.7%) |
| Health Care & Social Assistance | 128 (56.1%) | 100 (43.9%) |
| Arts, Entertainment & Recreation | 0 (0.0%) | 0 (0.0%) |
| Accommodation & Food Services | 0 (0.0%) | 0 (0.0%) |
| Public Administration | 13 (52.0%) | 12 (48.0%) |
| Total | 675 (46.0%) | 792 (54.0%) |
Education in Reno city Lamar County
School Enrollment in Reno city Lamar County
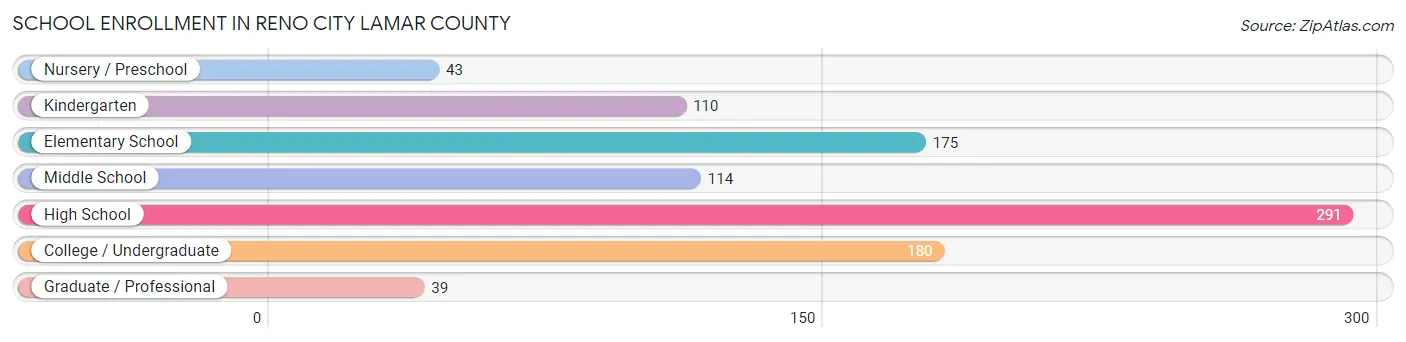
The most common levels of schooling among the 952 students in Reno city Lamar County are high school (291 | 30.6%), college / undergraduate (180 | 18.9%), and elementary school (175 | 18.4%).
| School Level | # Students | % Students |
| Nursery / Preschool | 43 | 4.5% |
| Kindergarten | 110 | 11.6% |
| Elementary School | 175 | 18.4% |
| Middle School | 114 | 12.0% |
| High School | 291 | 30.6% |
| College / Undergraduate | 180 | 18.9% |
| Graduate / Professional | 39 | 4.1% |
| Total | 952 | 100.0% |
School Enrollment by Age by Funding Source in Reno city Lamar County
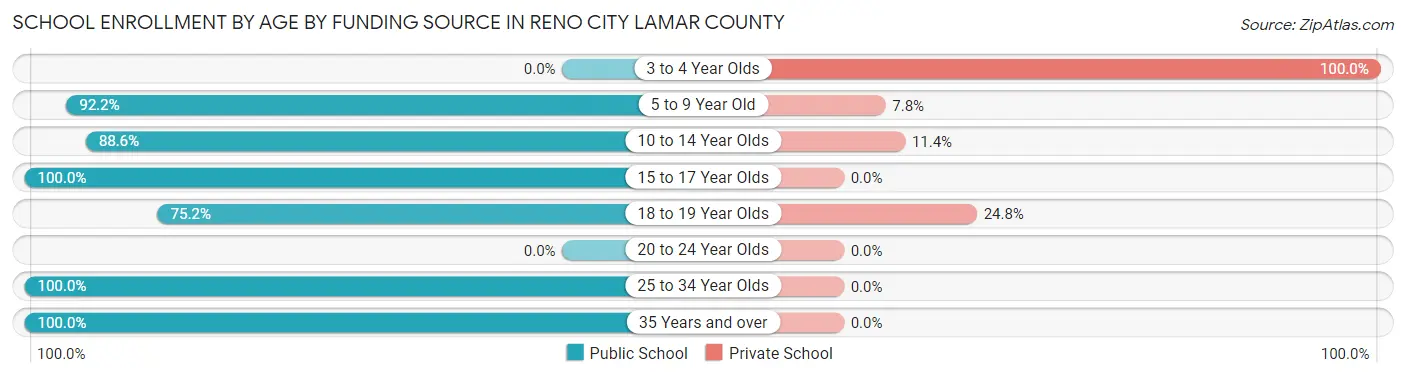
Out of a total of 952 students who are enrolled in schools in Reno city Lamar County, 92 (9.7%) attend a private institution, while the remaining 860 (90.3%) are enrolled in public schools. The age group of 3 to 4 year olds has the highest likelihood of being enrolled in private schools, with 19 (100.0% in the age bracket) enrolled. Conversely, the age group of 15 to 17 year olds has the lowest likelihood of being enrolled in a private school, with 193 (100.0% in the age bracket) attending a public institution.
| Age Bracket | Public School | Private School |
| 3 to 4 Year Olds | 0 (0.0%) | 19 (100.0%) |
| 5 to 9 Year Old | 285 (92.2%) | 24 (7.8%) |
| 10 to 14 Year Olds | 163 (88.6%) | 21 (11.4%) |
| 15 to 17 Year Olds | 193 (100.0%) | 0 (0.0%) |
| 18 to 19 Year Olds | 85 (75.2%) | 28 (24.8%) |
| 20 to 24 Year Olds | 0 (0.0%) | 0 (0.0%) |
| 25 to 34 Year Olds | 12 (100.0%) | 0 (0.0%) |
| 35 Years and over | 122 (100.0%) | 0 (0.0%) |
| Total | 860 (90.3%) | 92 (9.7%) |
Educational Attainment by Field of Study in Reno city Lamar County
Education (180 | 30.3%), social sciences (75 | 12.7%), business (67 | 11.3%), liberal arts & history (53 | 8.9%), and bio, nature & agricultural (44 | 7.4%) are the most common fields of study among 593 individuals in Reno city Lamar County who have obtained a bachelor's degree or higher.
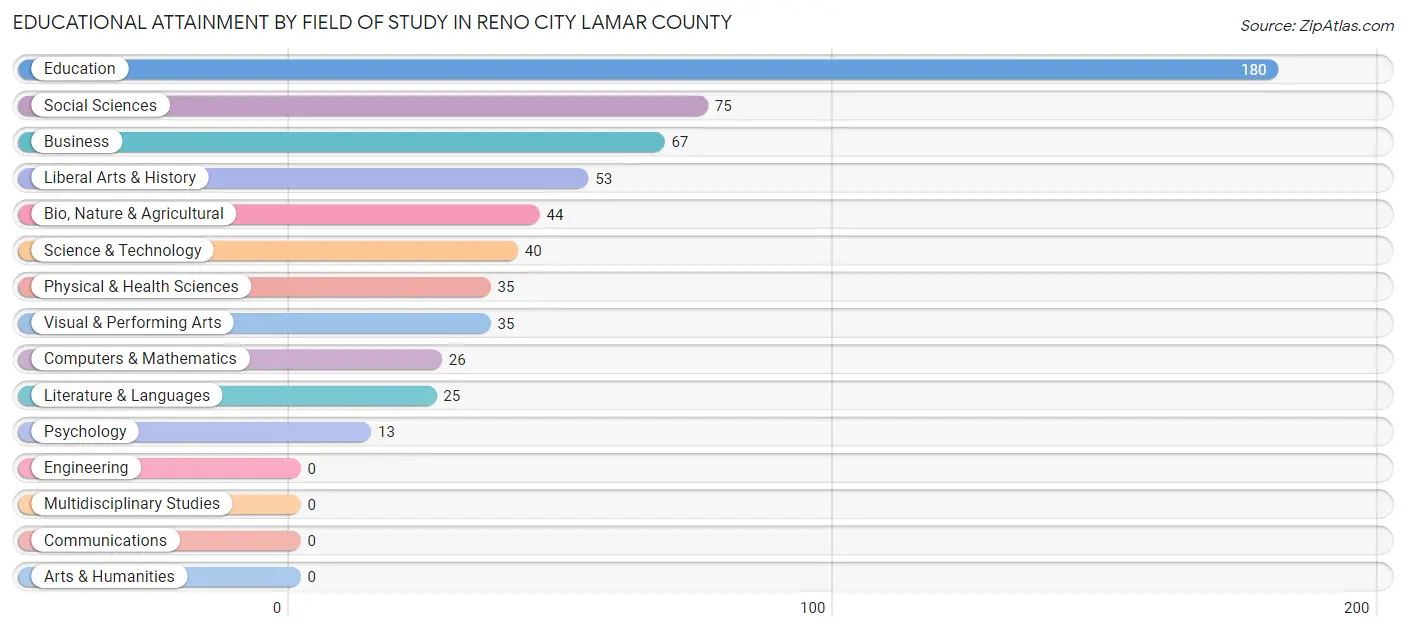
| Field of Study | # Graduates | % Graduates |
| Computers & Mathematics | 26 | 4.4% |
| Bio, Nature & Agricultural | 44 | 7.4% |
| Physical & Health Sciences | 35 | 5.9% |
| Psychology | 13 | 2.2% |
| Social Sciences | 75 | 12.7% |
| Engineering | 0 | 0.0% |
| Multidisciplinary Studies | 0 | 0.0% |
| Science & Technology | 40 | 6.8% |
| Business | 67 | 11.3% |
| Education | 180 | 30.3% |
| Literature & Languages | 25 | 4.2% |
| Liberal Arts & History | 53 | 8.9% |
| Visual & Performing Arts | 35 | 5.9% |
| Communications | 0 | 0.0% |
| Arts & Humanities | 0 | 0.0% |
| Total | 593 | 100.0% |
Transportation & Commute in Reno city Lamar County
Vehicle Availability by Sex in Reno city Lamar County
The most prevalent vehicle ownership categories in Reno city Lamar County are males with 2 vehicles (343, accounting for 50.8%) and females with 2 vehicles (330, making up 50.4%).
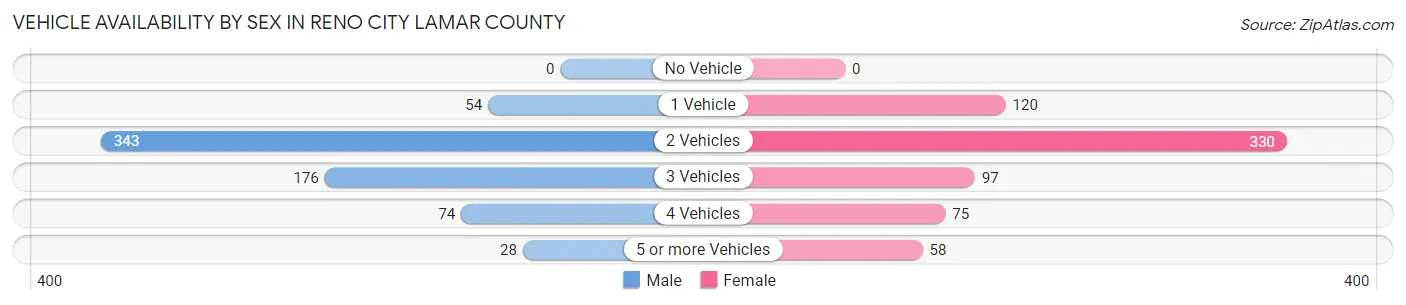
| Vehicles Available | Male | Female |
| No Vehicle | 0 (0.0%) | 0 (0.0%) |
| 1 Vehicle | 54 (8.0%) | 120 (17.6%) |
| 2 Vehicles | 343 (50.8%) | 330 (48.5%) |
| 3 Vehicles | 176 (26.1%) | 97 (14.3%) |
| 4 Vehicles | 74 (11.0%) | 75 (11.0%) |
| 5 or more Vehicles | 28 (4.2%) | 58 (8.5%) |
| Total | 675 (100.0%) | 680 (100.0%) |
Commute Time in Reno city Lamar County
The most frequently occuring commute durations in Reno city Lamar County are 10 to 14 minutes (496 commuters, 36.6%), 15 to 19 minutes (491 commuters, 36.2%), and 5 to 9 minutes (224 commuters, 16.5%).
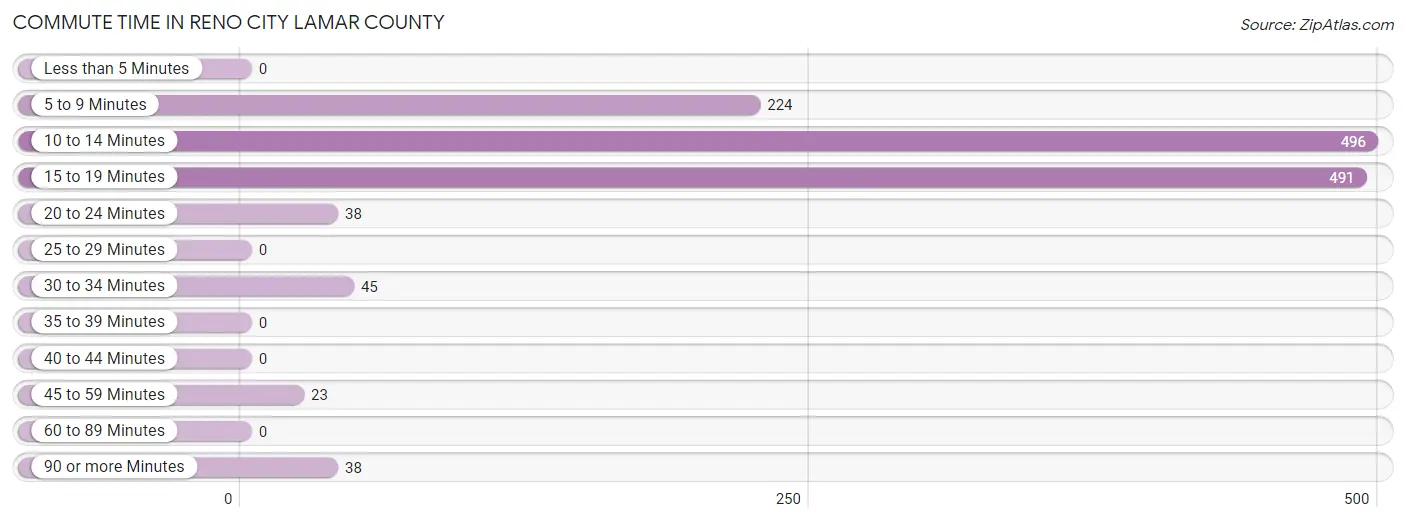
| Commute Time | # Commuters | % Commuters |
| Less than 5 Minutes | 0 | 0.0% |
| 5 to 9 Minutes | 224 | 16.5% |
| 10 to 14 Minutes | 496 | 36.6% |
| 15 to 19 Minutes | 491 | 36.2% |
| 20 to 24 Minutes | 38 | 2.8% |
| 25 to 29 Minutes | 0 | 0.0% |
| 30 to 34 Minutes | 45 | 3.3% |
| 35 to 39 Minutes | 0 | 0.0% |
| 40 to 44 Minutes | 0 | 0.0% |
| 45 to 59 Minutes | 23 | 1.7% |
| 60 to 89 Minutes | 0 | 0.0% |
| 90 or more Minutes | 38 | 2.8% |
Commute Time by Sex in Reno city Lamar County
The most common commute times in Reno city Lamar County are 15 to 19 minutes (281 commuters, 41.6%) for males and 10 to 14 minutes (239 commuters, 35.1%) for females.
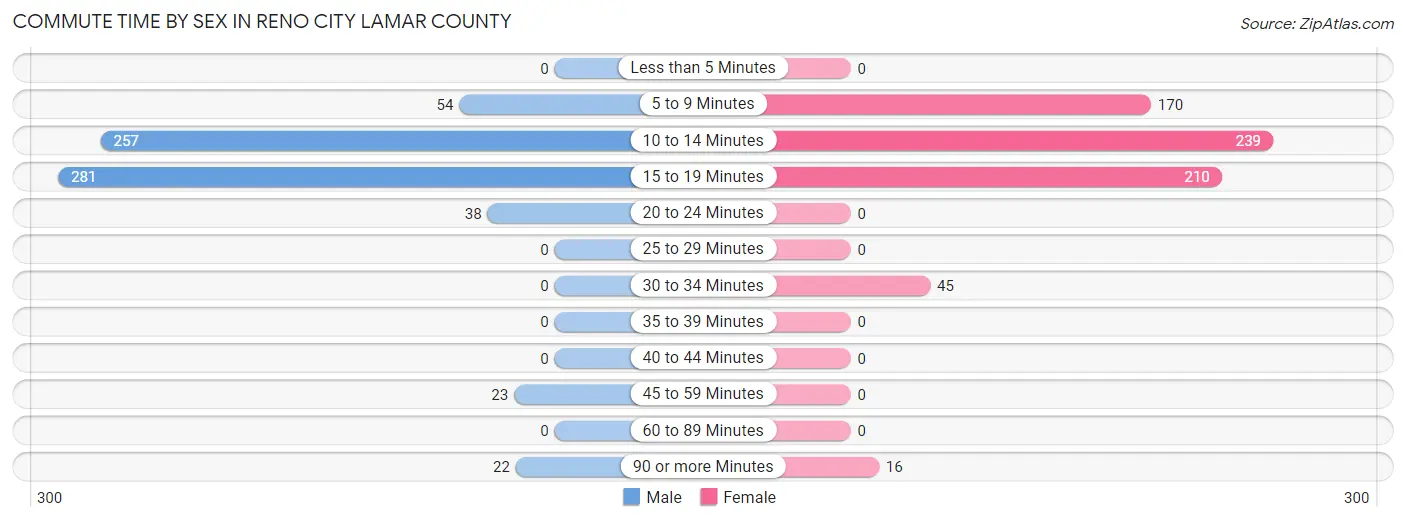
| Commute Time | Male | Female |
| Less than 5 Minutes | 0 (0.0%) | 0 (0.0%) |
| 5 to 9 Minutes | 54 (8.0%) | 170 (25.0%) |
| 10 to 14 Minutes | 257 (38.1%) | 239 (35.1%) |
| 15 to 19 Minutes | 281 (41.6%) | 210 (30.9%) |
| 20 to 24 Minutes | 38 (5.6%) | 0 (0.0%) |
| 25 to 29 Minutes | 0 (0.0%) | 0 (0.0%) |
| 30 to 34 Minutes | 0 (0.0%) | 45 (6.6%) |
| 35 to 39 Minutes | 0 (0.0%) | 0 (0.0%) |
| 40 to 44 Minutes | 0 (0.0%) | 0 (0.0%) |
| 45 to 59 Minutes | 23 (3.4%) | 0 (0.0%) |
| 60 to 89 Minutes | 0 (0.0%) | 0 (0.0%) |
| 90 or more Minutes | 22 (3.3%) | 16 (2.4%) |
Time of Departure to Work by Sex in Reno city Lamar County
The most frequent times of departure to work in Reno city Lamar County are 6:30 AM to 6:59 AM (163, 24.1%) for males and 7:30 AM to 7:59 AM (234, 34.4%) for females.
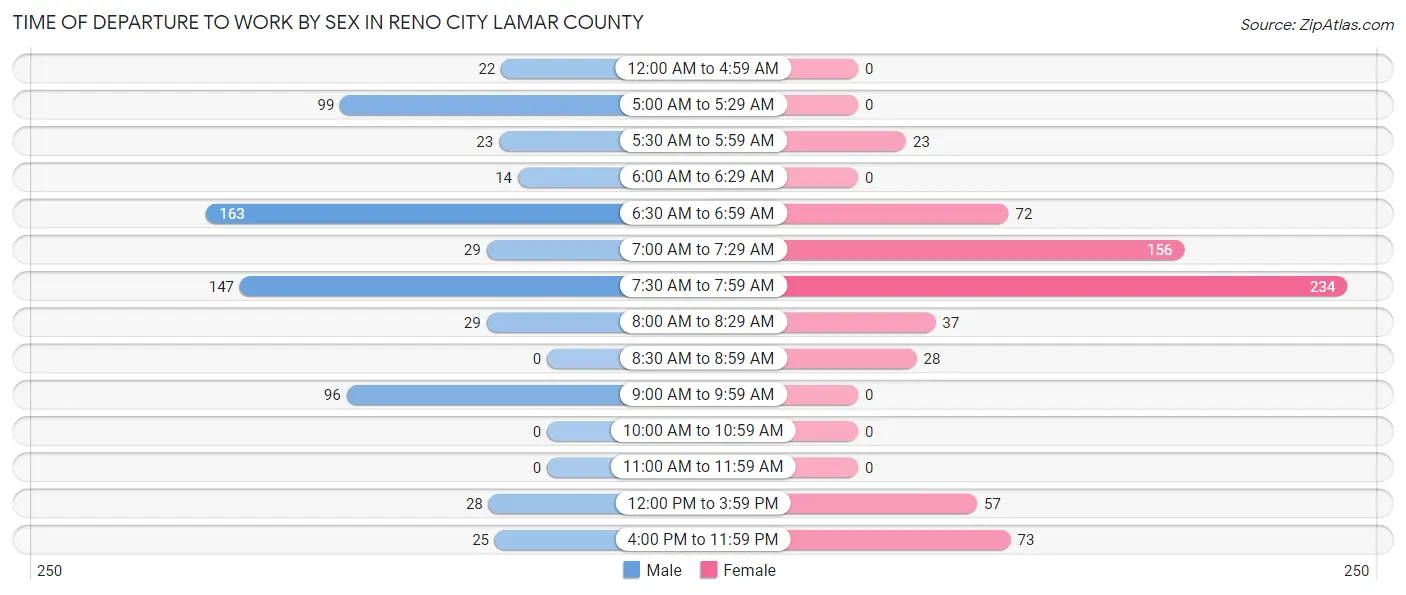
| Time of Departure | Male | Female |
| 12:00 AM to 4:59 AM | 22 (3.3%) | 0 (0.0%) |
| 5:00 AM to 5:29 AM | 99 (14.7%) | 0 (0.0%) |
| 5:30 AM to 5:59 AM | 23 (3.4%) | 23 (3.4%) |
| 6:00 AM to 6:29 AM | 14 (2.1%) | 0 (0.0%) |
| 6:30 AM to 6:59 AM | 163 (24.1%) | 72 (10.6%) |
| 7:00 AM to 7:29 AM | 29 (4.3%) | 156 (22.9%) |
| 7:30 AM to 7:59 AM | 147 (21.8%) | 234 (34.4%) |
| 8:00 AM to 8:29 AM | 29 (4.3%) | 37 (5.4%) |
| 8:30 AM to 8:59 AM | 0 (0.0%) | 28 (4.1%) |
| 9:00 AM to 9:59 AM | 96 (14.2%) | 0 (0.0%) |
| 10:00 AM to 10:59 AM | 0 (0.0%) | 0 (0.0%) |
| 11:00 AM to 11:59 AM | 0 (0.0%) | 0 (0.0%) |
| 12:00 PM to 3:59 PM | 28 (4.2%) | 57 (8.4%) |
| 4:00 PM to 11:59 PM | 25 (3.7%) | 73 (10.7%) |
| Total | 675 (100.0%) | 680 (100.0%) |
Housing Occupancy in Reno city Lamar County
Occupancy by Ownership in Reno city Lamar County
Of the total 1,304 dwellings in Reno city Lamar County, owner-occupied units account for 1,043 (80.0%), while renter-occupied units make up 261 (20.0%).
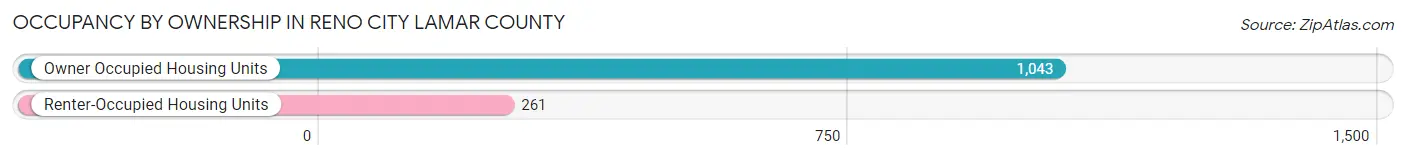
| Occupancy | # Housing Units | % Housing Units |
| Owner Occupied Housing Units | 1,043 | 80.0% |
| Renter-Occupied Housing Units | 261 | 20.0% |
| Total Occupied Housing Units | 1,304 | 100.0% |
Occupancy by Household Size in Reno city Lamar County
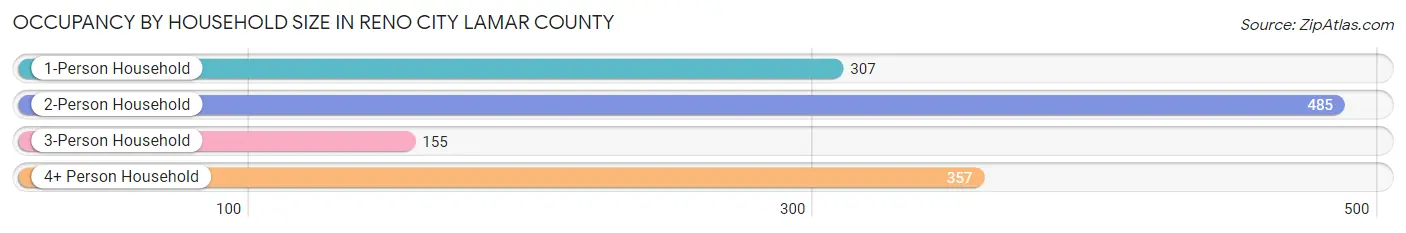
| Household Size | # Housing Units | % Housing Units |
| 1-Person Household | 307 | 23.5% |
| 2-Person Household | 485 | 37.2% |
| 3-Person Household | 155 | 11.9% |
| 4+ Person Household | 357 | 27.4% |
| Total Housing Units | 1,304 | 100.0% |
Occupancy by Ownership by Household Size in Reno city Lamar County
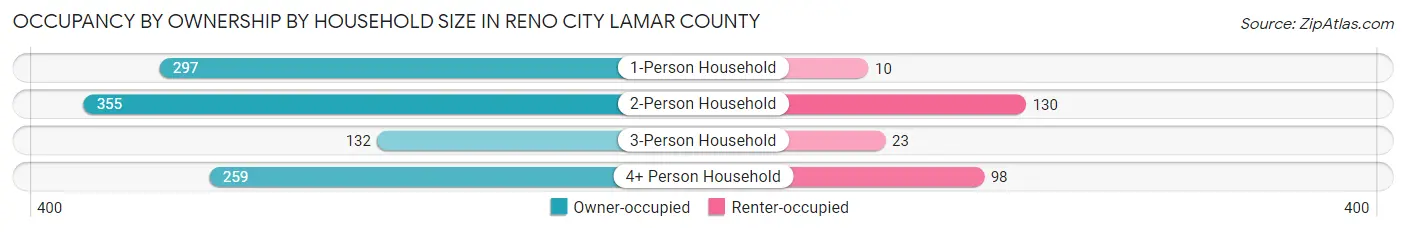
| Household Size | Owner-occupied | Renter-occupied |
| 1-Person Household | 297 (96.7%) | 10 (3.3%) |
| 2-Person Household | 355 (73.2%) | 130 (26.8%) |
| 3-Person Household | 132 (85.2%) | 23 (14.8%) |
| 4+ Person Household | 259 (72.6%) | 98 (27.5%) |
| Total Housing Units | 1,043 (80.0%) | 261 (20.0%) |
Occupancy by Educational Attainment in Reno city Lamar County
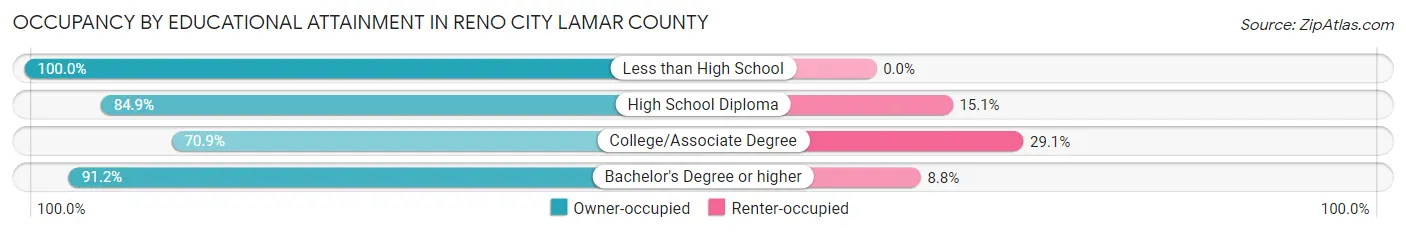
| Household Size | Owner-occupied | Renter-occupied |
| Less than High School | 38 (100.0%) | 0 (0.0%) |
| High School Diploma | 275 (84.9%) | 49 (15.1%) |
| College/Associate Degree | 450 (70.9%) | 185 (29.1%) |
| Bachelor's Degree or higher | 280 (91.2%) | 27 (8.8%) |
Occupancy by Age of Householder in Reno city Lamar County
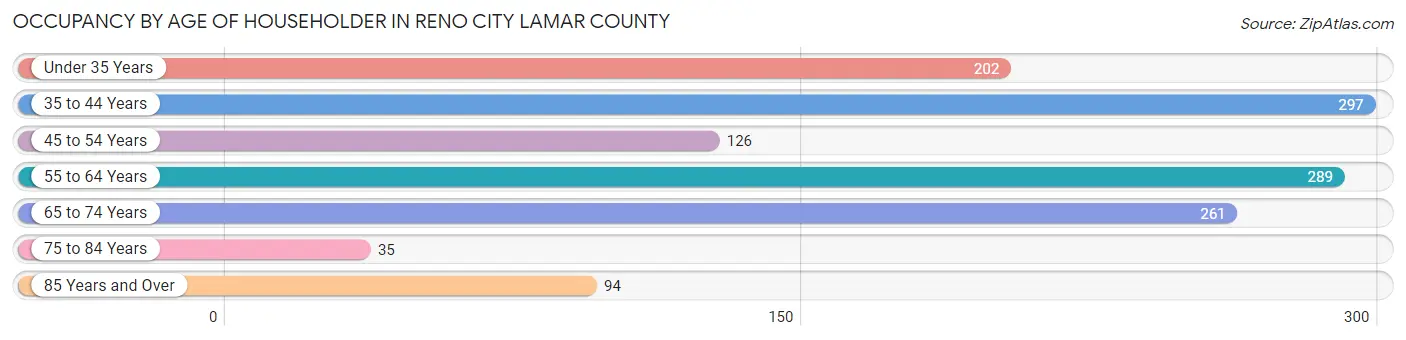
| Age Bracket | # Households | % Households |
| Under 35 Years | 202 | 15.5% |
| 35 to 44 Years | 297 | 22.8% |
| 45 to 54 Years | 126 | 9.7% |
| 55 to 64 Years | 289 | 22.2% |
| 65 to 74 Years | 261 | 20.0% |
| 75 to 84 Years | 35 | 2.7% |
| 85 Years and Over | 94 | 7.2% |
| Total | 1,304 | 100.0% |
Housing Finances in Reno city Lamar County
Median Income by Occupancy in Reno city Lamar County
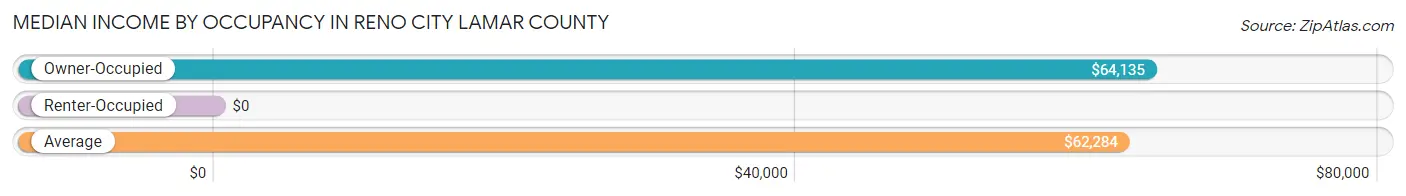
| Occupancy Type | # Households | Median Income |
| Owner-Occupied | 1,043 (80.0%) | $64,135 |
| Renter-Occupied | 261 (20.0%) | $0 |
| Average | 1,304 (100.0%) | $62,284 |
Occupancy by Householder Income Bracket in Reno city Lamar County
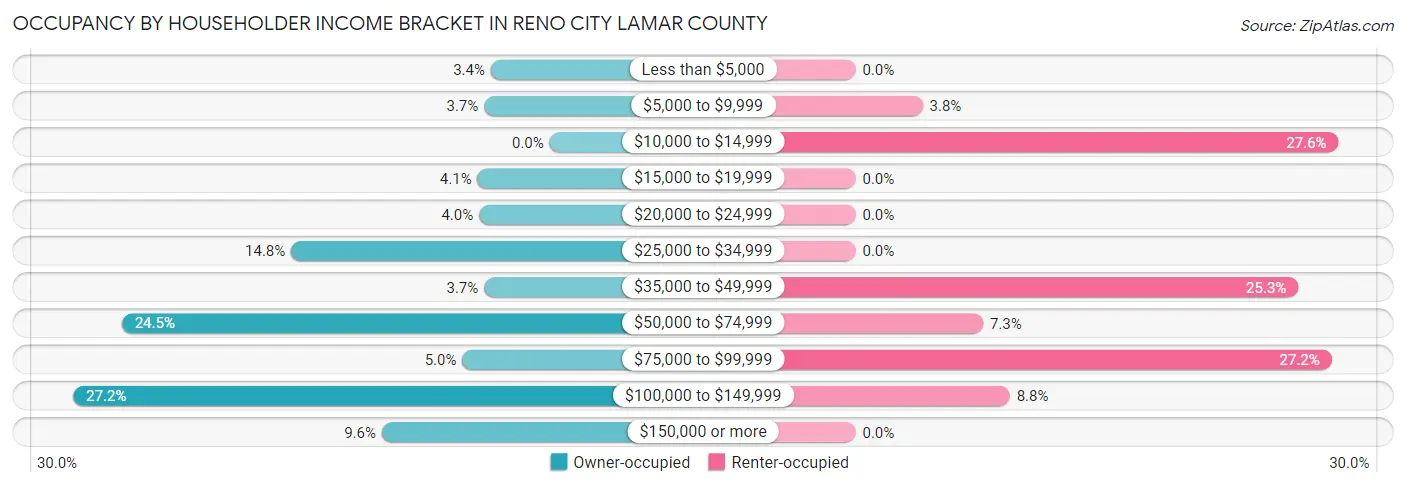
| Income Bracket | Owner-occupied | Renter-occupied |
| Less than $5,000 | 35 (3.4%) | 0 (0.0%) |
| $5,000 to $9,999 | 39 (3.7%) | 10 (3.8%) |
| $10,000 to $14,999 | 0 (0.0%) | 72 (27.6%) |
| $15,000 to $19,999 | 43 (4.1%) | 0 (0.0%) |
| $20,000 to $24,999 | 42 (4.0%) | 0 (0.0%) |
| $25,000 to $34,999 | 154 (14.8%) | 0 (0.0%) |
| $35,000 to $49,999 | 39 (3.7%) | 66 (25.3%) |
| $50,000 to $74,999 | 255 (24.4%) | 19 (7.3%) |
| $75,000 to $99,999 | 52 (5.0%) | 71 (27.2%) |
| $100,000 to $149,999 | 284 (27.2%) | 23 (8.8%) |
| $150,000 or more | 100 (9.6%) | 0 (0.0%) |
| Total | 1,043 (100.0%) | 261 (100.0%) |
Monthly Housing Cost Tiers in Reno city Lamar County
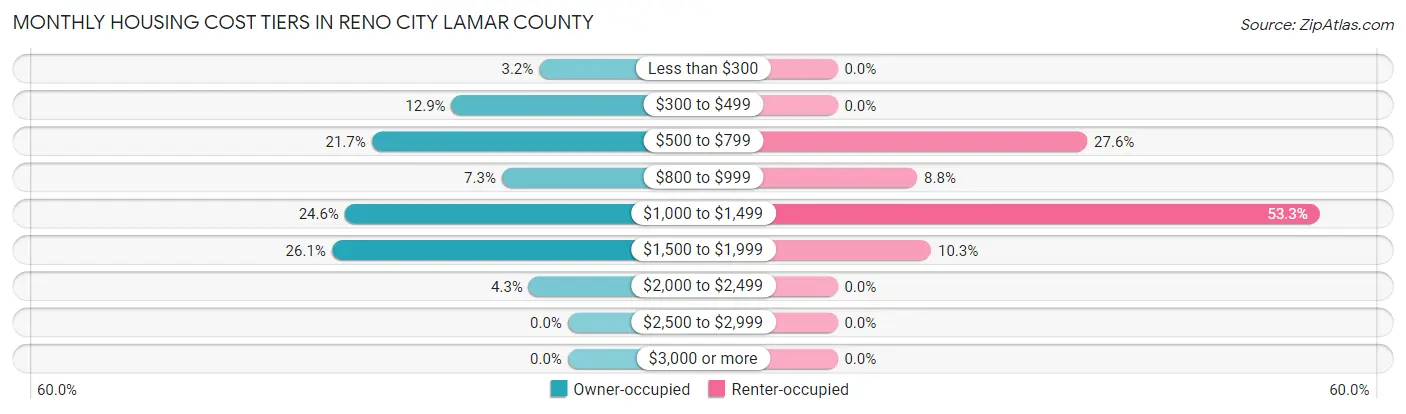
| Monthly Cost | Owner-occupied | Renter-occupied |
| Less than $300 | 33 (3.2%) | 0 (0.0%) |
| $300 to $499 | 134 (12.9%) | 0 (0.0%) |
| $500 to $799 | 226 (21.7%) | 72 (27.6%) |
| $800 to $999 | 76 (7.3%) | 23 (8.8%) |
| $1,000 to $1,499 | 257 (24.6%) | 139 (53.3%) |
| $1,500 to $1,999 | 272 (26.1%) | 27 (10.3%) |
| $2,000 to $2,499 | 45 (4.3%) | 0 (0.0%) |
| $2,500 to $2,999 | 0 (0.0%) | 0 (0.0%) |
| $3,000 or more | 0 (0.0%) | 0 (0.0%) |
| Total | 1,043 (100.0%) | 261 (100.0%) |
Physical Housing Characteristics in Reno city Lamar County
Housing Structures in Reno city Lamar County
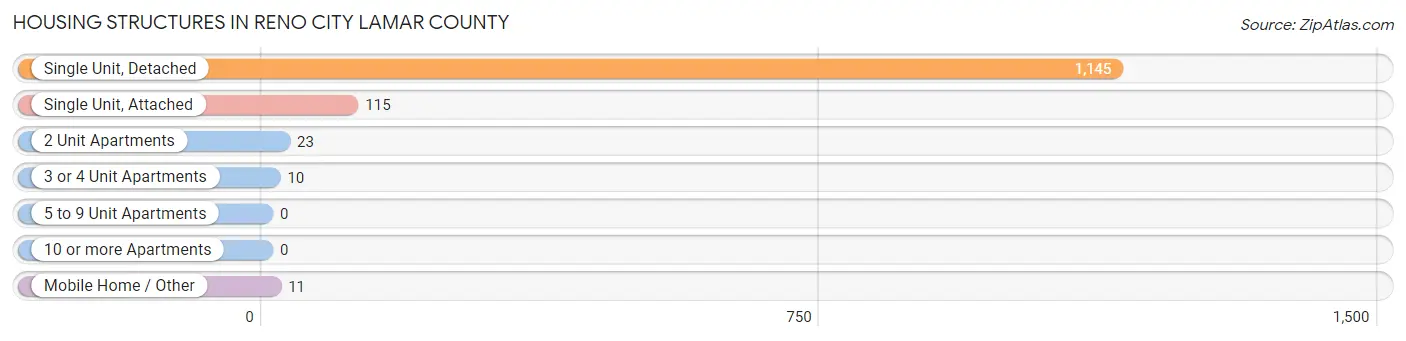
| Structure Type | # Housing Units | % Housing Units |
| Single Unit, Detached | 1,145 | 87.8% |
| Single Unit, Attached | 115 | 8.8% |
| 2 Unit Apartments | 23 | 1.8% |
| 3 or 4 Unit Apartments | 10 | 0.8% |
| 5 to 9 Unit Apartments | 0 | 0.0% |
| 10 or more Apartments | 0 | 0.0% |
| Mobile Home / Other | 11 | 0.8% |
| Total | 1,304 | 100.0% |
Housing Structures by Occupancy in Reno city Lamar County
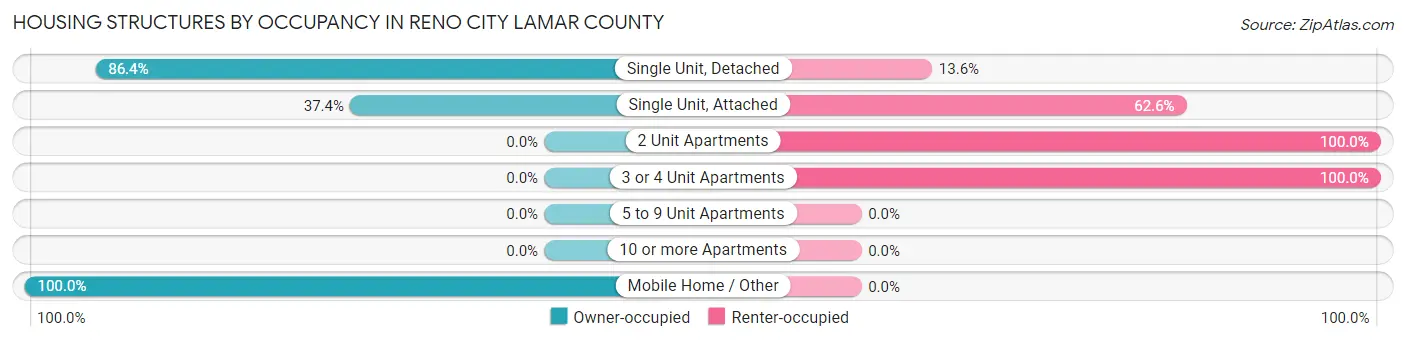
| Structure Type | Owner-occupied | Renter-occupied |
| Single Unit, Detached | 989 (86.4%) | 156 (13.6%) |
| Single Unit, Attached | 43 (37.4%) | 72 (62.6%) |
| 2 Unit Apartments | 0 (0.0%) | 23 (100.0%) |
| 3 or 4 Unit Apartments | 0 (0.0%) | 10 (100.0%) |
| 5 to 9 Unit Apartments | 0 (0.0%) | 0 (0.0%) |
| 10 or more Apartments | 0 (0.0%) | 0 (0.0%) |
| Mobile Home / Other | 11 (100.0%) | 0 (0.0%) |
| Total | 1,043 (80.0%) | 261 (20.0%) |
Housing Structures by Number of Rooms in Reno city Lamar County
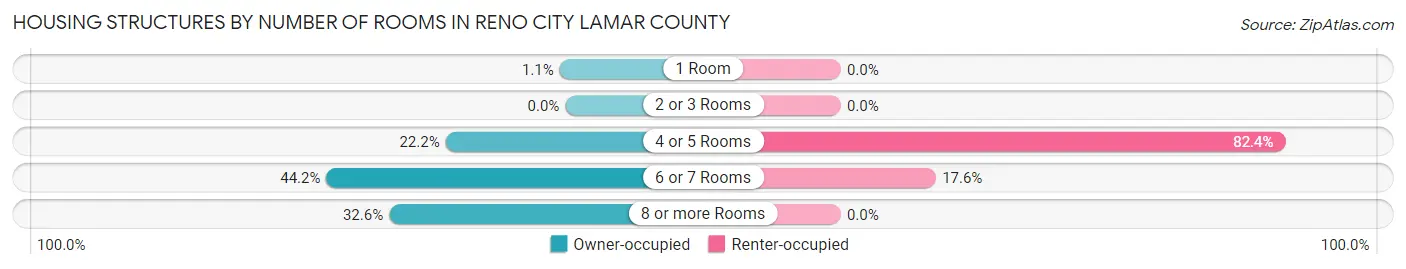
| Number of Rooms | Owner-occupied | Renter-occupied |
| 1 Room | 11 (1.1%) | 0 (0.0%) |
| 2 or 3 Rooms | 0 (0.0%) | 0 (0.0%) |
| 4 or 5 Rooms | 231 (22.2%) | 215 (82.4%) |
| 6 or 7 Rooms | 461 (44.2%) | 46 (17.6%) |
| 8 or more Rooms | 340 (32.6%) | 0 (0.0%) |
| Total | 1,043 (100.0%) | 261 (100.0%) |
Housing Structure by Heating Type in Reno city Lamar County
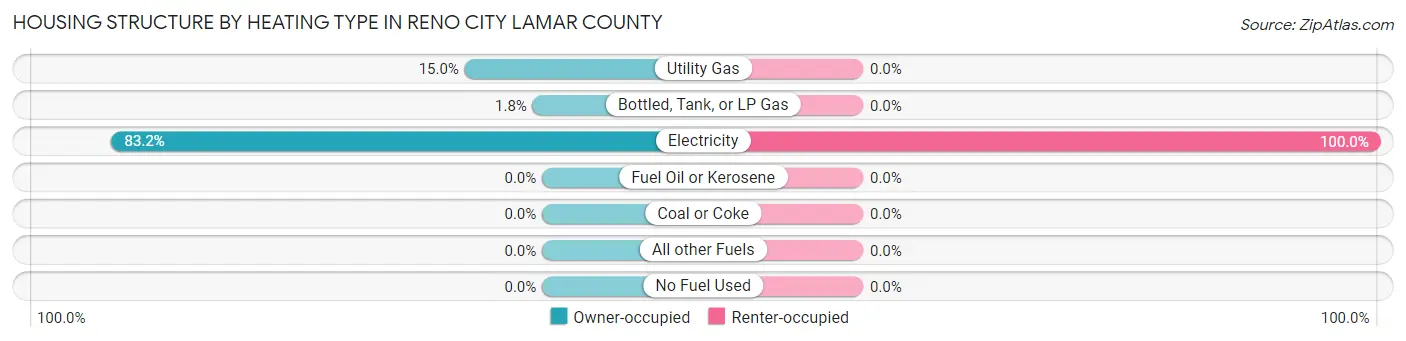
| Heating Type | Owner-occupied | Renter-occupied |
| Utility Gas | 156 (15.0%) | 0 (0.0%) |
| Bottled, Tank, or LP Gas | 19 (1.8%) | 0 (0.0%) |
| Electricity | 868 (83.2%) | 261 (100.0%) |
| Fuel Oil or Kerosene | 0 (0.0%) | 0 (0.0%) |
| Coal or Coke | 0 (0.0%) | 0 (0.0%) |
| All other Fuels | 0 (0.0%) | 0 (0.0%) |
| No Fuel Used | 0 (0.0%) | 0 (0.0%) |
| Total | 1,043 (100.0%) | 261 (100.0%) |
Household Vehicle Usage in Reno city Lamar County
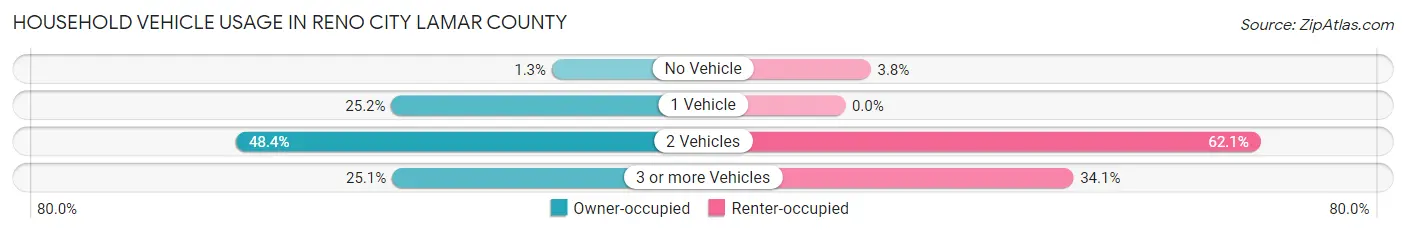
| Vehicles per Household | Owner-occupied | Renter-occupied |
| No Vehicle | 13 (1.3%) | 10 (3.8%) |
| 1 Vehicle | 263 (25.2%) | 0 (0.0%) |
| 2 Vehicles | 505 (48.4%) | 162 (62.1%) |
| 3 or more Vehicles | 262 (25.1%) | 89 (34.1%) |
| Total | 1,043 (100.0%) | 261 (100.0%) |
Real Estate & Mortgages in Reno city Lamar County
Real Estate and Mortgage Overview in Reno city Lamar County
| Characteristic | Without Mortgage | With Mortgage |
| Housing Units | 440 | 603 |
| Median Property Value | $204,800 | $199,700 |
| Median Household Income | $51,250 | $45 |
| Monthly Housing Costs | $534 | $0 |
| Real Estate Taxes | $1,727 | $20 |
Property Value by Mortgage Status in Reno city Lamar County
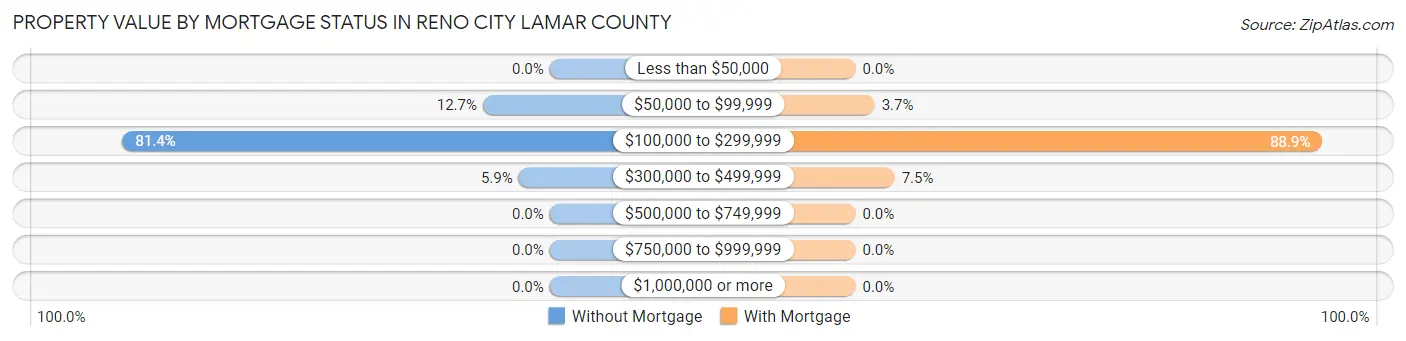
| Property Value | Without Mortgage | With Mortgage |
| Less than $50,000 | 0 (0.0%) | 0 (0.0%) |
| $50,000 to $99,999 | 56 (12.7%) | 22 (3.6%) |
| $100,000 to $299,999 | 358 (81.4%) | 536 (88.9%) |
| $300,000 to $499,999 | 26 (5.9%) | 45 (7.5%) |
| $500,000 to $749,999 | 0 (0.0%) | 0 (0.0%) |
| $750,000 to $999,999 | 0 (0.0%) | 0 (0.0%) |
| $1,000,000 or more | 0 (0.0%) | 0 (0.0%) |
| Total | 440 (100.0%) | 603 (100.0%) |
Household Income by Mortgage Status in Reno city Lamar County
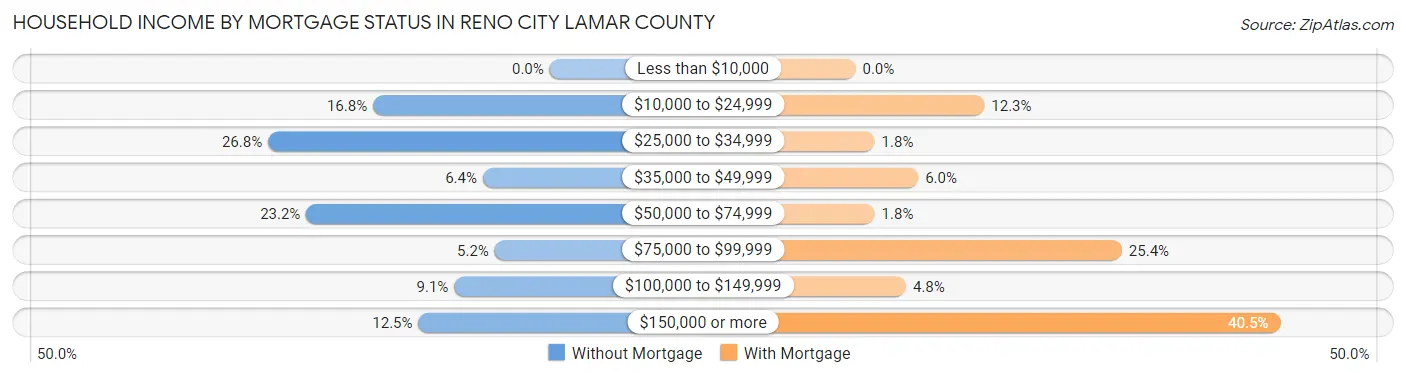
| Household Income | Without Mortgage | With Mortgage |
| Less than $10,000 | 0 (0.0%) | 0 (0.0%) |
| $10,000 to $24,999 | 74 (16.8%) | 74 (12.3%) |
| $25,000 to $34,999 | 118 (26.8%) | 11 (1.8%) |
| $35,000 to $49,999 | 28 (6.4%) | 36 (6.0%) |
| $50,000 to $74,999 | 102 (23.2%) | 11 (1.8%) |
| $75,000 to $99,999 | 23 (5.2%) | 153 (25.4%) |
| $100,000 to $149,999 | 40 (9.1%) | 29 (4.8%) |
| $150,000 or more | 55 (12.5%) | 244 (40.5%) |
| Total | 440 (100.0%) | 603 (100.0%) |
Property Value to Household Income Ratio in Reno city Lamar County
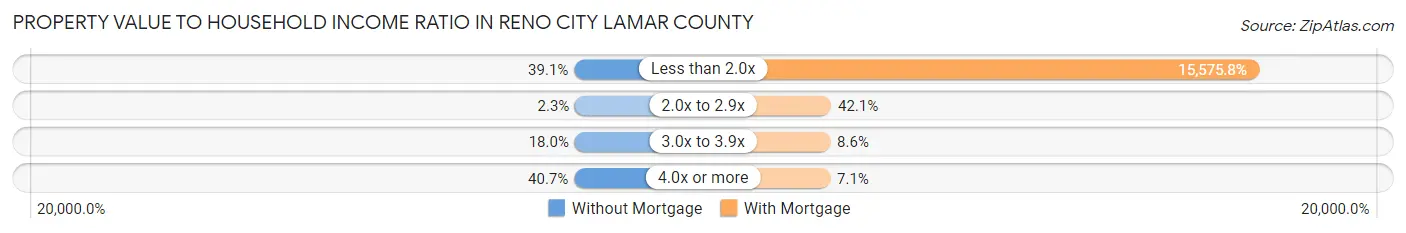
| Value-to-Income Ratio | Without Mortgage | With Mortgage |
| Less than 2.0x | 172 (39.1%) | 93,922 (15,575.8%) |
| 2.0x to 2.9x | 10 (2.3%) | 254 (42.1%) |
| 3.0x to 3.9x | 79 (17.9%) | 52 (8.6%) |
| 4.0x or more | 179 (40.7%) | 43 (7.1%) |
| Total | 440 (100.0%) | 603 (100.0%) |
Real Estate Taxes by Mortgage Status in Reno city Lamar County

| Property Taxes | Without Mortgage | With Mortgage |
| Less than $800 | 43 (9.8%) | 16 (2.6%) |
| $800 to $1,499 | 148 (33.6%) | 22 (3.6%) |
| $800 to $1,499 | 249 (56.6%) | 86 (14.3%) |
| Total | 440 (100.0%) | 603 (100.0%) |
Health & Disability in Reno city Lamar County
Health Insurance Coverage by Age in Reno city Lamar County
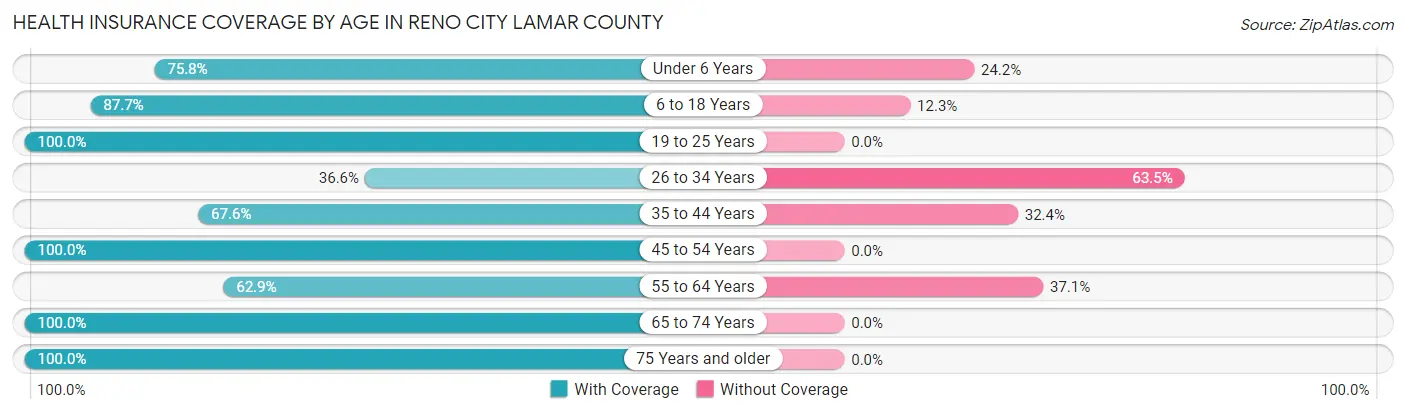
| Age Bracket | With Coverage | Without Coverage |
| Under 6 Years | 354 (75.8%) | 113 (24.2%) |
| 6 to 18 Years | 593 (87.7%) | 83 (12.3%) |
| 19 to 25 Years | 153 (100.0%) | 0 (0.0%) |
| 26 to 34 Years | 125 (36.5%) | 217 (63.4%) |
| 35 to 44 Years | 416 (67.6%) | 199 (32.4%) |
| 45 to 54 Years | 242 (100.0%) | 0 (0.0%) |
| 55 to 64 Years | 287 (62.9%) | 169 (37.1%) |
| 65 to 74 Years | 339 (100.0%) | 0 (0.0%) |
| 75 Years and older | 159 (100.0%) | 0 (0.0%) |
| Total | 2,668 (77.4%) | 781 (22.6%) |
Health Insurance Coverage by Citizenship Status in Reno city Lamar County
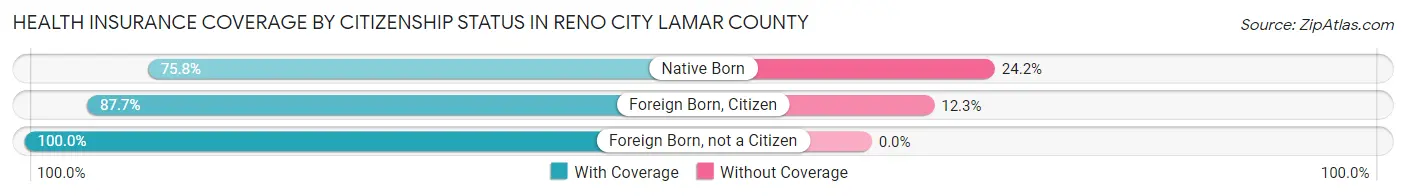
| Citizenship Status | With Coverage | Without Coverage |
| Native Born | 354 (75.8%) | 113 (24.2%) |
| Foreign Born, Citizen | 593 (87.7%) | 83 (12.3%) |
| Foreign Born, not a Citizen | 153 (100.0%) | 0 (0.0%) |
Health Insurance Coverage by Household Income in Reno city Lamar County
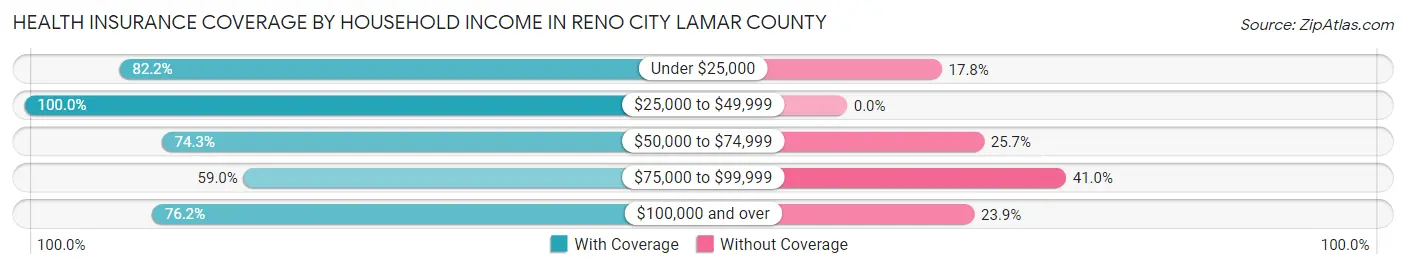
| Household Income | With Coverage | Without Coverage |
| Under $25,000 | 338 (82.2%) | 73 (17.8%) |
| $25,000 to $49,999 | 401 (100.0%) | 0 (0.0%) |
| $50,000 to $74,999 | 495 (74.3%) | 171 (25.7%) |
| $75,000 to $99,999 | 230 (59.0%) | 160 (41.0%) |
| $100,000 and over | 1,204 (76.1%) | 377 (23.8%) |
Public vs Private Health Insurance Coverage by Age in Reno city Lamar County
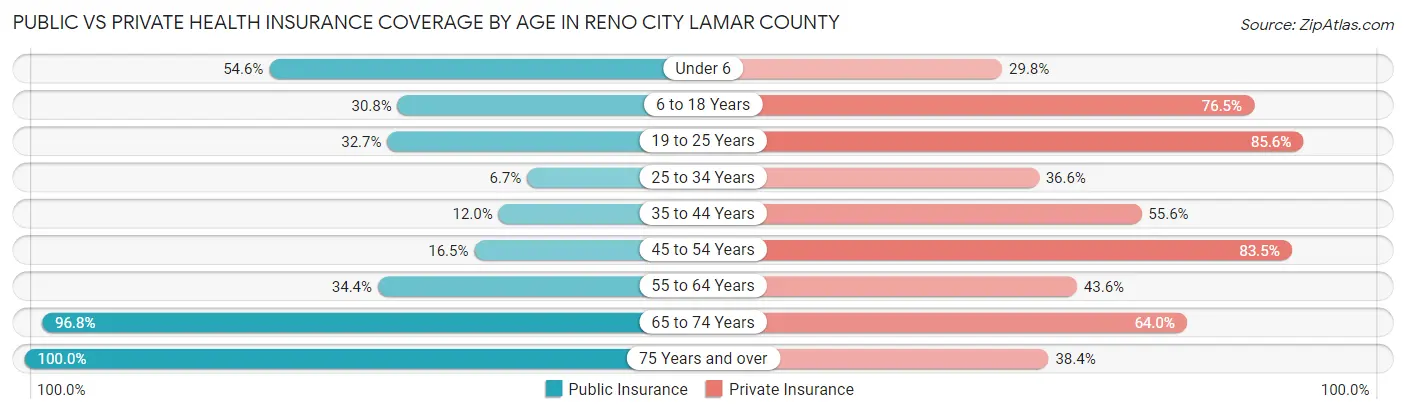
| Age Bracket | Public Insurance | Private Insurance |
| Under 6 | 255 (54.6%) | 139 (29.8%) |
| 6 to 18 Years | 208 (30.8%) | 517 (76.5%) |
| 19 to 25 Years | 50 (32.7%) | 131 (85.6%) |
| 25 to 34 Years | 23 (6.7%) | 125 (36.5%) |
| 35 to 44 Years | 74 (12.0%) | 342 (55.6%) |
| 45 to 54 Years | 40 (16.5%) | 202 (83.5%) |
| 55 to 64 Years | 157 (34.4%) | 199 (43.6%) |
| 65 to 74 Years | 328 (96.8%) | 217 (64.0%) |
| 75 Years and over | 159 (100.0%) | 61 (38.4%) |
| Total | 1,294 (37.5%) | 1,933 (56.0%) |
Disability Status by Sex by Age in Reno city Lamar County
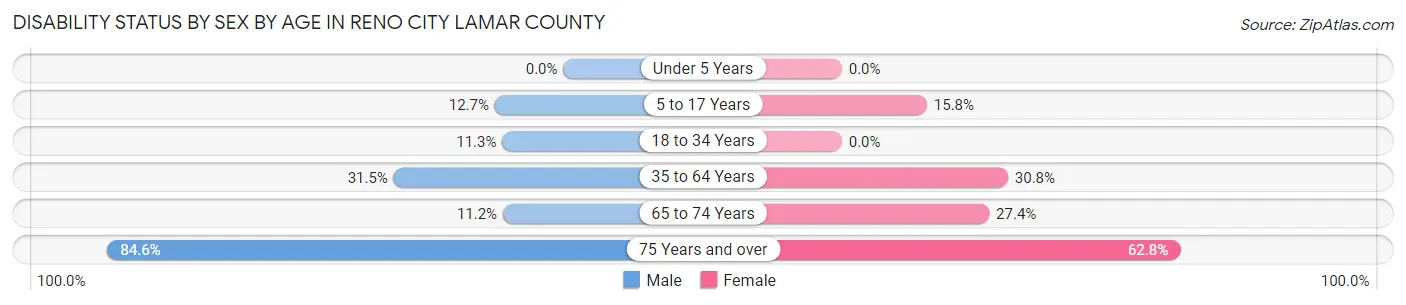
| Age Bracket | Male | Female |
| Under 5 Years | 0 (0.0%) | 0 (0.0%) |
| 5 to 17 Years | 64 (12.7%) | 36 (15.8%) |
| 18 to 34 Years | 23 (11.3%) | 0 (0.0%) |
| 35 to 64 Years | 205 (31.5%) | 204 (30.8%) |
| 65 to 74 Years | 13 (11.2%) | 61 (27.4%) |
| 75 Years and over | 55 (84.6%) | 59 (62.8%) |
Disability Class by Sex by Age in Reno city Lamar County
Disability Class: Hearing Difficulty
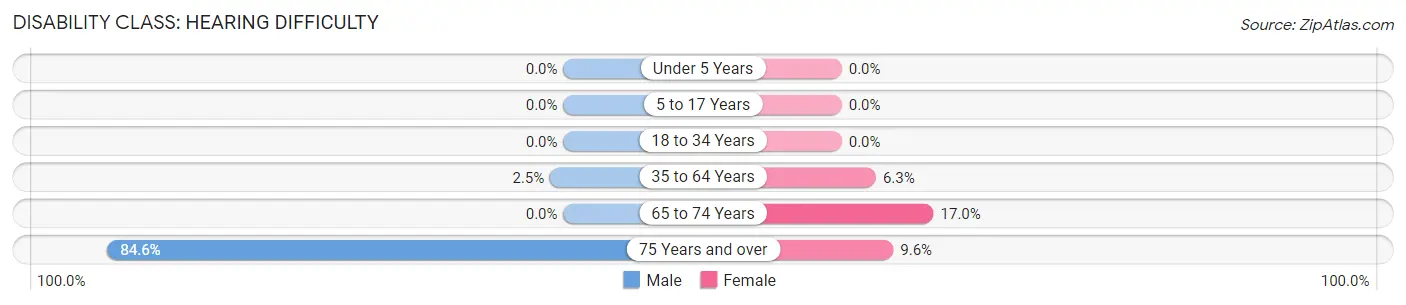
| Age Bracket | Male | Female |
| Under 5 Years | 0 (0.0%) | 0 (0.0%) |
| 5 to 17 Years | 0 (0.0%) | 0 (0.0%) |
| 18 to 34 Years | 0 (0.0%) | 0 (0.0%) |
| 35 to 64 Years | 16 (2.5%) | 42 (6.3%) |
| 65 to 74 Years | 0 (0.0%) | 38 (17.0%) |
| 75 Years and over | 55 (84.6%) | 9 (9.6%) |
Disability Class: Vision Difficulty
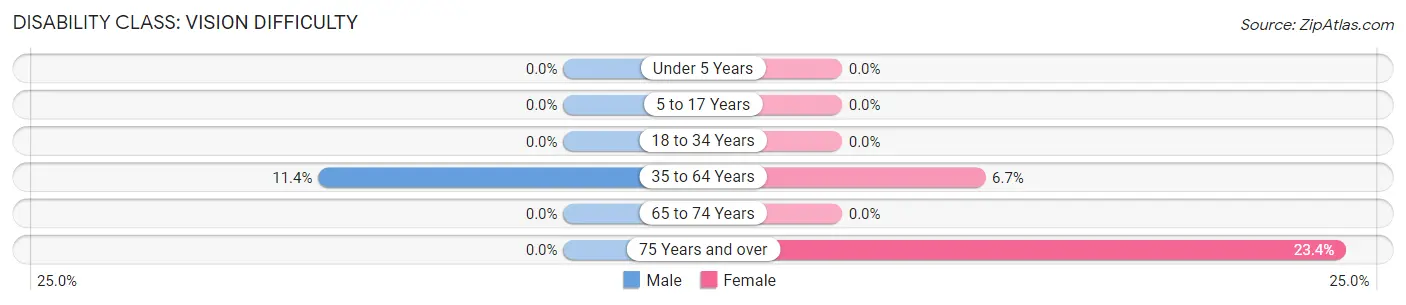
| Age Bracket | Male | Female |
| Under 5 Years | 0 (0.0%) | 0 (0.0%) |
| 5 to 17 Years | 0 (0.0%) | 0 (0.0%) |
| 18 to 34 Years | 0 (0.0%) | 0 (0.0%) |
| 35 to 64 Years | 74 (11.4%) | 44 (6.7%) |
| 65 to 74 Years | 0 (0.0%) | 0 (0.0%) |
| 75 Years and over | 0 (0.0%) | 22 (23.4%) |
Disability Class: Cognitive Difficulty
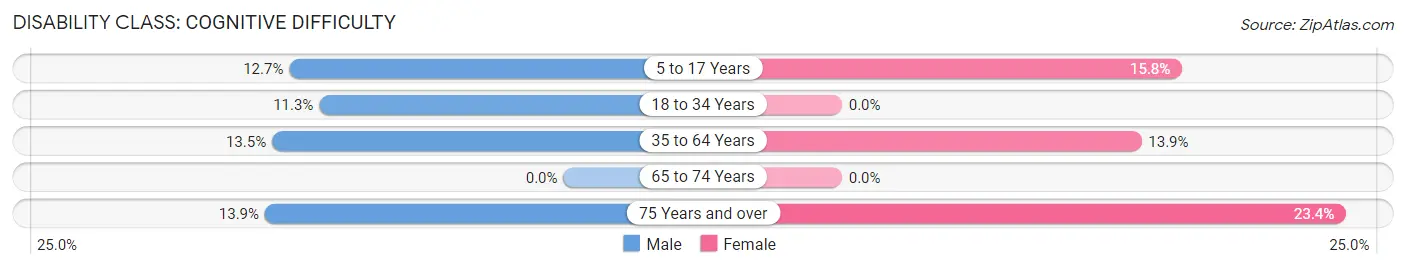
| Age Bracket | Male | Female |
| 5 to 17 Years | 64 (12.7%) | 36 (15.8%) |
| 18 to 34 Years | 23 (11.3%) | 0 (0.0%) |
| 35 to 64 Years | 88 (13.5%) | 92 (13.9%) |
| 65 to 74 Years | 0 (0.0%) | 0 (0.0%) |
| 75 Years and over | 9 (13.9%) | 22 (23.4%) |
Disability Class: Ambulatory Difficulty
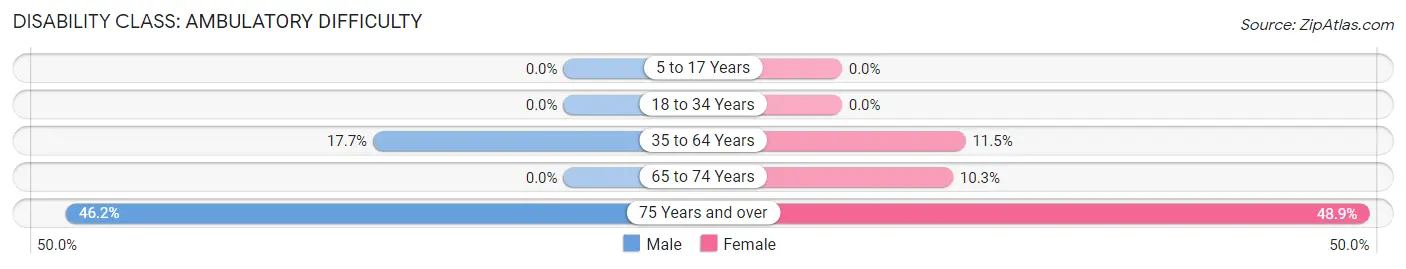
| Age Bracket | Male | Female |
| 5 to 17 Years | 0 (0.0%) | 0 (0.0%) |
| 18 to 34 Years | 0 (0.0%) | 0 (0.0%) |
| 35 to 64 Years | 115 (17.7%) | 76 (11.5%) |
| 65 to 74 Years | 0 (0.0%) | 23 (10.3%) |
| 75 Years and over | 30 (46.2%) | 46 (48.9%) |
Disability Class: Self-Care Difficulty
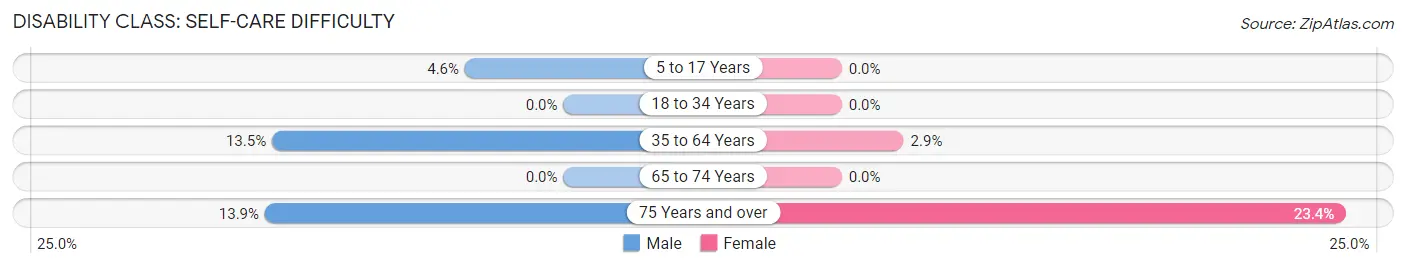
| Age Bracket | Male | Female |
| 5 to 17 Years | 23 (4.6%) | 0 (0.0%) |
| 18 to 34 Years | 0 (0.0%) | 0 (0.0%) |
| 35 to 64 Years | 88 (13.5%) | 19 (2.9%) |
| 65 to 74 Years | 0 (0.0%) | 0 (0.0%) |
| 75 Years and over | 9 (13.9%) | 22 (23.4%) |
Technology Access in Reno city Lamar County
Computing Device Access in Reno city Lamar County
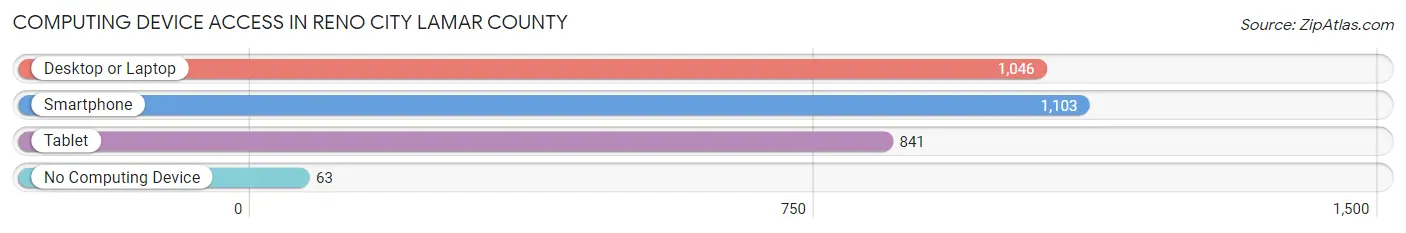
| Device Type | # Households | % Households |
| Desktop or Laptop | 1,046 | 80.2% |
| Smartphone | 1,103 | 84.6% |
| Tablet | 841 | 64.5% |
| No Computing Device | 63 | 4.8% |
| Total | 1,304 | 100.0% |
Internet Access in Reno city Lamar County
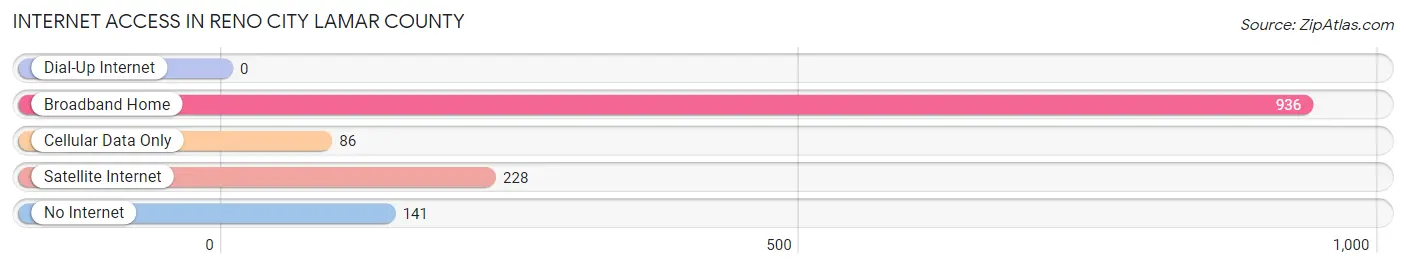
| Internet Type | # Households | % Households |
| Dial-Up Internet | 0 | 0.0% |
| Broadband Home | 936 | 71.8% |
| Cellular Data Only | 86 | 6.6% |
| Satellite Internet | 228 | 17.5% |
| No Internet | 141 | 10.8% |
| Total | 1,304 | 100.0% |
Reno city Lamar County Summary
Reno City is a small city located in Lamar County, Texas. It is situated in the northeastern part of the state, about 80 miles northeast of Dallas. The city has a population of approximately 1,500 people and covers an area of 1.2 square miles.
Geography
Reno City is located in the northeastern part of Lamar County, Texas. It is situated in the Red River Valley, which is part of the larger Great Plains region. The city is surrounded by rolling hills and is located near the Red River, which forms the border between Texas and Oklahoma. The city is located at an elevation of 645 feet above sea level.
The climate in Reno City is classified as humid subtropical, with hot summers and mild winters. The average annual temperature is around 68 degrees Fahrenheit, with an average high of around 90 degrees in the summer and an average low of around 40 degrees in the winter. The average annual precipitation is around 37 inches.
Economy
Reno City’s economy is largely based on agriculture and manufacturing. The city is home to several large agricultural operations, including cattle ranches, cotton farms, and grain elevators. The city also has several manufacturing plants, including a paper mill and a plastics factory.
The city also has a small retail sector, with several small shops and restaurants. The city is also home to a small airport, which serves the surrounding area.
Demographics
As of the 2010 census, Reno City had a population of 1,500 people. The racial makeup of the city was 94.7% White, 0.7% African American, 0.7% Native American, 0.3% Asian, 0.1% Pacific Islander, and 3.3% from other races. Hispanic or Latino of any race were 5.3% of the population.
The median household income in Reno City was $37,500, and the median family income was $41,250. The per capita income was $17,500. About 15.7% of families and 18.3% of the population were below the poverty line, including 25.7% of those under age 18 and 10.7% of those age 65 or over.
Conclusion
Reno City is a small city located in Lamar County, Texas. It has a population of approximately 1,500 people and covers an area of 1.2 square miles. The city’s economy is largely based on agriculture and manufacturing, and it has a small retail sector. The city’s population is mostly White, with a small percentage of African American, Native American, Asian, and Pacific Islander residents. The median household income in Reno City is $37,500, and the median family income is $41,250.
Common Questions
What is Per Capita Income in Reno city Lamar County?
Per Capita income in Reno city Lamar County is $29,803.
What is the Median Family Income in Reno city Lamar County?
Median Family Income in Reno city Lamar County is $88,219.
What is the Median Household income in Reno city Lamar County?
Median Household Income in Reno city Lamar County is $62,284.
What is Income or Wage Gap in Reno city Lamar County?
Income or Wage Gap in Reno city Lamar County is 62.7%.
Women in Reno city Lamar County earn 37.3 cents for every dollar earned by a man.
What is Inequality or Gini Index in Reno city Lamar County?
Inequality or Gini Index in Reno city Lamar County is 0.42.
What is the Total Population of Reno city Lamar County?
Total Population of Reno city Lamar County is 3,449.
What is the Total Male Population of Reno city Lamar County?
Total Male Population of Reno city Lamar County is 1,819.
What is the Total Female Population of Reno city Lamar County?
Total Female Population of Reno city Lamar County is 1,630.
What is the Ratio of Males per 100 Females in Reno city Lamar County?
There are 111.60 Males per 100 Females in Reno city Lamar County.
What is the Ratio of Females per 100 Males in Reno city Lamar County?
There are 89.61 Females per 100 Males in Reno city Lamar County.
What is the Median Population Age in Reno city Lamar County?
Median Population Age in Reno city Lamar County is 36.0 Years.
What is the Average Family Size in Reno city Lamar County
Average Family Size in Reno city Lamar County is 3.2 People.
What is the Average Household Size in Reno city Lamar County
Average Household Size in Reno city Lamar County is 2.6 People.
How Large is the Labor Force in Reno city Lamar County?
There are 1,608 People in the Labor Forcein in Reno city Lamar County.
What is the Percentage of People in the Labor Force in Reno city Lamar County?
64.7% of People are in the Labor Force in Reno city Lamar County.
What is the Unemployment Rate in Reno city Lamar County?
Unemployment Rate in Reno city Lamar County is 8.7%.