Zip Codes with the Lowest Poverty Level Among Children Under the Age of 5 in Texas
RELATED REPORTS & OPTIONS
Lowest Poverty | Child 0-5
Texas
Compare Zip Codes
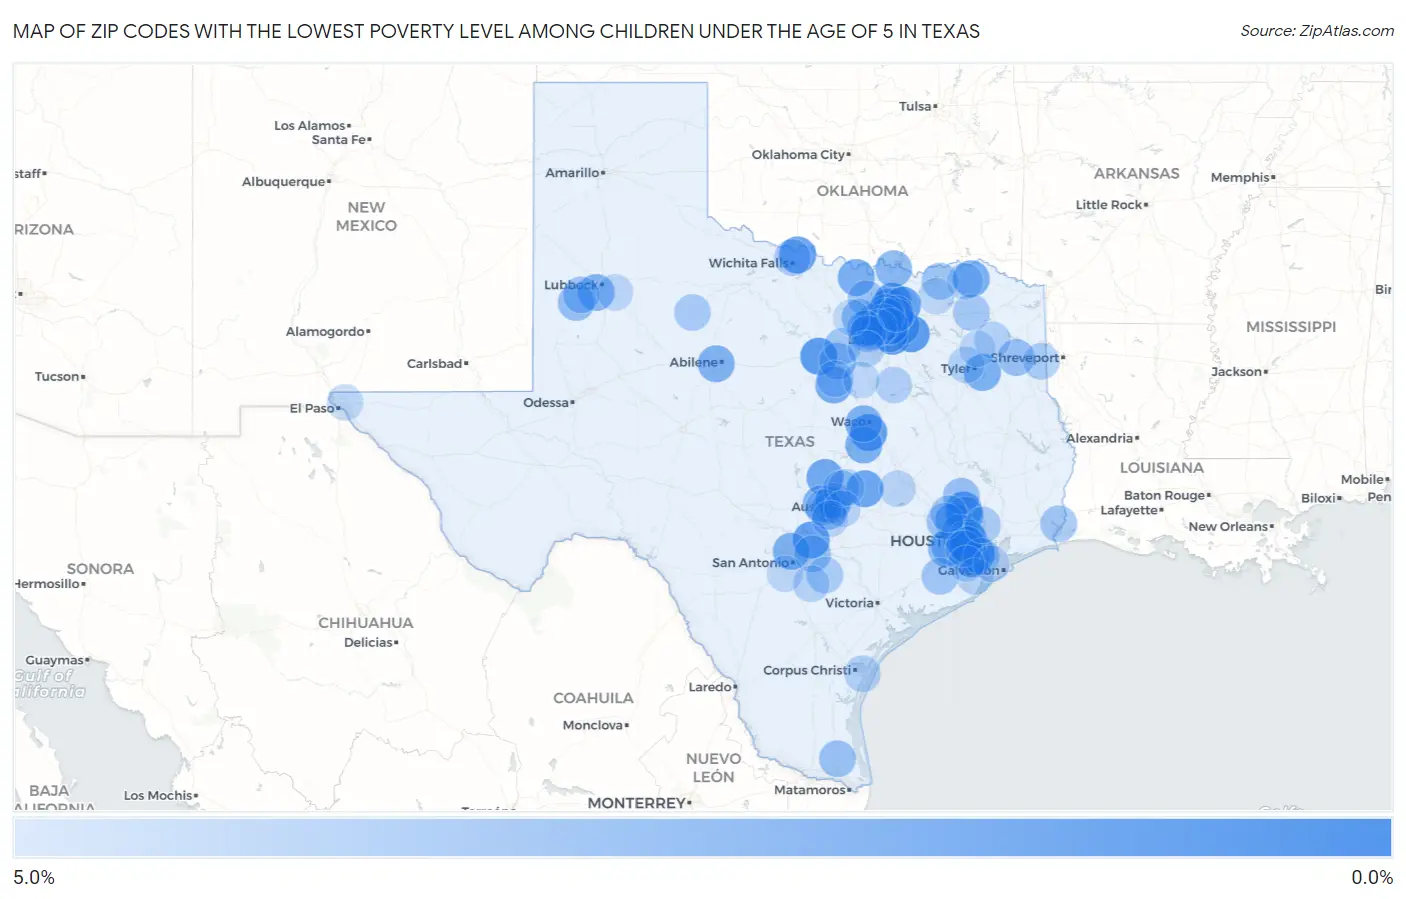
Map of Zip Codes with the Lowest Poverty Level Among Children Under the Age of 5 in Texas
5.0%
0.0%
Zip Codes with the Lowest Poverty Level Among Children Under the Age of 5 in Texas
| Zip Code | Child Poverty | vs State | vs National | |
| 1. | 77581 | 0.17% | 21.1%(-20.9)#1 | 18.1%(-17.9)#9 |
| 2. | 76462 | 0.35% | 21.1%(-20.7)#2 | 18.1%(-17.7)#21 |
| 3. | 75032 | 0.41% | 21.1%(-20.7)#3 | 18.1%(-17.7)#34 |
| 4. | 75078 | 0.48% | 21.1%(-20.6)#4 | 18.1%(-17.6)#55 |
| 5. | 75009 | 0.55% | 21.1%(-20.5)#5 | 18.1%(-17.5)#77 |
| 6. | 76655 | 0.62% | 21.1%(-20.5)#6 | 18.1%(-17.4)#98 |
| 7. | 76305 | 0.66% | 21.1%(-20.4)#7 | 18.1%(-17.4)#116 |
| 8. | 75454 | 0.67% | 21.1%(-20.4)#8 | 18.1%(-17.4)#123 |
| 9. | 78132 | 0.76% | 21.1%(-20.3)#9 | 18.1%(-17.3)#153 |
| 10. | 75214 | 0.76% | 21.1%(-20.3)#10 | 18.1%(-17.3)#156 |
| 11. | 77384 | 0.77% | 21.1%(-20.3)#11 | 18.1%(-17.3)#161 |
| 12. | 76578 | 0.93% | 21.1%(-20.2)#12 | 18.1%(-17.1)#249 |
| 13. | 75048 | 1.1% | 21.1%(-20.0)#13 | 18.1%(-17.0)#311 |
| 14. | 76092 | 1.1% | 21.1%(-20.0)#14 | 18.1%(-17.0)#316 |
| 15. | 78642 | 1.1% | 21.1%(-20.0)#15 | 18.1%(-17.0)#322 |
| 16. | 77578 | 1.2% | 21.1%(-19.9)#16 | 18.1%(-16.9)#366 |
| 17. | 76690 | 1.3% | 21.1%(-19.8)#17 | 18.1%(-16.7)#432 |
| 18. | 75013 | 1.4% | 21.1%(-19.7)#18 | 18.1%(-16.7)#456 |
| 19. | 75225 | 1.4% | 21.1%(-19.7)#19 | 18.1%(-16.7)#476 |
| 20. | 76252 | 1.5% | 21.1%(-19.6)#20 | 18.1%(-16.6)#518 |
| 21. | 75416 | 1.5% | 21.1%(-19.6)#21 | 18.1%(-16.6)#526 |
| 22. | 75033 | 1.5% | 21.1%(-19.5)#22 | 18.1%(-16.5)#561 |
| 23. | 75707 | 1.6% | 21.1%(-19.5)#23 | 18.1%(-16.5)#583 |
| 24. | 77380 | 1.6% | 21.1%(-19.5)#24 | 18.1%(-16.5)#584 |
| 25. | 78248 | 1.6% | 21.1%(-19.5)#25 | 18.1%(-16.5)#594 |
| 26. | 76579 | 1.6% | 21.1%(-19.5)#26 | 18.1%(-16.4)#603 |
| 27. | 78738 | 1.6% | 21.1%(-19.5)#27 | 18.1%(-16.4)#613 |
| 28. | 76712 | 1.7% | 21.1%(-19.4)#28 | 18.1%(-16.4)#639 |
| 29. | 78746 | 1.7% | 21.1%(-19.4)#29 | 18.1%(-16.4)#649 |
| 30. | 79607 | 1.7% | 21.1%(-19.3)#30 | 18.1%(-16.3)#674 |
| 31. | 77377 | 1.8% | 21.1%(-19.3)#31 | 18.1%(-16.3)#692 |
| 32. | 75028 | 1.8% | 21.1%(-19.3)#32 | 18.1%(-16.3)#710 |
| 33. | 77056 | 1.8% | 21.1%(-19.3)#33 | 18.1%(-16.2)#718 |
| 34. | 77041 | 1.8% | 21.1%(-19.2)#34 | 18.1%(-16.2)#734 |
| 35. | 79424 | 1.9% | 21.1%(-19.2)#35 | 18.1%(-16.2)#761 |
| 36. | 77007 | 1.9% | 21.1%(-19.2)#36 | 18.1%(-16.2)#766 |
| 37. | 77407 | 2.0% | 21.1%(-19.1)#37 | 18.1%(-16.1)#797 |
| 38. | 75076 | 2.0% | 21.1%(-19.1)#38 | 18.1%(-16.0)#841 |
| 39. | 77024 | 2.1% | 21.1%(-18.9)#39 | 18.1%(-15.9)#934 |
| 40. | 77008 | 2.2% | 21.1%(-18.8)#40 | 18.1%(-15.8)#1,001 |
| 41. | 78749 | 2.3% | 21.1%(-18.8)#41 | 18.1%(-15.8)#1,003 |
| 42. | 75034 | 2.3% | 21.1%(-18.8)#42 | 18.1%(-15.8)#1,025 |
| 43. | 77406 | 2.3% | 21.1%(-18.7)#43 | 18.1%(-15.7)#1,057 |
| 44. | 77401 | 2.4% | 21.1%(-18.7)#44 | 18.1%(-15.7)#1,071 |
| 45. | 76247 | 2.4% | 21.1%(-18.7)#45 | 18.1%(-15.7)#1,075 |
| 46. | 76049 | 2.5% | 21.1%(-18.6)#46 | 18.1%(-15.6)#1,138 |
| 47. | 75010 | 2.5% | 21.1%(-18.6)#47 | 18.1%(-15.6)#1,144 |
| 48. | 75248 | 2.5% | 21.1%(-18.6)#48 | 18.1%(-15.6)#1,152 |
| 49. | 79345 | 2.5% | 21.1%(-18.6)#49 | 18.1%(-15.5)#1,181 |
| 50. | 75650 | 2.6% | 21.1%(-18.5)#50 | 18.1%(-15.5)#1,208 |
| 51. | 77318 | 2.6% | 21.1%(-18.5)#51 | 18.1%(-15.5)#1,235 |
| 52. | 76034 | 2.6% | 21.1%(-18.5)#52 | 18.1%(-15.4)#1,240 |
| 53. | 78124 | 2.7% | 21.1%(-18.4)#53 | 18.1%(-15.4)#1,268 |
| 54. | 77025 | 2.7% | 21.1%(-18.4)#54 | 18.1%(-15.4)#1,288 |
| 55. | 78569 | 2.7% | 21.1%(-18.4)#55 | 18.1%(-15.4)#1,294 |
| 56. | 77447 | 2.7% | 21.1%(-18.4)#56 | 18.1%(-15.3)#1,307 |
| 57. | 76266 | 2.7% | 21.1%(-18.4)#57 | 18.1%(-15.3)#1,309 |
| 58. | 79358 | 2.7% | 21.1%(-18.4)#58 | 18.1%(-15.3)#1,311 |
| 59. | 75446 | 2.8% | 21.1%(-18.3)#59 | 18.1%(-15.2)#1,390 |
| 60. | 77546 | 2.9% | 21.1%(-18.2)#60 | 18.1%(-15.2)#1,418 |
| 61. | 77420 | 2.9% | 21.1%(-18.1)#61 | 18.1%(-15.1)#1,465 |
| 62. | 75019 | 3.0% | 21.1%(-18.1)#62 | 18.1%(-15.1)#1,476 |
| 63. | 77611 | 3.0% | 21.1%(-18.1)#63 | 18.1%(-15.1)#1,481 |
| 64. | 76008 | 3.0% | 21.1%(-18.1)#64 | 18.1%(-15.1)#1,487 |
| 65. | 76248 | 3.0% | 21.1%(-18.1)#65 | 18.1%(-15.0)#1,509 |
| 66. | 75478 | 3.0% | 21.1%(-18.1)#66 | 18.1%(-15.0)#1,523 |
| 67. | 78731 | 3.1% | 21.1%(-18.0)#67 | 18.1%(-15.0)#1,545 |
| 68. | 77355 | 3.1% | 21.1%(-18.0)#68 | 18.1%(-15.0)#1,568 |
| 69. | 78665 | 3.1% | 21.1%(-18.0)#69 | 18.1%(-14.9)#1,592 |
| 70. | 77085 | 3.2% | 21.1%(-17.9)#70 | 18.1%(-14.9)#1,617 |
| 71. | 76054 | 3.2% | 21.1%(-17.9)#71 | 18.1%(-14.9)#1,624 |
| 72. | 79502 | 3.2% | 21.1%(-17.9)#72 | 18.1%(-14.9)#1,643 |
| 73. | 76311 | 3.2% | 21.1%(-17.9)#73 | 18.1%(-14.8)#1,648 |
| 74. | 78160 | 3.3% | 21.1%(-17.8)#74 | 18.1%(-14.8)#1,707 |
| 75. | 77346 | 3.3% | 21.1%(-17.8)#75 | 18.1%(-14.7)#1,715 |
| 76. | 75692 | 3.3% | 21.1%(-17.8)#76 | 18.1%(-14.7)#1,719 |
| 77. | 76043 | 3.4% | 21.1%(-17.7)#77 | 18.1%(-14.6)#1,784 |
| 78. | 76060 | 3.5% | 21.1%(-17.6)#78 | 18.1%(-14.6)#1,816 |
| 79. | 76626 | 3.5% | 21.1%(-17.5)#79 | 18.1%(-14.5)#1,848 |
| 80. | 78419 | 3.6% | 21.1%(-17.5)#80 | 18.1%(-14.5)#1,865 |
| 81. | 75704 | 3.6% | 21.1%(-17.5)#81 | 18.1%(-14.5)#1,875 |
| 82. | 75644 | 3.6% | 21.1%(-17.5)#82 | 18.1%(-14.5)#1,879 |
| 83. | 78736 | 3.6% | 21.1%(-17.5)#83 | 18.1%(-14.5)#1,884 |
| 84. | 78114 | 3.6% | 21.1%(-17.5)#84 | 18.1%(-14.4)#1,903 |
| 85. | 77534 | 3.6% | 21.1%(-17.4)#85 | 18.1%(-14.4)#1,917 |
| 86. | 78634 | 3.7% | 21.1%(-17.4)#86 | 18.1%(-14.4)#1,942 |
| 87. | 75462 | 3.7% | 21.1%(-17.4)#87 | 18.1%(-14.4)#1,962 |
| 88. | 78725 | 3.8% | 21.1%(-17.3)#88 | 18.1%(-14.3)#2,003 |
| 89. | 75070 | 3.8% | 21.1%(-17.3)#89 | 18.1%(-14.3)#2,013 |
| 90. | 77836 | 3.8% | 21.1%(-17.3)#90 | 18.1%(-14.3)#2,022 |
| 91. | 78610 | 3.8% | 21.1%(-17.3)#91 | 18.1%(-14.2)#2,031 |
| 92. | 77591 | 3.9% | 21.1%(-17.2)#92 | 18.1%(-14.2)#2,083 |
| 93. | 75765 | 3.9% | 21.1%(-17.2)#93 | 18.1%(-14.2)#2,097 |
| 94. | 78073 | 3.9% | 21.1%(-17.1)#94 | 18.1%(-14.1)#2,120 |
| 95. | 79364 | 3.9% | 21.1%(-17.1)#95 | 18.1%(-14.1)#2,123 |
| 96. | 77583 | 4.0% | 21.1%(-17.1)#96 | 18.1%(-14.1)#2,133 |
| 97. | 76636 | 4.0% | 21.1%(-17.1)#97 | 18.1%(-14.1)#2,138 |
| 98. | 79908 | 4.0% | 21.1%(-17.1)#98 | 18.1%(-14.1)#2,140 |
| 99. | 75449 | 4.0% | 21.1%(-17.1)#99 | 18.1%(-14.1)#2,175 |
| 100. | 76078 | 4.1% | 21.1%(-17.0)#100 | 18.1%(-14.0)#2,224 |
Common Questions
What are the Top 10 Zip Codes with the Lowest Poverty Level Among Children Under the Age of 5 in Texas?
Top 10 Zip Codes with the Lowest Poverty Level Among Children Under the Age of 5 in Texas are:
What zip code has the Lowest Poverty Level Among Children Under the Age of 5 in Texas?
77581 has the Lowest Poverty Level Among Children Under the Age of 5 in Texas with 0.17%.
What is the Poverty Level Among Children Under the Age of 5 in the State of Texas?
Poverty Level Among Children Under the Age of 5 in Texas is 21.1%.
What is the Poverty Level Among Children Under the Age of 5 in the United States?
Poverty Level Among Children Under the Age of 5 in the United States is 18.1%.