Santa Fe, TX Map & Demographics
Santa Fe Map
Santa Fe Overview
$41,479
PER CAPITA INCOME
$96,775
AVG FAMILY INCOME
$91,209
AVG HOUSEHOLD INCOME
16.8%
WAGE / INCOME GAP [ % ]
83.2¢/ $1
WAGE / INCOME GAP [ $ ]
$10,832
FAMILY INCOME DEFICIT
0.44
INEQUALITY / GINI INDEX
12,792
TOTAL POPULATION
6,298
MALE POPULATION
6,494
FEMALE POPULATION
96.98
MALES / 100 FEMALES
103.11
FEMALES / 100 MALES
42.7
MEDIAN AGE
3.1
AVG FAMILY SIZE
2.8
AVG HOUSEHOLD SIZE
6,444
LABOR FORCE [ PEOPLE ]
60.0%
PERCENT IN LABOR FORCE
7.8%
UNEMPLOYMENT RATE
Santa Fe Area Codes
Income in Santa Fe
Income Overview in Santa Fe
Per Capita Income in Santa Fe is $41,479, while median incomes of families and households are $96,775 and $91,209 respectively.
| Characteristic | Number | Measure |
| Per Capita Income | 12,792 | $41,479 |
| Median Family Income | 3,337 | $96,775 |
| Mean Family Income | 3,337 | $124,428 |
| Median Household Income | 4,631 | $91,209 |
| Mean Household Income | 4,631 | $114,245 |
| Income Deficit | 3,337 | $10,832 |
| Wage / Income Gap (%) | 12,792 | 16.76% |
| Wage / Income Gap ($) | 12,792 | 83.24¢ per $1 |
| Gini / Inequality Index | 12,792 | 0.44 |
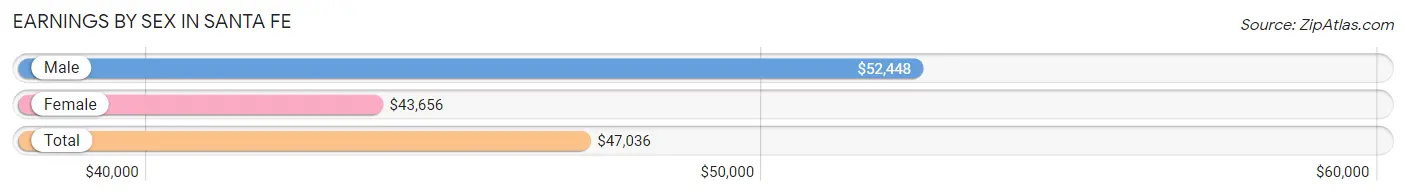
Earnings by Sex in Santa Fe
Average Earnings in Santa Fe are $47,036, $52,448 for men and $43,656 for women, a difference of 16.8%.
| Sex | Number | Average Earnings |
| Male | 3,401 (52.1%) | $52,448 |
| Female | 3,125 (47.9%) | $43,656 |
| Total | 6,526 (100.0%) | $47,036 |
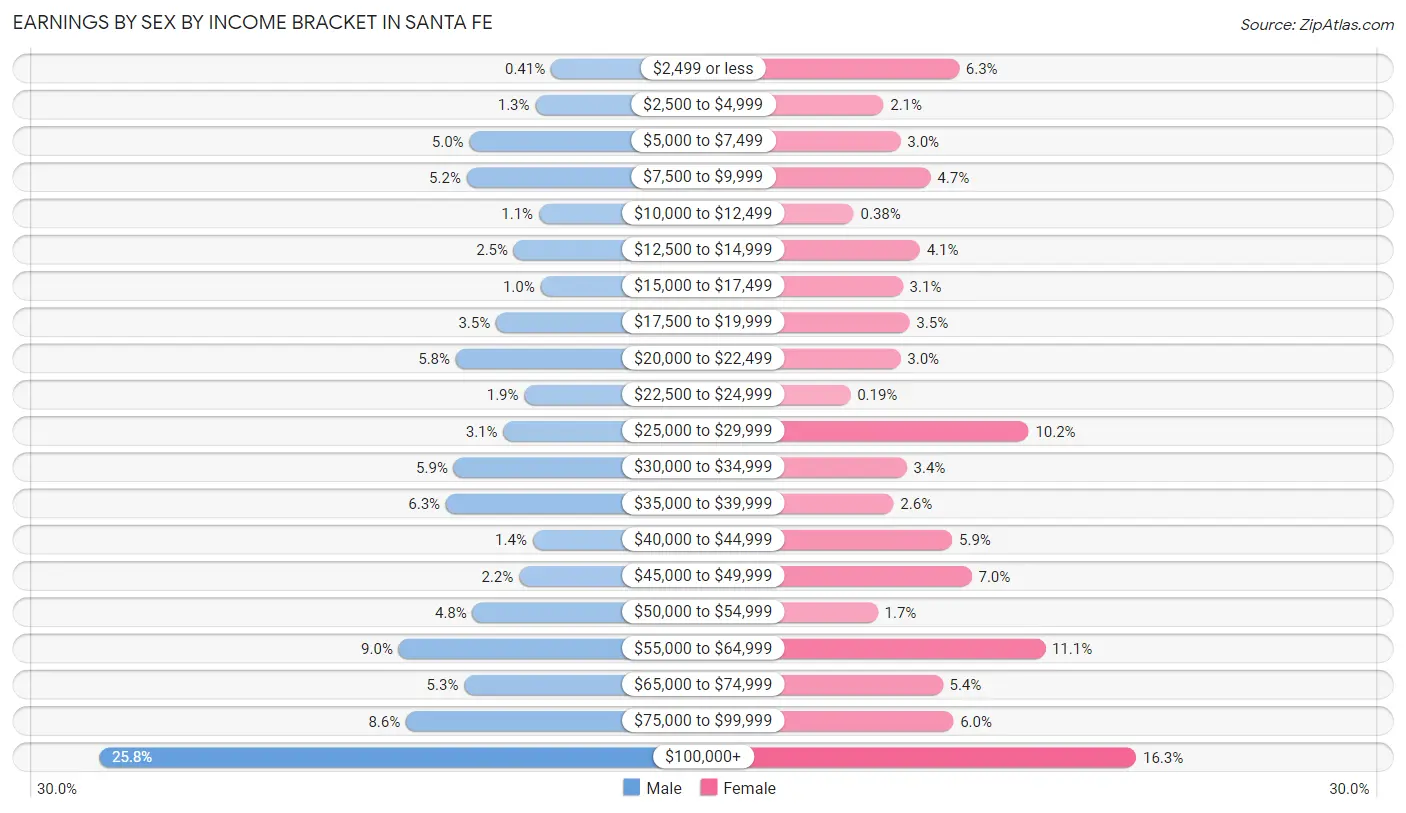
Earnings by Sex by Income Bracket in Santa Fe
The most common earnings brackets in Santa Fe are $100,000+ for men (878 | 25.8%) and $100,000+ for women (508 | 16.3%).
| Income | Male | Female |
| $2,499 or less | 14 (0.4%) | 197 (6.3%) |
| $2,500 to $4,999 | 44 (1.3%) | 64 (2.1%) |
| $5,000 to $7,499 | 170 (5.0%) | 94 (3.0%) |
| $7,500 to $9,999 | 175 (5.1%) | 147 (4.7%) |
| $10,000 to $12,499 | 37 (1.1%) | 12 (0.4%) |
| $12,500 to $14,999 | 85 (2.5%) | 128 (4.1%) |
| $15,000 to $17,499 | 34 (1.0%) | 98 (3.1%) |
| $17,500 to $19,999 | 119 (3.5%) | 110 (3.5%) |
| $20,000 to $22,499 | 196 (5.8%) | 94 (3.0%) |
| $22,500 to $24,999 | 65 (1.9%) | 6 (0.2%) |
| $25,000 to $29,999 | 105 (3.1%) | 319 (10.2%) |
| $30,000 to $34,999 | 200 (5.9%) | 105 (3.4%) |
| $35,000 to $39,999 | 215 (6.3%) | 82 (2.6%) |
| $40,000 to $44,999 | 49 (1.4%) | 185 (5.9%) |
| $45,000 to $49,999 | 75 (2.2%) | 219 (7.0%) |
| $50,000 to $54,999 | 164 (4.8%) | 54 (1.7%) |
| $55,000 to $64,999 | 305 (9.0%) | 348 (11.1%) |
| $65,000 to $74,999 | 180 (5.3%) | 168 (5.4%) |
| $75,000 to $99,999 | 291 (8.6%) | 187 (6.0%) |
| $100,000+ | 878 (25.8%) | 508 (16.3%) |
| Total | 3,401 (100.0%) | 3,125 (100.0%) |
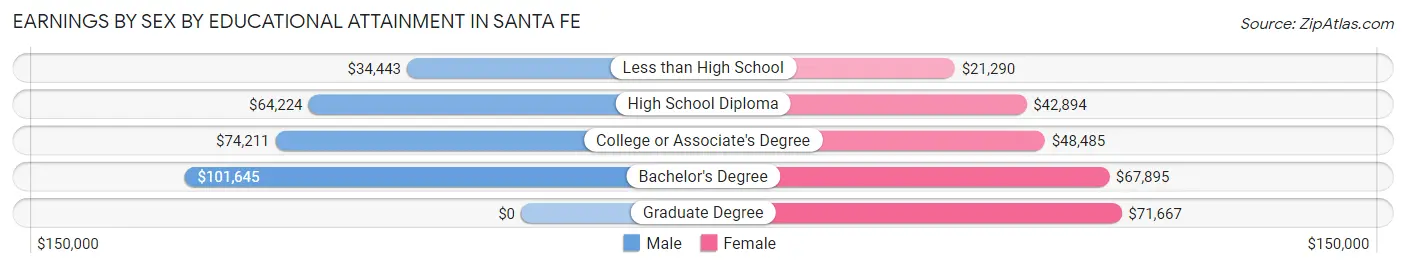
Earnings by Sex by Educational Attainment in Santa Fe
Average earnings in Santa Fe are $59,028 for men and $45,236 for women, a difference of 23.4%. Men with an educational attainment of bachelor's degree enjoy the highest average annual earnings of $101,645, while those with less than high school education earn the least with $34,443. Women with an educational attainment of graduate degree earn the most with the average annual earnings of $71,667, while those with less than high school education have the smallest earnings of $21,290.
| Educational Attainment | Male Income | Female Income |
| Less than High School | $34,443 | $21,290 |
| High School Diploma | $64,224 | $42,894 |
| College or Associate's Degree | $74,211 | $48,485 |
| Bachelor's Degree | $101,645 | $67,895 |
| Graduate Degree | - | - |
| Total | $59,028 | $45,236 |
Family Income in Santa Fe
Family Income Brackets in Santa Fe
According to the Santa Fe family income data, there are 637 families falling into the $75,000 to $99,999 income range, which is the most common income bracket and makes up 19.1% of all families. Conversely, the $15,000 to $24,999 income bracket is the least frequent group with only 40 families (1.2%) belonging to this category.
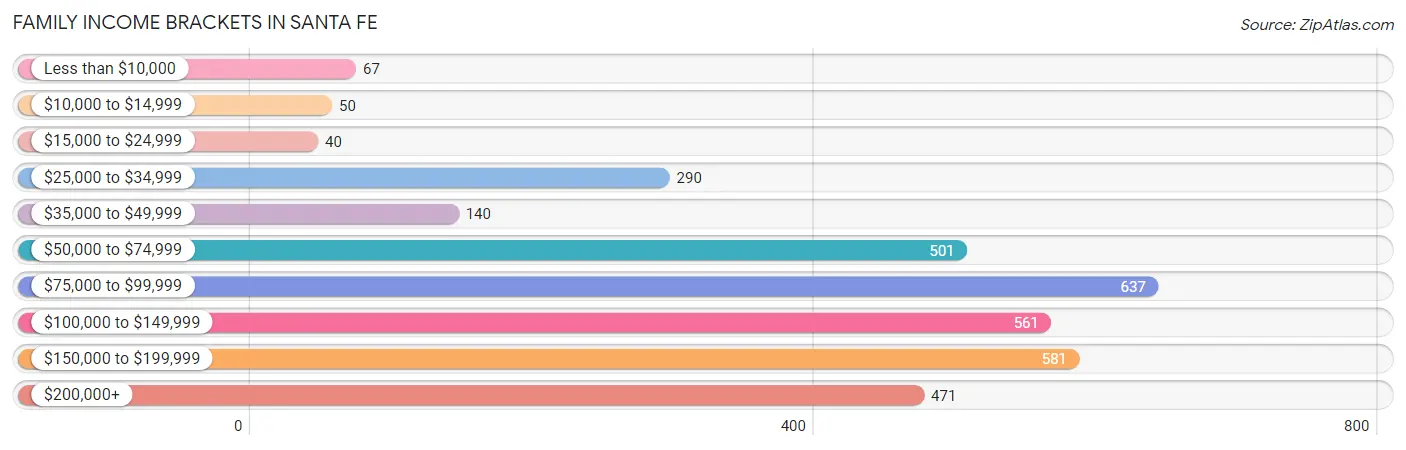
| Income Bracket | # Families | % Families |
| Less than $10,000 | 67 | 2.0% |
| $10,000 to $14,999 | 50 | 1.5% |
| $15,000 to $24,999 | 40 | 1.2% |
| $25,000 to $34,999 | 290 | 8.7% |
| $35,000 to $49,999 | 140 | 4.2% |
| $50,000 to $74,999 | 501 | 15.0% |
| $75,000 to $99,999 | 637 | 19.1% |
| $100,000 to $149,999 | 561 | 16.8% |
| $150,000 to $199,999 | 581 | 17.4% |
| $200,000+ | 471 | 14.1% |
Family Income by Famaliy Size in Santa Fe
7+ person families (29 | 0.9%) account for the highest median family income in Santa Fe with $156,319 per family, while 2-person families (1,357 | 40.7%) have the highest median income of $41,498 per family member.
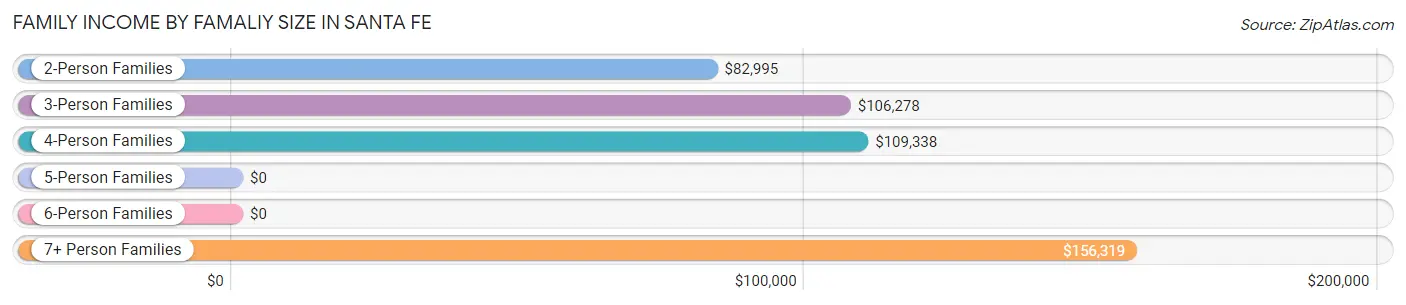
| Income Bracket | # Families | Median Income |
| 2-Person Families | 1,357 (40.7%) | $82,995 |
| 3-Person Families | 1,055 (31.6%) | $106,278 |
| 4-Person Families | 433 (13.0%) | $109,338 |
| 5-Person Families | 397 (11.9%) | $0 |
| 6-Person Families | 66 (2.0%) | $0 |
| 7+ Person Families | 29 (0.9%) | $156,319 |
| Total | 3,337 (100.0%) | $96,775 |
Family Income by Number of Earners in Santa Fe
The median family income in Santa Fe is $96,775, with families comprising 3+ earners (479) having the highest median family income of $184,596, while families with no earners (472) have the lowest median family income of $62,500, accounting for 14.3% and 14.1% of families, respectively.
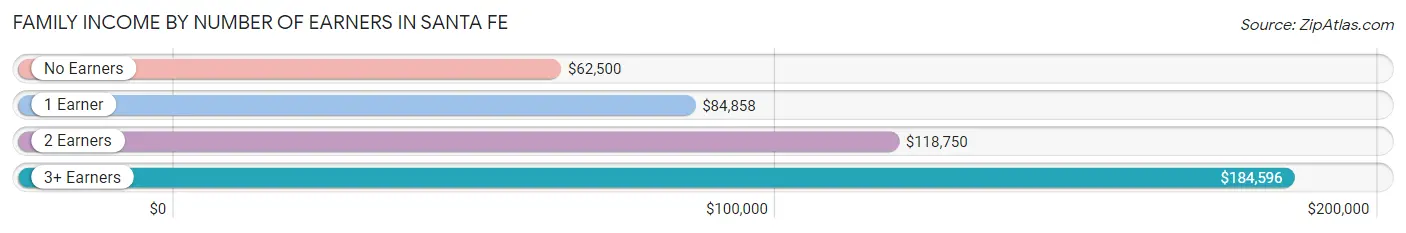
| Number of Earners | # Families | Median Income |
| No Earners | 472 (14.1%) | $62,500 |
| 1 Earner | 1,332 (39.9%) | $84,858 |
| 2 Earners | 1,054 (31.6%) | $118,750 |
| 3+ Earners | 479 (14.3%) | $184,596 |
| Total | 3,337 (100.0%) | $96,775 |
Household Income in Santa Fe
Household Income Brackets in Santa Fe
With 857 households falling in the category, the $75,000 to $99,999 income range is the most frequent in Santa Fe, accounting for 18.5% of all households. In contrast, only 102 households (2.2%) fall into the $10,000 to $14,999 income bracket, making it the least populous group.
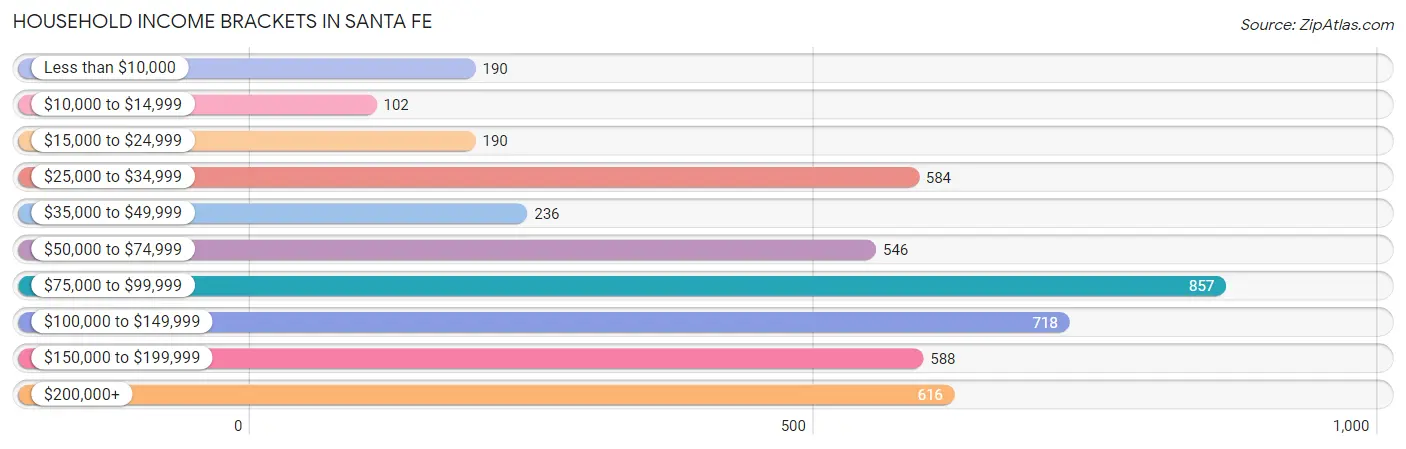
| Income Bracket | # Households | % Households |
| Less than $10,000 | 190 | 4.1% |
| $10,000 to $14,999 | 102 | 2.2% |
| $15,000 to $24,999 | 190 | 4.1% |
| $25,000 to $34,999 | 584 | 12.6% |
| $35,000 to $49,999 | 236 | 5.1% |
| $50,000 to $74,999 | 546 | 11.8% |
| $75,000 to $99,999 | 857 | 18.5% |
| $100,000 to $149,999 | 718 | 15.5% |
| $150,000 to $199,999 | 588 | 12.7% |
| $200,000+ | 616 | 13.3% |
Household Income by Householder Age in Santa Fe
The median household income in Santa Fe is $91,209, with the highest median household income of $106,629 found in the 25 to 44 years age bracket for the primary householder. A total of 1,152 households (24.9%) fall into this category. Meanwhile, the 15 to 24 years age bracket for the primary householder has the lowest median household income of $0, with 73 households (1.6%) in this group.
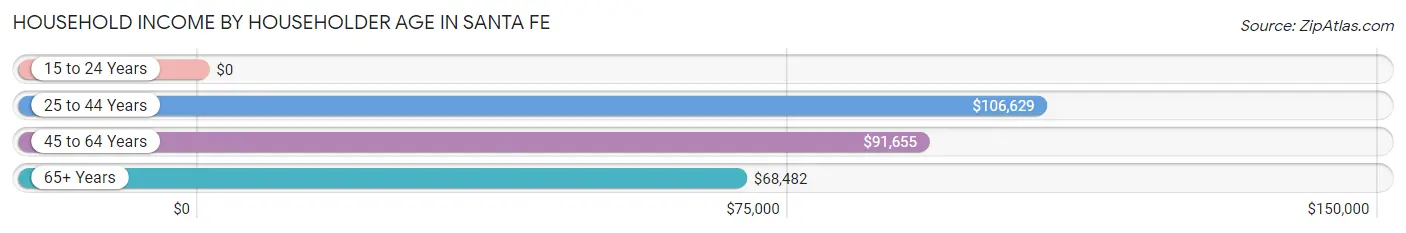
| Income Bracket | # Households | Median Income |
| 15 to 24 Years | 73 (1.6%) | $0 |
| 25 to 44 Years | 1,152 (24.9%) | $106,629 |
| 45 to 64 Years | 2,148 (46.4%) | $91,655 |
| 65+ Years | 1,258 (27.2%) | $68,482 |
| Total | 4,631 (100.0%) | $91,209 |
Poverty in Santa Fe
Income Below Poverty by Sex and Age in Santa Fe
With 7.0% poverty level for males and 5.1% for females among the residents of Santa Fe, 15 year old males and 75 year old and over females are the most vulnerable to poverty, with 9 males (20.9%) and 51 females (10.2%) in their respective age groups living below the poverty level.
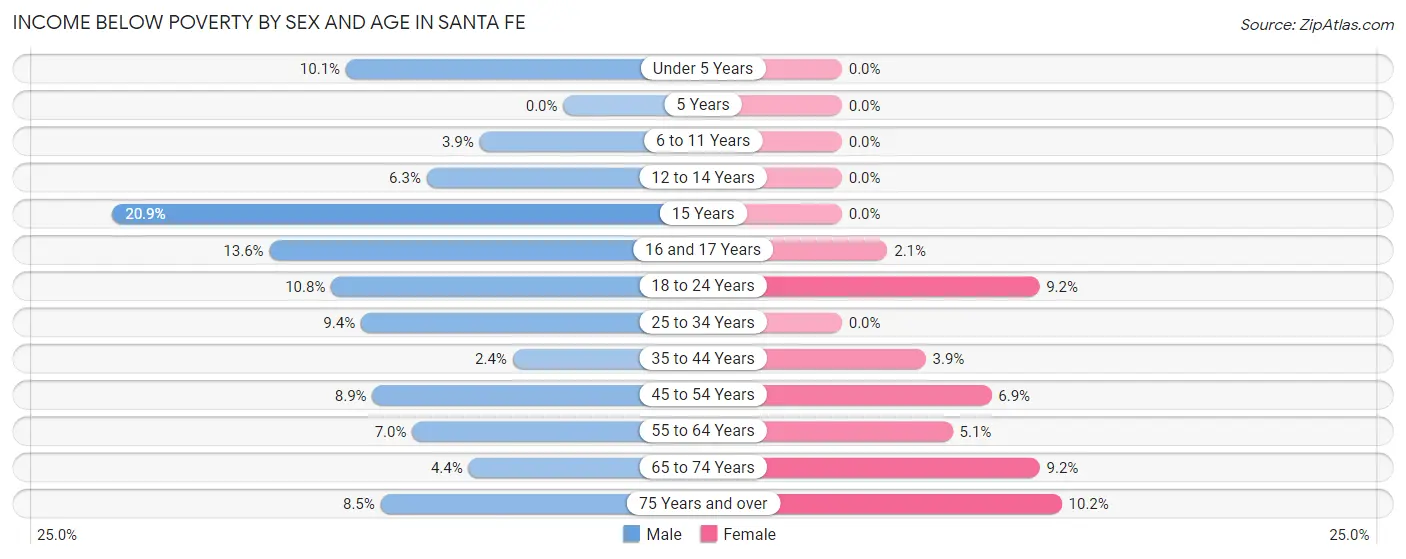
| Age Bracket | Male | Female |
| Under 5 Years | 34 (10.1%) | 0 (0.0%) |
| 5 Years | 0 (0.0%) | 0 (0.0%) |
| 6 to 11 Years | 17 (3.9%) | 0 (0.0%) |
| 12 to 14 Years | 17 (6.3%) | 0 (0.0%) |
| 15 Years | 9 (20.9%) | 0 (0.0%) |
| 16 and 17 Years | 15 (13.6%) | 6 (2.1%) |
| 18 to 24 Years | 49 (10.8%) | 60 (9.2%) |
| 25 to 34 Years | 78 (9.4%) | 0 (0.0%) |
| 35 to 44 Years | 21 (2.4%) | 39 (3.9%) |
| 45 to 54 Years | 71 (8.9%) | 68 (6.9%) |
| 55 to 64 Years | 73 (7.0%) | 62 (5.1%) |
| 65 to 74 Years | 25 (4.4%) | 47 (9.2%) |
| 75 Years and over | 28 (8.5%) | 51 (10.2%) |
| Total | 437 (7.0%) | 333 (5.1%) |
Income Above Poverty by Sex and Age in Santa Fe
According to the poverty statistics in Santa Fe, males aged 5 years and females aged under 5 years are the age groups that are most secure financially, with 100.0% of males and 100.0% of females in these age groups living above the poverty line.
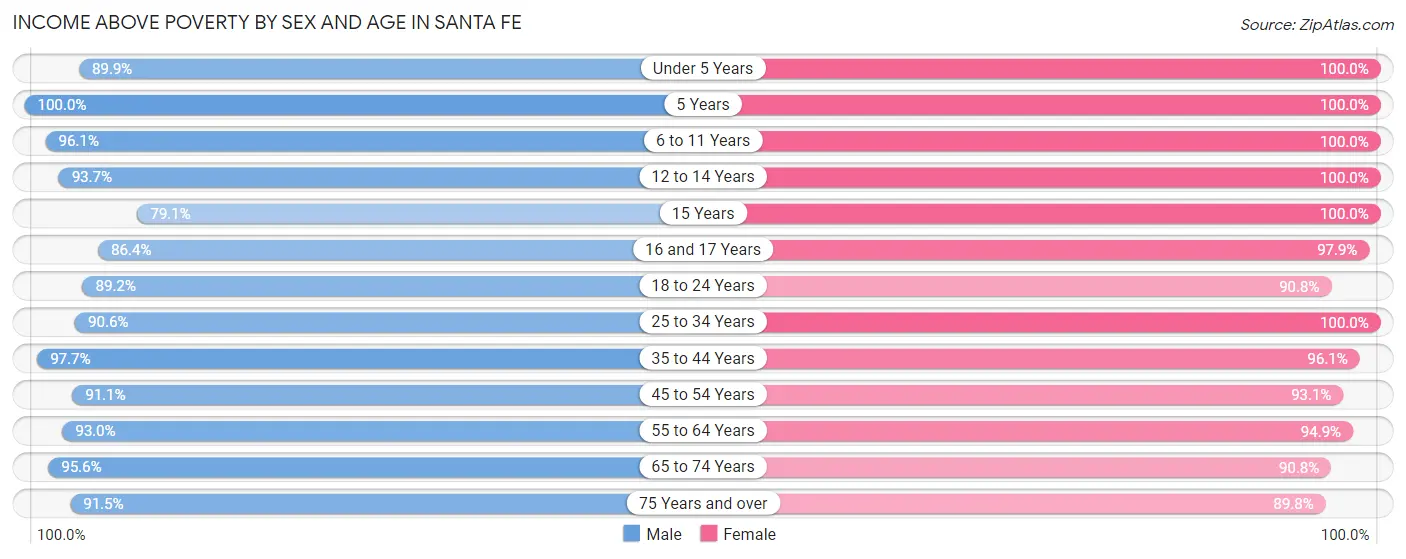
| Age Bracket | Male | Female |
| Under 5 Years | 303 (89.9%) | 270 (100.0%) |
| 5 Years | 124 (100.0%) | 10 (100.0%) |
| 6 to 11 Years | 420 (96.1%) | 301 (100.0%) |
| 12 to 14 Years | 251 (93.7%) | 151 (100.0%) |
| 15 Years | 34 (79.1%) | 54 (100.0%) |
| 16 and 17 Years | 95 (86.4%) | 279 (97.9%) |
| 18 to 24 Years | 406 (89.2%) | 595 (90.8%) |
| 25 to 34 Years | 753 (90.6%) | 556 (100.0%) |
| 35 to 44 Years | 873 (97.7%) | 964 (96.1%) |
| 45 to 54 Years | 730 (91.1%) | 912 (93.1%) |
| 55 to 64 Years | 968 (93.0%) | 1,145 (94.9%) |
| 65 to 74 Years | 543 (95.6%) | 465 (90.8%) |
| 75 Years and over | 302 (91.5%) | 449 (89.8%) |
| Total | 5,802 (93.0%) | 6,151 (94.9%) |
Income Below Poverty Among Married-Couple Families in Santa Fe
The poverty statistics for married-couple families in Santa Fe show that 2.8% or 76 of the total 2,745 families live below the poverty line. Families with no children have the highest poverty rate of 3.5%, comprising of 61 families. On the other hand, families with 3 or 4 children have the lowest poverty rate of 0.0%, which includes 0 families.
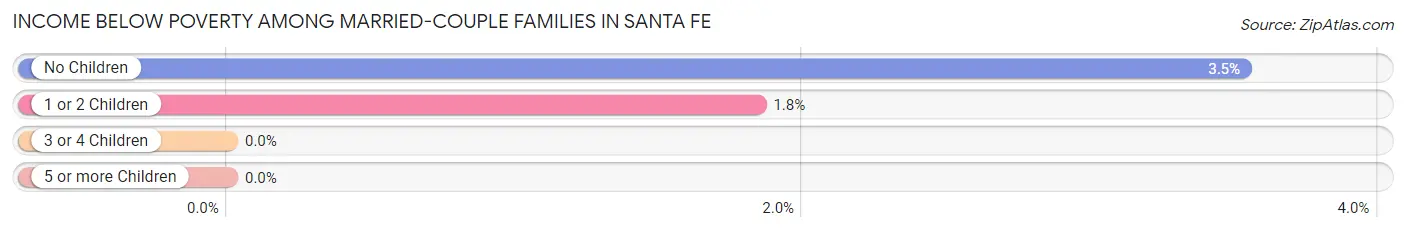
| Children | Above Poverty | Below Poverty |
| No Children | 1,667 (96.5%) | 61 (3.5%) |
| 1 or 2 Children | 802 (98.2%) | 15 (1.8%) |
| 3 or 4 Children | 200 (100.0%) | 0 (0.0%) |
| 5 or more Children | 0 (0.0%) | 0 (0.0%) |
| Total | 2,669 (97.2%) | 76 (2.8%) |
Income Below Poverty Among Single-Parent Households in Santa Fe
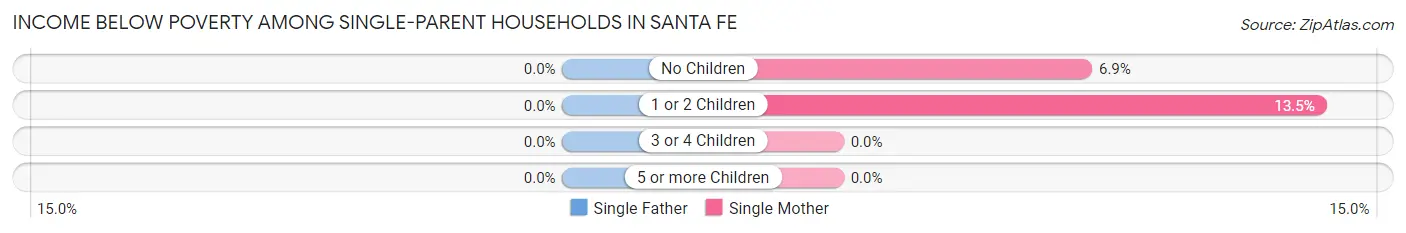
| Children | Single Father | Single Mother |
| No Children | 0 (0.0%) | 17 (6.9%) |
| 1 or 2 Children | 0 (0.0%) | 39 (13.5%) |
| 3 or 4 Children | 0 (0.0%) | 0 (0.0%) |
| 5 or more Children | 0 (0.0%) | 0 (0.0%) |
| Total | 0 (0.0%) | 56 (10.4%) |
Income Below Poverty Among Married-Couple vs Single-Parent Households in Santa Fe
The poverty data for Santa Fe shows that 76 of the married-couple family households (2.8%) and 56 of the single-parent households (9.5%) are living below the poverty level. Within the married-couple family households, those with no children have the highest poverty rate, with 61 households (3.5%) falling below the poverty line. Among the single-parent households, those with 1 or 2 children have the highest poverty rate, with 39 household (13.0%) living below poverty.
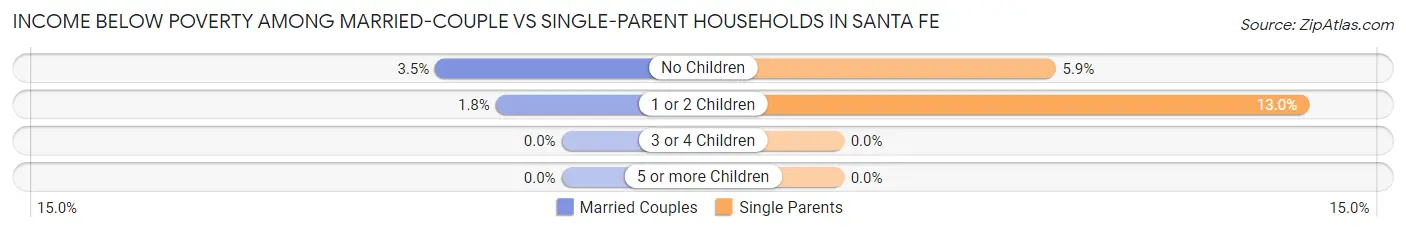
| Children | Married-Couple Families | Single-Parent Households |
| No Children | 61 (3.5%) | 17 (5.9%) |
| 1 or 2 Children | 15 (1.8%) | 39 (13.0%) |
| 3 or 4 Children | 0 (0.0%) | 0 (0.0%) |
| 5 or more Children | 0 (0.0%) | 0 (0.0%) |
| Total | 76 (2.8%) | 56 (9.5%) |
Race in Santa Fe
The most populous races in Santa Fe are White / Caucasian (10,239 | 80.0%), Hispanic or Latino (2,690 | 21.0%), and Two or more Races (1,907 | 14.9%).
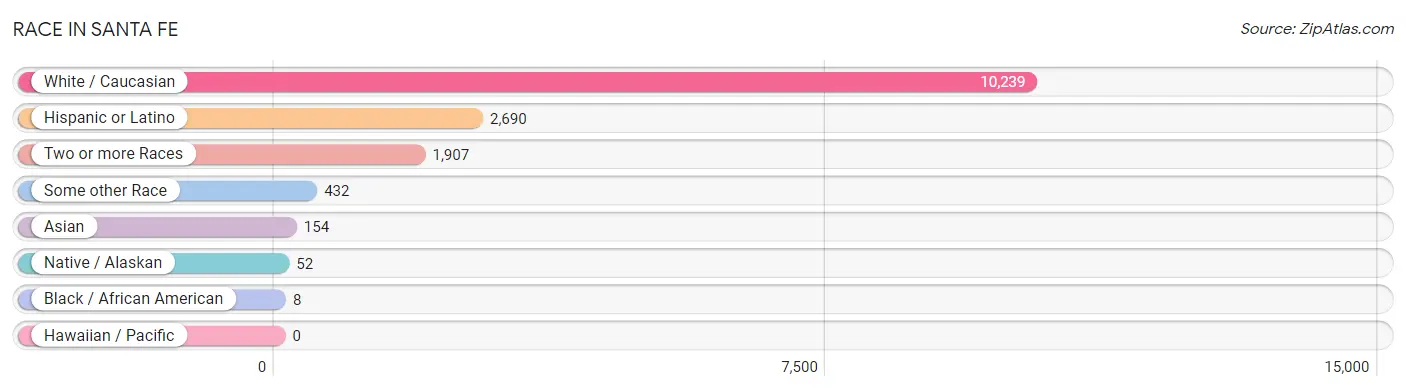
| Race | # Population | % Population |
| Asian | 154 | 1.2% |
| Black / African American | 8 | 0.1% |
| Hawaiian / Pacific | 0 | 0.0% |
| Hispanic or Latino | 2,690 | 21.0% |
| Native / Alaskan | 52 | 0.4% |
| White / Caucasian | 10,239 | 80.0% |
| Two or more Races | 1,907 | 14.9% |
| Some other Race | 432 | 3.4% |
| Total | 12,792 | 100.0% |
Ancestry in Santa Fe
The most populous ancestries reported in Santa Fe are Mexican (1,852 | 14.5%), German (1,392 | 10.9%), Irish (1,028 | 8.0%), English (1,013 | 7.9%), and American (509 | 4.0%), together accounting for 45.3% of all Santa Fe residents.
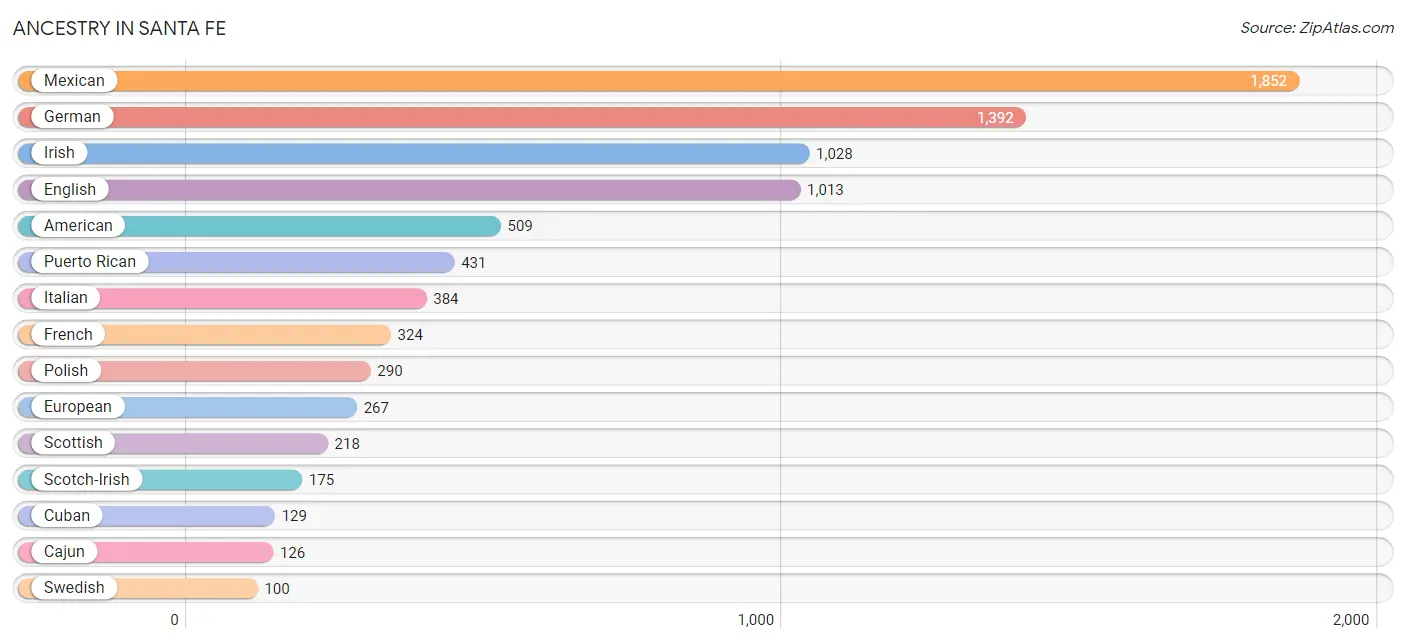
| Ancestry | # Population | % Population |
| American | 509 | 4.0% |
| Apache | 17 | 0.1% |
| Austrian | 5 | 0.0% |
| Bhutanese | 21 | 0.2% |
| British | 90 | 0.7% |
| Burmese | 1 | 0.0% |
| Cajun | 126 | 1.0% |
| Central American | 39 | 0.3% |
| Cherokee | 32 | 0.3% |
| Choctaw | 31 | 0.2% |
| Colombian | 15 | 0.1% |
| Creek | 7 | 0.1% |
| Cuban | 129 | 1.0% |
| Czech | 73 | 0.6% |
| Danish | 14 | 0.1% |
| Dutch | 53 | 0.4% |
| Eastern European | 2 | 0.0% |
| English | 1,013 | 7.9% |
| European | 267 | 2.1% |
| French | 324 | 2.5% |
| French Canadian | 27 | 0.2% |
| German | 1,392 | 10.9% |
| Greek | 31 | 0.2% |
| Irish | 1,028 | 8.0% |
| Italian | 384 | 3.0% |
| Korean | 95 | 0.7% |
| Maltese | 8 | 0.1% |
| Mexican | 1,852 | 14.5% |
| Nicaraguan | 31 | 0.2% |
| Northern European | 13 | 0.1% |
| Norwegian | 24 | 0.2% |
| Pakistani | 66 | 0.5% |
| Polish | 290 | 2.3% |
| Portuguese | 39 | 0.3% |
| Puerto Rican | 431 | 3.4% |
| Russian | 48 | 0.4% |
| Salvadoran | 8 | 0.1% |
| Scandinavian | 2 | 0.0% |
| Scotch-Irish | 175 | 1.4% |
| Scottish | 218 | 1.7% |
| Slavic | 7 | 0.1% |
| Slovak | 10 | 0.1% |
| South American | 15 | 0.1% |
| Spaniard | 9 | 0.1% |
| Swedish | 100 | 0.8% |
| Swiss | 7 | 0.1% |
| Welsh | 63 | 0.5% |
| Yaqui | 17 | 0.1% | View All 48 Rows |
Immigrants in Santa Fe
The most numerous immigrant groups reported in Santa Fe came from Latin America (359 | 2.8%), Central America (236 | 1.8%), Mexico (201 | 1.6%), Asia (156 | 1.2%), and South Eastern Asia (144 | 1.1%), together accounting for 8.6% of all Santa Fe residents.
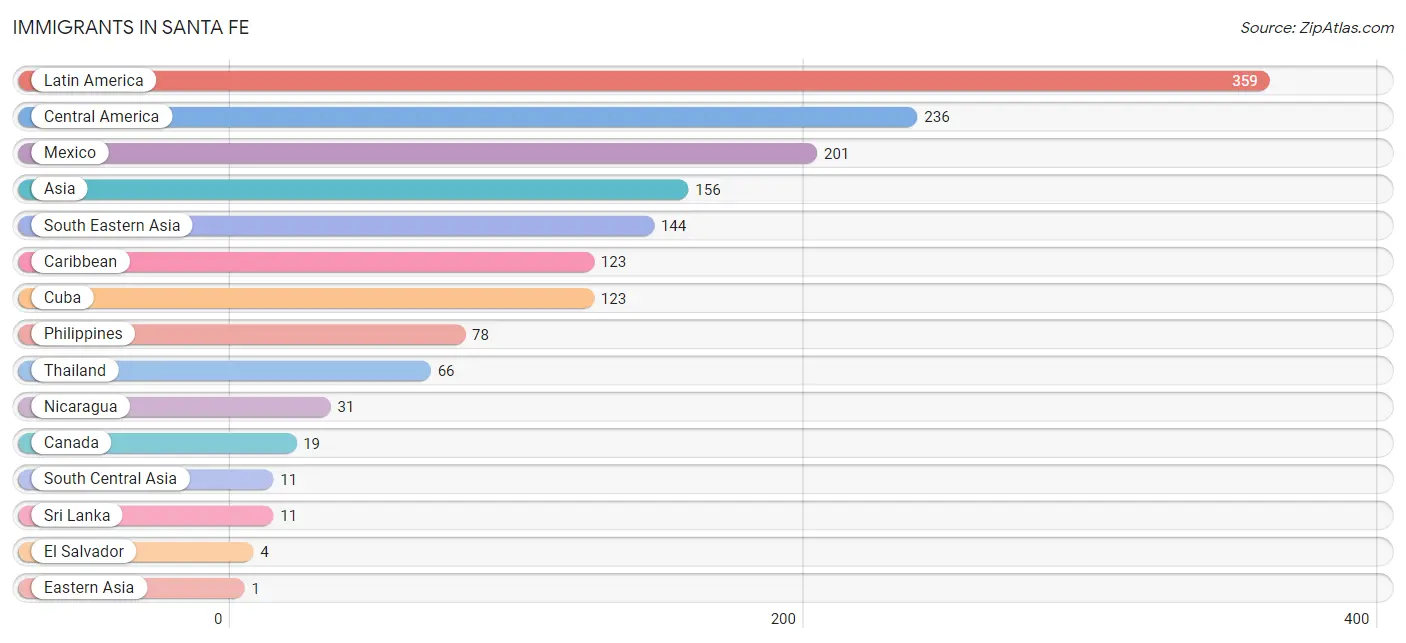
| Immigration Origin | # Population | % Population |
| Asia | 156 | 1.2% |
| Canada | 19 | 0.2% |
| Caribbean | 123 | 1.0% |
| Central America | 236 | 1.8% |
| Cuba | 123 | 1.0% |
| Eastern Asia | 1 | 0.0% |
| El Salvador | 4 | 0.0% |
| Korea | 1 | 0.0% |
| Latin America | 359 | 2.8% |
| Mexico | 201 | 1.6% |
| Nicaragua | 31 | 0.2% |
| Philippines | 78 | 0.6% |
| South Central Asia | 11 | 0.1% |
| South Eastern Asia | 144 | 1.1% |
| Sri Lanka | 11 | 0.1% |
| Thailand | 66 | 0.5% | View All 16 Rows |
Sex and Age in Santa Fe
Sex and Age in Santa Fe
The most populous age groups in Santa Fe are 60 to 64 Years (618 | 9.8%) for men and 60 to 64 Years (642 | 9.9%) for women.
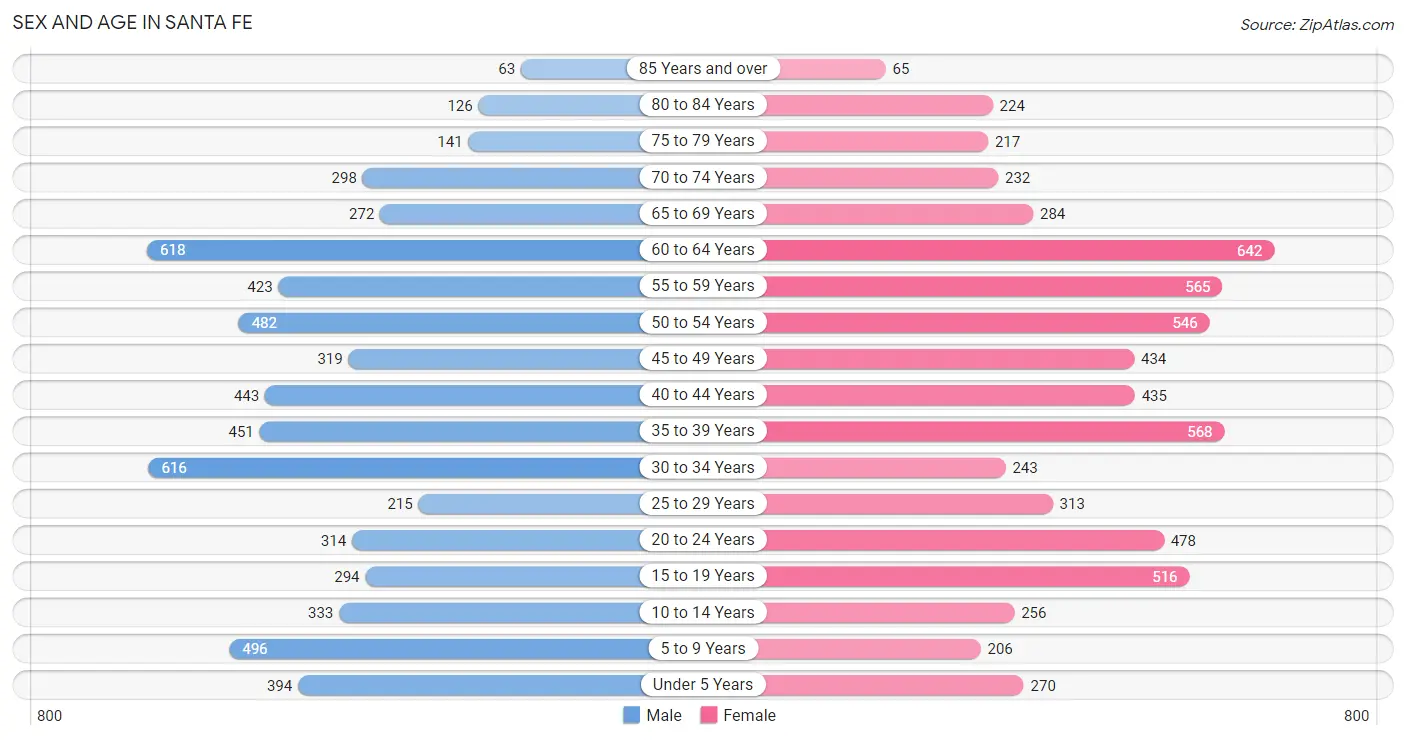
| Age Bracket | Male | Female |
| Under 5 Years | 394 (6.3%) | 270 (4.2%) |
| 5 to 9 Years | 496 (7.9%) | 206 (3.2%) |
| 10 to 14 Years | 333 (5.3%) | 256 (3.9%) |
| 15 to 19 Years | 294 (4.7%) | 516 (8.0%) |
| 20 to 24 Years | 314 (5.0%) | 478 (7.4%) |
| 25 to 29 Years | 215 (3.4%) | 313 (4.8%) |
| 30 to 34 Years | 616 (9.8%) | 243 (3.7%) |
| 35 to 39 Years | 451 (7.2%) | 568 (8.7%) |
| 40 to 44 Years | 443 (7.0%) | 435 (6.7%) |
| 45 to 49 Years | 319 (5.1%) | 434 (6.7%) |
| 50 to 54 Years | 482 (7.6%) | 546 (8.4%) |
| 55 to 59 Years | 423 (6.7%) | 565 (8.7%) |
| 60 to 64 Years | 618 (9.8%) | 642 (9.9%) |
| 65 to 69 Years | 272 (4.3%) | 284 (4.4%) |
| 70 to 74 Years | 298 (4.7%) | 232 (3.6%) |
| 75 to 79 Years | 141 (2.2%) | 217 (3.3%) |
| 80 to 84 Years | 126 (2.0%) | 224 (3.5%) |
| 85 Years and over | 63 (1.0%) | 65 (1.0%) |
| Total | 6,298 (100.0%) | 6,494 (100.0%) |
Families and Households in Santa Fe
Median Family Size in Santa Fe
The median family size in Santa Fe is 3.11 persons per family, with married-couple families (2,745 | 82.3%) accounting for the largest median family size of 3.23 persons per family. On the other hand, single female/mother families (539 | 16.2%) represent the smallest median family size with 2.54 persons per family.
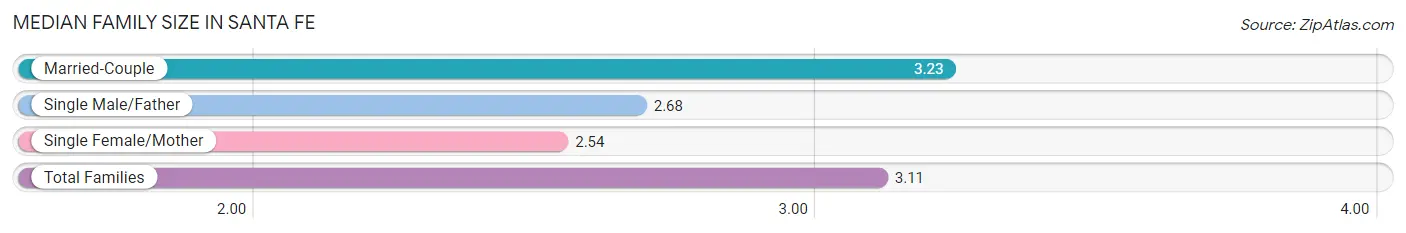
| Family Type | # Families | Family Size |
| Married-Couple | 2,745 (82.3%) | 3.23 |
| Single Male/Father | 53 (1.6%) | 2.68 |
| Single Female/Mother | 539 (16.2%) | 2.54 |
| Total Families | 3,337 (100.0%) | 3.11 |
Median Household Size in Santa Fe
The median household size in Santa Fe is 2.76 persons per household, with single male/father households (53 | 1.1%) accounting for the largest median household size of 3.85 persons per household. non-family households (1,294 | 27.9%) represent the smallest median household size with 1.57 persons per household.
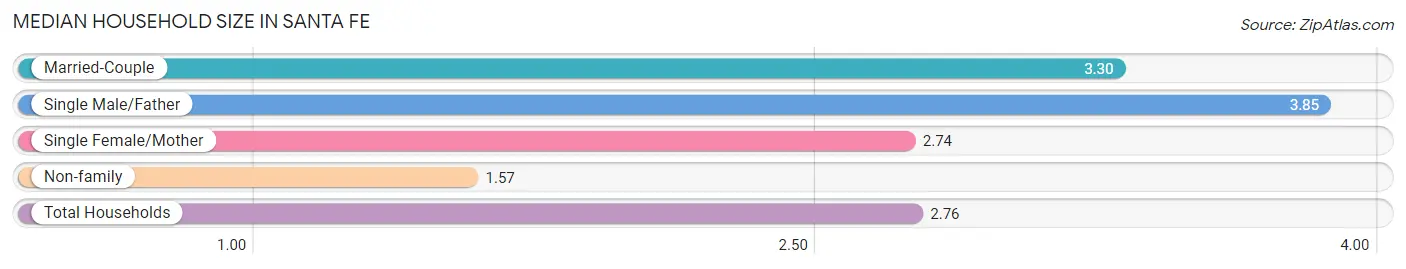
| Household Type | # Households | Household Size |
| Married-Couple | 2,745 (59.3%) | 3.30 |
| Single Male/Father | 53 (1.1%) | 3.85 |
| Single Female/Mother | 539 (11.6%) | 2.74 |
| Non-family | 1,294 (27.9%) | 1.57 |
| Total Households | 4,631 (100.0%) | 2.76 |
Household Size by Marriage Status in Santa Fe
Out of a total of 4,631 households in Santa Fe, 3,337 (72.1%) are family households, while 1,294 (27.9%) are nonfamily households. The most numerous type of family households are 2-person households, comprising 1,337, and the most common type of nonfamily households are 1-person households, comprising 1,042.
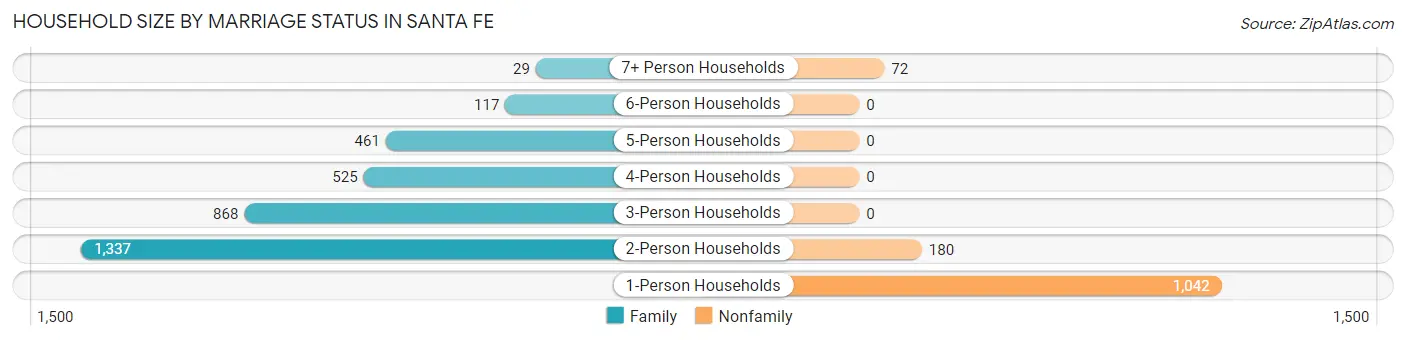
| Household Size | Family Households | Nonfamily Households |
| 1-Person Households | - | 1,042 (22.5%) |
| 2-Person Households | 1,337 (28.9%) | 180 (3.9%) |
| 3-Person Households | 868 (18.7%) | 0 (0.0%) |
| 4-Person Households | 525 (11.3%) | 0 (0.0%) |
| 5-Person Households | 461 (10.0%) | 0 (0.0%) |
| 6-Person Households | 117 (2.5%) | 0 (0.0%) |
| 7+ Person Households | 29 (0.6%) | 72 (1.5%) |
| Total | 3,337 (72.1%) | 1,294 (27.9%) |
Female Fertility in Santa Fe
Fertility by Age in Santa Fe
Average fertility rate in Santa Fe is 50.0 births per 1,000 women. Women in the age bracket of 20 to 34 years have the highest fertility rate with 132.0 births per 1,000 women. Women in the age bracket of 20 to 34 years acount for 89.0% of all women with births.
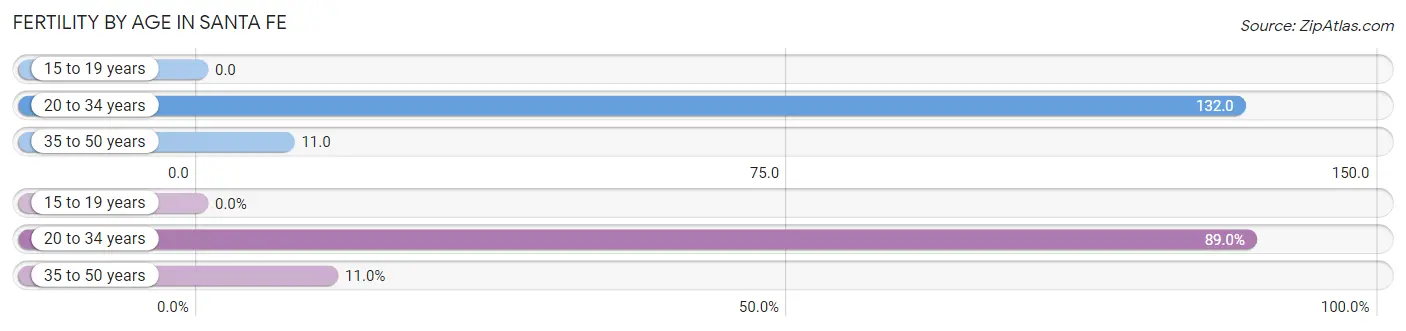
| Age Bracket | Women with Births | Births / 1,000 Women |
| 15 to 19 years | 0 (0.0%) | 0.0 |
| 20 to 34 years | 137 (89.0%) | 132.0 |
| 35 to 50 years | 17 (11.0%) | 11.0 |
| Total | 154 (100.0%) | 50.0 |
Fertility by Age by Marriage Status in Santa Fe
42.2% of women with births (154) in Santa Fe are married. The highest percentage of unmarried women with births falls into 20 to 34 years age bracket with 65.0% of them unmarried at the time of birth, while the lowest percentage of unmarried women with births belong to 35 to 50 years age bracket with 0.0% of them unmarried.
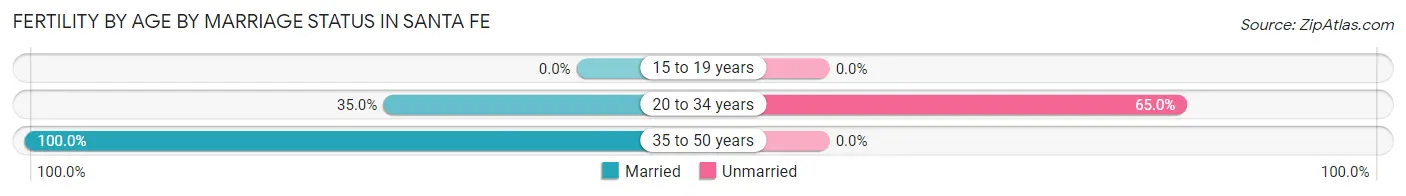
| Age Bracket | Married | Unmarried |
| 15 to 19 years | 0 (0.0%) | 0 (0.0%) |
| 20 to 34 years | 48 (35.0%) | 89 (65.0%) |
| 35 to 50 years | 17 (100.0%) | 0 (0.0%) |
| Total | 65 (42.2%) | 89 (57.8%) |
Fertility by Education in Santa Fe
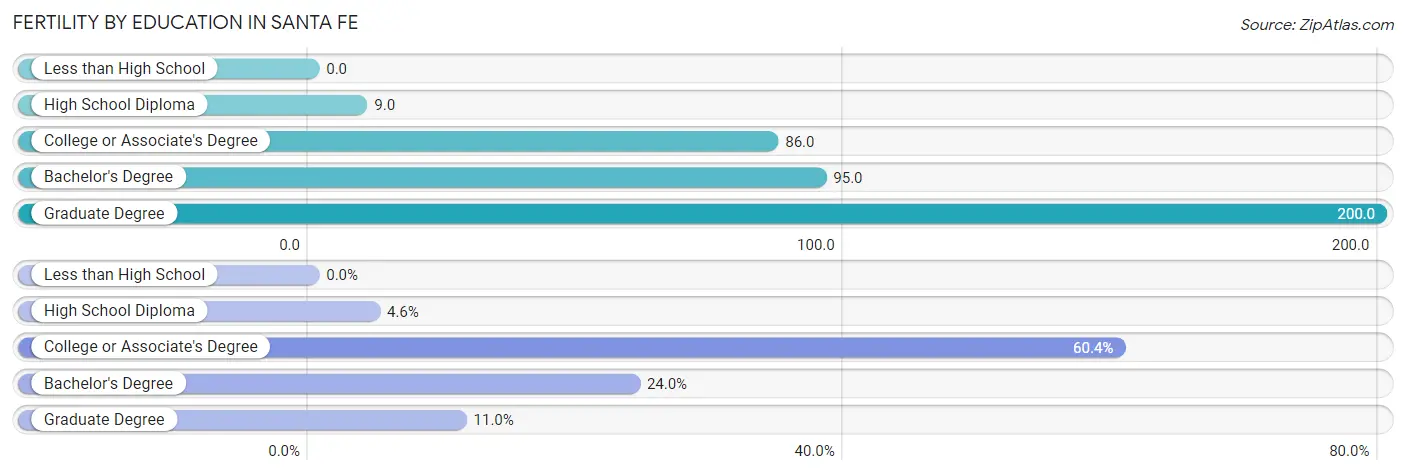
| Educational Attainment | Women with Births | Births / 1,000 Women |
| Less than High School | 0 (0.0%) | 0.0 |
| High School Diploma | 7 (4.5%) | 9.0 |
| College or Associate's Degree | 93 (60.4%) | 86.0 |
| Bachelor's Degree | 37 (24.0%) | 95.0 |
| Graduate Degree | 17 (11.0%) | 200.0 |
| Total | 154 (100.0%) | 50.0 |
Fertility by Education by Marriage Status in Santa Fe
57.8% of women with births in Santa Fe are unmarried. Women with the educational attainment of high school diploma are most likely to be married with 100.0% of them married at childbirth, while women with the educational attainment of college or associate's degree are least likely to be married with 95.7% of them unmarried at childbirth.
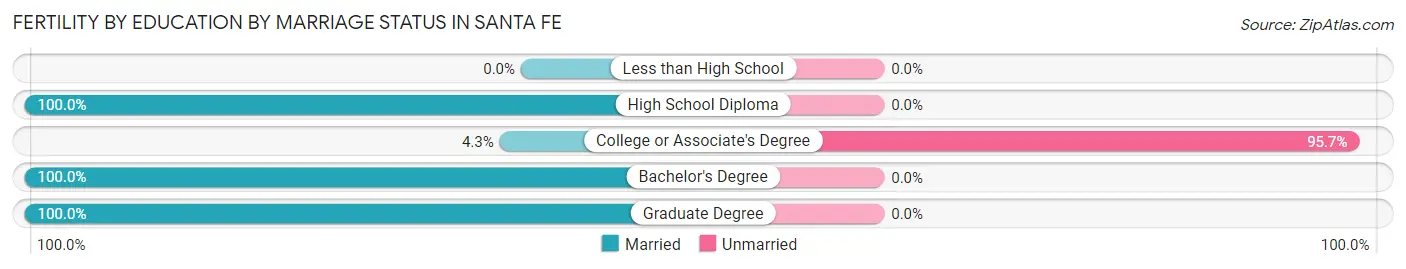
| Educational Attainment | Married | Unmarried |
| Less than High School | 0 (0.0%) | 0 (0.0%) |
| High School Diploma | 7 (100.0%) | 0 (0.0%) |
| College or Associate's Degree | 4 (4.3%) | 89 (95.7%) |
| Bachelor's Degree | 37 (100.0%) | 0 (0.0%) |
| Graduate Degree | 17 (100.0%) | 0 (0.0%) |
| Total | 65 (42.2%) | 89 (57.8%) |
Employment Characteristics in Santa Fe
Employment by Class of Employer in Santa Fe
Among the 5,911 employed individuals in Santa Fe, private company employees (4,223 | 71.4%), state government employees (497 | 8.4%), and self-employed (not incorporated) (487 | 8.2%) make up the most common classes of employment.
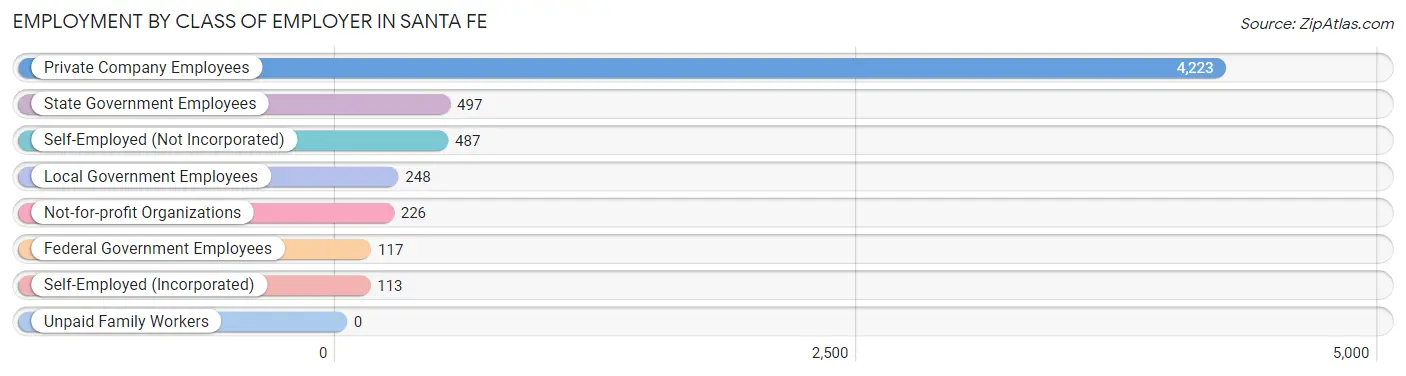
| Employer Class | # Employees | % Employees |
| Private Company Employees | 4,223 | 71.4% |
| Self-Employed (Incorporated) | 113 | 1.9% |
| Self-Employed (Not Incorporated) | 487 | 8.2% |
| Not-for-profit Organizations | 226 | 3.8% |
| Local Government Employees | 248 | 4.2% |
| State Government Employees | 497 | 8.4% |
| Federal Government Employees | 117 | 2.0% |
| Unpaid Family Workers | 0 | 0.0% |
| Total | 5,911 | 100.0% |
Employment Status by Age in Santa Fe
According to the labor force statistics for Santa Fe, out of the total population over 16 years of age (10,740), 60.0% or 6,444 individuals are in the labor force, with 7.8% or 503 of them unemployed. The age group with the highest labor force participation rate is 25 to 29 years, with 92.2% or 487 individuals in the labor force. Within the labor force, the 20 to 24 years age range has the highest percentage of unemployed individuals, with 17.5% or 94 of them being unemployed.
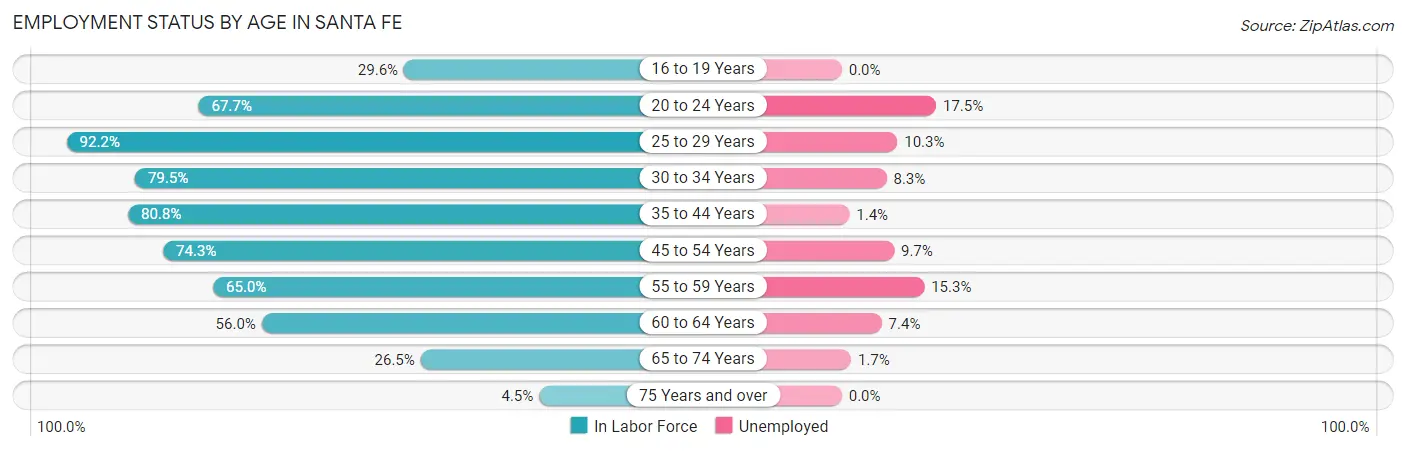
| Age Bracket | In Labor Force | Unemployed |
| 16 to 19 Years | 211 (29.6%) | 0 (0.0%) |
| 20 to 24 Years | 536 (67.7%) | 94 (17.5%) |
| 25 to 29 Years | 487 (92.2%) | 50 (10.3%) |
| 30 to 34 Years | 683 (79.5%) | 57 (8.3%) |
| 35 to 44 Years | 1,533 (80.8%) | 21 (1.4%) |
| 45 to 54 Years | 1,323 (74.3%) | 128 (9.7%) |
| 55 to 59 Years | 642 (65.0%) | 98 (15.3%) |
| 60 to 64 Years | 706 (56.0%) | 52 (7.4%) |
| 65 to 74 Years | 288 (26.5%) | 5 (1.7%) |
| 75 Years and over | 38 (4.5%) | 0 (0.0%) |
| Total | 6,444 (60.0%) | 503 (7.8%) |
Employment Status by Educational Attainment in Santa Fe
According to labor force statistics for Santa Fe, 73.5% of individuals (5,375) out of the total population between 25 and 64 years of age (7,313) are in the labor force, with 7.6% or 408 of them being unemployed. The group with the highest labor force participation rate are those with the educational attainment of college / associate degree, with 86.0% or 2,329 individuals in the labor force. Within the labor force, individuals with college / associate degree education have the highest percentage of unemployment, with 12.1% or 282 of them being unemployed.
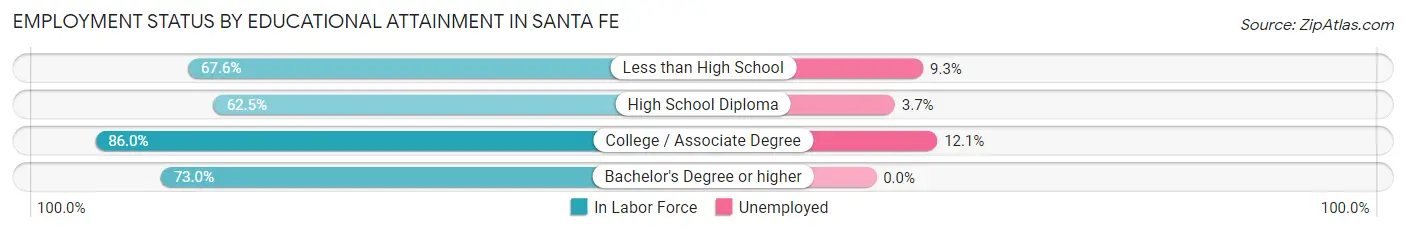
| Educational Attainment | In Labor Force | Unemployed |
| Less than High School | 740 (67.6%) | 102 (9.3%) |
| High School Diploma | 1,528 (62.5%) | 90 (3.7%) |
| College / Associate Degree | 2,329 (86.0%) | 328 (12.1%) |
| Bachelor's Degree or higher | 778 (73.0%) | 0 (0.0%) |
| Total | 5,375 (73.5%) | 556 (7.6%) |
Employment Occupations by Sex in Santa Fe
Management, Business, Science and Arts Occupations
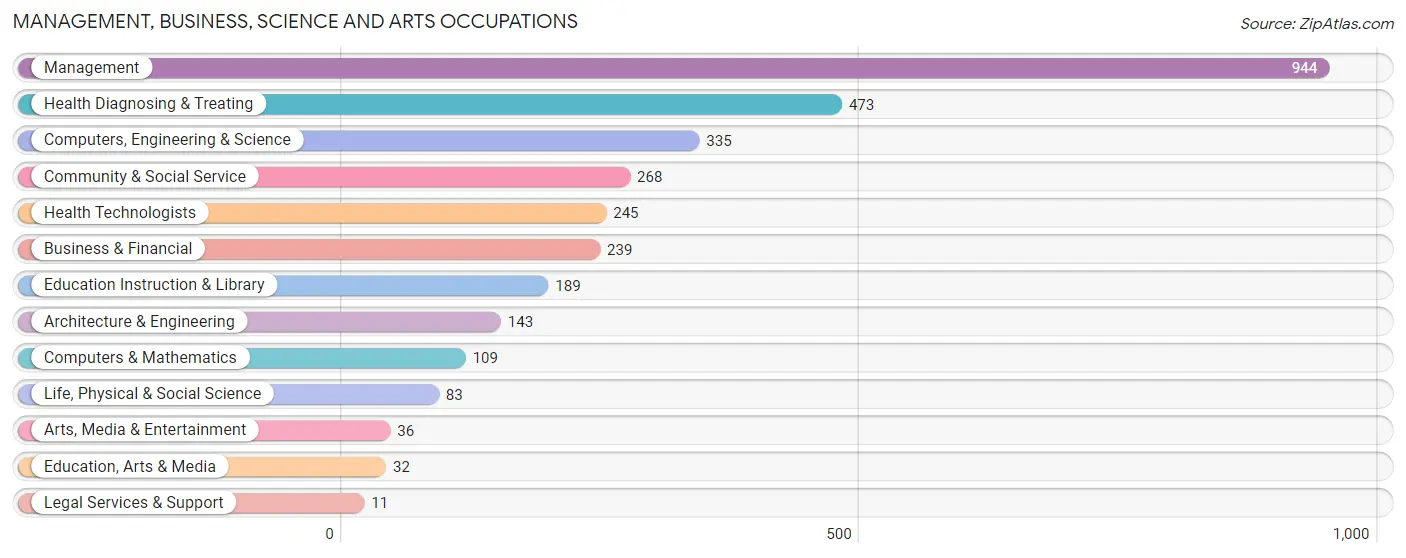
The most common Management, Business, Science and Arts occupations in Santa Fe are Management (944 | 15.9%), Health Diagnosing & Treating (473 | 8.0%), Computers, Engineering & Science (335 | 5.6%), Community & Social Service (268 | 4.5%), and Health Technologists (245 | 4.1%).
Management, Business, Science and Arts Occupations by Sex
Within the Management, Business, Science and Arts occupations in Santa Fe, the most male-oriented occupations are Education, Arts & Media (100.0%), Architecture & Engineering (88.8%), and Computers & Mathematics (85.3%), while the most female-oriented occupations are Legal Services & Support (100.0%), Arts, Media & Entertainment (100.0%), and Life, Physical & Social Science (94.0%).
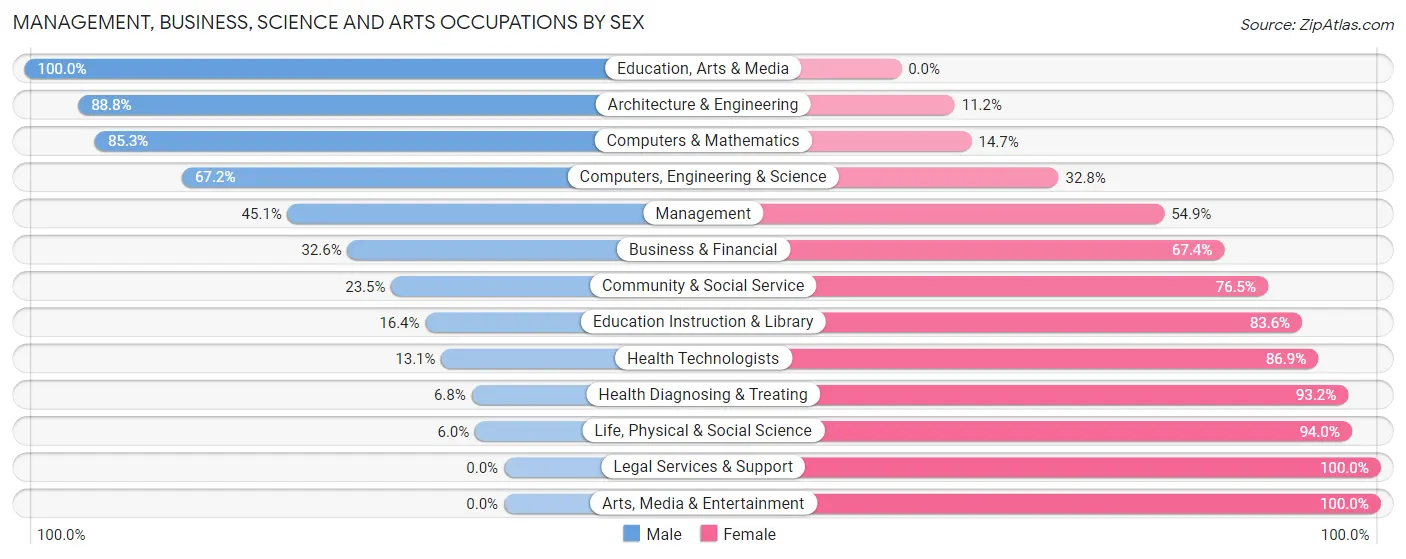
| Occupation | Male | Female |
| Management | 426 (45.1%) | 518 (54.9%) |
| Business & Financial | 78 (32.6%) | 161 (67.4%) |
| Computers, Engineering & Science | 225 (67.2%) | 110 (32.8%) |
| Computers & Mathematics | 93 (85.3%) | 16 (14.7%) |
| Architecture & Engineering | 127 (88.8%) | 16 (11.2%) |
| Life, Physical & Social Science | 5 (6.0%) | 78 (94.0%) |
| Community & Social Service | 63 (23.5%) | 205 (76.5%) |
| Education, Arts & Media | 32 (100.0%) | 0 (0.0%) |
| Legal Services & Support | 0 (0.0%) | 11 (100.0%) |
| Education Instruction & Library | 31 (16.4%) | 158 (83.6%) |
| Arts, Media & Entertainment | 0 (0.0%) | 36 (100.0%) |
| Health Diagnosing & Treating | 32 (6.8%) | 441 (93.2%) |
| Health Technologists | 32 (13.1%) | 213 (86.9%) |
| Total (Category) | 824 (36.5%) | 1,435 (63.5%) |
| Total (Overall) | 3,062 (51.5%) | 2,878 (48.4%) |
Services Occupations
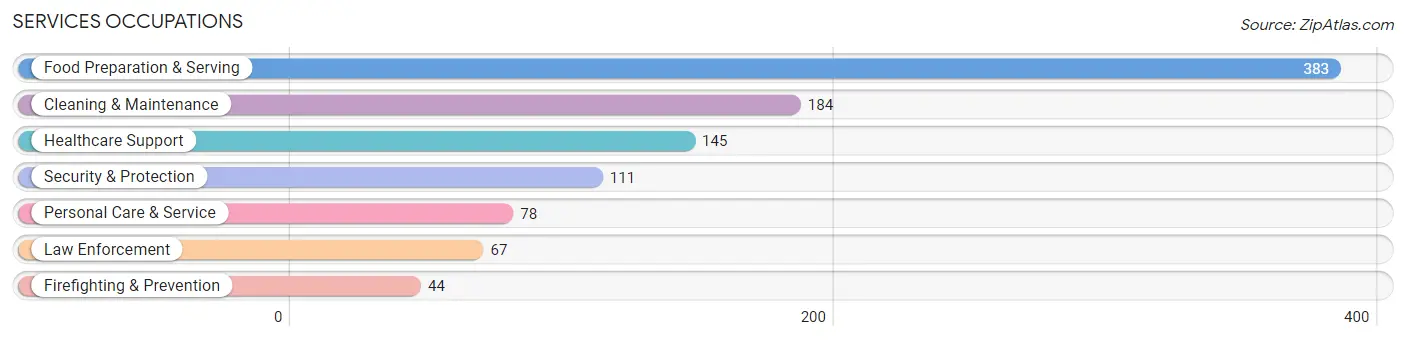
The most common Services occupations in Santa Fe are Food Preparation & Serving (383 | 6.5%), Cleaning & Maintenance (184 | 3.1%), Healthcare Support (145 | 2.4%), Security & Protection (111 | 1.9%), and Personal Care & Service (78 | 1.3%).
Services Occupations by Sex
Within the Services occupations in Santa Fe, the most male-oriented occupations are Firefighting & Prevention (100.0%), Security & Protection (91.9%), and Law Enforcement (86.6%), while the most female-oriented occupations are Personal Care & Service (74.4%), Food Preparation & Serving (64.0%), and Cleaning & Maintenance (45.7%).
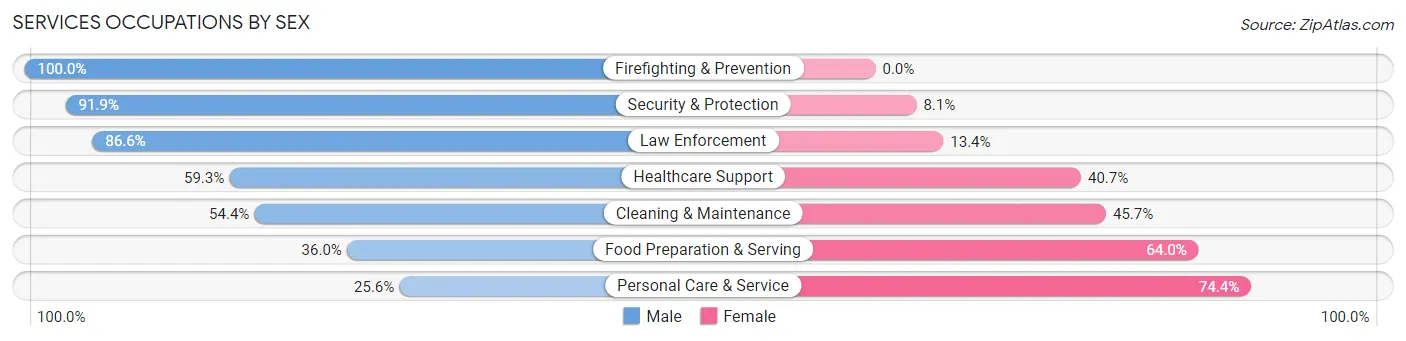
| Occupation | Male | Female |
| Healthcare Support | 86 (59.3%) | 59 (40.7%) |
| Security & Protection | 102 (91.9%) | 9 (8.1%) |
| Firefighting & Prevention | 44 (100.0%) | 0 (0.0%) |
| Law Enforcement | 58 (86.6%) | 9 (13.4%) |
| Food Preparation & Serving | 138 (36.0%) | 245 (64.0%) |
| Cleaning & Maintenance | 100 (54.3%) | 84 (45.7%) |
| Personal Care & Service | 20 (25.6%) | 58 (74.4%) |
| Total (Category) | 446 (49.5%) | 455 (50.5%) |
| Total (Overall) | 3,062 (51.5%) | 2,878 (48.4%) |
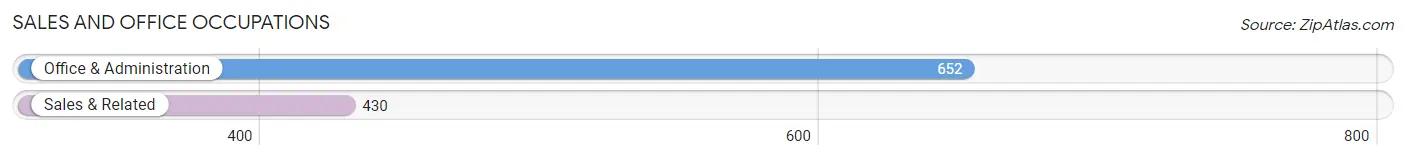
Sales and Office Occupations
The most common Sales and Office occupations in Santa Fe are Office & Administration (652 | 11.0%), and Sales & Related (430 | 7.2%).
Sales and Office Occupations by Sex
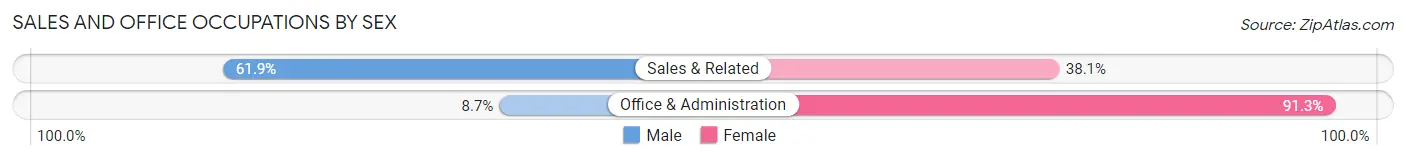
| Occupation | Male | Female |
| Sales & Related | 266 (61.9%) | 164 (38.1%) |
| Office & Administration | 57 (8.7%) | 595 (91.3%) |
| Total (Category) | 323 (29.8%) | 759 (70.2%) |
| Total (Overall) | 3,062 (51.5%) | 2,878 (48.4%) |
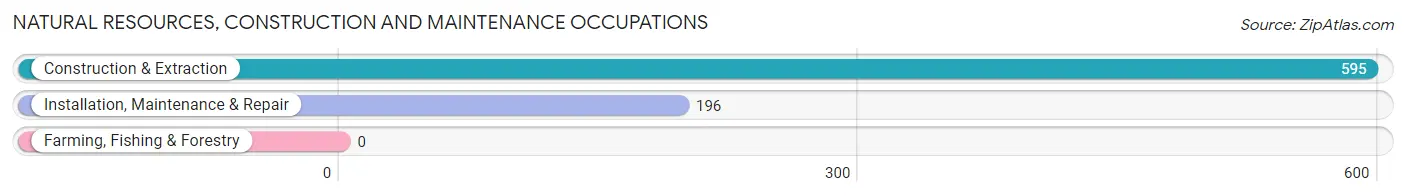
Natural Resources, Construction and Maintenance Occupations
The most common Natural Resources, Construction and Maintenance occupations in Santa Fe are Construction & Extraction (595 | 10.0%), and Installation, Maintenance & Repair (196 | 3.3%).
Natural Resources, Construction and Maintenance Occupations by Sex
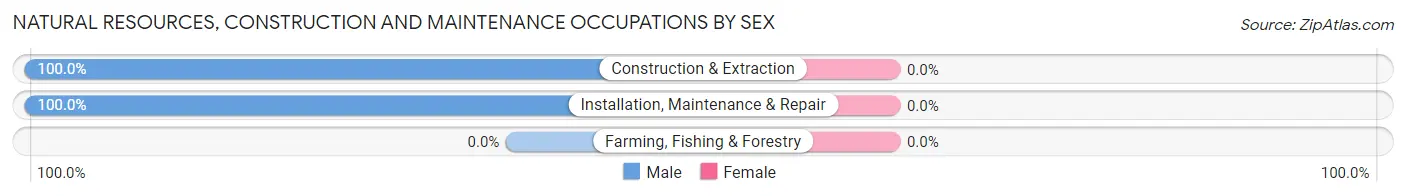
| Occupation | Male | Female |
| Farming, Fishing & Forestry | 0 (0.0%) | 0 (0.0%) |
| Construction & Extraction | 595 (100.0%) | 0 (0.0%) |
| Installation, Maintenance & Repair | 196 (100.0%) | 0 (0.0%) |
| Total (Category) | 791 (100.0%) | 0 (0.0%) |
| Total (Overall) | 3,062 (51.5%) | 2,878 (48.4%) |
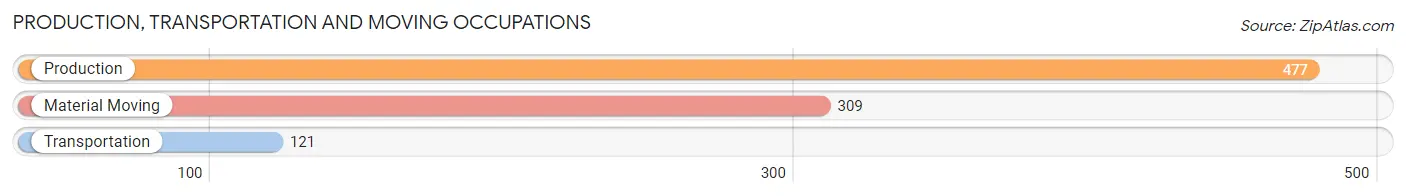
Production, Transportation and Moving Occupations
The most common Production, Transportation and Moving occupations in Santa Fe are Production (477 | 8.0%), Material Moving (309 | 5.2%), and Transportation (121 | 2.0%).
Production, Transportation and Moving Occupations by Sex
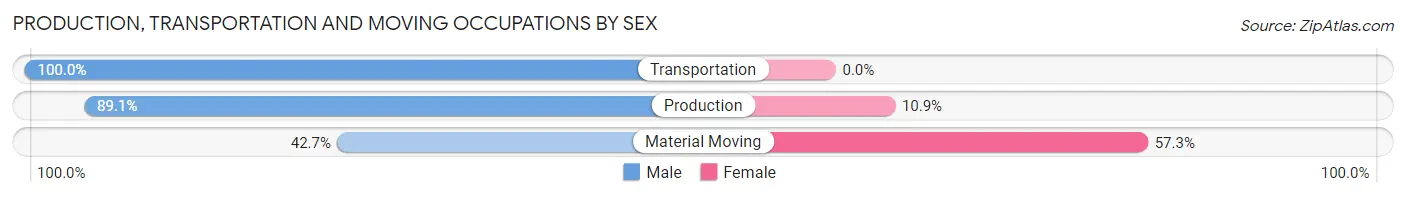
| Occupation | Male | Female |
| Production | 425 (89.1%) | 52 (10.9%) |
| Transportation | 121 (100.0%) | 0 (0.0%) |
| Material Moving | 132 (42.7%) | 177 (57.3%) |
| Total (Category) | 678 (74.8%) | 229 (25.3%) |
| Total (Overall) | 3,062 (51.5%) | 2,878 (48.4%) |
Employment Industries by Sex in Santa Fe
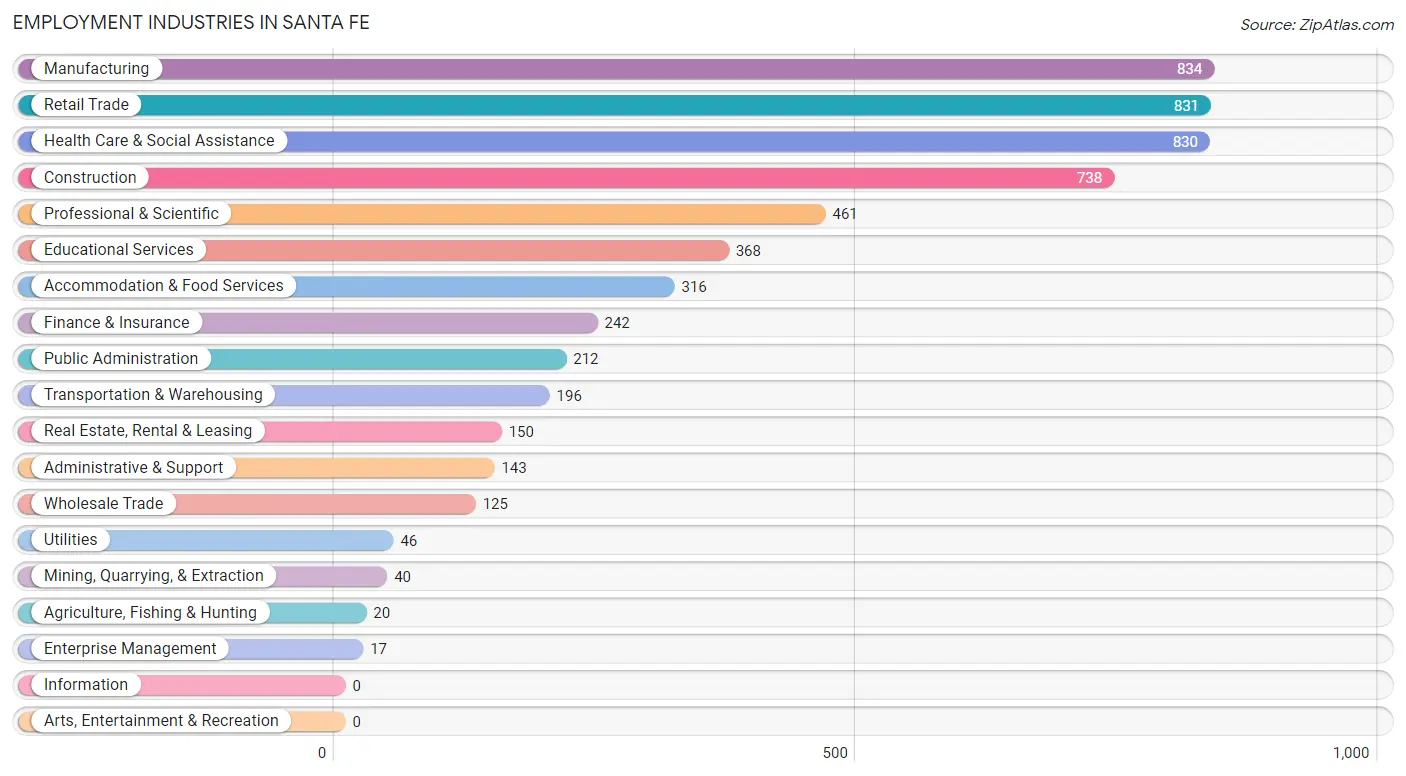
Employment Industries in Santa Fe
The major employment industries in Santa Fe include Manufacturing (834 | 14.0%), Retail Trade (831 | 14.0%), Health Care & Social Assistance (830 | 14.0%), Construction (738 | 12.4%), and Professional & Scientific (461 | 7.8%).
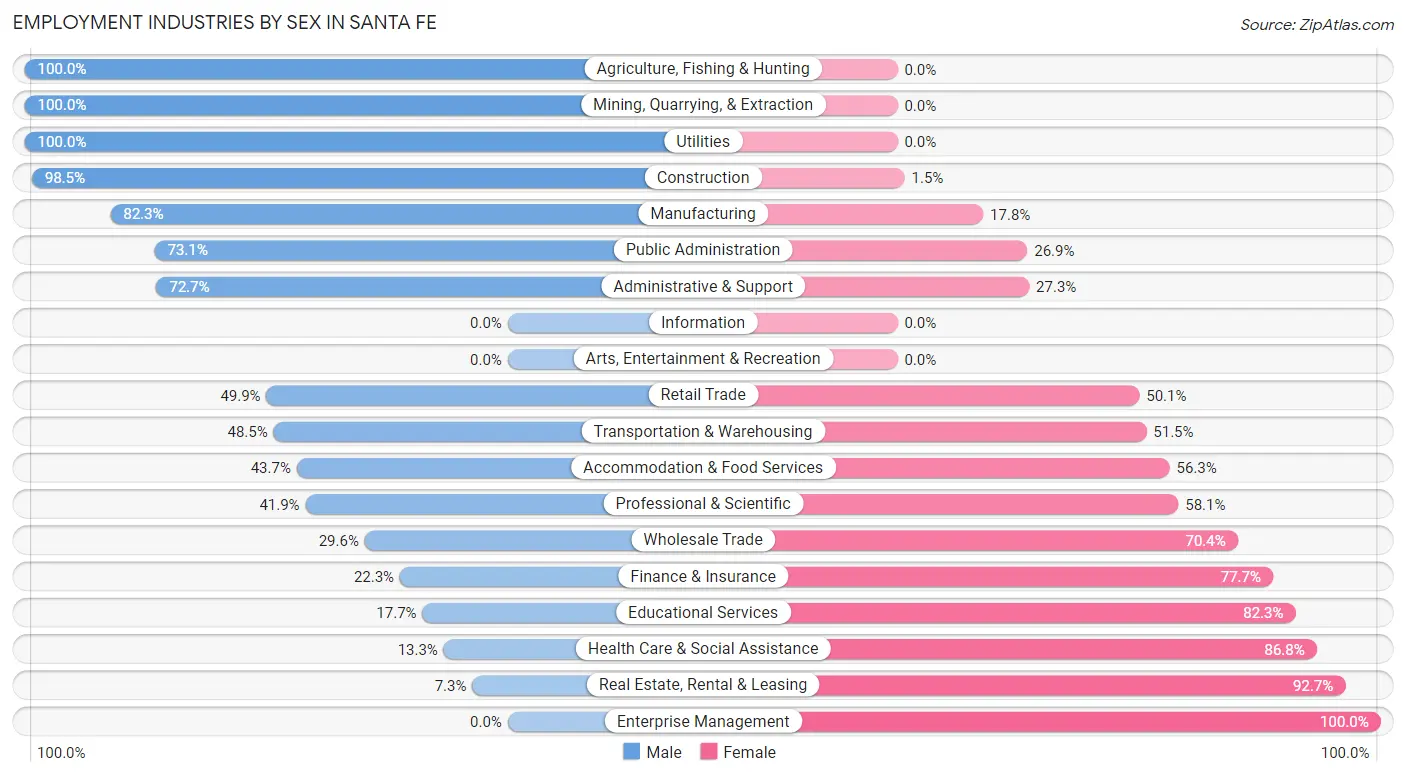
Employment Industries by Sex in Santa Fe
The Santa Fe industries that see more men than women are Agriculture, Fishing & Hunting (100.0%), Mining, Quarrying, & Extraction (100.0%), and Utilities (100.0%), whereas the industries that tend to have a higher number of women are Enterprise Management (100.0%), Real Estate, Rental & Leasing (92.7%), and Health Care & Social Assistance (86.8%).
| Industry | Male | Female |
| Agriculture, Fishing & Hunting | 20 (100.0%) | 0 (0.0%) |
| Mining, Quarrying, & Extraction | 40 (100.0%) | 0 (0.0%) |
| Construction | 727 (98.5%) | 11 (1.5%) |
| Manufacturing | 686 (82.3%) | 148 (17.7%) |
| Wholesale Trade | 37 (29.6%) | 88 (70.4%) |
| Retail Trade | 415 (49.9%) | 416 (50.1%) |
| Transportation & Warehousing | 95 (48.5%) | 101 (51.5%) |
| Utilities | 46 (100.0%) | 0 (0.0%) |
| Information | 0 (0.0%) | 0 (0.0%) |
| Finance & Insurance | 54 (22.3%) | 188 (77.7%) |
| Real Estate, Rental & Leasing | 11 (7.3%) | 139 (92.7%) |
| Professional & Scientific | 193 (41.9%) | 268 (58.1%) |
| Enterprise Management | 0 (0.0%) | 17 (100.0%) |
| Administrative & Support | 104 (72.7%) | 39 (27.3%) |
| Educational Services | 65 (17.7%) | 303 (82.3%) |
| Health Care & Social Assistance | 110 (13.3%) | 720 (86.8%) |
| Arts, Entertainment & Recreation | 0 (0.0%) | 0 (0.0%) |
| Accommodation & Food Services | 138 (43.7%) | 178 (56.3%) |
| Public Administration | 155 (73.1%) | 57 (26.9%) |
| Total | 3,062 (51.5%) | 2,878 (48.4%) |
Education in Santa Fe
School Enrollment in Santa Fe
The most common levels of schooling among the 2,503 students in Santa Fe are high school (681 | 27.2%), college / undergraduate (573 | 22.9%), and elementary school (518 | 20.7%).
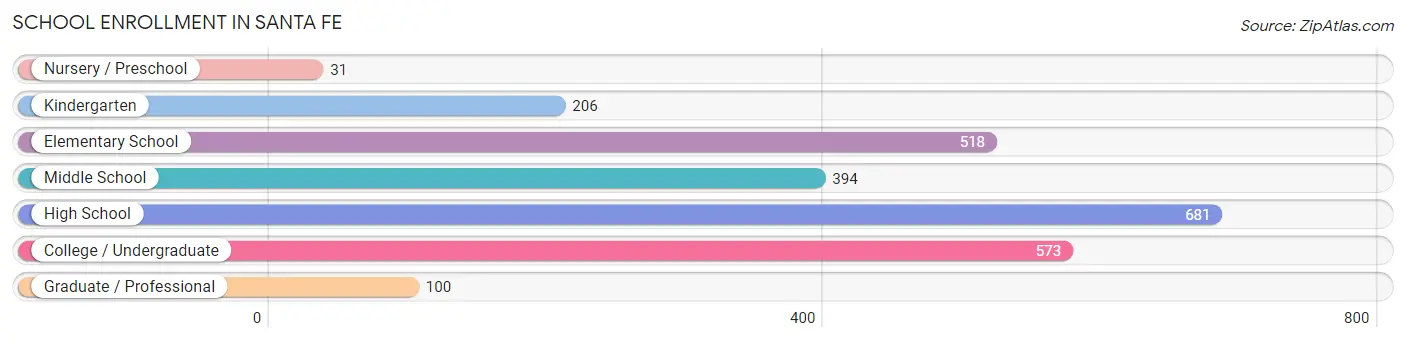
| School Level | # Students | % Students |
| Nursery / Preschool | 31 | 1.2% |
| Kindergarten | 206 | 8.2% |
| Elementary School | 518 | 20.7% |
| Middle School | 394 | 15.7% |
| High School | 681 | 27.2% |
| College / Undergraduate | 573 | 22.9% |
| Graduate / Professional | 100 | 4.0% |
| Total | 2,503 | 100.0% |
School Enrollment by Age by Funding Source in Santa Fe
Out of a total of 2,503 students who are enrolled in schools in Santa Fe, 308 (12.3%) attend a private institution, while the remaining 2,195 (87.7%) are enrolled in public schools. The age group of 10 to 14 year olds has the highest likelihood of being enrolled in private schools, with 111 (18.9% in the age bracket) enrolled. Conversely, the age group of 18 to 19 year olds has the lowest likelihood of being enrolled in a private school, with 157 (100.0% in the age bracket) attending a public institution.
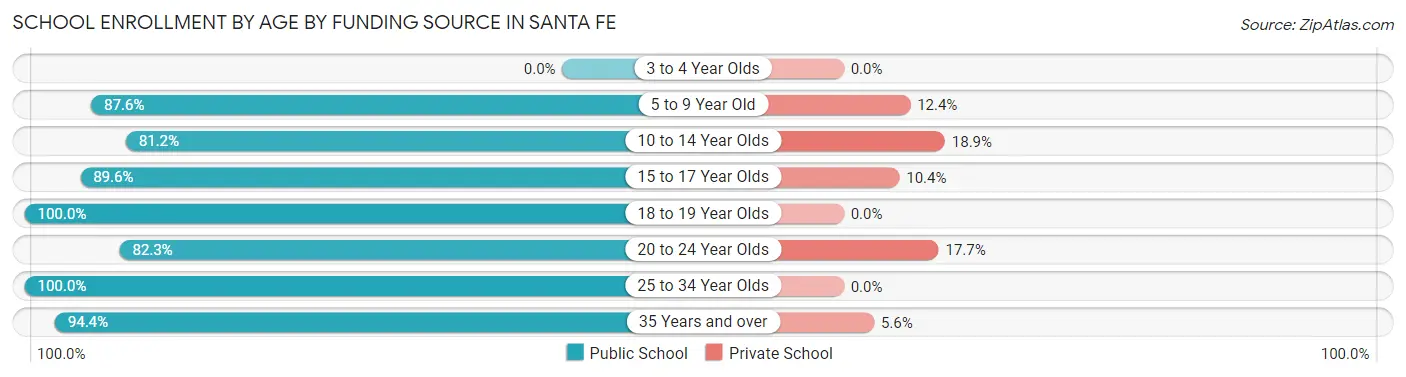
| Age Bracket | Public School | Private School |
| 3 to 4 Year Olds | 0 (0.0%) | 0 (0.0%) |
| 5 to 9 Year Old | 615 (87.6%) | 87 (12.4%) |
| 10 to 14 Year Olds | 478 (81.1%) | 111 (18.9%) |
| 15 to 17 Year Olds | 372 (89.6%) | 43 (10.4%) |
| 18 to 19 Year Olds | 157 (100.0%) | 0 (0.0%) |
| 20 to 24 Year Olds | 247 (82.3%) | 53 (17.7%) |
| 25 to 34 Year Olds | 74 (100.0%) | 0 (0.0%) |
| 35 Years and over | 251 (94.4%) | 15 (5.6%) |
| Total | 2,195 (87.7%) | 308 (12.3%) |
Educational Attainment by Field of Study in Santa Fe
Business (313 | 21.2%), education (186 | 12.6%), science & technology (143 | 9.7%), arts & humanities (127 | 8.6%), and bio, nature & agricultural (120 | 8.1%) are the most common fields of study among 1,479 individuals in Santa Fe who have obtained a bachelor's degree or higher.
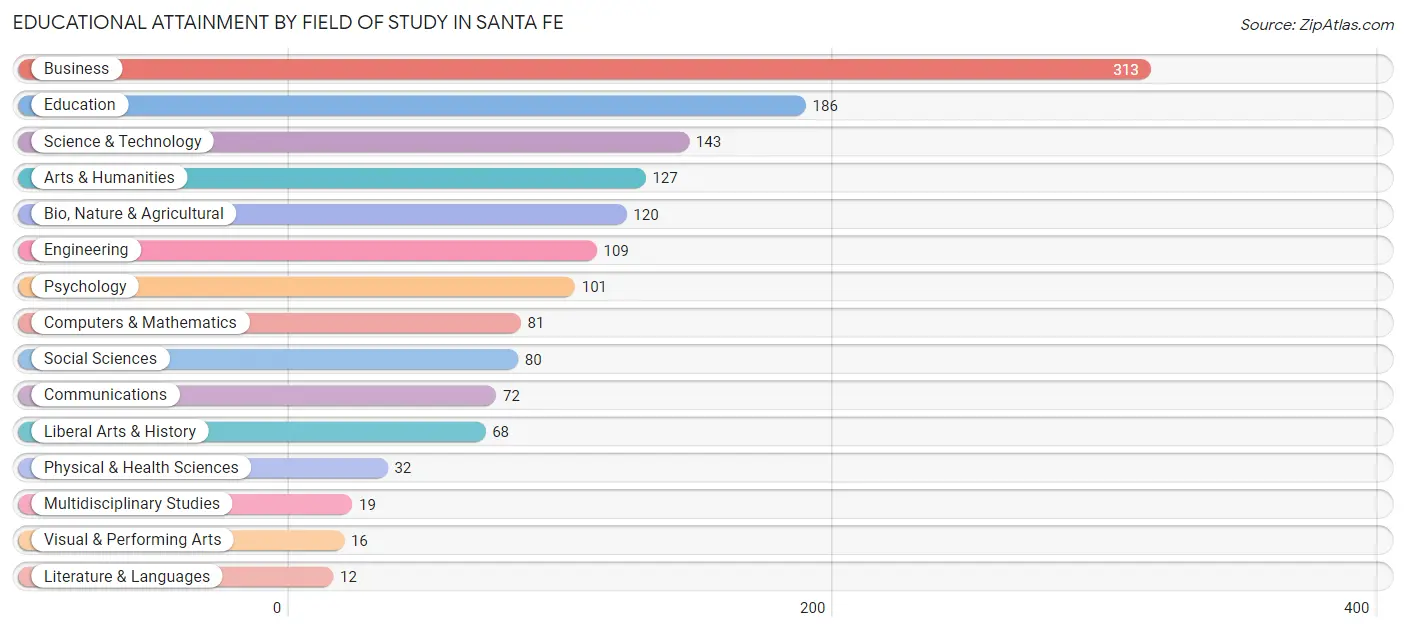
| Field of Study | # Graduates | % Graduates |
| Computers & Mathematics | 81 | 5.5% |
| Bio, Nature & Agricultural | 120 | 8.1% |
| Physical & Health Sciences | 32 | 2.2% |
| Psychology | 101 | 6.8% |
| Social Sciences | 80 | 5.4% |
| Engineering | 109 | 7.4% |
| Multidisciplinary Studies | 19 | 1.3% |
| Science & Technology | 143 | 9.7% |
| Business | 313 | 21.2% |
| Education | 186 | 12.6% |
| Literature & Languages | 12 | 0.8% |
| Liberal Arts & History | 68 | 4.6% |
| Visual & Performing Arts | 16 | 1.1% |
| Communications | 72 | 4.9% |
| Arts & Humanities | 127 | 8.6% |
| Total | 1,479 | 100.0% |
Transportation & Commute in Santa Fe
Vehicle Availability by Sex in Santa Fe
The most prevalent vehicle ownership categories in Santa Fe are males with 2 vehicles (1,192, accounting for 39.1%) and females with 2 vehicles (1,760, making up 41.7%).
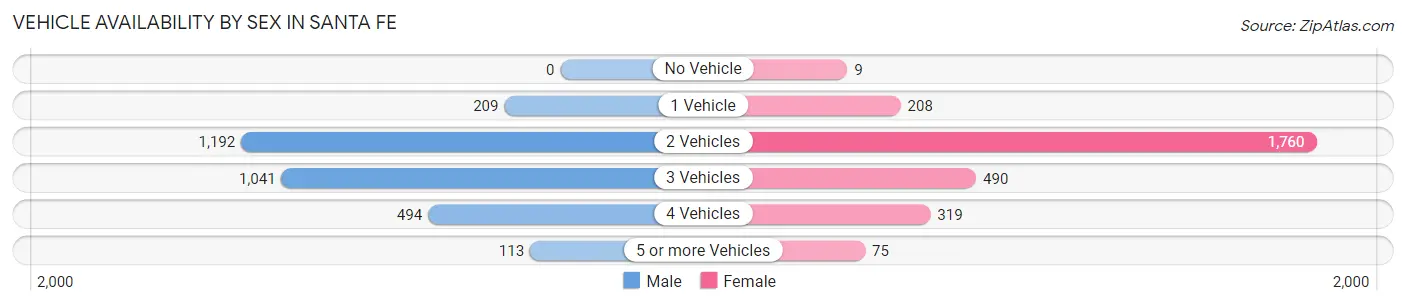
| Vehicles Available | Male | Female |
| No Vehicle | 0 (0.0%) | 9 (0.3%) |
| 1 Vehicle | 209 (6.9%) | 208 (7.3%) |
| 2 Vehicles | 1,192 (39.1%) | 1,760 (61.5%) |
| 3 Vehicles | 1,041 (34.1%) | 490 (17.1%) |
| 4 Vehicles | 494 (16.2%) | 319 (11.2%) |
| 5 or more Vehicles | 113 (3.7%) | 75 (2.6%) |
| Total | 3,049 (100.0%) | 2,861 (100.0%) |
Commute Time in Santa Fe
The most frequently occuring commute durations in Santa Fe are 30 to 34 minutes (1,096 commuters, 20.1%), 20 to 24 minutes (837 commuters, 15.3%), and 45 to 59 minutes (654 commuters, 12.0%).
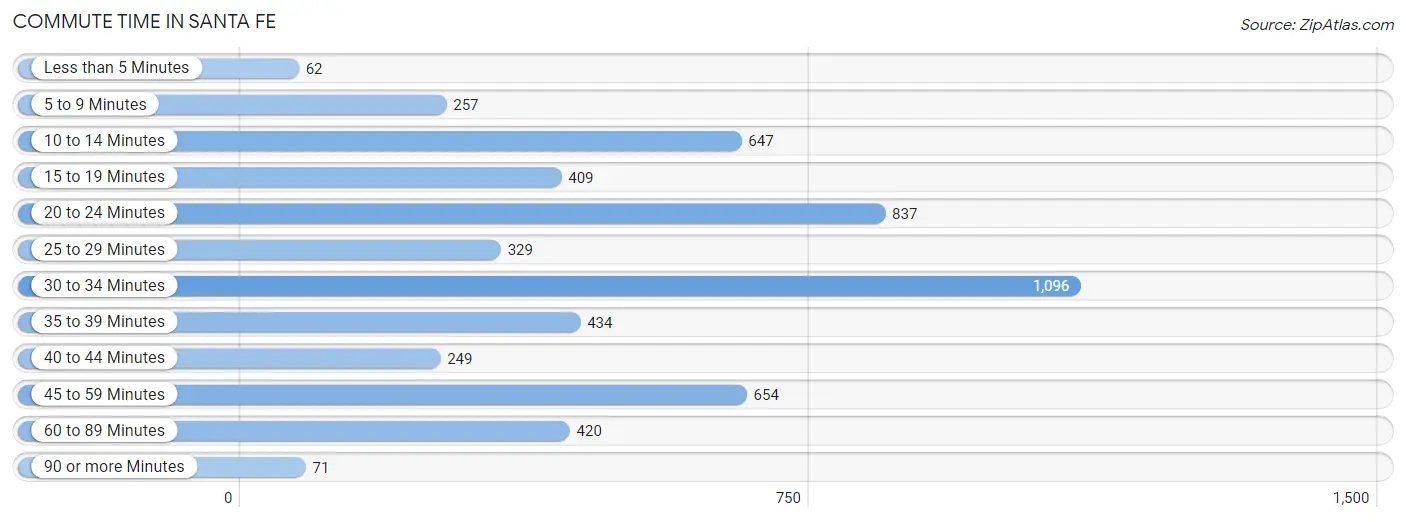
| Commute Time | # Commuters | % Commuters |
| Less than 5 Minutes | 62 | 1.1% |
| 5 to 9 Minutes | 257 | 4.7% |
| 10 to 14 Minutes | 647 | 11.8% |
| 15 to 19 Minutes | 409 | 7.5% |
| 20 to 24 Minutes | 837 | 15.3% |
| 25 to 29 Minutes | 329 | 6.0% |
| 30 to 34 Minutes | 1,096 | 20.1% |
| 35 to 39 Minutes | 434 | 7.9% |
| 40 to 44 Minutes | 249 | 4.6% |
| 45 to 59 Minutes | 654 | 12.0% |
| 60 to 89 Minutes | 420 | 7.7% |
| 90 or more Minutes | 71 | 1.3% |
Commute Time by Sex in Santa Fe
The most common commute times in Santa Fe are 20 to 24 minutes (504 commuters, 17.1%) for males and 30 to 34 minutes (652 commuters, 26.0%) for females.
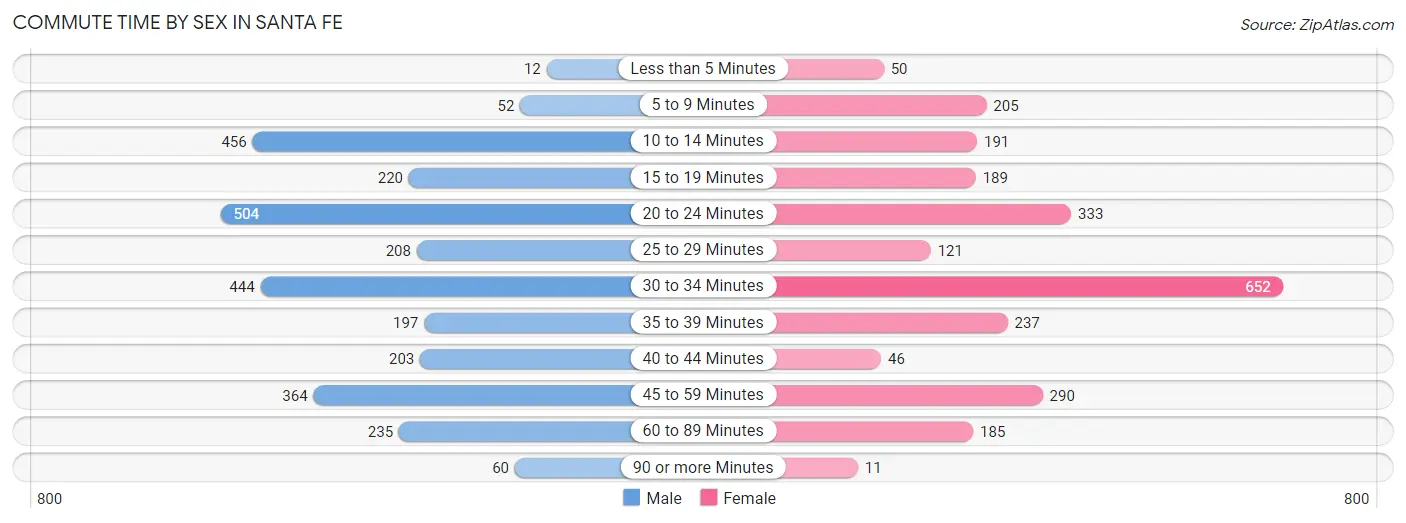
| Commute Time | Male | Female |
| Less than 5 Minutes | 12 (0.4%) | 50 (2.0%) |
| 5 to 9 Minutes | 52 (1.8%) | 205 (8.2%) |
| 10 to 14 Minutes | 456 (15.4%) | 191 (7.6%) |
| 15 to 19 Minutes | 220 (7.4%) | 189 (7.5%) |
| 20 to 24 Minutes | 504 (17.1%) | 333 (13.3%) |
| 25 to 29 Minutes | 208 (7.0%) | 121 (4.8%) |
| 30 to 34 Minutes | 444 (15.0%) | 652 (26.0%) |
| 35 to 39 Minutes | 197 (6.7%) | 237 (9.4%) |
| 40 to 44 Minutes | 203 (6.9%) | 46 (1.8%) |
| 45 to 59 Minutes | 364 (12.3%) | 290 (11.6%) |
| 60 to 89 Minutes | 235 (8.0%) | 185 (7.4%) |
| 90 or more Minutes | 60 (2.0%) | 11 (0.4%) |
Time of Departure to Work by Sex in Santa Fe
The most frequent times of departure to work in Santa Fe are 4:00 PM to 11:59 PM (491, 16.6%) for males and 8:00 AM to 8:29 AM (428, 17.1%) for females.
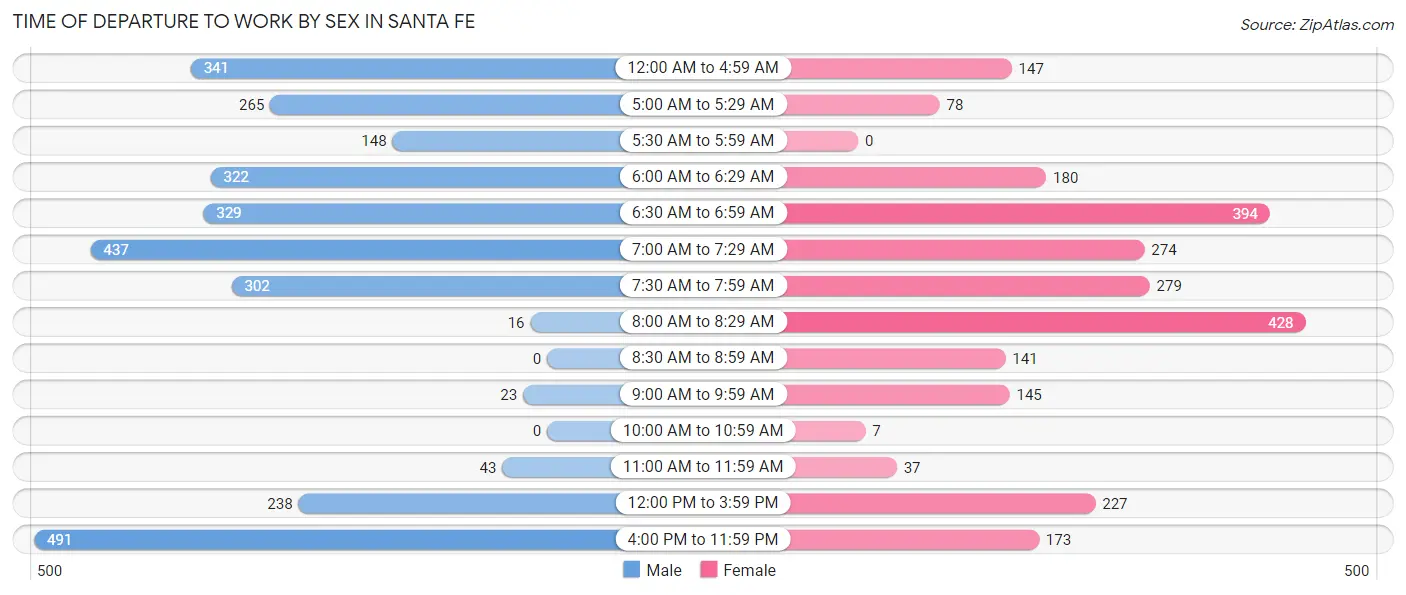
| Time of Departure | Male | Female |
| 12:00 AM to 4:59 AM | 341 (11.5%) | 147 (5.9%) |
| 5:00 AM to 5:29 AM | 265 (9.0%) | 78 (3.1%) |
| 5:30 AM to 5:59 AM | 148 (5.0%) | 0 (0.0%) |
| 6:00 AM to 6:29 AM | 322 (10.9%) | 180 (7.2%) |
| 6:30 AM to 6:59 AM | 329 (11.1%) | 394 (15.7%) |
| 7:00 AM to 7:29 AM | 437 (14.8%) | 274 (10.9%) |
| 7:30 AM to 7:59 AM | 302 (10.2%) | 279 (11.1%) |
| 8:00 AM to 8:29 AM | 16 (0.5%) | 428 (17.1%) |
| 8:30 AM to 8:59 AM | 0 (0.0%) | 141 (5.6%) |
| 9:00 AM to 9:59 AM | 23 (0.8%) | 145 (5.8%) |
| 10:00 AM to 10:59 AM | 0 (0.0%) | 7 (0.3%) |
| 11:00 AM to 11:59 AM | 43 (1.5%) | 37 (1.5%) |
| 12:00 PM to 3:59 PM | 238 (8.1%) | 227 (9.0%) |
| 4:00 PM to 11:59 PM | 491 (16.6%) | 173 (6.9%) |
| Total | 2,955 (100.0%) | 2,510 (100.0%) |
Housing Occupancy in Santa Fe
Occupancy by Ownership in Santa Fe
Of the total 4,631 dwellings in Santa Fe, owner-occupied units account for 3,829 (82.7%), while renter-occupied units make up 802 (17.3%).
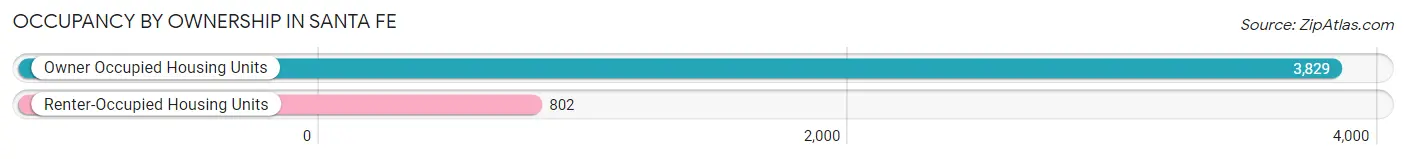
| Occupancy | # Housing Units | % Housing Units |
| Owner Occupied Housing Units | 3,829 | 82.7% |
| Renter-Occupied Housing Units | 802 | 17.3% |
| Total Occupied Housing Units | 4,631 | 100.0% |
Occupancy by Household Size in Santa Fe
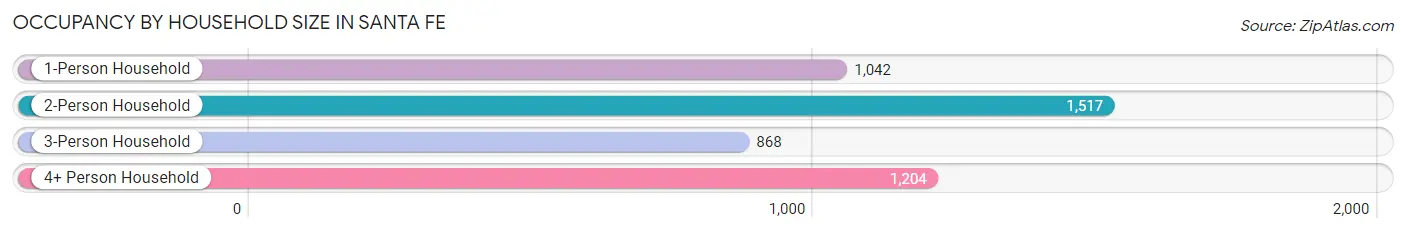
| Household Size | # Housing Units | % Housing Units |
| 1-Person Household | 1,042 | 22.5% |
| 2-Person Household | 1,517 | 32.8% |
| 3-Person Household | 868 | 18.7% |
| 4+ Person Household | 1,204 | 26.0% |
| Total Housing Units | 4,631 | 100.0% |
Occupancy by Ownership by Household Size in Santa Fe
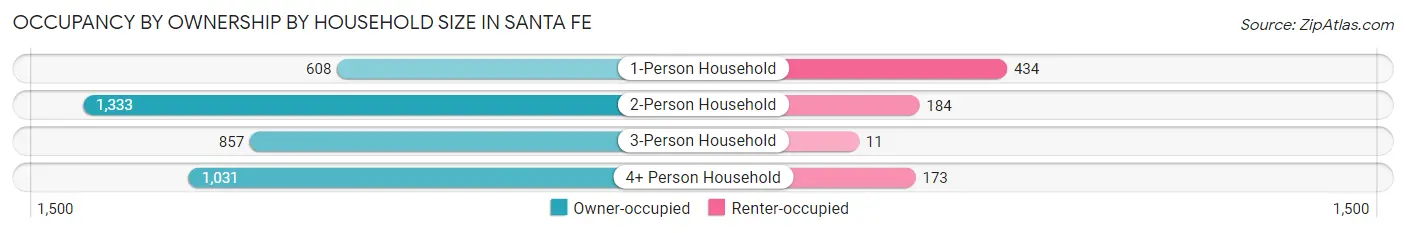
| Household Size | Owner-occupied | Renter-occupied |
| 1-Person Household | 608 (58.4%) | 434 (41.6%) |
| 2-Person Household | 1,333 (87.9%) | 184 (12.1%) |
| 3-Person Household | 857 (98.7%) | 11 (1.3%) |
| 4+ Person Household | 1,031 (85.6%) | 173 (14.4%) |
| Total Housing Units | 3,829 (82.7%) | 802 (17.3%) |
Occupancy by Educational Attainment in Santa Fe
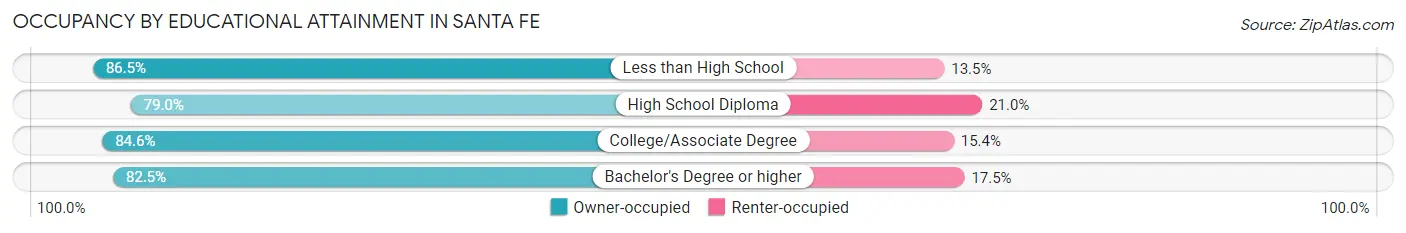
| Household Size | Owner-occupied | Renter-occupied |
| Less than High School | 461 (86.5%) | 72 (13.5%) |
| High School Diploma | 1,127 (79.0%) | 300 (21.0%) |
| College/Associate Degree | 1,501 (84.6%) | 273 (15.4%) |
| Bachelor's Degree or higher | 740 (82.5%) | 157 (17.5%) |
Occupancy by Age of Householder in Santa Fe
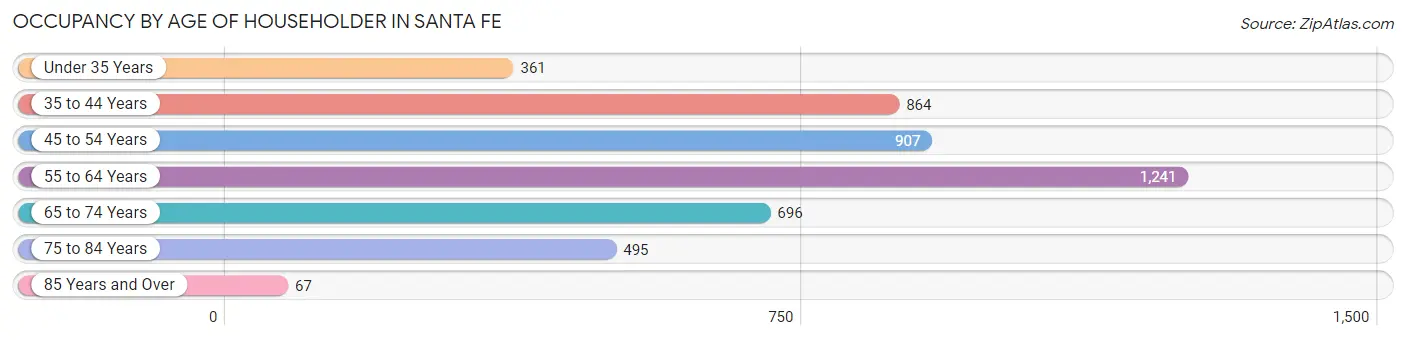
| Age Bracket | # Households | % Households |
| Under 35 Years | 361 | 7.8% |
| 35 to 44 Years | 864 | 18.7% |
| 45 to 54 Years | 907 | 19.6% |
| 55 to 64 Years | 1,241 | 26.8% |
| 65 to 74 Years | 696 | 15.0% |
| 75 to 84 Years | 495 | 10.7% |
| 85 Years and Over | 67 | 1.5% |
| Total | 4,631 | 100.0% |
Housing Finances in Santa Fe
Median Income by Occupancy in Santa Fe
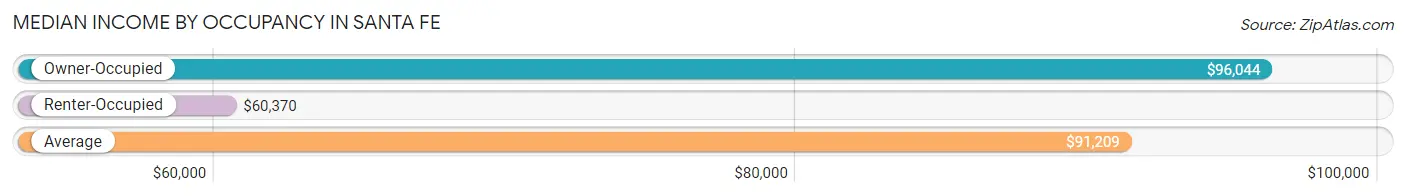
| Occupancy Type | # Households | Median Income |
| Owner-Occupied | 3,829 (82.7%) | $96,044 |
| Renter-Occupied | 802 (17.3%) | $60,370 |
| Average | 4,631 (100.0%) | $91,209 |
Occupancy by Householder Income Bracket in Santa Fe
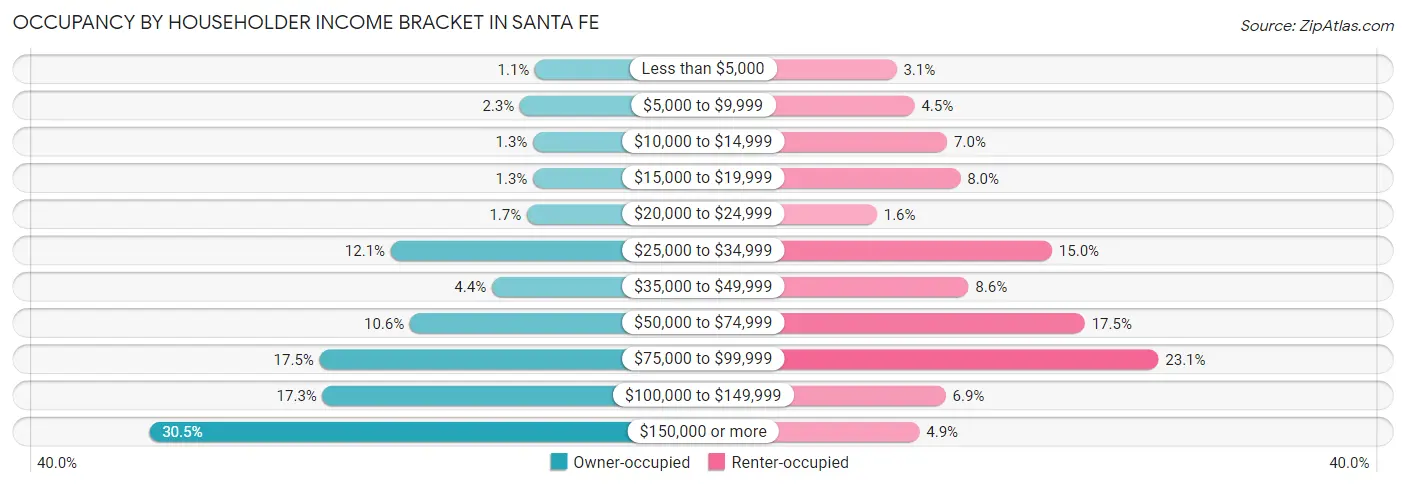
| Income Bracket | Owner-occupied | Renter-occupied |
| Less than $5,000 | 42 (1.1%) | 25 (3.1%) |
| $5,000 to $9,999 | 86 (2.2%) | 36 (4.5%) |
| $10,000 to $14,999 | 48 (1.3%) | 56 (7.0%) |
| $15,000 to $19,999 | 48 (1.3%) | 64 (8.0%) |
| $20,000 to $24,999 | 66 (1.7%) | 13 (1.6%) |
| $25,000 to $34,999 | 463 (12.1%) | 120 (15.0%) |
| $35,000 to $49,999 | 168 (4.4%) | 69 (8.6%) |
| $50,000 to $74,999 | 407 (10.6%) | 140 (17.5%) |
| $75,000 to $99,999 | 671 (17.5%) | 185 (23.1%) |
| $100,000 to $149,999 | 662 (17.3%) | 55 (6.9%) |
| $150,000 or more | 1,168 (30.5%) | 39 (4.9%) |
| Total | 3,829 (100.0%) | 802 (100.0%) |
Monthly Housing Cost Tiers in Santa Fe
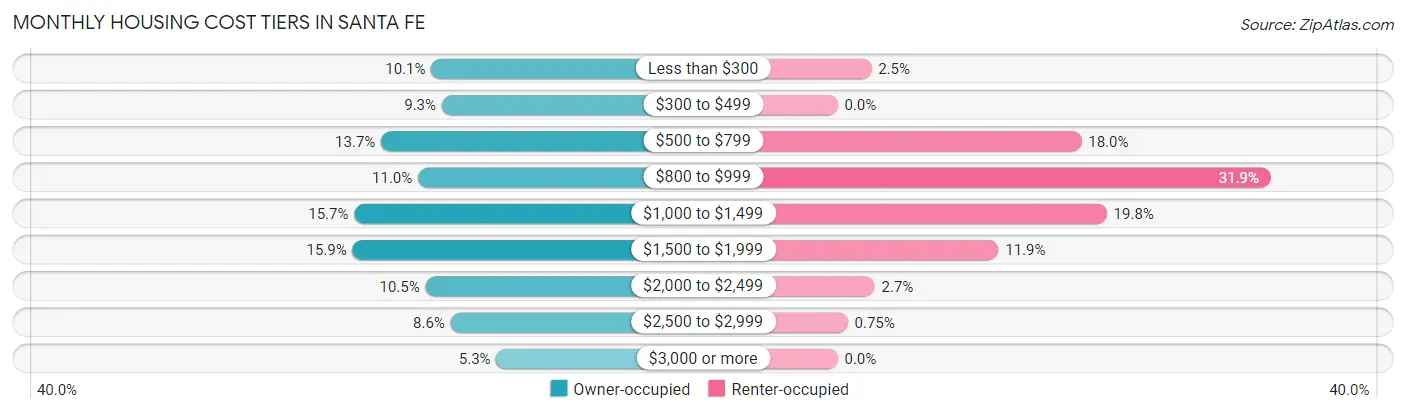
| Monthly Cost | Owner-occupied | Renter-occupied |
| Less than $300 | 385 (10.1%) | 20 (2.5%) |
| $300 to $499 | 355 (9.3%) | 0 (0.0%) |
| $500 to $799 | 526 (13.7%) | 144 (18.0%) |
| $800 to $999 | 422 (11.0%) | 256 (31.9%) |
| $1,000 to $1,499 | 602 (15.7%) | 159 (19.8%) |
| $1,500 to $1,999 | 607 (15.9%) | 95 (11.8%) |
| $2,000 to $2,499 | 401 (10.5%) | 22 (2.7%) |
| $2,500 to $2,999 | 330 (8.6%) | 6 (0.7%) |
| $3,000 or more | 201 (5.2%) | 0 (0.0%) |
| Total | 3,829 (100.0%) | 802 (100.0%) |
Physical Housing Characteristics in Santa Fe
Housing Structures in Santa Fe
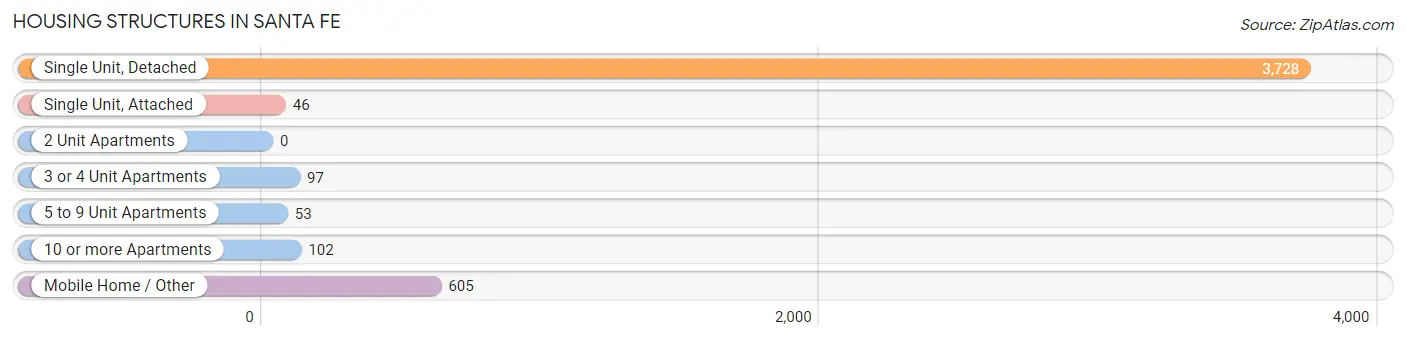
| Structure Type | # Housing Units | % Housing Units |
| Single Unit, Detached | 3,728 | 80.5% |
| Single Unit, Attached | 46 | 1.0% |
| 2 Unit Apartments | 0 | 0.0% |
| 3 or 4 Unit Apartments | 97 | 2.1% |
| 5 to 9 Unit Apartments | 53 | 1.1% |
| 10 or more Apartments | 102 | 2.2% |
| Mobile Home / Other | 605 | 13.1% |
| Total | 4,631 | 100.0% |
Housing Structures by Occupancy in Santa Fe
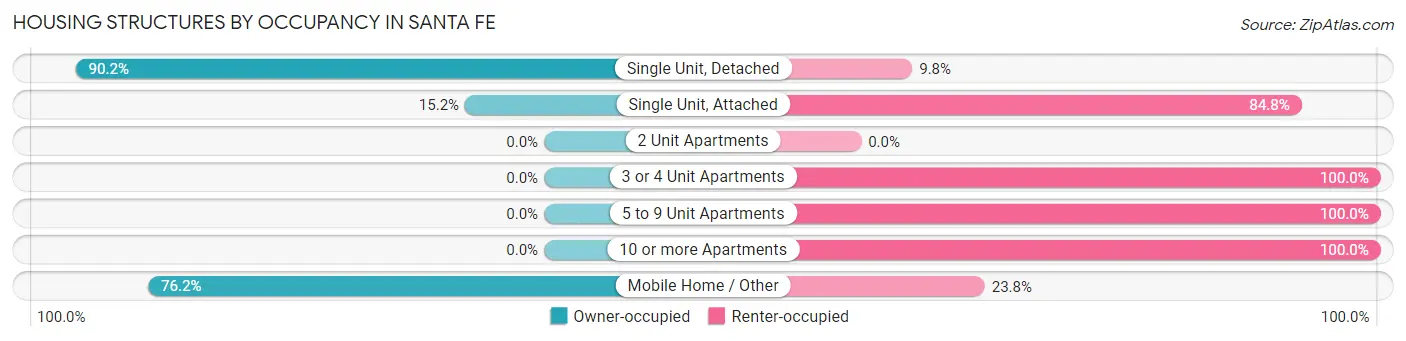
| Structure Type | Owner-occupied | Renter-occupied |
| Single Unit, Detached | 3,361 (90.2%) | 367 (9.8%) |
| Single Unit, Attached | 7 (15.2%) | 39 (84.8%) |
| 2 Unit Apartments | 0 (0.0%) | 0 (0.0%) |
| 3 or 4 Unit Apartments | 0 (0.0%) | 97 (100.0%) |
| 5 to 9 Unit Apartments | 0 (0.0%) | 53 (100.0%) |
| 10 or more Apartments | 0 (0.0%) | 102 (100.0%) |
| Mobile Home / Other | 461 (76.2%) | 144 (23.8%) |
| Total | 3,829 (82.7%) | 802 (17.3%) |
Housing Structures by Number of Rooms in Santa Fe
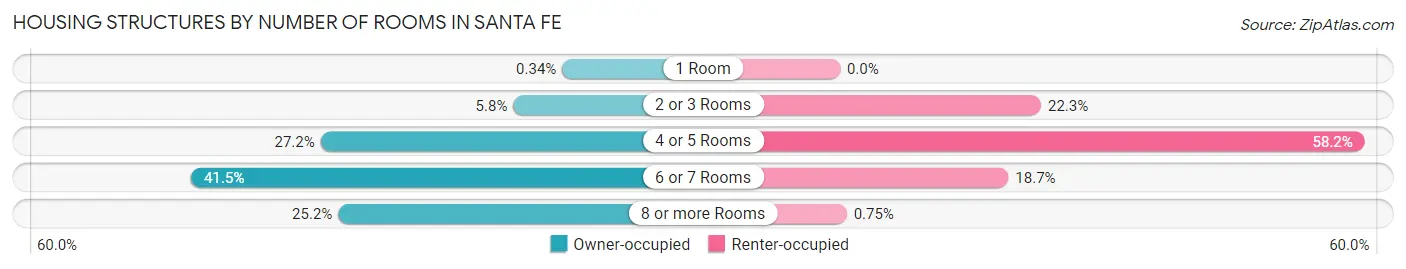
| Number of Rooms | Owner-occupied | Renter-occupied |
| 1 Room | 13 (0.3%) | 0 (0.0%) |
| 2 or 3 Rooms | 221 (5.8%) | 179 (22.3%) |
| 4 or 5 Rooms | 1,040 (27.2%) | 467 (58.2%) |
| 6 or 7 Rooms | 1,590 (41.5%) | 150 (18.7%) |
| 8 or more Rooms | 965 (25.2%) | 6 (0.7%) |
| Total | 3,829 (100.0%) | 802 (100.0%) |
Housing Structure by Heating Type in Santa Fe
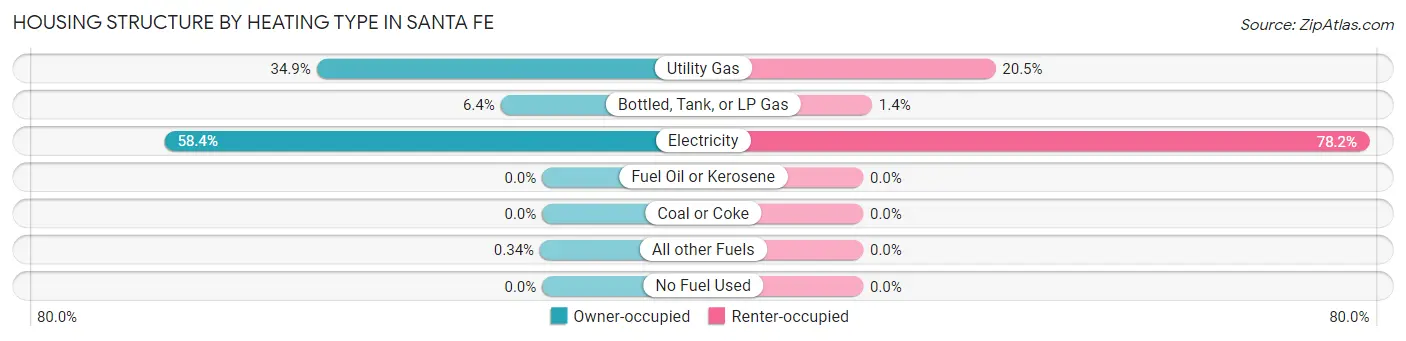
| Heating Type | Owner-occupied | Renter-occupied |
| Utility Gas | 1,335 (34.9%) | 164 (20.4%) |
| Bottled, Tank, or LP Gas | 246 (6.4%) | 11 (1.4%) |
| Electricity | 2,235 (58.4%) | 627 (78.2%) |
| Fuel Oil or Kerosene | 0 (0.0%) | 0 (0.0%) |
| Coal or Coke | 0 (0.0%) | 0 (0.0%) |
| All other Fuels | 13 (0.3%) | 0 (0.0%) |
| No Fuel Used | 0 (0.0%) | 0 (0.0%) |
| Total | 3,829 (100.0%) | 802 (100.0%) |
Household Vehicle Usage in Santa Fe
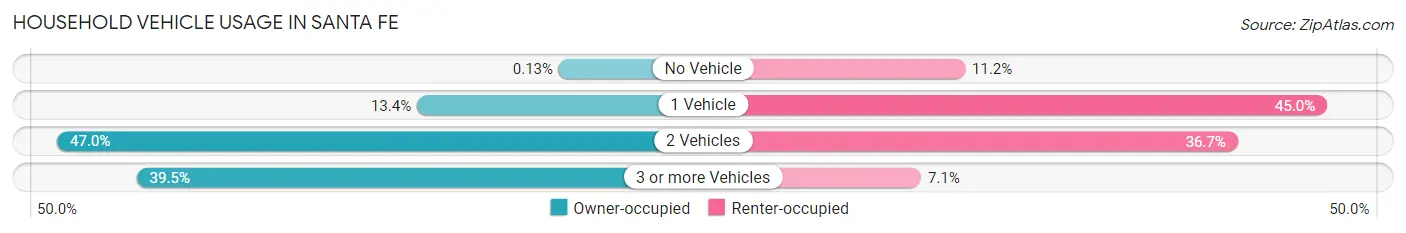
| Vehicles per Household | Owner-occupied | Renter-occupied |
| No Vehicle | 5 (0.1%) | 90 (11.2%) |
| 1 Vehicle | 512 (13.4%) | 361 (45.0%) |
| 2 Vehicles | 1,798 (47.0%) | 294 (36.7%) |
| 3 or more Vehicles | 1,514 (39.5%) | 57 (7.1%) |
| Total | 3,829 (100.0%) | 802 (100.0%) |
Real Estate & Mortgages in Santa Fe
Real Estate and Mortgage Overview in Santa Fe
| Characteristic | Without Mortgage | With Mortgage |
| Housing Units | 2,075 | 1,754 |
| Median Property Value | $235,300 | $285,500 |
| Median Household Income | $77,274 | $735 |
| Monthly Housing Costs | $712 | $201 |
| Real Estate Taxes | $3,461 | $15 |
Property Value by Mortgage Status in Santa Fe
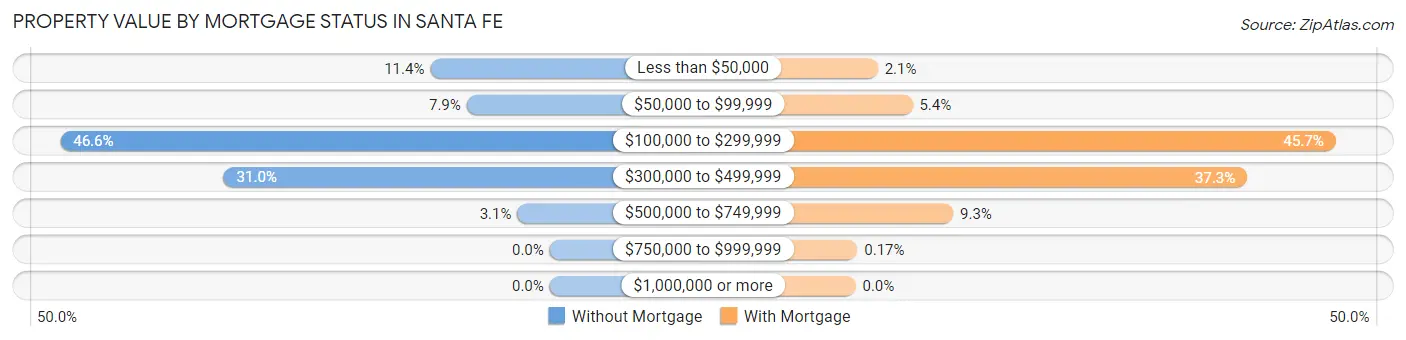
| Property Value | Without Mortgage | With Mortgage |
| Less than $50,000 | 236 (11.4%) | 37 (2.1%) |
| $50,000 to $99,999 | 164 (7.9%) | 95 (5.4%) |
| $100,000 to $299,999 | 967 (46.6%) | 802 (45.7%) |
| $300,000 to $499,999 | 644 (31.0%) | 654 (37.3%) |
| $500,000 to $749,999 | 64 (3.1%) | 163 (9.3%) |
| $750,000 to $999,999 | 0 (0.0%) | 3 (0.2%) |
| $1,000,000 or more | 0 (0.0%) | 0 (0.0%) |
| Total | 2,075 (100.0%) | 1,754 (100.0%) |
Household Income by Mortgage Status in Santa Fe
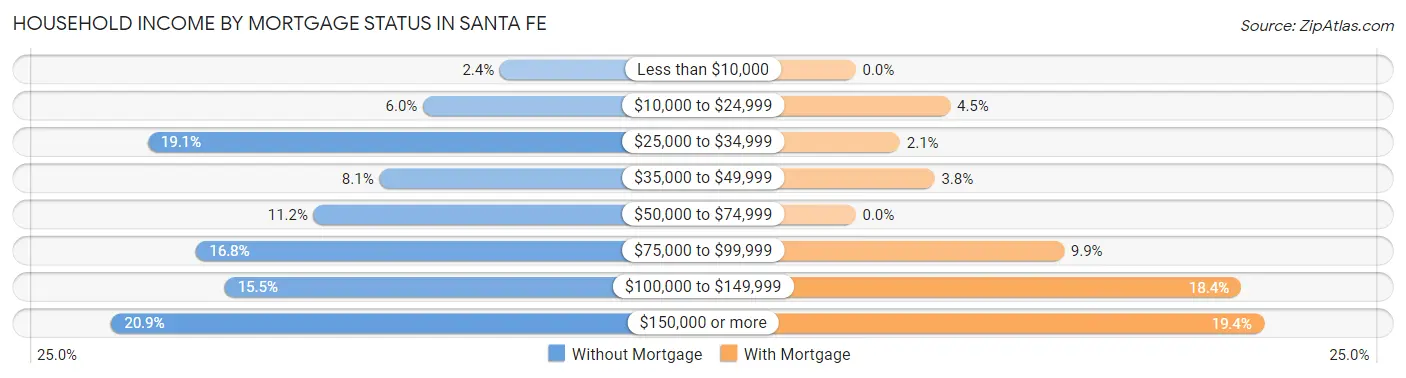
| Household Income | Without Mortgage | With Mortgage |
| Less than $10,000 | 49 (2.4%) | 0 (0.0%) |
| $10,000 to $24,999 | 125 (6.0%) | 79 (4.5%) |
| $25,000 to $34,999 | 397 (19.1%) | 37 (2.1%) |
| $35,000 to $49,999 | 168 (8.1%) | 66 (3.8%) |
| $50,000 to $74,999 | 233 (11.2%) | 0 (0.0%) |
| $75,000 to $99,999 | 349 (16.8%) | 174 (9.9%) |
| $100,000 to $149,999 | 321 (15.5%) | 322 (18.4%) |
| $150,000 or more | 433 (20.9%) | 341 (19.4%) |
| Total | 2,075 (100.0%) | 1,754 (100.0%) |
Property Value to Household Income Ratio in Santa Fe
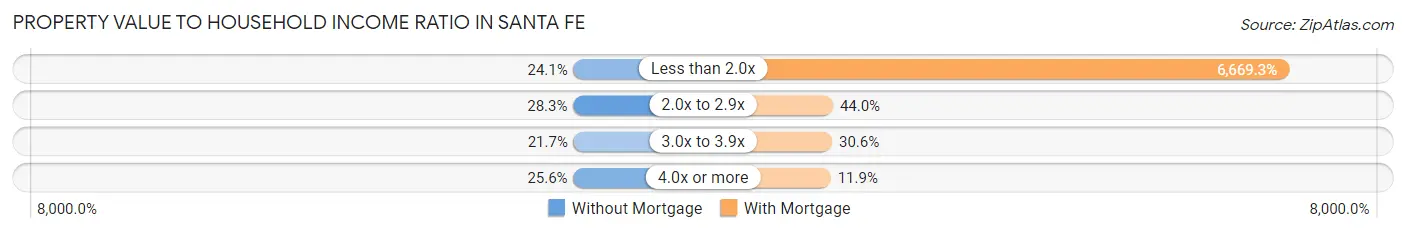
| Value-to-Income Ratio | Without Mortgage | With Mortgage |
| Less than 2.0x | 500 (24.1%) | 116,979 (6,669.3%) |
| 2.0x to 2.9x | 588 (28.3%) | 772 (44.0%) |
| 3.0x to 3.9x | 450 (21.7%) | 536 (30.6%) |
| 4.0x or more | 531 (25.6%) | 208 (11.9%) |
| Total | 2,075 (100.0%) | 1,754 (100.0%) |
Real Estate Taxes by Mortgage Status in Santa Fe
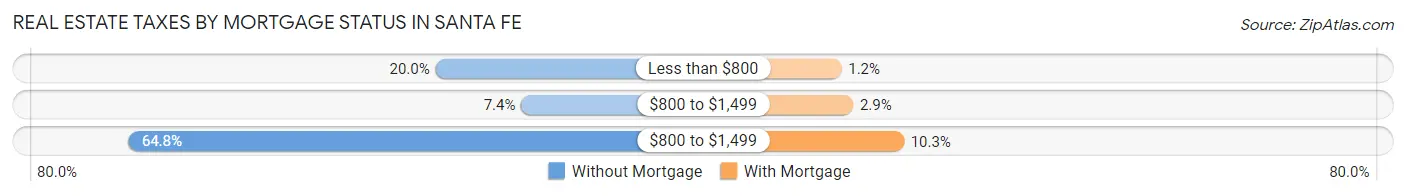
| Property Taxes | Without Mortgage | With Mortgage |
| Less than $800 | 414 (20.0%) | 21 (1.2%) |
| $800 to $1,499 | 154 (7.4%) | 51 (2.9%) |
| $800 to $1,499 | 1,344 (64.8%) | 181 (10.3%) |
| Total | 2,075 (100.0%) | 1,754 (100.0%) |
Health & Disability in Santa Fe
Health Insurance Coverage by Age in Santa Fe
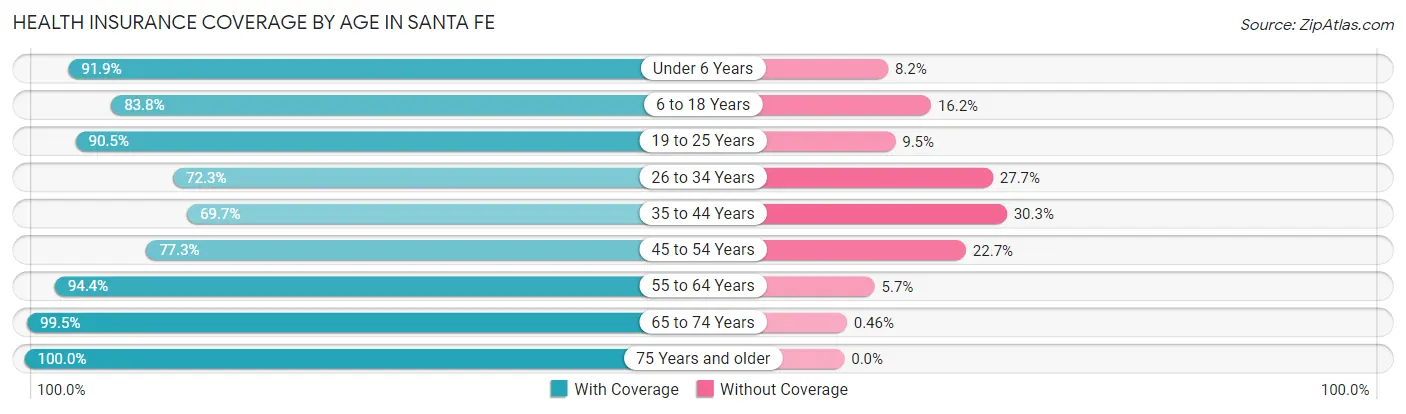
| Age Bracket | With Coverage | Without Coverage |
| Under 6 Years | 733 (91.8%) | 65 (8.2%) |
| 6 to 18 Years | 1,572 (83.8%) | 303 (16.2%) |
| 19 to 25 Years | 951 (90.5%) | 100 (9.5%) |
| 26 to 34 Years | 882 (72.3%) | 338 (27.7%) |
| 35 to 44 Years | 1,321 (69.7%) | 574 (30.3%) |
| 45 to 54 Years | 1,377 (77.3%) | 404 (22.7%) |
| 55 to 64 Years | 2,121 (94.4%) | 127 (5.7%) |
| 65 to 74 Years | 1,075 (99.5%) | 5 (0.5%) |
| 75 Years and older | 830 (100.0%) | 0 (0.0%) |
| Total | 10,862 (85.0%) | 1,916 (15.0%) |
Health Insurance Coverage by Citizenship Status in Santa Fe
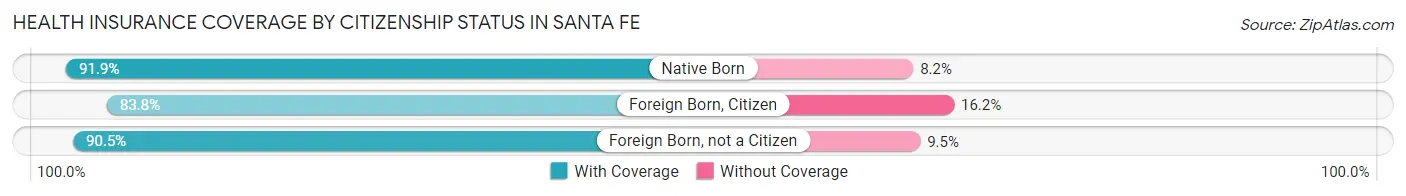
| Citizenship Status | With Coverage | Without Coverage |
| Native Born | 733 (91.8%) | 65 (8.2%) |
| Foreign Born, Citizen | 1,572 (83.8%) | 303 (16.2%) |
| Foreign Born, not a Citizen | 951 (90.5%) | 100 (9.5%) |
Health Insurance Coverage by Household Income in Santa Fe
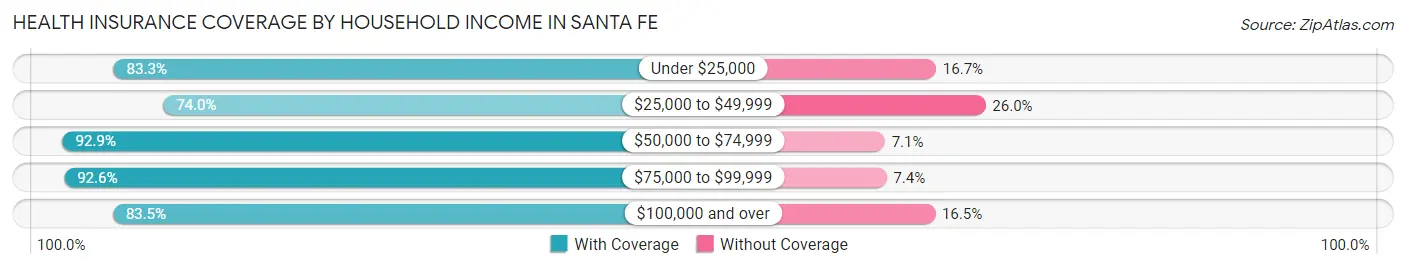
| Household Income | With Coverage | Without Coverage |
| Under $25,000 | 554 (83.3%) | 111 (16.7%) |
| $25,000 to $49,999 | 1,254 (74.0%) | 440 (26.0%) |
| $50,000 to $74,999 | 1,400 (92.9%) | 107 (7.1%) |
| $75,000 to $99,999 | 2,179 (92.6%) | 175 (7.4%) |
| $100,000 and over | 5,474 (83.5%) | 1,083 (16.5%) |
Public vs Private Health Insurance Coverage by Age in Santa Fe
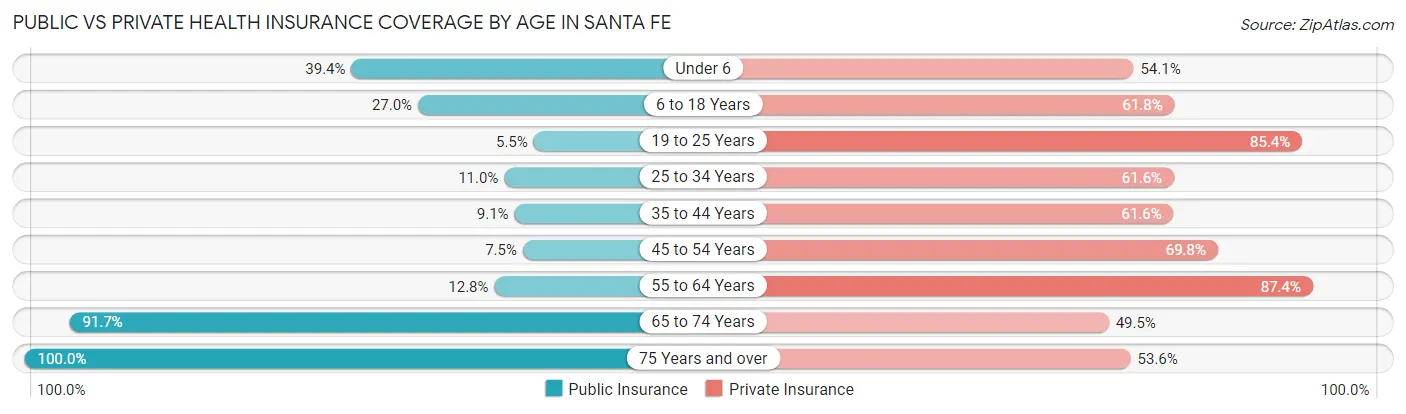
| Age Bracket | Public Insurance | Private Insurance |
| Under 6 | 314 (39.4%) | 432 (54.1%) |
| 6 to 18 Years | 506 (27.0%) | 1,158 (61.8%) |
| 19 to 25 Years | 58 (5.5%) | 898 (85.4%) |
| 25 to 34 Years | 134 (11.0%) | 752 (61.6%) |
| 35 to 44 Years | 172 (9.1%) | 1,167 (61.6%) |
| 45 to 54 Years | 134 (7.5%) | 1,243 (69.8%) |
| 55 to 64 Years | 288 (12.8%) | 1,965 (87.4%) |
| 65 to 74 Years | 990 (91.7%) | 535 (49.5%) |
| 75 Years and over | 830 (100.0%) | 445 (53.6%) |
| Total | 3,426 (26.8%) | 8,595 (67.3%) |
Disability Status by Sex by Age in Santa Fe
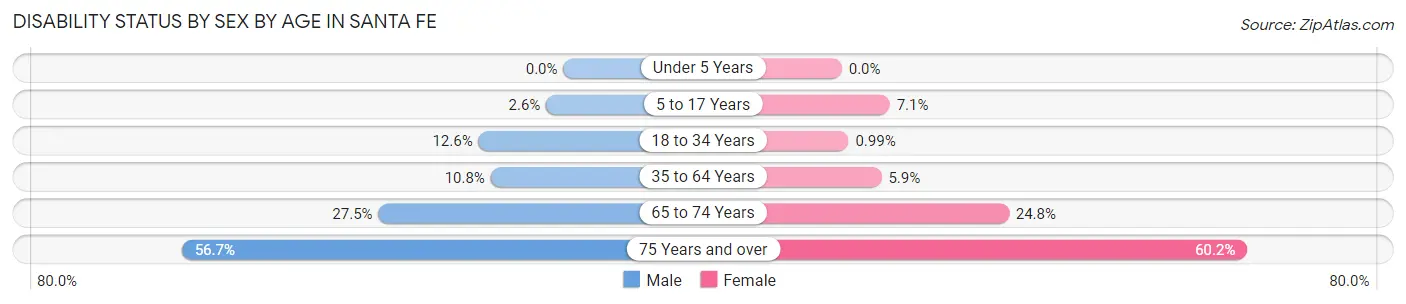
| Age Bracket | Male | Female |
| Under 5 Years | 0 (0.0%) | 0 (0.0%) |
| 5 to 17 Years | 25 (2.5%) | 57 (7.1%) |
| 18 to 34 Years | 162 (12.6%) | 12 (1.0%) |
| 35 to 64 Years | 295 (10.8%) | 188 (5.9%) |
| 65 to 74 Years | 156 (27.5%) | 127 (24.8%) |
| 75 Years and over | 187 (56.7%) | 301 (60.2%) |
Disability Class by Sex by Age in Santa Fe
Disability Class: Hearing Difficulty
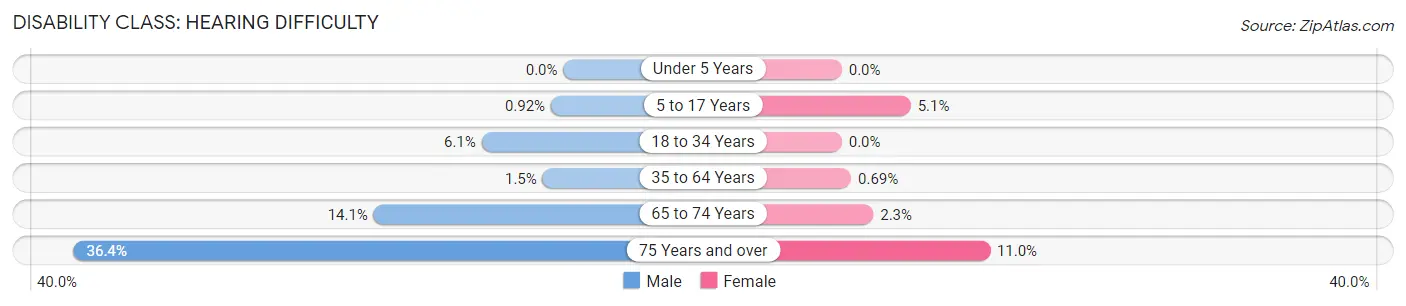
| Age Bracket | Male | Female |
| Under 5 Years | 0 (0.0%) | 0 (0.0%) |
| 5 to 17 Years | 9 (0.9%) | 41 (5.1%) |
| 18 to 34 Years | 78 (6.1%) | 0 (0.0%) |
| 35 to 64 Years | 42 (1.5%) | 22 (0.7%) |
| 65 to 74 Years | 80 (14.1%) | 12 (2.3%) |
| 75 Years and over | 120 (36.4%) | 55 (11.0%) |
Disability Class: Vision Difficulty
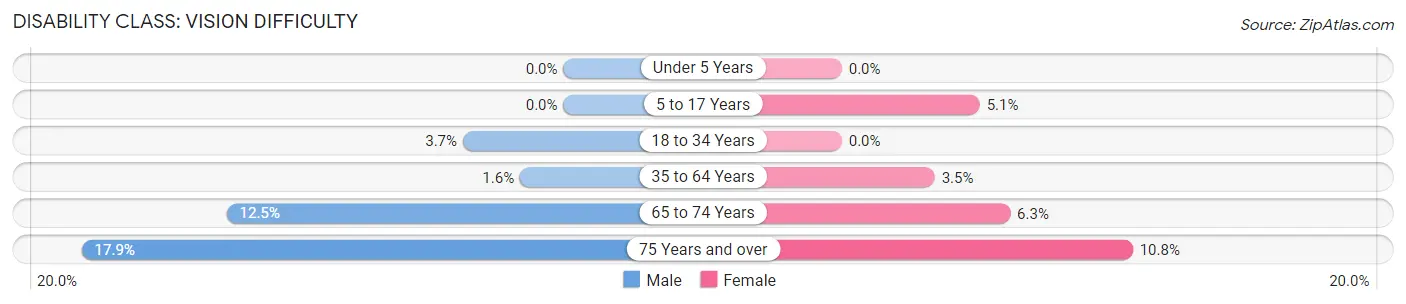
| Age Bracket | Male | Female |
| Under 5 Years | 0 (0.0%) | 0 (0.0%) |
| 5 to 17 Years | 0 (0.0%) | 41 (5.1%) |
| 18 to 34 Years | 48 (3.7%) | 0 (0.0%) |
| 35 to 64 Years | 44 (1.6%) | 110 (3.5%) |
| 65 to 74 Years | 71 (12.5%) | 32 (6.2%) |
| 75 Years and over | 59 (17.9%) | 54 (10.8%) |
Disability Class: Cognitive Difficulty
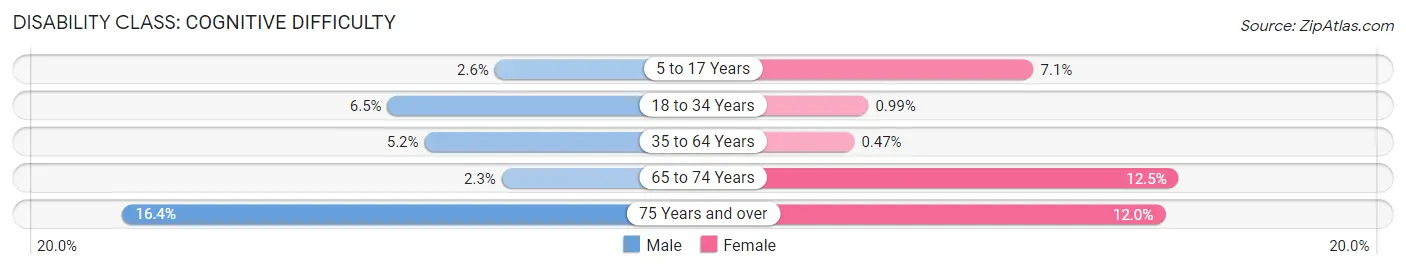
| Age Bracket | Male | Female |
| 5 to 17 Years | 25 (2.5%) | 57 (7.1%) |
| 18 to 34 Years | 84 (6.5%) | 12 (1.0%) |
| 35 to 64 Years | 141 (5.2%) | 15 (0.5%) |
| 65 to 74 Years | 13 (2.3%) | 64 (12.5%) |
| 75 Years and over | 54 (16.4%) | 60 (12.0%) |
Disability Class: Ambulatory Difficulty
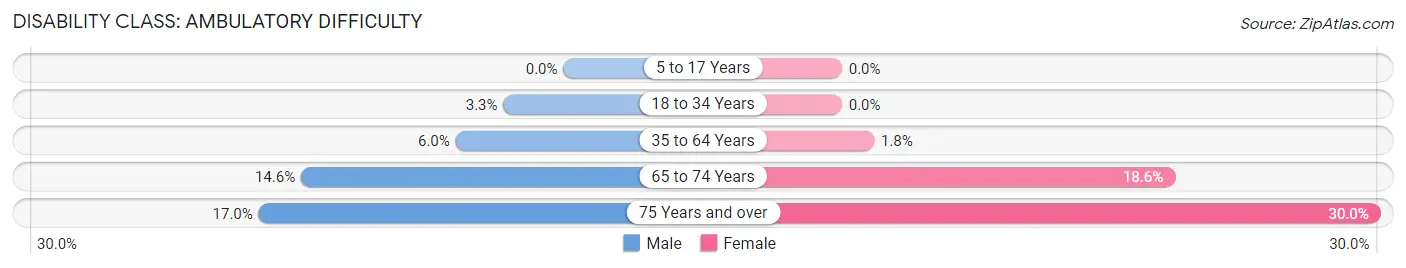
| Age Bracket | Male | Female |
| 5 to 17 Years | 0 (0.0%) | 0 (0.0%) |
| 18 to 34 Years | 43 (3.3%) | 0 (0.0%) |
| 35 to 64 Years | 164 (6.0%) | 57 (1.8%) |
| 65 to 74 Years | 83 (14.6%) | 95 (18.5%) |
| 75 Years and over | 56 (17.0%) | 150 (30.0%) |
Disability Class: Self-Care Difficulty
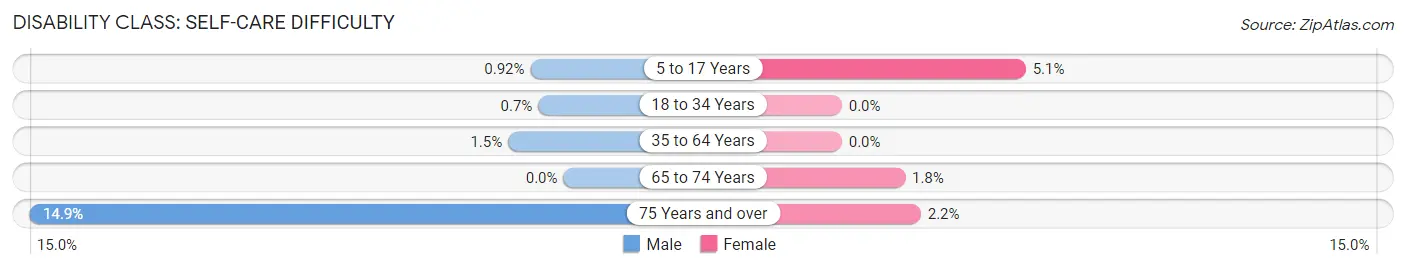
| Age Bracket | Male | Female |
| 5 to 17 Years | 9 (0.9%) | 41 (5.1%) |
| 18 to 34 Years | 9 (0.7%) | 0 (0.0%) |
| 35 to 64 Years | 42 (1.5%) | 0 (0.0%) |
| 65 to 74 Years | 0 (0.0%) | 9 (1.8%) |
| 75 Years and over | 49 (14.8%) | 11 (2.2%) |
Technology Access in Santa Fe
Computing Device Access in Santa Fe
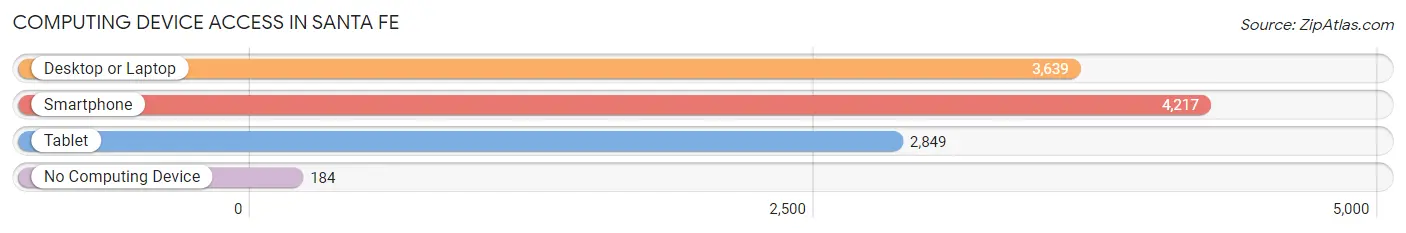
| Device Type | # Households | % Households |
| Desktop or Laptop | 3,639 | 78.6% |
| Smartphone | 4,217 | 91.1% |
| Tablet | 2,849 | 61.5% |
| No Computing Device | 184 | 4.0% |
| Total | 4,631 | 100.0% |
Internet Access in Santa Fe
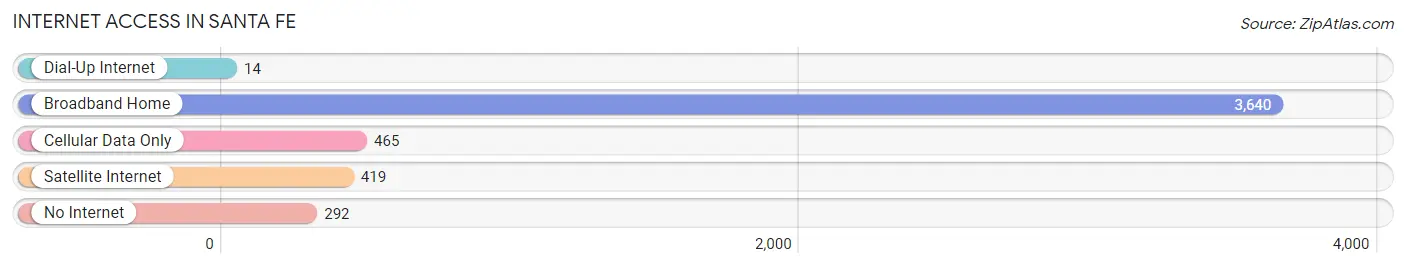
| Internet Type | # Households | % Households |
| Dial-Up Internet | 14 | 0.3% |
| Broadband Home | 3,640 | 78.6% |
| Cellular Data Only | 465 | 10.0% |
| Satellite Internet | 419 | 9.0% |
| No Internet | 292 | 6.3% |
| Total | 4,631 | 100.0% |
Santa Fe Summary
Santa Fe, Texas is a city located in Galveston County, Texas, United States. The city is located approximately 25 miles southeast of Houston and is part of the Houston–The Woodlands–Sugar Land metropolitan area. As of the 2010 census, the city had a population of 12,222.
History
The area that is now Santa Fe was first settled in the early 1800s by a group of settlers from the nearby town of Galveston. The settlers named the area Santa Fe, after the nearby Santa Fe River. The town was officially incorporated in 1876.
In the late 1800s, the town was a major shipping port for cotton and other agricultural products. The town was also home to several sawmills and lumberyards.
In the early 1900s, the town began to experience a population boom as the Houston Ship Channel was built nearby. This allowed for easier access to the port of Galveston and the Gulf of Mexico.
In the 1950s, the town experienced a population decline as many of the residents moved to Houston for better job opportunities. However, the town has since experienced a resurgence in population as many people have moved back to the area.
Geography
Santa Fe is located in southeastern Galveston County at 29°22′N 95°3′W (29.36, -95.05). It is bordered to the north by Hitchcock, to the east by La Marque, to the south by Dickinson, and to the west by Alvin.
The city is located on the Gulf Coastal Plain, and is approximately 25 miles southeast of Houston. The terrain is mostly flat, with some rolling hills. The Santa Fe River runs through the city.
Economy
The economy of Santa Fe is largely based on the oil and gas industry. The city is home to several oil and gas companies, including Chevron, Shell, and ExxonMobil.
The city is also home to several manufacturing companies including a paper mill and a steel mill
The city is also home to several retail stores including Walmart Target and Home Depot
Demographics
As of the 2010 census, the city had a population of 12,222. The racial makeup of the city was 73.3% White, 17.2% African American, 0.7% Native American, 0.7% Asian, 0.1% Pacific Islander, 6.2% from other races, and 2.0% from two or more races. Hispanic or Latino of any race were 18.3% of the population.
The median income for a household in the city was $41,945, and the median income for a family was $50,945. The per capita income for the city was $20,945. About 11.2% of families and 14.2% of the population were below the poverty line, including 19.2% of those under age 18 and 8.2% of those age 65 or over.
Common Questions
What is Per Capita Income in Santa Fe?
Per Capita income in Santa Fe is $41,479.
What is the Median Family Income in Santa Fe?
Median Family Income in Santa Fe is $96,775.
What is the Median Household income in Santa Fe?
Median Household Income in Santa Fe is $91,209.
What is Income or Wage Gap in Santa Fe?
Income or Wage Gap in Santa Fe is 16.8%.
Women in Santa Fe earn 83.2 cents for every dollar earned by a man.
What is Family Income Deficit in Santa Fe?
Family Income Deficit in Santa Fe is $10,832.
Families that are below poverty line in Santa Fe earn $10,832 less on average than the poverty threshold level.
What is Inequality or Gini Index in Santa Fe?
Inequality or Gini Index in Santa Fe is 0.44.
What is the Total Population of Santa Fe?
Total Population of Santa Fe is 12,792.
What is the Total Male Population of Santa Fe?
Total Male Population of Santa Fe is 6,298.
What is the Total Female Population of Santa Fe?
Total Female Population of Santa Fe is 6,494.
What is the Ratio of Males per 100 Females in Santa Fe?
There are 96.98 Males per 100 Females in Santa Fe.
What is the Ratio of Females per 100 Males in Santa Fe?
There are 103.11 Females per 100 Males in Santa Fe.
What is the Median Population Age in Santa Fe?
Median Population Age in Santa Fe is 42.7 Years.
What is the Average Family Size in Santa Fe
Average Family Size in Santa Fe is 3.1 People.
What is the Average Household Size in Santa Fe
Average Household Size in Santa Fe is 2.8 People.
How Large is the Labor Force in Santa Fe?
There are 6,444 People in the Labor Forcein in Santa Fe.
What is the Percentage of People in the Labor Force in Santa Fe?
60.0% of People are in the Labor Force in Santa Fe.
What is the Unemployment Rate in Santa Fe?
Unemployment Rate in Santa Fe is 7.8%.