Richwood, TX Map & Demographics
Richwood Map
Richwood Overview
$34,069
PER CAPITA INCOME
$90,848
AVG FAMILY INCOME
$75,500
AVG HOUSEHOLD INCOME
46.9%
WAGE / INCOME GAP [ % ]
53.1¢/ $1
WAGE / INCOME GAP [ $ ]
0.37
INEQUALITY / GINI INDEX
4,712
TOTAL POPULATION
2,398
MALE POPULATION
2,314
FEMALE POPULATION
103.63
MALES / 100 FEMALES
96.50
FEMALES / 100 MALES
30.1
MEDIAN AGE
3.4
AVG FAMILY SIZE
2.8
AVG HOUSEHOLD SIZE
2,427
LABOR FORCE [ PEOPLE ]
72.7%
PERCENT IN LABOR FORCE
5.7%
UNEMPLOYMENT RATE
Richwood Area Codes
Income in Richwood
Income Overview in Richwood
Per Capita Income in Richwood is $34,069, while median incomes of families and households are $90,848 and $75,500 respectively.
| Characteristic | Number | Measure |
| Per Capita Income | 4,712 | $34,069 |
| Median Family Income | 1,199 | $90,848 |
| Mean Family Income | 1,199 | $104,456 |
| Median Household Income | 1,710 | $75,500 |
| Mean Household Income | 1,710 | $93,166 |
| Income Deficit | 1,199 | $0 |
| Wage / Income Gap (%) | 4,712 | 46.90% |
| Wage / Income Gap ($) | 4,712 | 53.10¢ per $1 |
| Gini / Inequality Index | 4,712 | 0.37 |
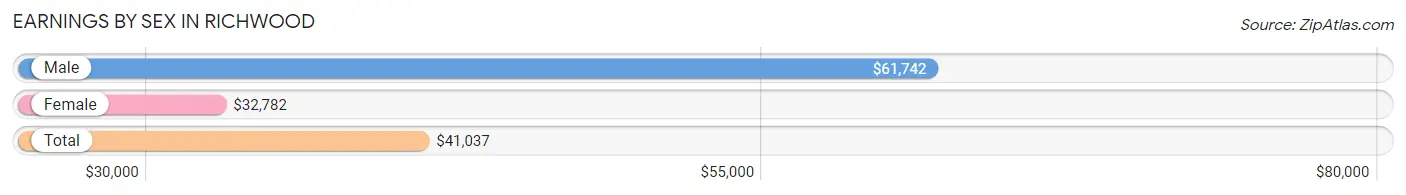
Earnings by Sex in Richwood
Average Earnings in Richwood are $41,037, $61,742 for men and $32,782 for women, a difference of 46.9%.
| Sex | Number | Average Earnings |
| Male | 1,254 (51.7%) | $61,742 |
| Female | 1,170 (48.3%) | $32,782 |
| Total | 2,424 (100.0%) | $41,037 |
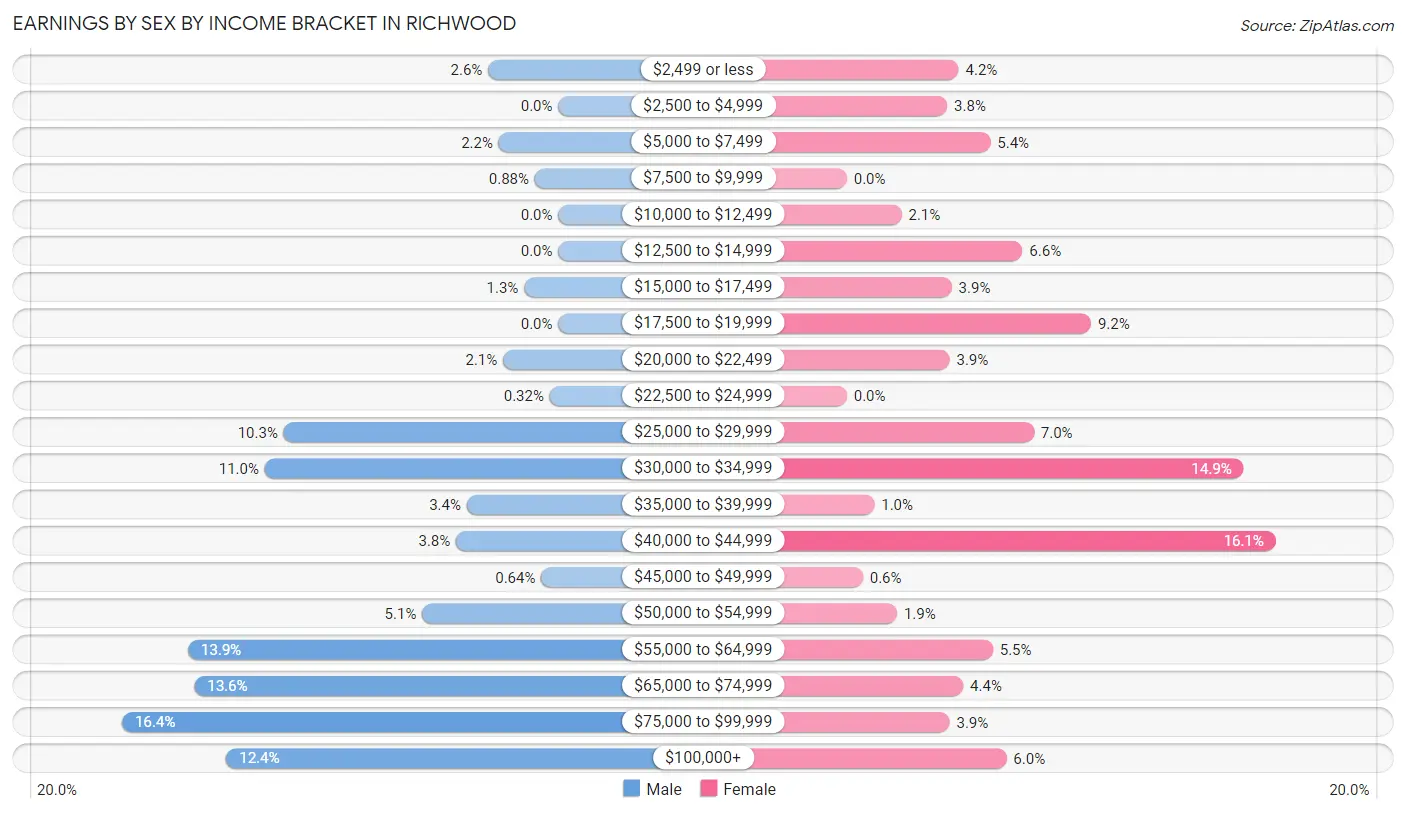
Earnings by Sex by Income Bracket in Richwood
The most common earnings brackets in Richwood are $75,000 to $99,999 for men (205 | 16.4%) and $40,000 to $44,999 for women (188 | 16.1%).
| Income | Male | Female |
| $2,499 or less | 33 (2.6%) | 49 (4.2%) |
| $2,500 to $4,999 | 0 (0.0%) | 44 (3.8%) |
| $5,000 to $7,499 | 28 (2.2%) | 63 (5.4%) |
| $7,500 to $9,999 | 11 (0.9%) | 0 (0.0%) |
| $10,000 to $12,499 | 0 (0.0%) | 24 (2.1%) |
| $12,500 to $14,999 | 0 (0.0%) | 77 (6.6%) |
| $15,000 to $17,499 | 16 (1.3%) | 46 (3.9%) |
| $17,500 to $19,999 | 0 (0.0%) | 107 (9.1%) |
| $20,000 to $22,499 | 26 (2.1%) | 45 (3.8%) |
| $22,500 to $24,999 | 4 (0.3%) | 0 (0.0%) |
| $25,000 to $29,999 | 129 (10.3%) | 82 (7.0%) |
| $30,000 to $34,999 | 138 (11.0%) | 174 (14.9%) |
| $35,000 to $39,999 | 43 (3.4%) | 12 (1.0%) |
| $40,000 to $44,999 | 48 (3.8%) | 188 (16.1%) |
| $45,000 to $49,999 | 8 (0.6%) | 7 (0.6%) |
| $50,000 to $54,999 | 64 (5.1%) | 22 (1.9%) |
| $55,000 to $64,999 | 174 (13.9%) | 64 (5.5%) |
| $65,000 to $74,999 | 171 (13.6%) | 51 (4.4%) |
| $75,000 to $99,999 | 205 (16.4%) | 45 (3.8%) |
| $100,000+ | 156 (12.4%) | 70 (6.0%) |
| Total | 1,254 (100.0%) | 1,170 (100.0%) |
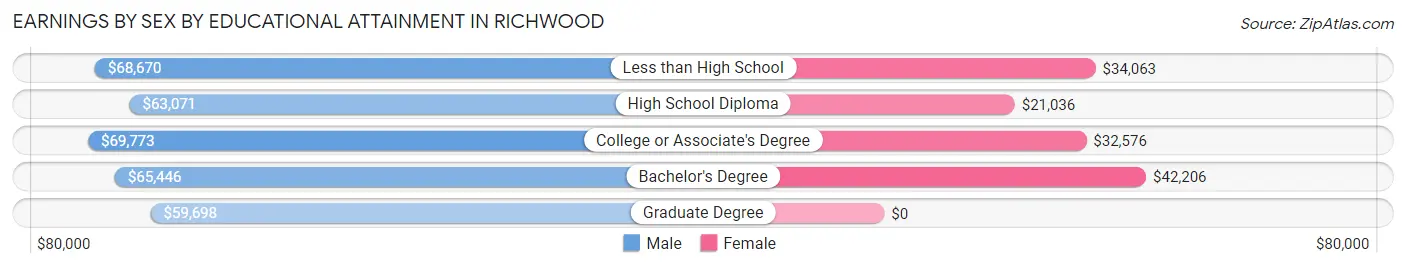
Earnings by Sex by Educational Attainment in Richwood
Average earnings in Richwood are $66,786 for men and $34,243 for women, a difference of 48.7%. Men with an educational attainment of college or associate's degree enjoy the highest average annual earnings of $69,773, while those with graduate degree education earn the least with $59,698. Women with an educational attainment of bachelor's degree earn the most with the average annual earnings of $42,206, while those with high school diploma education have the smallest earnings of $21,036.
| Educational Attainment | Male Income | Female Income |
| Less than High School | $68,670 | $34,063 |
| High School Diploma | $63,071 | $21,036 |
| College or Associate's Degree | $69,773 | $32,576 |
| Bachelor's Degree | $65,446 | $42,206 |
| Graduate Degree | $59,698 | $0 |
| Total | $66,786 | $34,243 |
Family Income in Richwood
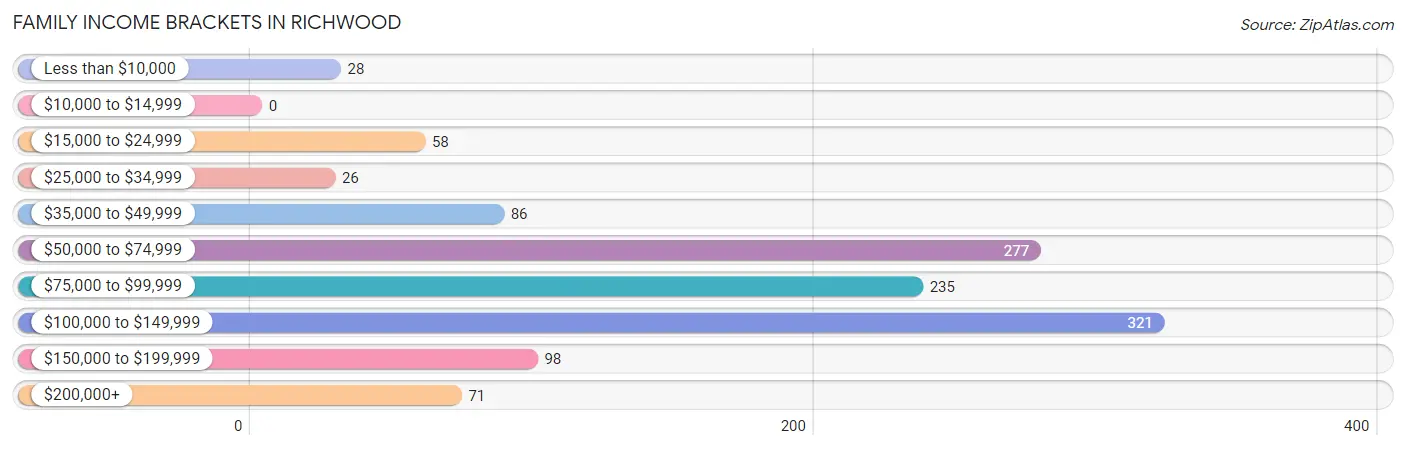
Family Income Brackets in Richwood
According to the Richwood family income data, there are 321 families falling into the $100,000 to $149,999 income range, which is the most common income bracket and makes up 26.8% of all families.
| Income Bracket | # Families | % Families |
| Less than $10,000 | 28 | 2.3% |
| $10,000 to $14,999 | 0 | 0.0% |
| $15,000 to $24,999 | 58 | 4.8% |
| $25,000 to $34,999 | 26 | 2.2% |
| $35,000 to $49,999 | 86 | 7.2% |
| $50,000 to $74,999 | 277 | 23.1% |
| $75,000 to $99,999 | 235 | 19.6% |
| $100,000 to $149,999 | 321 | 26.8% |
| $150,000 to $199,999 | 98 | 8.2% |
| $200,000+ | 71 | 5.9% |
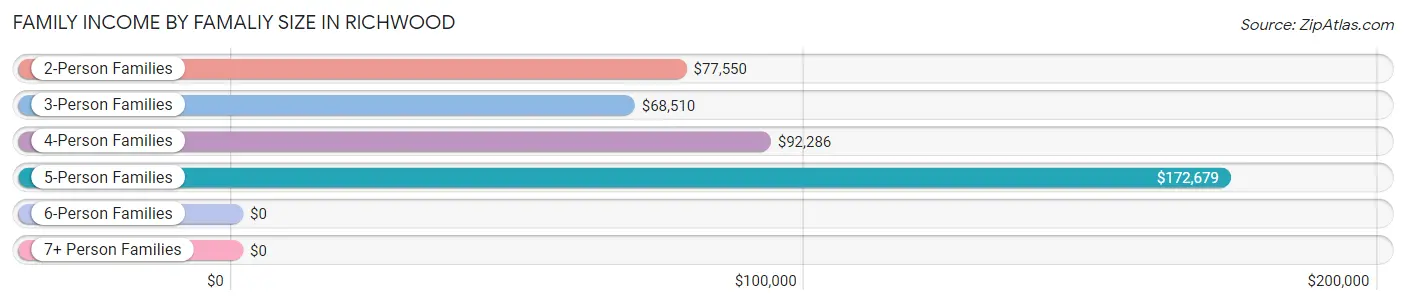
Family Income by Famaliy Size in Richwood
5-person families (39 | 3.3%) account for the highest median family income in Richwood with $172,679 per family, while 2-person families (500 | 41.7%) have the highest median income of $38,775 per family member.
| Income Bracket | # Families | Median Income |
| 2-Person Families | 500 (41.7%) | $77,550 |
| 3-Person Families | 237 (19.8%) | $68,510 |
| 4-Person Families | 309 (25.8%) | $92,286 |
| 5-Person Families | 39 (3.3%) | $172,679 |
| 6-Person Families | 78 (6.5%) | $0 |
| 7+ Person Families | 36 (3.0%) | $0 |
| Total | 1,199 (100.0%) | $90,848 |
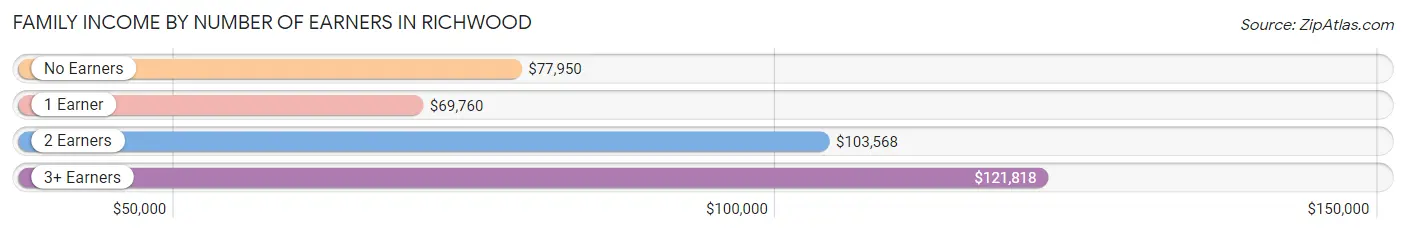
Family Income by Number of Earners in Richwood
The median family income in Richwood is $90,848, with families comprising 3+ earners (98) having the highest median family income of $121,818, while families with 1 earner (351) have the lowest median family income of $69,760, accounting for 8.2% and 29.3% of families, respectively.
| Number of Earners | # Families | Median Income |
| No Earners | 174 (14.5%) | $77,950 |
| 1 Earner | 351 (29.3%) | $69,760 |
| 2 Earners | 576 (48.0%) | $103,568 |
| 3+ Earners | 98 (8.2%) | $121,818 |
| Total | 1,199 (100.0%) | $90,848 |
Household Income in Richwood
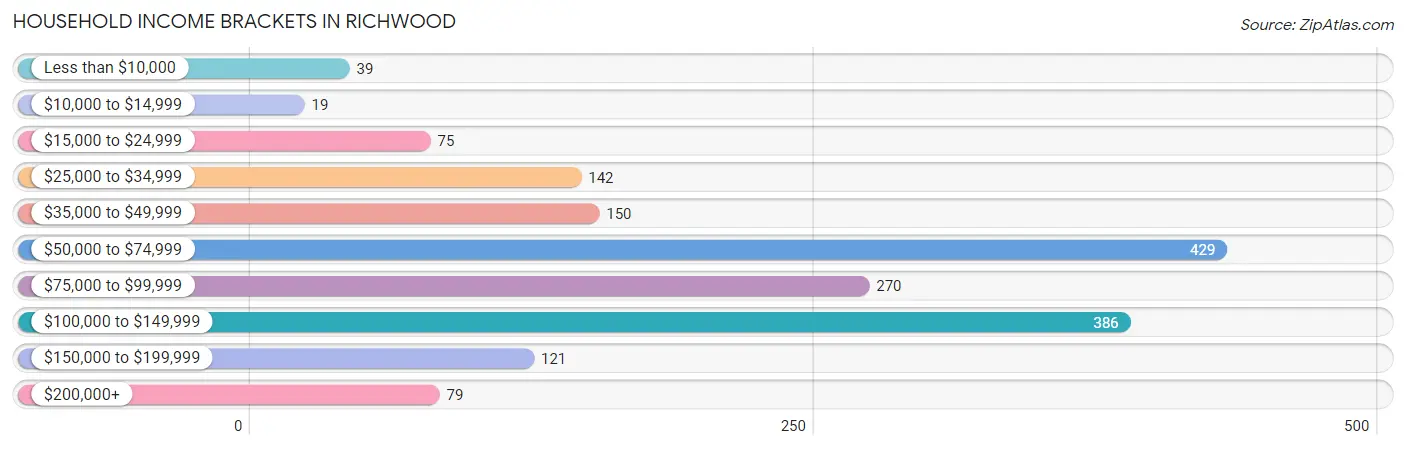
Household Income Brackets in Richwood
With 429 households falling in the category, the $50,000 to $74,999 income range is the most frequent in Richwood, accounting for 25.1% of all households. In contrast, only 19 households (1.1%) fall into the $10,000 to $14,999 income bracket, making it the least populous group.
| Income Bracket | # Households | % Households |
| Less than $10,000 | 39 | 2.3% |
| $10,000 to $14,999 | 19 | 1.1% |
| $15,000 to $24,999 | 75 | 4.4% |
| $25,000 to $34,999 | 142 | 8.3% |
| $35,000 to $49,999 | 150 | 8.8% |
| $50,000 to $74,999 | 429 | 25.1% |
| $75,000 to $99,999 | 270 | 15.8% |
| $100,000 to $149,999 | 386 | 22.6% |
| $150,000 to $199,999 | 121 | 7.1% |
| $200,000+ | 79 | 4.6% |
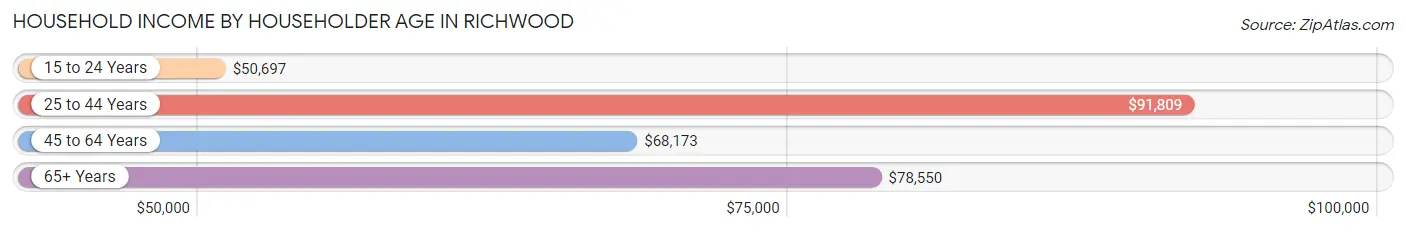
Household Income by Householder Age in Richwood
The median household income in Richwood is $75,500, with the highest median household income of $91,809 found in the 25 to 44 years age bracket for the primary householder. A total of 748 households (43.7%) fall into this category. Meanwhile, the 15 to 24 years age bracket for the primary householder has the lowest median household income of $50,697, with 186 households (10.9%) in this group.
| Income Bracket | # Households | Median Income |
| 15 to 24 Years | 186 (10.9%) | $50,697 |
| 25 to 44 Years | 748 (43.7%) | $91,809 |
| 45 to 64 Years | 544 (31.8%) | $68,173 |
| 65+ Years | 232 (13.6%) | $78,550 |
| Total | 1,710 (100.0%) | $75,500 |
Poverty in Richwood
Income Below Poverty by Sex and Age in Richwood
With 1.6% poverty level for males and 6.2% for females among the residents of Richwood, 55 to 64 year old males and 15 year old females are the most vulnerable to poverty, with 18 males (6.7%) and 12 females (42.9%) in their respective age groups living below the poverty level.

| Age Bracket | Male | Female |
| Under 5 Years | 10 (2.9%) | 0 (0.0%) |
| 5 Years | 0 (0.0%) | 0 (0.0%) |
| 6 to 11 Years | 0 (0.0%) | 0 (0.0%) |
| 12 to 14 Years | 0 (0.0%) | 0 (0.0%) |
| 15 Years | 0 (0.0%) | 12 (42.9%) |
| 16 and 17 Years | 0 (0.0%) | 0 (0.0%) |
| 18 to 24 Years | 11 (6.2%) | 18 (5.4%) |
| 25 to 34 Years | 0 (0.0%) | 42 (13.9%) |
| 35 to 44 Years | 0 (0.0%) | 0 (0.0%) |
| 45 to 54 Years | 0 (0.0%) | 10 (6.9%) |
| 55 to 64 Years | 18 (6.7%) | 26 (9.3%) |
| 65 to 74 Years | 0 (0.0%) | 36 (27.1%) |
| 75 Years and over | 0 (0.0%) | 0 (0.0%) |
| Total | 39 (1.6%) | 144 (6.2%) |
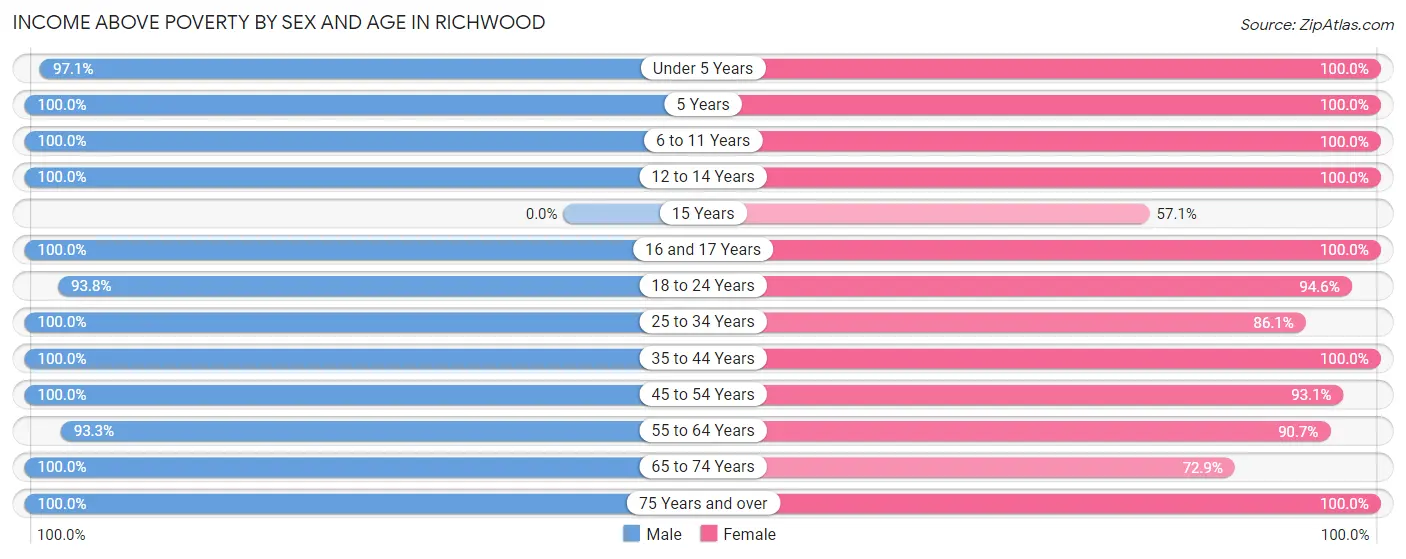
Income Above Poverty by Sex and Age in Richwood
According to the poverty statistics in Richwood, males aged 5 years and females aged under 5 years are the age groups that are most secure financially, with 100.0% of males and 100.0% of females in these age groups living above the poverty line.
| Age Bracket | Male | Female |
| Under 5 Years | 338 (97.1%) | 92 (100.0%) |
| 5 Years | 83 (100.0%) | 14 (100.0%) |
| 6 to 11 Years | 294 (100.0%) | 355 (100.0%) |
| 12 to 14 Years | 19 (100.0%) | 131 (100.0%) |
| 15 Years | 0 (0.0%) | 16 (57.1%) |
| 16 and 17 Years | 101 (100.0%) | 83 (100.0%) |
| 18 to 24 Years | 166 (93.8%) | 316 (94.6%) |
| 25 to 34 Years | 399 (100.0%) | 260 (86.1%) |
| 35 to 44 Years | 279 (100.0%) | 338 (100.0%) |
| 45 to 54 Years | 223 (100.0%) | 135 (93.1%) |
| 55 to 64 Years | 250 (93.3%) | 252 (90.6%) |
| 65 to 74 Years | 114 (100.0%) | 97 (72.9%) |
| 75 Years and over | 83 (100.0%) | 81 (100.0%) |
| Total | 2,349 (98.4%) | 2,170 (93.8%) |
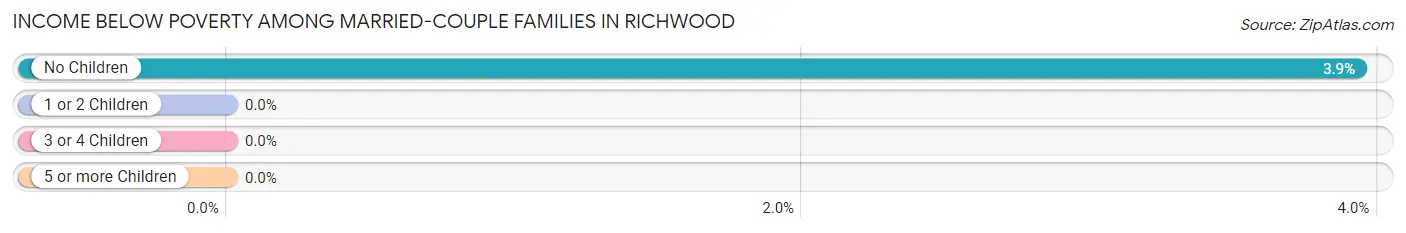
Income Below Poverty Among Married-Couple Families in Richwood
The poverty statistics for married-couple families in Richwood show that 1.9% or 18 of the total 953 families live below the poverty line. Families with no children have the highest poverty rate of 3.9%, comprising of 18 families. On the other hand, families with 1 or 2 children have the lowest poverty rate of 0.0%, which includes 0 families.
| Children | Above Poverty | Below Poverty |
| No Children | 440 (96.1%) | 18 (3.9%) |
| 1 or 2 Children | 375 (100.0%) | 0 (0.0%) |
| 3 or 4 Children | 95 (100.0%) | 0 (0.0%) |
| 5 or more Children | 25 (100.0%) | 0 (0.0%) |
| Total | 935 (98.1%) | 18 (1.9%) |
Income Below Poverty Among Single-Parent Households in Richwood
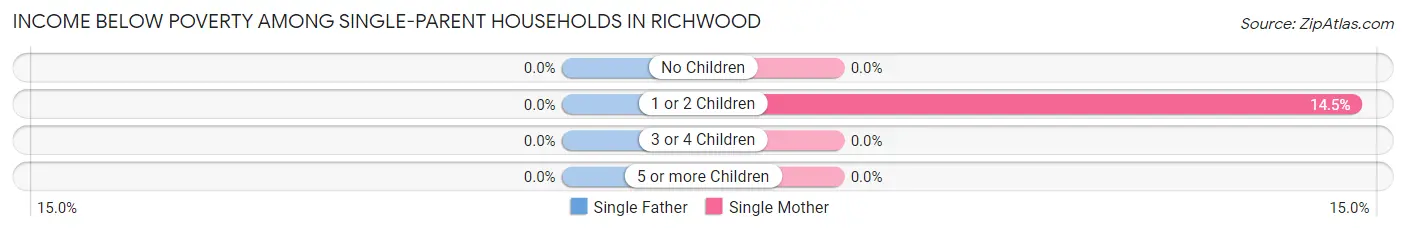
| Children | Single Father | Single Mother |
| No Children | 0 (0.0%) | 0 (0.0%) |
| 1 or 2 Children | 0 (0.0%) | 20 (14.5%) |
| 3 or 4 Children | 0 (0.0%) | 0 (0.0%) |
| 5 or more Children | 0 (0.0%) | 0 (0.0%) |
| Total | 0 (0.0%) | 20 (11.1%) |
Income Below Poverty Among Married-Couple vs Single-Parent Households in Richwood
The poverty data for Richwood shows that 18 of the married-couple family households (1.9%) and 20 of the single-parent households (8.1%) are living below the poverty level. Within the married-couple family households, those with no children have the highest poverty rate, with 18 households (3.9%) falling below the poverty line. Among the single-parent households, those with 1 or 2 children have the highest poverty rate, with 20 household (11.1%) living below poverty.
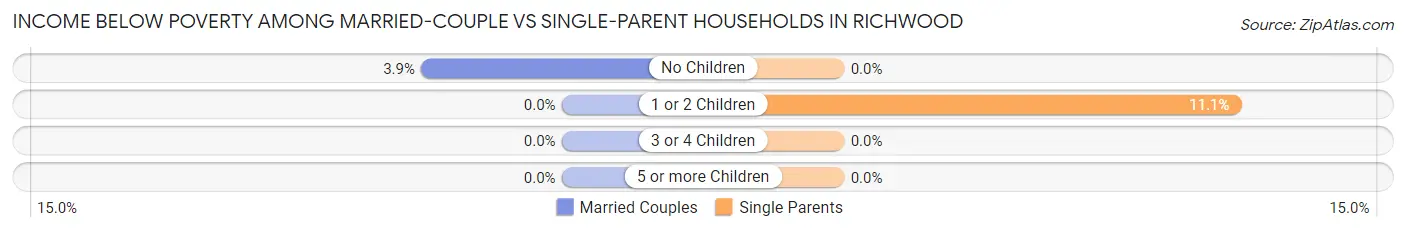
| Children | Married-Couple Families | Single-Parent Households |
| No Children | 18 (3.9%) | 0 (0.0%) |
| 1 or 2 Children | 0 (0.0%) | 20 (11.1%) |
| 3 or 4 Children | 0 (0.0%) | 0 (0.0%) |
| 5 or more Children | 0 (0.0%) | 0 (0.0%) |
| Total | 18 (1.9%) | 20 (8.1%) |
Race in Richwood
The most populous races in Richwood are White / Caucasian (3,045 | 64.6%), Hispanic or Latino (2,449 | 52.0%), and Some other Race (741 | 15.7%).
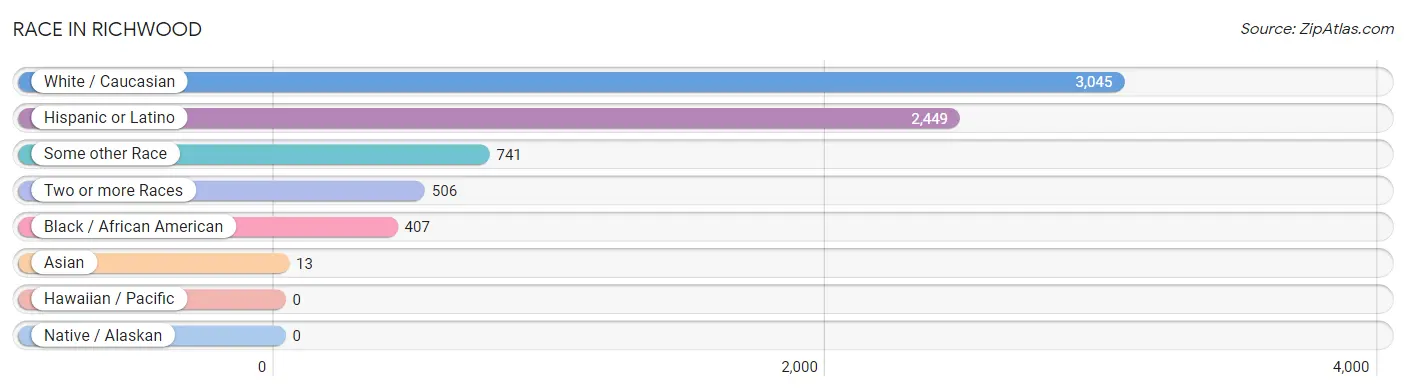
| Race | # Population | % Population |
| Asian | 13 | 0.3% |
| Black / African American | 407 | 8.6% |
| Hawaiian / Pacific | 0 | 0.0% |
| Hispanic or Latino | 2,449 | 52.0% |
| Native / Alaskan | 0 | 0.0% |
| White / Caucasian | 3,045 | 64.6% |
| Two or more Races | 506 | 10.7% |
| Some other Race | 741 | 15.7% |
| Total | 4,712 | 100.0% |
Ancestry in Richwood
The most populous ancestries reported in Richwood are Mexican (2,271 | 48.2%), German (470 | 10.0%), Irish (353 | 7.5%), English (238 | 5.1%), and American (202 | 4.3%), together accounting for 75.0% of all Richwood residents.
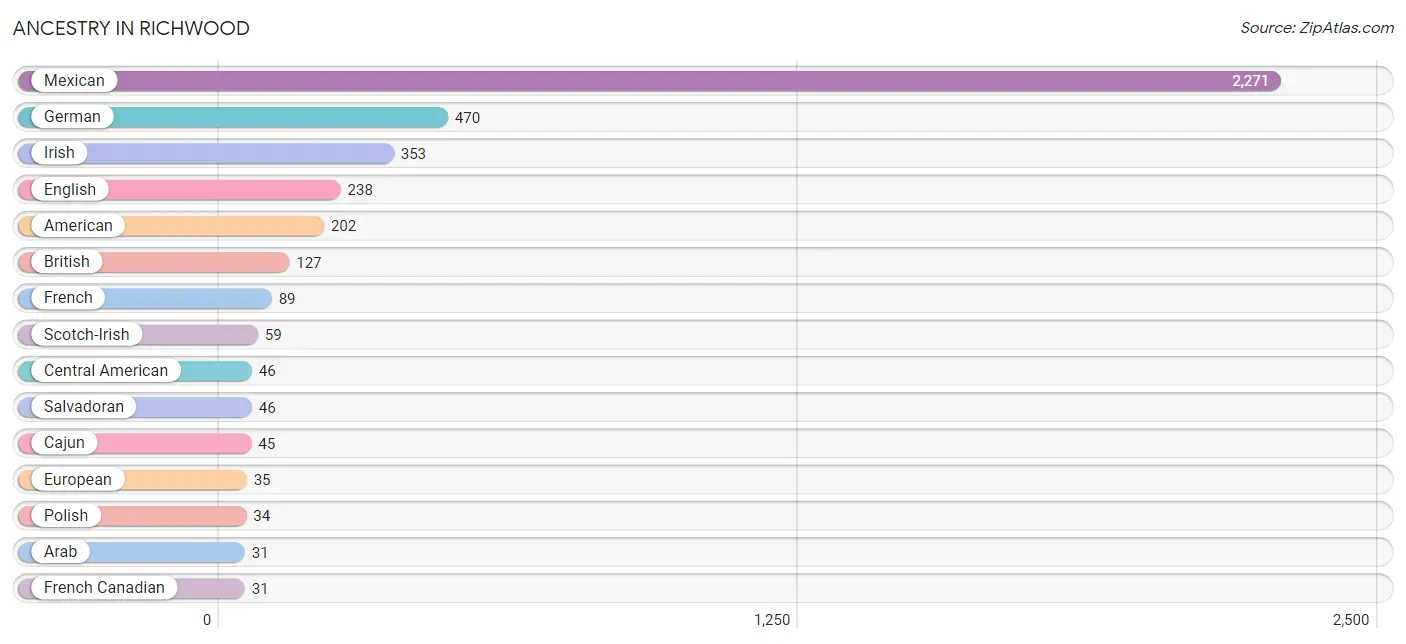
| Ancestry | # Population | % Population |
| African | 18 | 0.4% |
| American | 202 | 4.3% |
| Arab | 31 | 0.7% |
| British | 127 | 2.7% |
| Cajun | 45 | 1.0% |
| Central American | 46 | 1.0% |
| Cuban | 10 | 0.2% |
| Czech | 23 | 0.5% |
| Danish | 10 | 0.2% |
| English | 238 | 5.1% |
| European | 35 | 0.7% |
| French | 89 | 1.9% |
| French Canadian | 31 | 0.7% |
| German | 470 | 10.0% |
| Irish | 353 | 7.5% |
| Italian | 29 | 0.6% |
| Korean | 19 | 0.4% |
| Mexican | 2,271 | 48.2% |
| Polish | 34 | 0.7% |
| Puerto Rican | 15 | 0.3% |
| Salvadoran | 46 | 1.0% |
| Scotch-Irish | 59 | 1.3% |
| Scottish | 7 | 0.2% |
| Subsaharan African | 18 | 0.4% |
| Thai | 9 | 0.2% | View All 25 Rows |
Immigrants in Richwood
The most numerous immigrant groups reported in Richwood came from Latin America (220 | 4.7%), Central America (210 | 4.5%), Mexico (151 | 3.2%), El Salvador (59 | 1.3%), and Asia (34 | 0.7%), together accounting for 14.3% of all Richwood residents.
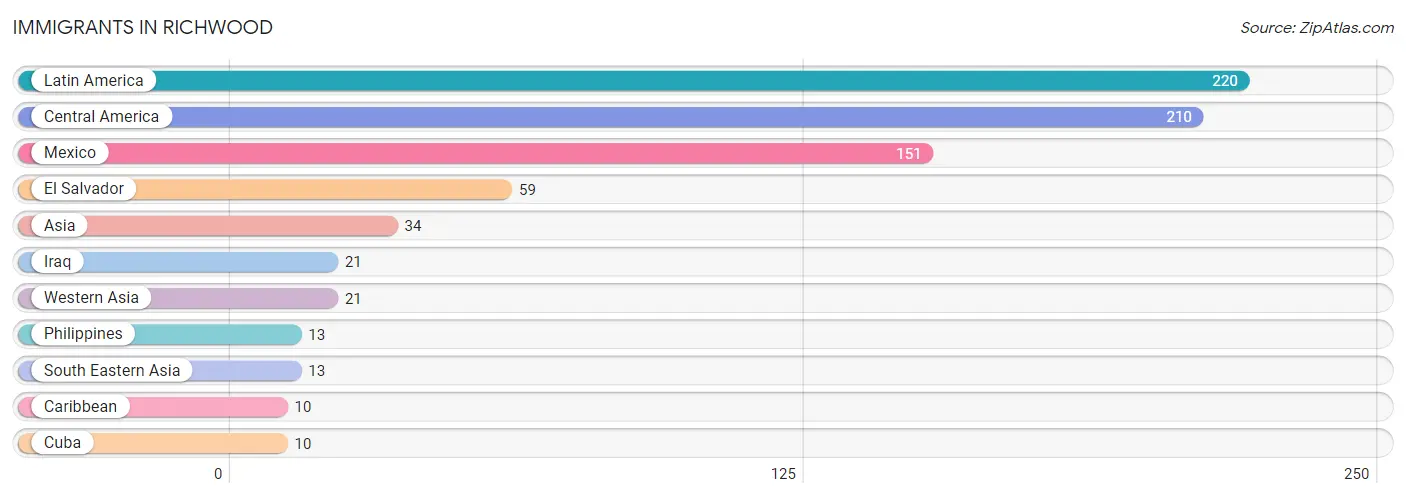
| Immigration Origin | # Population | % Population |
| Asia | 34 | 0.7% |
| Caribbean | 10 | 0.2% |
| Central America | 210 | 4.5% |
| Cuba | 10 | 0.2% |
| El Salvador | 59 | 1.3% |
| Iraq | 21 | 0.4% |
| Latin America | 220 | 4.7% |
| Mexico | 151 | 3.2% |
| Philippines | 13 | 0.3% |
| South Eastern Asia | 13 | 0.3% |
| Western Asia | 21 | 0.4% | View All 11 Rows |
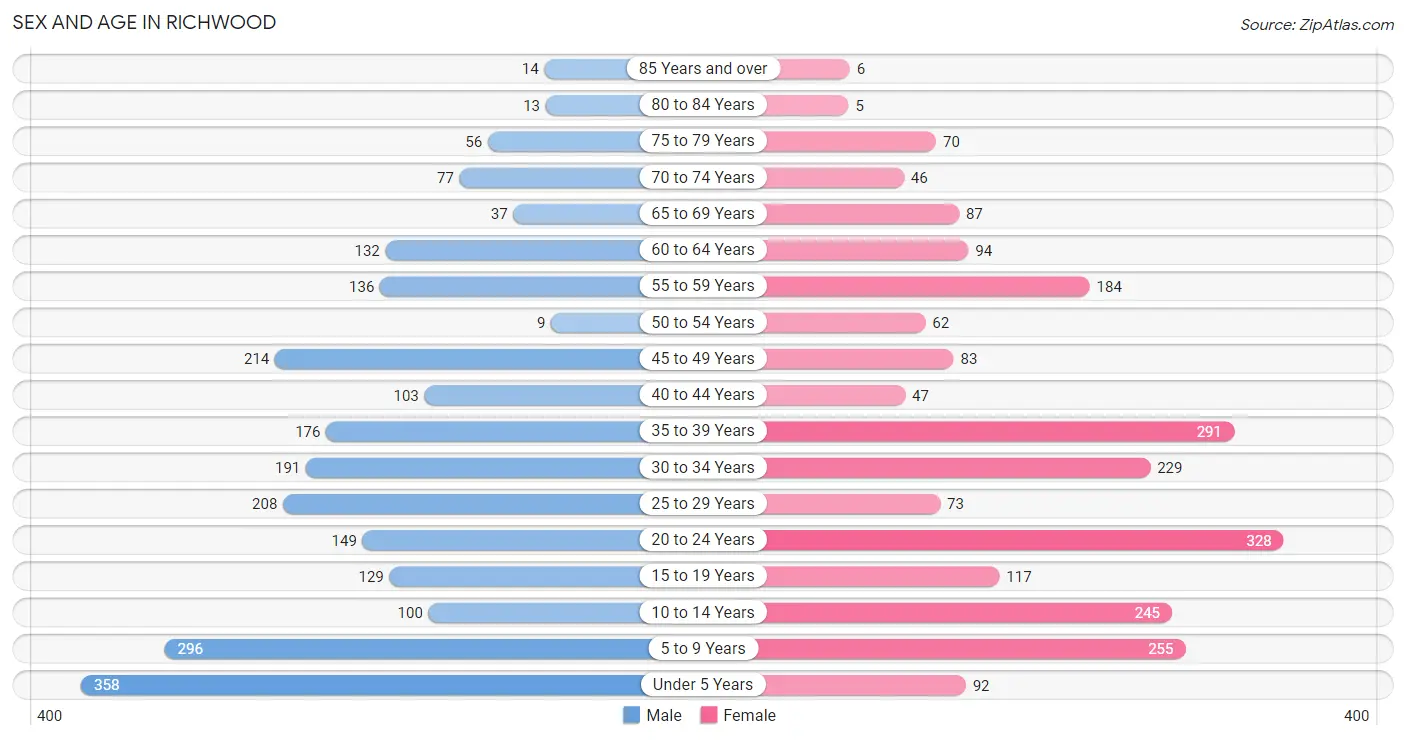
Sex and Age in Richwood
Sex and Age in Richwood
The most populous age groups in Richwood are Under 5 Years (358 | 14.9%) for men and 20 to 24 Years (328 | 14.2%) for women.
| Age Bracket | Male | Female |
| Under 5 Years | 358 (14.9%) | 92 (4.0%) |
| 5 to 9 Years | 296 (12.3%) | 255 (11.0%) |
| 10 to 14 Years | 100 (4.2%) | 245 (10.6%) |
| 15 to 19 Years | 129 (5.4%) | 117 (5.1%) |
| 20 to 24 Years | 149 (6.2%) | 328 (14.2%) |
| 25 to 29 Years | 208 (8.7%) | 73 (3.2%) |
| 30 to 34 Years | 191 (8.0%) | 229 (9.9%) |
| 35 to 39 Years | 176 (7.3%) | 291 (12.6%) |
| 40 to 44 Years | 103 (4.3%) | 47 (2.0%) |
| 45 to 49 Years | 214 (8.9%) | 83 (3.6%) |
| 50 to 54 Years | 9 (0.4%) | 62 (2.7%) |
| 55 to 59 Years | 136 (5.7%) | 184 (8.0%) |
| 60 to 64 Years | 132 (5.5%) | 94 (4.1%) |
| 65 to 69 Years | 37 (1.5%) | 87 (3.8%) |
| 70 to 74 Years | 77 (3.2%) | 46 (2.0%) |
| 75 to 79 Years | 56 (2.3%) | 70 (3.0%) |
| 80 to 84 Years | 13 (0.5%) | 5 (0.2%) |
| 85 Years and over | 14 (0.6%) | 6 (0.3%) |
| Total | 2,398 (100.0%) | 2,314 (100.0%) |
Families and Households in Richwood
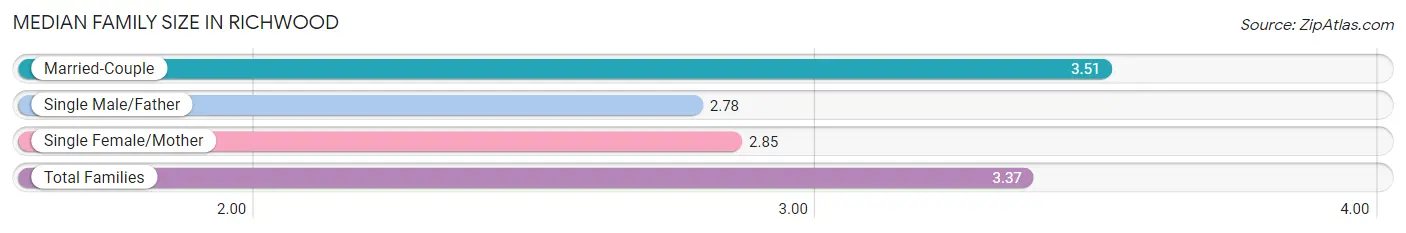
Median Family Size in Richwood
The median family size in Richwood is 3.37 persons per family, with married-couple families (953 | 79.5%) accounting for the largest median family size of 3.51 persons per family. On the other hand, single male/father families (65 | 5.4%) represent the smallest median family size with 2.78 persons per family.
| Family Type | # Families | Family Size |
| Married-Couple | 953 (79.5%) | 3.51 |
| Single Male/Father | 65 (5.4%) | 2.78 |
| Single Female/Mother | 181 (15.1%) | 2.85 |
| Total Families | 1,199 (100.0%) | 3.37 |
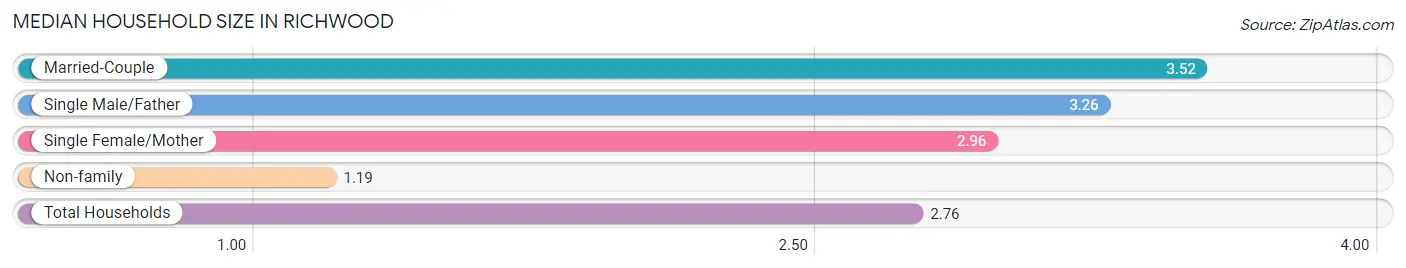
Median Household Size in Richwood
The median household size in Richwood is 2.76 persons per household, with married-couple households (953 | 55.7%) accounting for the largest median household size of 3.52 persons per household. non-family households (511 | 29.9%) represent the smallest median household size with 1.19 persons per household.
| Household Type | # Households | Household Size |
| Married-Couple | 953 (55.7%) | 3.52 |
| Single Male/Father | 65 (3.8%) | 3.26 |
| Single Female/Mother | 181 (10.6%) | 2.96 |
| Non-family | 511 (29.9%) | 1.19 |
| Total Households | 1,710 (100.0%) | 2.76 |
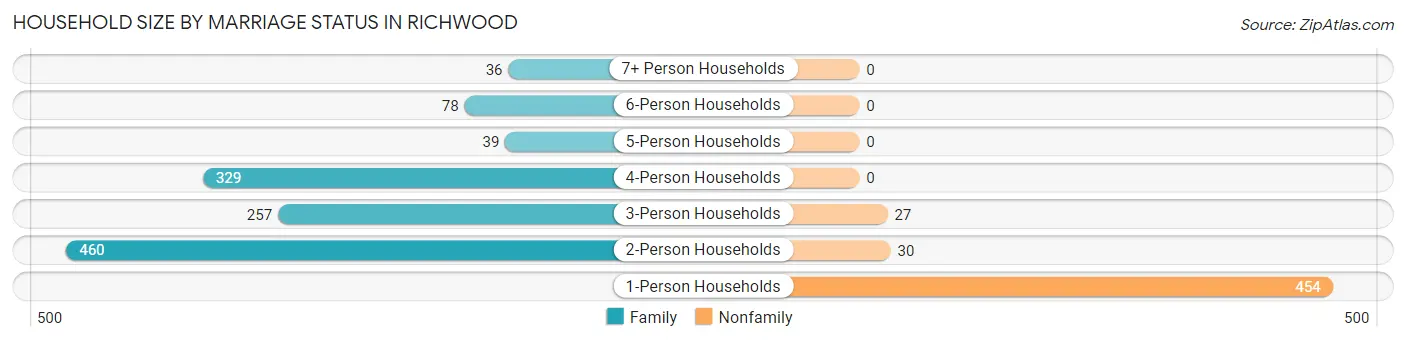
Household Size by Marriage Status in Richwood
Out of a total of 1,710 households in Richwood, 1,199 (70.1%) are family households, while 511 (29.9%) are nonfamily households. The most numerous type of family households are 2-person households, comprising 460, and the most common type of nonfamily households are 1-person households, comprising 454.
| Household Size | Family Households | Nonfamily Households |
| 1-Person Households | - | 454 (26.6%) |
| 2-Person Households | 460 (26.9%) | 30 (1.8%) |
| 3-Person Households | 257 (15.0%) | 27 (1.6%) |
| 4-Person Households | 329 (19.2%) | 0 (0.0%) |
| 5-Person Households | 39 (2.3%) | 0 (0.0%) |
| 6-Person Households | 78 (4.6%) | 0 (0.0%) |
| 7+ Person Households | 36 (2.1%) | 0 (0.0%) |
| Total | 1,199 (70.1%) | 511 (29.9%) |
Female Fertility in Richwood
Fertility by Age in Richwood
Average fertility rate in Richwood is 9.0 births per 1,000 women. Women in the age bracket of 20 to 34 years have the highest fertility rate with 16.0 births per 1,000 women. Women in the age bracket of 20 to 34 years acount for 100.0% of all women with births.
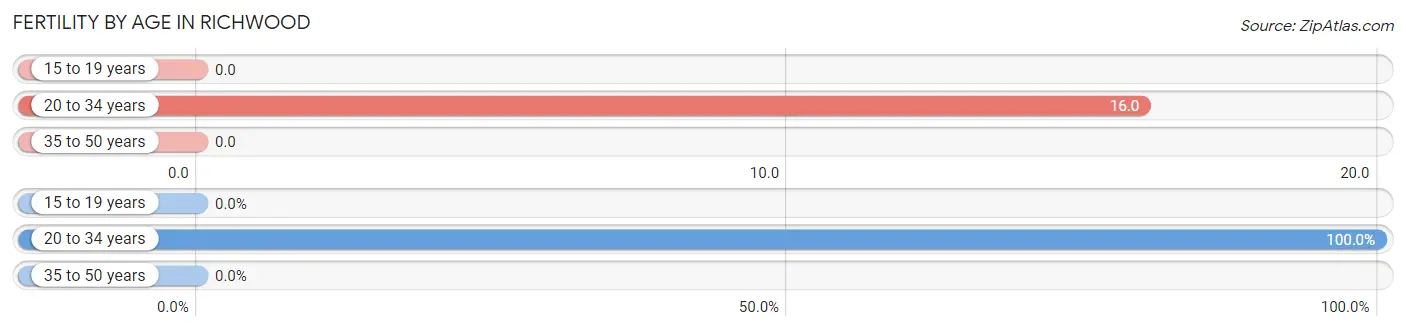
| Age Bracket | Women with Births | Births / 1,000 Women |
| 15 to 19 years | 0 (0.0%) | 0.0 |
| 20 to 34 years | 10 (100.0%) | 16.0 |
| 35 to 50 years | 0 (0.0%) | 0.0 |
| Total | 10 (100.0%) | 9.0 |
Fertility by Age by Marriage Status in Richwood
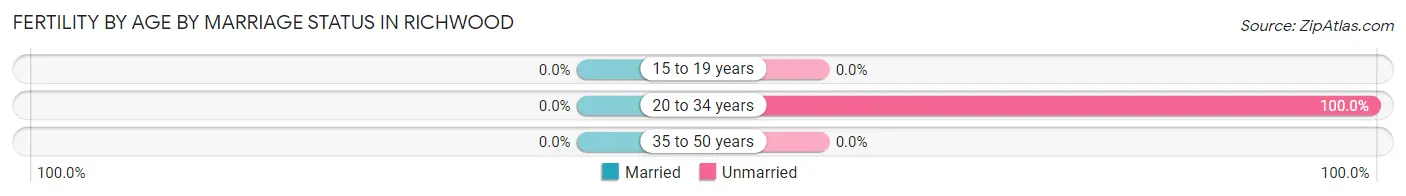
| Age Bracket | Married | Unmarried |
| 15 to 19 years | 0 (0.0%) | 0 (0.0%) |
| 20 to 34 years | 0 (0.0%) | 10 (100.0%) |
| 35 to 50 years | 0 (0.0%) | 0 (0.0%) |
| Total | 0 (0.0%) | 10 (100.0%) |
Fertility by Education in Richwood
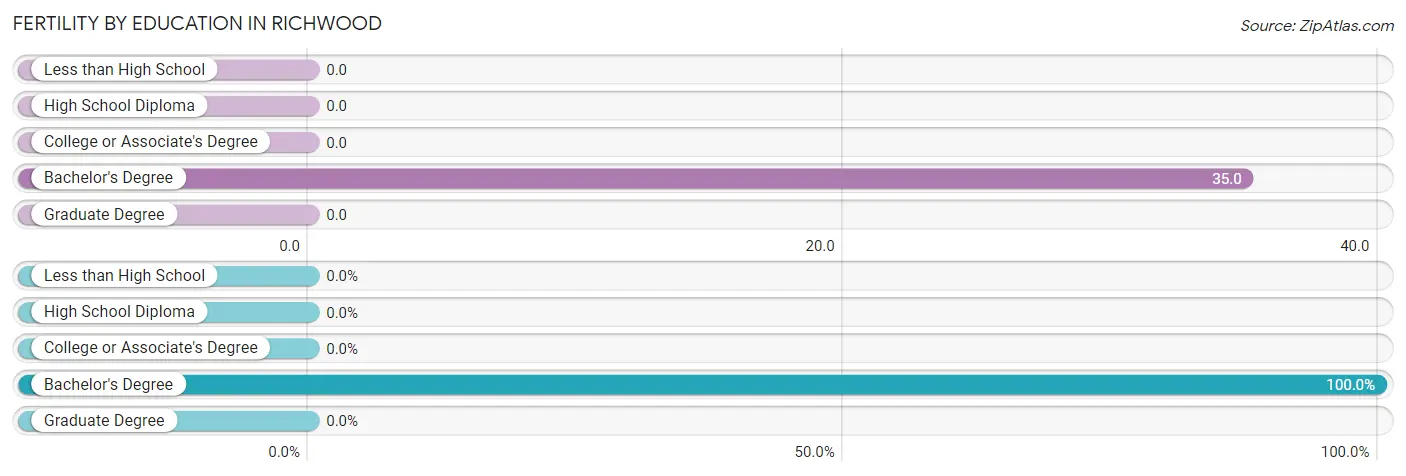
| Educational Attainment | Women with Births | Births / 1,000 Women |
| Less than High School | 0 (0.0%) | 0.0 |
| High School Diploma | 0 (0.0%) | 0.0 |
| College or Associate's Degree | 0 (0.0%) | 0.0 |
| Bachelor's Degree | 10 (100.0%) | 35.0 |
| Graduate Degree | 0 (0.0%) | 0.0 |
| Total | 10 (100.0%) | 9.0 |
Fertility by Education by Marriage Status in Richwood
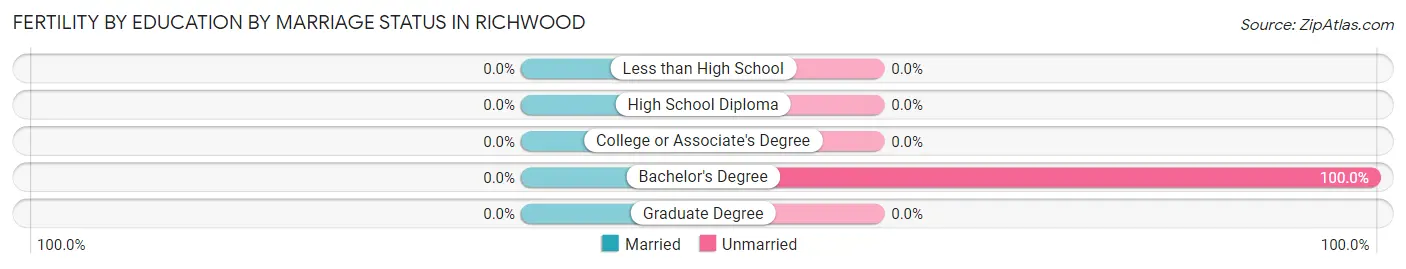
| Educational Attainment | Married | Unmarried |
| Less than High School | 0 (0.0%) | 0 (0.0%) |
| High School Diploma | 0 (0.0%) | 0 (0.0%) |
| College or Associate's Degree | 0 (0.0%) | 0 (0.0%) |
| Bachelor's Degree | 0 (0.0%) | 10 (100.0%) |
| Graduate Degree | 0 (0.0%) | 0 (0.0%) |
| Total | 0 (0.0%) | 10 (100.0%) |
Employment Characteristics in Richwood
Employment by Class of Employer in Richwood
Among the 2,239 employed individuals in Richwood, private company employees (1,684 | 75.2%), local government employees (321 | 14.3%), and state government employees (118 | 5.3%) make up the most common classes of employment.
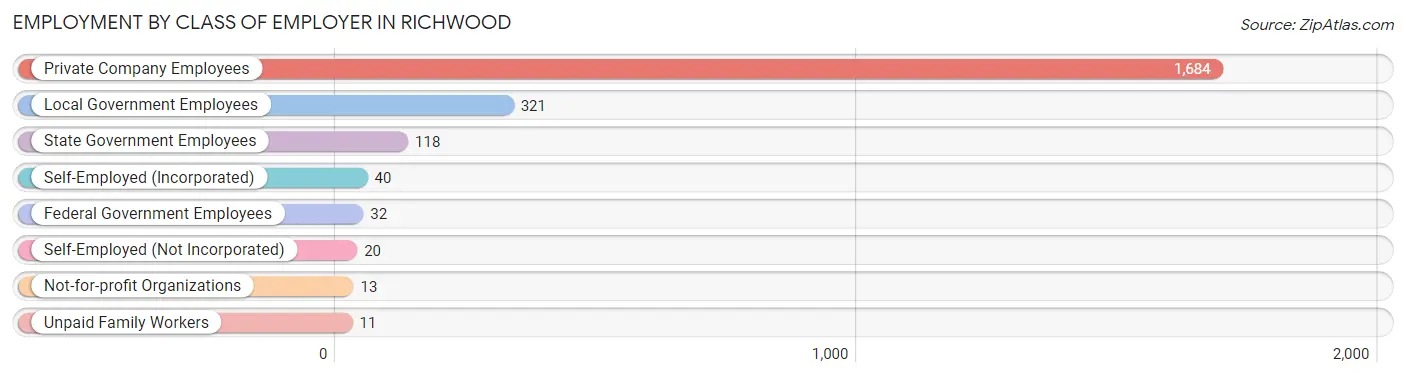
| Employer Class | # Employees | % Employees |
| Private Company Employees | 1,684 | 75.2% |
| Self-Employed (Incorporated) | 40 | 1.8% |
| Self-Employed (Not Incorporated) | 20 | 0.9% |
| Not-for-profit Organizations | 13 | 0.6% |
| Local Government Employees | 321 | 14.3% |
| State Government Employees | 118 | 5.3% |
| Federal Government Employees | 32 | 1.4% |
| Unpaid Family Workers | 11 | 0.5% |
| Total | 2,239 | 100.0% |
Employment Status by Age in Richwood
According to the labor force statistics for Richwood, out of the total population over 16 years of age (3,338), 72.7% or 2,427 individuals are in the labor force, with 5.7% or 138 of them unemployed. The age group with the highest labor force participation rate is 35 to 44 years, with 96.4% or 595 individuals in the labor force. Within the labor force, the 55 to 59 years age range has the highest percentage of unemployed individuals, with 25.6% or 54 of them being unemployed.
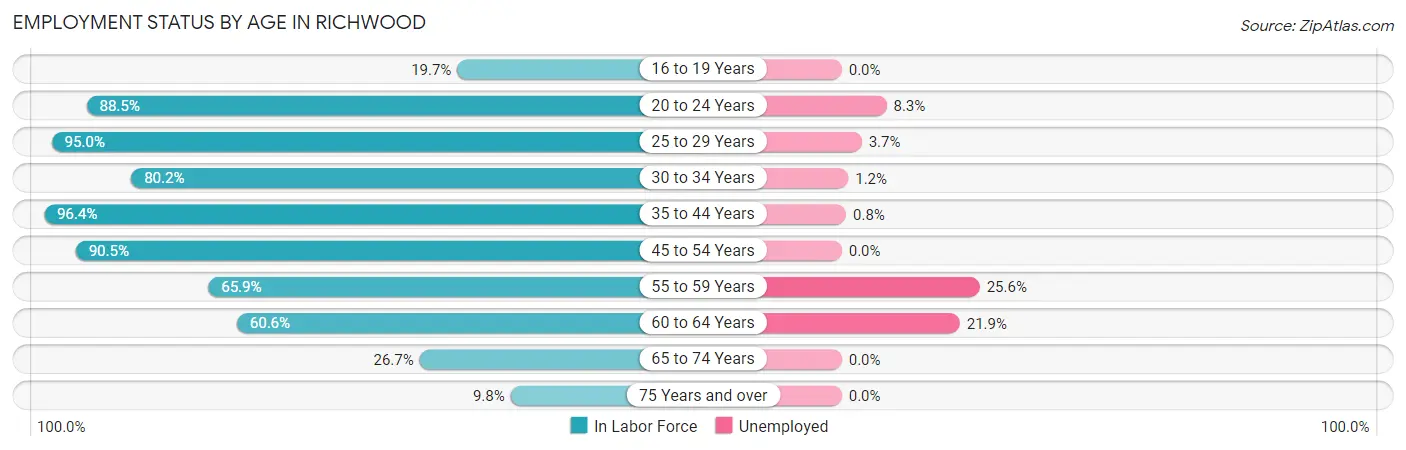
| Age Bracket | In Labor Force | Unemployed |
| 16 to 19 Years | 43 (19.7%) | 0 (0.0%) |
| 20 to 24 Years | 422 (88.5%) | 35 (8.3%) |
| 25 to 29 Years | 267 (95.0%) | 10 (3.7%) |
| 30 to 34 Years | 337 (80.2%) | 4 (1.2%) |
| 35 to 44 Years | 595 (96.4%) | 5 (0.8%) |
| 45 to 54 Years | 333 (90.5%) | 0 (0.0%) |
| 55 to 59 Years | 211 (65.9%) | 54 (25.6%) |
| 60 to 64 Years | 137 (60.6%) | 30 (21.9%) |
| 65 to 74 Years | 66 (26.7%) | 0 (0.0%) |
| 75 Years and over | 16 (9.8%) | 0 (0.0%) |
| Total | 2,427 (72.7%) | 138 (5.7%) |
Employment Status by Educational Attainment in Richwood
According to labor force statistics for Richwood, 84.2% of individuals (1,879) out of the total population between 25 and 64 years of age (2,232) are in the labor force, with 5.5% or 103 of them being unemployed. The group with the highest labor force participation rate are those with the educational attainment of bachelor's degree or higher, with 93.0% or 463 individuals in the labor force. Within the labor force, individuals with high school diploma education have the highest percentage of unemployment, with 8.5% or 37 of them being unemployed.
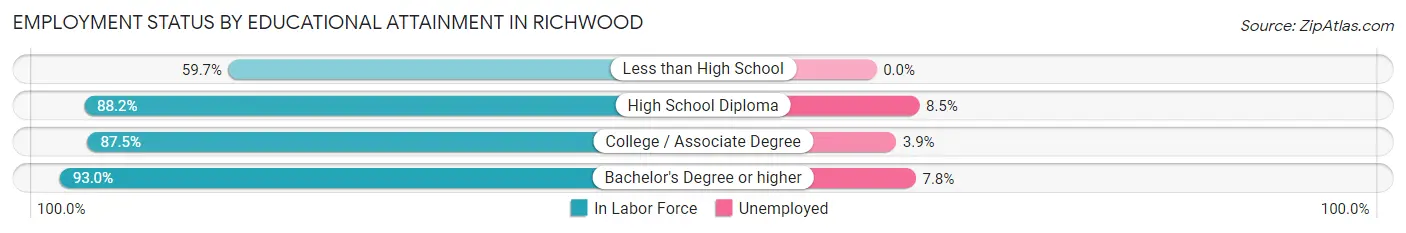
| Educational Attainment | In Labor Force | Unemployed |
| Less than High School | 222 (59.7%) | 0 (0.0%) |
| High School Diploma | 434 (88.2%) | 42 (8.5%) |
| College / Associate Degree | 761 (87.5%) | 34 (3.9%) |
| Bachelor's Degree or higher | 463 (93.0%) | 39 (7.8%) |
| Total | 1,879 (84.2%) | 123 (5.5%) |
Employment Occupations by Sex in Richwood
Management, Business, Science and Arts Occupations
The most common Management, Business, Science and Arts occupations in Richwood are Community & Social Service (354 | 15.5%), Education Instruction & Library (334 | 14.6%), Management (313 | 13.7%), Computers, Engineering & Science (149 | 6.5%), and Computers & Mathematics (98 | 4.3%).
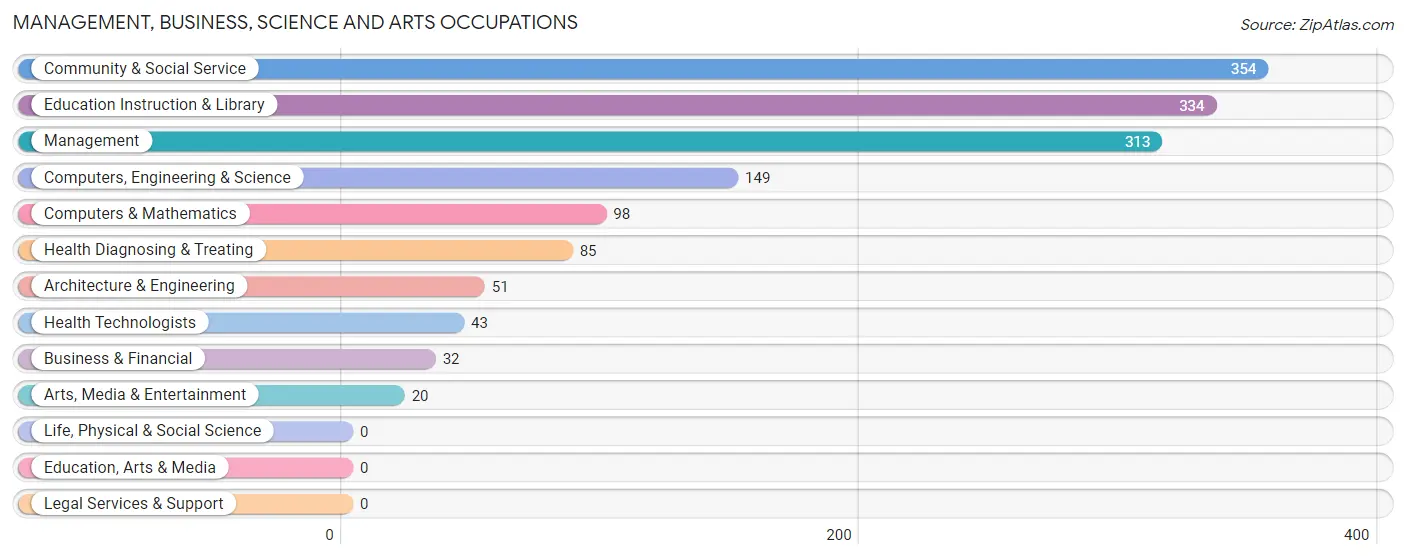
Management, Business, Science and Arts Occupations by Sex
Within the Management, Business, Science and Arts occupations in Richwood, the most male-oriented occupations are Computers & Mathematics (100.0%), Computers, Engineering & Science (93.3%), and Architecture & Engineering (80.4%), while the most female-oriented occupations are Arts, Media & Entertainment (100.0%), Health Diagnosing & Treating (89.4%), and Community & Social Service (89.3%).
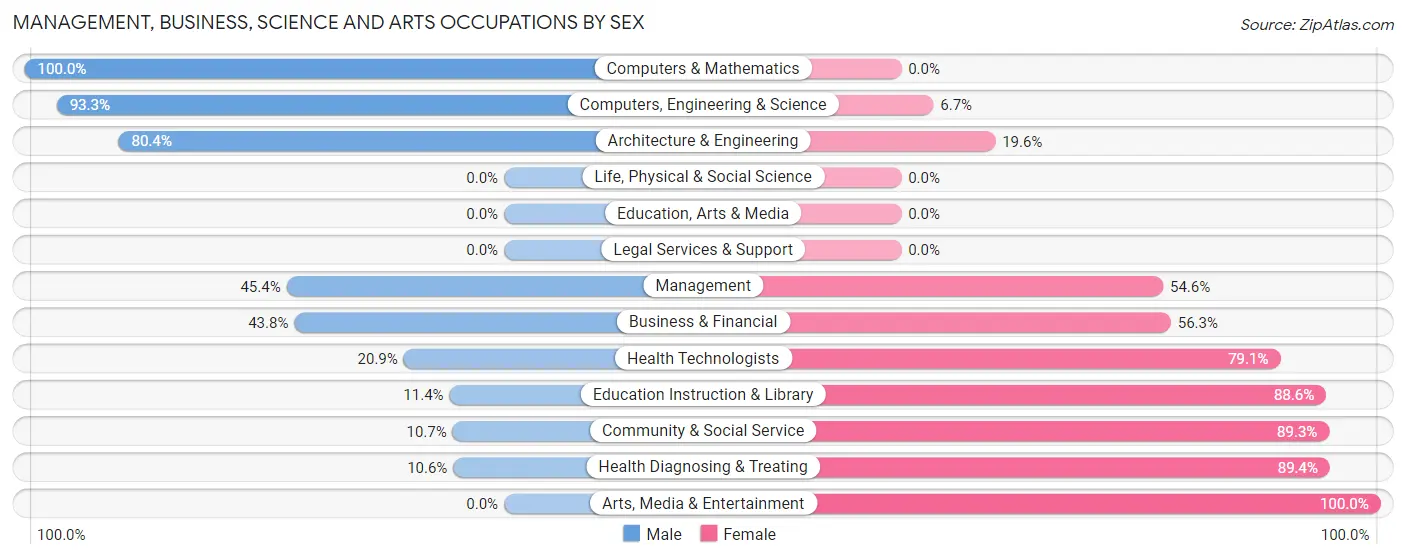
| Occupation | Male | Female |
| Management | 142 (45.4%) | 171 (54.6%) |
| Business & Financial | 14 (43.8%) | 18 (56.2%) |
| Computers, Engineering & Science | 139 (93.3%) | 10 (6.7%) |
| Computers & Mathematics | 98 (100.0%) | 0 (0.0%) |
| Architecture & Engineering | 41 (80.4%) | 10 (19.6%) |
| Life, Physical & Social Science | 0 (0.0%) | 0 (0.0%) |
| Community & Social Service | 38 (10.7%) | 316 (89.3%) |
| Education, Arts & Media | 0 (0.0%) | 0 (0.0%) |
| Legal Services & Support | 0 (0.0%) | 0 (0.0%) |
| Education Instruction & Library | 38 (11.4%) | 296 (88.6%) |
| Arts, Media & Entertainment | 0 (0.0%) | 20 (100.0%) |
| Health Diagnosing & Treating | 9 (10.6%) | 76 (89.4%) |
| Health Technologists | 9 (20.9%) | 34 (79.1%) |
| Total (Category) | 342 (36.7%) | 591 (63.3%) |
| Total (Overall) | 1,208 (52.8%) | 1,081 (47.2%) |
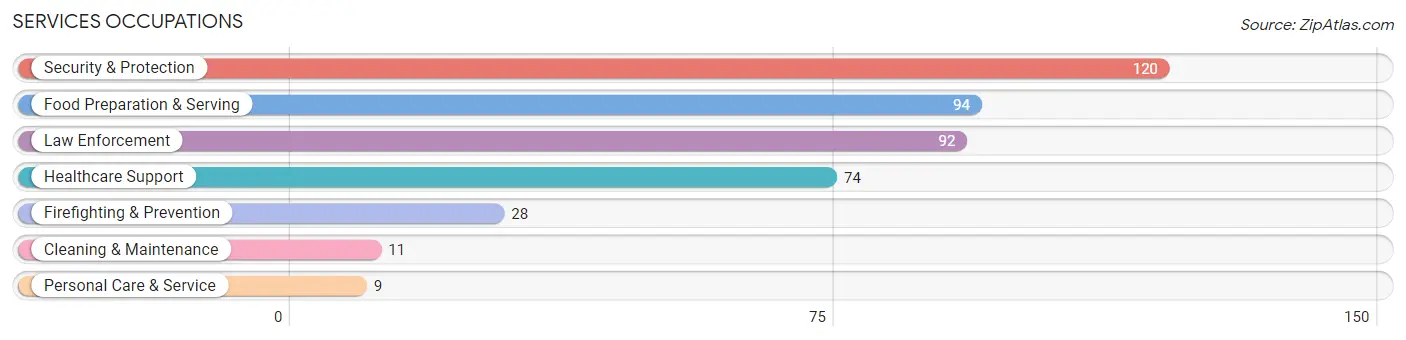
Services Occupations
The most common Services occupations in Richwood are Security & Protection (120 | 5.2%), Food Preparation & Serving (94 | 4.1%), Law Enforcement (92 | 4.0%), Healthcare Support (74 | 3.2%), and Firefighting & Prevention (28 | 1.2%).
Services Occupations by Sex
Within the Services occupations in Richwood, the most male-oriented occupations are Cleaning & Maintenance (100.0%), Law Enforcement (62.0%), and Security & Protection (60.0%), while the most female-oriented occupations are Healthcare Support (100.0%), Food Preparation & Serving (100.0%), and Personal Care & Service (100.0%).
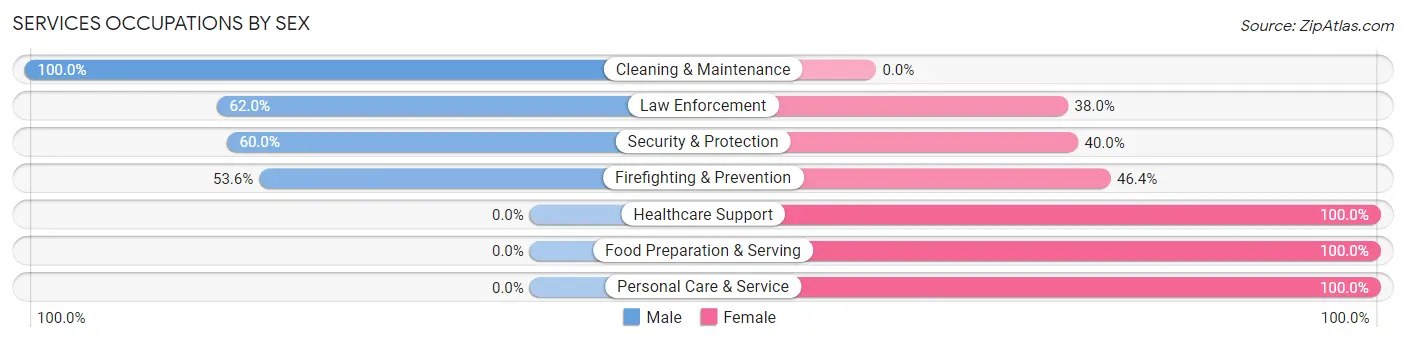
| Occupation | Male | Female |
| Healthcare Support | 0 (0.0%) | 74 (100.0%) |
| Security & Protection | 72 (60.0%) | 48 (40.0%) |
| Firefighting & Prevention | 15 (53.6%) | 13 (46.4%) |
| Law Enforcement | 57 (62.0%) | 35 (38.0%) |
| Food Preparation & Serving | 0 (0.0%) | 94 (100.0%) |
| Cleaning & Maintenance | 11 (100.0%) | 0 (0.0%) |
| Personal Care & Service | 0 (0.0%) | 9 (100.0%) |
| Total (Category) | 83 (27.0%) | 225 (73.1%) |
| Total (Overall) | 1,208 (52.8%) | 1,081 (47.2%) |
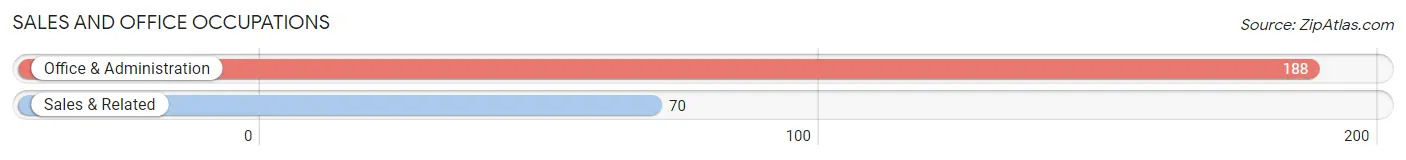
Sales and Office Occupations
The most common Sales and Office occupations in Richwood are Office & Administration (188 | 8.2%), and Sales & Related (70 | 3.1%).
Sales and Office Occupations by Sex
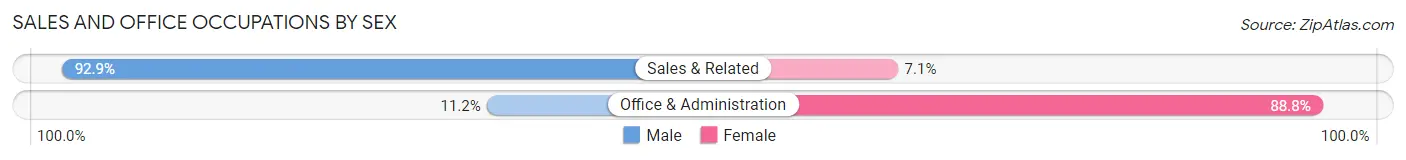
| Occupation | Male | Female |
| Sales & Related | 65 (92.9%) | 5 (7.1%) |
| Office & Administration | 21 (11.2%) | 167 (88.8%) |
| Total (Category) | 86 (33.3%) | 172 (66.7%) |
| Total (Overall) | 1,208 (52.8%) | 1,081 (47.2%) |
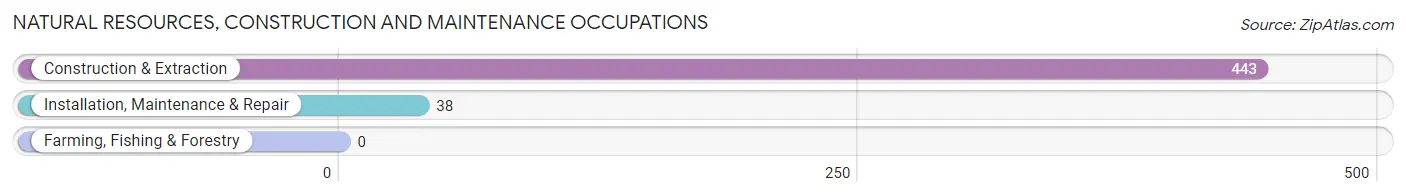
Natural Resources, Construction and Maintenance Occupations
The most common Natural Resources, Construction and Maintenance occupations in Richwood are Construction & Extraction (443 | 19.4%), and Installation, Maintenance & Repair (38 | 1.7%).
Natural Resources, Construction and Maintenance Occupations by Sex
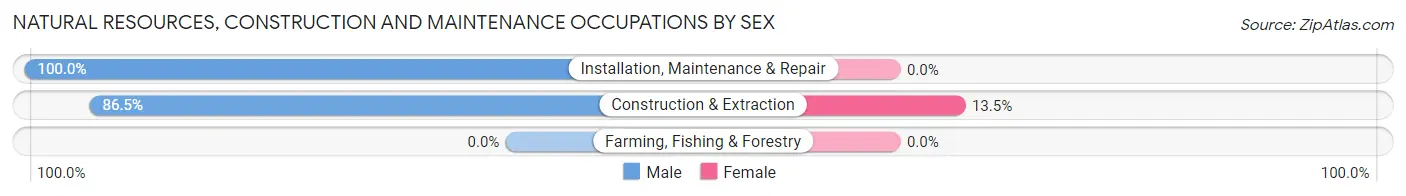
| Occupation | Male | Female |
| Farming, Fishing & Forestry | 0 (0.0%) | 0 (0.0%) |
| Construction & Extraction | 383 (86.5%) | 60 (13.5%) |
| Installation, Maintenance & Repair | 38 (100.0%) | 0 (0.0%) |
| Total (Category) | 421 (87.5%) | 60 (12.5%) |
| Total (Overall) | 1,208 (52.8%) | 1,081 (47.2%) |
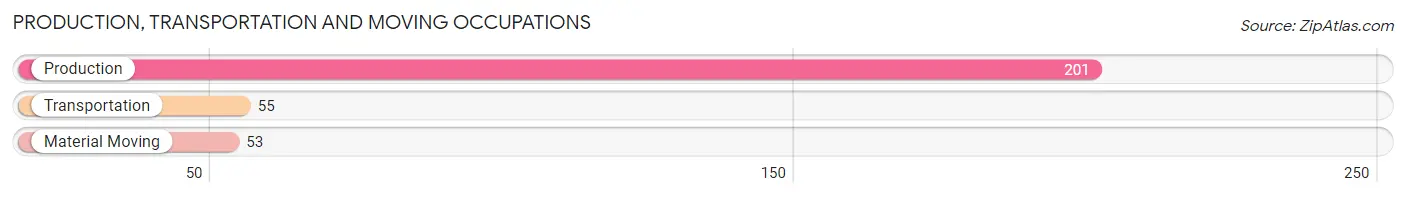
Production, Transportation and Moving Occupations
The most common Production, Transportation and Moving occupations in Richwood are Production (201 | 8.8%), Transportation (55 | 2.4%), and Material Moving (53 | 2.3%).
Production, Transportation and Moving Occupations by Sex
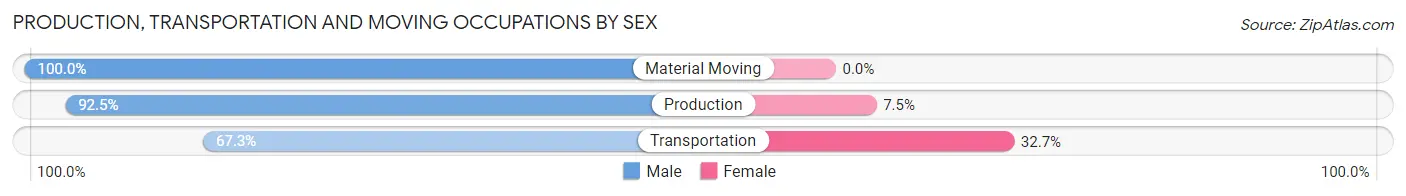
| Occupation | Male | Female |
| Production | 186 (92.5%) | 15 (7.5%) |
| Transportation | 37 (67.3%) | 18 (32.7%) |
| Material Moving | 53 (100.0%) | 0 (0.0%) |
| Total (Category) | 276 (89.3%) | 33 (10.7%) |
| Total (Overall) | 1,208 (52.8%) | 1,081 (47.2%) |
Employment Industries by Sex in Richwood
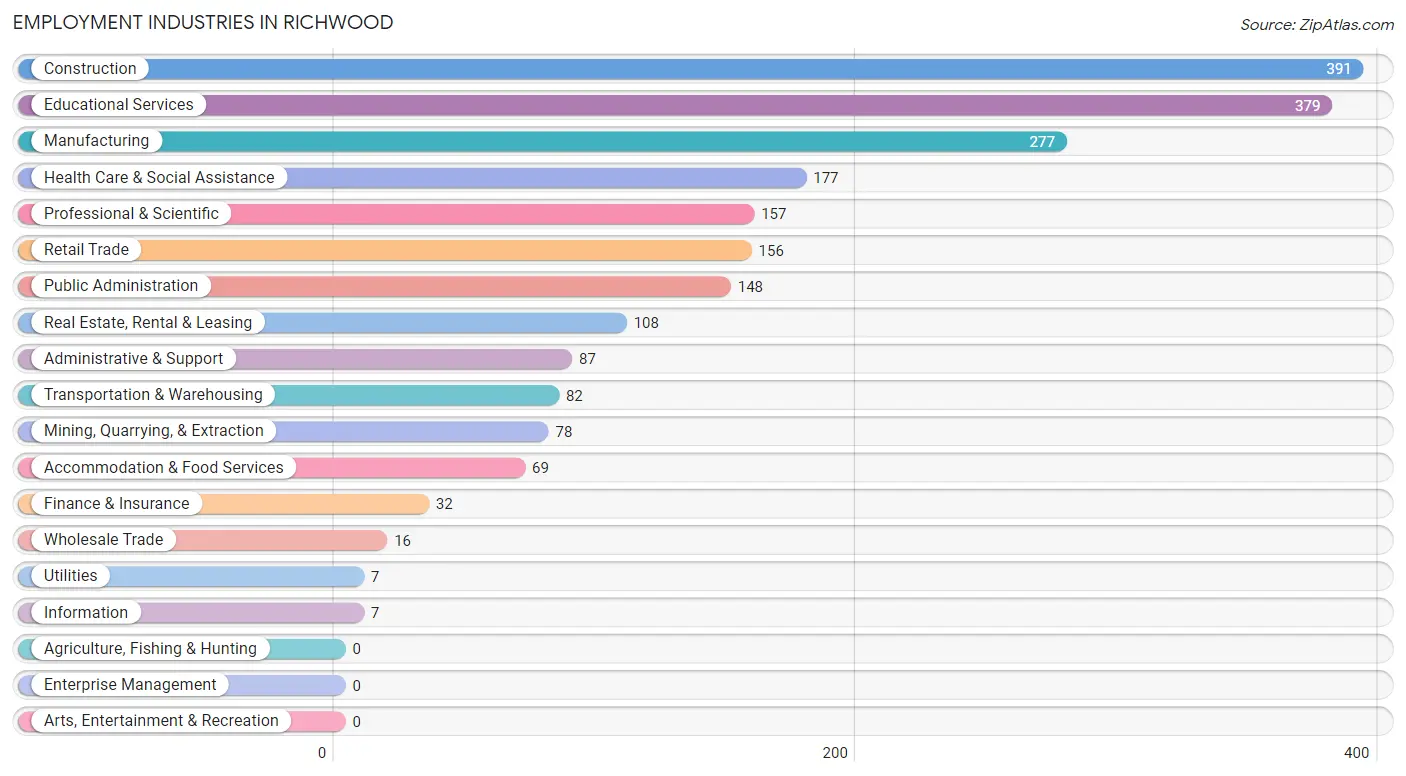
Employment Industries in Richwood
The major employment industries in Richwood include Construction (391 | 17.1%), Educational Services (379 | 16.6%), Manufacturing (277 | 12.1%), Health Care & Social Assistance (177 | 7.7%), and Professional & Scientific (157 | 6.9%).
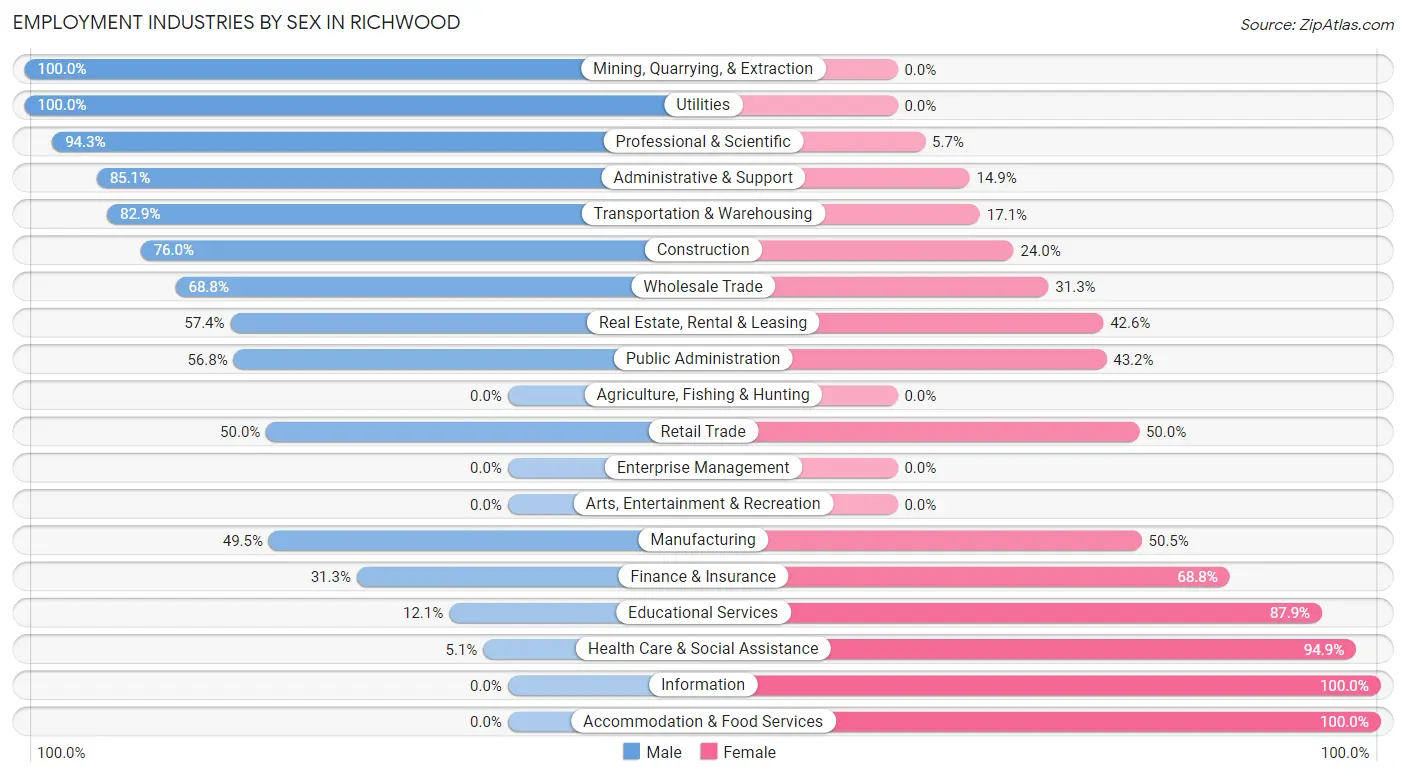
Employment Industries by Sex in Richwood
The Richwood industries that see more men than women are Mining, Quarrying, & Extraction (100.0%), Utilities (100.0%), and Professional & Scientific (94.3%), whereas the industries that tend to have a higher number of women are Information (100.0%), Accommodation & Food Services (100.0%), and Health Care & Social Assistance (94.9%).
| Industry | Male | Female |
| Agriculture, Fishing & Hunting | 0 (0.0%) | 0 (0.0%) |
| Mining, Quarrying, & Extraction | 78 (100.0%) | 0 (0.0%) |
| Construction | 297 (76.0%) | 94 (24.0%) |
| Manufacturing | 137 (49.5%) | 140 (50.5%) |
| Wholesale Trade | 11 (68.8%) | 5 (31.2%) |
| Retail Trade | 78 (50.0%) | 78 (50.0%) |
| Transportation & Warehousing | 68 (82.9%) | 14 (17.1%) |
| Utilities | 7 (100.0%) | 0 (0.0%) |
| Information | 0 (0.0%) | 7 (100.0%) |
| Finance & Insurance | 10 (31.2%) | 22 (68.8%) |
| Real Estate, Rental & Leasing | 62 (57.4%) | 46 (42.6%) |
| Professional & Scientific | 148 (94.3%) | 9 (5.7%) |
| Enterprise Management | 0 (0.0%) | 0 (0.0%) |
| Administrative & Support | 74 (85.1%) | 13 (14.9%) |
| Educational Services | 46 (12.1%) | 333 (87.9%) |
| Health Care & Social Assistance | 9 (5.1%) | 168 (94.9%) |
| Arts, Entertainment & Recreation | 0 (0.0%) | 0 (0.0%) |
| Accommodation & Food Services | 0 (0.0%) | 69 (100.0%) |
| Public Administration | 84 (56.8%) | 64 (43.2%) |
| Total | 1,208 (52.8%) | 1,081 (47.2%) |
Education in Richwood
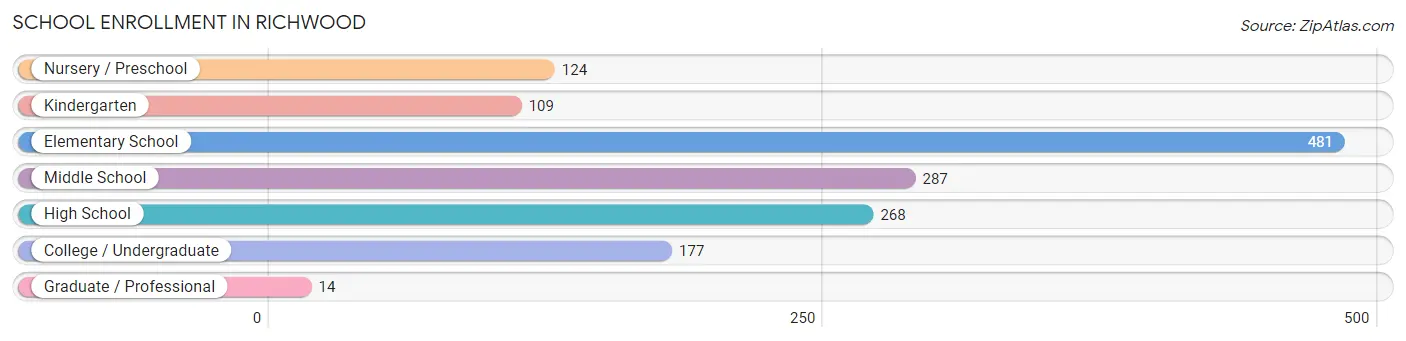
School Enrollment in Richwood
The most common levels of schooling among the 1,460 students in Richwood are elementary school (481 | 33.0%), middle school (287 | 19.7%), and high school (268 | 18.4%).
| School Level | # Students | % Students |
| Nursery / Preschool | 124 | 8.5% |
| Kindergarten | 109 | 7.5% |
| Elementary School | 481 | 33.0% |
| Middle School | 287 | 19.7% |
| High School | 268 | 18.4% |
| College / Undergraduate | 177 | 12.1% |
| Graduate / Professional | 14 | 1.0% |
| Total | 1,460 | 100.0% |
School Enrollment by Age by Funding Source in Richwood
Out of a total of 1,460 students who are enrolled in schools in Richwood, 69 (4.7%) attend a private institution, while the remaining 1,391 (95.3%) are enrolled in public schools. The age group of 25 to 34 year olds has the highest likelihood of being enrolled in private schools, with 28 (100.0% in the age bracket) enrolled. Conversely, the age group of 5 to 9 year old has the lowest likelihood of being enrolled in a private school, with 551 (100.0% in the age bracket) attending a public institution.
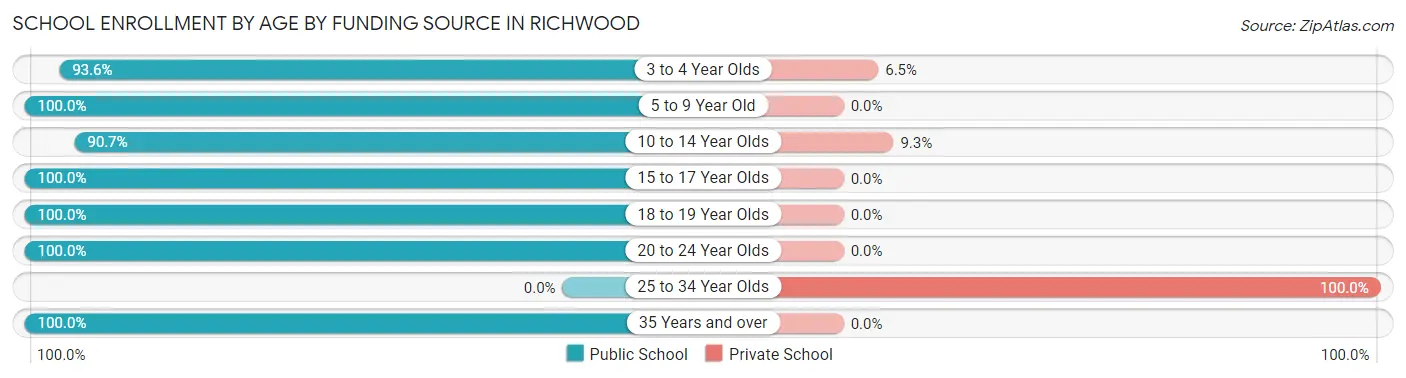
| Age Bracket | Public School | Private School |
| 3 to 4 Year Olds | 116 (93.5%) | 8 (6.5%) |
| 5 to 9 Year Old | 551 (100.0%) | 0 (0.0%) |
| 10 to 14 Year Olds | 313 (90.7%) | 32 (9.3%) |
| 15 to 17 Year Olds | 212 (100.0%) | 0 (0.0%) |
| 18 to 19 Year Olds | 17 (100.0%) | 0 (0.0%) |
| 20 to 24 Year Olds | 106 (100.0%) | 0 (0.0%) |
| 25 to 34 Year Olds | 0 (0.0%) | 28 (100.0%) |
| 35 Years and over | 77 (100.0%) | 0 (0.0%) |
| Total | 1,391 (95.3%) | 69 (4.7%) |
Educational Attainment by Field of Study in Richwood
Education (141 | 19.6%), engineering (123 | 17.1%), business (121 | 16.8%), bio, nature & agricultural (120 | 16.7%), and arts & humanities (59 | 8.2%) are the most common fields of study among 720 individuals in Richwood who have obtained a bachelor's degree or higher.
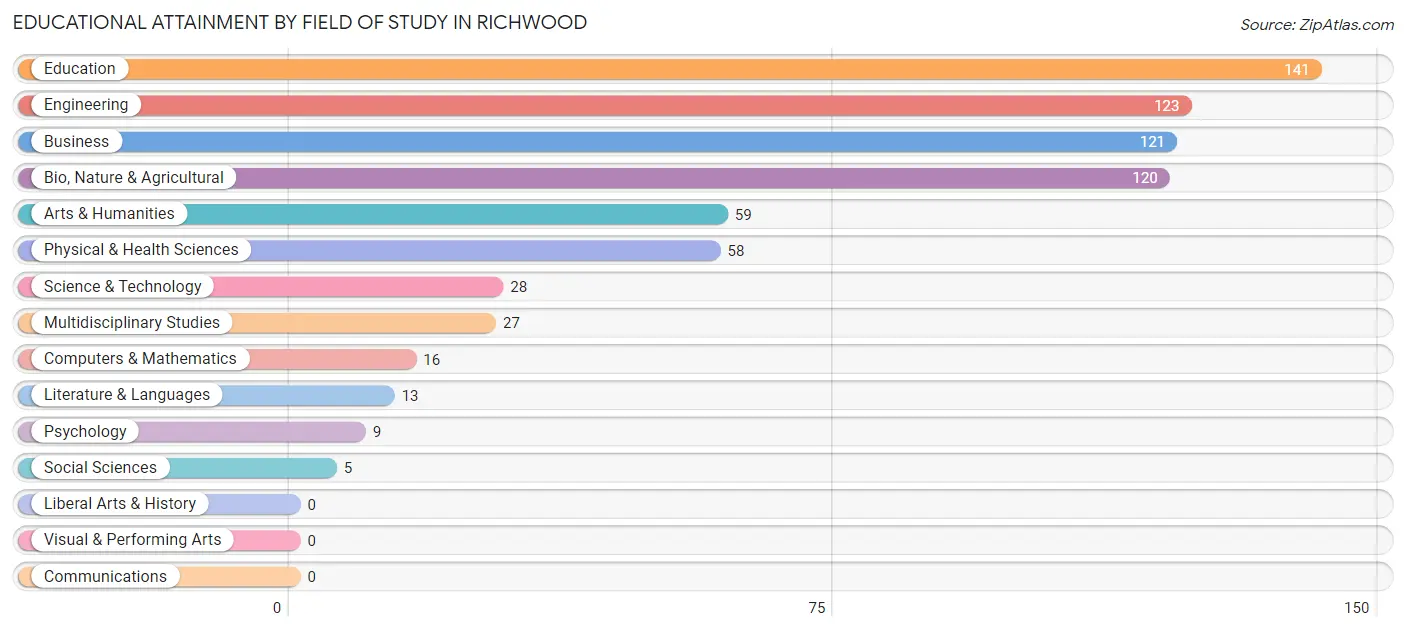
| Field of Study | # Graduates | % Graduates |
| Computers & Mathematics | 16 | 2.2% |
| Bio, Nature & Agricultural | 120 | 16.7% |
| Physical & Health Sciences | 58 | 8.1% |
| Psychology | 9 | 1.3% |
| Social Sciences | 5 | 0.7% |
| Engineering | 123 | 17.1% |
| Multidisciplinary Studies | 27 | 3.7% |
| Science & Technology | 28 | 3.9% |
| Business | 121 | 16.8% |
| Education | 141 | 19.6% |
| Literature & Languages | 13 | 1.8% |
| Liberal Arts & History | 0 | 0.0% |
| Visual & Performing Arts | 0 | 0.0% |
| Communications | 0 | 0.0% |
| Arts & Humanities | 59 | 8.2% |
| Total | 720 | 100.0% |
Transportation & Commute in Richwood
Vehicle Availability by Sex in Richwood
The most prevalent vehicle ownership categories in Richwood are males with 2 vehicles (478, accounting for 40.1%) and females with 2 vehicles (547, making up 45.7%).
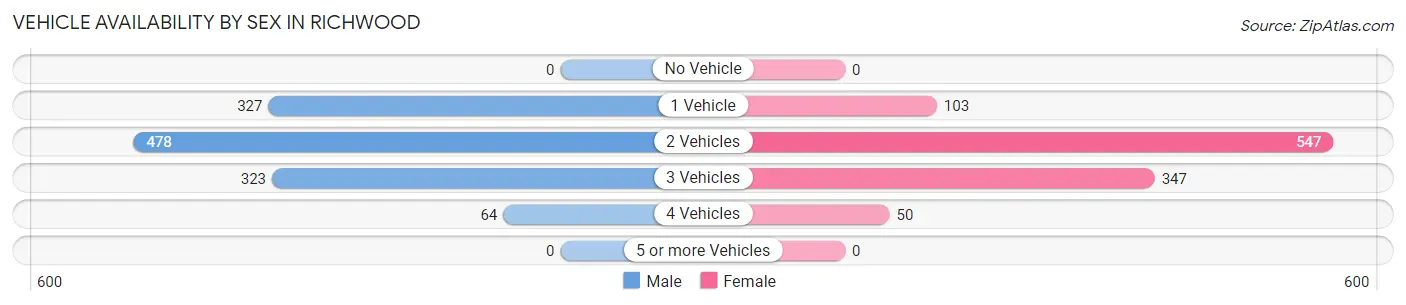
| Vehicles Available | Male | Female |
| No Vehicle | 0 (0.0%) | 0 (0.0%) |
| 1 Vehicle | 327 (27.4%) | 103 (9.8%) |
| 2 Vehicles | 478 (40.1%) | 547 (52.2%) |
| 3 Vehicles | 323 (27.1%) | 347 (33.1%) |
| 4 Vehicles | 64 (5.4%) | 50 (4.8%) |
| 5 or more Vehicles | 0 (0.0%) | 0 (0.0%) |
| Total | 1,192 (100.0%) | 1,047 (100.0%) |
Commute Time in Richwood
The most frequently occuring commute durations in Richwood are 15 to 19 minutes (620 commuters, 29.7%), 20 to 24 minutes (348 commuters, 16.7%), and 5 to 9 minutes (305 commuters, 14.6%).
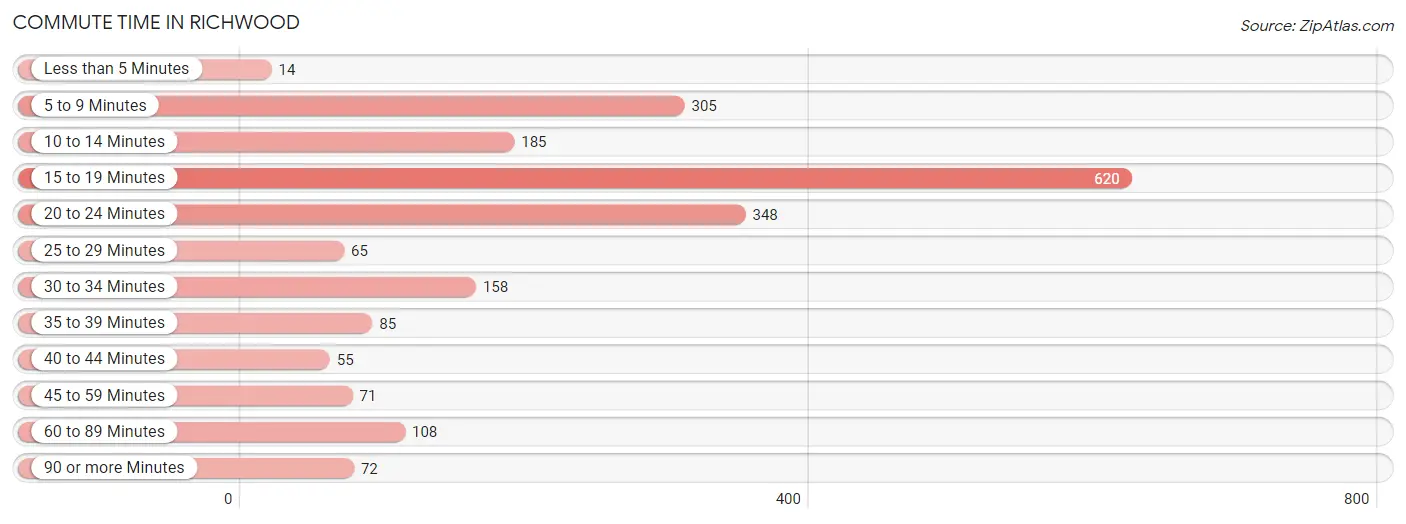
| Commute Time | # Commuters | % Commuters |
| Less than 5 Minutes | 14 | 0.7% |
| 5 to 9 Minutes | 305 | 14.6% |
| 10 to 14 Minutes | 185 | 8.9% |
| 15 to 19 Minutes | 620 | 29.7% |
| 20 to 24 Minutes | 348 | 16.7% |
| 25 to 29 Minutes | 65 | 3.1% |
| 30 to 34 Minutes | 158 | 7.6% |
| 35 to 39 Minutes | 85 | 4.1% |
| 40 to 44 Minutes | 55 | 2.6% |
| 45 to 59 Minutes | 71 | 3.4% |
| 60 to 89 Minutes | 108 | 5.2% |
| 90 or more Minutes | 72 | 3.5% |
Commute Time by Sex in Richwood
The most common commute times in Richwood are 15 to 19 minutes (368 commuters, 35.1%) for males and 15 to 19 minutes (252 commuters, 24.2%) for females.
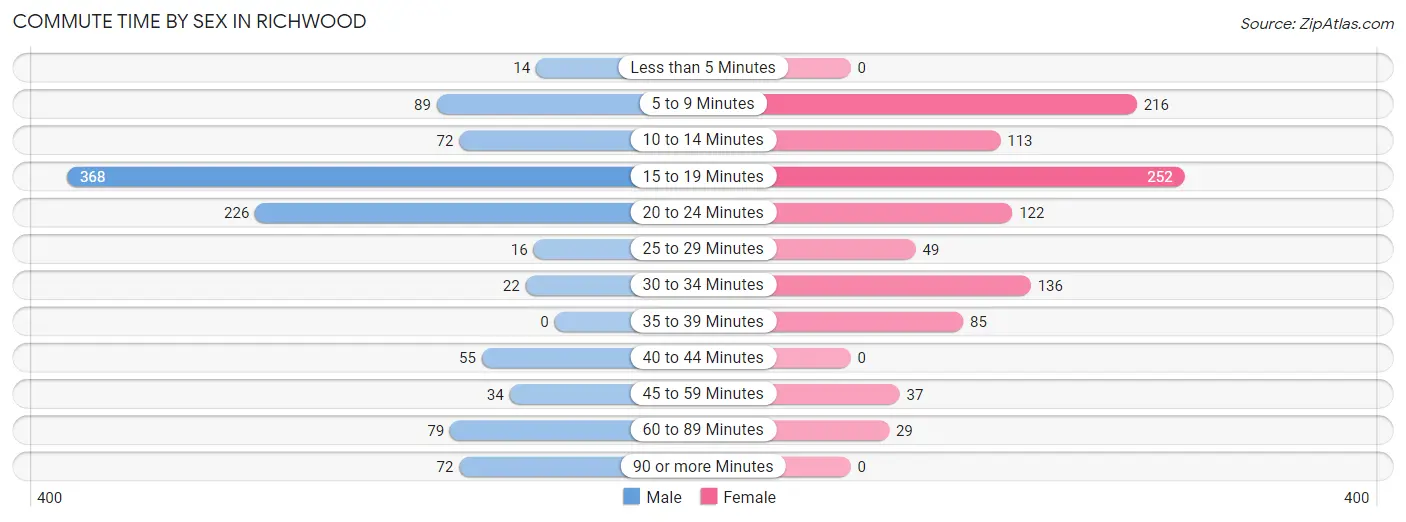
| Commute Time | Male | Female |
| Less than 5 Minutes | 14 (1.3%) | 0 (0.0%) |
| 5 to 9 Minutes | 89 (8.5%) | 216 (20.8%) |
| 10 to 14 Minutes | 72 (6.9%) | 113 (10.9%) |
| 15 to 19 Minutes | 368 (35.1%) | 252 (24.2%) |
| 20 to 24 Minutes | 226 (21.6%) | 122 (11.7%) |
| 25 to 29 Minutes | 16 (1.5%) | 49 (4.7%) |
| 30 to 34 Minutes | 22 (2.1%) | 136 (13.1%) |
| 35 to 39 Minutes | 0 (0.0%) | 85 (8.2%) |
| 40 to 44 Minutes | 55 (5.2%) | 0 (0.0%) |
| 45 to 59 Minutes | 34 (3.3%) | 37 (3.6%) |
| 60 to 89 Minutes | 79 (7.5%) | 29 (2.8%) |
| 90 or more Minutes | 72 (6.9%) | 0 (0.0%) |
Time of Departure to Work by Sex in Richwood
The most frequent times of departure to work in Richwood are 6:00 AM to 6:29 AM (252, 24.1%) for males and 6:30 AM to 6:59 AM (211, 20.3%) for females.
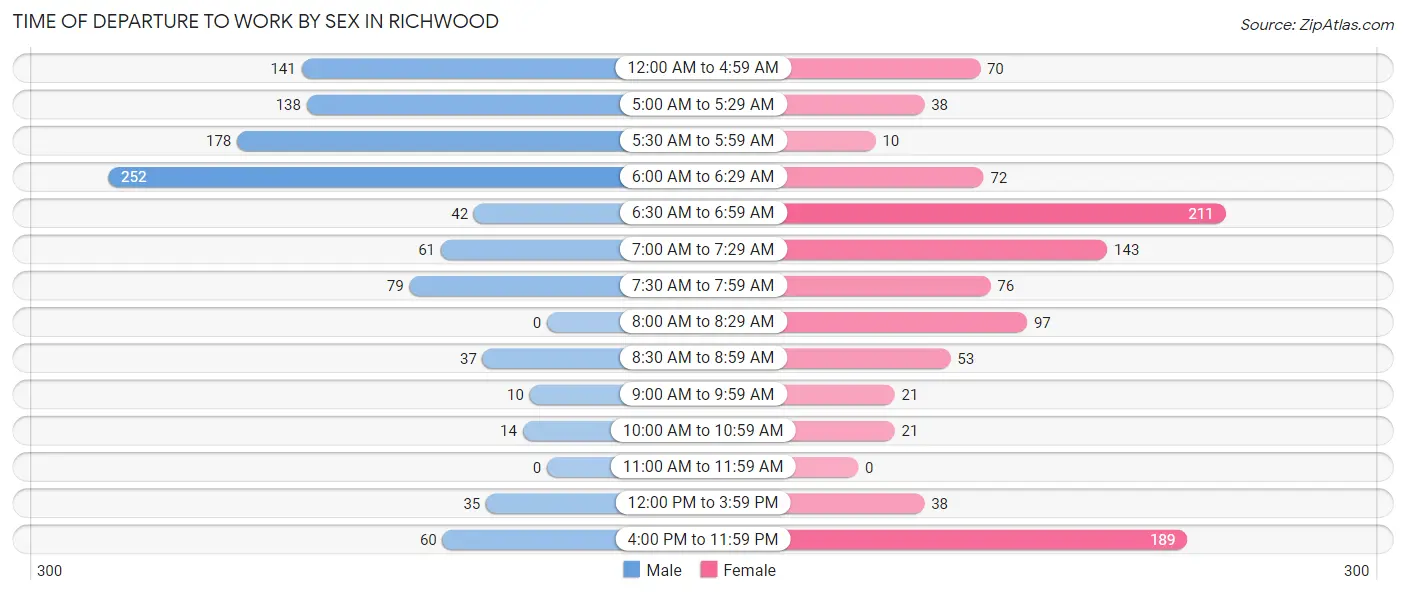
| Time of Departure | Male | Female |
| 12:00 AM to 4:59 AM | 141 (13.5%) | 70 (6.7%) |
| 5:00 AM to 5:29 AM | 138 (13.2%) | 38 (3.7%) |
| 5:30 AM to 5:59 AM | 178 (17.0%) | 10 (1.0%) |
| 6:00 AM to 6:29 AM | 252 (24.1%) | 72 (6.9%) |
| 6:30 AM to 6:59 AM | 42 (4.0%) | 211 (20.3%) |
| 7:00 AM to 7:29 AM | 61 (5.8%) | 143 (13.8%) |
| 7:30 AM to 7:59 AM | 79 (7.5%) | 76 (7.3%) |
| 8:00 AM to 8:29 AM | 0 (0.0%) | 97 (9.3%) |
| 8:30 AM to 8:59 AM | 37 (3.5%) | 53 (5.1%) |
| 9:00 AM to 9:59 AM | 10 (1.0%) | 21 (2.0%) |
| 10:00 AM to 10:59 AM | 14 (1.3%) | 21 (2.0%) |
| 11:00 AM to 11:59 AM | 0 (0.0%) | 0 (0.0%) |
| 12:00 PM to 3:59 PM | 35 (3.3%) | 38 (3.7%) |
| 4:00 PM to 11:59 PM | 60 (5.7%) | 189 (18.2%) |
| Total | 1,047 (100.0%) | 1,039 (100.0%) |
Housing Occupancy in Richwood
Occupancy by Ownership in Richwood
Of the total 1,710 dwellings in Richwood, owner-occupied units account for 1,069 (62.5%), while renter-occupied units make up 641 (37.5%).
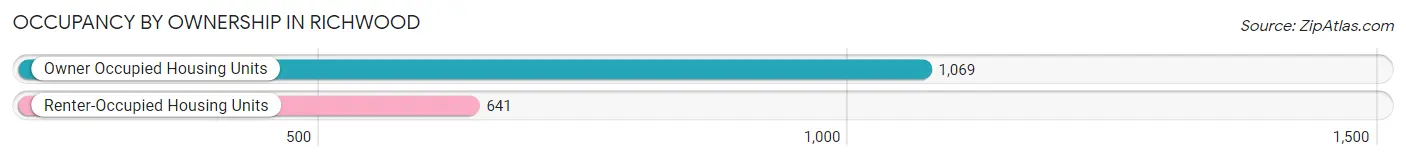
| Occupancy | # Housing Units | % Housing Units |
| Owner Occupied Housing Units | 1,069 | 62.5% |
| Renter-Occupied Housing Units | 641 | 37.5% |
| Total Occupied Housing Units | 1,710 | 100.0% |
Occupancy by Household Size in Richwood
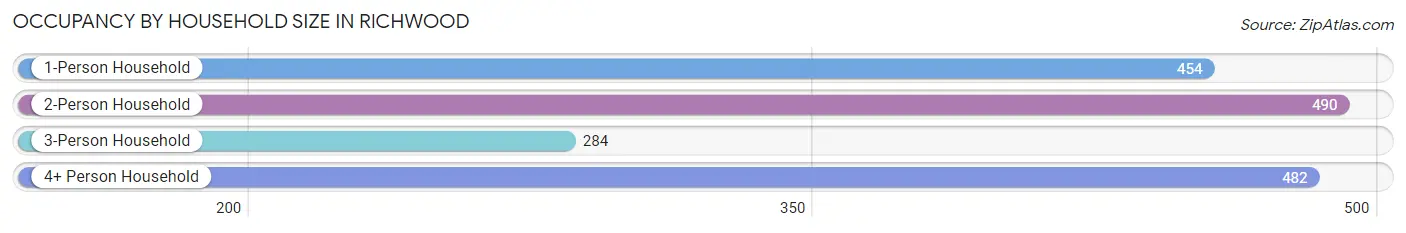
| Household Size | # Housing Units | % Housing Units |
| 1-Person Household | 454 | 26.6% |
| 2-Person Household | 490 | 28.6% |
| 3-Person Household | 284 | 16.6% |
| 4+ Person Household | 482 | 28.2% |
| Total Housing Units | 1,710 | 100.0% |
Occupancy by Ownership by Household Size in Richwood
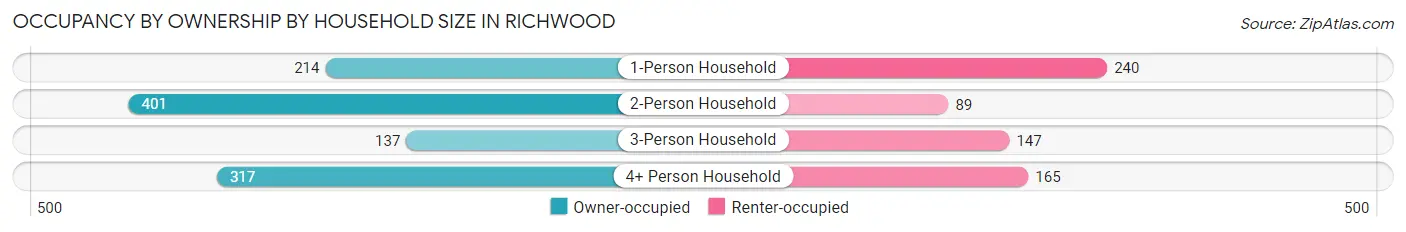
| Household Size | Owner-occupied | Renter-occupied |
| 1-Person Household | 214 (47.1%) | 240 (52.9%) |
| 2-Person Household | 401 (81.8%) | 89 (18.2%) |
| 3-Person Household | 137 (48.2%) | 147 (51.8%) |
| 4+ Person Household | 317 (65.8%) | 165 (34.2%) |
| Total Housing Units | 1,069 (62.5%) | 641 (37.5%) |
Occupancy by Educational Attainment in Richwood
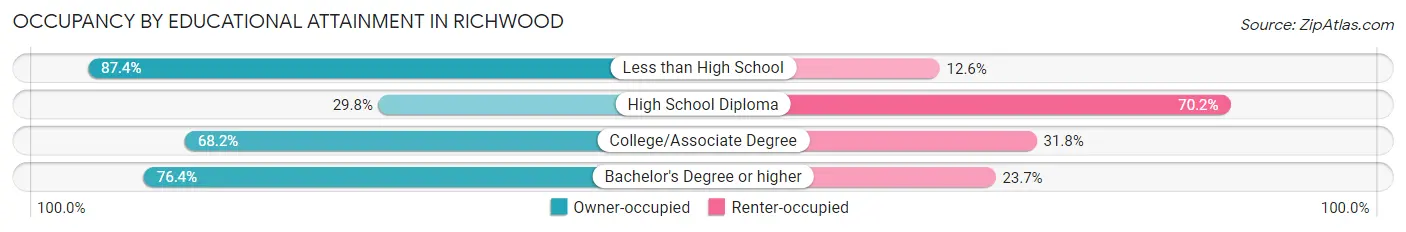
| Household Size | Owner-occupied | Renter-occupied |
| Less than High School | 132 (87.4%) | 19 (12.6%) |
| High School Diploma | 126 (29.8%) | 297 (70.2%) |
| College/Associate Degree | 472 (68.2%) | 220 (31.8%) |
| Bachelor's Degree or higher | 339 (76.3%) | 105 (23.6%) |
Occupancy by Age of Householder in Richwood
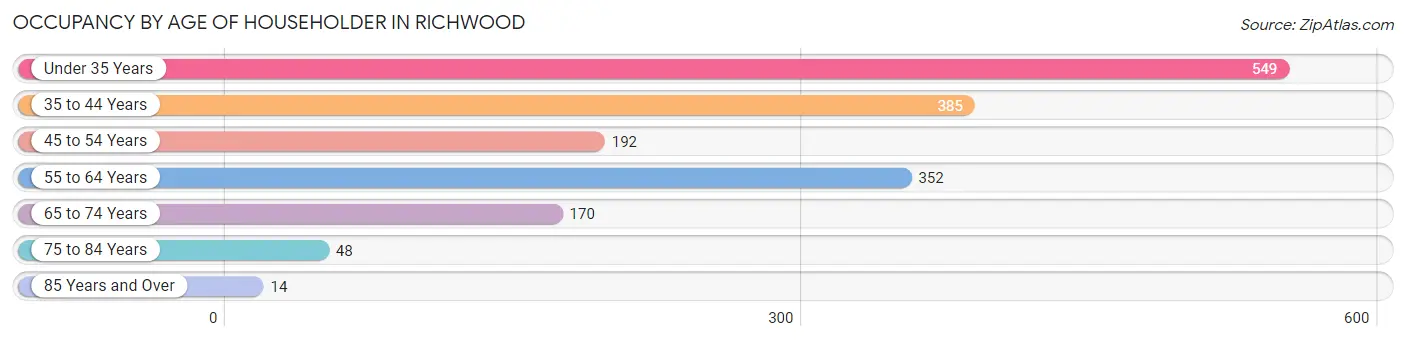
| Age Bracket | # Households | % Households |
| Under 35 Years | 549 | 32.1% |
| 35 to 44 Years | 385 | 22.5% |
| 45 to 54 Years | 192 | 11.2% |
| 55 to 64 Years | 352 | 20.6% |
| 65 to 74 Years | 170 | 9.9% |
| 75 to 84 Years | 48 | 2.8% |
| 85 Years and Over | 14 | 0.8% |
| Total | 1,710 | 100.0% |
Housing Finances in Richwood
Median Income by Occupancy in Richwood
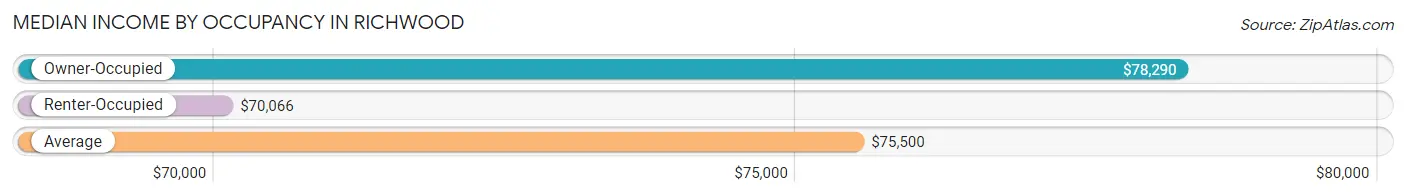
| Occupancy Type | # Households | Median Income |
| Owner-Occupied | 1,069 (62.5%) | $78,290 |
| Renter-Occupied | 641 (37.5%) | $70,066 |
| Average | 1,710 (100.0%) | $75,500 |
Occupancy by Householder Income Bracket in Richwood
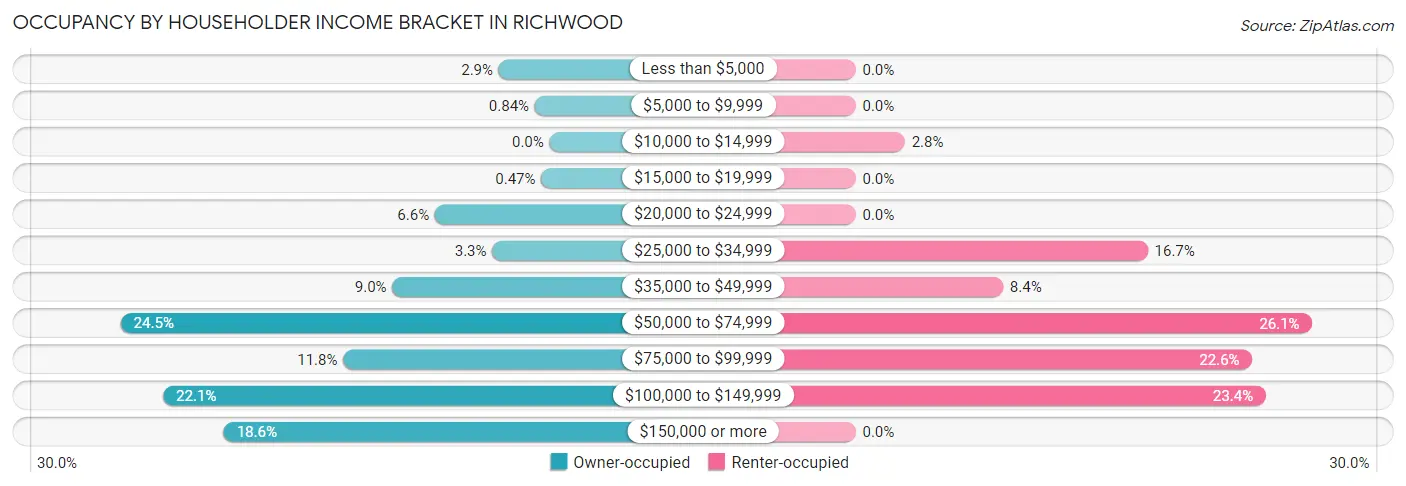
| Income Bracket | Owner-occupied | Renter-occupied |
| Less than $5,000 | 31 (2.9%) | 0 (0.0%) |
| $5,000 to $9,999 | 9 (0.8%) | 0 (0.0%) |
| $10,000 to $14,999 | 0 (0.0%) | 18 (2.8%) |
| $15,000 to $19,999 | 5 (0.5%) | 0 (0.0%) |
| $20,000 to $24,999 | 70 (6.6%) | 0 (0.0%) |
| $25,000 to $34,999 | 35 (3.3%) | 107 (16.7%) |
| $35,000 to $49,999 | 96 (9.0%) | 54 (8.4%) |
| $50,000 to $74,999 | 262 (24.5%) | 167 (26.1%) |
| $75,000 to $99,999 | 126 (11.8%) | 145 (22.6%) |
| $100,000 to $149,999 | 236 (22.1%) | 150 (23.4%) |
| $150,000 or more | 199 (18.6%) | 0 (0.0%) |
| Total | 1,069 (100.0%) | 641 (100.0%) |
Monthly Housing Cost Tiers in Richwood
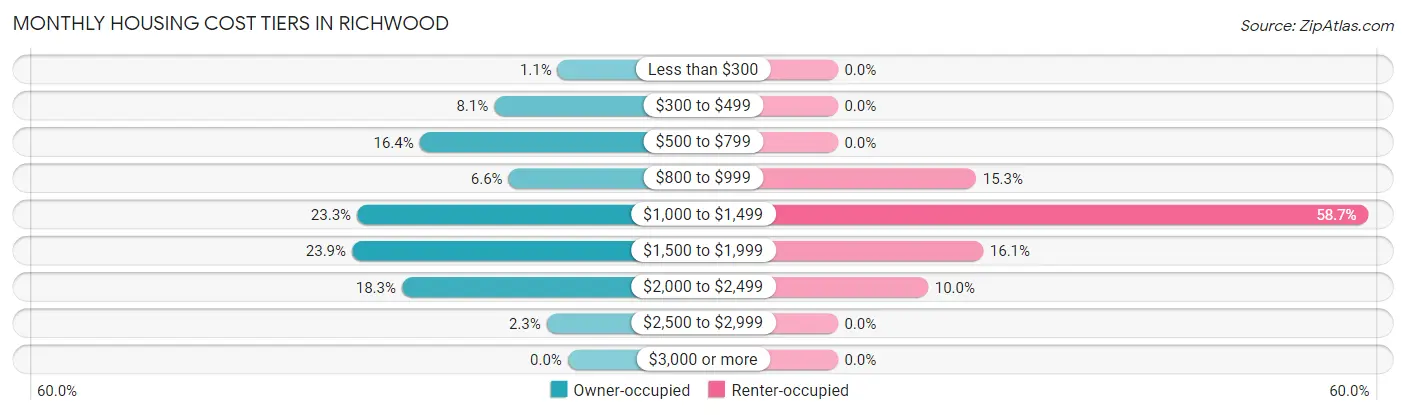
| Monthly Cost | Owner-occupied | Renter-occupied |
| Less than $300 | 12 (1.1%) | 0 (0.0%) |
| $300 to $499 | 87 (8.1%) | 0 (0.0%) |
| $500 to $799 | 175 (16.4%) | 0 (0.0%) |
| $800 to $999 | 70 (6.6%) | 98 (15.3%) |
| $1,000 to $1,499 | 249 (23.3%) | 376 (58.7%) |
| $1,500 to $1,999 | 255 (23.8%) | 103 (16.1%) |
| $2,000 to $2,499 | 196 (18.3%) | 64 (10.0%) |
| $2,500 to $2,999 | 25 (2.3%) | 0 (0.0%) |
| $3,000 or more | 0 (0.0%) | 0 (0.0%) |
| Total | 1,069 (100.0%) | 641 (100.0%) |
Physical Housing Characteristics in Richwood
Housing Structures in Richwood
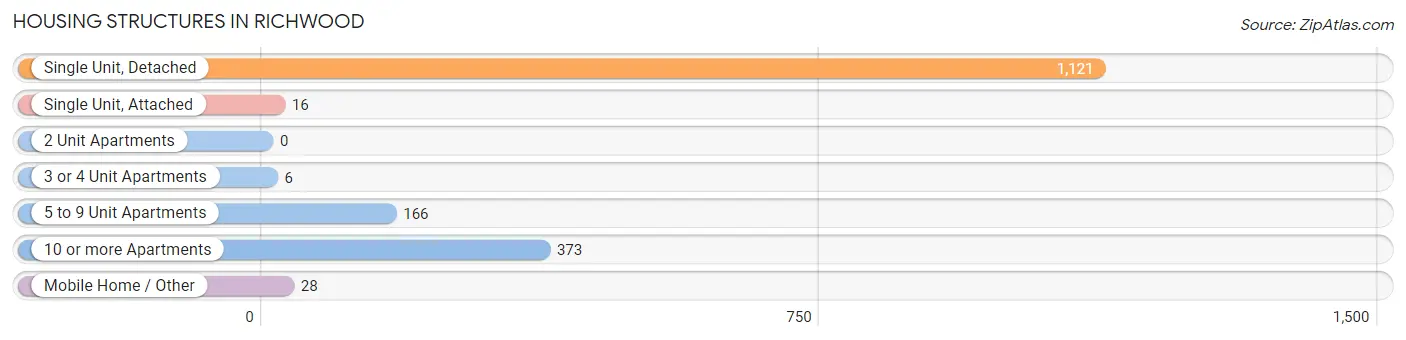
| Structure Type | # Housing Units | % Housing Units |
| Single Unit, Detached | 1,121 | 65.6% |
| Single Unit, Attached | 16 | 0.9% |
| 2 Unit Apartments | 0 | 0.0% |
| 3 or 4 Unit Apartments | 6 | 0.4% |
| 5 to 9 Unit Apartments | 166 | 9.7% |
| 10 or more Apartments | 373 | 21.8% |
| Mobile Home / Other | 28 | 1.6% |
| Total | 1,710 | 100.0% |
Housing Structures by Occupancy in Richwood
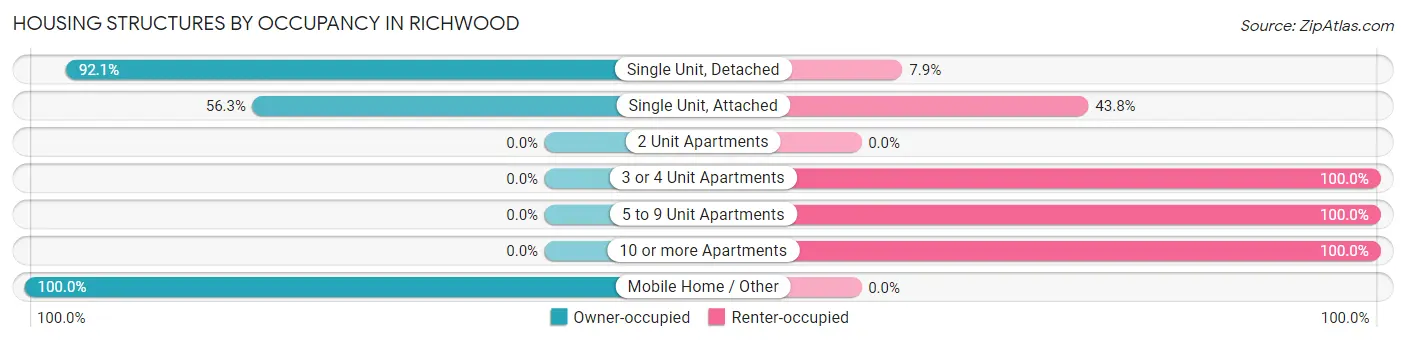
| Structure Type | Owner-occupied | Renter-occupied |
| Single Unit, Detached | 1,032 (92.1%) | 89 (7.9%) |
| Single Unit, Attached | 9 (56.2%) | 7 (43.8%) |
| 2 Unit Apartments | 0 (0.0%) | 0 (0.0%) |
| 3 or 4 Unit Apartments | 0 (0.0%) | 6 (100.0%) |
| 5 to 9 Unit Apartments | 0 (0.0%) | 166 (100.0%) |
| 10 or more Apartments | 0 (0.0%) | 373 (100.0%) |
| Mobile Home / Other | 28 (100.0%) | 0 (0.0%) |
| Total | 1,069 (62.5%) | 641 (37.5%) |
Housing Structures by Number of Rooms in Richwood
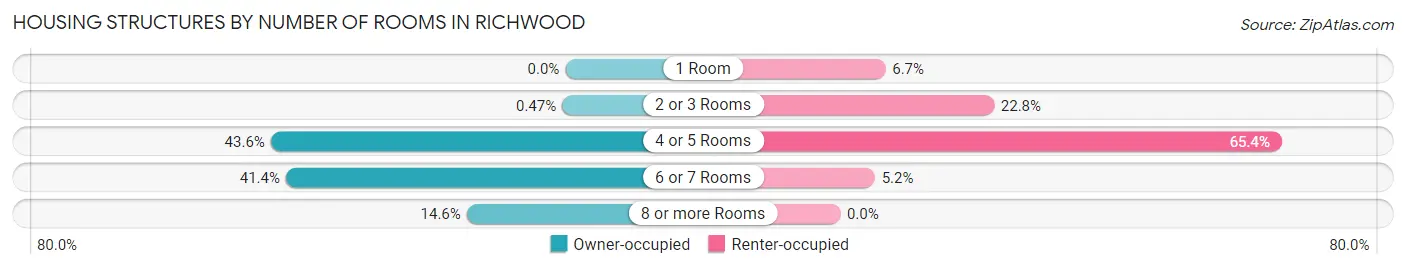
| Number of Rooms | Owner-occupied | Renter-occupied |
| 1 Room | 0 (0.0%) | 43 (6.7%) |
| 2 or 3 Rooms | 5 (0.5%) | 146 (22.8%) |
| 4 or 5 Rooms | 466 (43.6%) | 419 (65.4%) |
| 6 or 7 Rooms | 442 (41.3%) | 33 (5.1%) |
| 8 or more Rooms | 156 (14.6%) | 0 (0.0%) |
| Total | 1,069 (100.0%) | 641 (100.0%) |
Housing Structure by Heating Type in Richwood
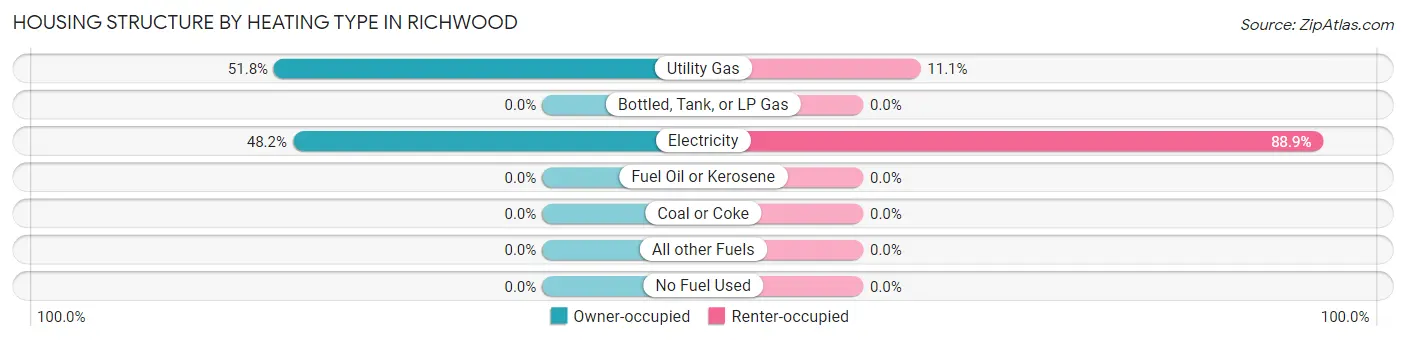
| Heating Type | Owner-occupied | Renter-occupied |
| Utility Gas | 554 (51.8%) | 71 (11.1%) |
| Bottled, Tank, or LP Gas | 0 (0.0%) | 0 (0.0%) |
| Electricity | 515 (48.2%) | 570 (88.9%) |
| Fuel Oil or Kerosene | 0 (0.0%) | 0 (0.0%) |
| Coal or Coke | 0 (0.0%) | 0 (0.0%) |
| All other Fuels | 0 (0.0%) | 0 (0.0%) |
| No Fuel Used | 0 (0.0%) | 0 (0.0%) |
| Total | 1,069 (100.0%) | 641 (100.0%) |
Household Vehicle Usage in Richwood
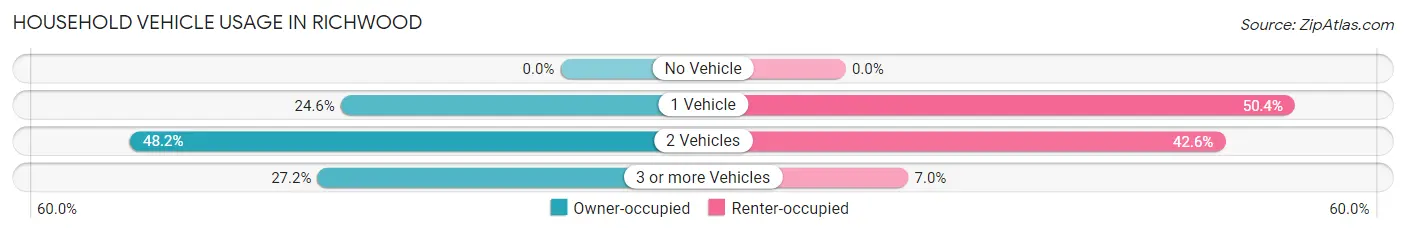
| Vehicles per Household | Owner-occupied | Renter-occupied |
| No Vehicle | 0 (0.0%) | 0 (0.0%) |
| 1 Vehicle | 263 (24.6%) | 323 (50.4%) |
| 2 Vehicles | 515 (48.2%) | 273 (42.6%) |
| 3 or more Vehicles | 291 (27.2%) | 45 (7.0%) |
| Total | 1,069 (100.0%) | 641 (100.0%) |
Real Estate & Mortgages in Richwood
Real Estate and Mortgage Overview in Richwood
| Characteristic | Without Mortgage | With Mortgage |
| Housing Units | 394 | 675 |
| Median Property Value | $202,400 | $232,600 |
| Median Household Income | $65,245 | $107 |
| Monthly Housing Costs | $667 | $0 |
| Real Estate Taxes | $3,073 | $6 |
Property Value by Mortgage Status in Richwood
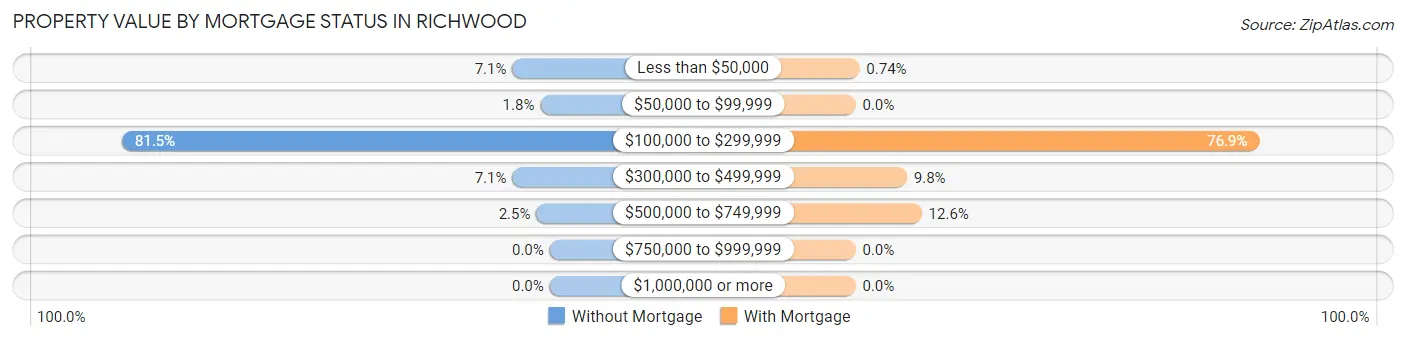
| Property Value | Without Mortgage | With Mortgage |
| Less than $50,000 | 28 (7.1%) | 5 (0.7%) |
| $50,000 to $99,999 | 7 (1.8%) | 0 (0.0%) |
| $100,000 to $299,999 | 321 (81.5%) | 519 (76.9%) |
| $300,000 to $499,999 | 28 (7.1%) | 66 (9.8%) |
| $500,000 to $749,999 | 10 (2.5%) | 85 (12.6%) |
| $750,000 to $999,999 | 0 (0.0%) | 0 (0.0%) |
| $1,000,000 or more | 0 (0.0%) | 0 (0.0%) |
| Total | 394 (100.0%) | 675 (100.0%) |
Household Income by Mortgage Status in Richwood
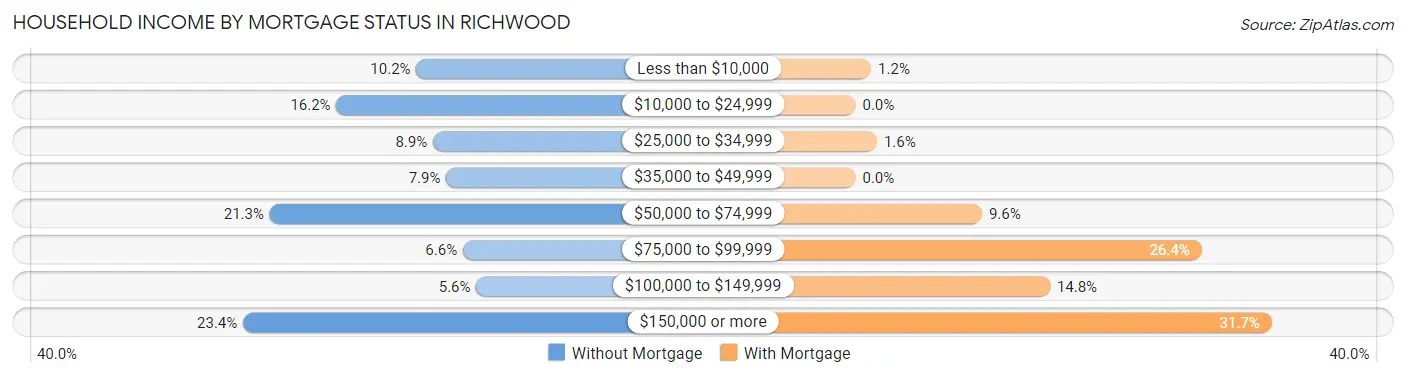
| Household Income | Without Mortgage | With Mortgage |
| Less than $10,000 | 40 (10.2%) | 8 (1.2%) |
| $10,000 to $24,999 | 64 (16.2%) | 0 (0.0%) |
| $25,000 to $34,999 | 35 (8.9%) | 11 (1.6%) |
| $35,000 to $49,999 | 31 (7.9%) | 0 (0.0%) |
| $50,000 to $74,999 | 84 (21.3%) | 65 (9.6%) |
| $75,000 to $99,999 | 26 (6.6%) | 178 (26.4%) |
| $100,000 to $149,999 | 22 (5.6%) | 100 (14.8%) |
| $150,000 or more | 92 (23.4%) | 214 (31.7%) |
| Total | 394 (100.0%) | 675 (100.0%) |
Property Value to Household Income Ratio in Richwood
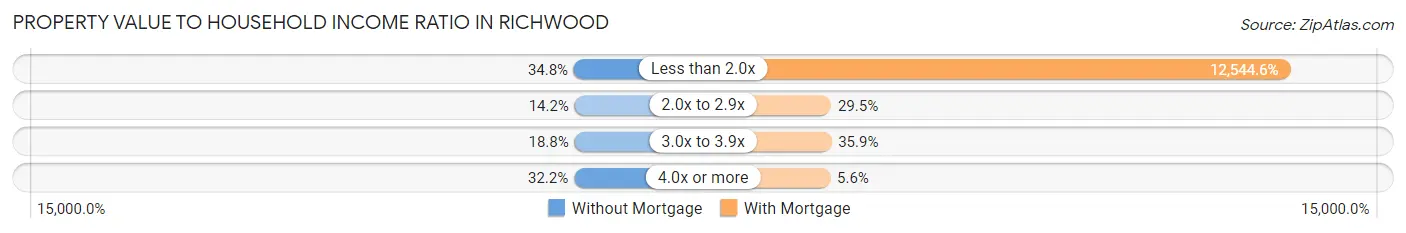
| Value-to-Income Ratio | Without Mortgage | With Mortgage |
| Less than 2.0x | 137 (34.8%) | 84,676 (12,544.6%) |
| 2.0x to 2.9x | 56 (14.2%) | 199 (29.5%) |
| 3.0x to 3.9x | 74 (18.8%) | 242 (35.8%) |
| 4.0x or more | 127 (32.2%) | 38 (5.6%) |
| Total | 394 (100.0%) | 675 (100.0%) |
Real Estate Taxes by Mortgage Status in Richwood
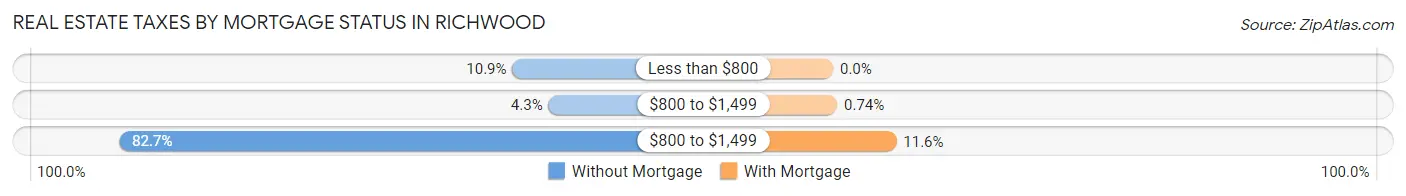
| Property Taxes | Without Mortgage | With Mortgage |
| Less than $800 | 43 (10.9%) | 0 (0.0%) |
| $800 to $1,499 | 17 (4.3%) | 5 (0.7%) |
| $800 to $1,499 | 326 (82.7%) | 78 (11.6%) |
| Total | 394 (100.0%) | 675 (100.0%) |
Health & Disability in Richwood
Health Insurance Coverage by Age in Richwood
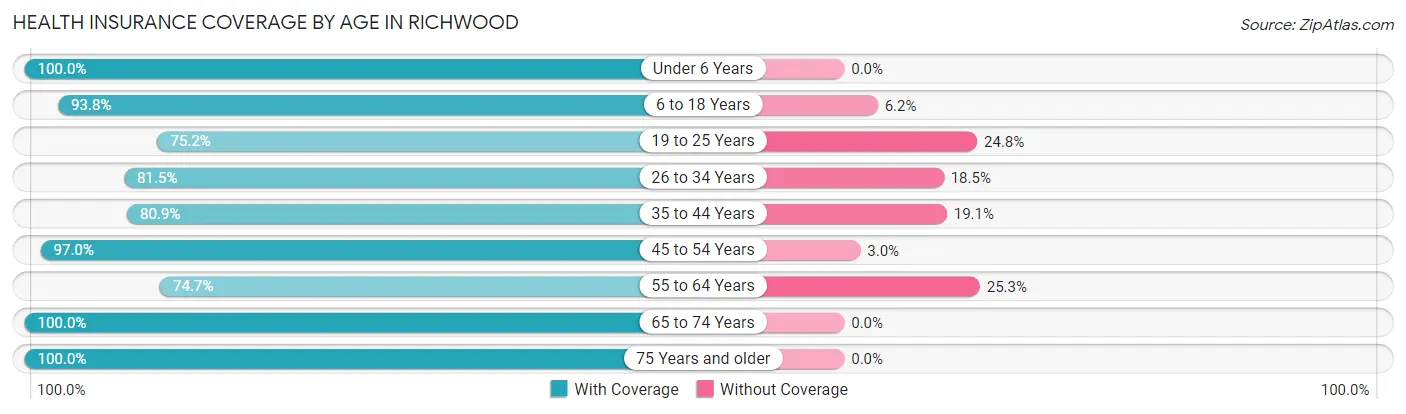
| Age Bracket | With Coverage | Without Coverage |
| Under 6 Years | 547 (100.0%) | 0 (0.0%) |
| 6 to 18 Years | 964 (93.8%) | 64 (6.2%) |
| 19 to 25 Years | 416 (75.2%) | 137 (24.8%) |
| 26 to 34 Years | 523 (81.5%) | 119 (18.5%) |
| 35 to 44 Years | 499 (80.9%) | 118 (19.1%) |
| 45 to 54 Years | 357 (97.0%) | 11 (3.0%) |
| 55 to 64 Years | 408 (74.7%) | 138 (25.3%) |
| 65 to 74 Years | 247 (100.0%) | 0 (0.0%) |
| 75 Years and older | 164 (100.0%) | 0 (0.0%) |
| Total | 4,125 (87.5%) | 587 (12.5%) |
Health Insurance Coverage by Citizenship Status in Richwood
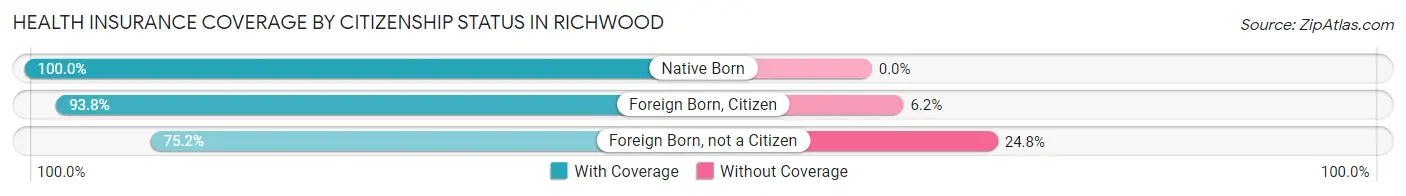
| Citizenship Status | With Coverage | Without Coverage |
| Native Born | 547 (100.0%) | 0 (0.0%) |
| Foreign Born, Citizen | 964 (93.8%) | 64 (6.2%) |
| Foreign Born, not a Citizen | 416 (75.2%) | 137 (24.8%) |
Health Insurance Coverage by Household Income in Richwood
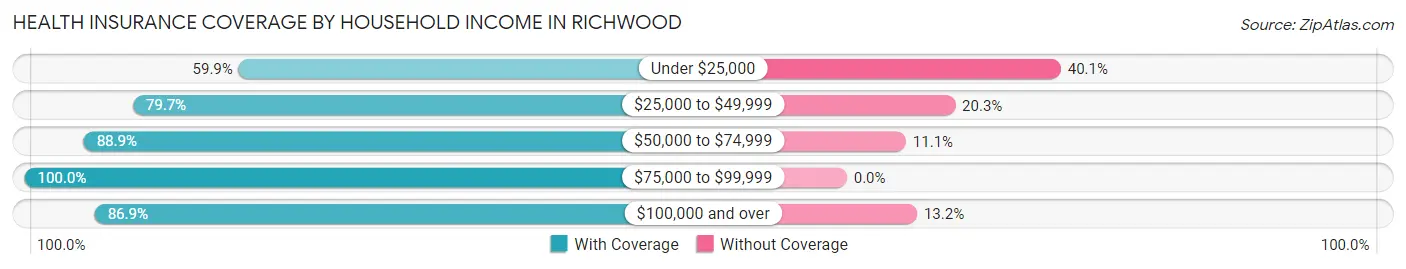
| Household Income | With Coverage | Without Coverage |
| Under $25,000 | 115 (59.9%) | 77 (40.1%) |
| $25,000 to $49,999 | 420 (79.7%) | 107 (20.3%) |
| $50,000 to $74,999 | 907 (88.9%) | 113 (11.1%) |
| $75,000 to $99,999 | 768 (100.0%) | 0 (0.0%) |
| $100,000 and over | 1,915 (86.9%) | 290 (13.2%) |
Public vs Private Health Insurance Coverage by Age in Richwood
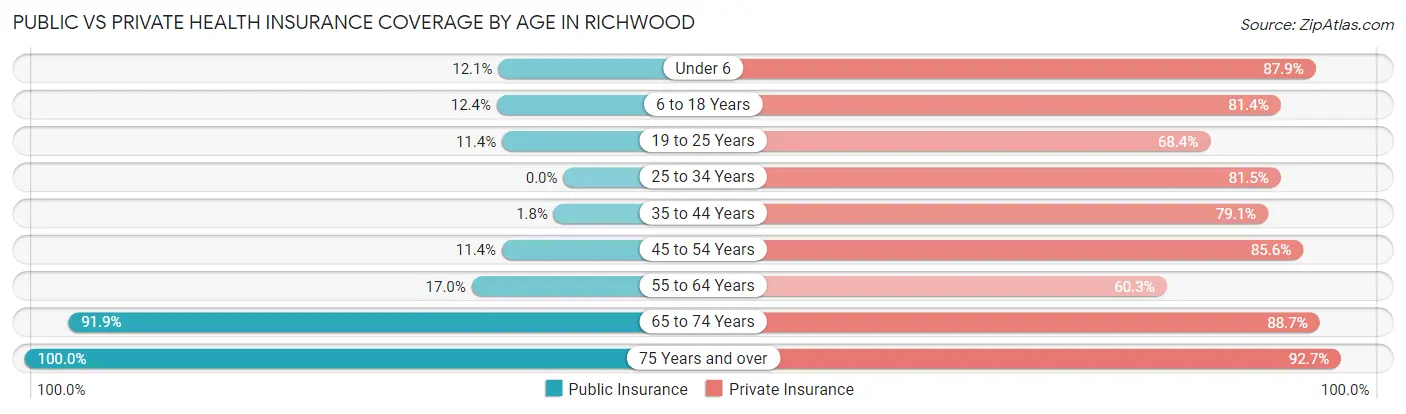
| Age Bracket | Public Insurance | Private Insurance |
| Under 6 | 66 (12.1%) | 481 (87.9%) |
| 6 to 18 Years | 127 (12.3%) | 837 (81.4%) |
| 19 to 25 Years | 63 (11.4%) | 378 (68.3%) |
| 25 to 34 Years | 0 (0.0%) | 523 (81.5%) |
| 35 to 44 Years | 11 (1.8%) | 488 (79.1%) |
| 45 to 54 Years | 42 (11.4%) | 315 (85.6%) |
| 55 to 64 Years | 93 (17.0%) | 329 (60.3%) |
| 65 to 74 Years | 227 (91.9%) | 219 (88.7%) |
| 75 Years and over | 164 (100.0%) | 152 (92.7%) |
| Total | 793 (16.8%) | 3,722 (79.0%) |
Disability Status by Sex by Age in Richwood
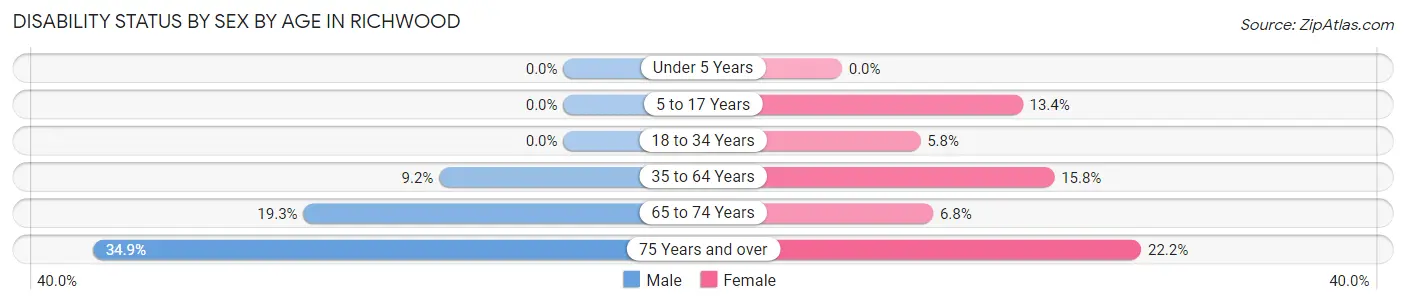
| Age Bracket | Male | Female |
| Under 5 Years | 0 (0.0%) | 0 (0.0%) |
| 5 to 17 Years | 0 (0.0%) | 82 (13.4%) |
| 18 to 34 Years | 0 (0.0%) | 37 (5.8%) |
| 35 to 64 Years | 71 (9.2%) | 120 (15.8%) |
| 65 to 74 Years | 22 (19.3%) | 9 (6.8%) |
| 75 Years and over | 29 (34.9%) | 18 (22.2%) |
Disability Class by Sex by Age in Richwood
Disability Class: Hearing Difficulty
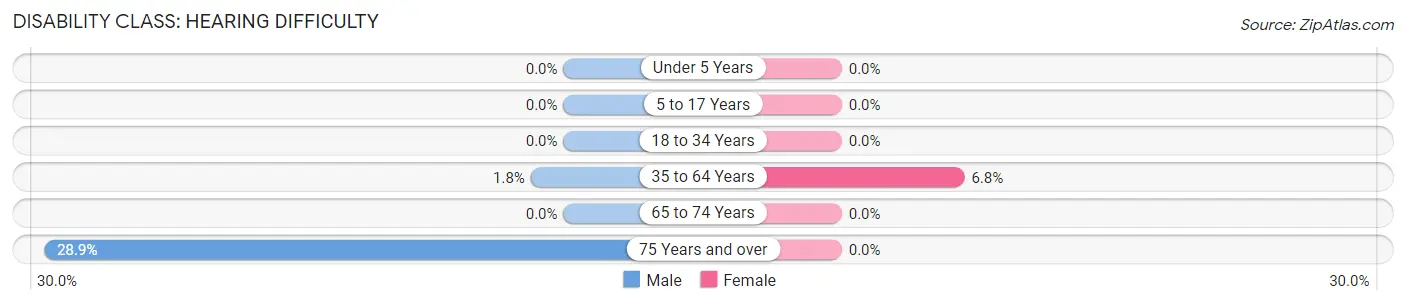
| Age Bracket | Male | Female |
| Under 5 Years | 0 (0.0%) | 0 (0.0%) |
| 5 to 17 Years | 0 (0.0%) | 0 (0.0%) |
| 18 to 34 Years | 0 (0.0%) | 0 (0.0%) |
| 35 to 64 Years | 14 (1.8%) | 52 (6.8%) |
| 65 to 74 Years | 0 (0.0%) | 0 (0.0%) |
| 75 Years and over | 24 (28.9%) | 0 (0.0%) |
Disability Class: Vision Difficulty
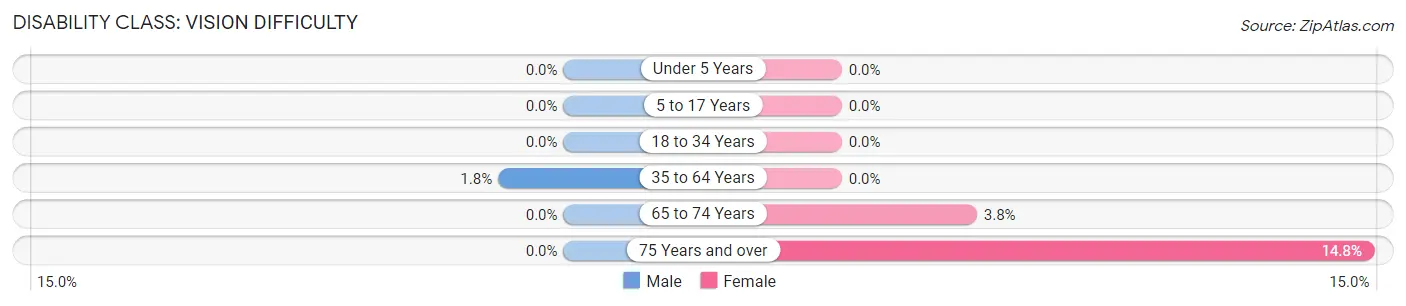
| Age Bracket | Male | Female |
| Under 5 Years | 0 (0.0%) | 0 (0.0%) |
| 5 to 17 Years | 0 (0.0%) | 0 (0.0%) |
| 18 to 34 Years | 0 (0.0%) | 0 (0.0%) |
| 35 to 64 Years | 14 (1.8%) | 0 (0.0%) |
| 65 to 74 Years | 0 (0.0%) | 5 (3.8%) |
| 75 Years and over | 0 (0.0%) | 12 (14.8%) |
Disability Class: Cognitive Difficulty
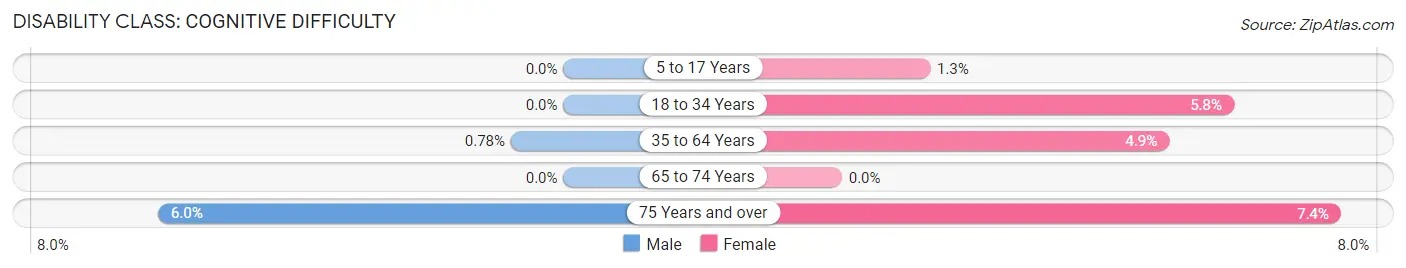
| Age Bracket | Male | Female |
| 5 to 17 Years | 0 (0.0%) | 8 (1.3%) |
| 18 to 34 Years | 0 (0.0%) | 37 (5.8%) |
| 35 to 64 Years | 6 (0.8%) | 37 (4.9%) |
| 65 to 74 Years | 0 (0.0%) | 0 (0.0%) |
| 75 Years and over | 5 (6.0%) | 6 (7.4%) |
Disability Class: Ambulatory Difficulty
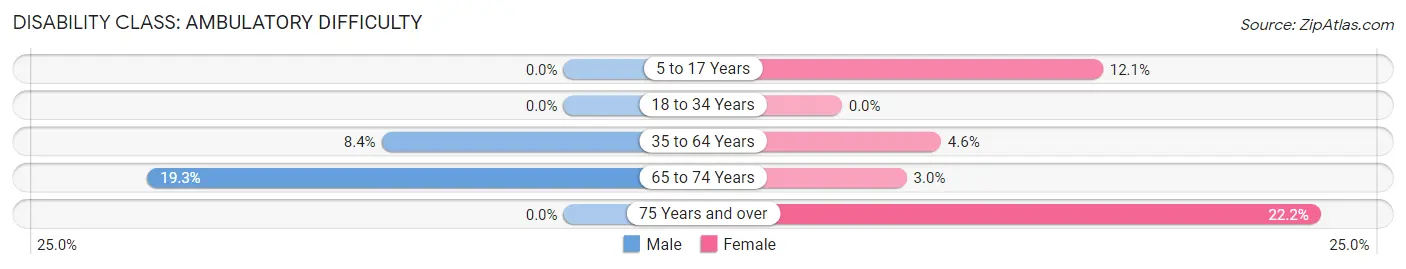
| Age Bracket | Male | Female |
| 5 to 17 Years | 0 (0.0%) | 74 (12.1%) |
| 18 to 34 Years | 0 (0.0%) | 0 (0.0%) |
| 35 to 64 Years | 65 (8.4%) | 35 (4.6%) |
| 65 to 74 Years | 22 (19.3%) | 4 (3.0%) |
| 75 Years and over | 0 (0.0%) | 18 (22.2%) |
Disability Class: Self-Care Difficulty
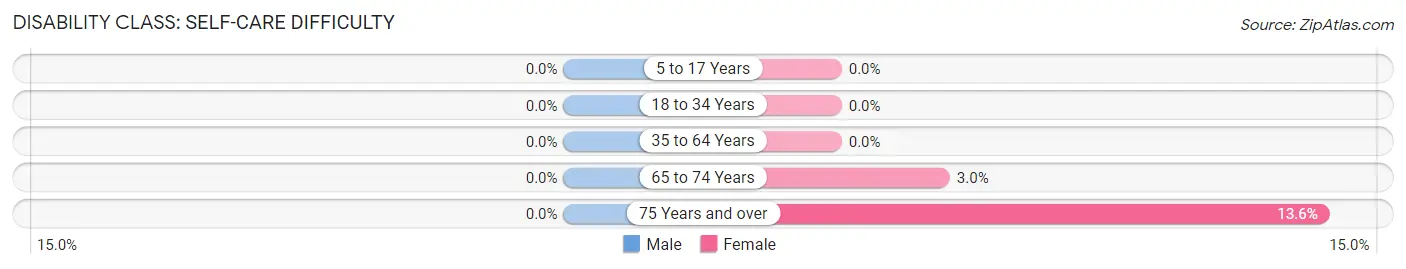
| Age Bracket | Male | Female |
| 5 to 17 Years | 0 (0.0%) | 0 (0.0%) |
| 18 to 34 Years | 0 (0.0%) | 0 (0.0%) |
| 35 to 64 Years | 0 (0.0%) | 0 (0.0%) |
| 65 to 74 Years | 0 (0.0%) | 4 (3.0%) |
| 75 Years and over | 0 (0.0%) | 11 (13.6%) |
Technology Access in Richwood
Computing Device Access in Richwood
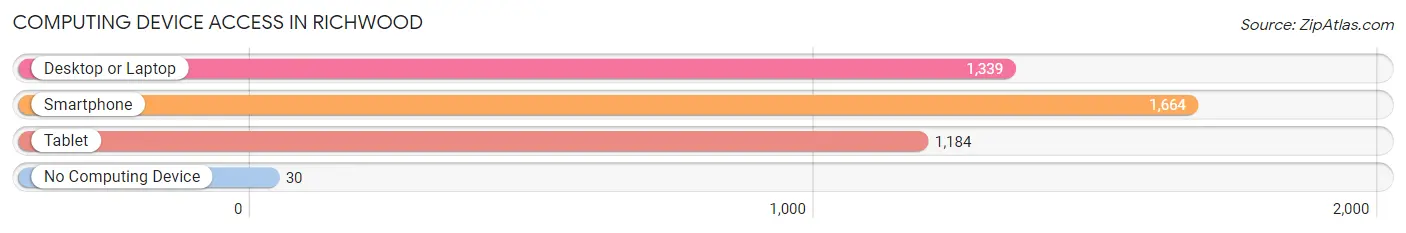
| Device Type | # Households | % Households |
| Desktop or Laptop | 1,339 | 78.3% |
| Smartphone | 1,664 | 97.3% |
| Tablet | 1,184 | 69.2% |
| No Computing Device | 30 | 1.8% |
| Total | 1,710 | 100.0% |
Internet Access in Richwood
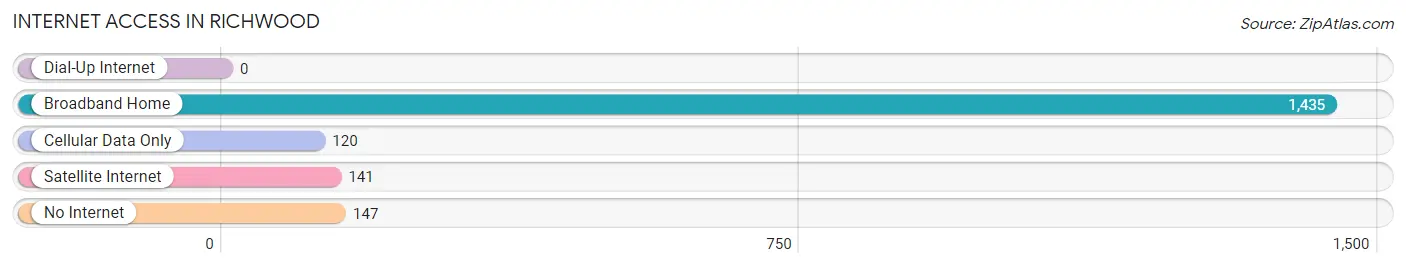
| Internet Type | # Households | % Households |
| Dial-Up Internet | 0 | 0.0% |
| Broadband Home | 1,435 | 83.9% |
| Cellular Data Only | 120 | 7.0% |
| Satellite Internet | 141 | 8.3% |
| No Internet | 147 | 8.6% |
| Total | 1,710 | 100.0% |
Richwood Summary
Richwood, Texas is a small city located in Brazoria County, Texas. It is situated on the Gulf Coast, approximately 30 miles south of Houston. The city has a population of approximately 4,000 people and is part of the Greater Houston metropolitan area.
History
Richwood was founded in 1891 by a group of settlers from the nearby town of Angleton. The settlers were looking for a place to settle and start a new life. The town was named after the nearby Richwood Creek, which was named after a local family. The town was incorporated in 1895 and quickly grew to become a thriving community.
The town was a popular destination for tourists and vacationers in the early 1900s. It was known for its beautiful beaches and fishing opportunities. The town also had a thriving lumber industry, which provided jobs for many of the residents.
In the 1950s, the town began to decline as the lumber industry moved away and the population began to decline. The town was hit hard by Hurricane Carla in 1961, which caused extensive damage to the town. The town was able to recover and rebuild, but the population never returned to its pre-hurricane levels.
Geography
Richwood is located in Brazoria County, Texas, on the Gulf Coast. It is situated approximately 30 miles south of Houston. The city is bordered by the cities of Angleton, Freeport, and Lake Jackson. The city is located on the banks of Richwood Creek, which is a tributary of the Brazos River.
The city has a total area of 2.3 square miles, all of which is land. The terrain is mostly flat, with some rolling hills. The climate is humid subtropical, with hot summers and mild winters.
Economy
The economy of Richwood is largely based on tourism and fishing. The city is home to several popular beaches and fishing spots, which attract visitors from all over the region. The city also has a thriving seafood industry, with several seafood restaurants and markets.
The city also has a growing manufacturing sector, with several factories located in the area. The city is home to several large companies, including a paper mill, a chemical plant, and a plastics factory.
Demographics
As of the 2010 census, the population of Richwood was 4,000. The racial makeup of the city was 79.3% White, 15.2% African American, 0.7% Native American, 0.7% Asian, 0.1% Pacific Islander, and 3.9% from other races. Hispanic or Latino of any race were 8.3% of the population.
The median household income in Richwood was $41,250, and the median family income was $48,750. The per capita income was $19,945. About 15.2% of the population was below the poverty line.
Richwood is a small city with a rich history and a bright future. It is a popular destination for tourists and vacationers, and it has a thriving economy based on tourism and fishing. The city is home to a diverse population, and it is a great place to live and work.
Common Questions
What is Per Capita Income in Richwood?
Per Capita income in Richwood is $34,069.
What is the Median Family Income in Richwood?
Median Family Income in Richwood is $90,848.
What is the Median Household income in Richwood?
Median Household Income in Richwood is $75,500.
What is Income or Wage Gap in Richwood?
Income or Wage Gap in Richwood is 46.9%.
Women in Richwood earn 53.1 cents for every dollar earned by a man.
What is Inequality or Gini Index in Richwood?
Inequality or Gini Index in Richwood is 0.37.
What is the Total Population of Richwood?
Total Population of Richwood is 4,712.
What is the Total Male Population of Richwood?
Total Male Population of Richwood is 2,398.
What is the Total Female Population of Richwood?
Total Female Population of Richwood is 2,314.
What is the Ratio of Males per 100 Females in Richwood?
There are 103.63 Males per 100 Females in Richwood.
What is the Ratio of Females per 100 Males in Richwood?
There are 96.50 Females per 100 Males in Richwood.
What is the Median Population Age in Richwood?
Median Population Age in Richwood is 30.1 Years.
What is the Average Family Size in Richwood
Average Family Size in Richwood is 3.4 People.
What is the Average Household Size in Richwood
Average Household Size in Richwood is 2.8 People.
How Large is the Labor Force in Richwood?
There are 2,427 People in the Labor Forcein in Richwood.
What is the Percentage of People in the Labor Force in Richwood?
72.7% of People are in the Labor Force in Richwood.
What is the Unemployment Rate in Richwood?
Unemployment Rate in Richwood is 5.7%.