St Jo, TX Map & Demographics
St Jo Map
St Jo Overview
$25,678
PER CAPITA INCOME
$87,917
AVG FAMILY INCOME
$75,125
AVG HOUSEHOLD INCOME
36.6%
WAGE / INCOME GAP [ % ]
63.4¢/ $1
WAGE / INCOME GAP [ $ ]
0.36
INEQUALITY / GINI INDEX
904
TOTAL POPULATION
433
MALE POPULATION
471
FEMALE POPULATION
91.93
MALES / 100 FEMALES
108.78
FEMALES / 100 MALES
34.5
MEDIAN AGE
3.4
AVG FAMILY SIZE
2.8
AVG HOUSEHOLD SIZE
374
LABOR FORCE [ PEOPLE ]
60.8%
PERCENT IN LABOR FORCE
4.0%
UNEMPLOYMENT RATE
Income in St Jo
Income Overview in St Jo
Per Capita Income in St Jo is $25,678, while median incomes of families and households are $87,917 and $75,125 respectively.
| Characteristic | Number | Measure |
| Per Capita Income | 904 | $25,678 |
| Median Family Income | 217 | $87,917 |
| Mean Family Income | 217 | $82,590 |
| Median Household Income | 328 | $75,125 |
| Mean Household Income | 328 | $68,601 |
| Income Deficit | 217 | $0 |
| Wage / Income Gap (%) | 904 | 36.61% |
| Wage / Income Gap ($) | 904 | 63.39¢ per $1 |
| Gini / Inequality Index | 904 | 0.36 |
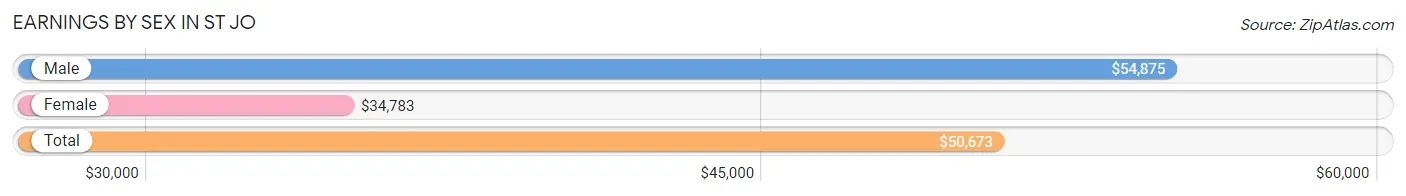
Earnings by Sex in St Jo
Average Earnings in St Jo are $50,673, $54,875 for men and $34,783 for women, a difference of 36.6%.
| Sex | Number | Average Earnings |
| Male | 205 (57.1%) | $54,875 |
| Female | 154 (42.9%) | $34,783 |
| Total | 359 (100.0%) | $50,673 |
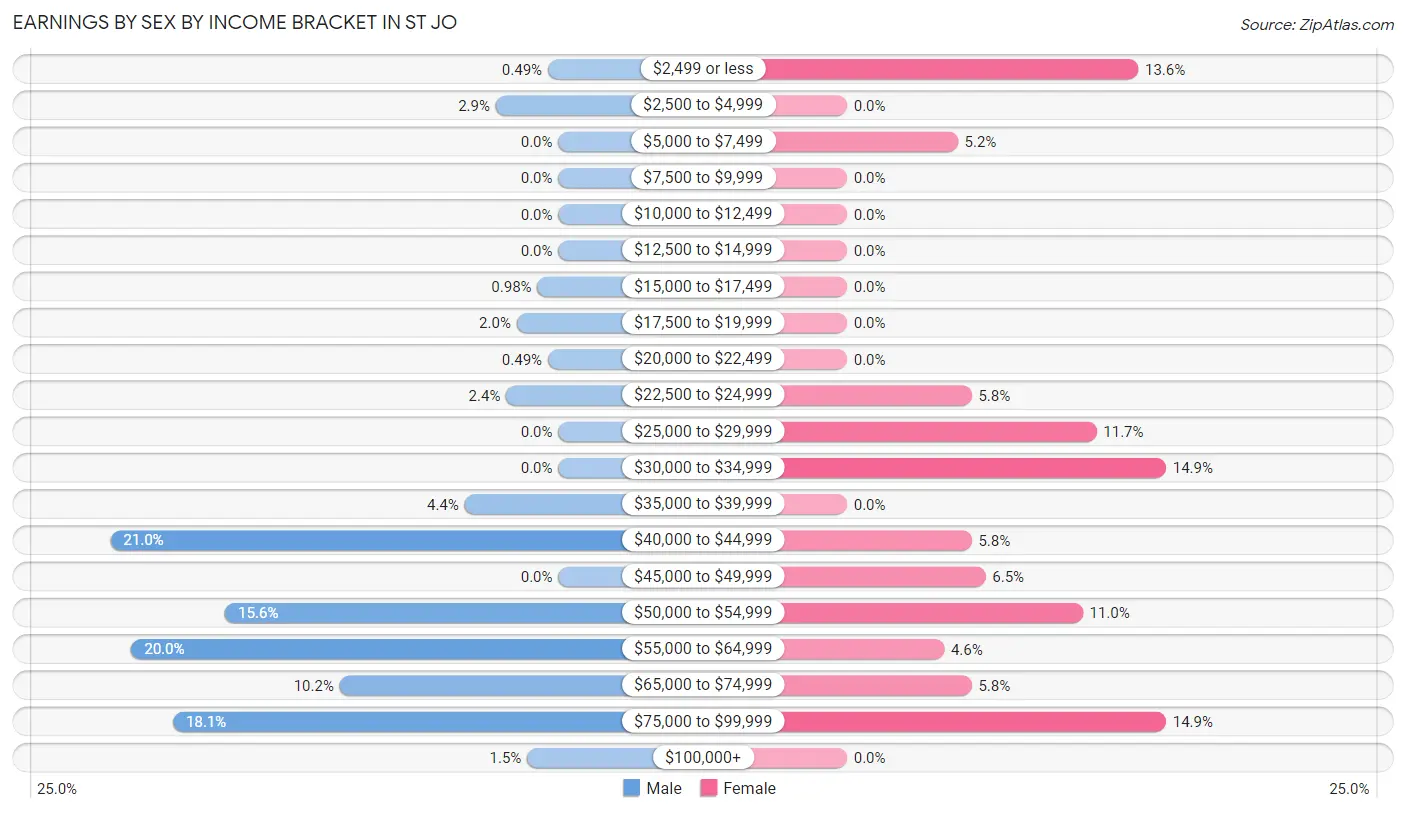
Earnings by Sex by Income Bracket in St Jo
The most common earnings brackets in St Jo are $40,000 to $44,999 for men (43 | 21.0%) and $30,000 to $34,999 for women (23 | 14.9%).
| Income | Male | Female |
| $2,499 or less | 1 (0.5%) | 21 (13.6%) |
| $2,500 to $4,999 | 6 (2.9%) | 0 (0.0%) |
| $5,000 to $7,499 | 0 (0.0%) | 8 (5.2%) |
| $7,500 to $9,999 | 0 (0.0%) | 0 (0.0%) |
| $10,000 to $12,499 | 0 (0.0%) | 0 (0.0%) |
| $12,500 to $14,999 | 0 (0.0%) | 0 (0.0%) |
| $15,000 to $17,499 | 2 (1.0%) | 0 (0.0%) |
| $17,500 to $19,999 | 4 (1.9%) | 0 (0.0%) |
| $20,000 to $22,499 | 1 (0.5%) | 0 (0.0%) |
| $22,500 to $24,999 | 5 (2.4%) | 9 (5.8%) |
| $25,000 to $29,999 | 0 (0.0%) | 18 (11.7%) |
| $30,000 to $34,999 | 0 (0.0%) | 23 (14.9%) |
| $35,000 to $39,999 | 9 (4.4%) | 0 (0.0%) |
| $40,000 to $44,999 | 43 (21.0%) | 9 (5.8%) |
| $45,000 to $49,999 | 0 (0.0%) | 10 (6.5%) |
| $50,000 to $54,999 | 32 (15.6%) | 17 (11.0%) |
| $55,000 to $64,999 | 41 (20.0%) | 7 (4.5%) |
| $65,000 to $74,999 | 21 (10.2%) | 9 (5.8%) |
| $75,000 to $99,999 | 37 (18.0%) | 23 (14.9%) |
| $100,000+ | 3 (1.5%) | 0 (0.0%) |
| Total | 205 (100.0%) | 154 (100.0%) |
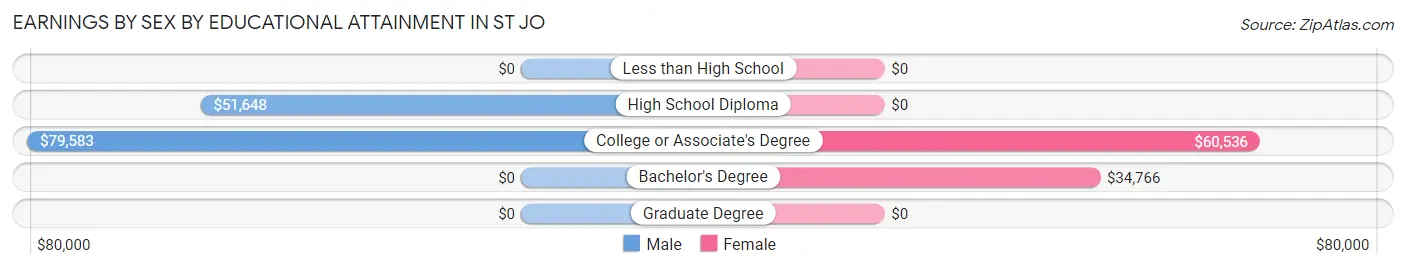
Earnings by Sex by Educational Attainment in St Jo
Average earnings in St Jo are $54,250 for men and $44,688 for women, a difference of 17.6%. Men with an educational attainment of college or associate's degree enjoy the highest average annual earnings of $79,583, while those with high school diploma education earn the least with $51,648. Women with an educational attainment of college or associate's degree earn the most with the average annual earnings of $60,536, while those with bachelor's degree education have the smallest earnings of $34,766.
| Educational Attainment | Male Income | Female Income |
| Less than High School | - | - |
| High School Diploma | $51,648 | $0 |
| College or Associate's Degree | $79,583 | $60,536 |
| Bachelor's Degree | - | - |
| Graduate Degree | - | - |
| Total | $54,250 | $44,688 |
Family Income in St Jo
Family Income Brackets in St Jo
According to the St Jo family income data, there are 98 families falling into the $100,000 to $149,999 income range, which is the most common income bracket and makes up 45.2% of all families.
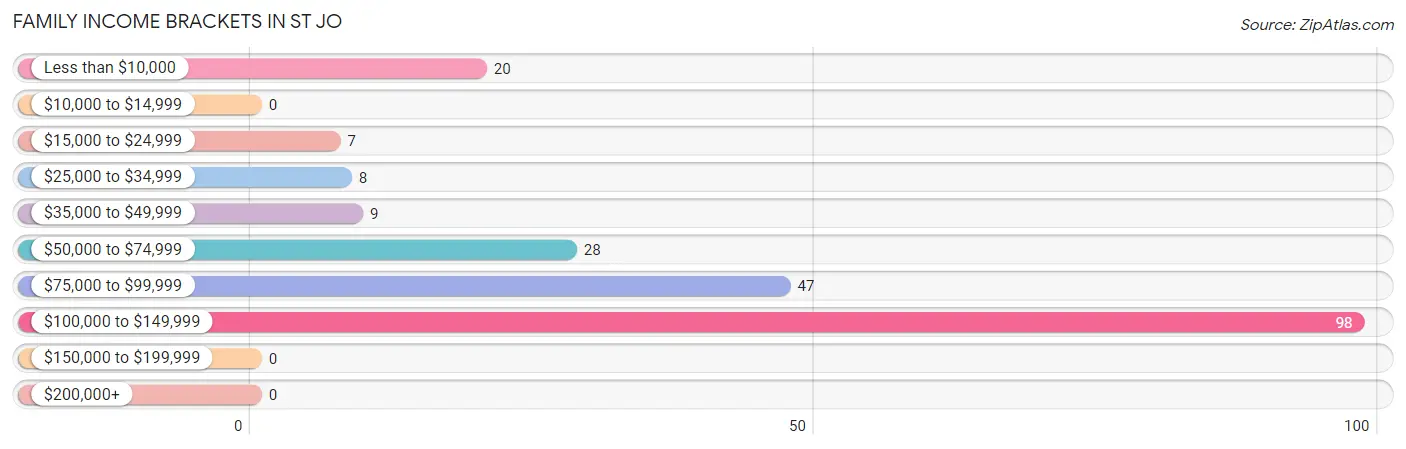
| Income Bracket | # Families | % Families |
| Less than $10,000 | 20 | 9.2% |
| $10,000 to $14,999 | 0 | 0.0% |
| $15,000 to $24,999 | 7 | 3.2% |
| $25,000 to $34,999 | 8 | 3.7% |
| $35,000 to $49,999 | 9 | 4.1% |
| $50,000 to $74,999 | 28 | 12.9% |
| $75,000 to $99,999 | 47 | 21.7% |
| $100,000 to $149,999 | 98 | 45.2% |
| $150,000 to $199,999 | 0 | 0.0% |
| $200,000+ | 0 | 0.0% |
Family Income by Famaliy Size in St Jo
2-person families (59 | 27.2%) account for the highest median family income in St Jo with $88,472 per family, while 2-person families (59 | 27.2%) have the highest median income of $44,236 per family member.
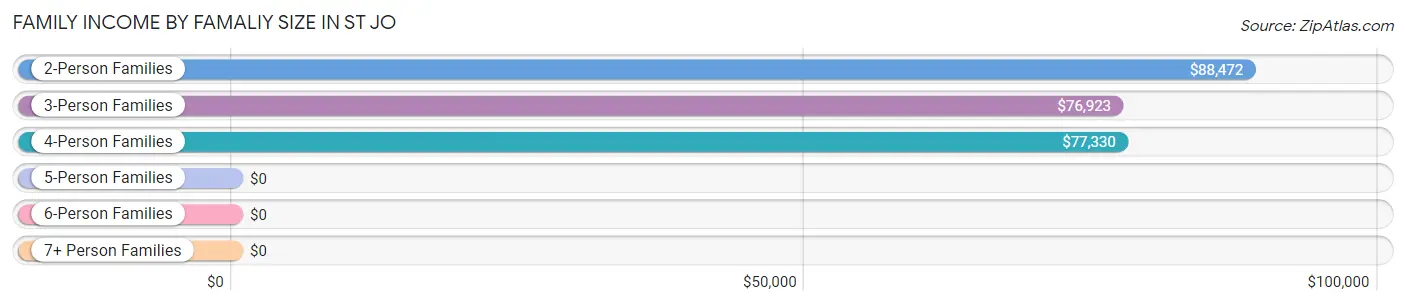
| Income Bracket | # Families | Median Income |
| 2-Person Families | 59 (27.2%) | $88,472 |
| 3-Person Families | 72 (33.2%) | $76,923 |
| 4-Person Families | 81 (37.3%) | $77,330 |
| 5-Person Families | 5 (2.3%) | $0 |
| 6-Person Families | 0 (0.0%) | $0 |
| 7+ Person Families | 0 (0.0%) | $0 |
| Total | 217 (100.0%) | $87,917 |
Family Income by Number of Earners in St Jo
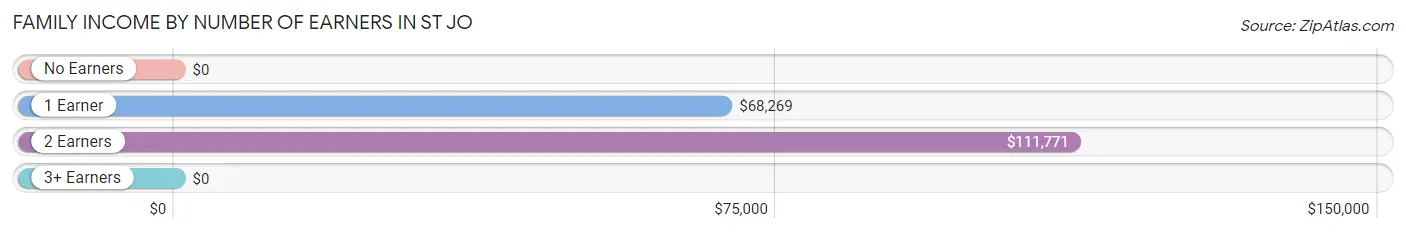
| Number of Earners | # Families | Median Income |
| No Earners | 44 (20.3%) | $0 |
| 1 Earner | 64 (29.5%) | $68,269 |
| 2 Earners | 109 (50.2%) | $111,771 |
| 3+ Earners | 0 (0.0%) | $0 |
| Total | 217 (100.0%) | $87,917 |
Household Income in St Jo
Household Income Brackets in St Jo
With 108 households falling in the category, the $100,000 to $149,999 income range is the most frequent in St Jo, accounting for 32.9% of all households.
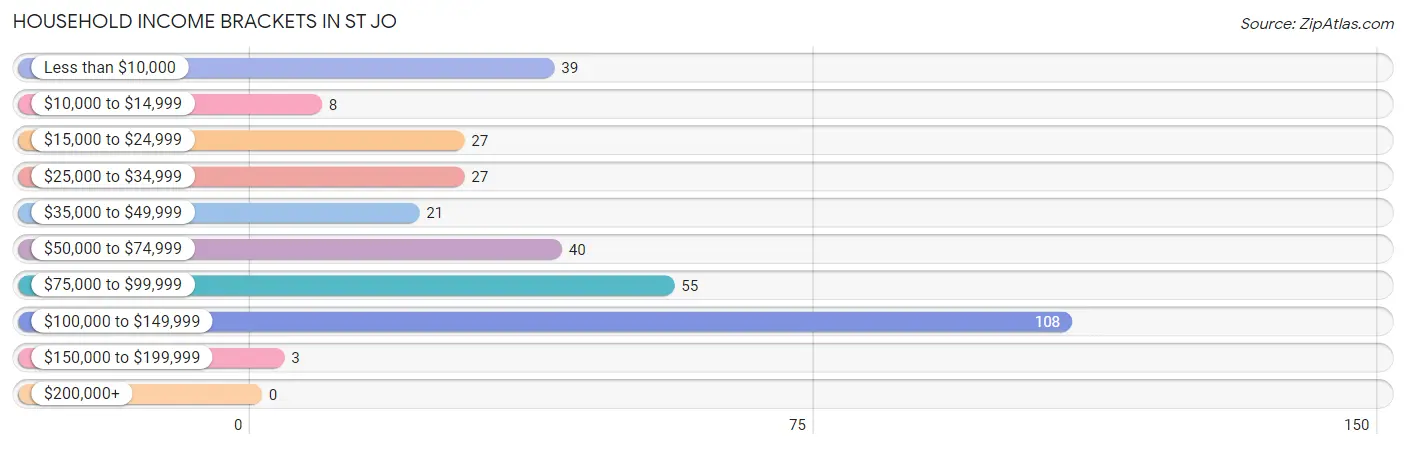
| Income Bracket | # Households | % Households |
| Less than $10,000 | 39 | 11.9% |
| $10,000 to $14,999 | 8 | 2.4% |
| $15,000 to $24,999 | 27 | 8.2% |
| $25,000 to $34,999 | 27 | 8.2% |
| $35,000 to $49,999 | 21 | 6.4% |
| $50,000 to $74,999 | 40 | 12.2% |
| $75,000 to $99,999 | 55 | 16.8% |
| $100,000 to $149,999 | 108 | 32.9% |
| $150,000 to $199,999 | 3 | 0.9% |
| $200,000+ | 0 | 0.0% |
Household Income by Householder Age in St Jo
The median household income in St Jo is $75,125, with the highest median household income of $89,861 found in the 25 to 44 years age bracket for the primary householder. A total of 133 households (40.6%) fall into this category. Meanwhile, the 15 to 24 years age bracket for the primary householder has the lowest median household income of $0, with 14 households (4.3%) in this group.
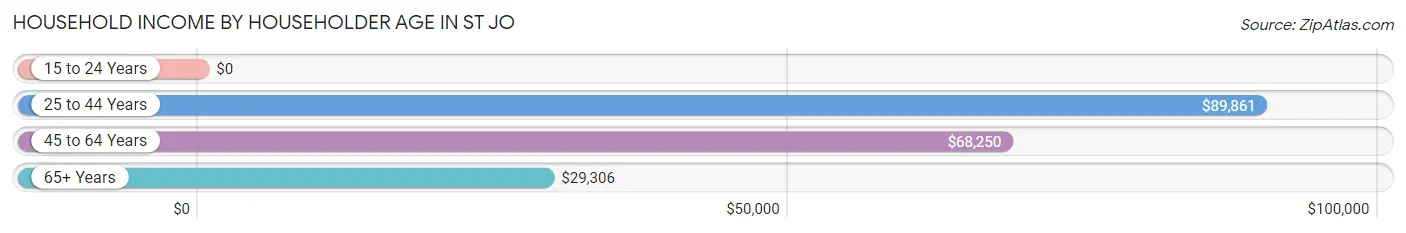
| Income Bracket | # Households | Median Income |
| 15 to 24 Years | 14 (4.3%) | $0 |
| 25 to 44 Years | 133 (40.6%) | $89,861 |
| 45 to 64 Years | 88 (26.8%) | $68,250 |
| 65+ Years | 93 (28.3%) | $29,306 |
| Total | 328 (100.0%) | $75,125 |
Poverty in St Jo
Income Below Poverty by Sex and Age in St Jo
With 17.9% poverty level for males and 14.0% for females among the residents of St Jo, 6 to 11 year old males and 18 to 24 year old females are the most vulnerable to poverty, with 35 males (68.6%) and 14 females (82.4%) in their respective age groups living below the poverty level.
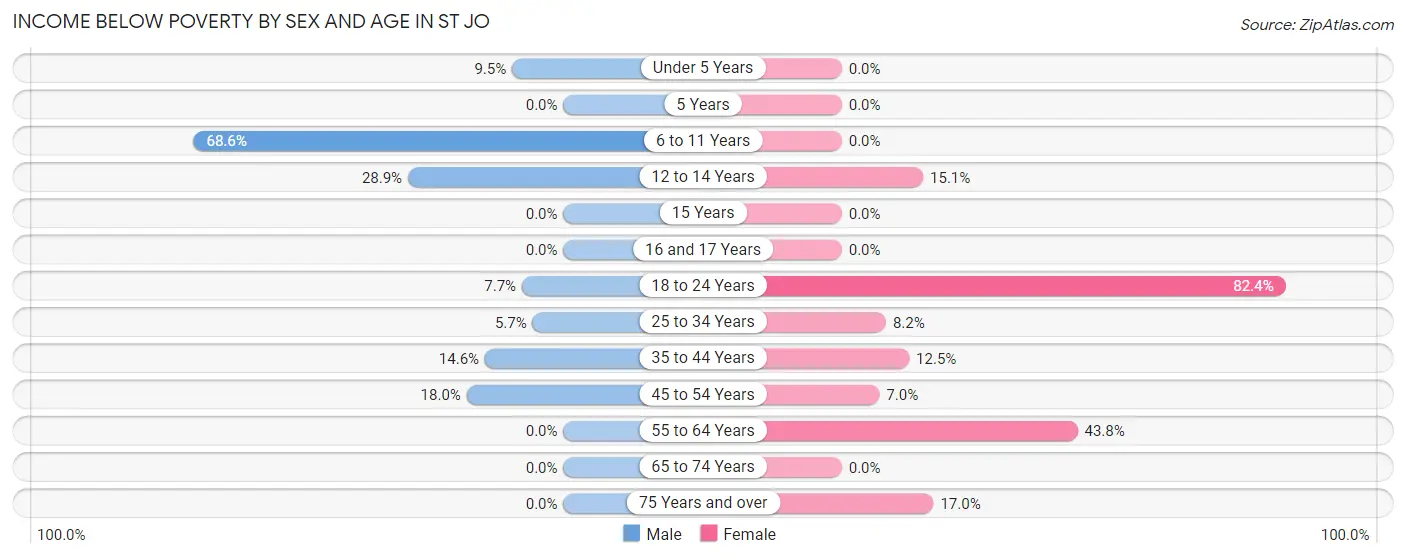
| Age Bracket | Male | Female |
| Under 5 Years | 2 (9.5%) | 0 (0.0%) |
| 5 Years | 0 (0.0%) | 0 (0.0%) |
| 6 to 11 Years | 35 (68.6%) | 0 (0.0%) |
| 12 to 14 Years | 15 (28.8%) | 8 (15.1%) |
| 15 Years | 0 (0.0%) | 0 (0.0%) |
| 16 and 17 Years | 0 (0.0%) | 0 (0.0%) |
| 18 to 24 Years | 1 (7.7%) | 14 (82.4%) |
| 25 to 34 Years | 2 (5.7%) | 5 (8.2%) |
| 35 to 44 Years | 15 (14.6%) | 7 (12.5%) |
| 45 to 54 Years | 7 (17.9%) | 3 (7.0%) |
| 55 to 64 Years | 0 (0.0%) | 21 (43.8%) |
| 65 to 74 Years | 0 (0.0%) | 0 (0.0%) |
| 75 Years and over | 0 (0.0%) | 8 (17.0%) |
| Total | 77 (17.9%) | 66 (14.0%) |
Income Above Poverty by Sex and Age in St Jo
According to the poverty statistics in St Jo, males aged 5 years and females aged under 5 years are the age groups that are most secure financially, with 100.0% of males and 100.0% of females in these age groups living above the poverty line.
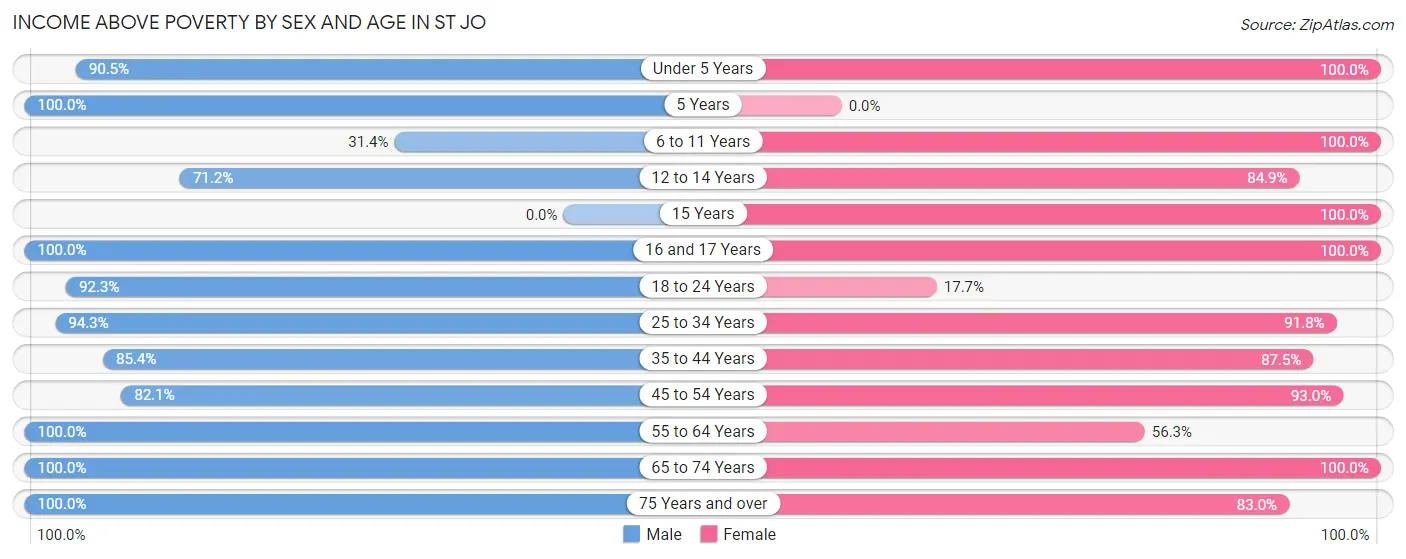
| Age Bracket | Male | Female |
| Under 5 Years | 19 (90.5%) | 30 (100.0%) |
| 5 Years | 5 (100.0%) | 0 (0.0%) |
| 6 to 11 Years | 16 (31.4%) | 68 (100.0%) |
| 12 to 14 Years | 37 (71.2%) | 45 (84.9%) |
| 15 Years | 0 (0.0%) | 6 (100.0%) |
| 16 and 17 Years | 33 (100.0%) | 13 (100.0%) |
| 18 to 24 Years | 12 (92.3%) | 3 (17.6%) |
| 25 to 34 Years | 33 (94.3%) | 56 (91.8%) |
| 35 to 44 Years | 88 (85.4%) | 49 (87.5%) |
| 45 to 54 Years | 32 (82.1%) | 40 (93.0%) |
| 55 to 64 Years | 34 (100.0%) | 27 (56.2%) |
| 65 to 74 Years | 22 (100.0%) | 29 (100.0%) |
| 75 Years and over | 22 (100.0%) | 39 (83.0%) |
| Total | 353 (82.1%) | 405 (86.0%) |
Income Below Poverty Among Married-Couple Families in St Jo
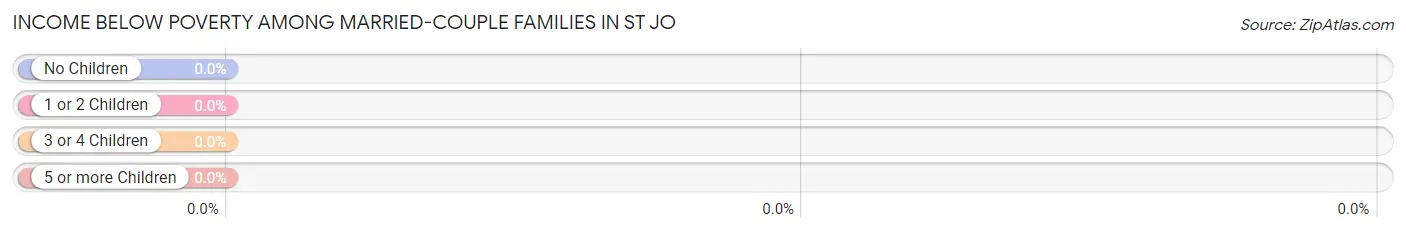
| Children | Above Poverty | Below Poverty |
| No Children | 48 (100.0%) | 0 (0.0%) |
| 1 or 2 Children | 105 (100.0%) | 0 (0.0%) |
| 3 or 4 Children | 5 (100.0%) | 0 (0.0%) |
| 5 or more Children | 0 (0.0%) | 0 (0.0%) |
| Total | 158 (100.0%) | 0 (0.0%) |
Income Below Poverty Among Single-Parent Households in St Jo
According to the poverty data in St Jo, 51.7% or 15 single-father households and 40.0% or 12 single-mother households are living below the poverty line. Among single-father households, those with 3 or 4 children have the highest poverty rate, with 15 households (100.0%) experiencing poverty. Likewise, among single-mother households, those with no children have the highest poverty rate, with 3 households (100.0%) falling below the poverty line.
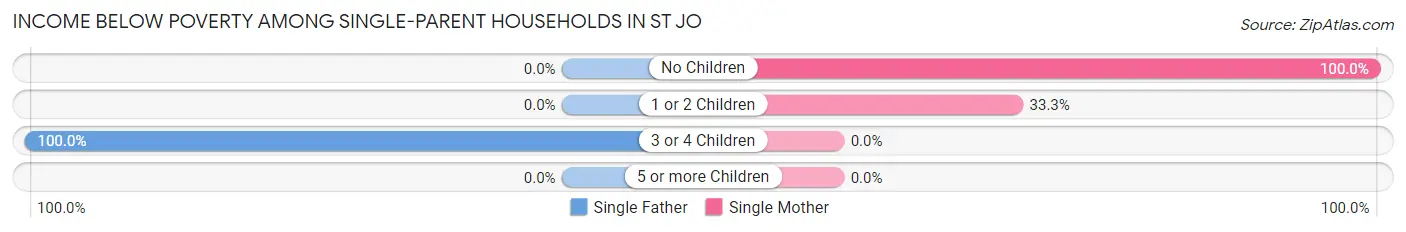
| Children | Single Father | Single Mother |
| No Children | 0 (0.0%) | 3 (100.0%) |
| 1 or 2 Children | 0 (0.0%) | 9 (33.3%) |
| 3 or 4 Children | 15 (100.0%) | 0 (0.0%) |
| 5 or more Children | 0 (0.0%) | 0 (0.0%) |
| Total | 15 (51.7%) | 12 (40.0%) |
Income Below Poverty Among Married-Couple vs Single-Parent Households in St Jo
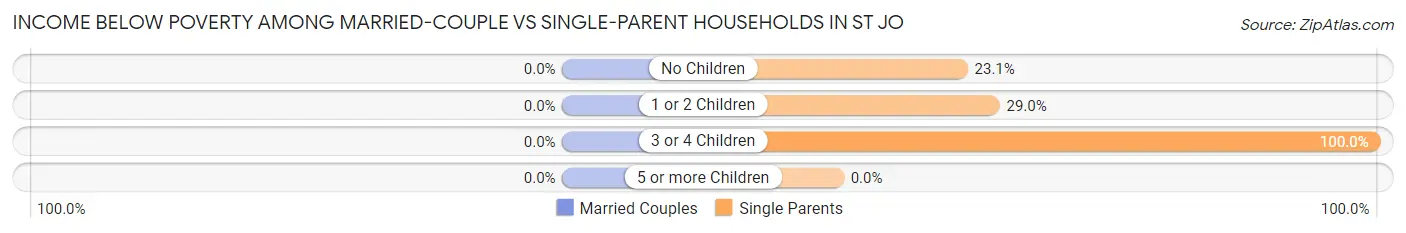
| Children | Married-Couple Families | Single-Parent Households |
| No Children | 0 (0.0%) | 3 (23.1%) |
| 1 or 2 Children | 0 (0.0%) | 9 (29.0%) |
| 3 or 4 Children | 0 (0.0%) | 15 (100.0%) |
| 5 or more Children | 0 (0.0%) | 0 (0.0%) |
| Total | 0 (0.0%) | 27 (45.8%) |
Race in St Jo
The most populous races in St Jo are White / Caucasian (876 | 96.9%), Hispanic or Latino (50 | 5.5%), and Two or more Races (28 | 3.1%).
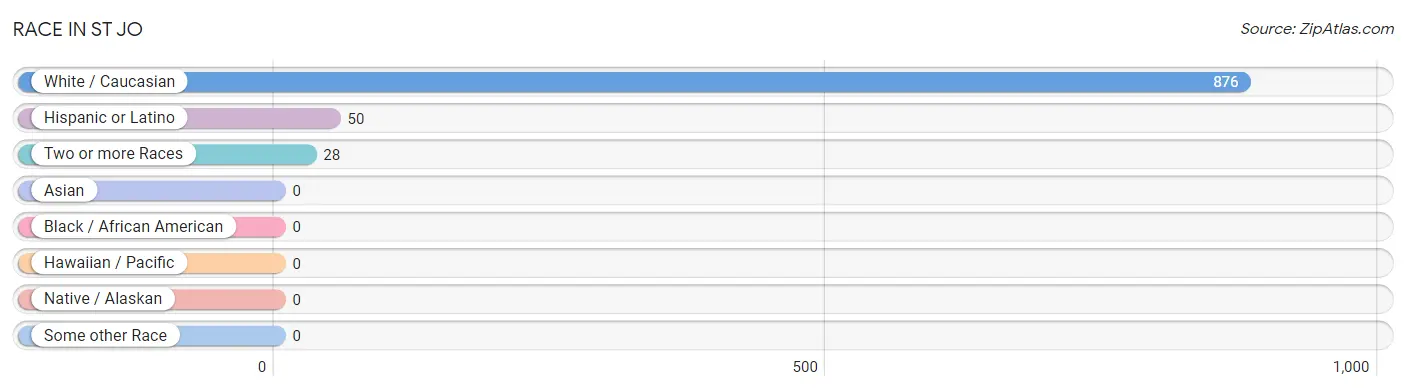
| Race | # Population | % Population |
| Asian | 0 | 0.0% |
| Black / African American | 0 | 0.0% |
| Hawaiian / Pacific | 0 | 0.0% |
| Hispanic or Latino | 50 | 5.5% |
| Native / Alaskan | 0 | 0.0% |
| White / Caucasian | 876 | 96.9% |
| Two or more Races | 28 | 3.1% |
| Some other Race | 0 | 0.0% |
| Total | 904 | 100.0% |
Ancestry in St Jo
The most populous ancestries reported in St Jo are Irish (98 | 10.8%), American (87 | 9.6%), German (85 | 9.4%), English (42 | 4.6%), and Mexican (28 | 3.1%), together accounting for 37.6% of all St Jo residents.
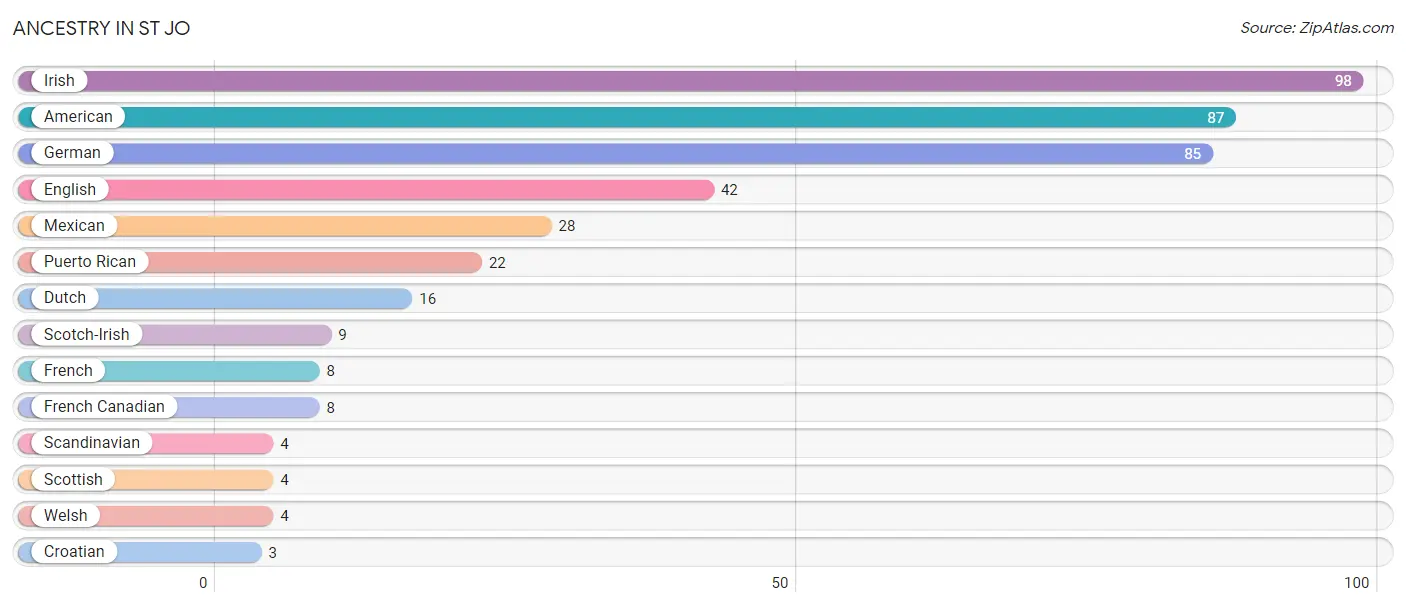
| Ancestry | # Population | % Population |
| American | 87 | 9.6% |
| Croatian | 3 | 0.3% |
| Dutch | 16 | 1.8% |
| English | 42 | 4.6% |
| French | 8 | 0.9% |
| French Canadian | 8 | 0.9% |
| German | 85 | 9.4% |
| Irish | 98 | 10.8% |
| Mexican | 28 | 3.1% |
| Puerto Rican | 22 | 2.4% |
| Scandinavian | 4 | 0.4% |
| Scotch-Irish | 9 | 1.0% |
| Scottish | 4 | 0.4% |
| Welsh | 4 | 0.4% | View All 14 Rows |
Immigrants in St Jo
The most numerous immigrant groups reported in St Jo came from Europe (8 | 0.9%), Germany (8 | 0.9%), Western Europe (8 | 0.9%), Central America (3 | 0.3%), and Latin America (3 | 0.3%), together accounting for 3.3% of all St Jo residents.
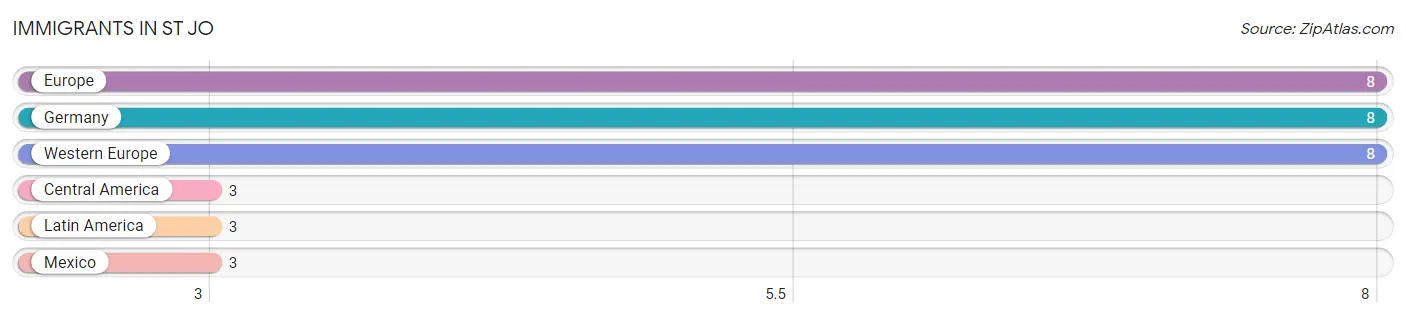
| Immigration Origin | # Population | % Population |
| Central America | 3 | 0.3% |
| Europe | 8 | 0.9% |
| Germany | 8 | 0.9% |
| Latin America | 3 | 0.3% |
| Mexico | 3 | 0.3% |
| Western Europe | 8 | 0.9% | View All 6 Rows |
Sex and Age in St Jo
Sex and Age in St Jo
The most populous age groups in St Jo are 35 to 39 Years (68 | 15.7%) for men and 10 to 14 Years (95 | 20.2%) for women.
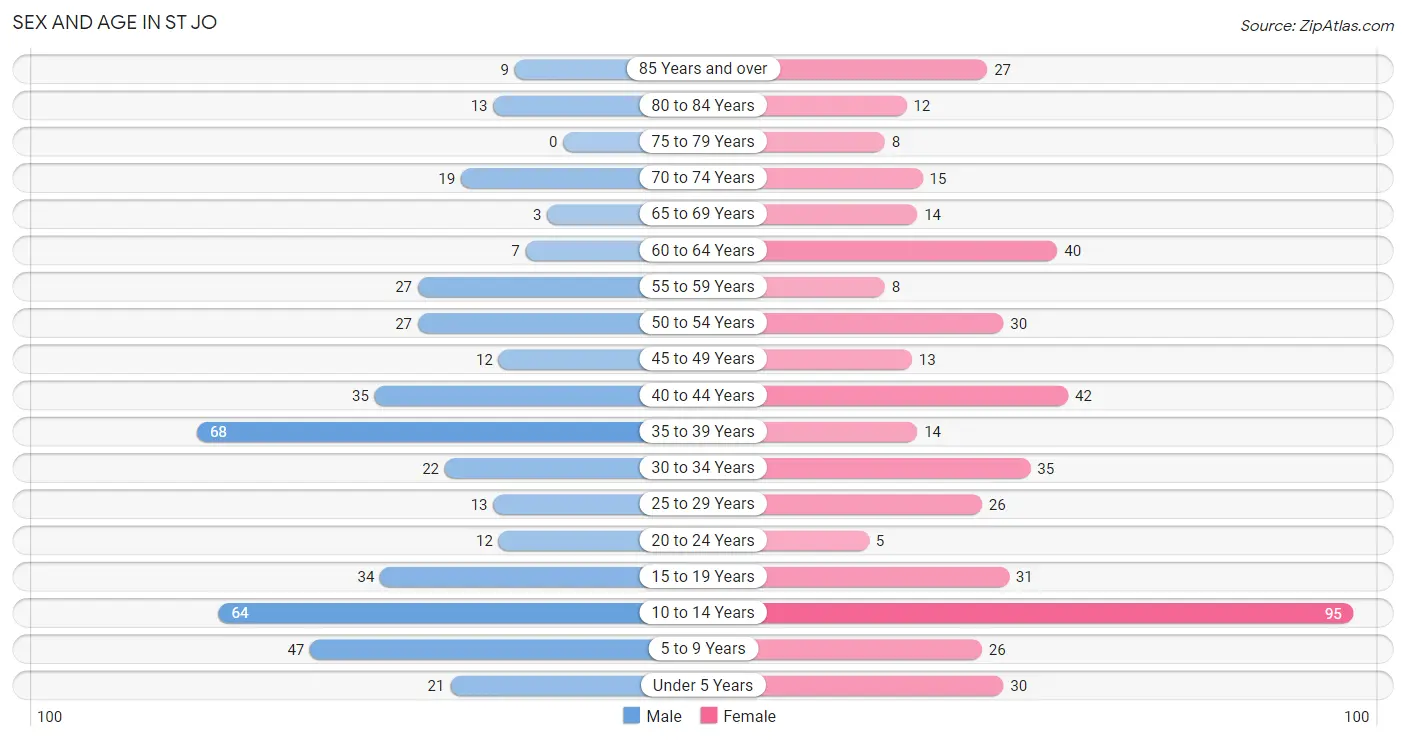
| Age Bracket | Male | Female |
| Under 5 Years | 21 (4.9%) | 30 (6.4%) |
| 5 to 9 Years | 47 (10.8%) | 26 (5.5%) |
| 10 to 14 Years | 64 (14.8%) | 95 (20.2%) |
| 15 to 19 Years | 34 (7.9%) | 31 (6.6%) |
| 20 to 24 Years | 12 (2.8%) | 5 (1.1%) |
| 25 to 29 Years | 13 (3.0%) | 26 (5.5%) |
| 30 to 34 Years | 22 (5.1%) | 35 (7.4%) |
| 35 to 39 Years | 68 (15.7%) | 14 (3.0%) |
| 40 to 44 Years | 35 (8.1%) | 42 (8.9%) |
| 45 to 49 Years | 12 (2.8%) | 13 (2.8%) |
| 50 to 54 Years | 27 (6.2%) | 30 (6.4%) |
| 55 to 59 Years | 27 (6.2%) | 8 (1.7%) |
| 60 to 64 Years | 7 (1.6%) | 40 (8.5%) |
| 65 to 69 Years | 3 (0.7%) | 14 (3.0%) |
| 70 to 74 Years | 19 (4.4%) | 15 (3.2%) |
| 75 to 79 Years | 0 (0.0%) | 8 (1.7%) |
| 80 to 84 Years | 13 (3.0%) | 12 (2.5%) |
| 85 Years and over | 9 (2.1%) | 27 (5.7%) |
| Total | 433 (100.0%) | 471 (100.0%) |
Families and Households in St Jo
Median Family Size in St Jo
The median family size in St Jo is 3.41 persons per family, with married-couple families (158 | 72.8%) accounting for the largest median family size of 3.56 persons per family. On the other hand, single female/mother families (30 | 13.8%) represent the smallest median family size with 2.87 persons per family.
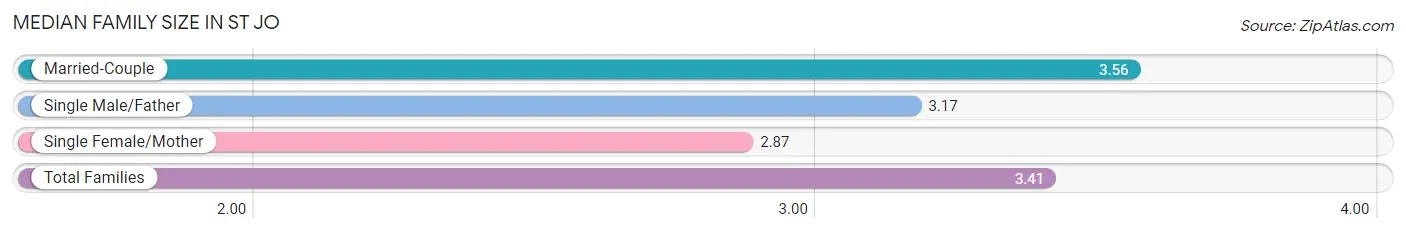
| Family Type | # Families | Family Size |
| Married-Couple | 158 (72.8%) | 3.56 |
| Single Male/Father | 29 (13.4%) | 3.17 |
| Single Female/Mother | 30 (13.8%) | 2.87 |
| Total Families | 217 (100.0%) | 3.41 |
Median Household Size in St Jo
The median household size in St Jo is 2.76 persons per household, with single female/mother households (30 | 9.1%) accounting for the largest median household size of 3.67 persons per household. non-family households (111 | 33.8%) represent the smallest median household size with 1.26 persons per household.
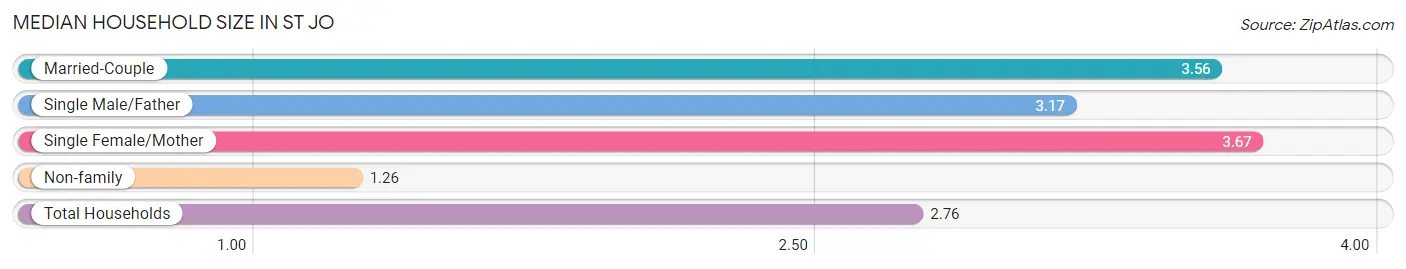
| Household Type | # Households | Household Size |
| Married-Couple | 158 (48.2%) | 3.56 |
| Single Male/Father | 29 (8.8%) | 3.17 |
| Single Female/Mother | 30 (9.1%) | 3.67 |
| Non-family | 111 (33.8%) | 1.26 |
| Total Households | 328 (100.0%) | 2.76 |
Household Size by Marriage Status in St Jo
Out of a total of 328 households in St Jo, 217 (66.2%) are family households, while 111 (33.8%) are nonfamily households. The most numerous type of family households are 4-person households, comprising 99, and the most common type of nonfamily households are 1-person households, comprising 94.
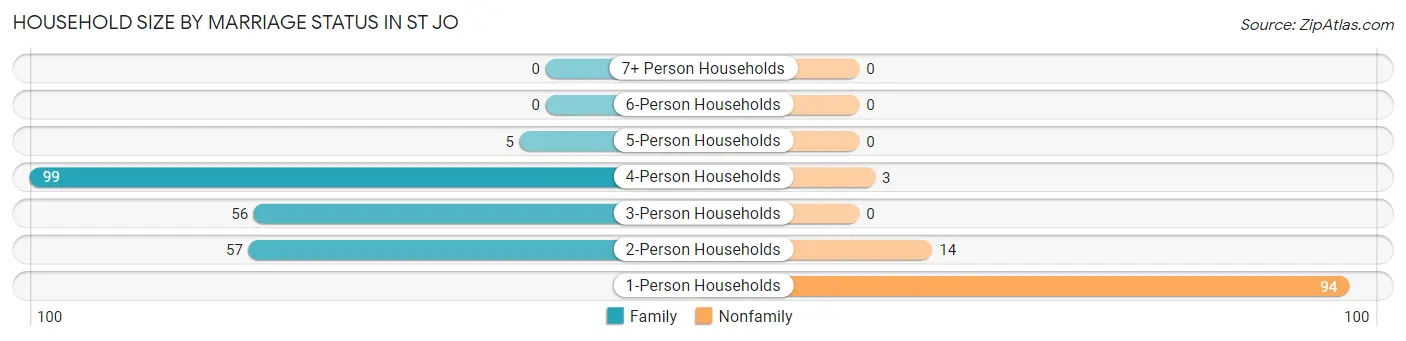
| Household Size | Family Households | Nonfamily Households |
| 1-Person Households | - | 94 (28.7%) |
| 2-Person Households | 57 (17.4%) | 14 (4.3%) |
| 3-Person Households | 56 (17.1%) | 0 (0.0%) |
| 4-Person Households | 99 (30.2%) | 3 (0.9%) |
| 5-Person Households | 5 (1.5%) | 0 (0.0%) |
| 6-Person Households | 0 (0.0%) | 0 (0.0%) |
| 7+ Person Households | 0 (0.0%) | 0 (0.0%) |
| Total | 217 (66.2%) | 111 (33.8%) |
Female Fertility in St Jo
Fertility by Age in St Jo
Average fertility rate in St Jo is 82.0 births per 1,000 women. Women in the age bracket of 20 to 34 years have the highest fertility rate with 227.0 births per 1,000 women. Women in the age bracket of 20 to 34 years acount for 100.0% of all women with births.
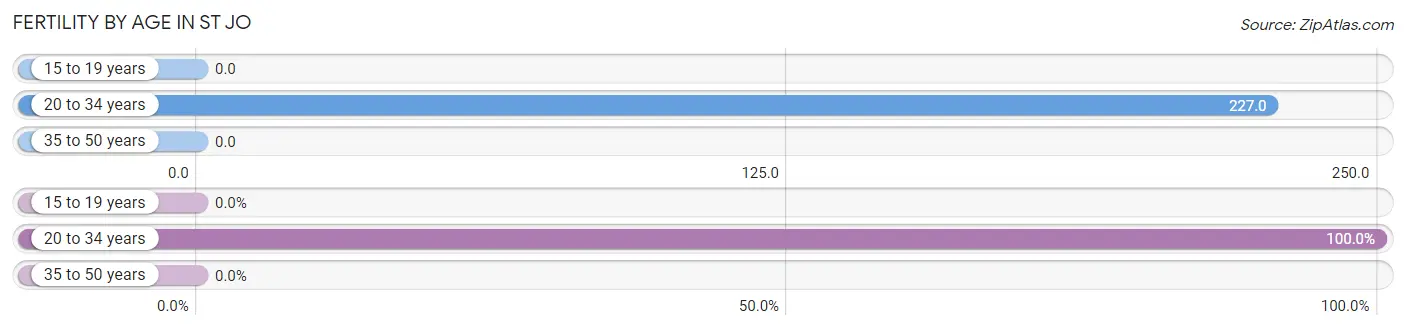
| Age Bracket | Women with Births | Births / 1,000 Women |
| 15 to 19 years | 0 (0.0%) | 0.0 |
| 20 to 34 years | 15 (100.0%) | 227.0 |
| 35 to 50 years | 0 (0.0%) | 0.0 |
| Total | 15 (100.0%) | 82.0 |
Fertility by Age by Marriage Status in St Jo
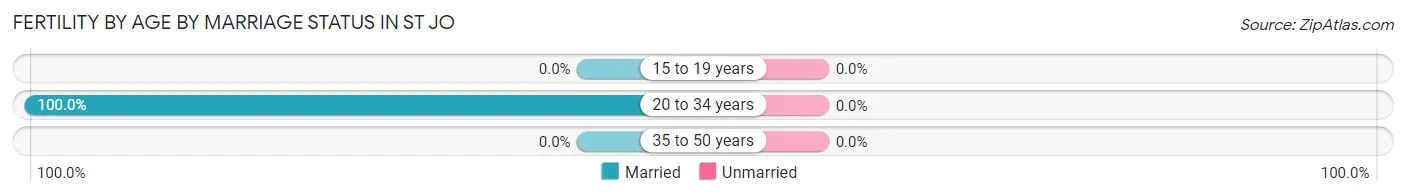
| Age Bracket | Married | Unmarried |
| 15 to 19 years | 0 (0.0%) | 0 (0.0%) |
| 20 to 34 years | 15 (100.0%) | 0 (0.0%) |
| 35 to 50 years | 0 (0.0%) | 0 (0.0%) |
| Total | 15 (100.0%) | 0 (0.0%) |
Fertility by Education in St Jo
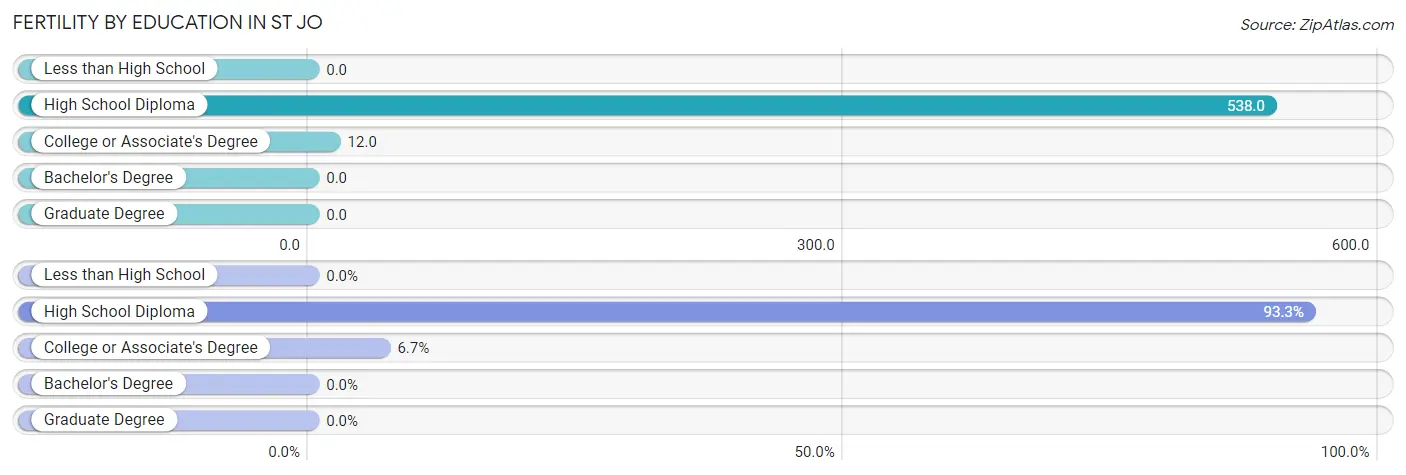
| Educational Attainment | Women with Births | Births / 1,000 Women |
| Less than High School | 0 (0.0%) | 0.0 |
| High School Diploma | 14 (93.3%) | 538.0 |
| College or Associate's Degree | 1 (6.7%) | 12.0 |
| Bachelor's Degree | 0 (0.0%) | 0.0 |
| Graduate Degree | 0 (0.0%) | 0.0 |
| Total | 15 (100.0%) | 82.0 |
Fertility by Education by Marriage Status in St Jo
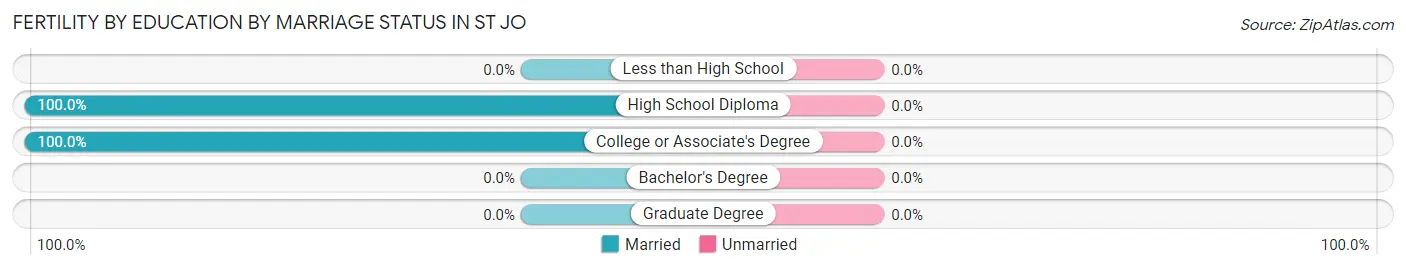
| Educational Attainment | Married | Unmarried |
| Less than High School | 0 (0.0%) | 0 (0.0%) |
| High School Diploma | 14 (100.0%) | 0 (0.0%) |
| College or Associate's Degree | 1 (100.0%) | 0 (0.0%) |
| Bachelor's Degree | 0 (0.0%) | 0 (0.0%) |
| Graduate Degree | 0 (0.0%) | 0 (0.0%) |
| Total | 15 (100.0%) | 0 (0.0%) |
Employment Characteristics in St Jo
Employment by Class of Employer in St Jo
Among the 359 employed individuals in St Jo, private company employees (235 | 65.5%), local government employees (68 | 18.9%), and federal government employees (33 | 9.2%) make up the most common classes of employment.
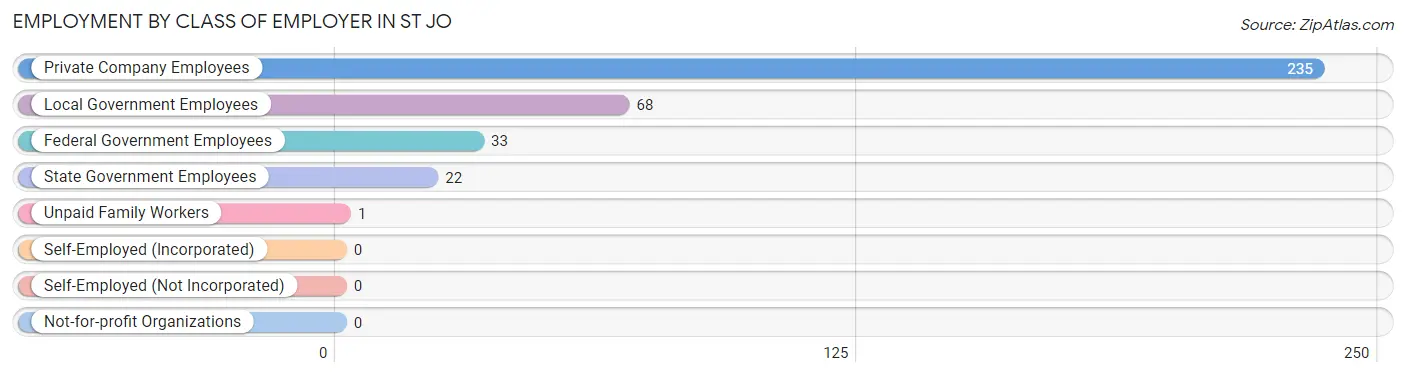
| Employer Class | # Employees | % Employees |
| Private Company Employees | 235 | 65.5% |
| Self-Employed (Incorporated) | 0 | 0.0% |
| Self-Employed (Not Incorporated) | 0 | 0.0% |
| Not-for-profit Organizations | 0 | 0.0% |
| Local Government Employees | 68 | 18.9% |
| State Government Employees | 22 | 6.1% |
| Federal Government Employees | 33 | 9.2% |
| Unpaid Family Workers | 1 | 0.3% |
| Total | 359 | 100.0% |
Employment Status by Age in St Jo
According to the labor force statistics for St Jo, out of the total population over 16 years of age (615), 60.8% or 374 individuals are in the labor force, with 4.0% or 15 of them unemployed. The age group with the highest labor force participation rate is 35 to 44 years, with 89.9% or 143 individuals in the labor force. Within the labor force, the 35 to 44 years age range has the highest percentage of unemployed individuals, with 10.5% or 15 of them being unemployed.
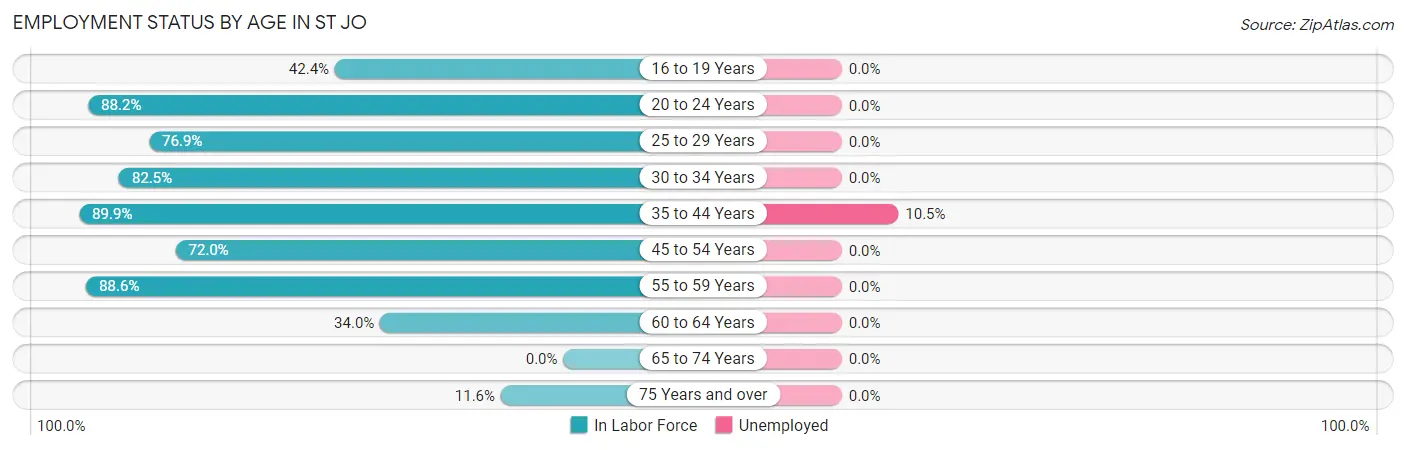
| Age Bracket | In Labor Force | Unemployed |
| 16 to 19 Years | 25 (42.4%) | 0 (0.0%) |
| 20 to 24 Years | 15 (88.2%) | 0 (0.0%) |
| 25 to 29 Years | 30 (76.9%) | 0 (0.0%) |
| 30 to 34 Years | 47 (82.5%) | 0 (0.0%) |
| 35 to 44 Years | 143 (89.9%) | 15 (10.5%) |
| 45 to 54 Years | 59 (72.0%) | 0 (0.0%) |
| 55 to 59 Years | 31 (88.6%) | 0 (0.0%) |
| 60 to 64 Years | 16 (34.0%) | 0 (0.0%) |
| 65 to 74 Years | 0 (0.0%) | 0 (0.0%) |
| 75 Years and over | 8 (11.6%) | 0 (0.0%) |
| Total | 374 (60.8%) | 15 (4.0%) |
Employment Status by Educational Attainment in St Jo
According to labor force statistics for St Jo, 77.8% of individuals (326) out of the total population between 25 and 64 years of age (419) are in the labor force, with 4.6% or 15 of them being unemployed. The group with the highest labor force participation rate are those with the educational attainment of high school diploma, with 88.3% or 151 individuals in the labor force. Within the labor force, individuals with college / associate degree education have the highest percentage of unemployment, with 14.6% or 15 of them being unemployed.
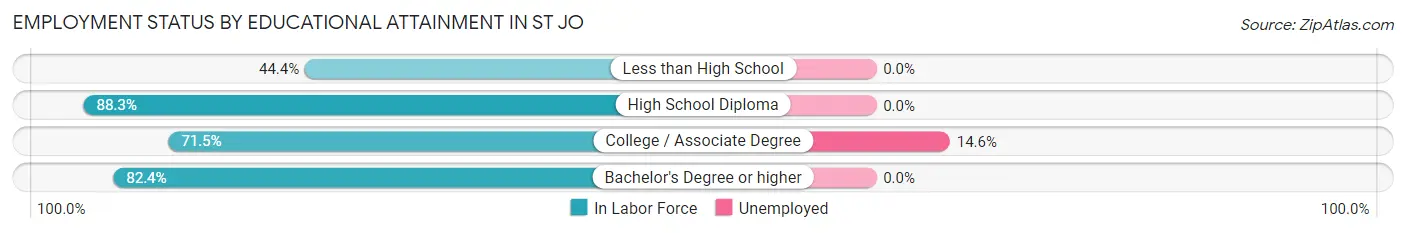
| Educational Attainment | In Labor Force | Unemployed |
| Less than High School | 16 (44.4%) | 0 (0.0%) |
| High School Diploma | 151 (88.3%) | 0 (0.0%) |
| College / Associate Degree | 103 (71.5%) | 21 (14.6%) |
| Bachelor's Degree or higher | 56 (82.4%) | 0 (0.0%) |
| Total | 326 (77.8%) | 19 (4.6%) |
Employment Occupations by Sex in St Jo
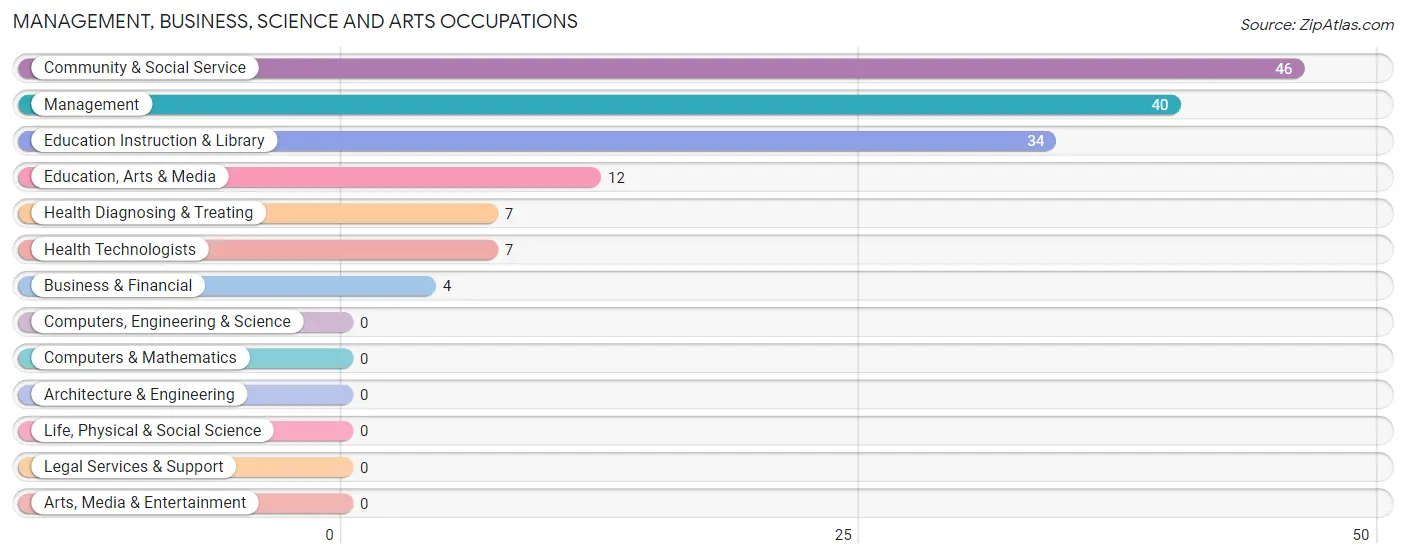
Management, Business, Science and Arts Occupations
The most common Management, Business, Science and Arts occupations in St Jo are Community & Social Service (46 | 12.8%), Management (40 | 11.1%), Education Instruction & Library (34 | 9.5%), Education, Arts & Media (12 | 3.3%), and Health Diagnosing & Treating (7 | 1.9%).
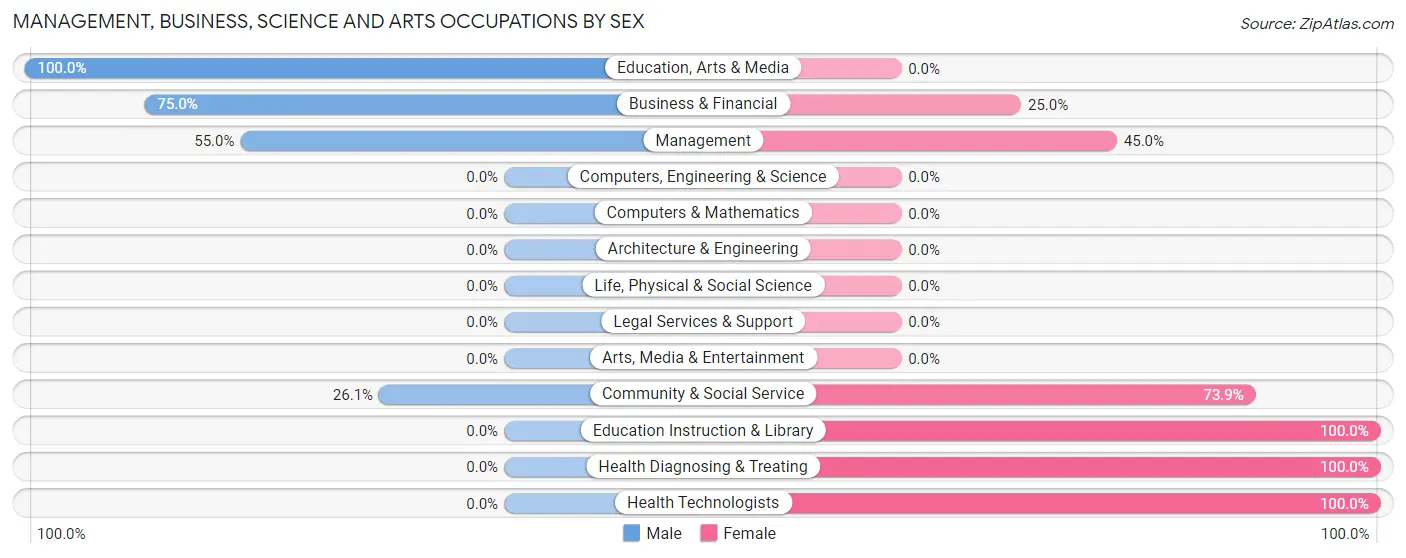
Management, Business, Science and Arts Occupations by Sex
Within the Management, Business, Science and Arts occupations in St Jo, the most male-oriented occupations are Education, Arts & Media (100.0%), Business & Financial (75.0%), and Management (55.0%), while the most female-oriented occupations are Education Instruction & Library (100.0%), Health Diagnosing & Treating (100.0%), and Health Technologists (100.0%).
| Occupation | Male | Female |
| Management | 22 (55.0%) | 18 (45.0%) |
| Business & Financial | 3 (75.0%) | 1 (25.0%) |
| Computers, Engineering & Science | 0 (0.0%) | 0 (0.0%) |
| Computers & Mathematics | 0 (0.0%) | 0 (0.0%) |
| Architecture & Engineering | 0 (0.0%) | 0 (0.0%) |
| Life, Physical & Social Science | 0 (0.0%) | 0 (0.0%) |
| Community & Social Service | 12 (26.1%) | 34 (73.9%) |
| Education, Arts & Media | 12 (100.0%) | 0 (0.0%) |
| Legal Services & Support | 0 (0.0%) | 0 (0.0%) |
| Education Instruction & Library | 0 (0.0%) | 34 (100.0%) |
| Arts, Media & Entertainment | 0 (0.0%) | 0 (0.0%) |
| Health Diagnosing & Treating | 0 (0.0%) | 7 (100.0%) |
| Health Technologists | 0 (0.0%) | 7 (100.0%) |
| Total (Category) | 37 (38.1%) | 60 (61.9%) |
| Total (Overall) | 205 (57.1%) | 154 (42.9%) |
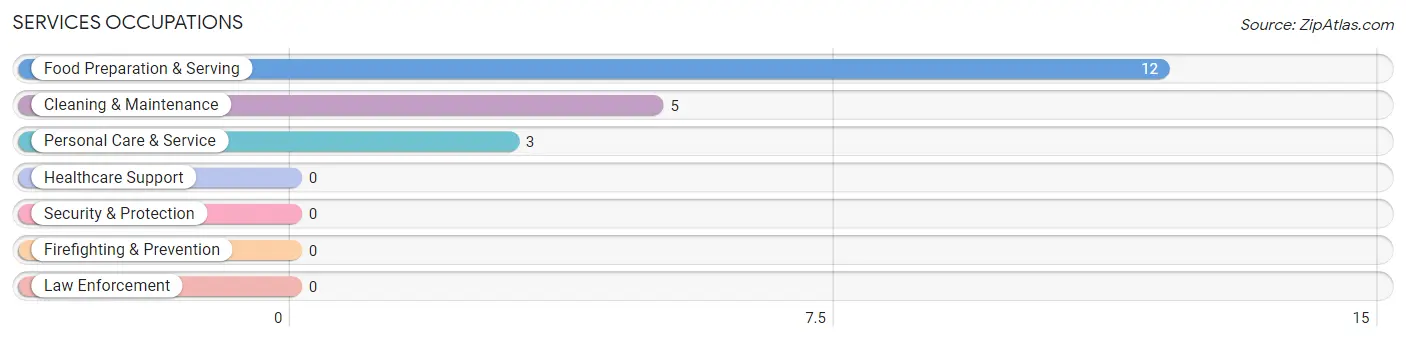
Services Occupations
The most common Services occupations in St Jo are Food Preparation & Serving (12 | 3.3%), Cleaning & Maintenance (5 | 1.4%), and Personal Care & Service (3 | 0.8%).
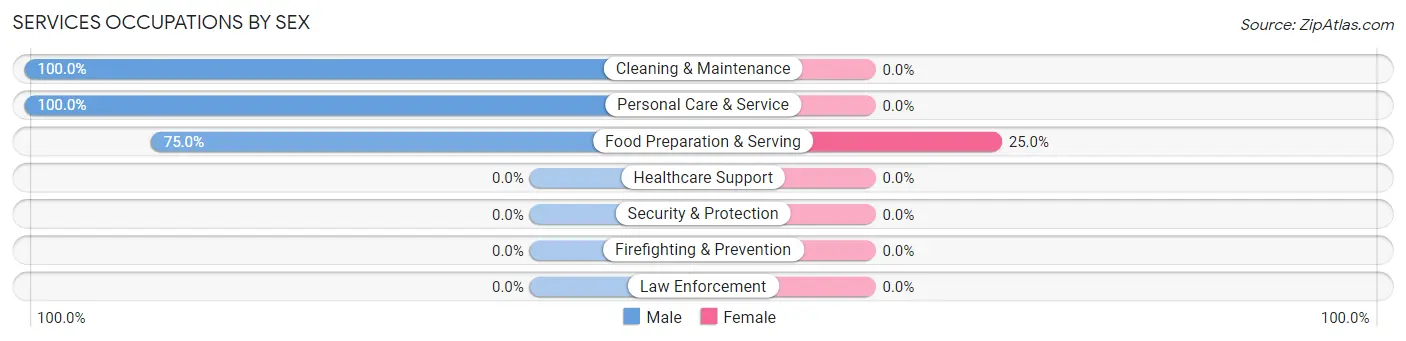
Services Occupations by Sex
| Occupation | Male | Female |
| Healthcare Support | 0 (0.0%) | 0 (0.0%) |
| Security & Protection | 0 (0.0%) | 0 (0.0%) |
| Firefighting & Prevention | 0 (0.0%) | 0 (0.0%) |
| Law Enforcement | 0 (0.0%) | 0 (0.0%) |
| Food Preparation & Serving | 9 (75.0%) | 3 (25.0%) |
| Cleaning & Maintenance | 5 (100.0%) | 0 (0.0%) |
| Personal Care & Service | 3 (100.0%) | 0 (0.0%) |
| Total (Category) | 17 (85.0%) | 3 (15.0%) |
| Total (Overall) | 205 (57.1%) | 154 (42.9%) |
Sales and Office Occupations
The most common Sales and Office occupations in St Jo are Office & Administration (81 | 22.6%), and Sales & Related (5 | 1.4%).
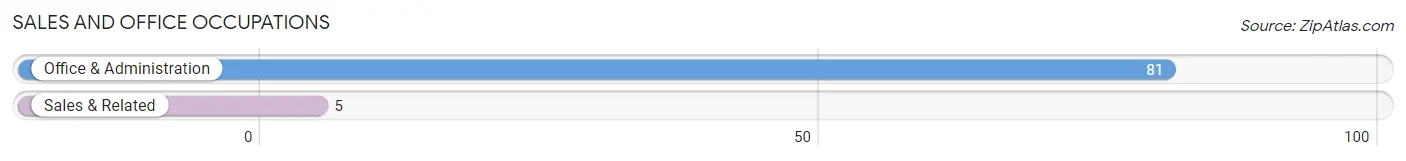
Sales and Office Occupations by Sex
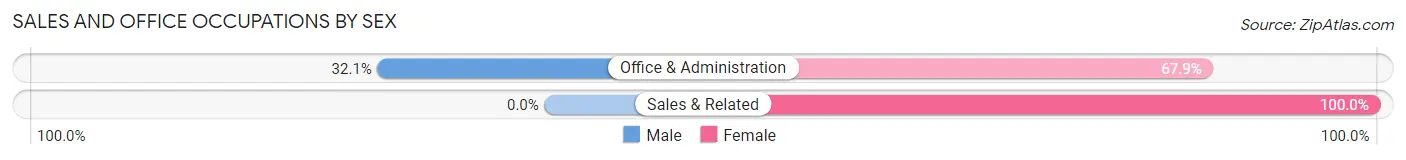
| Occupation | Male | Female |
| Sales & Related | 0 (0.0%) | 5 (100.0%) |
| Office & Administration | 26 (32.1%) | 55 (67.9%) |
| Total (Category) | 26 (30.2%) | 60 (69.8%) |
| Total (Overall) | 205 (57.1%) | 154 (42.9%) |
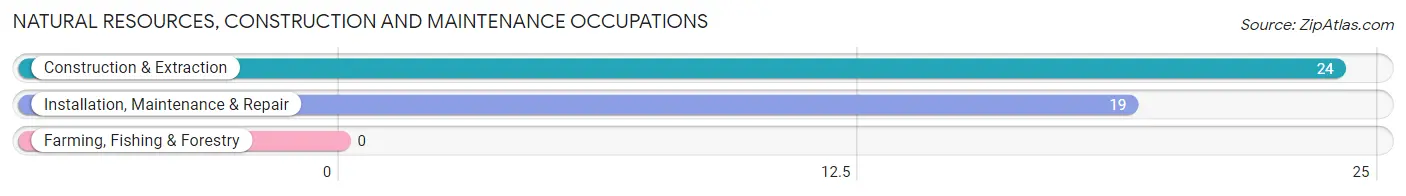
Natural Resources, Construction and Maintenance Occupations
The most common Natural Resources, Construction and Maintenance occupations in St Jo are Construction & Extraction (24 | 6.7%), and Installation, Maintenance & Repair (19 | 5.3%).
Natural Resources, Construction and Maintenance Occupations by Sex
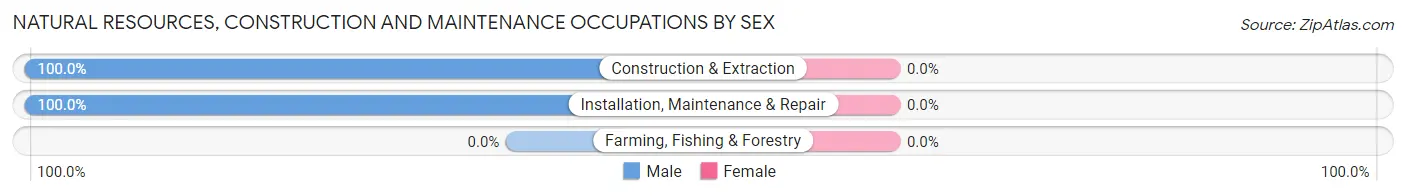
| Occupation | Male | Female |
| Farming, Fishing & Forestry | 0 (0.0%) | 0 (0.0%) |
| Construction & Extraction | 24 (100.0%) | 0 (0.0%) |
| Installation, Maintenance & Repair | 19 (100.0%) | 0 (0.0%) |
| Total (Category) | 43 (100.0%) | 0 (0.0%) |
| Total (Overall) | 205 (57.1%) | 154 (42.9%) |
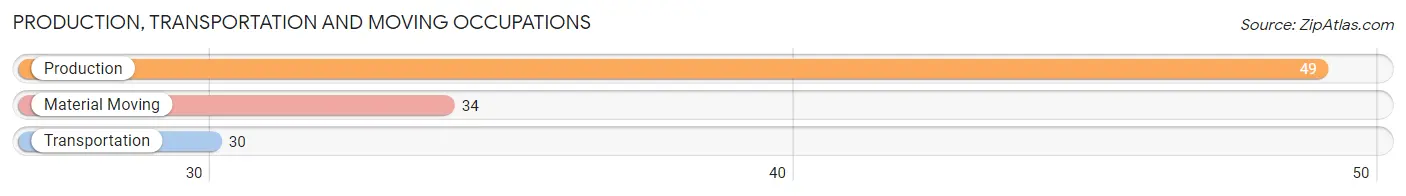
Production, Transportation and Moving Occupations
The most common Production, Transportation and Moving occupations in St Jo are Production (49 | 13.7%), Material Moving (34 | 9.5%), and Transportation (30 | 8.4%).
Production, Transportation and Moving Occupations by Sex
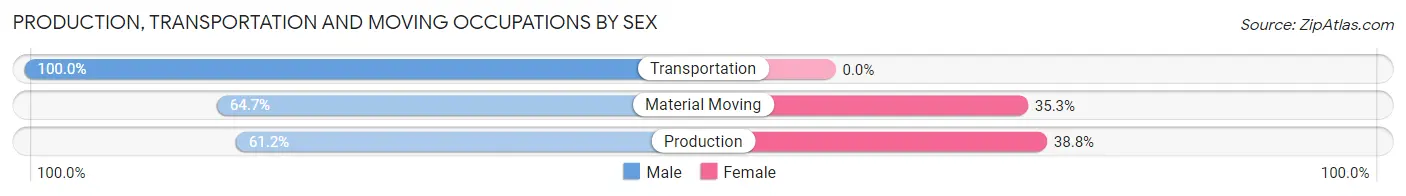
| Occupation | Male | Female |
| Production | 30 (61.2%) | 19 (38.8%) |
| Transportation | 30 (100.0%) | 0 (0.0%) |
| Material Moving | 22 (64.7%) | 12 (35.3%) |
| Total (Category) | 82 (72.6%) | 31 (27.4%) |
| Total (Overall) | 205 (57.1%) | 154 (42.9%) |
Employment Industries by Sex in St Jo
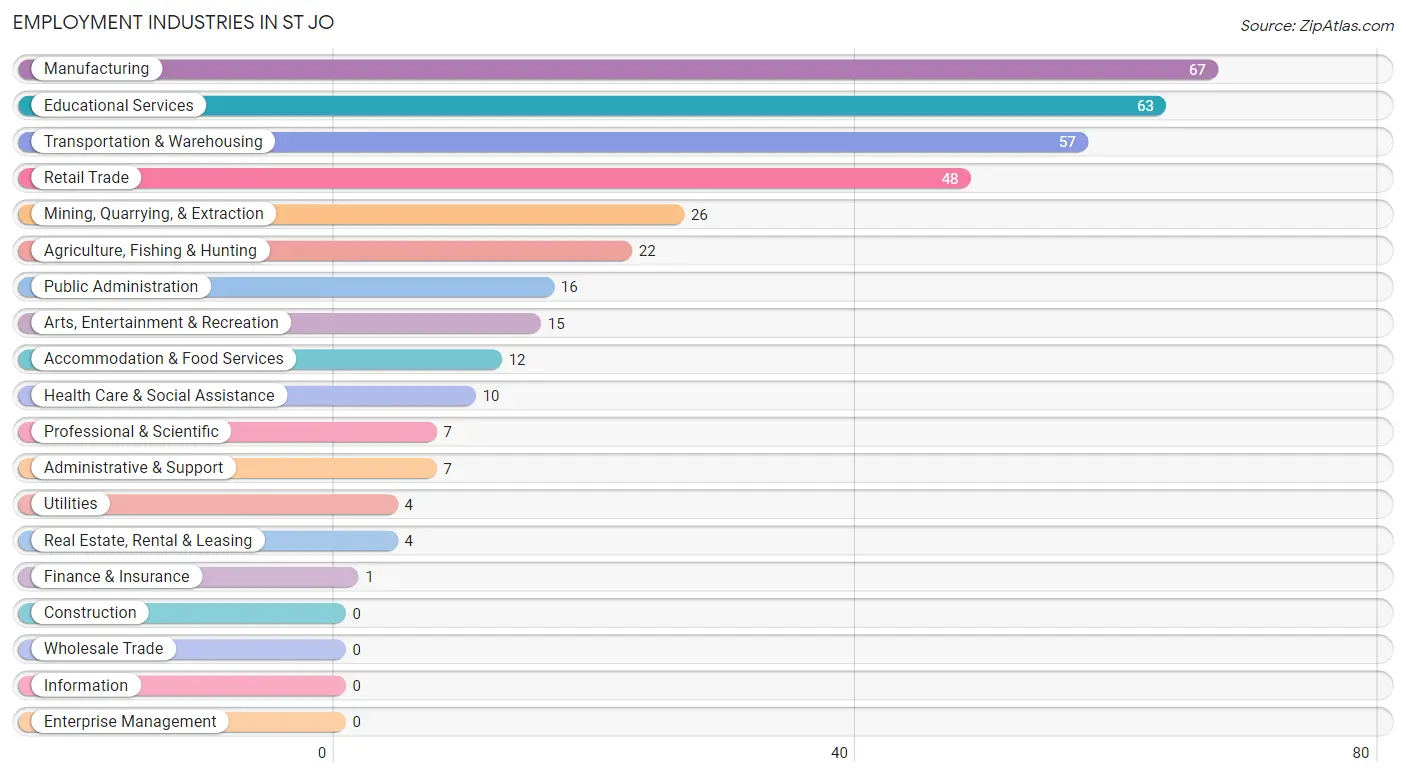
Employment Industries in St Jo
The major employment industries in St Jo include Manufacturing (67 | 18.7%), Educational Services (63 | 17.5%), Transportation & Warehousing (57 | 15.9%), Retail Trade (48 | 13.4%), and Mining, Quarrying, & Extraction (26 | 7.2%).
Employment Industries by Sex in St Jo
The St Jo industries that see more men than women are Agriculture, Fishing & Hunting (100.0%), Utilities (100.0%), and Real Estate, Rental & Leasing (100.0%), whereas the industries that tend to have a higher number of women are Finance & Insurance (100.0%), Professional & Scientific (100.0%), and Health Care & Social Assistance (100.0%).
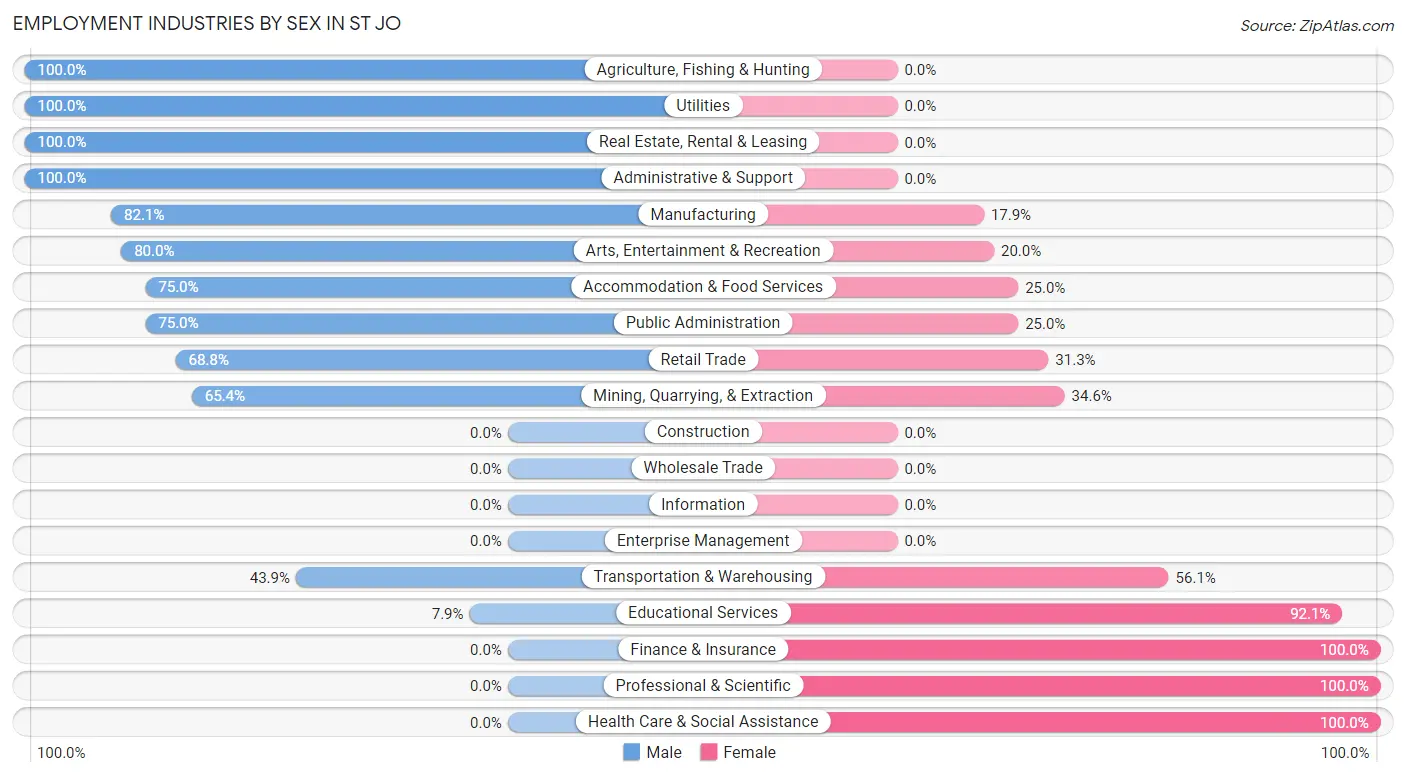
| Industry | Male | Female |
| Agriculture, Fishing & Hunting | 22 (100.0%) | 0 (0.0%) |
| Mining, Quarrying, & Extraction | 17 (65.4%) | 9 (34.6%) |
| Construction | 0 (0.0%) | 0 (0.0%) |
| Manufacturing | 55 (82.1%) | 12 (17.9%) |
| Wholesale Trade | 0 (0.0%) | 0 (0.0%) |
| Retail Trade | 33 (68.8%) | 15 (31.2%) |
| Transportation & Warehousing | 25 (43.9%) | 32 (56.1%) |
| Utilities | 4 (100.0%) | 0 (0.0%) |
| Information | 0 (0.0%) | 0 (0.0%) |
| Finance & Insurance | 0 (0.0%) | 1 (100.0%) |
| Real Estate, Rental & Leasing | 4 (100.0%) | 0 (0.0%) |
| Professional & Scientific | 0 (0.0%) | 7 (100.0%) |
| Enterprise Management | 0 (0.0%) | 0 (0.0%) |
| Administrative & Support | 7 (100.0%) | 0 (0.0%) |
| Educational Services | 5 (7.9%) | 58 (92.1%) |
| Health Care & Social Assistance | 0 (0.0%) | 10 (100.0%) |
| Arts, Entertainment & Recreation | 12 (80.0%) | 3 (20.0%) |
| Accommodation & Food Services | 9 (75.0%) | 3 (25.0%) |
| Public Administration | 12 (75.0%) | 4 (25.0%) |
| Total | 205 (57.1%) | 154 (42.9%) |
Education in St Jo
School Enrollment in St Jo
The most common levels of schooling among the 317 students in St Jo are middle school (132 | 41.6%), elementary school (95 | 30.0%), and high school (65 | 20.5%).
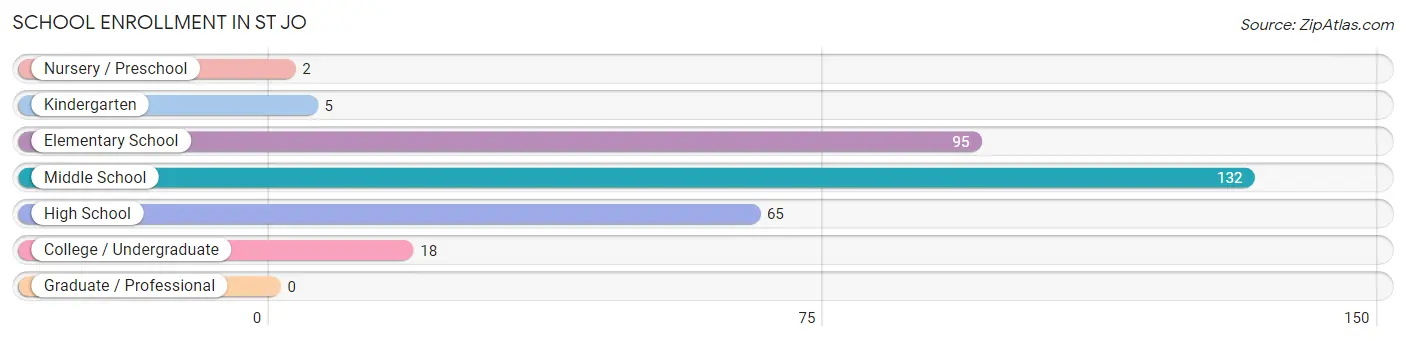
| School Level | # Students | % Students |
| Nursery / Preschool | 2 | 0.6% |
| Kindergarten | 5 | 1.6% |
| Elementary School | 95 | 30.0% |
| Middle School | 132 | 41.6% |
| High School | 65 | 20.5% |
| College / Undergraduate | 18 | 5.7% |
| Graduate / Professional | 0 | 0.0% |
| Total | 317 | 100.0% |
School Enrollment by Age by Funding Source in St Jo
Out of a total of 317 students who are enrolled in schools in St Jo, 7 (2.2%) attend a private institution, while the remaining 310 (97.8%) are enrolled in public schools. The age group of 15 to 17 year olds has the highest likelihood of being enrolled in private schools, with 7 (13.5% in the age bracket) enrolled. Conversely, the age group of 3 to 4 year olds has the lowest likelihood of being enrolled in a private school, with 2 (100.0% in the age bracket) attending a public institution.
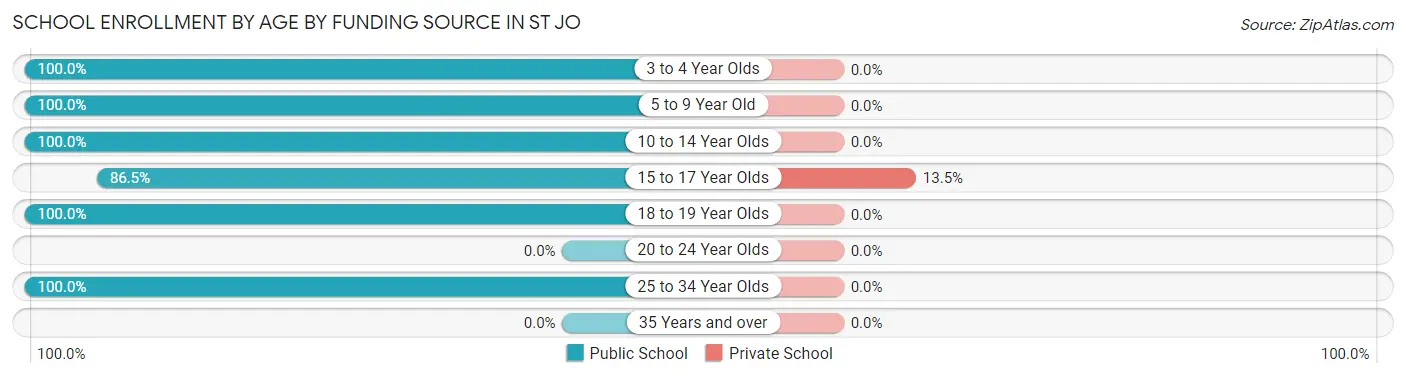
| Age Bracket | Public School | Private School |
| 3 to 4 Year Olds | 2 (100.0%) | 0 (0.0%) |
| 5 to 9 Year Old | 73 (100.0%) | 0 (0.0%) |
| 10 to 14 Year Olds | 159 (100.0%) | 0 (0.0%) |
| 15 to 17 Year Olds | 45 (86.5%) | 7 (13.5%) |
| 18 to 19 Year Olds | 13 (100.0%) | 0 (0.0%) |
| 20 to 24 Year Olds | 0 (0.0%) | 0 (0.0%) |
| 25 to 34 Year Olds | 18 (100.0%) | 0 (0.0%) |
| 35 Years and over | 0 (0.0%) | 0 (0.0%) |
| Total | 310 (97.8%) | 7 (2.2%) |
Educational Attainment by Field of Study in St Jo
Education (44 | 34.1%), business (33 | 25.6%), psychology (12 | 9.3%), arts & humanities (12 | 9.3%), and communications (11 | 8.5%) are the most common fields of study among 129 individuals in St Jo who have obtained a bachelor's degree or higher.
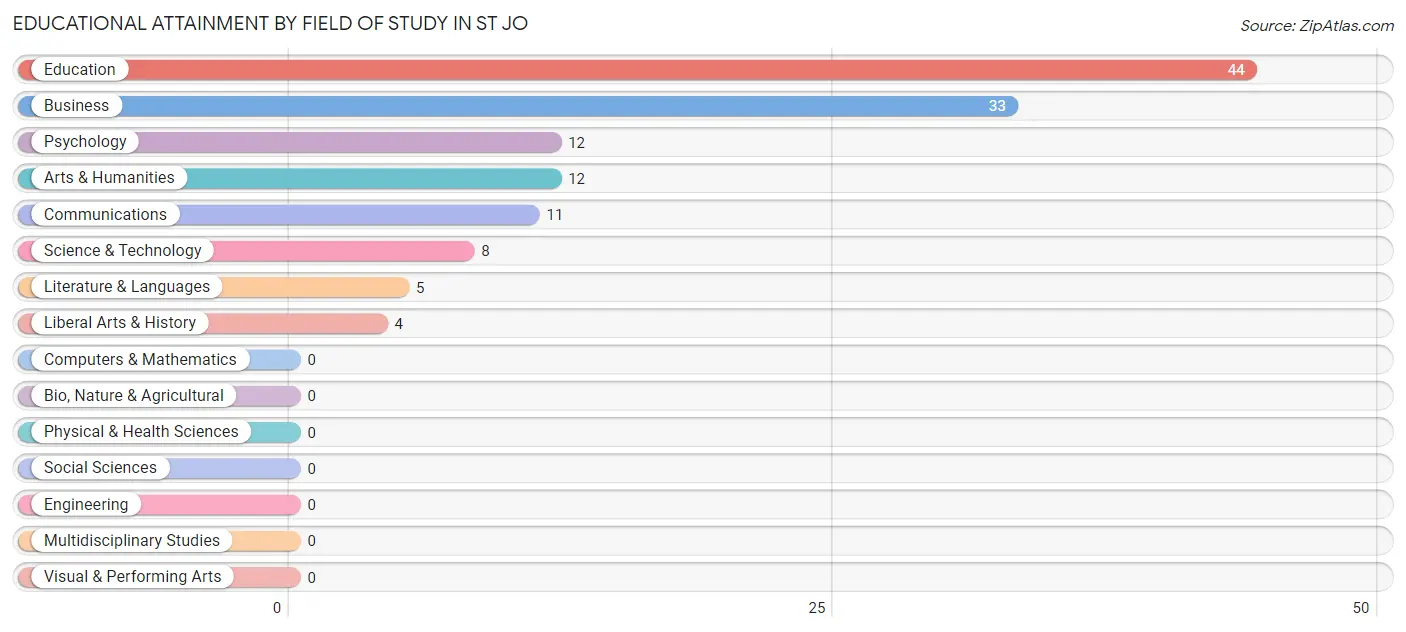
| Field of Study | # Graduates | % Graduates |
| Computers & Mathematics | 0 | 0.0% |
| Bio, Nature & Agricultural | 0 | 0.0% |
| Physical & Health Sciences | 0 | 0.0% |
| Psychology | 12 | 9.3% |
| Social Sciences | 0 | 0.0% |
| Engineering | 0 | 0.0% |
| Multidisciplinary Studies | 0 | 0.0% |
| Science & Technology | 8 | 6.2% |
| Business | 33 | 25.6% |
| Education | 44 | 34.1% |
| Literature & Languages | 5 | 3.9% |
| Liberal Arts & History | 4 | 3.1% |
| Visual & Performing Arts | 0 | 0.0% |
| Communications | 11 | 8.5% |
| Arts & Humanities | 12 | 9.3% |
| Total | 129 | 100.0% |
Transportation & Commute in St Jo
Vehicle Availability by Sex in St Jo
The most prevalent vehicle ownership categories in St Jo are males with 2 vehicles (122, accounting for 59.5%) and females with 2 vehicles (70, making up 79.2%).
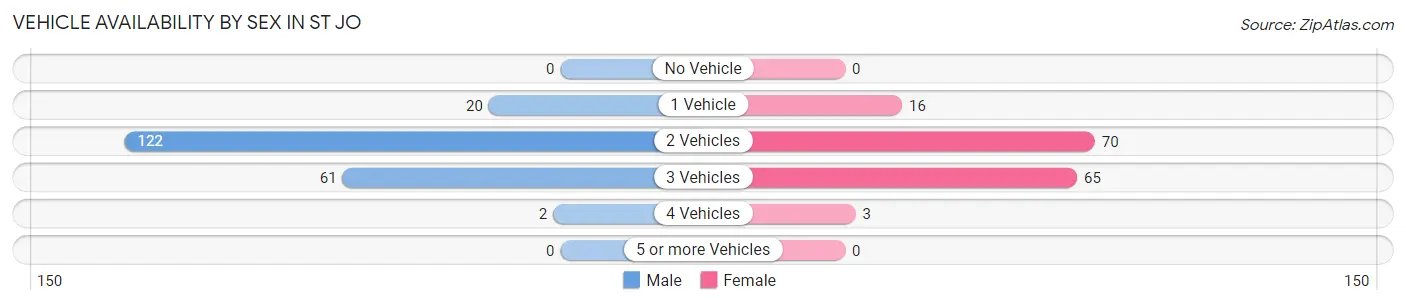
| Vehicles Available | Male | Female |
| No Vehicle | 0 (0.0%) | 0 (0.0%) |
| 1 Vehicle | 20 (9.8%) | 16 (10.4%) |
| 2 Vehicles | 122 (59.5%) | 70 (45.5%) |
| 3 Vehicles | 61 (29.8%) | 65 (42.2%) |
| 4 Vehicles | 2 (1.0%) | 3 (1.9%) |
| 5 or more Vehicles | 0 (0.0%) | 0 (0.0%) |
| Total | 205 (100.0%) | 154 (100.0%) |
Commute Time in St Jo
The most frequently occuring commute durations in St Jo are 10 to 14 minutes (53 commuters, 14.8%), less than 5 minutes (52 commuters, 14.5%), and 60 to 89 minutes (44 commuters, 12.3%).
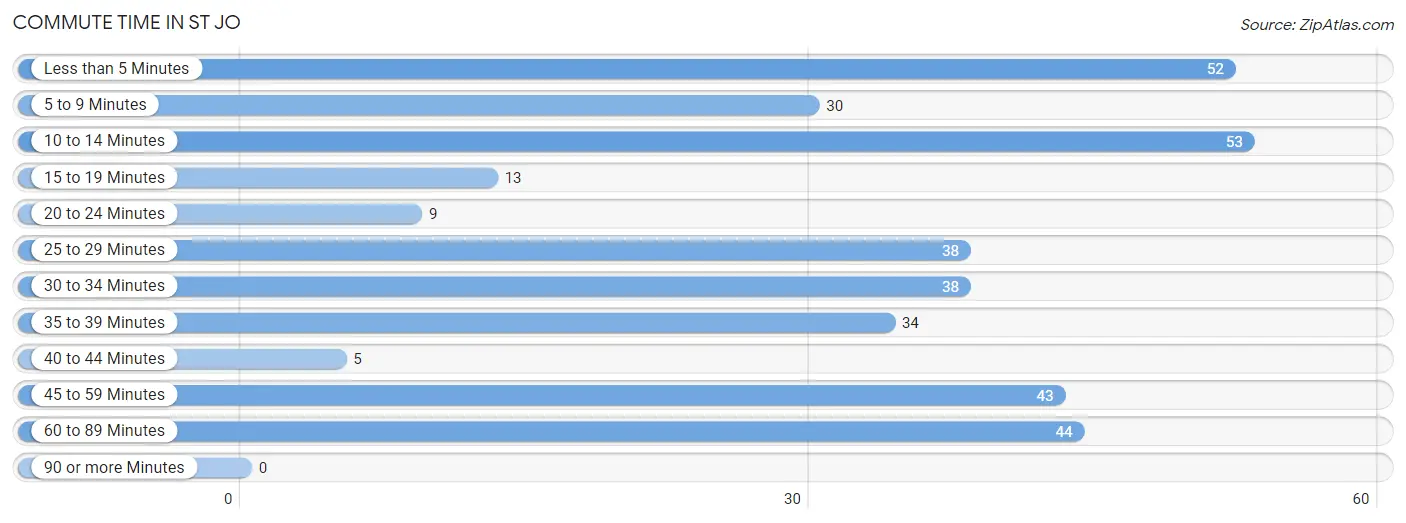
| Commute Time | # Commuters | % Commuters |
| Less than 5 Minutes | 52 | 14.5% |
| 5 to 9 Minutes | 30 | 8.4% |
| 10 to 14 Minutes | 53 | 14.8% |
| 15 to 19 Minutes | 13 | 3.6% |
| 20 to 24 Minutes | 9 | 2.5% |
| 25 to 29 Minutes | 38 | 10.6% |
| 30 to 34 Minutes | 38 | 10.6% |
| 35 to 39 Minutes | 34 | 9.5% |
| 40 to 44 Minutes | 5 | 1.4% |
| 45 to 59 Minutes | 43 | 12.0% |
| 60 to 89 Minutes | 44 | 12.3% |
| 90 or more Minutes | 0 | 0.0% |
Commute Time by Sex in St Jo
The most common commute times in St Jo are 45 to 59 minutes (40 commuters, 19.5%) for males and 10 to 14 minutes (35 commuters, 22.7%) for females.
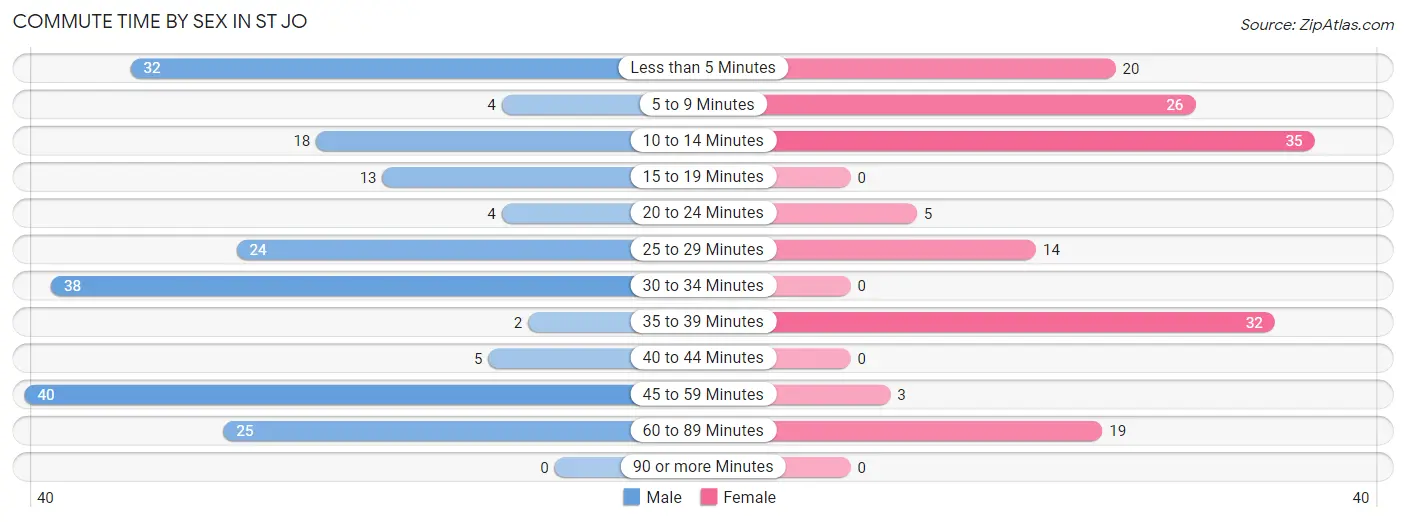
| Commute Time | Male | Female |
| Less than 5 Minutes | 32 (15.6%) | 20 (13.0%) |
| 5 to 9 Minutes | 4 (1.9%) | 26 (16.9%) |
| 10 to 14 Minutes | 18 (8.8%) | 35 (22.7%) |
| 15 to 19 Minutes | 13 (6.3%) | 0 (0.0%) |
| 20 to 24 Minutes | 4 (1.9%) | 5 (3.3%) |
| 25 to 29 Minutes | 24 (11.7%) | 14 (9.1%) |
| 30 to 34 Minutes | 38 (18.5%) | 0 (0.0%) |
| 35 to 39 Minutes | 2 (1.0%) | 32 (20.8%) |
| 40 to 44 Minutes | 5 (2.4%) | 0 (0.0%) |
| 45 to 59 Minutes | 40 (19.5%) | 3 (1.9%) |
| 60 to 89 Minutes | 25 (12.2%) | 19 (12.3%) |
| 90 or more Minutes | 0 (0.0%) | 0 (0.0%) |
Time of Departure to Work by Sex in St Jo
The most frequent times of departure to work in St Jo are 7:00 AM to 7:29 AM (54, 26.3%) for males and 7:00 AM to 7:29 AM (71, 46.1%) for females.
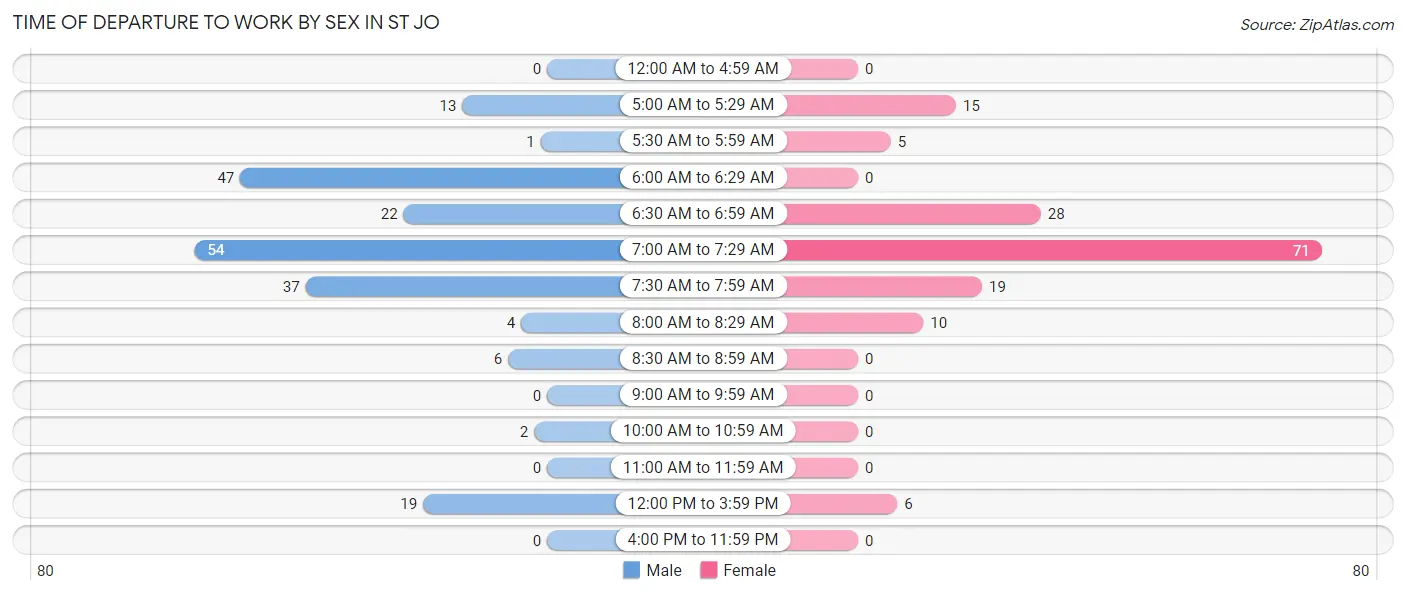
| Time of Departure | Male | Female |
| 12:00 AM to 4:59 AM | 0 (0.0%) | 0 (0.0%) |
| 5:00 AM to 5:29 AM | 13 (6.3%) | 15 (9.7%) |
| 5:30 AM to 5:59 AM | 1 (0.5%) | 5 (3.3%) |
| 6:00 AM to 6:29 AM | 47 (22.9%) | 0 (0.0%) |
| 6:30 AM to 6:59 AM | 22 (10.7%) | 28 (18.2%) |
| 7:00 AM to 7:29 AM | 54 (26.3%) | 71 (46.1%) |
| 7:30 AM to 7:59 AM | 37 (18.0%) | 19 (12.3%) |
| 8:00 AM to 8:29 AM | 4 (1.9%) | 10 (6.5%) |
| 8:30 AM to 8:59 AM | 6 (2.9%) | 0 (0.0%) |
| 9:00 AM to 9:59 AM | 0 (0.0%) | 0 (0.0%) |
| 10:00 AM to 10:59 AM | 2 (1.0%) | 0 (0.0%) |
| 11:00 AM to 11:59 AM | 0 (0.0%) | 0 (0.0%) |
| 12:00 PM to 3:59 PM | 19 (9.3%) | 6 (3.9%) |
| 4:00 PM to 11:59 PM | 0 (0.0%) | 0 (0.0%) |
| Total | 205 (100.0%) | 154 (100.0%) |
Housing Occupancy in St Jo
Occupancy by Ownership in St Jo
Of the total 328 dwellings in St Jo, owner-occupied units account for 241 (73.5%), while renter-occupied units make up 87 (26.5%).
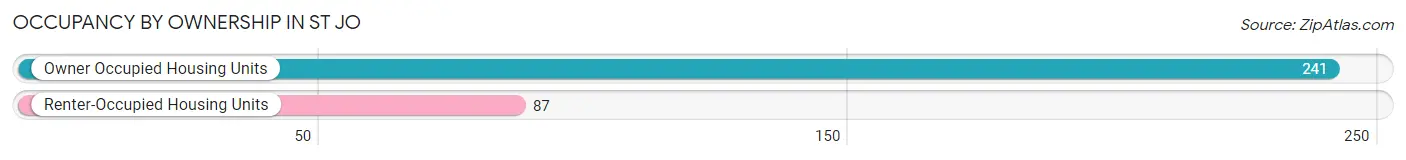
| Occupancy | # Housing Units | % Housing Units |
| Owner Occupied Housing Units | 241 | 73.5% |
| Renter-Occupied Housing Units | 87 | 26.5% |
| Total Occupied Housing Units | 328 | 100.0% |
Occupancy by Household Size in St Jo
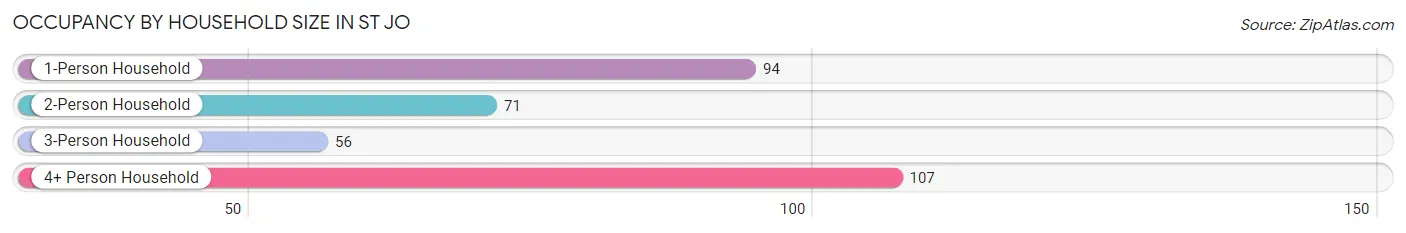
| Household Size | # Housing Units | % Housing Units |
| 1-Person Household | 94 | 28.7% |
| 2-Person Household | 71 | 21.6% |
| 3-Person Household | 56 | 17.1% |
| 4+ Person Household | 107 | 32.6% |
| Total Housing Units | 328 | 100.0% |
Occupancy by Ownership by Household Size in St Jo
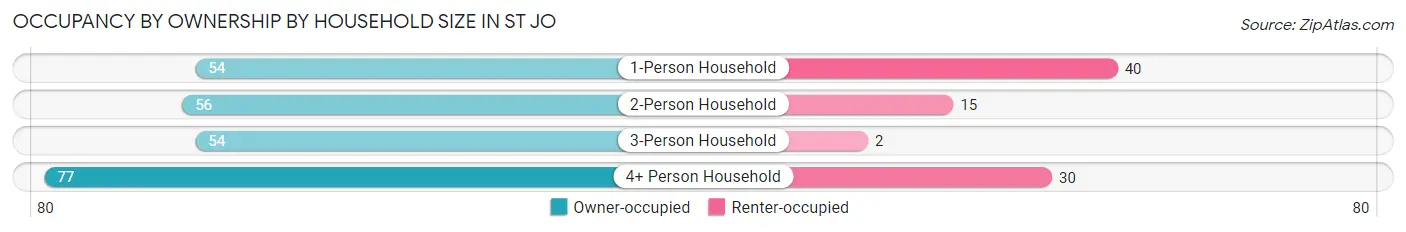
| Household Size | Owner-occupied | Renter-occupied |
| 1-Person Household | 54 (57.5%) | 40 (42.5%) |
| 2-Person Household | 56 (78.9%) | 15 (21.1%) |
| 3-Person Household | 54 (96.4%) | 2 (3.6%) |
| 4+ Person Household | 77 (72.0%) | 30 (28.0%) |
| Total Housing Units | 241 (73.5%) | 87 (26.5%) |
Occupancy by Educational Attainment in St Jo
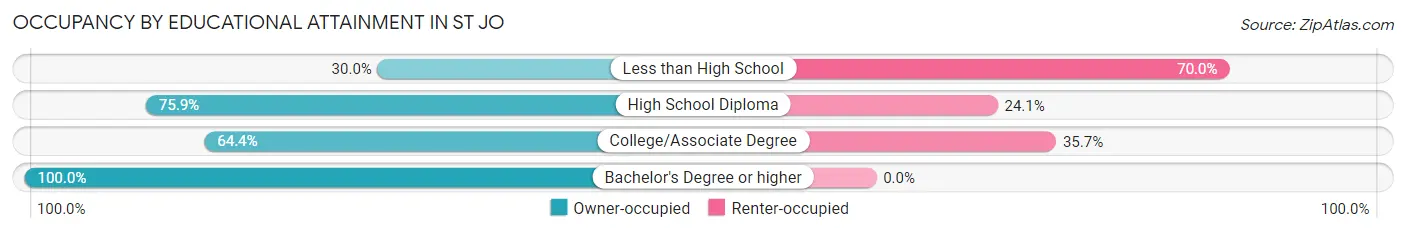
| Household Size | Owner-occupied | Renter-occupied |
| Less than High School | 6 (30.0%) | 14 (70.0%) |
| High School Diploma | 101 (75.9%) | 32 (24.1%) |
| College/Associate Degree | 74 (64.3%) | 41 (35.6%) |
| Bachelor's Degree or higher | 60 (100.0%) | 0 (0.0%) |
Occupancy by Age of Householder in St Jo
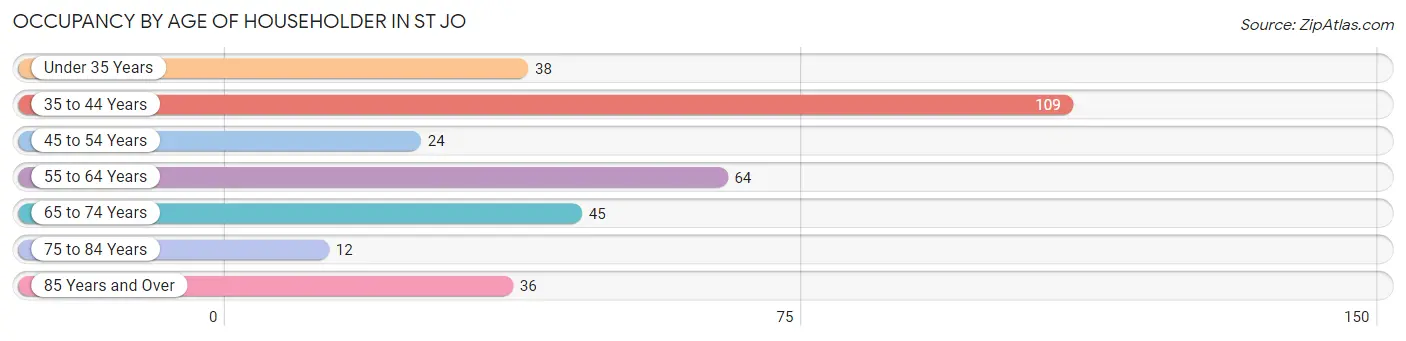
| Age Bracket | # Households | % Households |
| Under 35 Years | 38 | 11.6% |
| 35 to 44 Years | 109 | 33.2% |
| 45 to 54 Years | 24 | 7.3% |
| 55 to 64 Years | 64 | 19.5% |
| 65 to 74 Years | 45 | 13.7% |
| 75 to 84 Years | 12 | 3.7% |
| 85 Years and Over | 36 | 11.0% |
| Total | 328 | 100.0% |
Housing Finances in St Jo
Median Income by Occupancy in St Jo
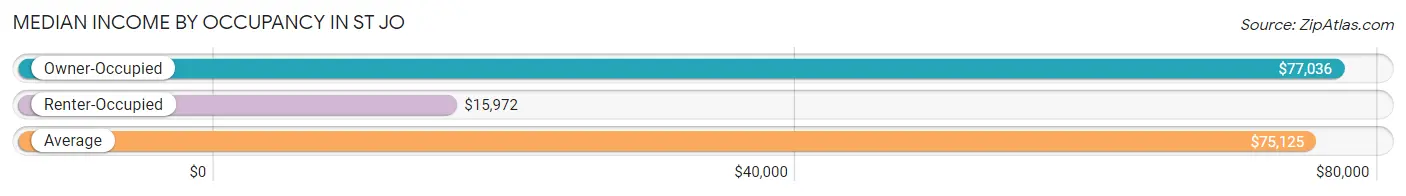
| Occupancy Type | # Households | Median Income |
| Owner-Occupied | 241 (73.5%) | $77,036 |
| Renter-Occupied | 87 (26.5%) | $15,972 |
| Average | 328 (100.0%) | $75,125 |
Occupancy by Householder Income Bracket in St Jo
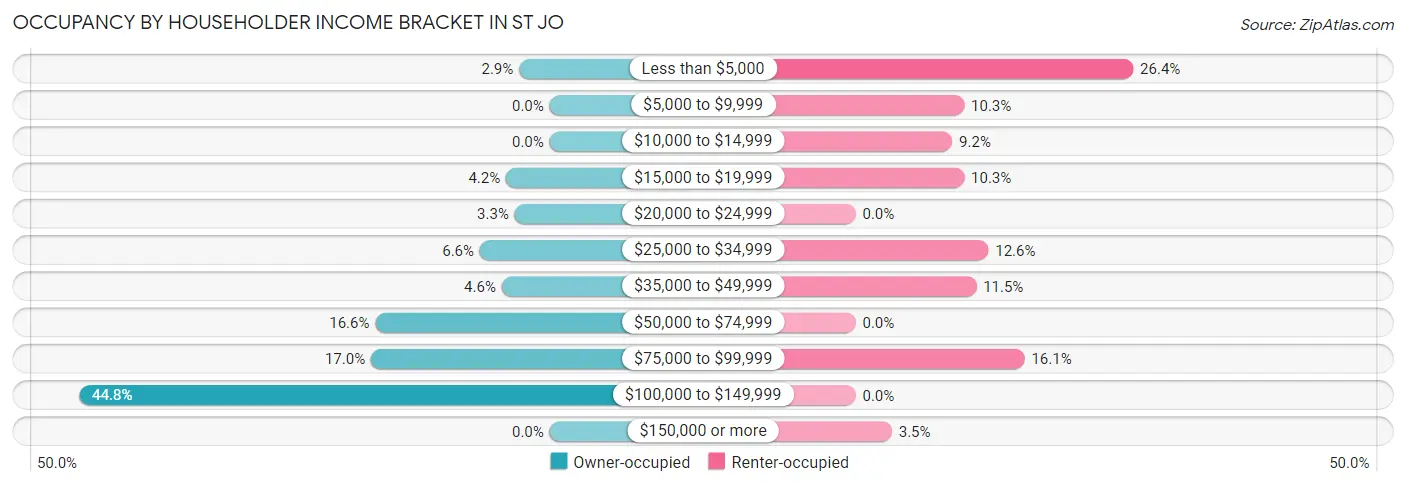
| Income Bracket | Owner-occupied | Renter-occupied |
| Less than $5,000 | 7 (2.9%) | 23 (26.4%) |
| $5,000 to $9,999 | 0 (0.0%) | 9 (10.3%) |
| $10,000 to $14,999 | 0 (0.0%) | 8 (9.2%) |
| $15,000 to $19,999 | 10 (4.2%) | 9 (10.3%) |
| $20,000 to $24,999 | 8 (3.3%) | 0 (0.0%) |
| $25,000 to $34,999 | 16 (6.6%) | 11 (12.6%) |
| $35,000 to $49,999 | 11 (4.6%) | 10 (11.5%) |
| $50,000 to $74,999 | 40 (16.6%) | 0 (0.0%) |
| $75,000 to $99,999 | 41 (17.0%) | 14 (16.1%) |
| $100,000 to $149,999 | 108 (44.8%) | 0 (0.0%) |
| $150,000 or more | 0 (0.0%) | 3 (3.5%) |
| Total | 241 (100.0%) | 87 (100.0%) |
Monthly Housing Cost Tiers in St Jo
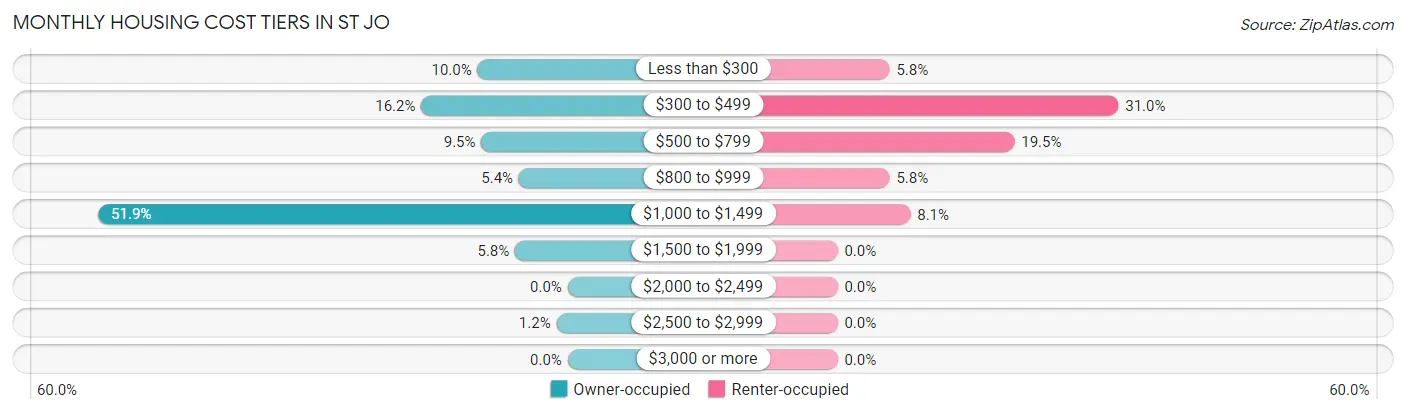
| Monthly Cost | Owner-occupied | Renter-occupied |
| Less than $300 | 24 (10.0%) | 5 (5.8%) |
| $300 to $499 | 39 (16.2%) | 27 (31.0%) |
| $500 to $799 | 23 (9.5%) | 17 (19.5%) |
| $800 to $999 | 13 (5.4%) | 5 (5.8%) |
| $1,000 to $1,499 | 125 (51.9%) | 7 (8.1%) |
| $1,500 to $1,999 | 14 (5.8%) | 0 (0.0%) |
| $2,000 to $2,499 | 0 (0.0%) | 0 (0.0%) |
| $2,500 to $2,999 | 3 (1.2%) | 0 (0.0%) |
| $3,000 or more | 0 (0.0%) | 0 (0.0%) |
| Total | 241 (100.0%) | 87 (100.0%) |
Physical Housing Characteristics in St Jo
Housing Structures in St Jo

| Structure Type | # Housing Units | % Housing Units |
| Single Unit, Detached | 257 | 78.3% |
| Single Unit, Attached | 4 | 1.2% |
| 2 Unit Apartments | 0 | 0.0% |
| 3 or 4 Unit Apartments | 28 | 8.5% |
| 5 to 9 Unit Apartments | 9 | 2.7% |
| 10 or more Apartments | 10 | 3.0% |
| Mobile Home / Other | 20 | 6.1% |
| Total | 328 | 100.0% |
Housing Structures by Occupancy in St Jo
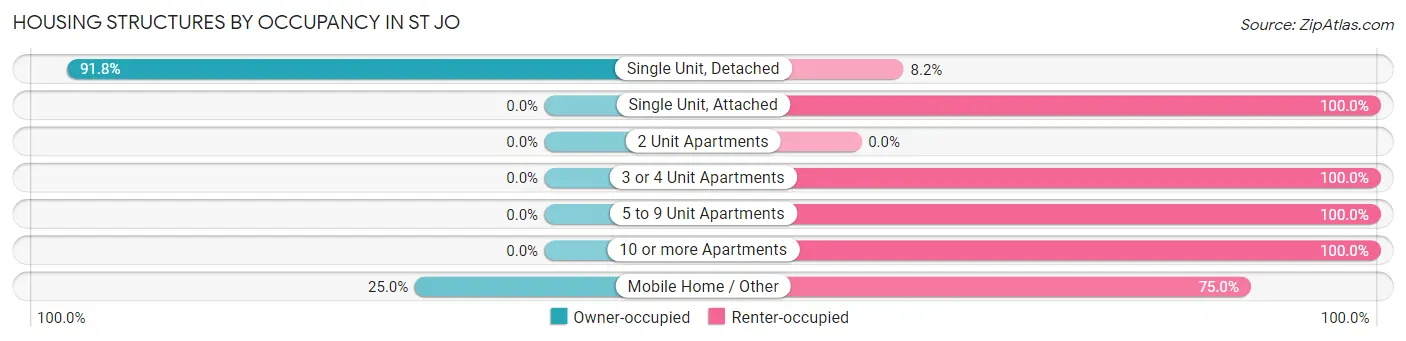
| Structure Type | Owner-occupied | Renter-occupied |
| Single Unit, Detached | 236 (91.8%) | 21 (8.2%) |
| Single Unit, Attached | 0 (0.0%) | 4 (100.0%) |
| 2 Unit Apartments | 0 (0.0%) | 0 (0.0%) |
| 3 or 4 Unit Apartments | 0 (0.0%) | 28 (100.0%) |
| 5 to 9 Unit Apartments | 0 (0.0%) | 9 (100.0%) |
| 10 or more Apartments | 0 (0.0%) | 10 (100.0%) |
| Mobile Home / Other | 5 (25.0%) | 15 (75.0%) |
| Total | 241 (73.5%) | 87 (26.5%) |
Housing Structures by Number of Rooms in St Jo
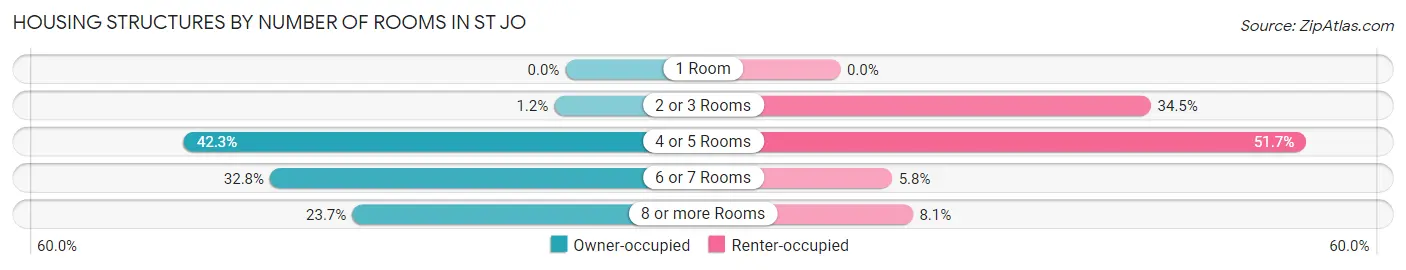
| Number of Rooms | Owner-occupied | Renter-occupied |
| 1 Room | 0 (0.0%) | 0 (0.0%) |
| 2 or 3 Rooms | 3 (1.2%) | 30 (34.5%) |
| 4 or 5 Rooms | 102 (42.3%) | 45 (51.7%) |
| 6 or 7 Rooms | 79 (32.8%) | 5 (5.8%) |
| 8 or more Rooms | 57 (23.6%) | 7 (8.1%) |
| Total | 241 (100.0%) | 87 (100.0%) |
Housing Structure by Heating Type in St Jo
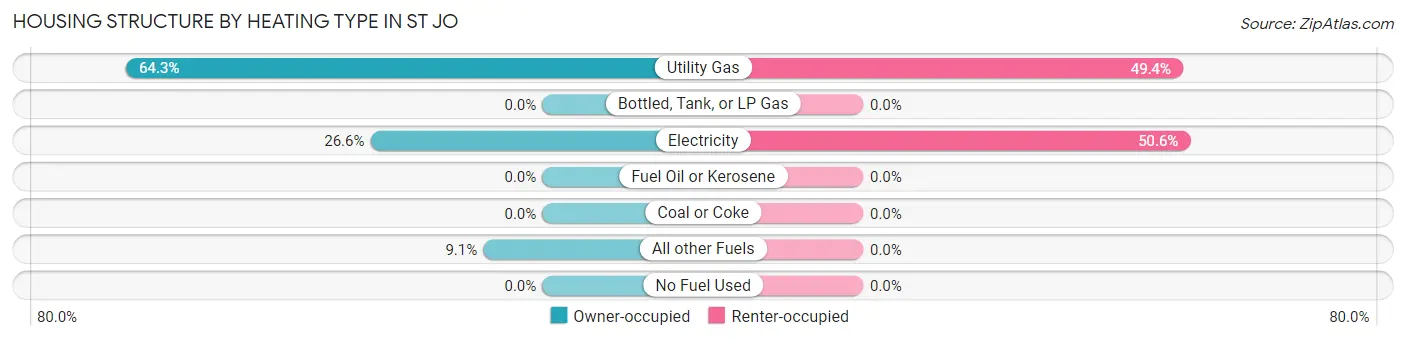
| Heating Type | Owner-occupied | Renter-occupied |
| Utility Gas | 155 (64.3%) | 43 (49.4%) |
| Bottled, Tank, or LP Gas | 0 (0.0%) | 0 (0.0%) |
| Electricity | 64 (26.6%) | 44 (50.6%) |
| Fuel Oil or Kerosene | 0 (0.0%) | 0 (0.0%) |
| Coal or Coke | 0 (0.0%) | 0 (0.0%) |
| All other Fuels | 22 (9.1%) | 0 (0.0%) |
| No Fuel Used | 0 (0.0%) | 0 (0.0%) |
| Total | 241 (100.0%) | 87 (100.0%) |
Household Vehicle Usage in St Jo
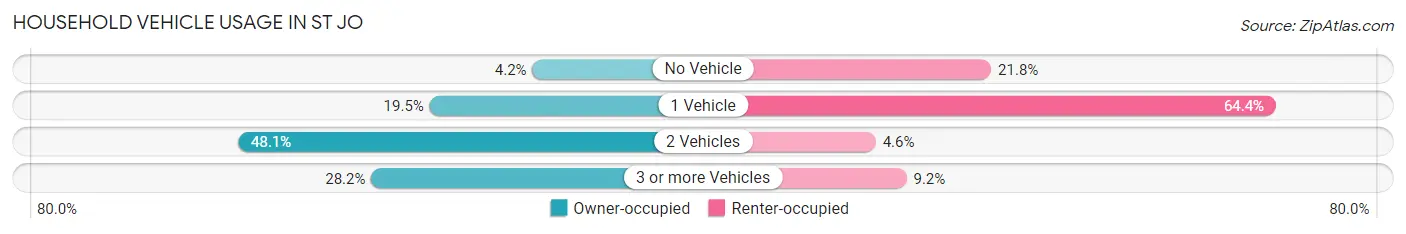
| Vehicles per Household | Owner-occupied | Renter-occupied |
| No Vehicle | 10 (4.2%) | 19 (21.8%) |
| 1 Vehicle | 47 (19.5%) | 56 (64.4%) |
| 2 Vehicles | 116 (48.1%) | 4 (4.6%) |
| 3 or more Vehicles | 68 (28.2%) | 8 (9.2%) |
| Total | 241 (100.0%) | 87 (100.0%) |
Real Estate & Mortgages in St Jo
Real Estate and Mortgage Overview in St Jo
| Characteristic | Without Mortgage | With Mortgage |
| Housing Units | 112 | 129 |
| Median Property Value | $113,900 | $151,400 |
| Median Household Income | $72,708 | $0 |
| Monthly Housing Costs | $468 | $0 |
| Real Estate Taxes | $781 | $3 |
Property Value by Mortgage Status in St Jo
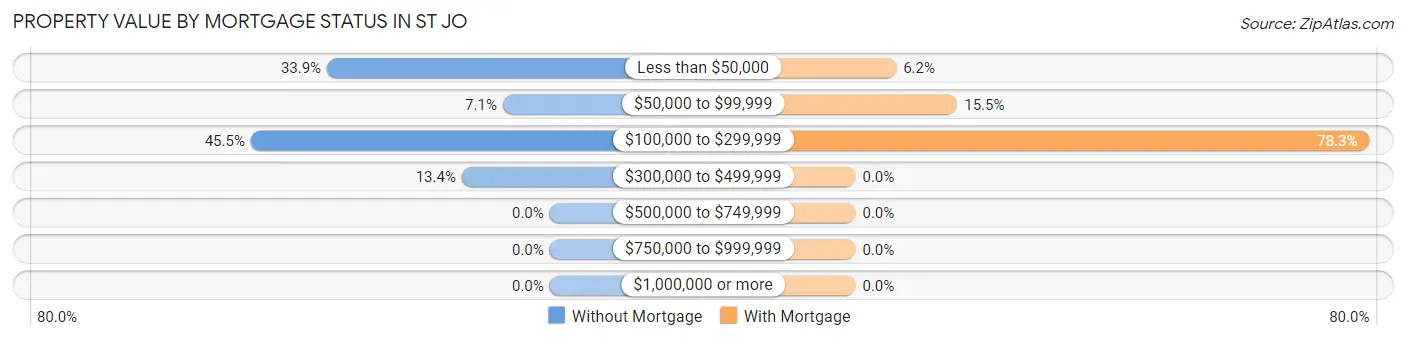
| Property Value | Without Mortgage | With Mortgage |
| Less than $50,000 | 38 (33.9%) | 8 (6.2%) |
| $50,000 to $99,999 | 8 (7.1%) | 20 (15.5%) |
| $100,000 to $299,999 | 51 (45.5%) | 101 (78.3%) |
| $300,000 to $499,999 | 15 (13.4%) | 0 (0.0%) |
| $500,000 to $749,999 | 0 (0.0%) | 0 (0.0%) |
| $750,000 to $999,999 | 0 (0.0%) | 0 (0.0%) |
| $1,000,000 or more | 0 (0.0%) | 0 (0.0%) |
| Total | 112 (100.0%) | 129 (100.0%) |
Household Income by Mortgage Status in St Jo
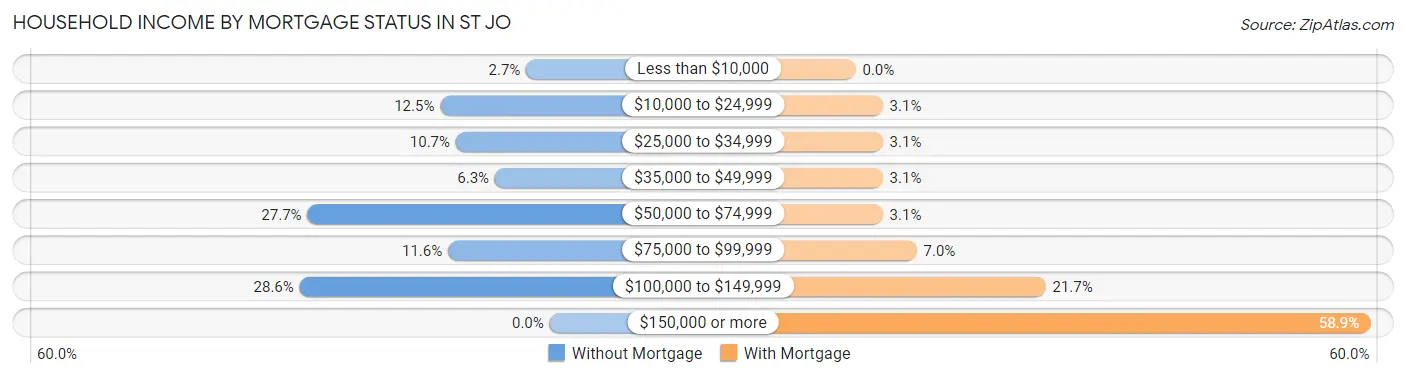
| Household Income | Without Mortgage | With Mortgage |
| Less than $10,000 | 3 (2.7%) | 0 (0.0%) |
| $10,000 to $24,999 | 14 (12.5%) | 4 (3.1%) |
| $25,000 to $34,999 | 12 (10.7%) | 4 (3.1%) |
| $35,000 to $49,999 | 7 (6.2%) | 4 (3.1%) |
| $50,000 to $74,999 | 31 (27.7%) | 4 (3.1%) |
| $75,000 to $99,999 | 13 (11.6%) | 9 (7.0%) |
| $100,000 to $149,999 | 32 (28.6%) | 28 (21.7%) |
| $150,000 or more | 0 (0.0%) | 76 (58.9%) |
| Total | 112 (100.0%) | 129 (100.0%) |
Property Value to Household Income Ratio in St Jo
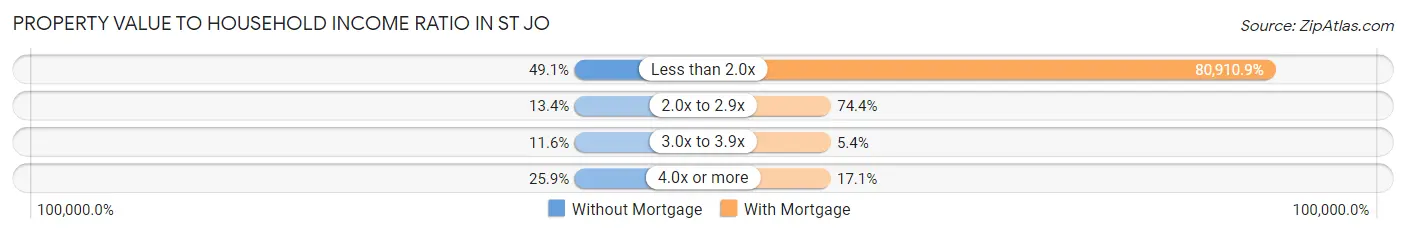
| Value-to-Income Ratio | Without Mortgage | With Mortgage |
| Less than 2.0x | 55 (49.1%) | 104,375 (80,910.9%) |
| 2.0x to 2.9x | 15 (13.4%) | 96 (74.4%) |
| 3.0x to 3.9x | 13 (11.6%) | 7 (5.4%) |
| 4.0x or more | 29 (25.9%) | 22 (17.1%) |
| Total | 112 (100.0%) | 129 (100.0%) |
Real Estate Taxes by Mortgage Status in St Jo
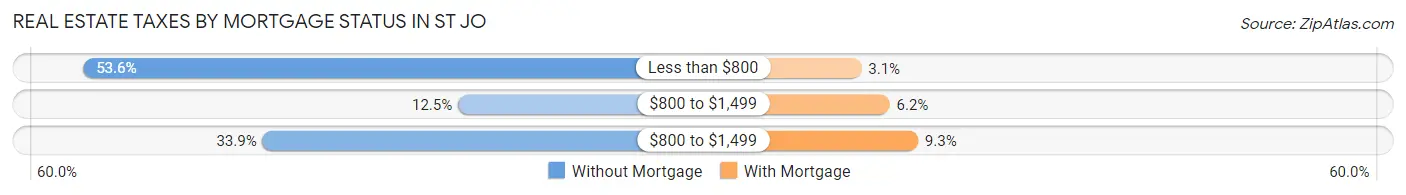
| Property Taxes | Without Mortgage | With Mortgage |
| Less than $800 | 60 (53.6%) | 4 (3.1%) |
| $800 to $1,499 | 14 (12.5%) | 8 (6.2%) |
| $800 to $1,499 | 38 (33.9%) | 12 (9.3%) |
| Total | 112 (100.0%) | 129 (100.0%) |
Health & Disability in St Jo
Health Insurance Coverage by Age in St Jo
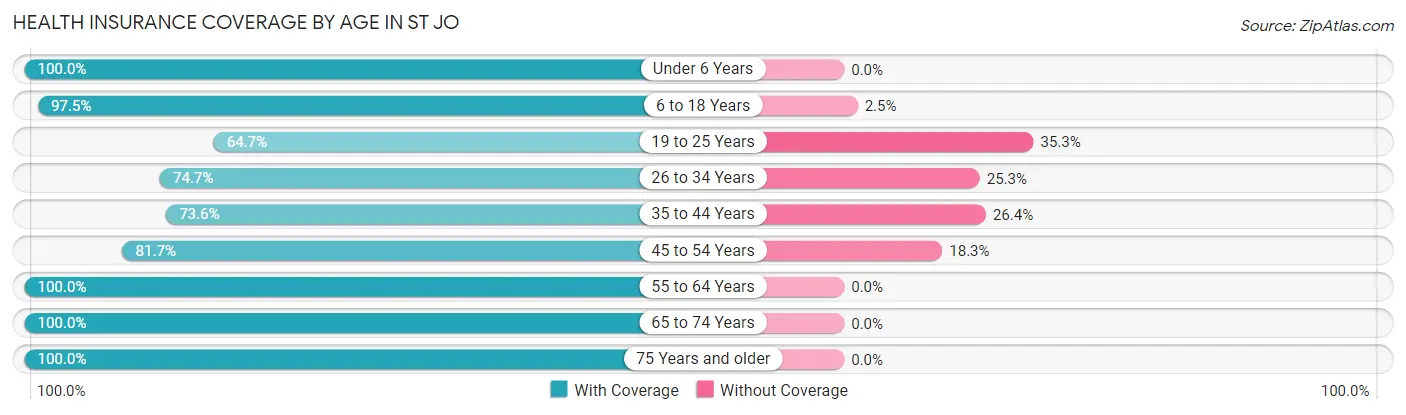
| Age Bracket | With Coverage | Without Coverage |
| Under 6 Years | 56 (100.0%) | 0 (0.0%) |
| 6 to 18 Years | 273 (97.5%) | 7 (2.5%) |
| 19 to 25 Years | 22 (64.7%) | 12 (35.3%) |
| 26 to 34 Years | 68 (74.7%) | 23 (25.3%) |
| 35 to 44 Years | 117 (73.6%) | 42 (26.4%) |
| 45 to 54 Years | 67 (81.7%) | 15 (18.3%) |
| 55 to 64 Years | 82 (100.0%) | 0 (0.0%) |
| 65 to 74 Years | 51 (100.0%) | 0 (0.0%) |
| 75 Years and older | 69 (100.0%) | 0 (0.0%) |
| Total | 805 (89.0%) | 99 (11.0%) |
Health Insurance Coverage by Citizenship Status in St Jo
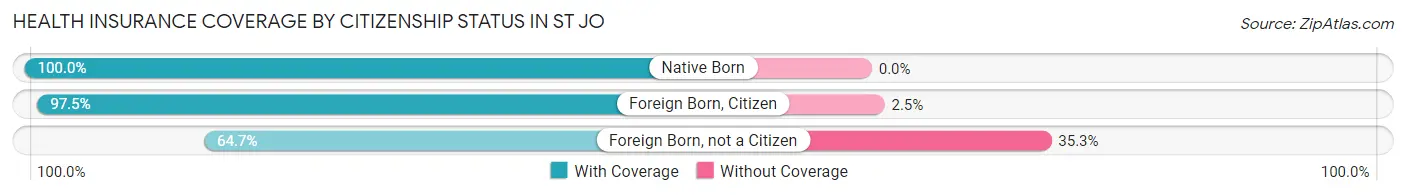
| Citizenship Status | With Coverage | Without Coverage |
| Native Born | 56 (100.0%) | 0 (0.0%) |
| Foreign Born, Citizen | 273 (97.5%) | 7 (2.5%) |
| Foreign Born, not a Citizen | 22 (64.7%) | 12 (35.3%) |
Health Insurance Coverage by Household Income in St Jo
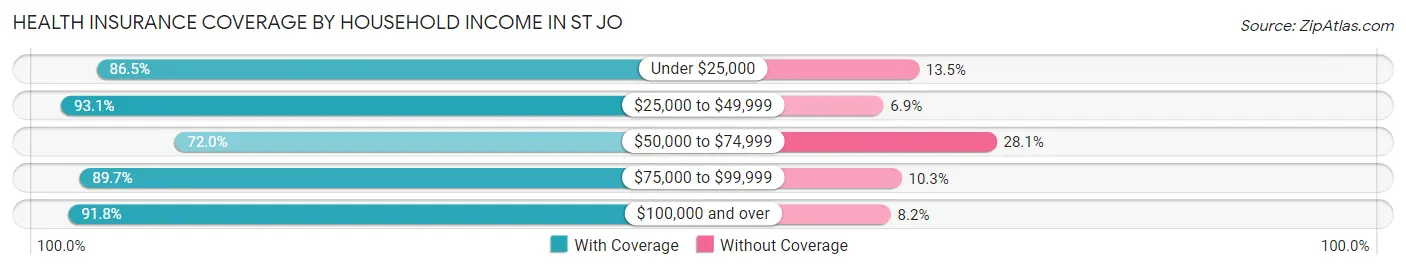
| Household Income | With Coverage | Without Coverage |
| Under $25,000 | 109 (86.5%) | 17 (13.5%) |
| $25,000 to $49,999 | 95 (93.1%) | 7 (6.9%) |
| $50,000 to $74,999 | 59 (72.0%) | 23 (28.1%) |
| $75,000 to $99,999 | 140 (89.7%) | 16 (10.3%) |
| $100,000 and over | 402 (91.8%) | 36 (8.2%) |
Public vs Private Health Insurance Coverage by Age in St Jo
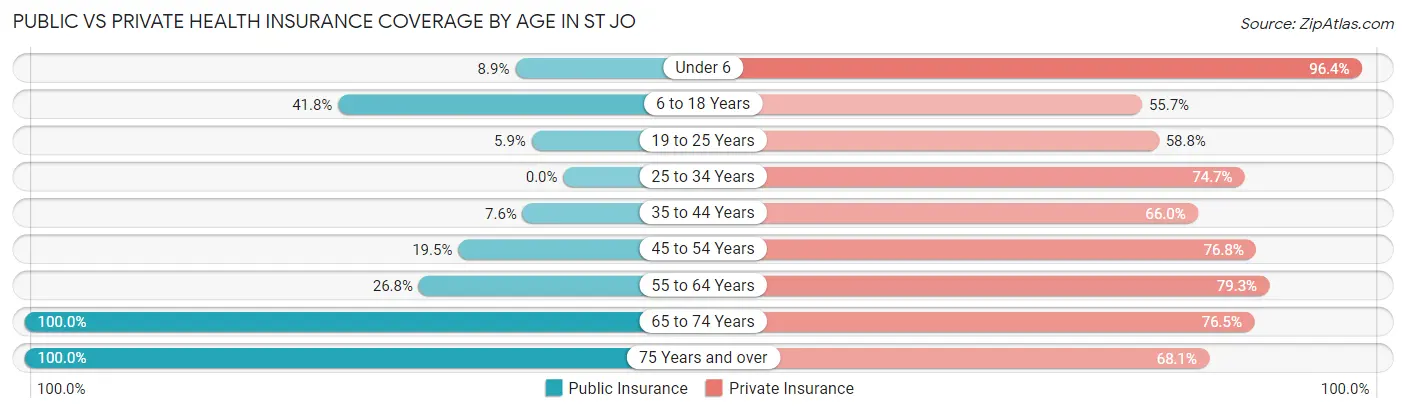
| Age Bracket | Public Insurance | Private Insurance |
| Under 6 | 5 (8.9%) | 54 (96.4%) |
| 6 to 18 Years | 117 (41.8%) | 156 (55.7%) |
| 19 to 25 Years | 2 (5.9%) | 20 (58.8%) |
| 25 to 34 Years | 0 (0.0%) | 68 (74.7%) |
| 35 to 44 Years | 12 (7.5%) | 105 (66.0%) |
| 45 to 54 Years | 16 (19.5%) | 63 (76.8%) |
| 55 to 64 Years | 22 (26.8%) | 65 (79.3%) |
| 65 to 74 Years | 51 (100.0%) | 39 (76.5%) |
| 75 Years and over | 69 (100.0%) | 47 (68.1%) |
| Total | 294 (32.5%) | 617 (68.2%) |
Disability Status by Sex by Age in St Jo
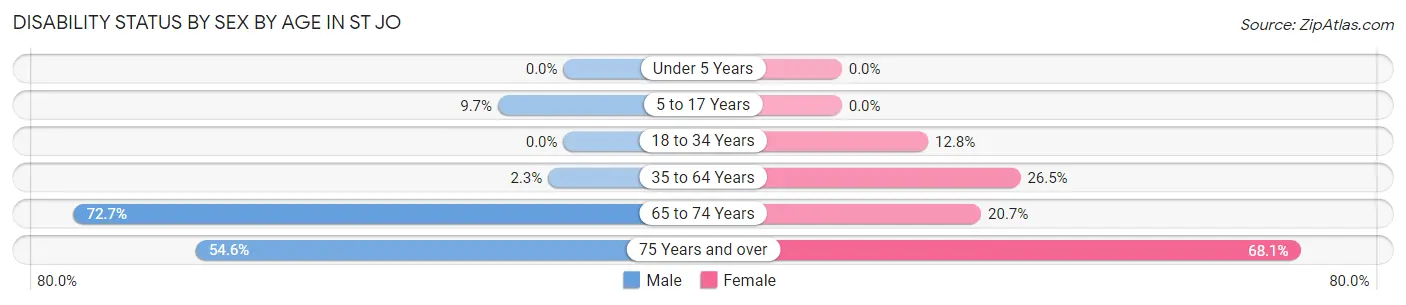
| Age Bracket | Male | Female |
| Under 5 Years | 0 (0.0%) | 0 (0.0%) |
| 5 to 17 Years | 14 (9.7%) | 0 (0.0%) |
| 18 to 34 Years | 0 (0.0%) | 10 (12.8%) |
| 35 to 64 Years | 4 (2.3%) | 39 (26.5%) |
| 65 to 74 Years | 16 (72.7%) | 6 (20.7%) |
| 75 Years and over | 12 (54.5%) | 32 (68.1%) |
Disability Class by Sex by Age in St Jo
Disability Class: Hearing Difficulty
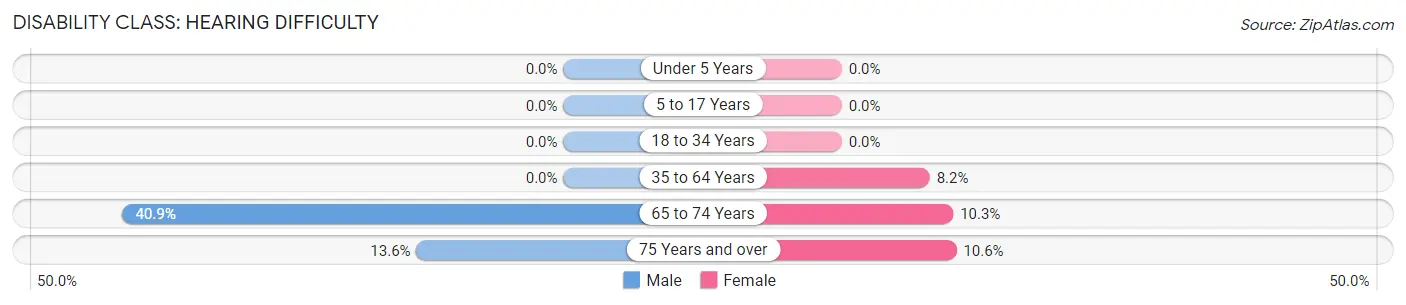
| Age Bracket | Male | Female |
| Under 5 Years | 0 (0.0%) | 0 (0.0%) |
| 5 to 17 Years | 0 (0.0%) | 0 (0.0%) |
| 18 to 34 Years | 0 (0.0%) | 0 (0.0%) |
| 35 to 64 Years | 0 (0.0%) | 12 (8.2%) |
| 65 to 74 Years | 9 (40.9%) | 3 (10.3%) |
| 75 Years and over | 3 (13.6%) | 5 (10.6%) |
Disability Class: Vision Difficulty
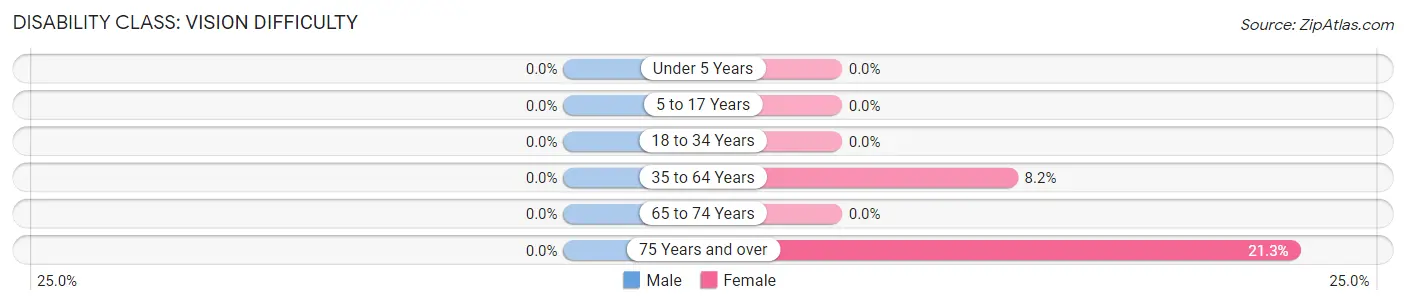
| Age Bracket | Male | Female |
| Under 5 Years | 0 (0.0%) | 0 (0.0%) |
| 5 to 17 Years | 0 (0.0%) | 0 (0.0%) |
| 18 to 34 Years | 0 (0.0%) | 0 (0.0%) |
| 35 to 64 Years | 0 (0.0%) | 12 (8.2%) |
| 65 to 74 Years | 0 (0.0%) | 0 (0.0%) |
| 75 Years and over | 0 (0.0%) | 10 (21.3%) |
Disability Class: Cognitive Difficulty
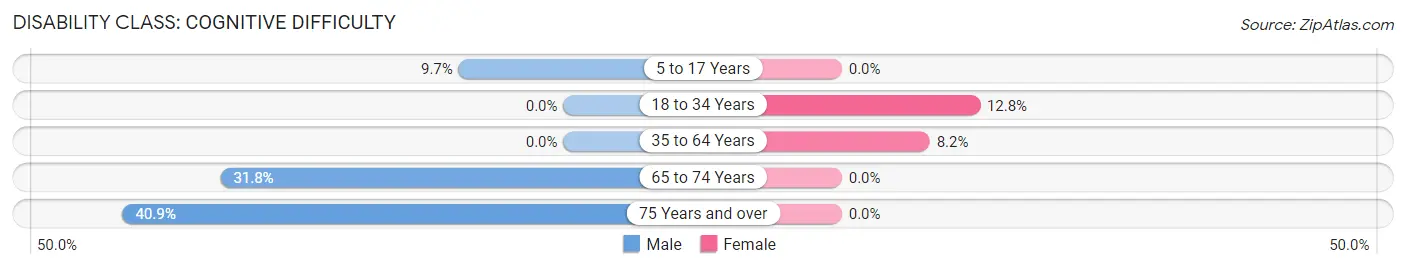
| Age Bracket | Male | Female |
| 5 to 17 Years | 14 (9.7%) | 0 (0.0%) |
| 18 to 34 Years | 0 (0.0%) | 10 (12.8%) |
| 35 to 64 Years | 0 (0.0%) | 12 (8.2%) |
| 65 to 74 Years | 7 (31.8%) | 0 (0.0%) |
| 75 Years and over | 9 (40.9%) | 0 (0.0%) |
Disability Class: Ambulatory Difficulty
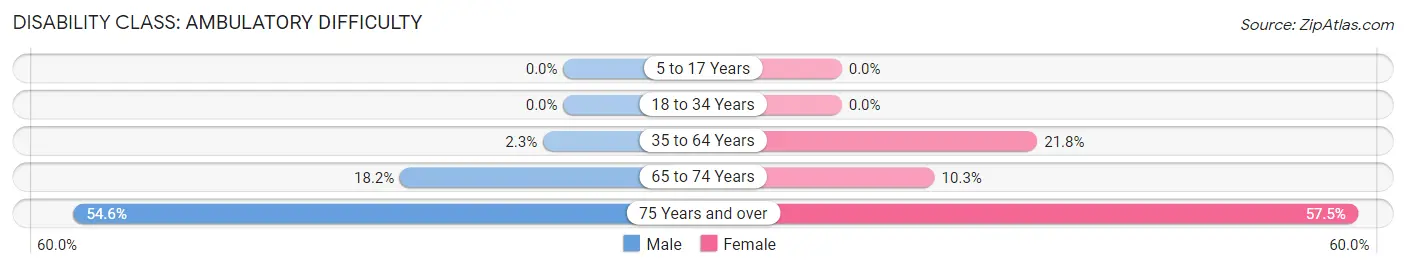
| Age Bracket | Male | Female |
| 5 to 17 Years | 0 (0.0%) | 0 (0.0%) |
| 18 to 34 Years | 0 (0.0%) | 0 (0.0%) |
| 35 to 64 Years | 4 (2.3%) | 32 (21.8%) |
| 65 to 74 Years | 4 (18.2%) | 3 (10.3%) |
| 75 Years and over | 12 (54.5%) | 27 (57.5%) |
Disability Class: Self-Care Difficulty
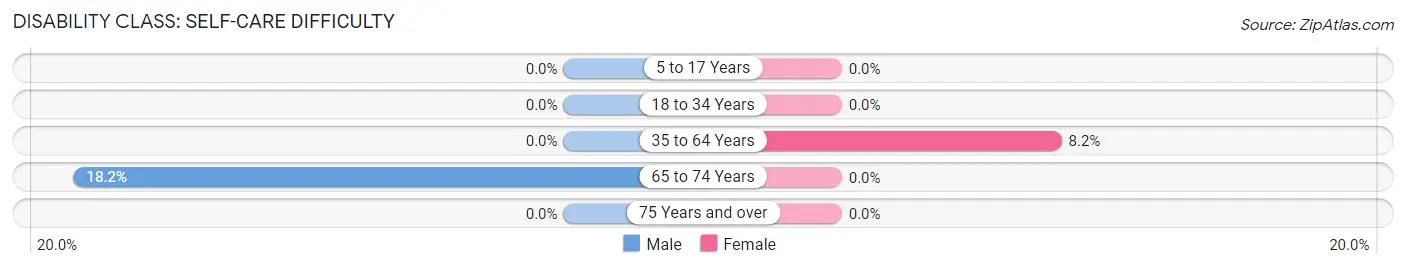
| Age Bracket | Male | Female |
| 5 to 17 Years | 0 (0.0%) | 0 (0.0%) |
| 18 to 34 Years | 0 (0.0%) | 0 (0.0%) |
| 35 to 64 Years | 0 (0.0%) | 12 (8.2%) |
| 65 to 74 Years | 4 (18.2%) | 0 (0.0%) |
| 75 Years and over | 0 (0.0%) | 0 (0.0%) |
Technology Access in St Jo
Computing Device Access in St Jo
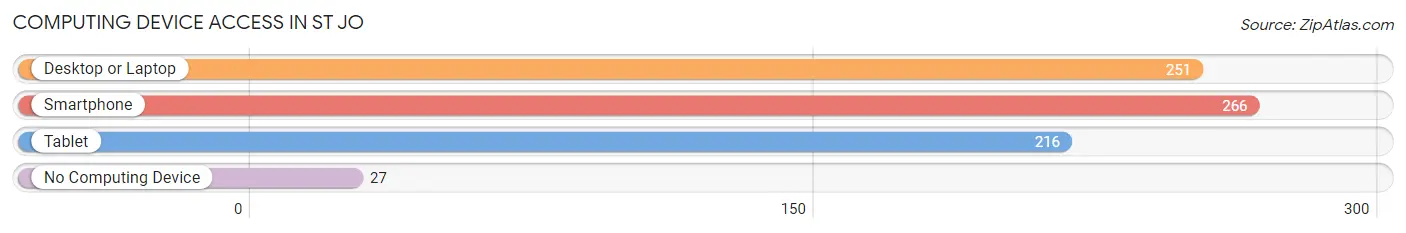
| Device Type | # Households | % Households |
| Desktop or Laptop | 251 | 76.5% |
| Smartphone | 266 | 81.1% |
| Tablet | 216 | 65.8% |
| No Computing Device | 27 | 8.2% |
| Total | 328 | 100.0% |
Internet Access in St Jo
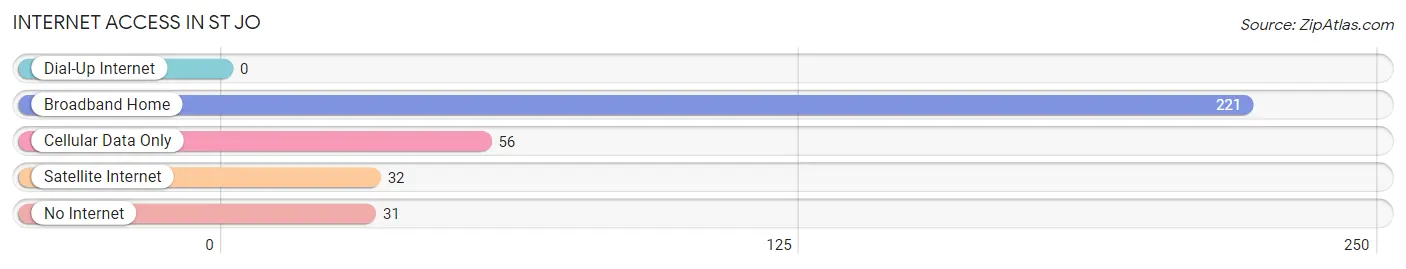
| Internet Type | # Households | % Households |
| Dial-Up Internet | 0 | 0.0% |
| Broadband Home | 221 | 67.4% |
| Cellular Data Only | 56 | 17.1% |
| Satellite Internet | 32 | 9.8% |
| No Internet | 31 | 9.5% |
| Total | 328 | 100.0% |
St Jo Summary
St Jo, Texas is a small town located in Montague County, Texas. It is situated on the banks of the Red River, approximately 90 miles northwest of Dallas. The town was founded in 1876 and has a population of approximately 1,000 people.
History
St Jo was founded in 1876 by a group of settlers from Missouri. The town was named after St. Joseph, Missouri, the hometown of the settlers. The town was originally a farming community, but soon became a trading center for the surrounding area. The town was incorporated in 1882 and the first post office was established in 1883.
In the early 1900s, St Jo began to experience a period of growth and development. The town was connected to the railroad in 1906, which allowed for increased trade and commerce. The town also became a popular tourist destination, with many people visiting to take advantage of the nearby fishing and hunting opportunities.
In the 1920s, St Jo experienced a period of decline due to the Great Depression. The town was unable to recover and the population began to decline. In the 1950s, the town began to experience a resurgence in population and economic activity. The town was connected to the interstate highway system in the 1960s, which allowed for increased trade and commerce.
Geography
St Jo is located in Montague County, Texas. It is situated on the banks of the Red River, approximately 90 miles northwest of Dallas. The town is located in a rural area, with the nearest major city being Wichita Falls, Texas. The town is surrounded by rolling hills and farmland.
The climate in St Jo is generally mild, with hot summers and cool winters. The average annual temperature is around 70 degrees Fahrenheit. The town receives an average of 33 inches of rain per year.
Economy
The economy of St Jo is largely based on agriculture and tourism. The town is home to several farms, which produce a variety of crops, including cotton, corn, and wheat. The town is also home to several tourist attractions, including the Red River Valley Museum and the St Jo Historical Society.
The town is also home to several small businesses, including restaurants, retail stores, and service providers. The town is also home to a small airport, which serves the surrounding area.
Demographics
As of the 2010 census, the population of St Jo was 1,000 people. The racial makeup of the town was 97.2% White, 0.7% African American, 0.3% Native American, 0.2% Asian, and 1.6% from other races. The median household income was $37,500 and the median family income was $41,250.
Conclusion
St Jo, Texas is a small town located in Montague County, Texas. It is situated on the banks of the Red River, approximately 90 miles northwest of Dallas. The town was founded in 1876 and has a population of approximately 1,000 people. The economy of St Jo is largely based on agriculture and tourism. The town is home to several farms, which produce a variety of crops, including cotton, corn, and wheat. The town is also home to several tourist attractions, including the Red River Valley Museum and the St Jo Historical Society. The town is also home to several small businesses, including restaurants, retail stores, and service providers. The town is also home to a small airport, which serves the surrounding area. As of the 2010 census, the population of St Jo was 1,000 people. The racial makeup of the town was 97.2% White, 0.7% African American, 0.3% Native American, 0.2% Asian, and 1.6% from other races. The median household income was $37,500 and the median family income was $41,250.
Common Questions
What is Per Capita Income in St Jo?
Per Capita income in St Jo is $25,678.
What is the Median Family Income in St Jo?
Median Family Income in St Jo is $87,917.
What is the Median Household income in St Jo?
Median Household Income in St Jo is $75,125.
What is Income or Wage Gap in St Jo?
Income or Wage Gap in St Jo is 36.6%.
Women in St Jo earn 63.4 cents for every dollar earned by a man.
What is Inequality or Gini Index in St Jo?
Inequality or Gini Index in St Jo is 0.36.
What is the Total Population of St Jo?
Total Population of St Jo is 904.
What is the Total Male Population of St Jo?
Total Male Population of St Jo is 433.
What is the Total Female Population of St Jo?
Total Female Population of St Jo is 471.
What is the Ratio of Males per 100 Females in St Jo?
There are 91.93 Males per 100 Females in St Jo.
What is the Ratio of Females per 100 Males in St Jo?
There are 108.78 Females per 100 Males in St Jo.
What is the Median Population Age in St Jo?
Median Population Age in St Jo is 34.5 Years.
What is the Average Family Size in St Jo
Average Family Size in St Jo is 3.4 People.
What is the Average Household Size in St Jo
Average Household Size in St Jo is 2.8 People.
How Large is the Labor Force in St Jo?
There are 374 People in the Labor Forcein in St Jo.
What is the Percentage of People in the Labor Force in St Jo?
60.8% of People are in the Labor Force in St Jo.
What is the Unemployment Rate in St Jo?
Unemployment Rate in St Jo is 4.0%.