Zip Codes with the Lowest Poverty Level Among Children Under the Age of 5 in Houston, TX
RELATED REPORTS & OPTIONS
Lowest Poverty | Child 0-5
Houston
Compare Zip Codes
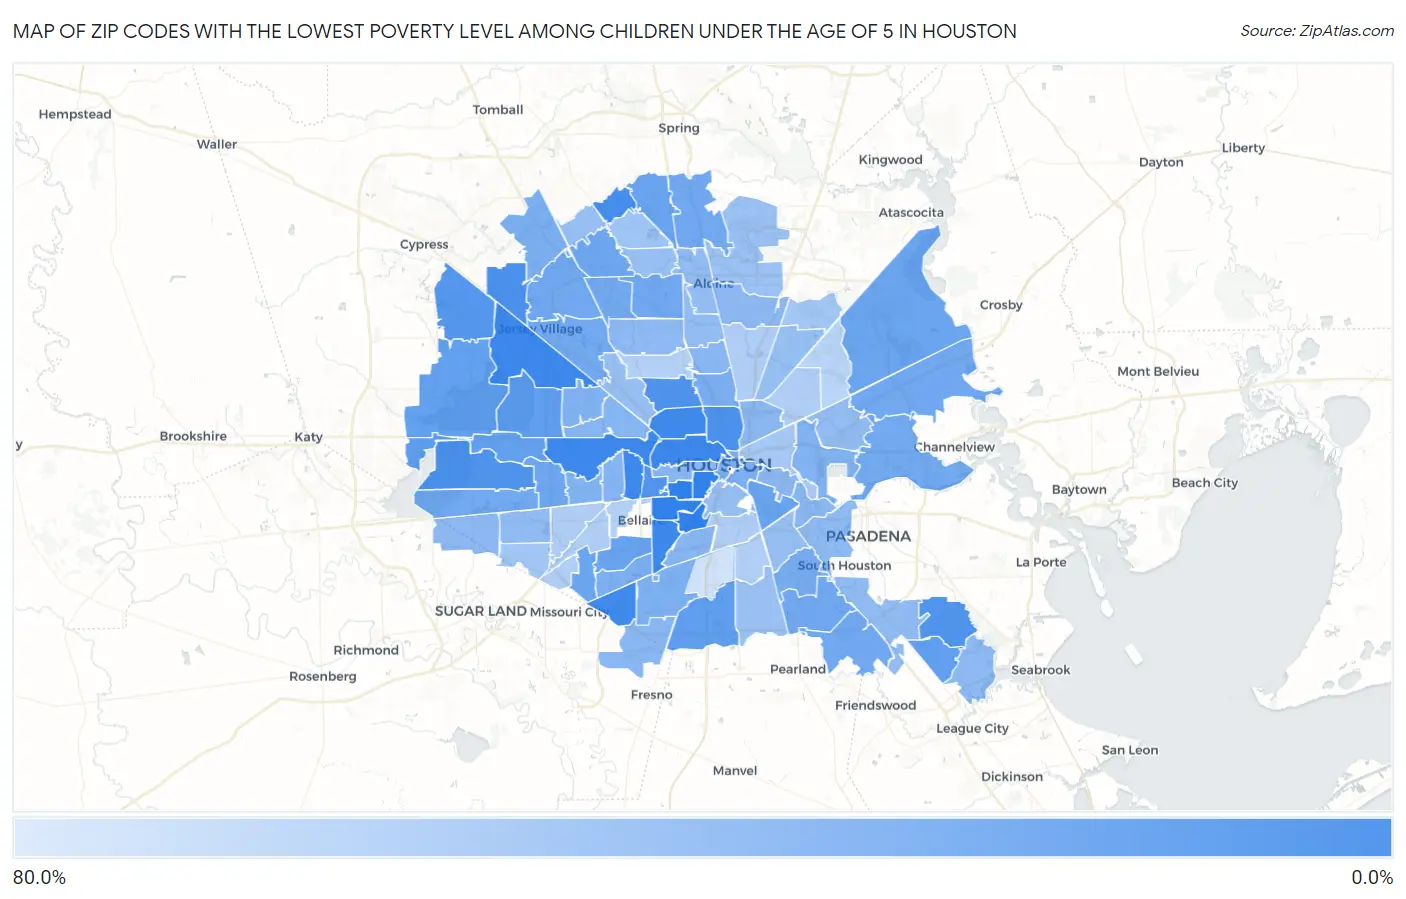
Map of Zip Codes with the Lowest Poverty Level Among Children Under the Age of 5 in Houston
73.8%
1.8%
Zip Codes with the Lowest Poverty Level Among Children Under the Age of 5 in Houston, TX
| Zip Code | Child Poverty | vs State | vs National | |
| 1. | 77056 | 1.8% | 21.1%(-19.3)#33 | 18.1%(-16.2)#718 |
| 2. | 77041 | 1.8% | 21.1%(-19.2)#34 | 18.1%(-16.2)#734 |
| 3. | 77007 | 1.9% | 21.1%(-19.2)#36 | 18.1%(-16.2)#766 |
| 4. | 77024 | 2.1% | 21.1%(-18.9)#39 | 18.1%(-15.9)#934 |
| 5. | 77008 | 2.2% | 21.1%(-18.8)#40 | 18.1%(-15.8)#1,001 |
| 6. | 77025 | 2.7% | 21.1%(-18.4)#54 | 18.1%(-15.4)#1,288 |
| 7. | 77085 | 3.2% | 21.1%(-17.9)#70 | 18.1%(-14.9)#1,617 |
| 8. | 77068 | 5.2% | 21.1%(-15.9)#140 | 18.1%(-12.9)#3,034 |
| 9. | 77065 | 7.8% | 21.1%(-13.3)#232 | 18.1%(-10.3)#4,796 |
| 10. | 77009 | 8.2% | 21.1%(-12.9)#244 | 18.1%(-9.86)#5,037 |
| 11. | 77077 | 8.6% | 21.1%(-12.5)#257 | 18.1%(-9.45)#5,343 |
| 12. | 77018 | 8.8% | 21.1%(-12.3)#262 | 18.1%(-9.26)#5,479 |
| 13. | 77059 | 10.1% | 21.1%(-11.0)#307 | 18.1%(-7.98)#6,312 |
| 14. | 77027 | 10.8% | 21.1%(-10.3)#333 | 18.1%(-7.29)#6,708 |
| 15. | 77095 | 11.4% | 21.1%(-9.73)#355 | 18.1%(-6.71)#7,063 |
| 16. | 77094 | 14.9% | 21.1%(-6.23)#484 | 18.1%(-3.21)#9,118 |
| 17. | 77047 | 16.2% | 21.1%(-4.84)#543 | 18.1%(-1.81)#9,883 |
| 18. | 77043 | 16.6% | 21.1%(-4.51)#554 | 18.1%(-1.49)#10,066 |
| 19. | 77062 | 16.6% | 21.1%(-4.49)#555 | 18.1%(-1.47)#10,076 |
| 20. | 77084 | 16.7% | 21.1%(-4.39)#559 | 18.1%(-1.37)#10,145 |
| 21. | 77079 | 17.2% | 21.1%(-3.91)#569 | 18.1%(-0.888)#10,330 |
| 22. | 77023 | 19.6% | 21.1%(-1.44)#637 | 18.1%(+1.59)#11,469 |
| 23. | 77090 | 20.1% | 21.1%(-0.946)#650 | 18.1%(+2.08)#11,712 |
| 24. | 77096 | 20.2% | 21.1%(-0.896)#651 | 18.1%(+2.13)#11,726 |
| 25. | 77044 | 21.1% | 21.1%(+0.025)#676 | 18.1%(+3.05)#12,124 |
| 26. | 77071 | 21.3% | 21.1%(+0.224)#681 | 18.1%(+3.25)#12,193 |
| 27. | 77042 | 21.9% | 21.1%(+0.828)#696 | 18.1%(+3.85)#12,442 |
| 28. | 77066 | 22.1% | 21.1%(+0.990)#700 | 18.1%(+4.01)#12,508 |
| 29. | 77089 | 22.7% | 21.1%(+1.63)#716 | 18.1%(+4.65)#12,791 |
| 30. | 77038 | 22.7% | 21.1%(+1.66)#717 | 18.1%(+4.68)#12,810 |
| 31. | 77064 | 22.9% | 21.1%(+1.85)#720 | 18.1%(+4.88)#12,884 |
| 32. | 77073 | 23.0% | 21.1%(+1.87)#721 | 18.1%(+4.89)#12,886 |
| 33. | 77049 | 23.0% | 21.1%(+1.91)#722 | 18.1%(+4.93)#12,902 |
| 34. | 77075 | 23.2% | 21.1%(+2.12)#730 | 18.1%(+5.14)#12,989 |
| 35. | 77086 | 23.5% | 21.1%(+2.46)#739 | 18.1%(+5.48)#13,118 |
| 36. | 77040 | 23.7% | 21.1%(+2.63)#747 | 18.1%(+5.65)#13,192 |
| 37. | 77082 | 23.9% | 21.1%(+2.81)#754 | 18.1%(+5.83)#13,274 |
| 38. | 77015 | 23.9% | 21.1%(+2.86)#755 | 18.1%(+5.89)#13,305 |
| 39. | 77061 | 25.8% | 21.1%(+4.70)#793 | 18.1%(+7.72)#13,958 |
| 40. | 77022 | 27.3% | 21.1%(+6.26)#838 | 18.1%(+9.29)#14,487 |
| 41. | 77070 | 28.2% | 21.1%(+7.09)#864 | 18.1%(+10.1)#14,749 |
| 42. | 77002 | 28.2% | 21.1%(+7.15)#866 | 18.1%(+10.2)#14,768 |
| 43. | 77003 | 29.4% | 21.1%(+8.36)#902 | 18.1%(+11.4)#15,155 |
| 44. | 77045 | 29.6% | 21.1%(+8.50)#905 | 18.1%(+11.5)#15,186 |
| 45. | 77035 | 29.7% | 21.1%(+8.62)#908 | 18.1%(+11.6)#15,225 |
| 46. | 77029 | 29.9% | 21.1%(+8.79)#913 | 18.1%(+11.8)#15,288 |
| 47. | 77063 | 30.0% | 21.1%(+8.93)#919 | 18.1%(+12.0)#15,336 |
| 48. | 77080 | 30.8% | 21.1%(+9.75)#941 | 18.1%(+12.8)#15,535 |
| 49. | 77055 | 32.0% | 21.1%(+10.9)#963 | 18.1%(+14.0)#15,835 |
| 50. | 77057 | 32.1% | 21.1%(+11.0)#965 | 18.1%(+14.0)#15,850 |
| 51. | 77076 | 33.4% | 21.1%(+12.3)#989 | 18.1%(+15.3)#16,244 |
| 52. | 77019 | 33.6% | 21.1%(+12.5)#998 | 18.1%(+15.6)#16,285 |
| 53. | 77054 | 33.7% | 21.1%(+12.7)#1,002 | 18.1%(+15.7)#16,311 |
| 54. | 77053 | 34.6% | 21.1%(+13.5)#1,019 | 18.1%(+16.6)#16,513 |
| 55. | 77026 | 34.7% | 21.1%(+13.7)#1,020 | 18.1%(+16.7)#16,540 |
| 56. | 77011 | 34.9% | 21.1%(+13.8)#1,023 | 18.1%(+16.8)#16,579 |
| 57. | 77012 | 34.9% | 21.1%(+13.8)#1,025 | 18.1%(+16.9)#16,586 |
| 58. | 77083 | 35.4% | 21.1%(+14.3)#1,031 | 18.1%(+17.3)#16,692 |
| 59. | 77039 | 35.6% | 21.1%(+14.5)#1,039 | 18.1%(+17.6)#16,751 |
| 60. | 77088 | 36.9% | 21.1%(+15.8)#1,057 | 18.1%(+18.8)#17,056 |
| 61. | 77058 | 37.1% | 21.1%(+16.0)#1,060 | 18.1%(+19.0)#17,091 |
| 62. | 77017 | 37.4% | 21.1%(+16.4)#1,065 | 18.1%(+19.4)#17,159 |
| 63. | 77072 | 38.0% | 21.1%(+16.9)#1,071 | 18.1%(+19.9)#17,260 |
| 64. | 77034 | 38.3% | 21.1%(+17.2)#1,077 | 18.1%(+20.2)#17,325 |
| 65. | 77013 | 38.7% | 21.1%(+17.6)#1,085 | 18.1%(+20.7)#17,411 |
| 66. | 77060 | 38.9% | 21.1%(+17.8)#1,088 | 18.1%(+20.8)#17,436 |
| 67. | 77037 | 39.0% | 21.1%(+17.9)#1,090 | 18.1%(+20.9)#17,454 |
| 68. | 77004 | 39.9% | 21.1%(+18.9)#1,107 | 18.1%(+21.9)#17,625 |
| 69. | 77016 | 40.5% | 21.1%(+19.4)#1,112 | 18.1%(+22.5)#17,742 |
| 70. | 77067 | 41.1% | 21.1%(+20.0)#1,129 | 18.1%(+23.0)#17,860 |
| 71. | 77092 | 41.3% | 21.1%(+20.2)#1,131 | 18.1%(+23.3)#17,896 |
| 72. | 77087 | 41.3% | 21.1%(+20.2)#1,132 | 18.1%(+23.3)#17,899 |
| 73. | 77069 | 41.6% | 21.1%(+20.5)#1,138 | 18.1%(+23.5)#17,944 |
| 74. | 77048 | 42.3% | 21.1%(+21.2)#1,151 | 18.1%(+24.2)#18,057 |
| 75. | 77032 | 44.2% | 21.1%(+23.1)#1,173 | 18.1%(+26.1)#18,360 |
| 76. | 77014 | 45.3% | 21.1%(+24.2)#1,186 | 18.1%(+27.2)#18,535 |
| 77. | 77050 | 47.0% | 21.1%(+25.9)#1,201 | 18.1%(+29.0)#18,750 |
| 78. | 77099 | 47.9% | 21.1%(+26.8)#1,208 | 18.1%(+29.8)#18,852 |
| 79. | 77020 | 48.8% | 21.1%(+27.7)#1,212 | 18.1%(+30.8)#18,957 |
| 80. | 77074 | 53.1% | 21.1%(+32.1)#1,238 | 18.1%(+35.1)#19,435 |
| 81. | 77031 | 53.2% | 21.1%(+32.1)#1,239 | 18.1%(+35.1)#19,436 |
| 82. | 77036 | 53.9% | 21.1%(+32.8)#1,243 | 18.1%(+35.8)#19,519 |
| 83. | 77021 | 54.0% | 21.1%(+32.9)#1,244 | 18.1%(+35.9)#19,527 |
| 84. | 77028 | 54.0% | 21.1%(+32.9)#1,245 | 18.1%(+35.9)#19,531 |
| 85. | 77093 | 54.2% | 21.1%(+33.1)#1,246 | 18.1%(+36.2)#19,549 |
| 86. | 77033 | 55.0% | 21.1%(+34.0)#1,248 | 18.1%(+37.0)#19,606 |
| 87. | 77081 | 55.7% | 21.1%(+34.6)#1,254 | 18.1%(+37.7)#19,663 |
| 88. | 77091 | 56.5% | 21.1%(+35.4)#1,259 | 18.1%(+38.5)#19,730 |
| 89. | 77078 | 60.3% | 21.1%(+39.2)#1,279 | 18.1%(+42.2)#20,013 |
| 90. | 77051 | 73.8% | 21.1%(+52.8)#1,317 | 18.1%(+55.8)#20,659 |
1
Common Questions
What are the Top 10 Zip Codes with the Lowest Poverty Level Among Children Under the Age of 5 in Houston, TX?
Top 10 Zip Codes with the Lowest Poverty Level Among Children Under the Age of 5 in Houston, TX are:
What zip code has the Lowest Poverty Level Among Children Under the Age of 5 in Houston, TX?
77056 has the Lowest Poverty Level Among Children Under the Age of 5 in Houston, TX with 1.8%.
What is the Poverty Level Among Children Under the Age of 5 in Houston, TX?
Poverty Level Among Children Under the Age of 5 in Houston is 31.0%.
What is the Poverty Level Among Children Under the Age of 5 in Texas?
Poverty Level Among Children Under the Age of 5 in Texas is 21.1%.
What is the Poverty Level Among Children Under the Age of 5 in the United States?
Poverty Level Among Children Under the Age of 5 in the United States is 18.1%.