Zip Codes with the Lowest Poverty Level Among Children Under the Age of 5 in Arlington, TX

RELATED REPORTS & OPTIONS

Lowest Poverty | Child 0-5
Population
Families and Households
Female Fertility
Female Fertility (Unmarried)
Race (Community Size)
Race (Percentage)
Ancestry (Community Size)
AfghanAfricanAlaska NativeAlbanianAmericanApacheArabArapahoArgentineanArmenianAustrianBarbadianBasqueBelgianBelizeanBhutaneseBlackfeetBrazilianBritishBulgarianBurmeseCajunCanadianCelticCentral AmericanCentral American IndianCherokeeChickasawChileanChoctawColombianComancheCosta RicanCreekCroatianCubanCzechCzechoslovakianDanishDominicanDutchEastern EuropeanEcuadorianEgyptianEnglishEthiopianEuropeanFilipinoFinnishFrenchFrench CanadianGermanGhanaianGreekGuamanian / ChamorroGuatemalanGuyaneseHaitianHonduranHungarianIndian (Asian)IndonesianIranianIraqiIrishIroquoisIsraeliItalianJamaicanJapaneseJordanianKenyanKiowaKoreanLaotianLebaneseLiberianLithuanianMalaysianMexicanMexican American IndianMongolianMoroccanNative HawaiianNavajoNicaraguanNigerianNorthern EuropeanNorwegianOsagePakistaniPalestinianPanamanianPeruvianPolishPortuguesePuerto RicanRomanianRussianSalvadoranSamoanScandinavianScotch-IrishScottishSerbianSiouxSlavicSlovakSloveneSomaliSouth AmericanSpaniardSpanishSri LankanSubsaharan AfricanSudaneseSwedishSwissSyrianThaiTonganTrinidadian and TobagonianTurkishUkrainianUruguayanVenezuelanVietnameseWelshWest IndianYaqui
Ancestry (Percentage)
AfghanAfricanAlaska NativeAlbanianAmericanApacheArabArapahoArgentineanArmenianAustrianBarbadianBasqueBelgianBelizeanBhutaneseBlackfeetBrazilianBritishBulgarianBurmeseCajunCanadianCelticCentral AmericanCentral American IndianCherokeeChickasawChileanChoctawColombianComancheCosta RicanCreekCroatianCubanCzechCzechoslovakianDanishDominicanDutchEastern EuropeanEcuadorianEgyptianEnglishEthiopianEuropeanFilipinoFinnishFrenchFrench CanadianGermanGhanaianGreekGuamanian / ChamorroGuatemalanGuyaneseHaitianHonduranHungarianIndian (Asian)IndonesianIranianIraqiIrishIroquoisIsraeliItalianJamaicanJapaneseJordanianKenyanKiowaKoreanLaotianLebaneseLiberianLithuanianMalaysianMexicanMexican American IndianMongolianMoroccanNative HawaiianNavajoNicaraguanNigerianNorthern EuropeanNorwegianOsagePakistaniPalestinianPanamanianPeruvianPolishPortuguesePuerto RicanRomanianRussianSalvadoranSamoanScandinavianScotch-IrishScottishSerbianSiouxSlavicSlovakSloveneSomaliSouth AmericanSpaniardSpanishSri LankanSubsaharan AfricanSudaneseSwedishSwissSyrianThaiTonganTrinidadian and TobagonianTurkishUkrainianUruguayanVenezuelanVietnameseWelshWest IndianYaqui
Immigrant Origin (Total)
AfghanistanAfricaArgentinaAsiaBangladeshBelgiumBelizeBrazilBurma / MyanmarCambodiaCameroonCanadaCaribbeanCentral AmericaChinaColombiaCongoCubaCzechoslovakiaDominican RepublicEastern AfricaEastern AsiaEastern EuropeEcuadorEgyptEl SalvadorEnglandEthiopiaEuropeFranceGermanyGhanaGreeceGuatemalaHaitiHondurasHong KongHungaryIndiaIndonesiaIranIraqIrelandIsraelItalyJamaicaJapanJordanKenyaKoreaKuwaitLatin AmericaLebanonLiberiaMalaysiaMexicoMiddle AfricaMoroccoNepalNetherlandsNicaraguaNigeriaNorthern AfricaNorthern EuropeOceaniaPakistanPanamaPeruPhilippinesPolandRomaniaRussiaSaudi ArabiaSenegalSomaliaSouth AfricaSouth AmericaSouth Central AsiaSouth Eastern AsiaSouthern EuropeSpainSri LankaSudanSwedenSyriaTaiwanThailandTrinidad and TobagoTurkeyUgandaUkraineVenezuelaVietnamWestern AfricaWestern AsiaWestern EuropeZaireZimbabwe
Immigrant Origin (Percentage)
AfghanistanAfricaArgentinaAsiaBangladeshBelgiumBelizeBrazilBurma / MyanmarCambodiaCameroonCanadaCaribbeanCentral AmericaChinaColombiaCongoCubaCzechoslovakiaDominican RepublicEastern AfricaEastern AsiaEastern EuropeEcuadorEgyptEl SalvadorEnglandEthiopiaEuropeFranceGermanyGhanaGreeceGuatemalaHaitiHondurasHong KongHungaryIndiaIndonesiaIranIraqIrelandIsraelItalyJamaicaJapanJordanKenyaKoreaKuwaitLatin AmericaLebanonLiberiaMalaysiaMexicoMiddle AfricaMoroccoNepalNetherlandsNicaraguaNigeriaNorthern AfricaNorthern EuropeOceaniaPakistanPanamaPeruPhilippinesPolandRomaniaRussiaSaudi ArabiaSenegalSomaliaSouth AfricaSouth AmericaSouth Central AsiaSouth Eastern AsiaSouthern EuropeSpainSri LankaSudanSwedenSyriaTaiwanThailandTrinidad and TobagoTurkeyUgandaUkraineVenezuelaVietnamWestern AfricaWestern AsiaWestern EuropeZaireZimbabwe
Income
Income (Families)
Income (Households)
Poverty
Poverty (Families)
Unemployment
Employment Occupations
Employment Industries
Employer Class
Commute Time
Commute Means
School Enrollment
Education by Degree Field
Occupancy
Finances
Physical Characteristics
Arlington
Compare Zip Codes
Comparison Subject

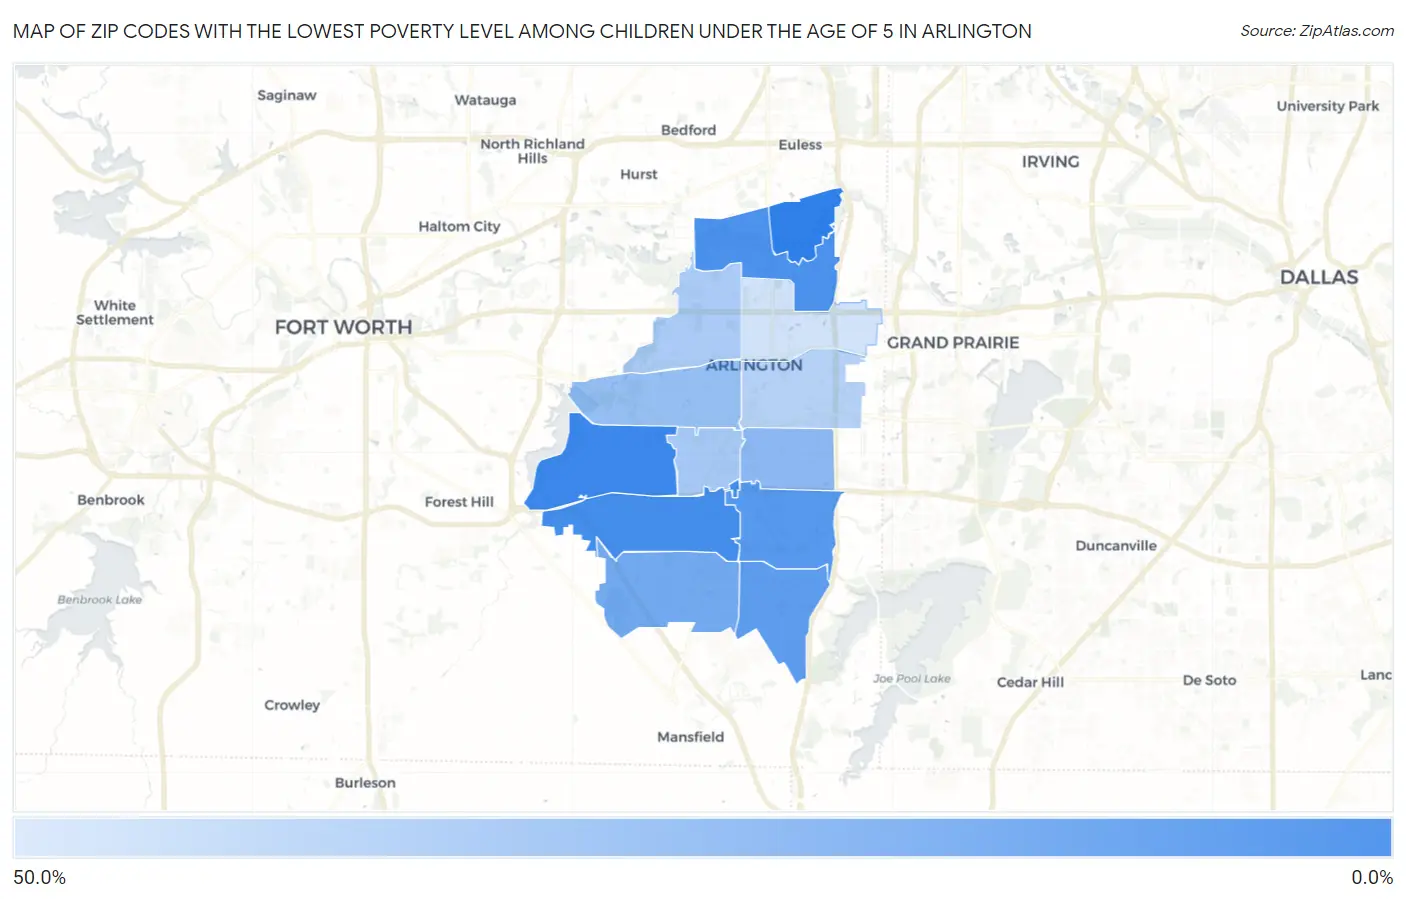
Map of Zip Codes with the Lowest Poverty Level Among Children Under the Age of 5 in Arlington

50.0%
0.0%
Zip Codes with the Lowest Poverty Level Among Children Under the Age of 5 in Arlington Map

Zip Codes with the Lowest Poverty Level Among Children Under the Age of 5 in Arlington, TX

Zip Code Child Poverty vs State vs National
1.760166.2%21.1%(-14.9)#17118.1%(-11.9)#3,729
2.760178.3%21.1%(-12.8)#24718.1%(-9.80)#5,081
3.760069.9%21.1%(-11.2)#29918.1%(-8.14)#6,201
4.7601812.4%21.1%(-8.68)#40318.1%(-5.66)#7,708
5.7600213.8%21.1%(-7.29)#44518.1%(-4.26)#8,515
6.7600118.8%21.1%(-2.29)#61418.1%(+0.733)#11,081
7.7601424.9%21.1%(+3.82)#77418.1%(+6.84)#13,611
8.7601327.3%21.1%(+6.23)#83618.1%(+9.25)#14,468
9.7601531.6%21.1%(+10.5)#95318.1%(+13.5)#15,743
10.7601232.6%21.1%(+11.5)#97118.1%(+14.5)#15,966
11.7601035.7%21.1%(+14.6)#1,04118.1%(+17.6)#16,763
12.7601143.6%21.1%(+22.6)#1,16418.1%(+25.6)#18,277

Common Questions

What are the Top 10 Zip Codes with the Lowest Poverty Level Among Children Under the Age of 5 in Arlington, TX?
Top 10 Zip Codes with the Lowest Poverty Level Among Children Under the Age of 5 in Arlington, TX are:
#1
0.0%
#2
6.2%
#3
8.3%
#4
9.9%
#5
12.4%
#6
13.8%
#7
18.8%
#8
24.9%
#9
27.3%
#10
31.6%
What zip code has the Lowest Poverty Level Among Children Under the Age of 5 in Arlington, TX?
76016 has the Lowest Poverty Level Among Children Under the Age of 5 in Arlington, TX with 6.2%.
What is the Poverty Level Among Children Under the Age of 5 in Arlington, TX?
Poverty Level Among Children Under the Age of 5 in Arlington is 23.2%.
What is the Poverty Level Among Children Under the Age of 5 in Texas?
Poverty Level Among Children Under the Age of 5 in Texas is 21.1%.
What is the Poverty Level Among Children Under the Age of 5 in the United States?
Poverty Level Among Children Under the Age of 5 in the United States is 18.1%.