Bellville, TX Map & Demographics
Bellville Map
Bellville Overview
$30,119
PER CAPITA INCOME
$88,100
AVG FAMILY INCOME
$61,500
AVG HOUSEHOLD INCOME
19.0%
WAGE / INCOME GAP [ % ]
81.0¢/ $1
WAGE / INCOME GAP [ $ ]
0.44
INEQUALITY / GINI INDEX
4,200
TOTAL POPULATION
2,194
MALE POPULATION
2,006
FEMALE POPULATION
109.37
MALES / 100 FEMALES
91.43
FEMALES / 100 MALES
40.4
MEDIAN AGE
3.4
AVG FAMILY SIZE
2.6
AVG HOUSEHOLD SIZE
1,891
LABOR FORCE [ PEOPLE ]
57.4%
PERCENT IN LABOR FORCE
Bellville Zip Codes
Bellville Area Codes
Income in Bellville
Income Overview in Bellville
Per Capita Income in Bellville is $30,119, while median incomes of families and households are $88,100 and $61,500 respectively.
| Characteristic | Number | Measure |
| Per Capita Income | 4,200 | $30,119 |
| Median Family Income | 988 | $88,100 |
| Mean Family Income | 988 | $103,879 |
| Median Household Income | 1,548 | $61,500 |
| Mean Household Income | 1,548 | $78,643 |
| Income Deficit | 988 | $0 |
| Wage / Income Gap (%) | 4,200 | 18.99% |
| Wage / Income Gap ($) | 4,200 | 81.01¢ per $1 |
| Gini / Inequality Index | 4,200 | 0.44 |
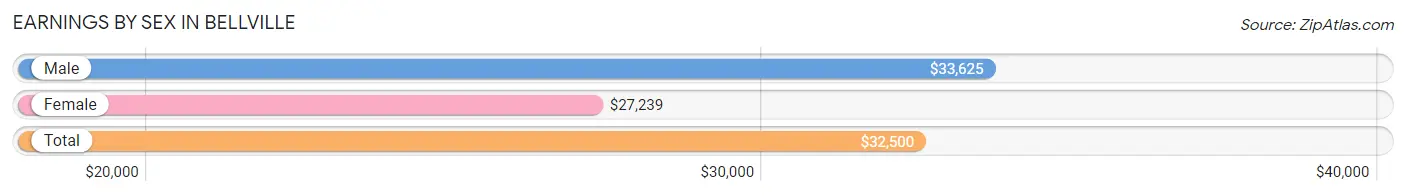
Earnings by Sex in Bellville
Average Earnings in Bellville are $32,500, $33,625 for men and $27,239 for women, a difference of 19.0%.
| Sex | Number | Average Earnings |
| Male | 1,096 (56.4%) | $33,625 |
| Female | 846 (43.6%) | $27,239 |
| Total | 1,942 (100.0%) | $32,500 |
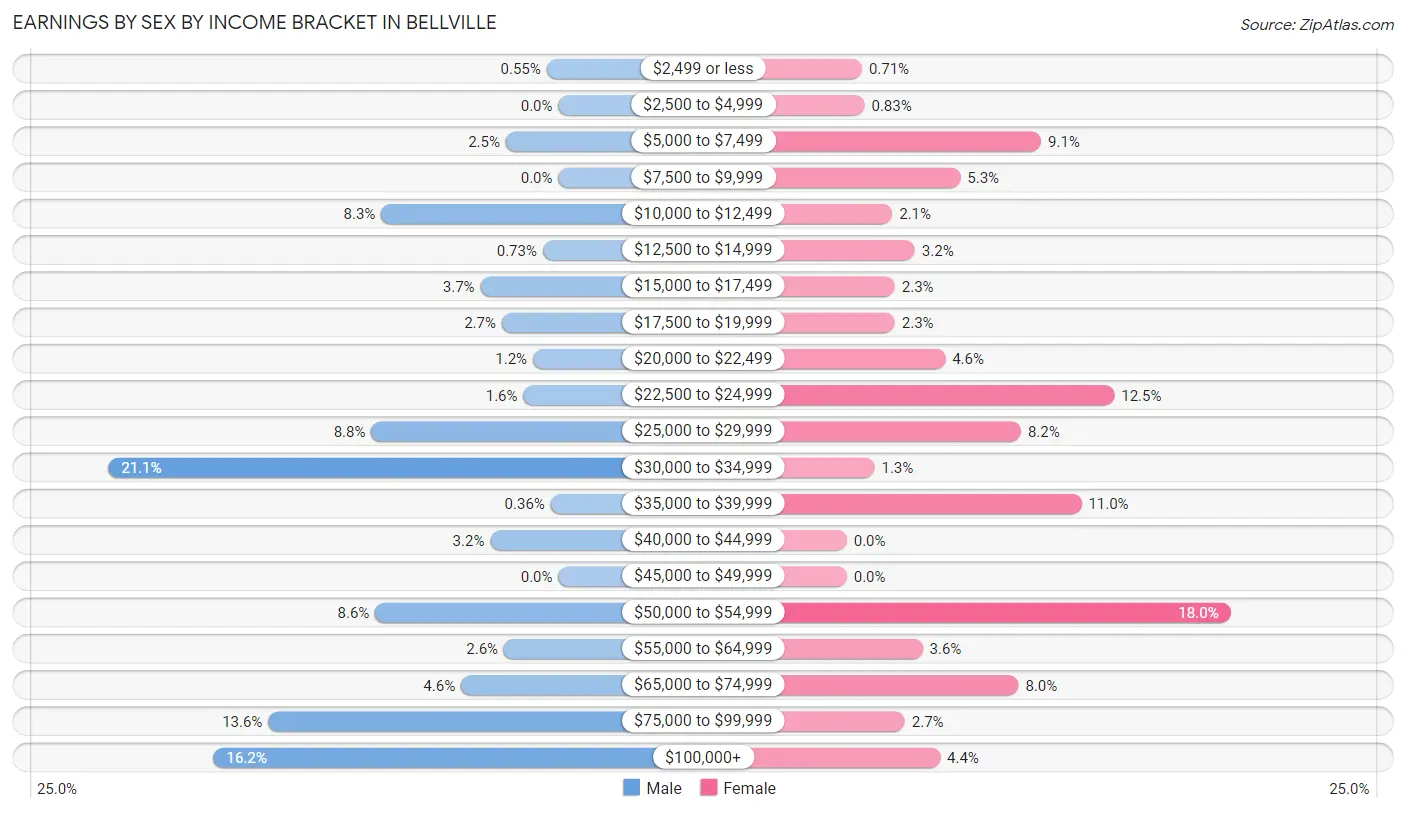
Earnings by Sex by Income Bracket in Bellville
The most common earnings brackets in Bellville are $30,000 to $34,999 for men (231 | 21.1%) and $50,000 to $54,999 for women (152 | 18.0%).
| Income | Male | Female |
| $2,499 or less | 6 (0.5%) | 6 (0.7%) |
| $2,500 to $4,999 | 0 (0.0%) | 7 (0.8%) |
| $5,000 to $7,499 | 27 (2.5%) | 77 (9.1%) |
| $7,500 to $9,999 | 0 (0.0%) | 45 (5.3%) |
| $10,000 to $12,499 | 91 (8.3%) | 18 (2.1%) |
| $12,500 to $14,999 | 8 (0.7%) | 27 (3.2%) |
| $15,000 to $17,499 | 40 (3.6%) | 19 (2.2%) |
| $17,500 to $19,999 | 29 (2.6%) | 19 (2.2%) |
| $20,000 to $22,499 | 13 (1.2%) | 39 (4.6%) |
| $22,500 to $24,999 | 18 (1.6%) | 106 (12.5%) |
| $25,000 to $29,999 | 96 (8.8%) | 69 (8.2%) |
| $30,000 to $34,999 | 231 (21.1%) | 11 (1.3%) |
| $35,000 to $39,999 | 4 (0.4%) | 93 (11.0%) |
| $40,000 to $44,999 | 35 (3.2%) | 0 (0.0%) |
| $45,000 to $49,999 | 0 (0.0%) | 0 (0.0%) |
| $50,000 to $54,999 | 94 (8.6%) | 152 (18.0%) |
| $55,000 to $64,999 | 28 (2.5%) | 30 (3.5%) |
| $65,000 to $74,999 | 50 (4.6%) | 68 (8.0%) |
| $75,000 to $99,999 | 149 (13.6%) | 23 (2.7%) |
| $100,000+ | 177 (16.2%) | 37 (4.4%) |
| Total | 1,096 (100.0%) | 846 (100.0%) |
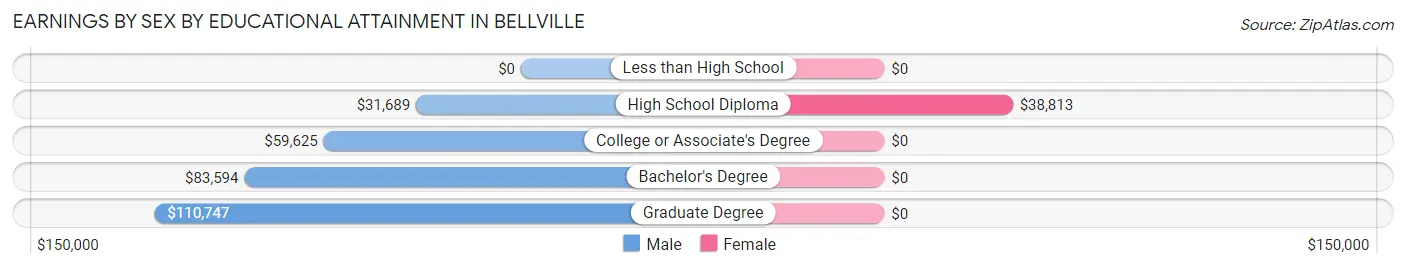
Earnings by Sex by Educational Attainment in Bellville
Average earnings in Bellville are $52,348 for men and $36,923 for women, a difference of 29.5%. Men with an educational attainment of graduate degree enjoy the highest average annual earnings of $110,747, while those with high school diploma education earn the least with $31,689. Women with an educational attainment of high school diploma earn the most with the average annual earnings of $38,813, while those with high school diploma education have the smallest earnings of $38,813.
| Educational Attainment | Male Income | Female Income |
| Less than High School | - | - |
| High School Diploma | $31,689 | $38,813 |
| College or Associate's Degree | $59,625 | $0 |
| Bachelor's Degree | $83,594 | $0 |
| Graduate Degree | $110,747 | $0 |
| Total | $52,348 | $36,923 |
Family Income in Bellville
Family Income Brackets in Bellville
According to the Bellville family income data, there are 343 families falling into the $50,000 to $74,999 income range, which is the most common income bracket and makes up 34.7% of all families.
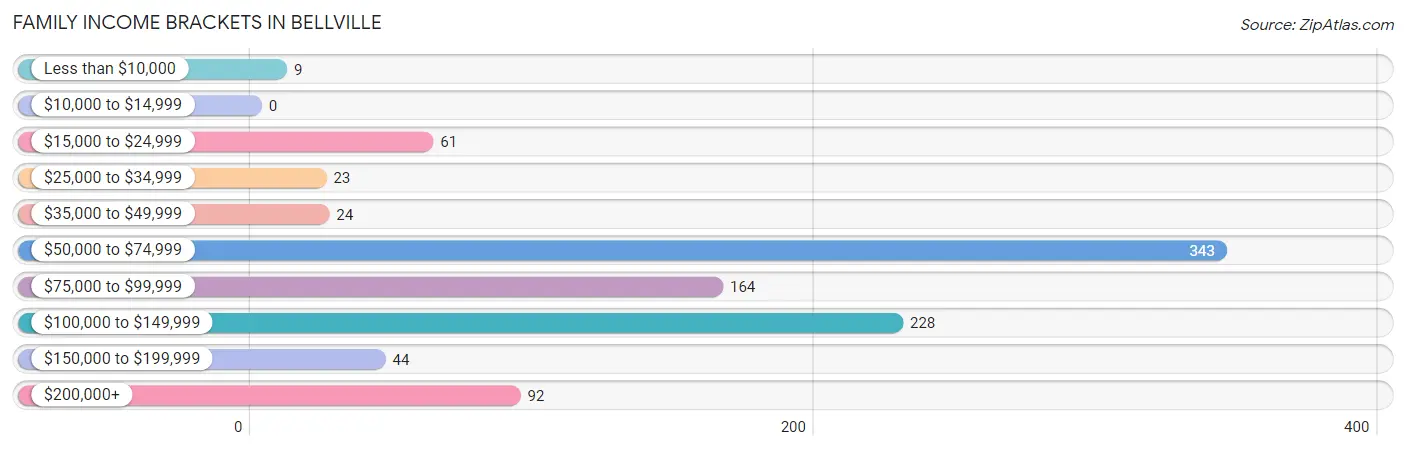
| Income Bracket | # Families | % Families |
| Less than $10,000 | 9 | 0.9% |
| $10,000 to $14,999 | 0 | 0.0% |
| $15,000 to $24,999 | 61 | 6.2% |
| $25,000 to $34,999 | 23 | 2.3% |
| $35,000 to $49,999 | 24 | 2.4% |
| $50,000 to $74,999 | 343 | 34.7% |
| $75,000 to $99,999 | 164 | 16.6% |
| $100,000 to $149,999 | 228 | 23.1% |
| $150,000 to $199,999 | 44 | 4.5% |
| $200,000+ | 92 | 9.3% |
Family Income by Famaliy Size in Bellville
4-person families (241 | 24.4%) account for the highest median family income in Bellville with $119,330 per family, while 2-person families (411 | 41.6%) have the highest median income of $43,580 per family member.
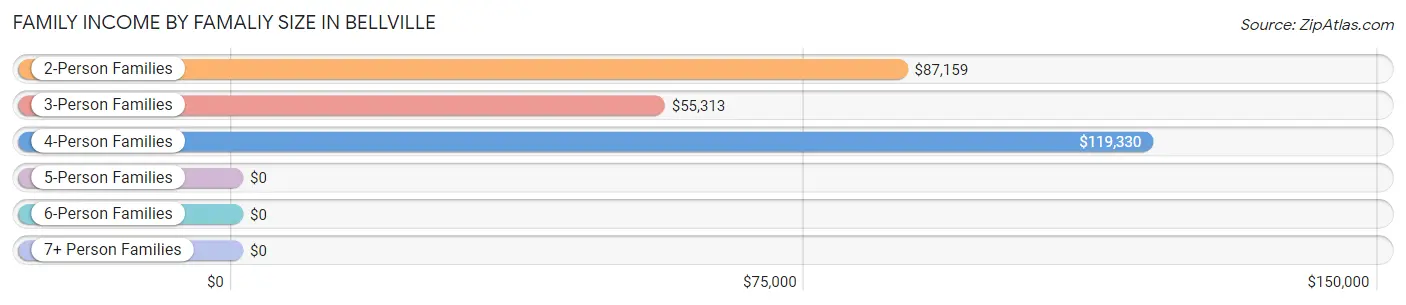
| Income Bracket | # Families | Median Income |
| 2-Person Families | 411 (41.6%) | $87,159 |
| 3-Person Families | 199 (20.1%) | $55,313 |
| 4-Person Families | 241 (24.4%) | $119,330 |
| 5-Person Families | 58 (5.9%) | $0 |
| 6-Person Families | 11 (1.1%) | $0 |
| 7+ Person Families | 68 (6.9%) | $0 |
| Total | 988 (100.0%) | $88,100 |
Family Income by Number of Earners in Bellville
The median family income in Bellville is $88,100, with families comprising 3+ earners (146) having the highest median family income of $143,900, while families with no earners (141) have the lowest median family income of $56,250, accounting for 14.8% and 14.3% of families, respectively.
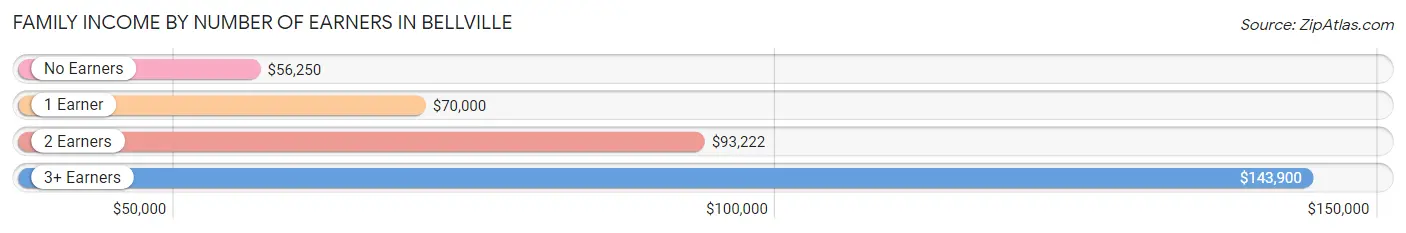
| Number of Earners | # Families | Median Income |
| No Earners | 141 (14.3%) | $56,250 |
| 1 Earner | 300 (30.4%) | $70,000 |
| 2 Earners | 401 (40.6%) | $93,222 |
| 3+ Earners | 146 (14.8%) | $143,900 |
| Total | 988 (100.0%) | $88,100 |
Household Income in Bellville
Household Income Brackets in Bellville
With 392 households falling in the category, the $50,000 to $74,999 income range is the most frequent in Bellville, accounting for 25.3% of all households. In contrast, only 43 households (2.8%) fall into the $150,000 to $199,999 income bracket, making it the least populous group.
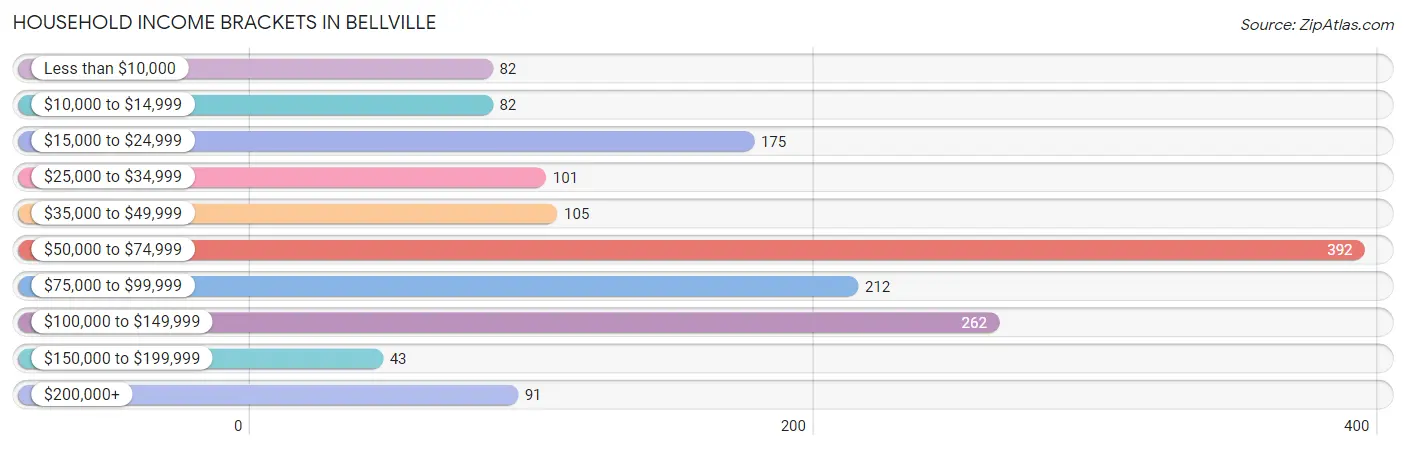
| Income Bracket | # Households | % Households |
| Less than $10,000 | 82 | 5.3% |
| $10,000 to $14,999 | 82 | 5.3% |
| $15,000 to $24,999 | 175 | 11.3% |
| $25,000 to $34,999 | 101 | 6.5% |
| $35,000 to $49,999 | 105 | 6.8% |
| $50,000 to $74,999 | 392 | 25.3% |
| $75,000 to $99,999 | 212 | 13.7% |
| $100,000 to $149,999 | 262 | 16.9% |
| $150,000 to $199,999 | 43 | 2.8% |
| $200,000+ | 91 | 5.9% |
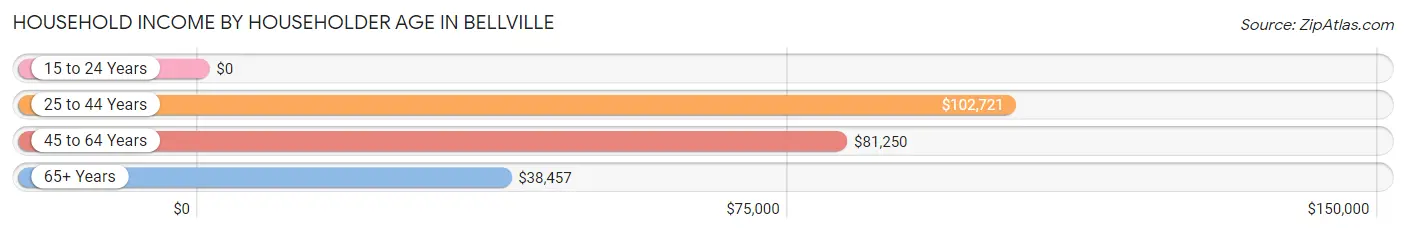
Household Income by Householder Age in Bellville
The median household income in Bellville is $61,500, with the highest median household income of $102,721 found in the 25 to 44 years age bracket for the primary householder. A total of 477 households (30.8%) fall into this category.
| Income Bracket | # Households | Median Income |
| 15 to 24 Years | 0 (0.0%) | $0 |
| 25 to 44 Years | 477 (30.8%) | $102,721 |
| 45 to 64 Years | 554 (35.8%) | $81,250 |
| 65+ Years | 517 (33.4%) | $38,457 |
| Total | 1,548 (100.0%) | $61,500 |
Poverty in Bellville
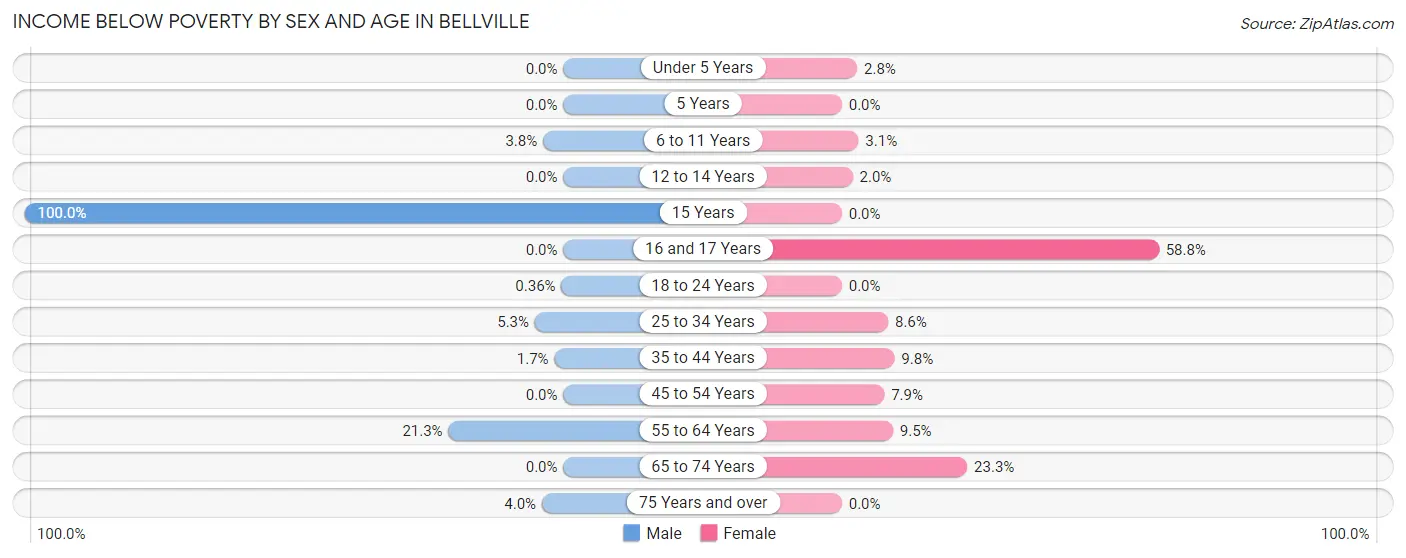
Income Below Poverty by Sex and Age in Bellville
With 5.9% poverty level for males and 9.4% for females among the residents of Bellville, 15 year old males and 16 and 17 year old females are the most vulnerable to poverty, with 21 males (100.0%) and 10 females (58.8%) in their respective age groups living below the poverty level.
| Age Bracket | Male | Female |
| Under 5 Years | 0 (0.0%) | 4 (2.8%) |
| 5 Years | 0 (0.0%) | 0 (0.0%) |
| 6 to 11 Years | 11 (3.8%) | 4 (3.1%) |
| 12 to 14 Years | 0 (0.0%) | 4 (2.0%) |
| 15 Years | 21 (100.0%) | 0 (0.0%) |
| 16 and 17 Years | 0 (0.0%) | 10 (58.8%) |
| 18 to 24 Years | 1 (0.4%) | 0 (0.0%) |
| 25 to 34 Years | 12 (5.3%) | 23 (8.6%) |
| 35 to 44 Years | 5 (1.7%) | 21 (9.8%) |
| 45 to 54 Years | 0 (0.0%) | 20 (7.9%) |
| 55 to 64 Years | 64 (21.3%) | 16 (9.5%) |
| 65 to 74 Years | 0 (0.0%) | 84 (23.3%) |
| 75 Years and over | 9 (4.0%) | 0 (0.0%) |
| Total | 123 (5.9%) | 186 (9.4%) |
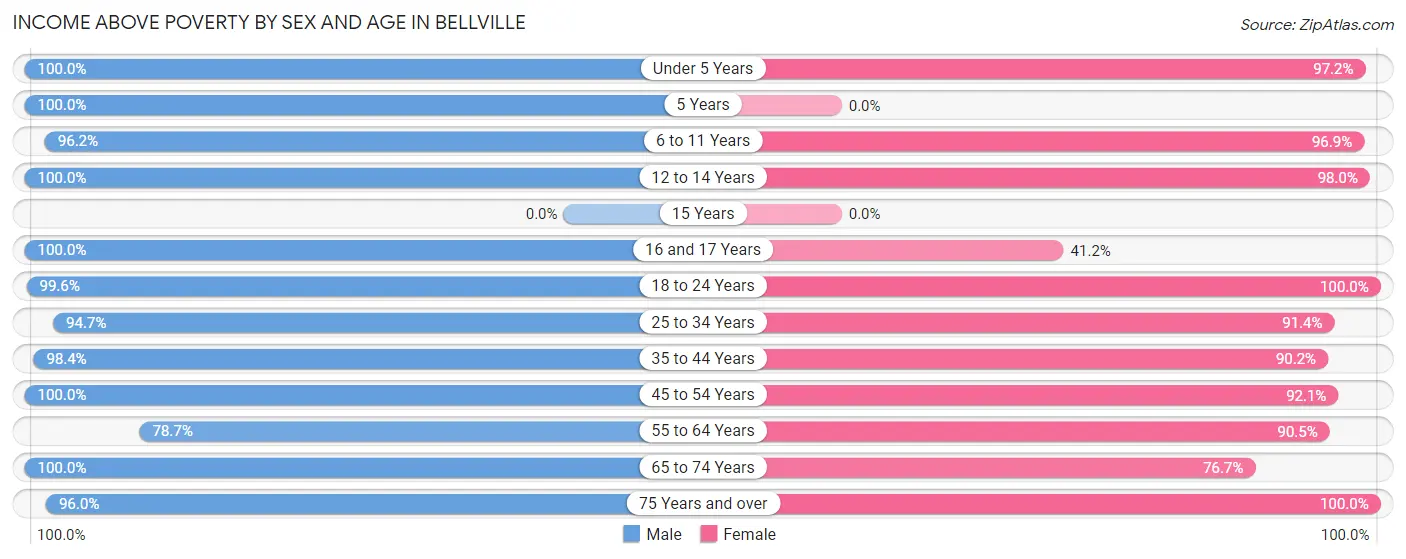
Income Above Poverty by Sex and Age in Bellville
According to the poverty statistics in Bellville, males aged under 5 years and females aged 18 to 24 years are the age groups that are most secure financially, with 100.0% of males and 100.0% of females in these age groups living above the poverty line.
| Age Bracket | Male | Female |
| Under 5 Years | 66 (100.0%) | 137 (97.2%) |
| 5 Years | 18 (100.0%) | 0 (0.0%) |
| 6 to 11 Years | 281 (96.2%) | 126 (96.9%) |
| 12 to 14 Years | 39 (100.0%) | 195 (98.0%) |
| 15 Years | 0 (0.0%) | 0 (0.0%) |
| 16 and 17 Years | 38 (100.0%) | 7 (41.2%) |
| 18 to 24 Years | 278 (99.6%) | 106 (100.0%) |
| 25 to 34 Years | 215 (94.7%) | 245 (91.4%) |
| 35 to 44 Years | 298 (98.4%) | 194 (90.2%) |
| 45 to 54 Years | 102 (100.0%) | 234 (92.1%) |
| 55 to 64 Years | 236 (78.7%) | 153 (90.5%) |
| 65 to 74 Years | 184 (100.0%) | 277 (76.7%) |
| 75 Years and over | 217 (96.0%) | 110 (100.0%) |
| Total | 1,972 (94.1%) | 1,784 (90.6%) |
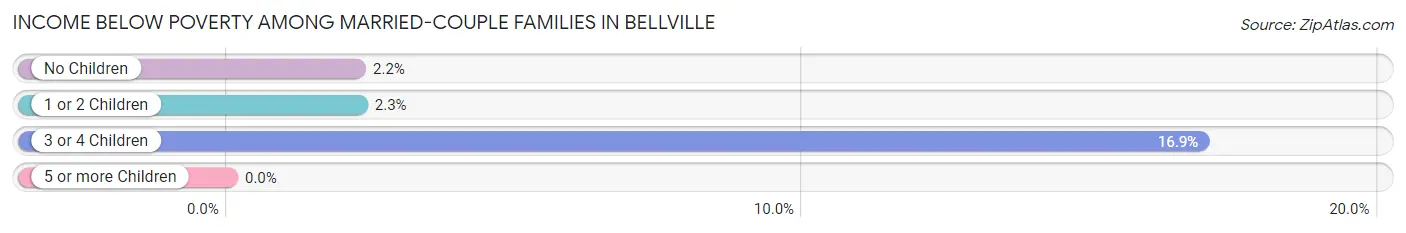
Income Below Poverty Among Married-Couple Families in Bellville
The poverty statistics for married-couple families in Bellville show that 3.3% or 25 of the total 758 families live below the poverty line. Families with 3 or 4 children have the highest poverty rate of 16.9%, comprising of 11 families. On the other hand, families with 5 or more children have the lowest poverty rate of 0.0%, which includes 0 families.
| Children | Above Poverty | Below Poverty |
| No Children | 395 (97.8%) | 9 (2.2%) |
| 1 or 2 Children | 216 (97.7%) | 5 (2.3%) |
| 3 or 4 Children | 54 (83.1%) | 11 (16.9%) |
| 5 or more Children | 68 (100.0%) | 0 (0.0%) |
| Total | 733 (96.7%) | 25 (3.3%) |
Income Below Poverty Among Single-Parent Households in Bellville
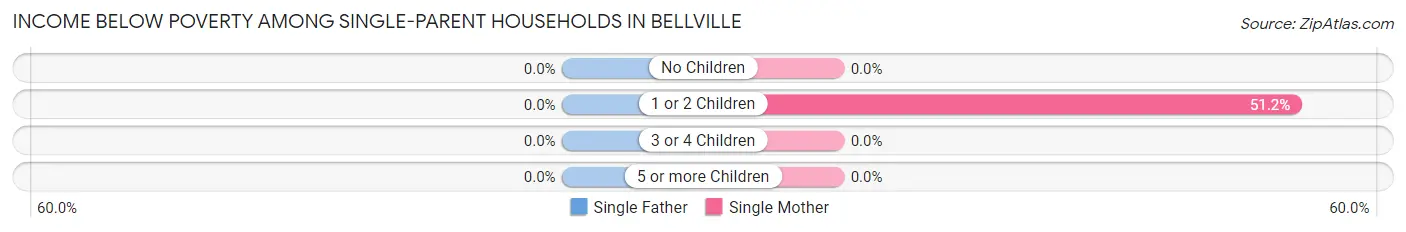
| Children | Single Father | Single Mother |
| No Children | 0 (0.0%) | 0 (0.0%) |
| 1 or 2 Children | 0 (0.0%) | 21 (51.2%) |
| 3 or 4 Children | 0 (0.0%) | 0 (0.0%) |
| 5 or more Children | 0 (0.0%) | 0 (0.0%) |
| Total | 0 (0.0%) | 21 (13.2%) |
Income Below Poverty Among Married-Couple vs Single-Parent Households in Bellville
The poverty data for Bellville shows that 25 of the married-couple family households (3.3%) and 21 of the single-parent households (9.1%) are living below the poverty level. Within the married-couple family households, those with 3 or 4 children have the highest poverty rate, with 11 households (16.9%) falling below the poverty line. Among the single-parent households, those with 1 or 2 children have the highest poverty rate, with 21 household (22.6%) living below poverty.
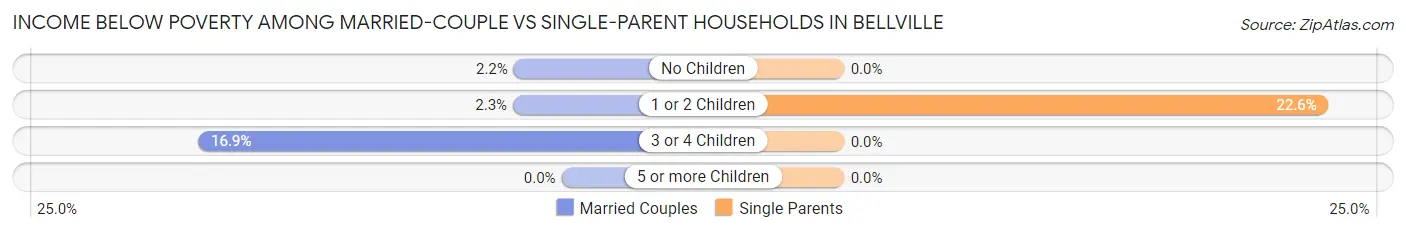
| Children | Married-Couple Families | Single-Parent Households |
| No Children | 9 (2.2%) | 0 (0.0%) |
| 1 or 2 Children | 5 (2.3%) | 21 (22.6%) |
| 3 or 4 Children | 11 (16.9%) | 0 (0.0%) |
| 5 or more Children | 0 (0.0%) | 0 (0.0%) |
| Total | 25 (3.3%) | 21 (9.1%) |
Race in Bellville
The most populous races in Bellville are White / Caucasian (2,939 | 70.0%), Hispanic or Latino (1,213 | 28.9%), and Some other Race (897 | 21.4%).
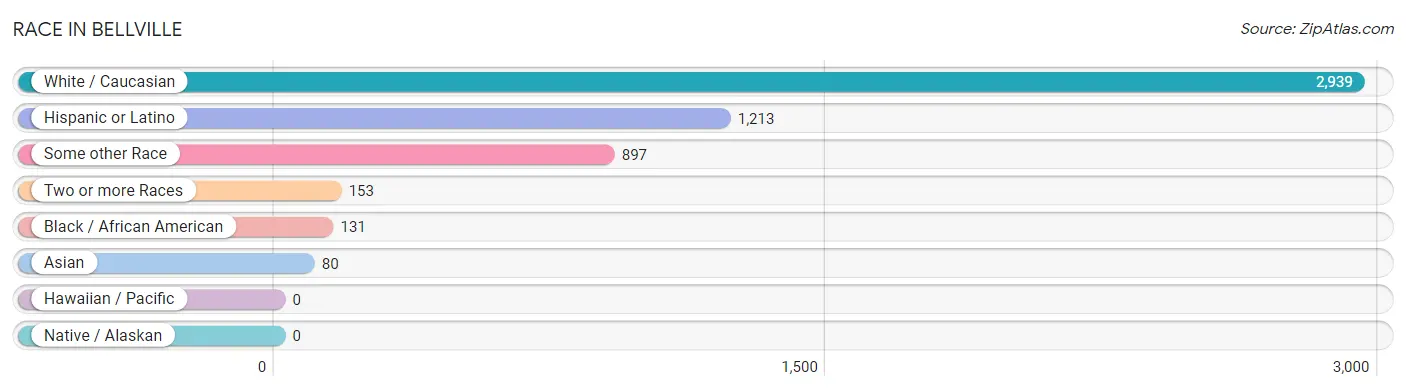
| Race | # Population | % Population |
| Asian | 80 | 1.9% |
| Black / African American | 131 | 3.1% |
| Hawaiian / Pacific | 0 | 0.0% |
| Hispanic or Latino | 1,213 | 28.9% |
| Native / Alaskan | 0 | 0.0% |
| White / Caucasian | 2,939 | 70.0% |
| Two or more Races | 153 | 3.6% |
| Some other Race | 897 | 21.4% |
| Total | 4,200 | 100.0% |
Ancestry in Bellville
The most populous ancestries reported in Bellville are Mexican (1,156 | 27.5%), German (880 | 20.9%), English (501 | 11.9%), Irish (316 | 7.5%), and Czech (187 | 4.4%), together accounting for 72.4% of all Bellville residents.
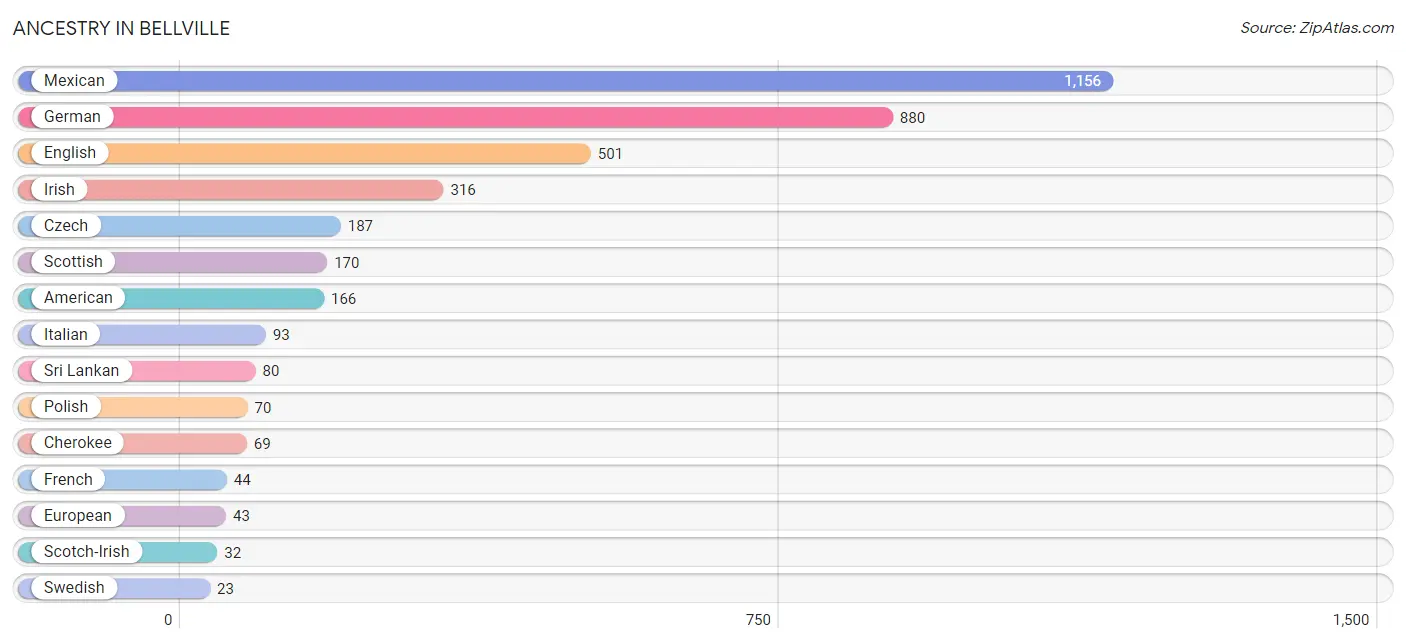
| Ancestry | # Population | % Population |
| American | 166 | 4.0% |
| Central American | 12 | 0.3% |
| Cherokee | 69 | 1.6% |
| Choctaw | 10 | 0.2% |
| Czech | 187 | 4.4% |
| Czechoslovakian | 19 | 0.4% |
| Danish | 12 | 0.3% |
| English | 501 | 11.9% |
| European | 43 | 1.0% |
| French | 44 | 1.1% |
| German | 880 | 20.9% |
| Greek | 16 | 0.4% |
| Irish | 316 | 7.5% |
| Italian | 93 | 2.2% |
| Mexican | 1,156 | 27.5% |
| Norwegian | 6 | 0.1% |
| Polish | 70 | 1.7% |
| Salvadoran | 12 | 0.3% |
| Scotch-Irish | 32 | 0.8% |
| Scottish | 170 | 4.1% |
| Sri Lankan | 80 | 1.9% |
| Swedish | 23 | 0.5% | View All 22 Rows |
Immigrants in Bellville
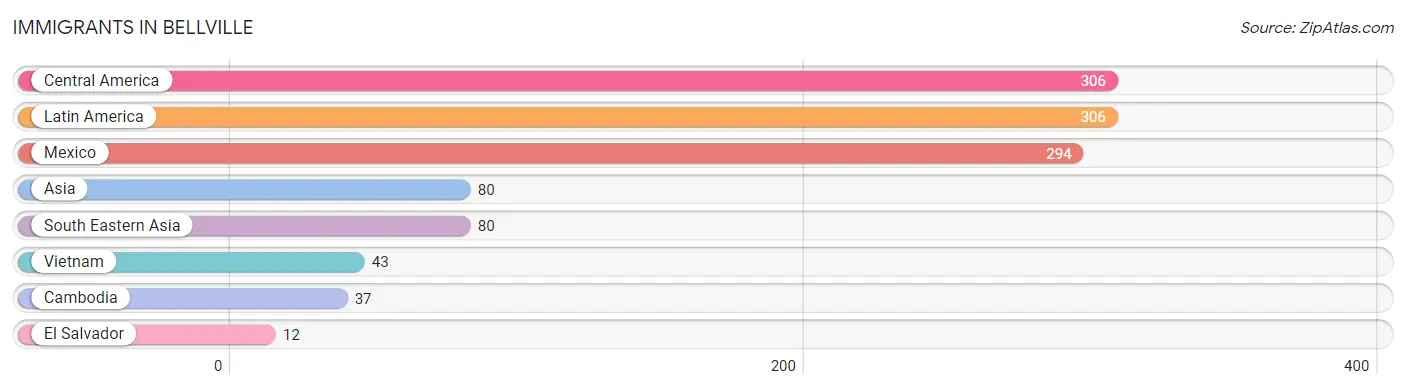
The most numerous immigrant groups reported in Bellville came from Central America (306 | 7.3%), Latin America (306 | 7.3%), Mexico (294 | 7.0%), Asia (80 | 1.9%), and South Eastern Asia (80 | 1.9%), together accounting for 25.4% of all Bellville residents.
| Immigration Origin | # Population | % Population |
| Asia | 80 | 1.9% |
| Cambodia | 37 | 0.9% |
| Central America | 306 | 7.3% |
| El Salvador | 12 | 0.3% |
| Latin America | 306 | 7.3% |
| Mexico | 294 | 7.0% |
| South Eastern Asia | 80 | 1.9% |
| Vietnam | 43 | 1.0% | View All 8 Rows |
Sex and Age in Bellville
Sex and Age in Bellville
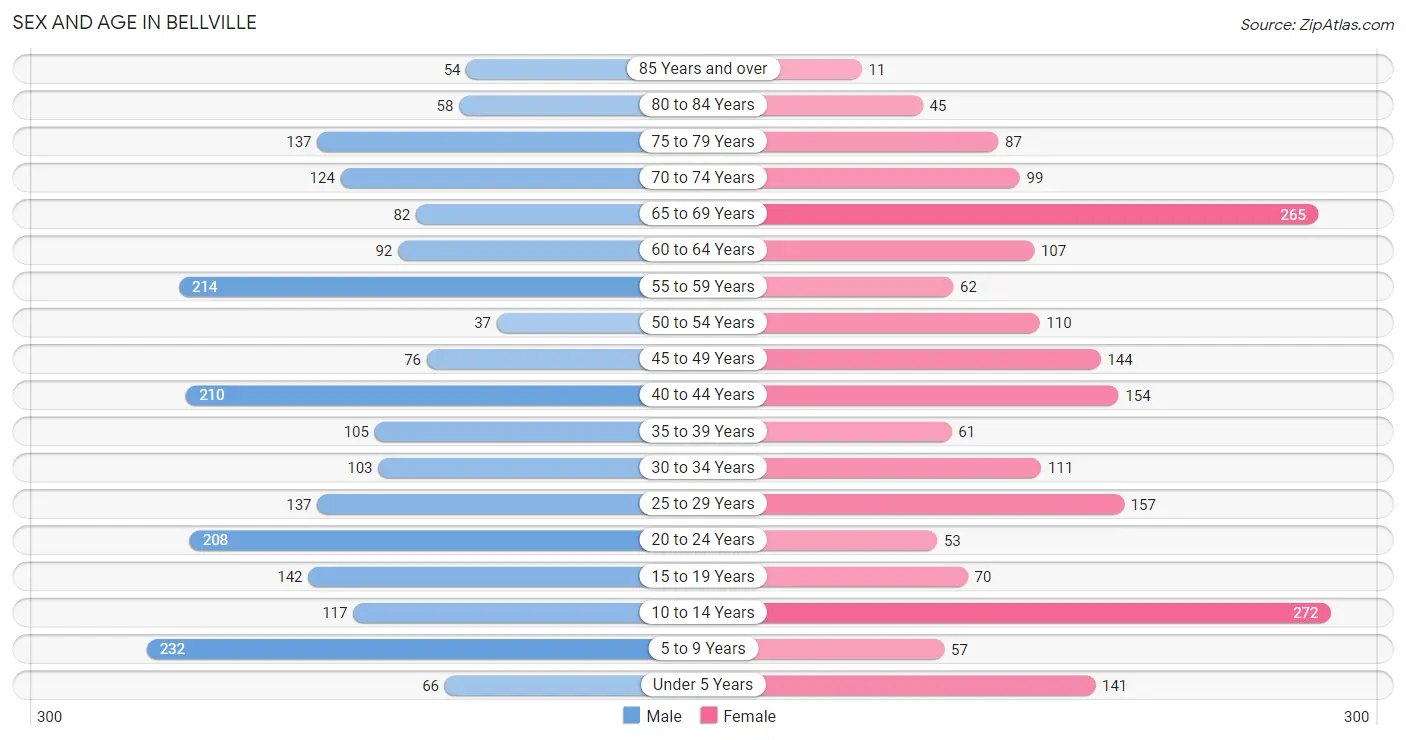
The most populous age groups in Bellville are 5 to 9 Years (232 | 10.6%) for men and 10 to 14 Years (272 | 13.6%) for women.
| Age Bracket | Male | Female |
| Under 5 Years | 66 (3.0%) | 141 (7.0%) |
| 5 to 9 Years | 232 (10.6%) | 57 (2.8%) |
| 10 to 14 Years | 117 (5.3%) | 272 (13.6%) |
| 15 to 19 Years | 142 (6.5%) | 70 (3.5%) |
| 20 to 24 Years | 208 (9.5%) | 53 (2.6%) |
| 25 to 29 Years | 137 (6.2%) | 157 (7.8%) |
| 30 to 34 Years | 103 (4.7%) | 111 (5.5%) |
| 35 to 39 Years | 105 (4.8%) | 61 (3.0%) |
| 40 to 44 Years | 210 (9.6%) | 154 (7.7%) |
| 45 to 49 Years | 76 (3.5%) | 144 (7.2%) |
| 50 to 54 Years | 37 (1.7%) | 110 (5.5%) |
| 55 to 59 Years | 214 (9.8%) | 62 (3.1%) |
| 60 to 64 Years | 92 (4.2%) | 107 (5.3%) |
| 65 to 69 Years | 82 (3.7%) | 265 (13.2%) |
| 70 to 74 Years | 124 (5.7%) | 99 (4.9%) |
| 75 to 79 Years | 137 (6.2%) | 87 (4.3%) |
| 80 to 84 Years | 58 (2.6%) | 45 (2.2%) |
| 85 Years and over | 54 (2.5%) | 11 (0.5%) |
| Total | 2,194 (100.0%) | 2,006 (100.0%) |
Families and Households in Bellville
Median Family Size in Bellville
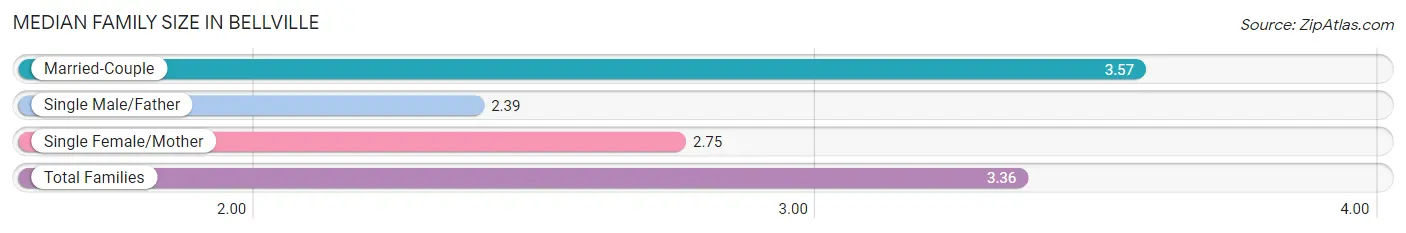
The median family size in Bellville is 3.36 persons per family, with married-couple families (758 | 76.7%) accounting for the largest median family size of 3.57 persons per family. On the other hand, single male/father families (71 | 7.2%) represent the smallest median family size with 2.39 persons per family.
| Family Type | # Families | Family Size |
| Married-Couple | 758 (76.7%) | 3.57 |
| Single Male/Father | 71 (7.2%) | 2.39 |
| Single Female/Mother | 159 (16.1%) | 2.75 |
| Total Families | 988 (100.0%) | 3.36 |
Median Household Size in Bellville
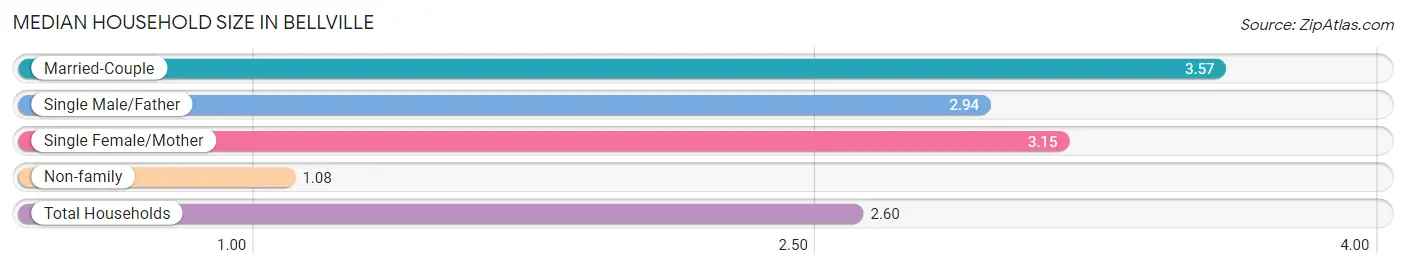
The median household size in Bellville is 2.60 persons per household, with married-couple households (758 | 49.0%) accounting for the largest median household size of 3.57 persons per household. non-family households (560 | 36.2%) represent the smallest median household size with 1.08 persons per household.
| Household Type | # Households | Household Size |
| Married-Couple | 758 (49.0%) | 3.57 |
| Single Male/Father | 71 (4.6%) | 2.94 |
| Single Female/Mother | 159 (10.3%) | 3.15 |
| Non-family | 560 (36.2%) | 1.08 |
| Total Households | 1,548 (100.0%) | 2.60 |
Household Size by Marriage Status in Bellville
Out of a total of 1,548 households in Bellville, 988 (63.8%) are family households, while 560 (36.2%) are nonfamily households. The most numerous type of family households are 2-person households, comprising 411, and the most common type of nonfamily households are 1-person households, comprising 496.
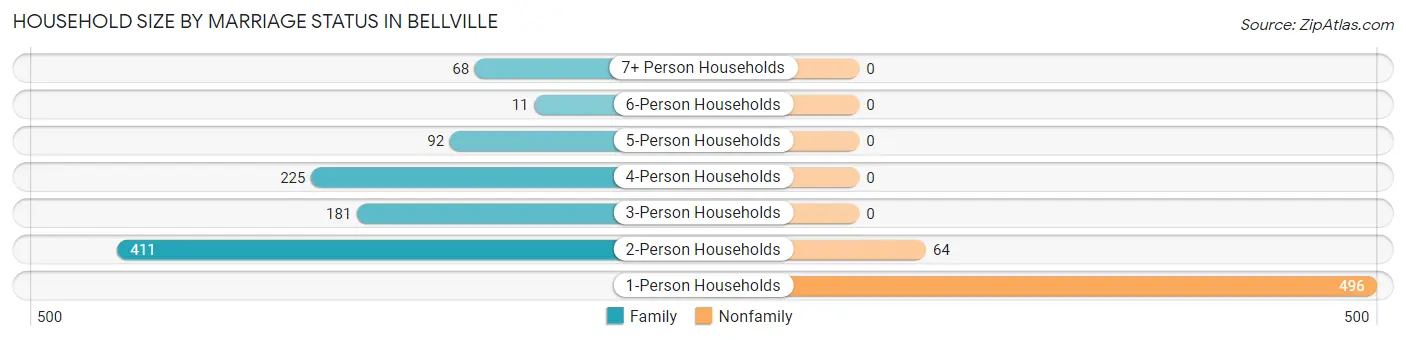
| Household Size | Family Households | Nonfamily Households |
| 1-Person Households | - | 496 (32.0%) |
| 2-Person Households | 411 (26.6%) | 64 (4.1%) |
| 3-Person Households | 181 (11.7%) | 0 (0.0%) |
| 4-Person Households | 225 (14.5%) | 0 (0.0%) |
| 5-Person Households | 92 (5.9%) | 0 (0.0%) |
| 6-Person Households | 11 (0.7%) | 0 (0.0%) |
| 7+ Person Households | 68 (4.4%) | 0 (0.0%) |
| Total | 988 (63.8%) | 560 (36.2%) |
Female Fertility in Bellville
Fertility by Age in Bellville
Average fertility rate in Bellville is 28.0 births per 1,000 women. Women in the age bracket of 20 to 34 years have the highest fertility rate with 69.0 births per 1,000 women. Women in the age bracket of 20 to 34 years acount for 100.0% of all women with births.
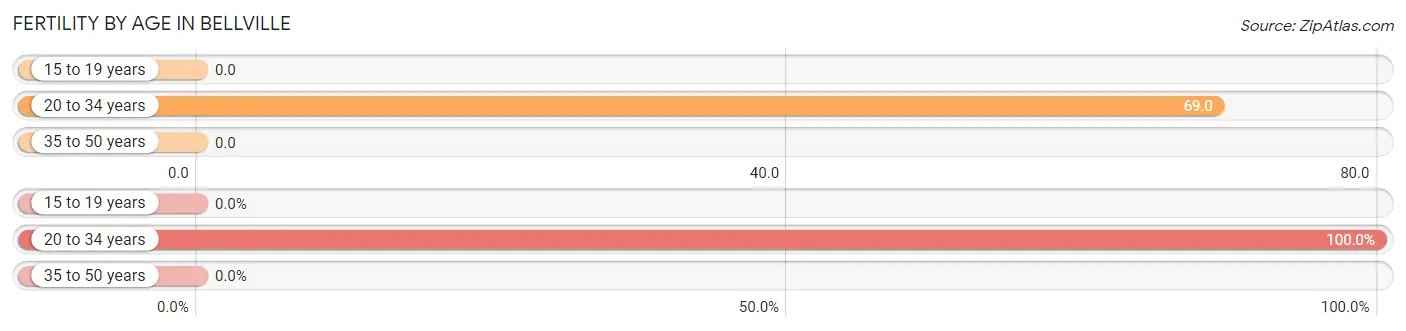
| Age Bracket | Women with Births | Births / 1,000 Women |
| 15 to 19 years | 0 (0.0%) | 0.0 |
| 20 to 34 years | 22 (100.0%) | 69.0 |
| 35 to 50 years | 0 (0.0%) | 0.0 |
| Total | 22 (100.0%) | 28.0 |
Fertility by Age by Marriage Status in Bellville
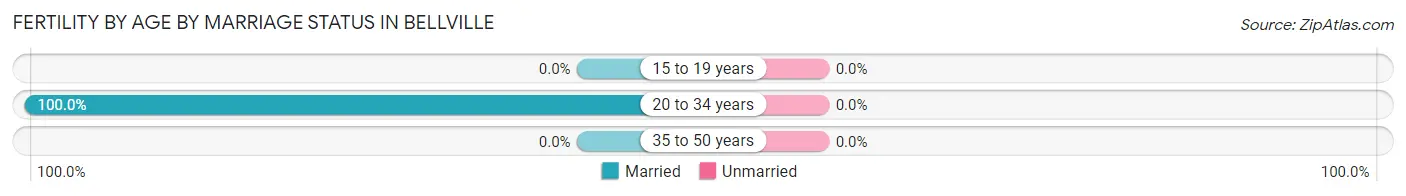
| Age Bracket | Married | Unmarried |
| 15 to 19 years | 0 (0.0%) | 0 (0.0%) |
| 20 to 34 years | 22 (100.0%) | 0 (0.0%) |
| 35 to 50 years | 0 (0.0%) | 0 (0.0%) |
| Total | 22 (100.0%) | 0 (0.0%) |
Fertility by Education in Bellville
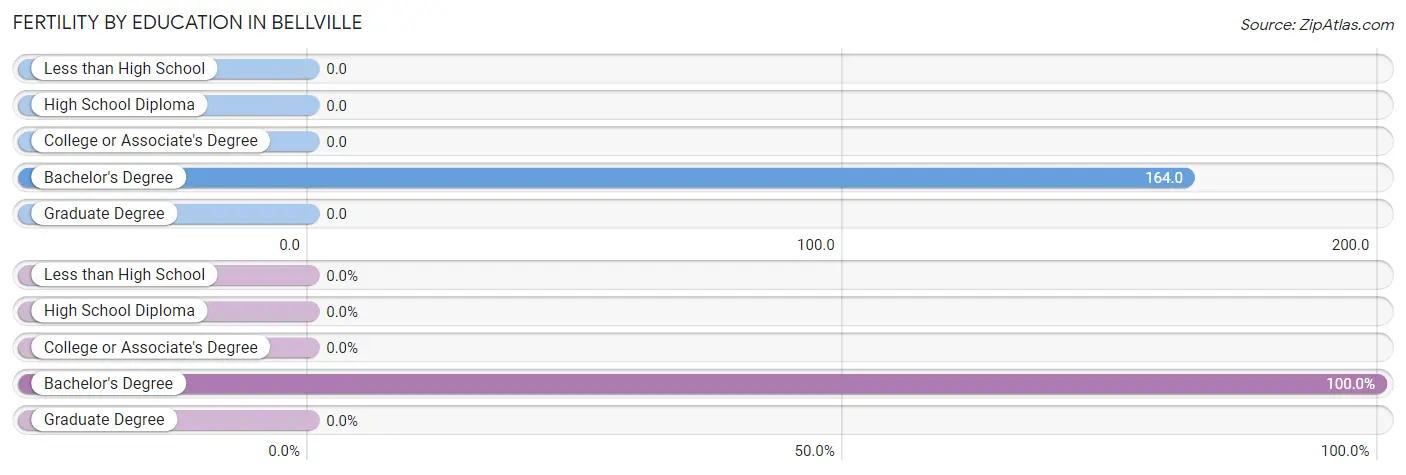
| Educational Attainment | Women with Births | Births / 1,000 Women |
| Less than High School | 0 (0.0%) | 0.0 |
| High School Diploma | 0 (0.0%) | 0.0 |
| College or Associate's Degree | 0 (0.0%) | 0.0 |
| Bachelor's Degree | 22 (100.0%) | 164.0 |
| Graduate Degree | 0 (0.0%) | 0.0 |
| Total | 22 (100.0%) | 28.0 |
Fertility by Education by Marriage Status in Bellville
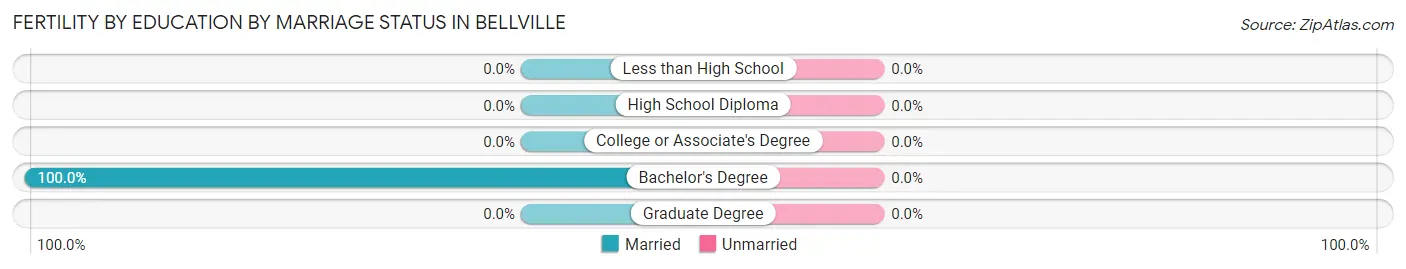
| Educational Attainment | Married | Unmarried |
| Less than High School | 0 (0.0%) | 0 (0.0%) |
| High School Diploma | 0 (0.0%) | 0 (0.0%) |
| College or Associate's Degree | 0 (0.0%) | 0 (0.0%) |
| Bachelor's Degree | 22 (100.0%) | 0 (0.0%) |
| Graduate Degree | 0 (0.0%) | 0 (0.0%) |
| Total | 22 (100.0%) | 0 (0.0%) |
Employment Characteristics in Bellville
Employment by Class of Employer in Bellville
Among the 1,891 employed individuals in Bellville, private company employees (984 | 52.0%), self-employed (not incorporated) (313 | 16.6%), and local government employees (213 | 11.3%) make up the most common classes of employment.
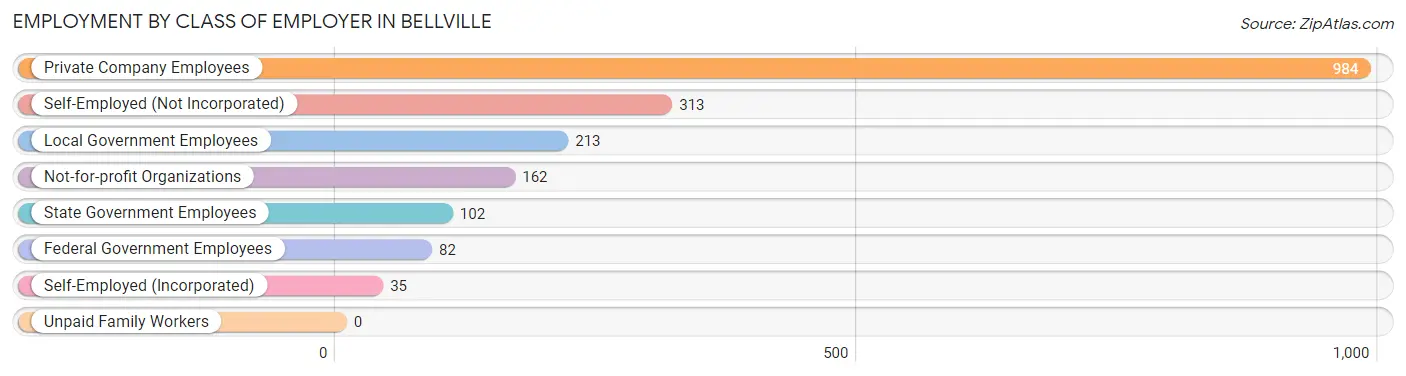
| Employer Class | # Employees | % Employees |
| Private Company Employees | 984 | 52.0% |
| Self-Employed (Incorporated) | 35 | 1.8% |
| Self-Employed (Not Incorporated) | 313 | 16.6% |
| Not-for-profit Organizations | 162 | 8.6% |
| Local Government Employees | 213 | 11.3% |
| State Government Employees | 102 | 5.4% |
| Federal Government Employees | 82 | 4.3% |
| Unpaid Family Workers | 0 | 0.0% |
| Total | 1,891 | 100.0% |
Employment Status by Age in Bellville
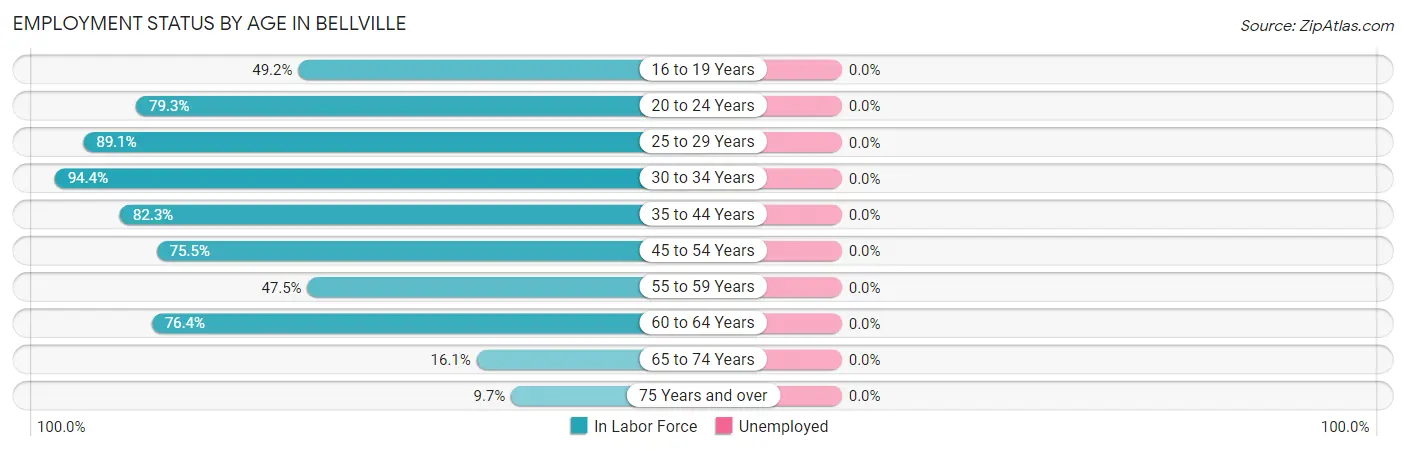
| Age Bracket | In Labor Force | Unemployed |
| 16 to 19 Years | 94 (49.2%) | 0 (0.0%) |
| 20 to 24 Years | 207 (79.3%) | 0 (0.0%) |
| 25 to 29 Years | 262 (89.1%) | 0 (0.0%) |
| 30 to 34 Years | 202 (94.4%) | 0 (0.0%) |
| 35 to 44 Years | 436 (82.3%) | 0 (0.0%) |
| 45 to 54 Years | 277 (75.5%) | 0 (0.0%) |
| 55 to 59 Years | 131 (47.5%) | 0 (0.0%) |
| 60 to 64 Years | 152 (76.4%) | 0 (0.0%) |
| 65 to 74 Years | 92 (16.1%) | 0 (0.0%) |
| 75 Years and over | 38 (9.7%) | 0 (0.0%) |
| Total | 1,891 (57.4%) | 0 (0.0%) |
Employment Status by Educational Attainment in Bellville

| Educational Attainment | In Labor Force | Unemployed |
| Less than High School | 82 (49.1%) | 0 (0.0%) |
| High School Diploma | 346 (74.9%) | 0 (0.0%) |
| College / Associate Degree | 519 (83.8%) | 0 (0.0%) |
| Bachelor's Degree or higher | 513 (81.2%) | 0 (0.0%) |
| Total | 1,461 (77.7%) | 0 (0.0%) |
Employment Occupations by Sex in Bellville
Management, Business, Science and Arts Occupations
The most common Management, Business, Science and Arts occupations in Bellville are Management (277 | 14.6%), Community & Social Service (213 | 11.3%), Education, Arts & Media (103 | 5.4%), Education Instruction & Library (73 | 3.9%), and Business & Financial (60 | 3.2%).
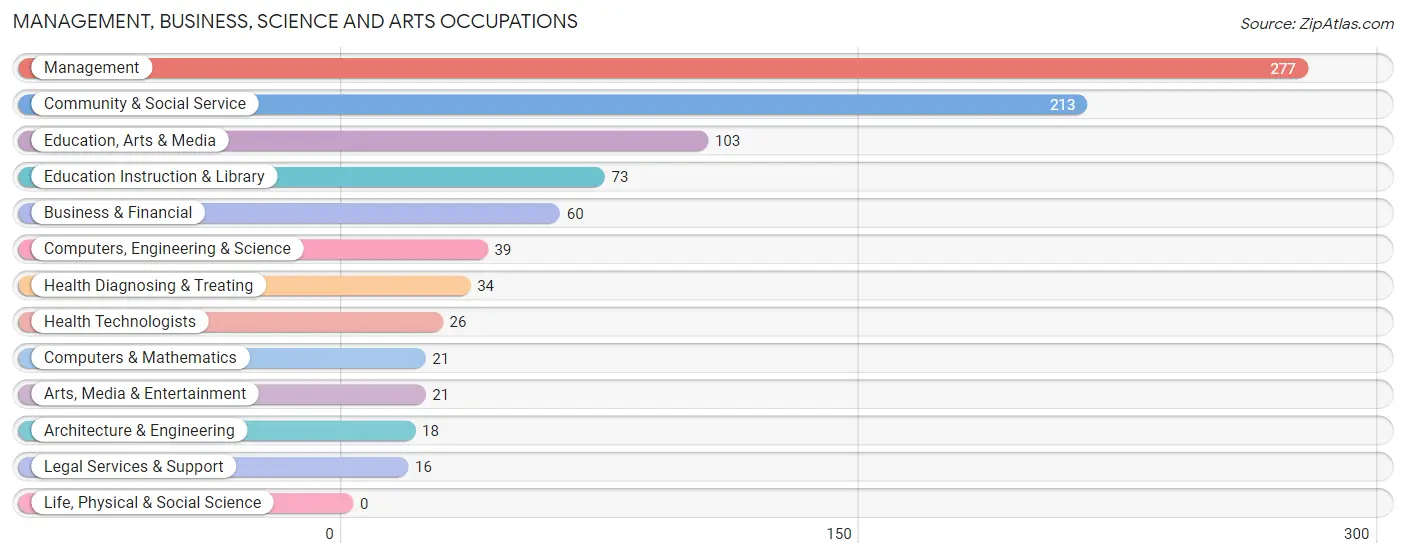
Management, Business, Science and Arts Occupations by Sex
Within the Management, Business, Science and Arts occupations in Bellville, the most male-oriented occupations are Arts, Media & Entertainment (90.5%), Business & Financial (76.7%), and Education, Arts & Media (71.8%), while the most female-oriented occupations are Health Diagnosing & Treating (100.0%), Health Technologists (100.0%), and Architecture & Engineering (83.3%).
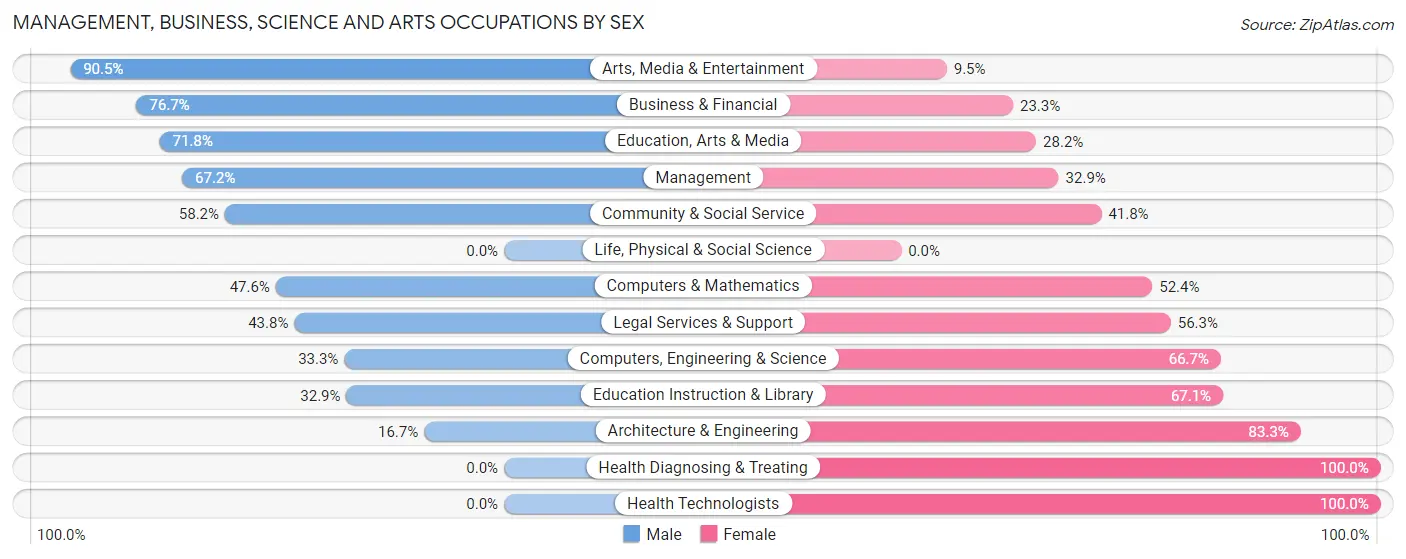
| Occupation | Male | Female |
| Management | 186 (67.1%) | 91 (32.9%) |
| Business & Financial | 46 (76.7%) | 14 (23.3%) |
| Computers, Engineering & Science | 13 (33.3%) | 26 (66.7%) |
| Computers & Mathematics | 10 (47.6%) | 11 (52.4%) |
| Architecture & Engineering | 3 (16.7%) | 15 (83.3%) |
| Life, Physical & Social Science | 0 (0.0%) | 0 (0.0%) |
| Community & Social Service | 124 (58.2%) | 89 (41.8%) |
| Education, Arts & Media | 74 (71.8%) | 29 (28.2%) |
| Legal Services & Support | 7 (43.8%) | 9 (56.2%) |
| Education Instruction & Library | 24 (32.9%) | 49 (67.1%) |
| Arts, Media & Entertainment | 19 (90.5%) | 2 (9.5%) |
| Health Diagnosing & Treating | 0 (0.0%) | 34 (100.0%) |
| Health Technologists | 0 (0.0%) | 26 (100.0%) |
| Total (Category) | 369 (59.2%) | 254 (40.8%) |
| Total (Overall) | 1,062 (56.2%) | 829 (43.8%) |
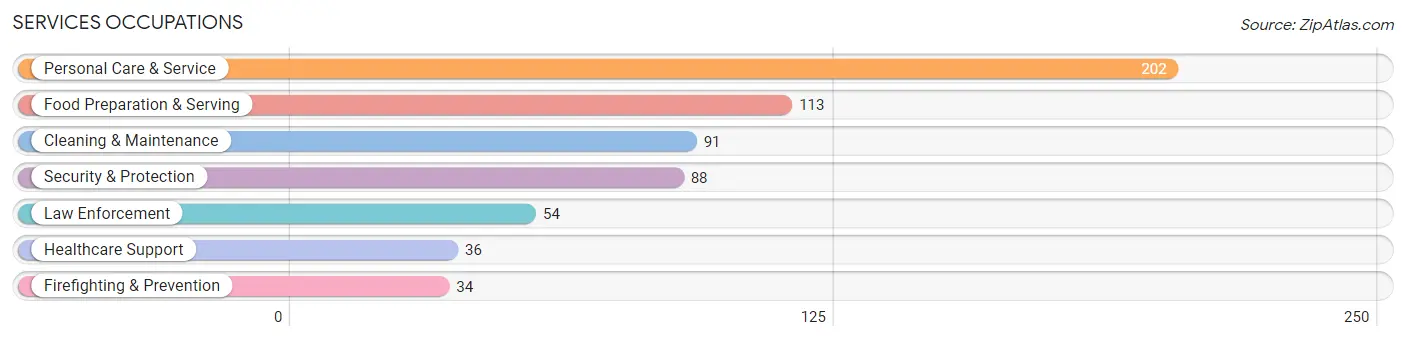
Services Occupations
The most common Services occupations in Bellville are Personal Care & Service (202 | 10.7%), Food Preparation & Serving (113 | 6.0%), Cleaning & Maintenance (91 | 4.8%), Security & Protection (88 | 4.6%), and Law Enforcement (54 | 2.9%).
Services Occupations by Sex
Within the Services occupations in Bellville, the most male-oriented occupations are Security & Protection (100.0%), Firefighting & Prevention (100.0%), and Law Enforcement (100.0%), while the most female-oriented occupations are Personal Care & Service (100.0%), Cleaning & Maintenance (75.8%), and Healthcare Support (50.0%).
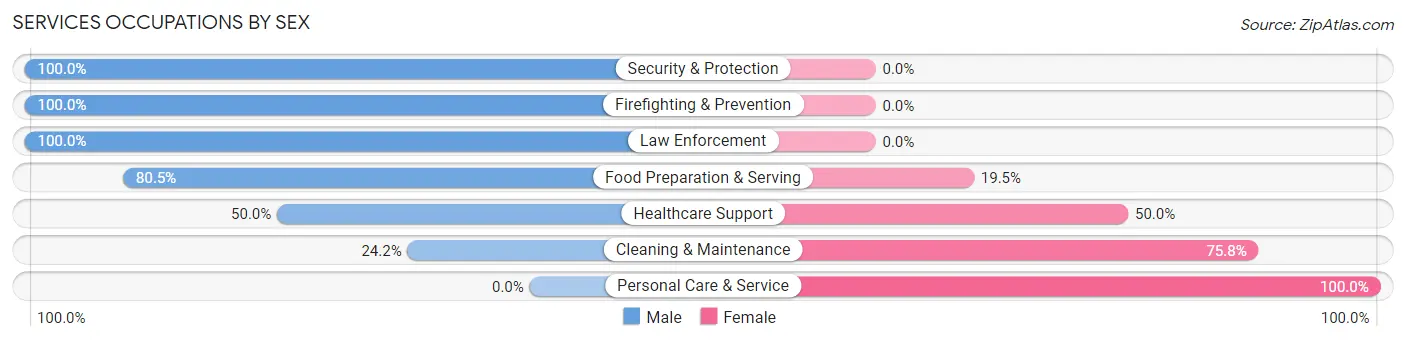
| Occupation | Male | Female |
| Healthcare Support | 18 (50.0%) | 18 (50.0%) |
| Security & Protection | 88 (100.0%) | 0 (0.0%) |
| Firefighting & Prevention | 34 (100.0%) | 0 (0.0%) |
| Law Enforcement | 54 (100.0%) | 0 (0.0%) |
| Food Preparation & Serving | 91 (80.5%) | 22 (19.5%) |
| Cleaning & Maintenance | 22 (24.2%) | 69 (75.8%) |
| Personal Care & Service | 0 (0.0%) | 202 (100.0%) |
| Total (Category) | 219 (41.3%) | 311 (58.7%) |
| Total (Overall) | 1,062 (56.2%) | 829 (43.8%) |
Sales and Office Occupations
The most common Sales and Office occupations in Bellville are Office & Administration (233 | 12.3%), and Sales & Related (183 | 9.7%).

Sales and Office Occupations by Sex

| Occupation | Male | Female |
| Sales & Related | 72 (39.3%) | 111 (60.7%) |
| Office & Administration | 80 (34.3%) | 153 (65.7%) |
| Total (Category) | 152 (36.5%) | 264 (63.5%) |
| Total (Overall) | 1,062 (56.2%) | 829 (43.8%) |
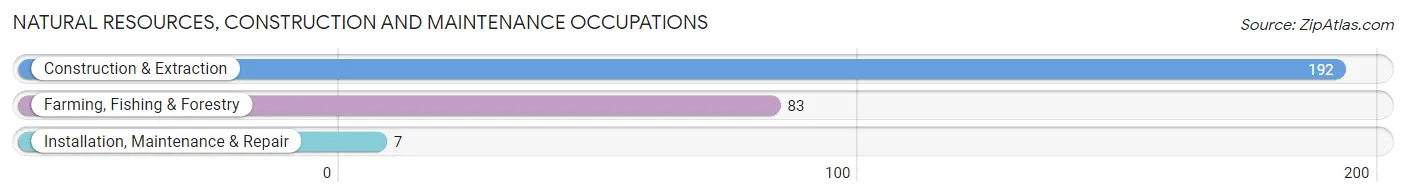
Natural Resources, Construction and Maintenance Occupations
The most common Natural Resources, Construction and Maintenance occupations in Bellville are Construction & Extraction (192 | 10.2%), Farming, Fishing & Forestry (83 | 4.4%), and Installation, Maintenance & Repair (7 | 0.4%).
Natural Resources, Construction and Maintenance Occupations by Sex

| Occupation | Male | Female |
| Farming, Fishing & Forestry | 83 (100.0%) | 0 (0.0%) |
| Construction & Extraction | 192 (100.0%) | 0 (0.0%) |
| Installation, Maintenance & Repair | 7 (100.0%) | 0 (0.0%) |
| Total (Category) | 282 (100.0%) | 0 (0.0%) |
| Total (Overall) | 1,062 (56.2%) | 829 (43.8%) |
Production, Transportation and Moving Occupations
The most common Production, Transportation and Moving occupations in Bellville are Transportation (21 | 1.1%), and Material Moving (19 | 1.0%).
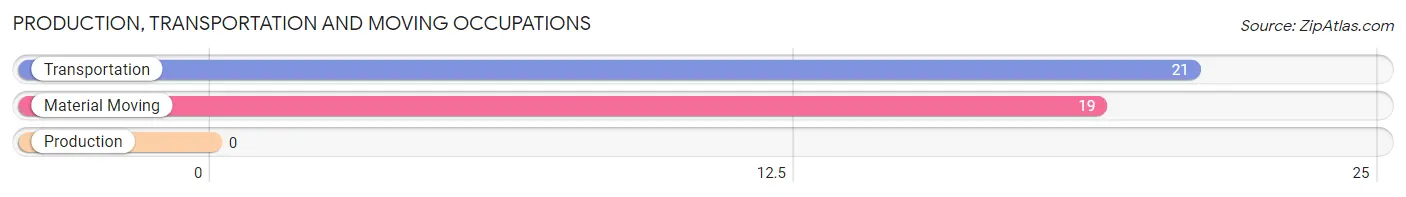
Production, Transportation and Moving Occupations by Sex

| Occupation | Male | Female |
| Production | 0 (0.0%) | 0 (0.0%) |
| Transportation | 21 (100.0%) | 0 (0.0%) |
| Material Moving | 19 (100.0%) | 0 (0.0%) |
| Total (Category) | 40 (100.0%) | 0 (0.0%) |
| Total (Overall) | 1,062 (56.2%) | 829 (43.8%) |
Employment Industries by Sex in Bellville
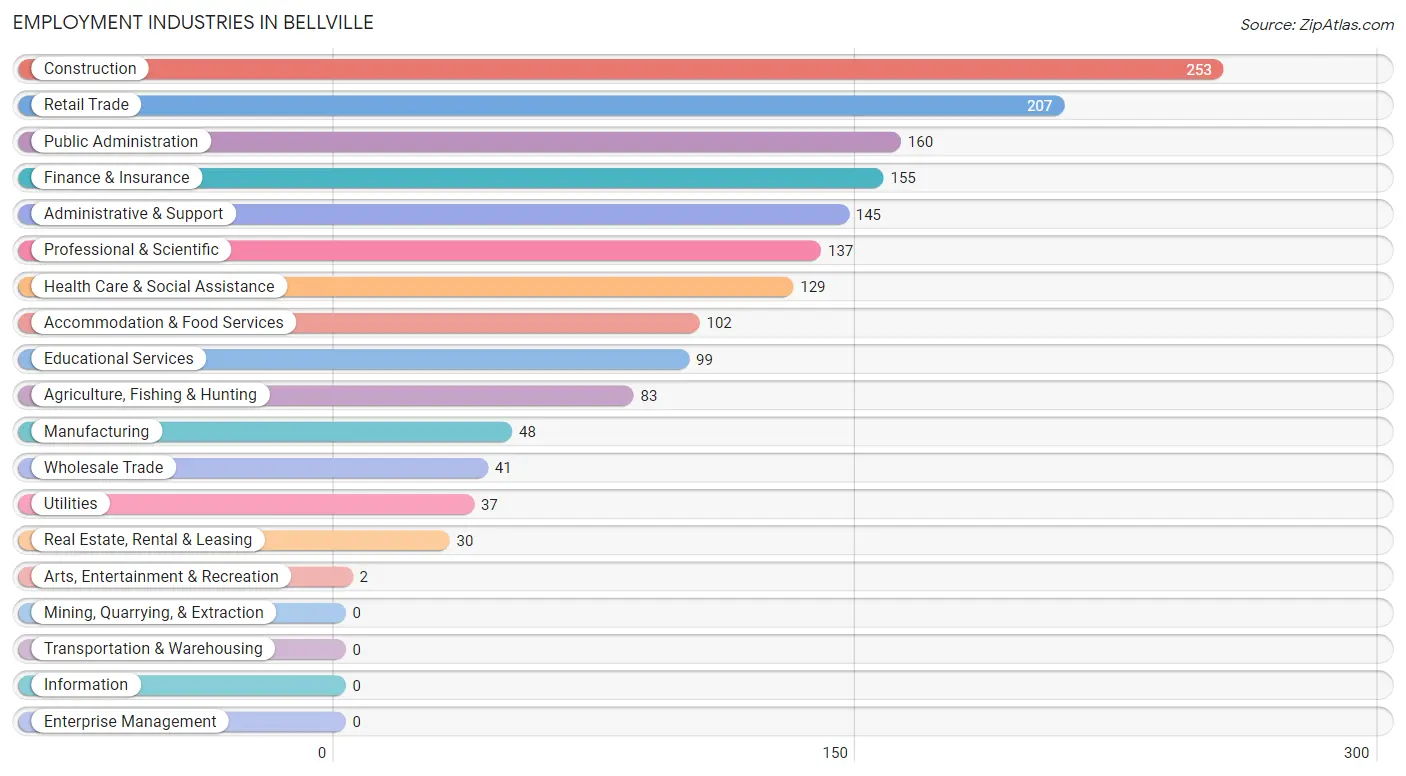
Employment Industries in Bellville
The major employment industries in Bellville include Construction (253 | 13.4%), Retail Trade (207 | 11.0%), Public Administration (160 | 8.5%), Finance & Insurance (155 | 8.2%), and Administrative & Support (145 | 7.7%).
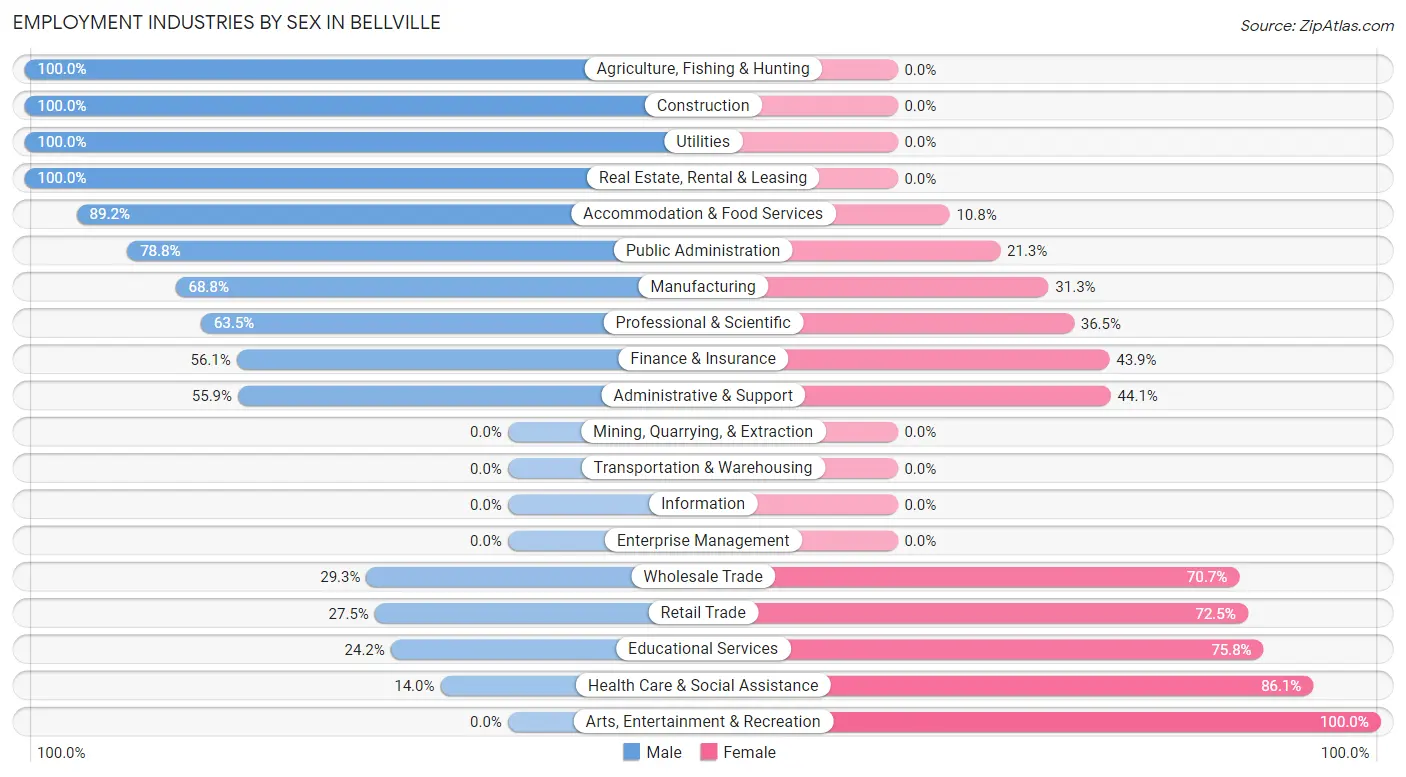
Employment Industries by Sex in Bellville
The Bellville industries that see more men than women are Agriculture, Fishing & Hunting (100.0%), Construction (100.0%), and Utilities (100.0%), whereas the industries that tend to have a higher number of women are Arts, Entertainment & Recreation (100.0%), Health Care & Social Assistance (86.1%), and Educational Services (75.8%).
| Industry | Male | Female |
| Agriculture, Fishing & Hunting | 83 (100.0%) | 0 (0.0%) |
| Mining, Quarrying, & Extraction | 0 (0.0%) | 0 (0.0%) |
| Construction | 253 (100.0%) | 0 (0.0%) |
| Manufacturing | 33 (68.8%) | 15 (31.2%) |
| Wholesale Trade | 12 (29.3%) | 29 (70.7%) |
| Retail Trade | 57 (27.5%) | 150 (72.5%) |
| Transportation & Warehousing | 0 (0.0%) | 0 (0.0%) |
| Utilities | 37 (100.0%) | 0 (0.0%) |
| Information | 0 (0.0%) | 0 (0.0%) |
| Finance & Insurance | 87 (56.1%) | 68 (43.9%) |
| Real Estate, Rental & Leasing | 30 (100.0%) | 0 (0.0%) |
| Professional & Scientific | 87 (63.5%) | 50 (36.5%) |
| Enterprise Management | 0 (0.0%) | 0 (0.0%) |
| Administrative & Support | 81 (55.9%) | 64 (44.1%) |
| Educational Services | 24 (24.2%) | 75 (75.8%) |
| Health Care & Social Assistance | 18 (14.0%) | 111 (86.1%) |
| Arts, Entertainment & Recreation | 0 (0.0%) | 2 (100.0%) |
| Accommodation & Food Services | 91 (89.2%) | 11 (10.8%) |
| Public Administration | 126 (78.7%) | 34 (21.2%) |
| Total | 1,062 (56.2%) | 829 (43.8%) |
Education in Bellville
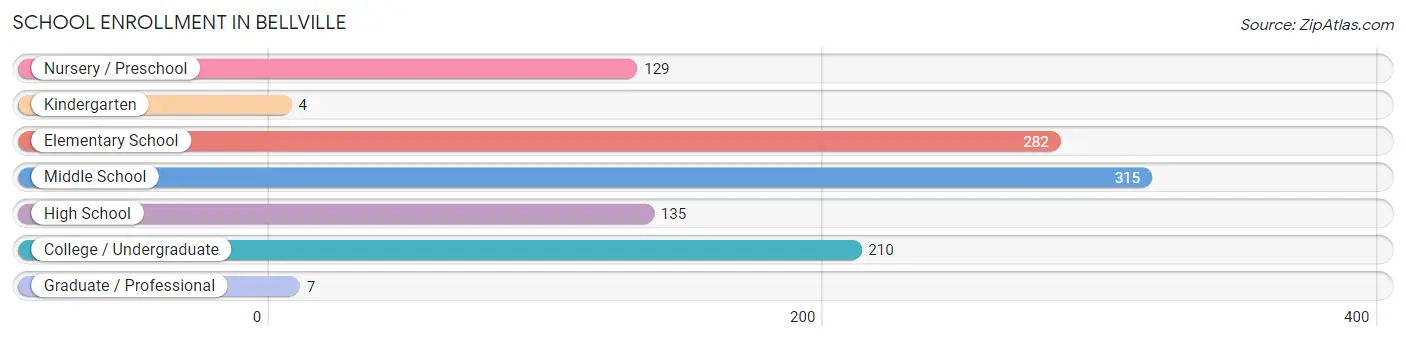
School Enrollment in Bellville
The most common levels of schooling among the 1,082 students in Bellville are middle school (315 | 29.1%), elementary school (282 | 26.1%), and college / undergraduate (210 | 19.4%).
| School Level | # Students | % Students |
| Nursery / Preschool | 129 | 11.9% |
| Kindergarten | 4 | 0.4% |
| Elementary School | 282 | 26.1% |
| Middle School | 315 | 29.1% |
| High School | 135 | 12.5% |
| College / Undergraduate | 210 | 19.4% |
| Graduate / Professional | 7 | 0.6% |
| Total | 1,082 | 100.0% |
School Enrollment by Age by Funding Source in Bellville
Out of a total of 1,082 students who are enrolled in schools in Bellville, 144 (13.3%) attend a private institution, while the remaining 938 (86.7%) are enrolled in public schools. The age group of 3 to 4 year olds has the highest likelihood of being enrolled in private schools, with 37 (33.3% in the age bracket) enrolled. Conversely, the age group of 18 to 19 year olds has the lowest likelihood of being enrolled in a private school, with 15 (100.0% in the age bracket) attending a public institution.
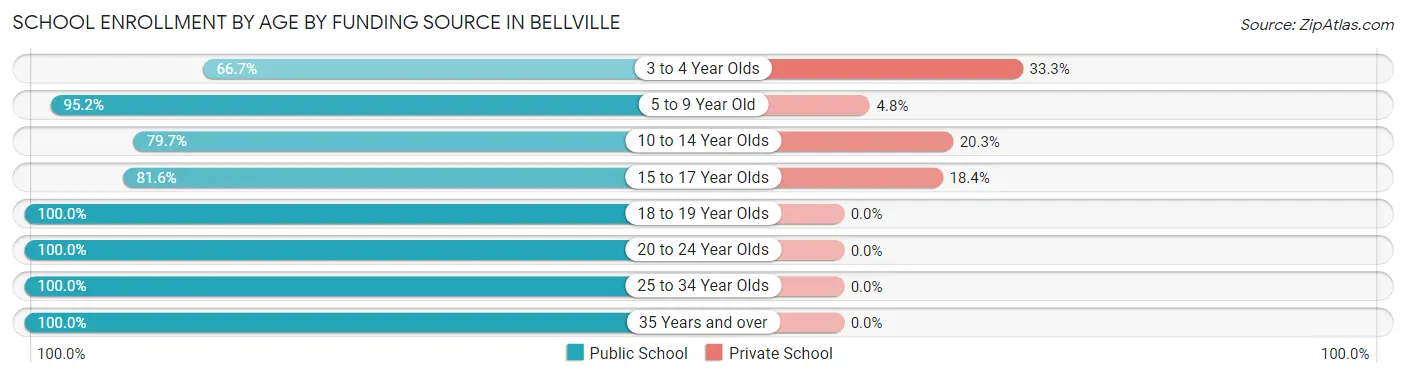
| Age Bracket | Public School | Private School |
| 3 to 4 Year Olds | 74 (66.7%) | 37 (33.3%) |
| 5 to 9 Year Old | 275 (95.2%) | 14 (4.8%) |
| 10 to 14 Year Olds | 310 (79.7%) | 79 (20.3%) |
| 15 to 17 Year Olds | 62 (81.6%) | 14 (18.4%) |
| 18 to 19 Year Olds | 15 (100.0%) | 0 (0.0%) |
| 20 to 24 Year Olds | 85 (100.0%) | 0 (0.0%) |
| 25 to 34 Year Olds | 74 (100.0%) | 0 (0.0%) |
| 35 Years and over | 43 (100.0%) | 0 (0.0%) |
| Total | 938 (86.7%) | 144 (13.3%) |
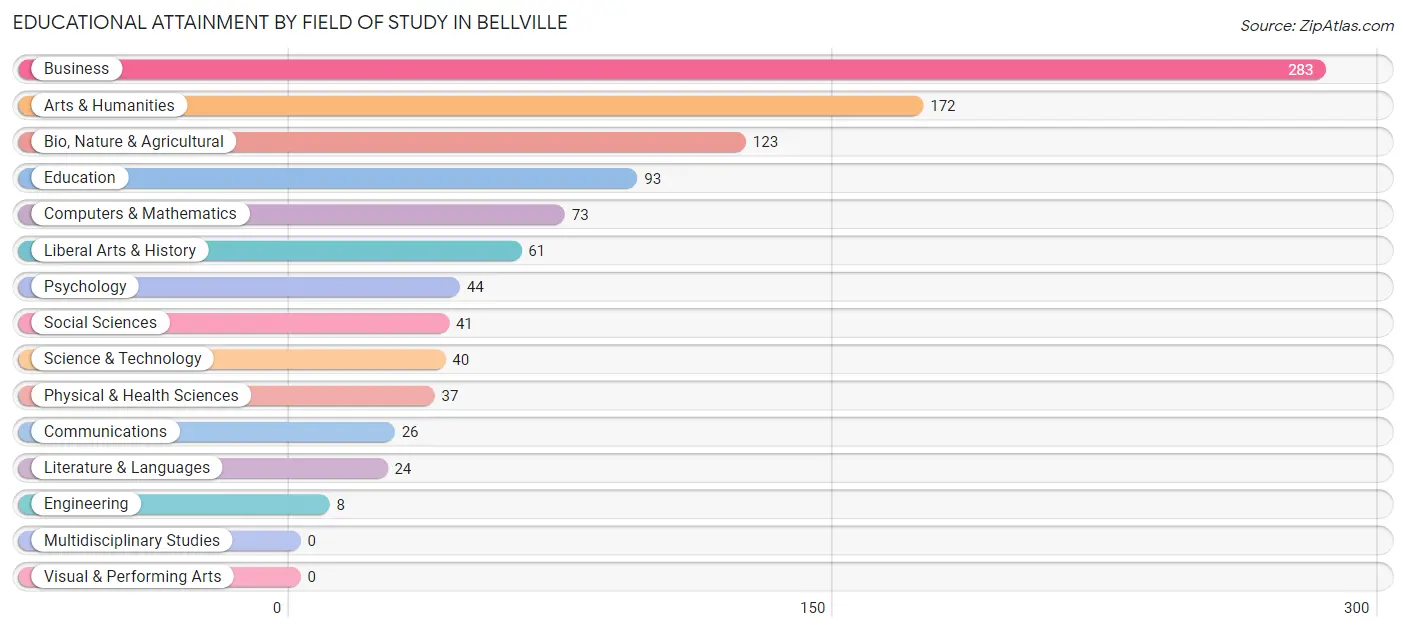
Educational Attainment by Field of Study in Bellville
Business (283 | 27.6%), arts & humanities (172 | 16.8%), bio, nature & agricultural (123 | 12.0%), education (93 | 9.1%), and computers & mathematics (73 | 7.1%) are the most common fields of study among 1,025 individuals in Bellville who have obtained a bachelor's degree or higher.
| Field of Study | # Graduates | % Graduates |
| Computers & Mathematics | 73 | 7.1% |
| Bio, Nature & Agricultural | 123 | 12.0% |
| Physical & Health Sciences | 37 | 3.6% |
| Psychology | 44 | 4.3% |
| Social Sciences | 41 | 4.0% |
| Engineering | 8 | 0.8% |
| Multidisciplinary Studies | 0 | 0.0% |
| Science & Technology | 40 | 3.9% |
| Business | 283 | 27.6% |
| Education | 93 | 9.1% |
| Literature & Languages | 24 | 2.3% |
| Liberal Arts & History | 61 | 5.9% |
| Visual & Performing Arts | 0 | 0.0% |
| Communications | 26 | 2.5% |
| Arts & Humanities | 172 | 16.8% |
| Total | 1,025 | 100.0% |
Transportation & Commute in Bellville
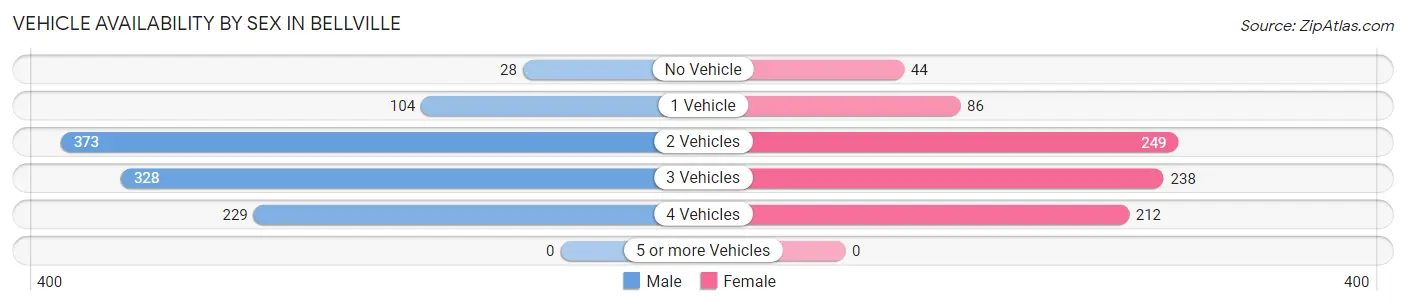
Vehicle Availability by Sex in Bellville
The most prevalent vehicle ownership categories in Bellville are males with 2 vehicles (373, accounting for 35.1%) and females with 2 vehicles (249, making up 45.0%).
| Vehicles Available | Male | Female |
| No Vehicle | 28 (2.6%) | 44 (5.3%) |
| 1 Vehicle | 104 (9.8%) | 86 (10.4%) |
| 2 Vehicles | 373 (35.1%) | 249 (30.0%) |
| 3 Vehicles | 328 (30.9%) | 238 (28.7%) |
| 4 Vehicles | 229 (21.6%) | 212 (25.6%) |
| 5 or more Vehicles | 0 (0.0%) | 0 (0.0%) |
| Total | 1,062 (100.0%) | 829 (100.0%) |
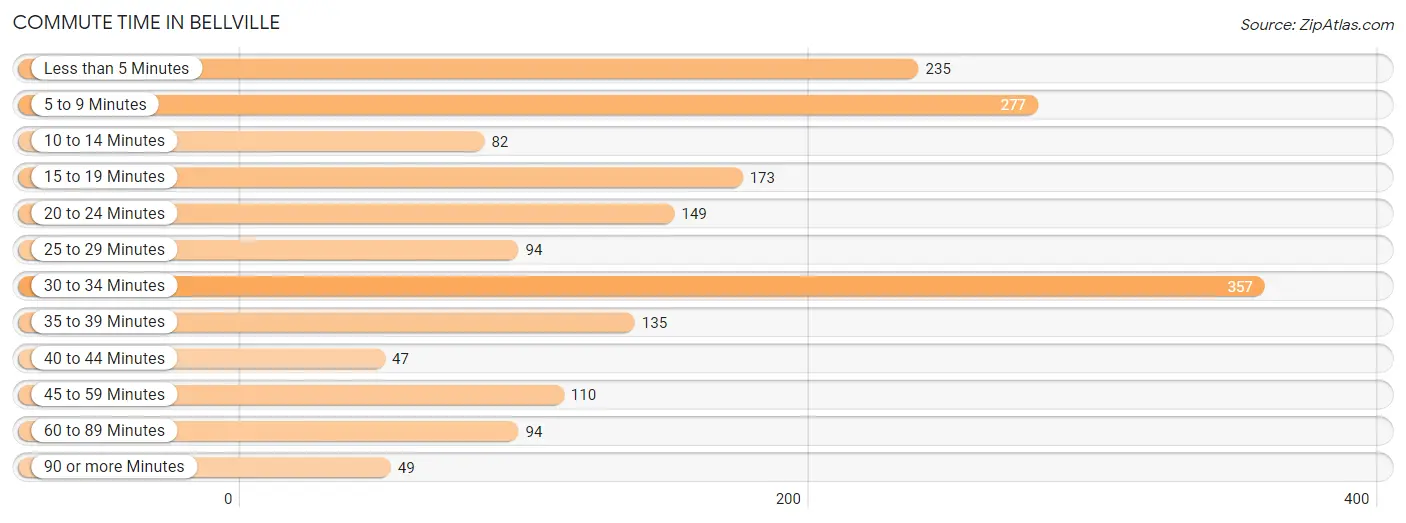
Commute Time in Bellville
The most frequently occuring commute durations in Bellville are 30 to 34 minutes (357 commuters, 19.8%), 5 to 9 minutes (277 commuters, 15.4%), and less than 5 minutes (235 commuters, 13.0%).
| Commute Time | # Commuters | % Commuters |
| Less than 5 Minutes | 235 | 13.0% |
| 5 to 9 Minutes | 277 | 15.4% |
| 10 to 14 Minutes | 82 | 4.5% |
| 15 to 19 Minutes | 173 | 9.6% |
| 20 to 24 Minutes | 149 | 8.3% |
| 25 to 29 Minutes | 94 | 5.2% |
| 30 to 34 Minutes | 357 | 19.8% |
| 35 to 39 Minutes | 135 | 7.5% |
| 40 to 44 Minutes | 47 | 2.6% |
| 45 to 59 Minutes | 110 | 6.1% |
| 60 to 89 Minutes | 94 | 5.2% |
| 90 or more Minutes | 49 | 2.7% |
Commute Time by Sex in Bellville
The most common commute times in Bellville are 30 to 34 minutes (278 commuters, 27.0%) for males and 5 to 9 minutes (161 commuters, 20.8%) for females.
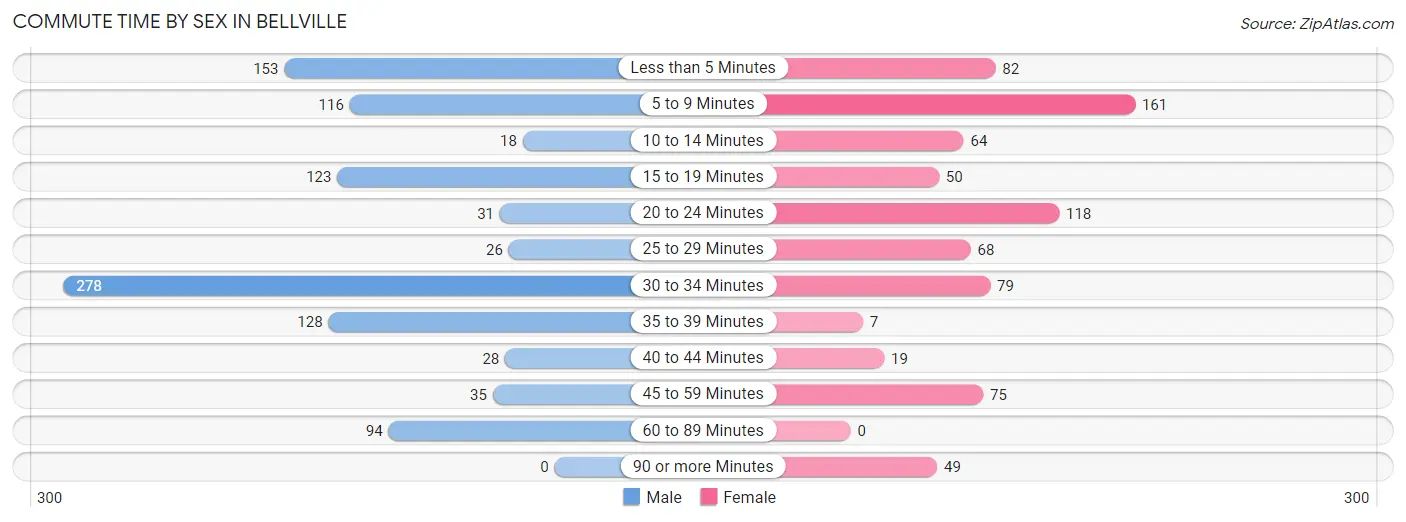
| Commute Time | Male | Female |
| Less than 5 Minutes | 153 (14.8%) | 82 (10.6%) |
| 5 to 9 Minutes | 116 (11.3%) | 161 (20.8%) |
| 10 to 14 Minutes | 18 (1.8%) | 64 (8.3%) |
| 15 to 19 Minutes | 123 (11.9%) | 50 (6.5%) |
| 20 to 24 Minutes | 31 (3.0%) | 118 (15.3%) |
| 25 to 29 Minutes | 26 (2.5%) | 68 (8.8%) |
| 30 to 34 Minutes | 278 (27.0%) | 79 (10.2%) |
| 35 to 39 Minutes | 128 (12.4%) | 7 (0.9%) |
| 40 to 44 Minutes | 28 (2.7%) | 19 (2.5%) |
| 45 to 59 Minutes | 35 (3.4%) | 75 (9.7%) |
| 60 to 89 Minutes | 94 (9.1%) | 0 (0.0%) |
| 90 or more Minutes | 0 (0.0%) | 49 (6.4%) |
Time of Departure to Work by Sex in Bellville
The most frequent times of departure to work in Bellville are 7:00 AM to 7:29 AM (239, 23.2%) for males and 7:00 AM to 7:29 AM (189, 24.5%) for females.
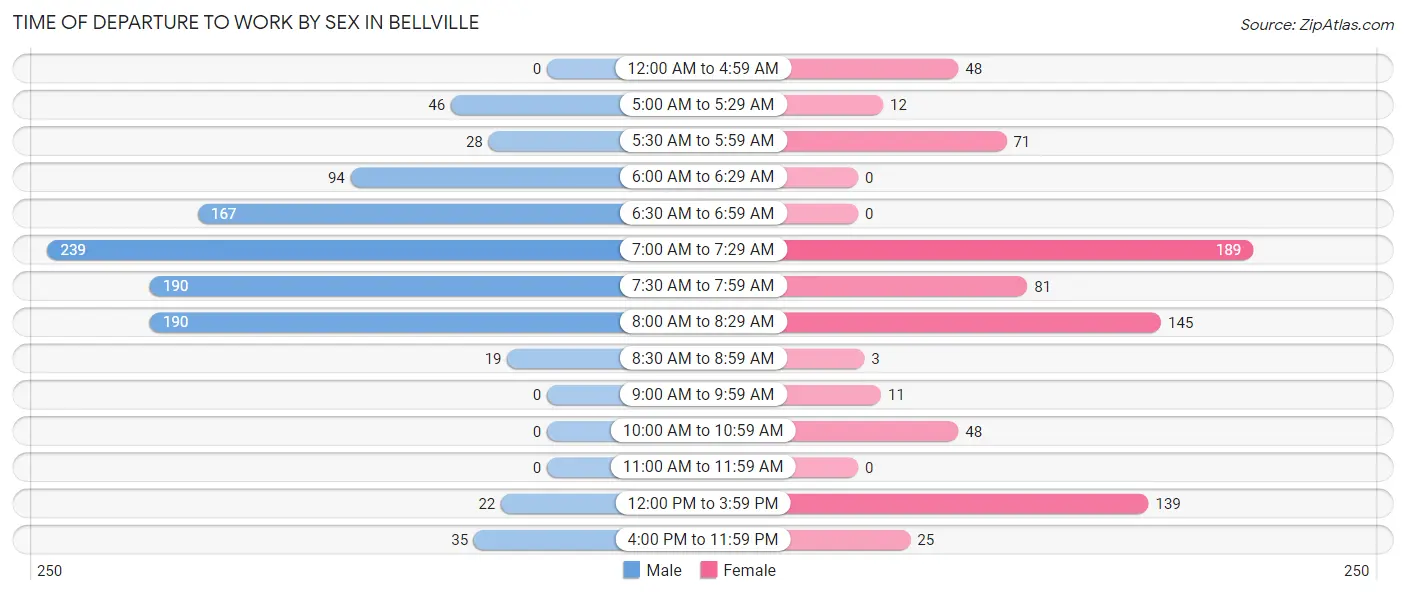
| Time of Departure | Male | Female |
| 12:00 AM to 4:59 AM | 0 (0.0%) | 48 (6.2%) |
| 5:00 AM to 5:29 AM | 46 (4.5%) | 12 (1.5%) |
| 5:30 AM to 5:59 AM | 28 (2.7%) | 71 (9.2%) |
| 6:00 AM to 6:29 AM | 94 (9.1%) | 0 (0.0%) |
| 6:30 AM to 6:59 AM | 167 (16.2%) | 0 (0.0%) |
| 7:00 AM to 7:29 AM | 239 (23.2%) | 189 (24.5%) |
| 7:30 AM to 7:59 AM | 190 (18.4%) | 81 (10.5%) |
| 8:00 AM to 8:29 AM | 190 (18.4%) | 145 (18.8%) |
| 8:30 AM to 8:59 AM | 19 (1.8%) | 3 (0.4%) |
| 9:00 AM to 9:59 AM | 0 (0.0%) | 11 (1.4%) |
| 10:00 AM to 10:59 AM | 0 (0.0%) | 48 (6.2%) |
| 11:00 AM to 11:59 AM | 0 (0.0%) | 0 (0.0%) |
| 12:00 PM to 3:59 PM | 22 (2.1%) | 139 (18.0%) |
| 4:00 PM to 11:59 PM | 35 (3.4%) | 25 (3.2%) |
| Total | 1,030 (100.0%) | 772 (100.0%) |
Housing Occupancy in Bellville
Occupancy by Ownership in Bellville
Of the total 1,548 dwellings in Bellville, owner-occupied units account for 1,010 (65.2%), while renter-occupied units make up 538 (34.7%).
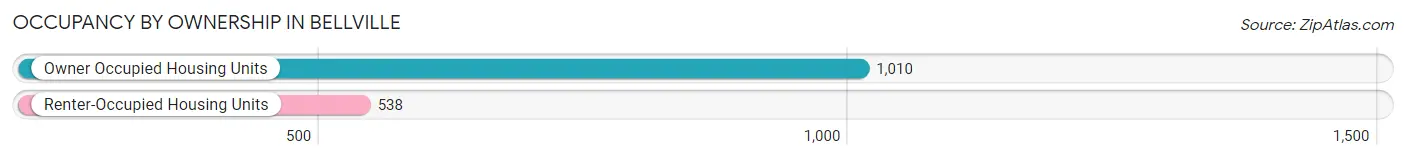
| Occupancy | # Housing Units | % Housing Units |
| Owner Occupied Housing Units | 1,010 | 65.2% |
| Renter-Occupied Housing Units | 538 | 34.7% |
| Total Occupied Housing Units | 1,548 | 100.0% |
Occupancy by Household Size in Bellville
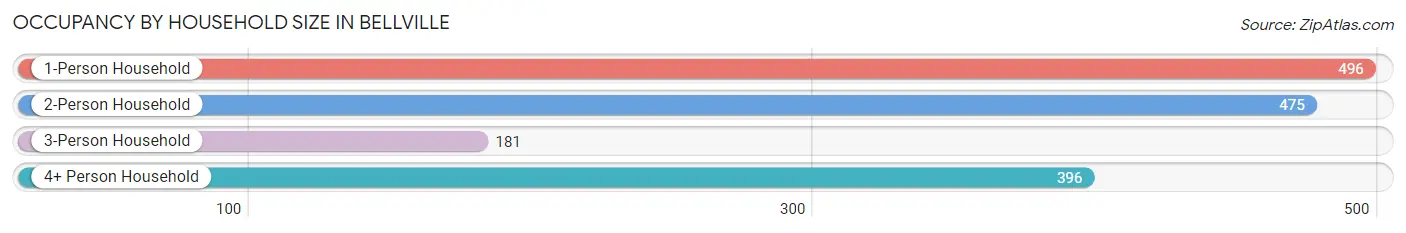
| Household Size | # Housing Units | % Housing Units |
| 1-Person Household | 496 | 32.0% |
| 2-Person Household | 475 | 30.7% |
| 3-Person Household | 181 | 11.7% |
| 4+ Person Household | 396 | 25.6% |
| Total Housing Units | 1,548 | 100.0% |
Occupancy by Ownership by Household Size in Bellville
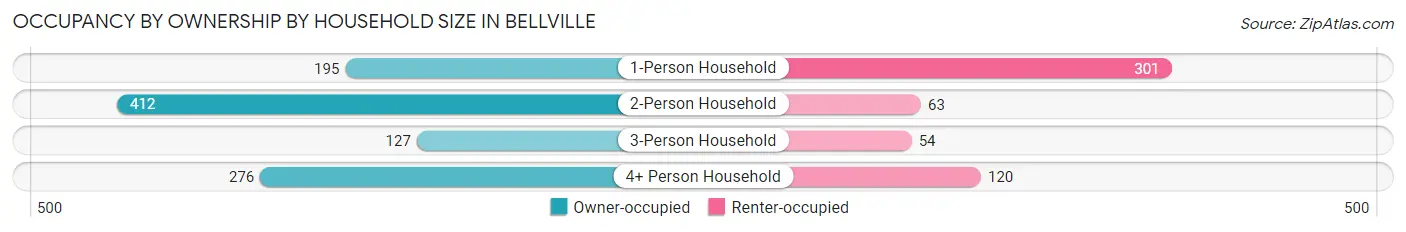
| Household Size | Owner-occupied | Renter-occupied |
| 1-Person Household | 195 (39.3%) | 301 (60.7%) |
| 2-Person Household | 412 (86.7%) | 63 (13.3%) |
| 3-Person Household | 127 (70.2%) | 54 (29.8%) |
| 4+ Person Household | 276 (69.7%) | 120 (30.3%) |
| Total Housing Units | 1,010 (65.2%) | 538 (34.7%) |
Occupancy by Educational Attainment in Bellville
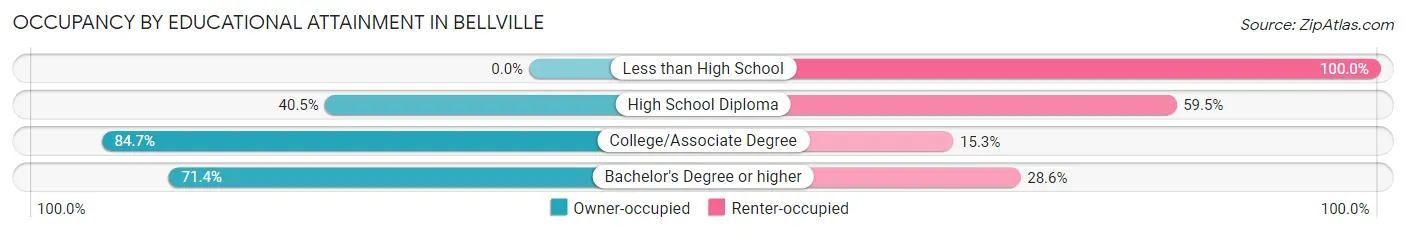
| Household Size | Owner-occupied | Renter-occupied |
| Less than High School | 0 (0.0%) | 146 (100.0%) |
| High School Diploma | 94 (40.5%) | 138 (59.5%) |
| College/Associate Degree | 511 (84.7%) | 92 (15.3%) |
| Bachelor's Degree or higher | 405 (71.4%) | 162 (28.6%) |
Occupancy by Age of Householder in Bellville
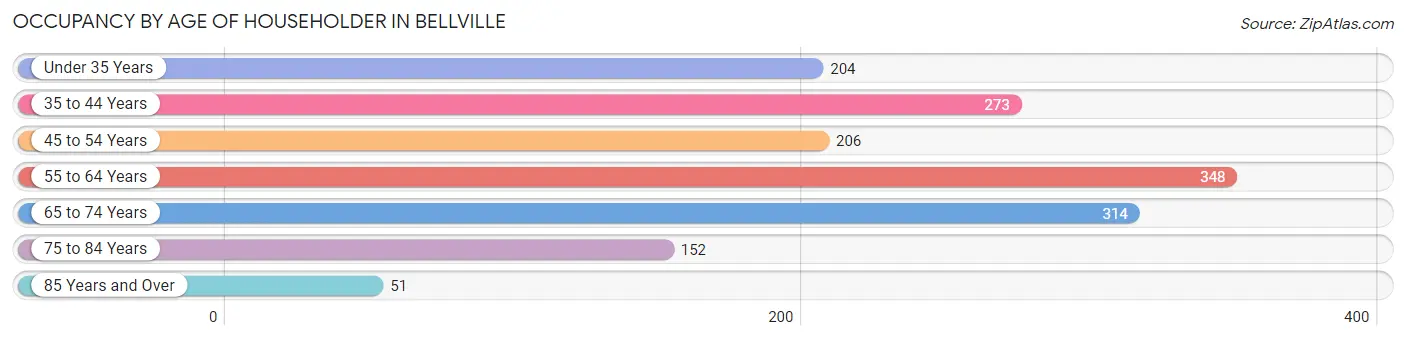
| Age Bracket | # Households | % Households |
| Under 35 Years | 204 | 13.2% |
| 35 to 44 Years | 273 | 17.6% |
| 45 to 54 Years | 206 | 13.3% |
| 55 to 64 Years | 348 | 22.5% |
| 65 to 74 Years | 314 | 20.3% |
| 75 to 84 Years | 152 | 9.8% |
| 85 Years and Over | 51 | 3.3% |
| Total | 1,548 | 100.0% |
Housing Finances in Bellville
Median Income by Occupancy in Bellville
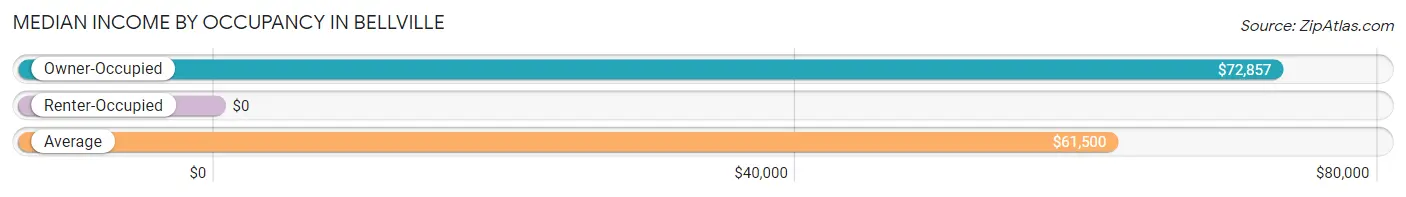
| Occupancy Type | # Households | Median Income |
| Owner-Occupied | 1,010 (65.2%) | $72,857 |
| Renter-Occupied | 538 (34.7%) | $0 |
| Average | 1,548 (100.0%) | $61,500 |
Occupancy by Householder Income Bracket in Bellville
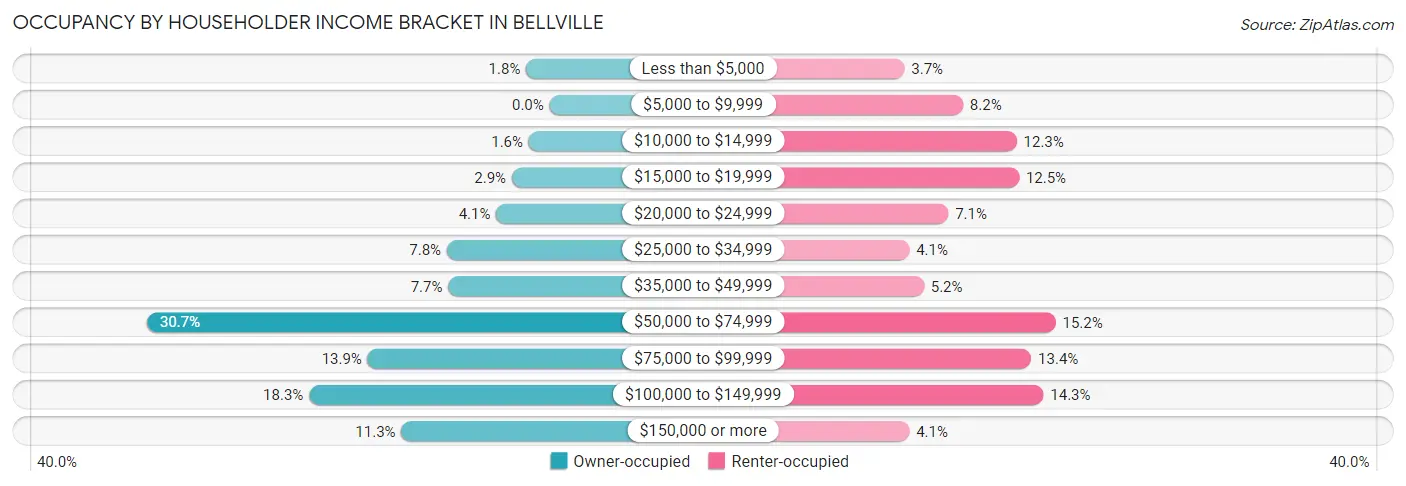
| Income Bracket | Owner-occupied | Renter-occupied |
| Less than $5,000 | 18 (1.8%) | 20 (3.7%) |
| $5,000 to $9,999 | 0 (0.0%) | 44 (8.2%) |
| $10,000 to $14,999 | 16 (1.6%) | 66 (12.3%) |
| $15,000 to $19,999 | 29 (2.9%) | 67 (12.4%) |
| $20,000 to $24,999 | 41 (4.1%) | 38 (7.1%) |
| $25,000 to $34,999 | 79 (7.8%) | 22 (4.1%) |
| $35,000 to $49,999 | 78 (7.7%) | 28 (5.2%) |
| $50,000 to $74,999 | 310 (30.7%) | 82 (15.2%) |
| $75,000 to $99,999 | 140 (13.9%) | 72 (13.4%) |
| $100,000 to $149,999 | 185 (18.3%) | 77 (14.3%) |
| $150,000 or more | 114 (11.3%) | 22 (4.1%) |
| Total | 1,010 (100.0%) | 538 (100.0%) |
Monthly Housing Cost Tiers in Bellville
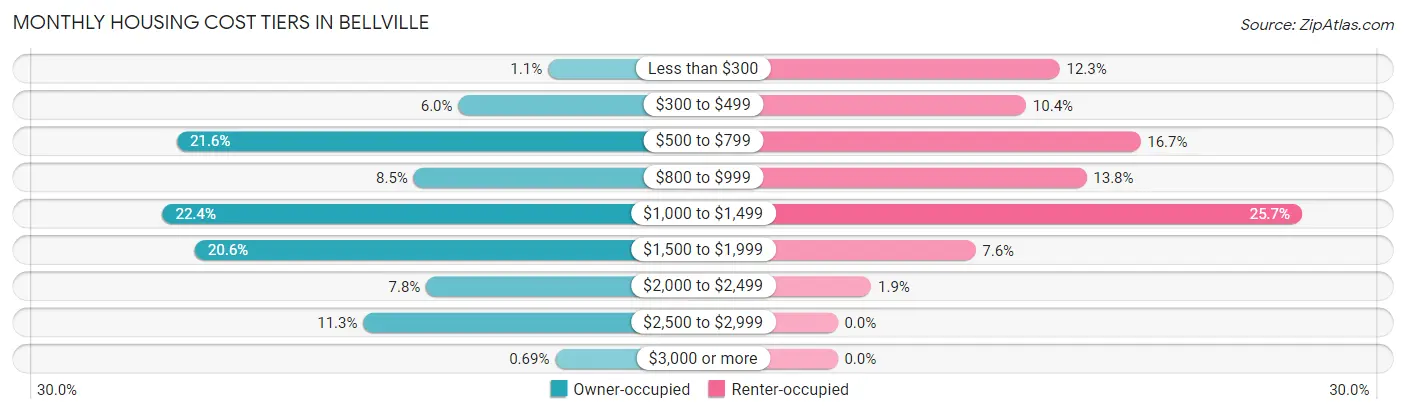
| Monthly Cost | Owner-occupied | Renter-occupied |
| Less than $300 | 11 (1.1%) | 66 (12.3%) |
| $300 to $499 | 61 (6.0%) | 56 (10.4%) |
| $500 to $799 | 218 (21.6%) | 90 (16.7%) |
| $800 to $999 | 86 (8.5%) | 74 (13.8%) |
| $1,000 to $1,499 | 226 (22.4%) | 138 (25.7%) |
| $1,500 to $1,999 | 208 (20.6%) | 41 (7.6%) |
| $2,000 to $2,499 | 79 (7.8%) | 10 (1.9%) |
| $2,500 to $2,999 | 114 (11.3%) | 0 (0.0%) |
| $3,000 or more | 7 (0.7%) | 0 (0.0%) |
| Total | 1,010 (100.0%) | 538 (100.0%) |
Physical Housing Characteristics in Bellville
Housing Structures in Bellville
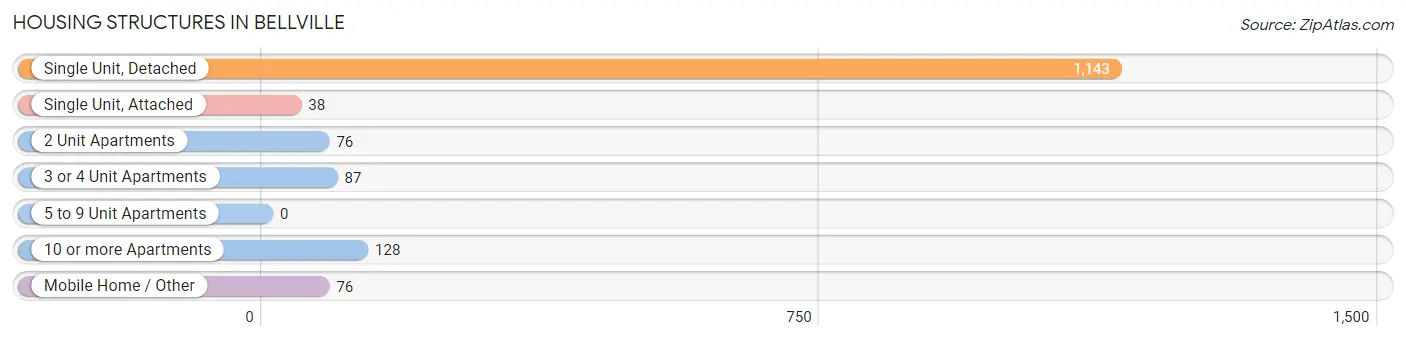
| Structure Type | # Housing Units | % Housing Units |
| Single Unit, Detached | 1,143 | 73.8% |
| Single Unit, Attached | 38 | 2.5% |
| 2 Unit Apartments | 76 | 4.9% |
| 3 or 4 Unit Apartments | 87 | 5.6% |
| 5 to 9 Unit Apartments | 0 | 0.0% |
| 10 or more Apartments | 128 | 8.3% |
| Mobile Home / Other | 76 | 4.9% |
| Total | 1,548 | 100.0% |
Housing Structures by Occupancy in Bellville
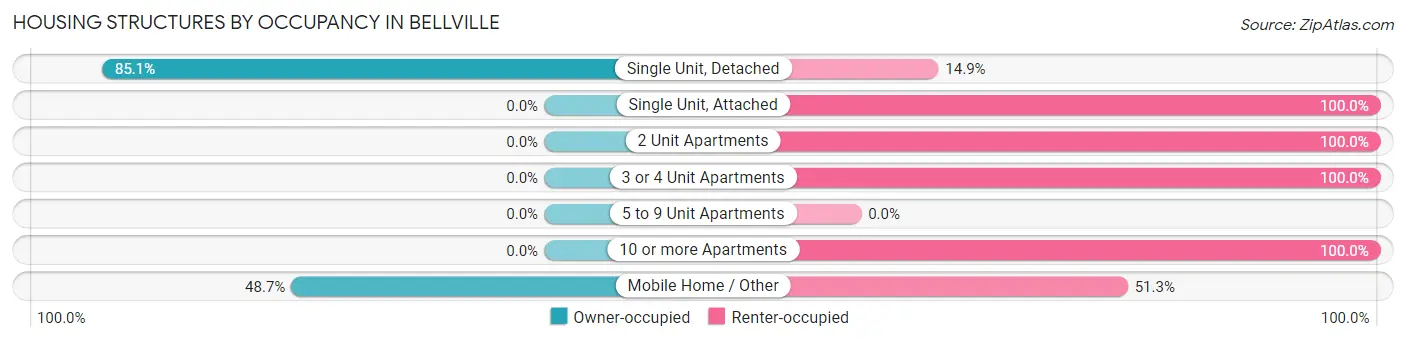
| Structure Type | Owner-occupied | Renter-occupied |
| Single Unit, Detached | 973 (85.1%) | 170 (14.9%) |
| Single Unit, Attached | 0 (0.0%) | 38 (100.0%) |
| 2 Unit Apartments | 0 (0.0%) | 76 (100.0%) |
| 3 or 4 Unit Apartments | 0 (0.0%) | 87 (100.0%) |
| 5 to 9 Unit Apartments | 0 (0.0%) | 0 (0.0%) |
| 10 or more Apartments | 0 (0.0%) | 128 (100.0%) |
| Mobile Home / Other | 37 (48.7%) | 39 (51.3%) |
| Total | 1,010 (65.2%) | 538 (34.7%) |
Housing Structures by Number of Rooms in Bellville
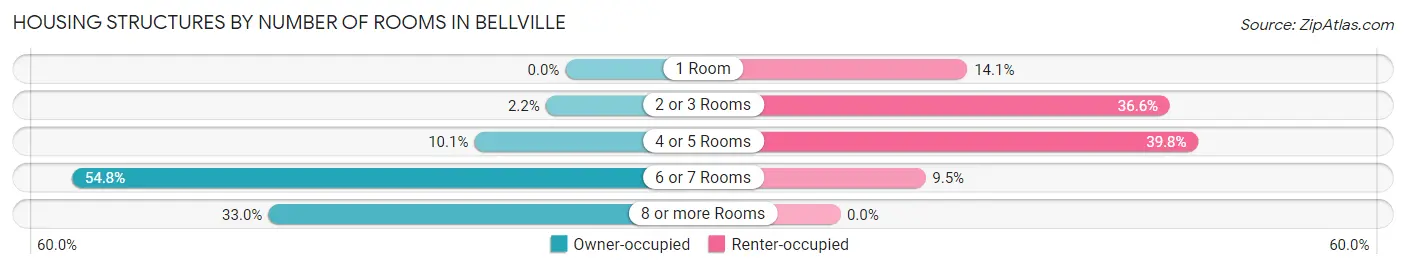
| Number of Rooms | Owner-occupied | Renter-occupied |
| 1 Room | 0 (0.0%) | 76 (14.1%) |
| 2 or 3 Rooms | 22 (2.2%) | 197 (36.6%) |
| 4 or 5 Rooms | 102 (10.1%) | 214 (39.8%) |
| 6 or 7 Rooms | 553 (54.7%) | 51 (9.5%) |
| 8 or more Rooms | 333 (33.0%) | 0 (0.0%) |
| Total | 1,010 (100.0%) | 538 (100.0%) |
Housing Structure by Heating Type in Bellville
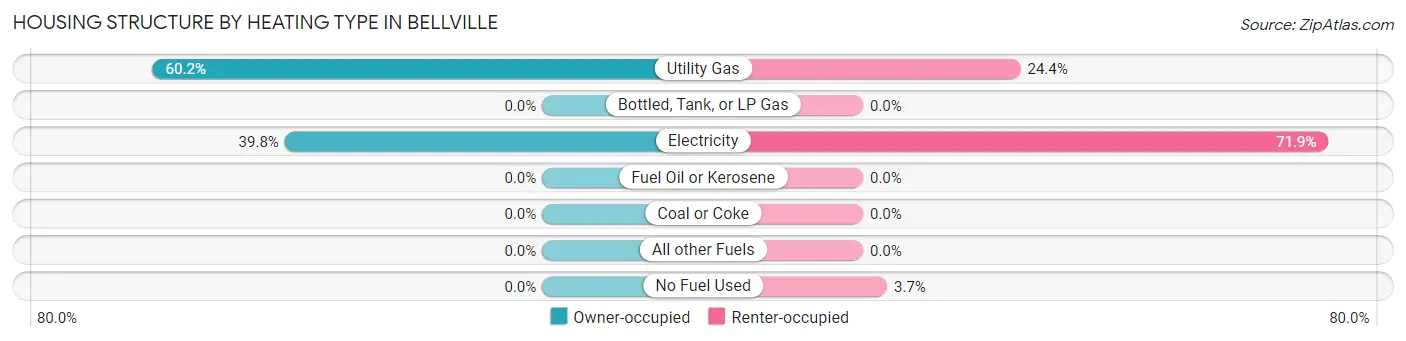
| Heating Type | Owner-occupied | Renter-occupied |
| Utility Gas | 608 (60.2%) | 131 (24.3%) |
| Bottled, Tank, or LP Gas | 0 (0.0%) | 0 (0.0%) |
| Electricity | 402 (39.8%) | 387 (71.9%) |
| Fuel Oil or Kerosene | 0 (0.0%) | 0 (0.0%) |
| Coal or Coke | 0 (0.0%) | 0 (0.0%) |
| All other Fuels | 0 (0.0%) | 0 (0.0%) |
| No Fuel Used | 0 (0.0%) | 20 (3.7%) |
| Total | 1,010 (100.0%) | 538 (100.0%) |
Household Vehicle Usage in Bellville
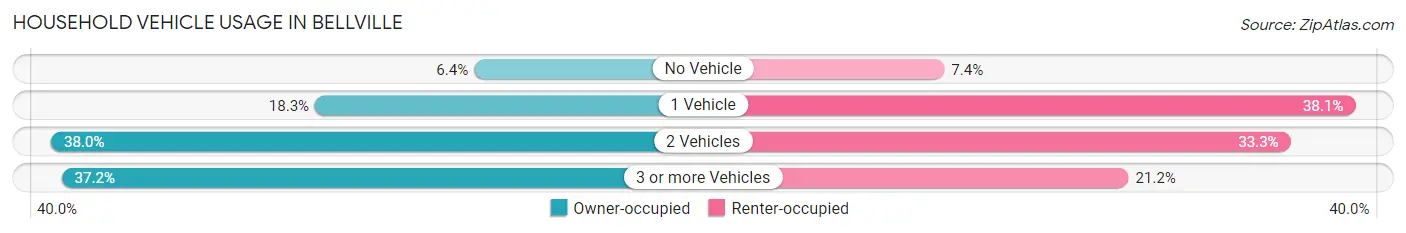
| Vehicles per Household | Owner-occupied | Renter-occupied |
| No Vehicle | 65 (6.4%) | 40 (7.4%) |
| 1 Vehicle | 185 (18.3%) | 205 (38.1%) |
| 2 Vehicles | 384 (38.0%) | 179 (33.3%) |
| 3 or more Vehicles | 376 (37.2%) | 114 (21.2%) |
| Total | 1,010 (100.0%) | 538 (100.0%) |
Real Estate & Mortgages in Bellville
Real Estate and Mortgage Overview in Bellville
| Characteristic | Without Mortgage | With Mortgage |
| Housing Units | 426 | 584 |
| Median Property Value | $220,200 | $256,000 |
| Median Household Income | $62,188 | $95 |
| Monthly Housing Costs | $680 | $7 |
| Real Estate Taxes | $2,836 | $0 |
Property Value by Mortgage Status in Bellville
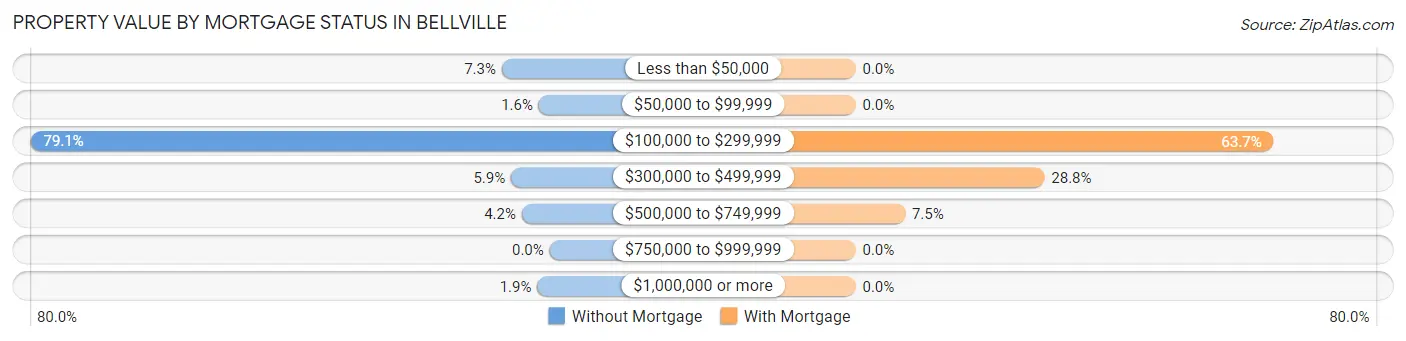
| Property Value | Without Mortgage | With Mortgage |
| Less than $50,000 | 31 (7.3%) | 0 (0.0%) |
| $50,000 to $99,999 | 7 (1.6%) | 0 (0.0%) |
| $100,000 to $299,999 | 337 (79.1%) | 372 (63.7%) |
| $300,000 to $499,999 | 25 (5.9%) | 168 (28.8%) |
| $500,000 to $749,999 | 18 (4.2%) | 44 (7.5%) |
| $750,000 to $999,999 | 0 (0.0%) | 0 (0.0%) |
| $1,000,000 or more | 8 (1.9%) | 0 (0.0%) |
| Total | 426 (100.0%) | 584 (100.0%) |
Household Income by Mortgage Status in Bellville
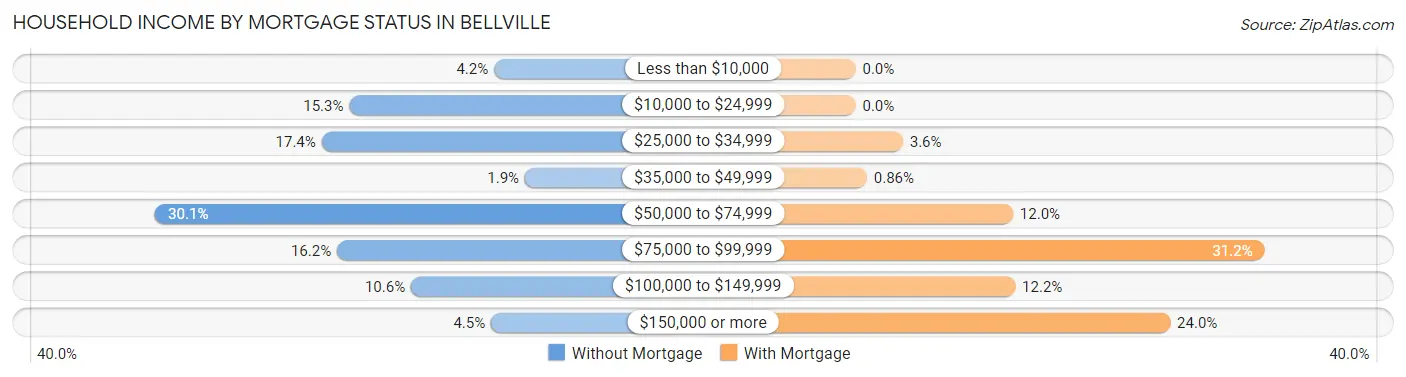
| Household Income | Without Mortgage | With Mortgage |
| Less than $10,000 | 18 (4.2%) | 0 (0.0%) |
| $10,000 to $24,999 | 65 (15.3%) | 0 (0.0%) |
| $25,000 to $34,999 | 74 (17.4%) | 21 (3.6%) |
| $35,000 to $49,999 | 8 (1.9%) | 5 (0.9%) |
| $50,000 to $74,999 | 128 (30.0%) | 70 (12.0%) |
| $75,000 to $99,999 | 69 (16.2%) | 182 (31.2%) |
| $100,000 to $149,999 | 45 (10.6%) | 71 (12.2%) |
| $150,000 or more | 19 (4.5%) | 140 (24.0%) |
| Total | 426 (100.0%) | 584 (100.0%) |
Property Value to Household Income Ratio in Bellville
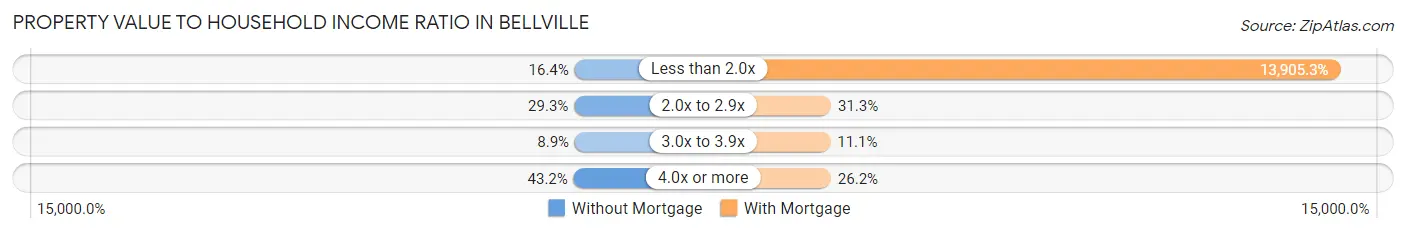
| Value-to-Income Ratio | Without Mortgage | With Mortgage |
| Less than 2.0x | 70 (16.4%) | 81,207 (13,905.3%) |
| 2.0x to 2.9x | 125 (29.3%) | 183 (31.3%) |
| 3.0x to 3.9x | 38 (8.9%) | 65 (11.1%) |
| 4.0x or more | 184 (43.2%) | 153 (26.2%) |
| Total | 426 (100.0%) | 584 (100.0%) |
Real Estate Taxes by Mortgage Status in Bellville
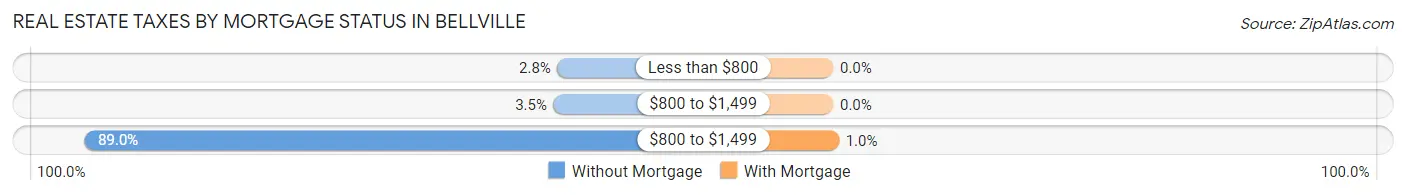
| Property Taxes | Without Mortgage | With Mortgage |
| Less than $800 | 12 (2.8%) | 0 (0.0%) |
| $800 to $1,499 | 15 (3.5%) | 0 (0.0%) |
| $800 to $1,499 | 379 (89.0%) | 6 (1.0%) |
| Total | 426 (100.0%) | 584 (100.0%) |
Health & Disability in Bellville
Health Insurance Coverage by Age in Bellville
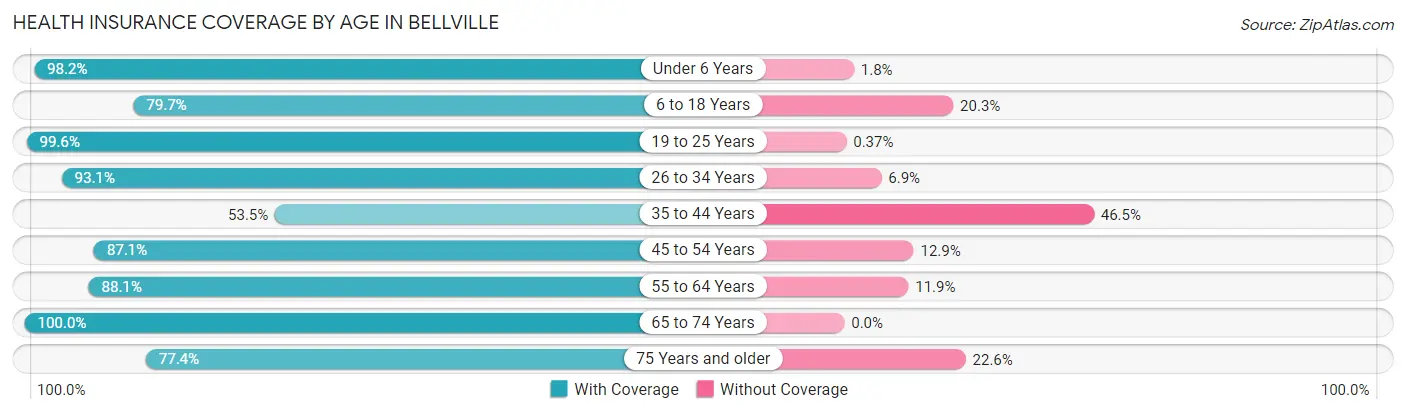
| Age Bracket | With Coverage | Without Coverage |
| Under 6 Years | 221 (98.2%) | 4 (1.8%) |
| 6 to 18 Years | 683 (79.7%) | 174 (20.3%) |
| 19 to 25 Years | 266 (99.6%) | 1 (0.4%) |
| 26 to 34 Years | 458 (93.1%) | 34 (6.9%) |
| 35 to 44 Years | 277 (53.5%) | 241 (46.5%) |
| 45 to 54 Years | 310 (87.1%) | 46 (12.9%) |
| 55 to 64 Years | 413 (88.1%) | 56 (11.9%) |
| 65 to 74 Years | 545 (100.0%) | 0 (0.0%) |
| 75 Years and older | 260 (77.4%) | 76 (22.6%) |
| Total | 3,433 (84.5%) | 632 (15.5%) |
Health Insurance Coverage by Citizenship Status in Bellville
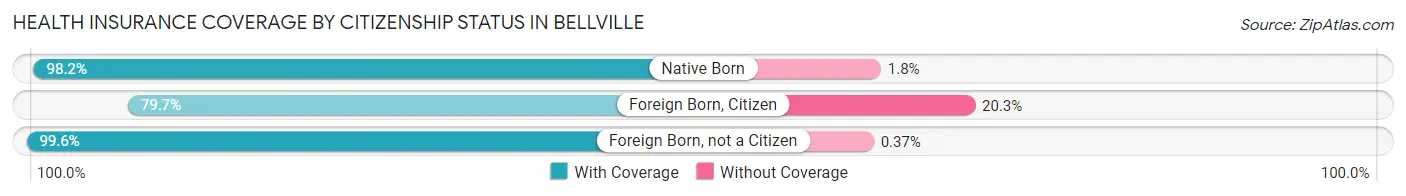
| Citizenship Status | With Coverage | Without Coverage |
| Native Born | 221 (98.2%) | 4 (1.8%) |
| Foreign Born, Citizen | 683 (79.7%) | 174 (20.3%) |
| Foreign Born, not a Citizen | 266 (99.6%) | 1 (0.4%) |
Health Insurance Coverage by Household Income in Bellville
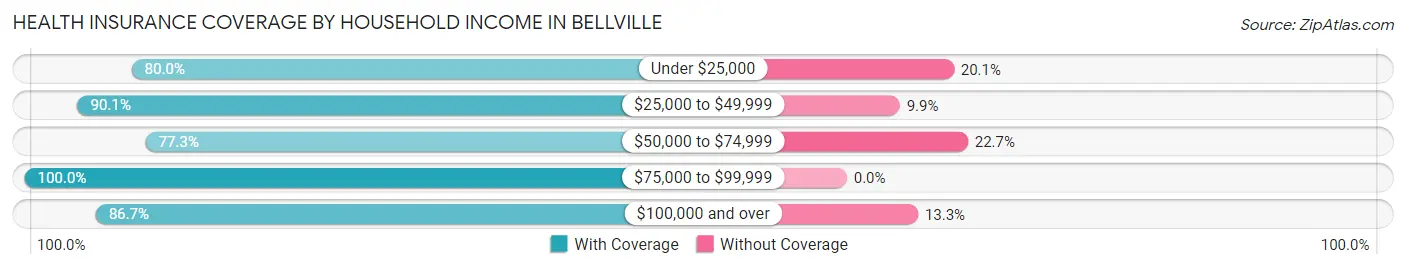
| Household Income | With Coverage | Without Coverage |
| Under $25,000 | 323 (79.9%) | 81 (20.1%) |
| $25,000 to $49,999 | 300 (90.1%) | 33 (9.9%) |
| $50,000 to $74,999 | 1,163 (77.3%) | 341 (22.7%) |
| $75,000 to $99,999 | 461 (100.0%) | 0 (0.0%) |
| $100,000 and over | 1,144 (86.7%) | 176 (13.3%) |
Public vs Private Health Insurance Coverage by Age in Bellville
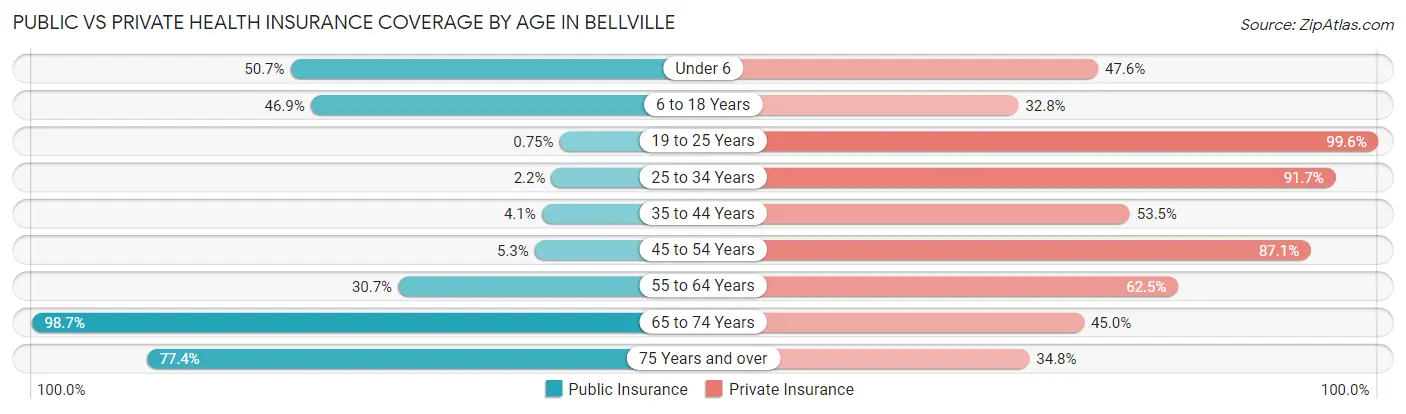
| Age Bracket | Public Insurance | Private Insurance |
| Under 6 | 114 (50.7%) | 107 (47.6%) |
| 6 to 18 Years | 402 (46.9%) | 281 (32.8%) |
| 19 to 25 Years | 2 (0.7%) | 266 (99.6%) |
| 25 to 34 Years | 11 (2.2%) | 451 (91.7%) |
| 35 to 44 Years | 21 (4.1%) | 277 (53.5%) |
| 45 to 54 Years | 19 (5.3%) | 310 (87.1%) |
| 55 to 64 Years | 144 (30.7%) | 293 (62.5%) |
| 65 to 74 Years | 538 (98.7%) | 245 (45.0%) |
| 75 Years and over | 260 (77.4%) | 117 (34.8%) |
| Total | 1,511 (37.2%) | 2,347 (57.7%) |
Disability Status by Sex by Age in Bellville
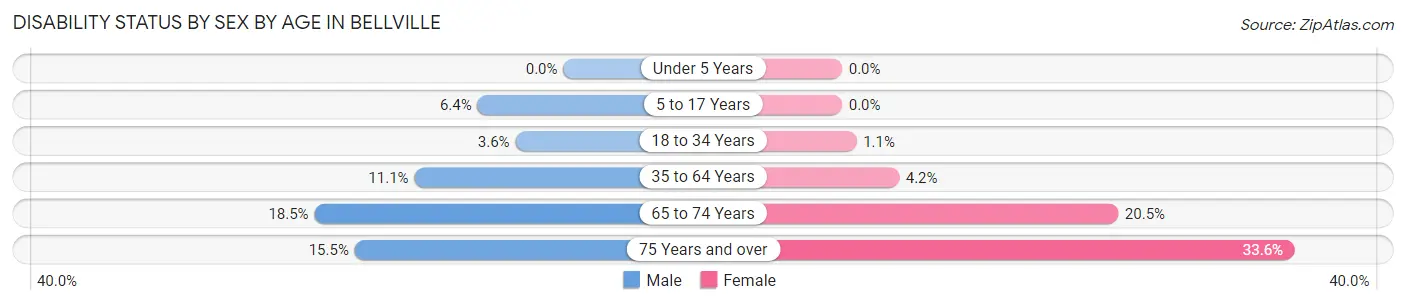
| Age Bracket | Male | Female |
| Under 5 Years | 0 (0.0%) | 0 (0.0%) |
| 5 to 17 Years | 26 (6.4%) | 0 (0.0%) |
| 18 to 34 Years | 18 (3.6%) | 4 (1.1%) |
| 35 to 64 Years | 78 (11.1%) | 27 (4.2%) |
| 65 to 74 Years | 34 (18.5%) | 74 (20.5%) |
| 75 Years and over | 35 (15.5%) | 37 (33.6%) |
Disability Class by Sex by Age in Bellville
Disability Class: Hearing Difficulty
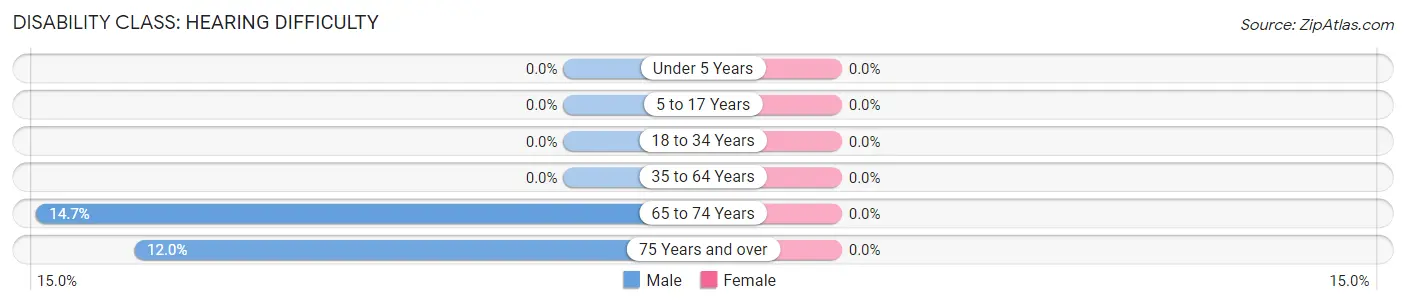
| Age Bracket | Male | Female |
| Under 5 Years | 0 (0.0%) | 0 (0.0%) |
| 5 to 17 Years | 0 (0.0%) | 0 (0.0%) |
| 18 to 34 Years | 0 (0.0%) | 0 (0.0%) |
| 35 to 64 Years | 0 (0.0%) | 0 (0.0%) |
| 65 to 74 Years | 27 (14.7%) | 0 (0.0%) |
| 75 Years and over | 27 (11.9%) | 0 (0.0%) |
Disability Class: Vision Difficulty
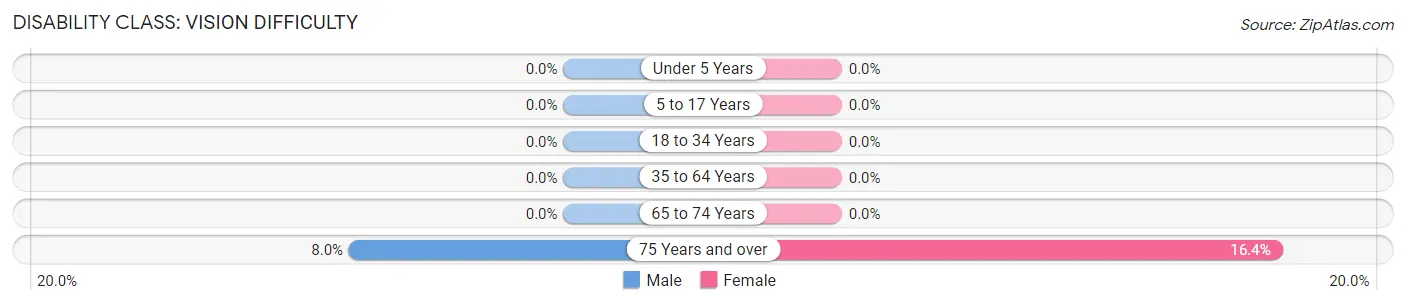
| Age Bracket | Male | Female |
| Under 5 Years | 0 (0.0%) | 0 (0.0%) |
| 5 to 17 Years | 0 (0.0%) | 0 (0.0%) |
| 18 to 34 Years | 0 (0.0%) | 0 (0.0%) |
| 35 to 64 Years | 0 (0.0%) | 0 (0.0%) |
| 65 to 74 Years | 0 (0.0%) | 0 (0.0%) |
| 75 Years and over | 18 (8.0%) | 18 (16.4%) |
Disability Class: Cognitive Difficulty
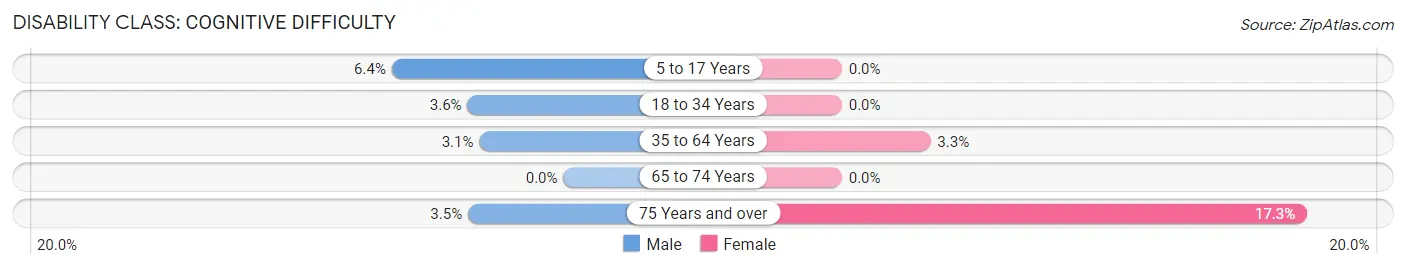
| Age Bracket | Male | Female |
| 5 to 17 Years | 26 (6.4%) | 0 (0.0%) |
| 18 to 34 Years | 18 (3.6%) | 0 (0.0%) |
| 35 to 64 Years | 22 (3.1%) | 21 (3.3%) |
| 65 to 74 Years | 0 (0.0%) | 0 (0.0%) |
| 75 Years and over | 8 (3.5%) | 19 (17.3%) |
Disability Class: Ambulatory Difficulty
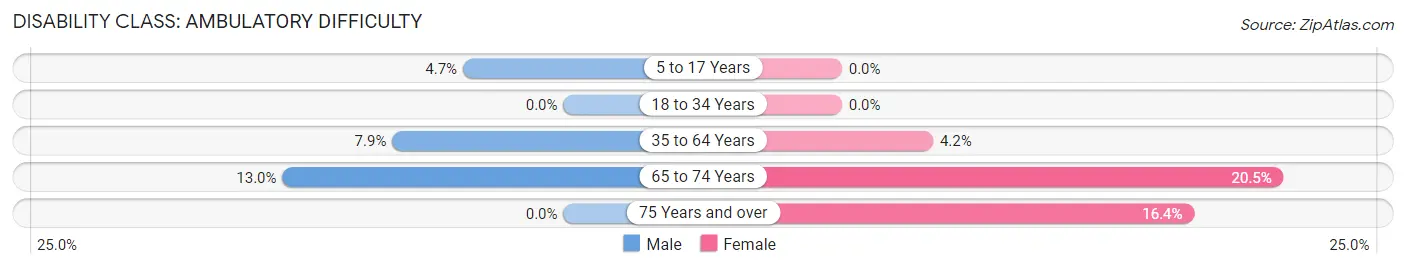
| Age Bracket | Male | Female |
| 5 to 17 Years | 19 (4.7%) | 0 (0.0%) |
| 18 to 34 Years | 0 (0.0%) | 0 (0.0%) |
| 35 to 64 Years | 56 (7.9%) | 27 (4.2%) |
| 65 to 74 Years | 24 (13.0%) | 74 (20.5%) |
| 75 Years and over | 0 (0.0%) | 18 (16.4%) |
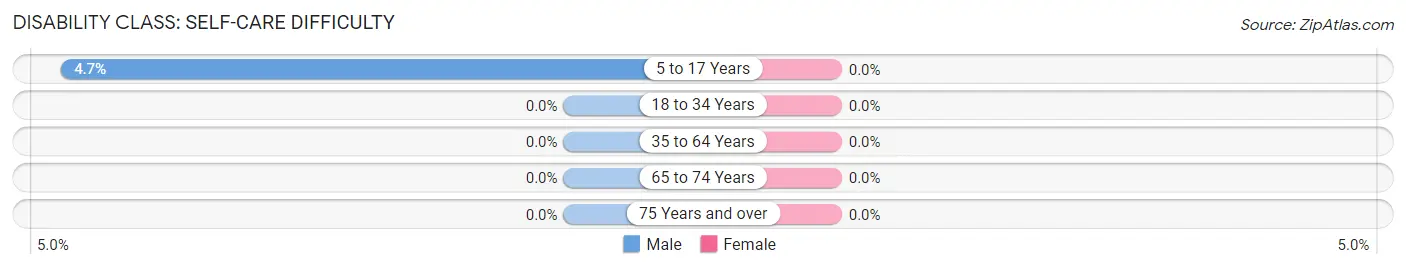
Disability Class: Self-Care Difficulty
| Age Bracket | Male | Female |
| 5 to 17 Years | 19 (4.7%) | 0 (0.0%) |
| 18 to 34 Years | 0 (0.0%) | 0 (0.0%) |
| 35 to 64 Years | 0 (0.0%) | 0 (0.0%) |
| 65 to 74 Years | 0 (0.0%) | 0 (0.0%) |
| 75 Years and over | 0 (0.0%) | 0 (0.0%) |
Technology Access in Bellville
Computing Device Access in Bellville
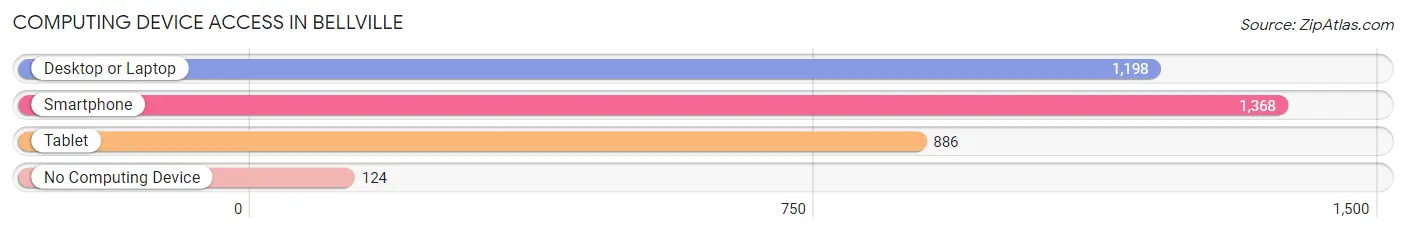
| Device Type | # Households | % Households |
| Desktop or Laptop | 1,198 | 77.4% |
| Smartphone | 1,368 | 88.4% |
| Tablet | 886 | 57.2% |
| No Computing Device | 124 | 8.0% |
| Total | 1,548 | 100.0% |
Internet Access in Bellville
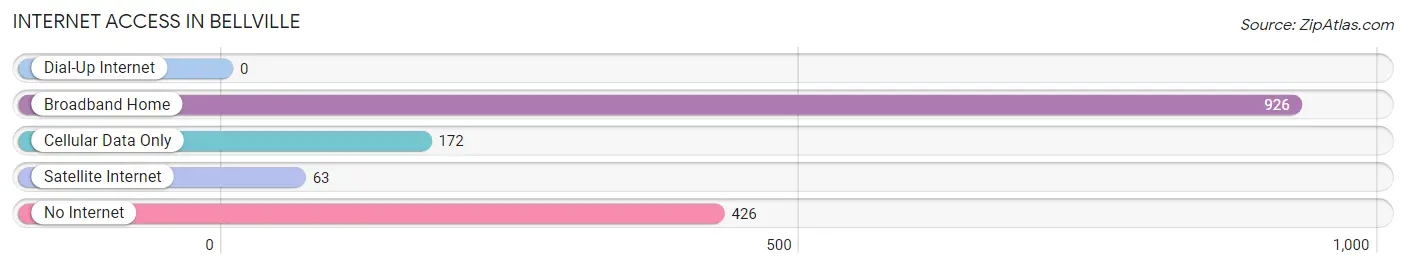
| Internet Type | # Households | % Households |
| Dial-Up Internet | 0 | 0.0% |
| Broadband Home | 926 | 59.8% |
| Cellular Data Only | 172 | 11.1% |
| Satellite Internet | 63 | 4.1% |
| No Internet | 426 | 27.5% |
| Total | 1,548 | 100.0% |
Bellville Summary
Bellville, Texas is a small town located in Austin County, Texas. It is situated about 50 miles west of Houston and is part of the Greater Houston metropolitan area. The town was founded in 1846 and is the county seat of Austin County. The population of Bellville was 2,890 at the 2010 census.
History
Bellville was founded in 1846 by German immigrants who had come to Texas in search of a better life. The town was named after the Bell family, who were among the first settlers. The town was originally known as Bell’s Settlement, but the name was changed to Bellville in 1851.
In the late 19th century, Bellville was a thriving agricultural center, with cotton, corn, and other crops being grown in the area. The town also had a number of businesses, including a bank, a hotel, and a newspaper.
In the early 20th century, Bellville began to decline as the railroad bypassed the town and the population began to move away. However, the town was revitalized in the 1950s when the oil industry began to boom in the area.
Geography
Bellville is located in Austin County, Texas, about 50 miles west of Houston. The town is situated on the Brazos River, which is the longest river in Texas. The town is surrounded by rolling hills and is located in the heart of the Texas Hill Country.
The climate in Bellville is hot and humid in the summer and mild in the winter. The average temperature in the summer is around 90 degrees Fahrenheit, while the average temperature in the winter is around 50 degrees Fahrenheit.
Economy
The economy of Bellville is largely based on agriculture and oil production. The town is home to several large farms that produce cotton, corn, and other crops. The town is also home to several oil and gas companies, which are responsible for much of the town’s economic activity.
In addition to agriculture and oil production, Bellville is also home to several small businesses, including restaurants, retail stores, and other services. The town is also home to a number of manufacturing companies, which produce a variety of products, including furniture, clothing, and electronics.
Demographics
As of the 2010 census, the population of Bellville was 2,890. The racial makeup of the town was 79.3% White, 16.2% Hispanic or Latino, 1.2% African American, 0.7% Native American, 0.3% Asian, and 2.5% from other races.
The median household income in Bellville was $41,250, and the median family income was $50,000. The per capita income in the town was $20,845. The poverty rate in Bellville was 16.2%, which is higher than the national average.
Conclusion
Bellville, Texas is a small town located in Austin County, Texas. It was founded in 1846 by German immigrants and is the county seat of Austin County. The town is situated on the Brazos River and is surrounded by rolling hills. The economy of Bellville is largely based on agriculture and oil production, and the town is home to several small businesses. The population of Bellville was 2,890 at the 2010 census, and the median household income was $41,250.
Common Questions
What is Per Capita Income in Bellville?
Per Capita income in Bellville is $30,119.
What is the Median Family Income in Bellville?
Median Family Income in Bellville is $88,100.
What is the Median Household income in Bellville?
Median Household Income in Bellville is $61,500.
What is Income or Wage Gap in Bellville?
Income or Wage Gap in Bellville is 19.0%.
Women in Bellville earn 81.0 cents for every dollar earned by a man.
What is Inequality or Gini Index in Bellville?
Inequality or Gini Index in Bellville is 0.44.
What is the Total Population of Bellville?
Total Population of Bellville is 4,200.
What is the Total Male Population of Bellville?
Total Male Population of Bellville is 2,194.
What is the Total Female Population of Bellville?
Total Female Population of Bellville is 2,006.
What is the Ratio of Males per 100 Females in Bellville?
There are 109.37 Males per 100 Females in Bellville.
What is the Ratio of Females per 100 Males in Bellville?
There are 91.43 Females per 100 Males in Bellville.
What is the Median Population Age in Bellville?
Median Population Age in Bellville is 40.4 Years.
What is the Average Family Size in Bellville
Average Family Size in Bellville is 3.4 People.
What is the Average Household Size in Bellville
Average Household Size in Bellville is 2.6 People.
How Large is the Labor Force in Bellville?
There are 1,891 People in the Labor Forcein in Bellville.
What is the Percentage of People in the Labor Force in Bellville?
57.4% of People are in the Labor Force in Bellville.