Zip Codes with the Lowest Poverty Level Among Children Under the Age of 5 in Dallas, TX

RELATED REPORTS & OPTIONS

Lowest Poverty | Child 0-5
Population
Families and Households
Female Fertility
Female Fertility (Unmarried)
Race (Community Size)
Race (Percentage)
Ancestry (Community Size)
AfghanAfricanAlaska NativeAlbanianAlsatianAmericanApacheArabArgentineanArmenianAssyrian / Chaldean / SyriacAustralianAustrianBahamianBangladeshiBarbadianBasqueBelgianBelizeanBhutaneseBlackfeetBolivianBrazilianBritishBritish West IndianBulgarianBurmeseCajunCambodianCanadianCape VerdeanCelticCentral AmericanCentral American IndianCherokeeChickasawChileanChippewaChoctawColombianComancheCosta RicanCreekCroatianCubanCypriotCzechCzechoslovakianDanishDominicanDutchDutch West IndianEastern EuropeanEcuadorianEgyptianEnglishEstonianEthiopianEuropeanFilipinoFinnishFrenchFrench CanadianGermanGhanaianGreekGuamanian / ChamorroGuatemalanGuyaneseHaitianHonduranHungarianIcelanderIndian (Asian)IndonesianIranianIraqiIrishIroquoisIsraeliItalianJamaicanJapaneseJordanianKenyanKoreanLaotianLatvianLebaneseLiberianLithuanianLuxembourgerMalaysianMalteseMexicanMexican American IndianMongolianMoroccanNative HawaiianNavajoNew ZealanderNicaraguanNigerianNorthern EuropeanNorwegianOkinawanOsagePakistaniPalestinianPanamanianParaguayanPennsylvania GermanPeruvianPolishPortuguesePotawatomiPuebloPuerto RicanRomanianRussianSalvadoranSamoanScandinavianScotch-IrishScottishSeminoleSenegaleseSerbianSierra LeoneanSiouxSlavicSlovakSloveneSomaliSouth AfricanSouth AmericanSouth American IndianSpaniardSpanishSpanish AmericanSpanish American IndianSri LankanSubsaharan AfricanSudaneseSwedishSwissSyrianThaiTohono O'OdhamTonganTrinidadian and TobagonianTurkishUgandanUkrainianUruguayanVenezuelanVietnameseWelshWest IndianYaquiYugoslavianZimbabwean
Ancestry (Percentage)
AfghanAfricanAlaska NativeAlbanianAlsatianAmericanApacheArabArgentineanArmenianAssyrian / Chaldean / SyriacAustralianAustrianBahamianBangladeshiBarbadianBasqueBelgianBelizeanBhutaneseBlackfeetBolivianBrazilianBritishBritish West IndianBulgarianBurmeseCajunCambodianCanadianCape VerdeanCelticCentral AmericanCentral American IndianCherokeeChickasawChileanChippewaChoctawColombianComancheCosta RicanCreekCroatianCubanCypriotCzechCzechoslovakianDanishDominicanDutchDutch West IndianEastern EuropeanEcuadorianEgyptianEnglishEstonianEthiopianEuropeanFilipinoFinnishFrenchFrench CanadianGermanGhanaianGreekGuamanian / ChamorroGuatemalanGuyaneseHaitianHonduranHungarianIcelanderIndian (Asian)IndonesianIranianIraqiIrishIroquoisIsraeliItalianJamaicanJapaneseJordanianKenyanKoreanLaotianLatvianLebaneseLiberianLithuanianLuxembourgerMalaysianMalteseMexicanMexican American IndianMongolianMoroccanNative HawaiianNavajoNew ZealanderNicaraguanNigerianNorthern EuropeanNorwegianOkinawanOsagePakistaniPalestinianPanamanianParaguayanPennsylvania GermanPeruvianPolishPortuguesePotawatomiPuebloPuerto RicanRomanianRussianSalvadoranSamoanScandinavianScotch-IrishScottishSeminoleSenegaleseSerbianSierra LeoneanSiouxSlavicSlovakSloveneSomaliSouth AfricanSouth AmericanSouth American IndianSpaniardSpanishSpanish AmericanSpanish American IndianSri LankanSubsaharan AfricanSudaneseSwedishSwissSyrianThaiTohono O'OdhamTonganTrinidadian and TobagonianTurkishUgandanUkrainianUruguayanVenezuelanVietnameseWelshWest IndianYaquiYugoslavianZimbabwean
Immigrant Origin (Total)
AfghanistanAfricaAlbaniaArgentinaArmeniaAsiaAustraliaAustriaBahamasBangladeshBelarusBelgiumBelizeBoliviaBosnia and HerzegovinaBrazilBulgariaBurma / MyanmarCambodiaCameroonCanadaCaribbeanCentral AmericaChileChinaColombiaCongoCosta RicaCroatiaCubaCzechoslovakiaDenmarkDominicaDominican RepublicEastern AfricaEastern AsiaEastern EuropeEcuadorEgyptEl SalvadorEnglandEritreaEthiopiaEuropeFijiFranceGermanyGhanaGreeceGuatemalaGuyanaHaitiHondurasHong KongHungaryIndiaIndonesiaIranIraqIrelandIsraelItalyJamaicaJapanJordanKazakhstanKenyaKoreaKuwaitLaosLatin AmericaLatviaLebanonLiberiaMalaysiaMexicoMiddle AfricaMoldovaMoroccoNepalNetherlandsNicaraguaNigeriaNorthern AfricaNorthern EuropeNorwayOceaniaPakistanPanamaPeruPhilippinesPolandPortugalRomaniaRussiaSaudi ArabiaScotlandSenegalSerbiaSierra LeoneSingaporeSomaliaSouth AfricaSouth AmericaSouth Central AsiaSouth Eastern AsiaSouthern EuropeSpainSri LankaSudanSwedenSwitzerlandSyriaTaiwanThailandTrinidad and TobagoTurkeyUgandaUkraineUruguayUzbekistanVenezuelaVietnamWest IndiesWestern AfricaWestern AsiaWestern EuropeYemenZaireZimbabwe
Immigrant Origin (Percentage)
AfghanistanAfricaAlbaniaArgentinaArmeniaAsiaAustraliaAustriaBahamasBangladeshBelarusBelgiumBelizeBoliviaBosnia and HerzegovinaBrazilBulgariaBurma / MyanmarCambodiaCameroonCanadaCaribbeanCentral AmericaChileChinaColombiaCongoCosta RicaCroatiaCubaCzechoslovakiaDenmarkDominicaDominican RepublicEastern AfricaEastern AsiaEastern EuropeEcuadorEgyptEl SalvadorEnglandEritreaEthiopiaEuropeFijiFranceGermanyGhanaGreeceGuatemalaGuyanaHaitiHondurasHong KongHungaryIndiaIndonesiaIranIraqIrelandIsraelItalyJamaicaJapanJordanKazakhstanKenyaKoreaKuwaitLaosLatin AmericaLatviaLebanonLiberiaMalaysiaMexicoMiddle AfricaMoldovaMoroccoNepalNetherlandsNicaraguaNigeriaNorthern AfricaNorthern EuropeNorwayOceaniaPakistanPanamaPeruPhilippinesPolandPortugalRomaniaRussiaSaudi ArabiaScotlandSenegalSerbiaSierra LeoneSingaporeSomaliaSouth AfricaSouth AmericaSouth Central AsiaSouth Eastern AsiaSouthern EuropeSpainSri LankaSudanSwedenSwitzerlandSyriaTaiwanThailandTrinidad and TobagoTurkeyUgandaUkraineUruguayUzbekistanVenezuelaVietnamWest IndiesWestern AfricaWestern AsiaWestern EuropeYemenZaireZimbabwe
Income
Income (Families)
Income (Households)
Poverty
Poverty (Families)
Unemployment
Employment Occupations
Employment Industries
Employer Class
Commute Time
Commute Means
School Enrollment
Education by Degree Field
Occupancy
Finances
Physical Characteristics
Dallas
Compare Zip Codes
Comparison Subject

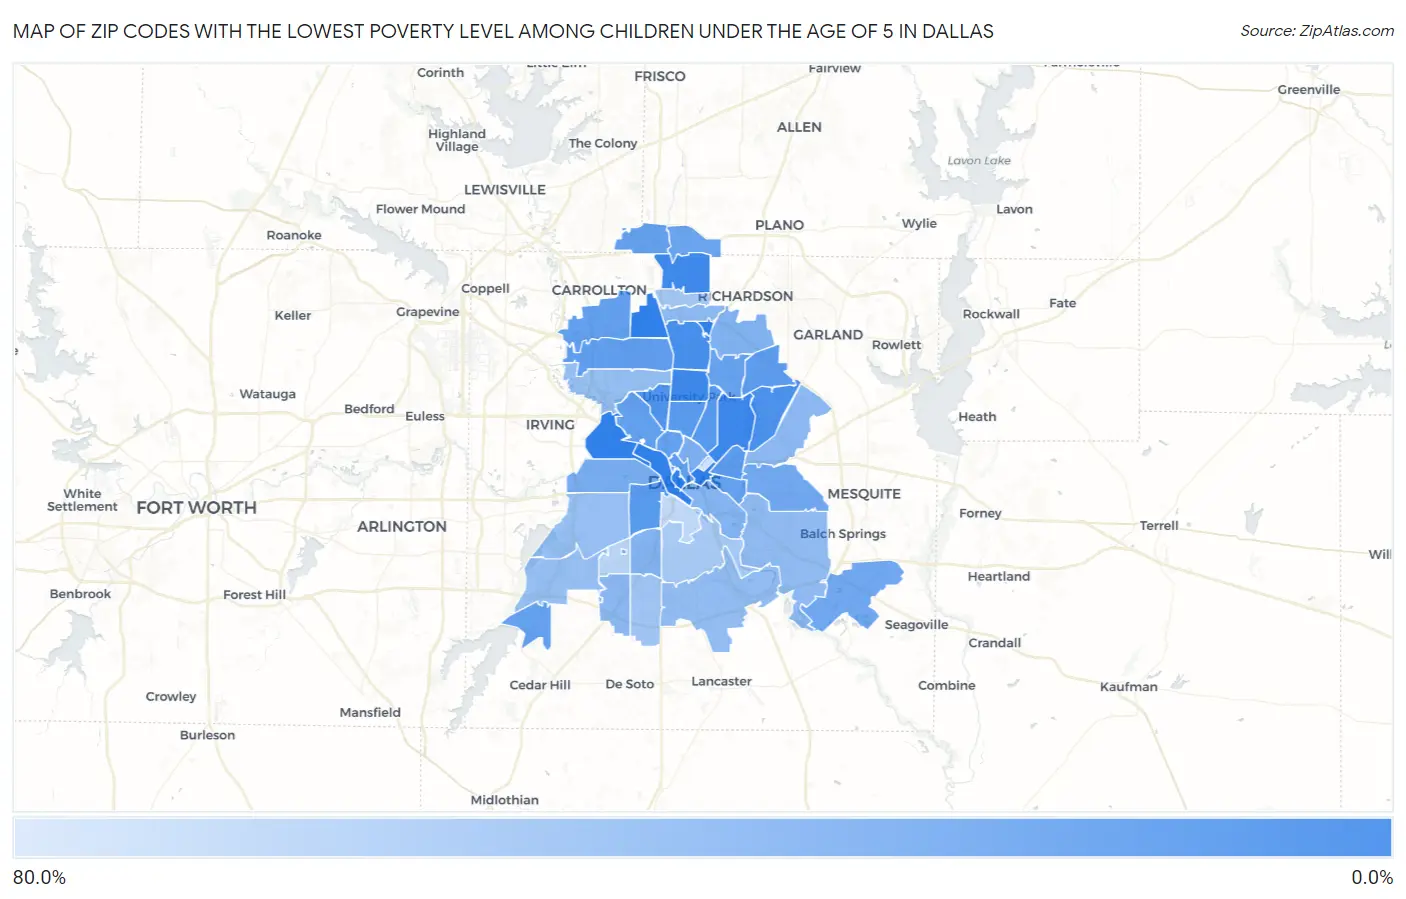
Map of Zip Codes with the Lowest Poverty Level Among Children Under the Age of 5 in Dallas

80.0%
0.0%
Zip Codes with the Lowest Poverty Level Among Children Under the Age of 5 in Dallas Map

Zip Codes with the Lowest Poverty Level Among Children Under the Age of 5 in Dallas, TX

Zip Code Child Poverty vs State vs National
1.752140.76%21.1%(-20.3)#1018.1%(-17.3)#156
2.752251.4%21.1%(-19.7)#1918.1%(-16.7)#476
3.752482.5%21.1%(-18.6)#4818.1%(-15.6)#1,152
4.752305.1%21.1%(-16.0)#13818.1%(-12.9)#2,999
5.752186.1%21.1%(-15.0)#16918.1%(-12.0)#3,671
6.752097.3%21.1%(-13.8)#21618.1%(-10.8)#4,482
7.7520610.6%21.1%(-10.5)#32518.1%(-7.49)#6,594
8.7520511.4%21.1%(-9.73)#35618.1%(-6.71)#7,064
9.7520811.4%21.1%(-9.72)#35718.1%(-6.70)#7,067
10.7522312.4%21.1%(-8.71)#40118.1%(-5.69)#7,687
11.7523813.5%21.1%(-7.62)#43618.1%(-4.60)#8,327
12.7520113.5%21.1%(-7.60)#43818.1%(-4.57)#8,343
13.7522914.4%21.1%(-6.71)#46818.1%(-3.68)#8,882
14.7523415.5%21.1%(-5.63)#50418.1%(-2.61)#9,484
15.7523515.7%21.1%(-5.36)#51618.1%(-2.33)#9,609
16.7521016.1%21.1%(-4.94)#53618.1%(-1.92)#9,836
17.7524916.4%21.1%(-4.71)#54618.1%(-1.68)#9,970
18.7521916.4%21.1%(-4.69)#54918.1%(-1.66)#9,977
19.7528716.5%21.1%(-4.61)#55218.1%(-1.58)#10,017
20.7523117.2%21.1%(-3.86)#57118.1%(-0.838)#10,349
21.7525219.3%21.1%(-1.77)#62718.1%(+1.25)#11,321
22.7525321.0%21.1%(-0.085)#67218.1%(+2.94)#12,075
23.7522721.0%21.1%(-0.043)#67418.1%(+2.98)#12,091
24.7521223.6%21.1%(+2.47)#74018.1%(+5.49)#13,121
25.7520427.3%21.1%(+6.20)#83518.1%(+9.22)#14,463
26.7524327.8%21.1%(+6.70)#85518.1%(+9.72)#14,650
27.7522428.9%21.1%(+7.82)#88418.1%(+10.8)#14,993
28.7521529.4%21.1%(+8.33)#90018.1%(+11.3)#15,136
29.7523732.7%21.1%(+11.6)#97918.1%(+14.6)#15,999
30.7522832.8%21.1%(+11.7)#98318.1%(+14.8)#16,039
31.7524034.3%21.1%(+13.2)#1,01518.1%(+16.3)#16,449
32.7521735.5%21.1%(+14.4)#1,03218.1%(+17.4)#16,711
33.7524135.9%21.1%(+14.8)#1,04318.1%(+17.8)#16,816
34.7522036.8%21.1%(+15.7)#1,05518.1%(+18.7)#17,031
35.7521138.1%21.1%(+17.0)#1,07518.1%(+20.0)#17,275
36.7523638.6%21.1%(+17.5)#1,08018.1%(+20.5)#17,388
37.7523242.3%21.1%(+21.2)#1,15218.1%(+24.3)#18,068
38.7525444.8%21.1%(+23.7)#1,18018.1%(+26.8)#18,466
39.7521646.8%21.1%(+25.7)#1,19618.1%(+28.7)#18,719
40.7523355.6%21.1%(+34.5)#1,25318.1%(+37.6)#19,657
41.7520359.3%21.1%(+38.2)#1,27318.1%(+41.2)#19,929
42.7524668.7%21.1%(+47.6)#1,30618.1%(+50.6)#20,468

Common Questions

What are the Top 10 Zip Codes with the Lowest Poverty Level Among Children Under the Age of 5 in Dallas, TX?
Top 10 Zip Codes with the Lowest Poverty Level Among Children Under the Age of 5 in Dallas, TX are:
#1
0.0%
#2
0.0%
#3
0.0%
#4
0.0%
#5
0.0%
#6
0.0%
#7
0.76%
#8
1.4%
#9
2.5%
#10
5.1%
What zip code has the Lowest Poverty Level Among Children Under the Age of 5 in Dallas, TX?
75214 has the Lowest Poverty Level Among Children Under the Age of 5 in Dallas, TX with 0.76%.
What is the Poverty Level Among Children Under the Age of 5 in Dallas, TX?
Poverty Level Among Children Under the Age of 5 in Dallas is 26.2%.
What is the Poverty Level Among Children Under the Age of 5 in Texas?
Poverty Level Among Children Under the Age of 5 in Texas is 21.1%.
What is the Poverty Level Among Children Under the Age of 5 in the United States?
Poverty Level Among Children Under the Age of 5 in the United States is 18.1%.