Saginaw, TX Map & Demographics
Saginaw Map
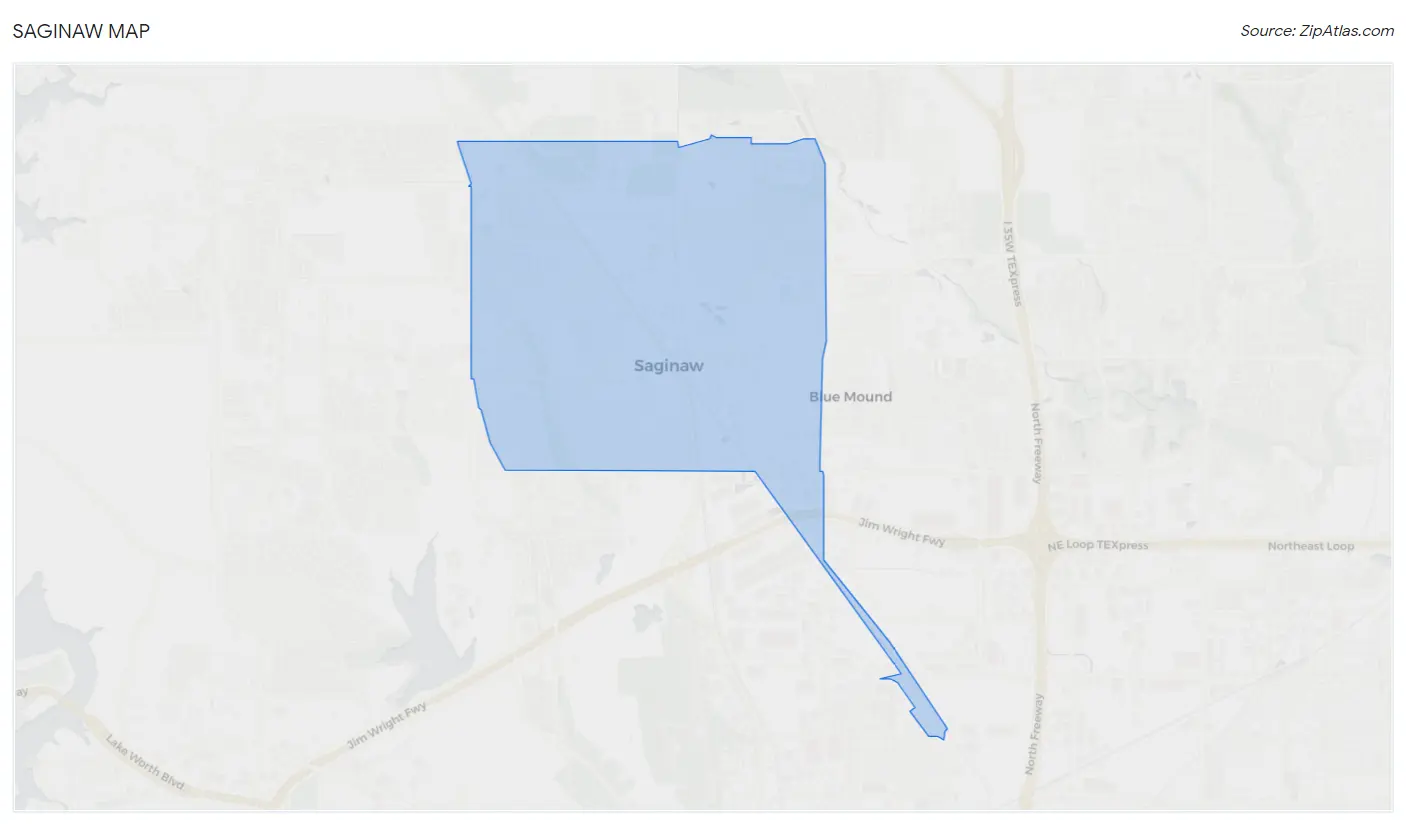
Saginaw Overview
$38,217
PER CAPITA INCOME
$109,569
AVG FAMILY INCOME
$99,752
AVG HOUSEHOLD INCOME
31.4%
WAGE / INCOME GAP [ % ]
68.6¢/ $1
WAGE / INCOME GAP [ $ ]
$10,065
FAMILY INCOME DEFICIT
0.31
INEQUALITY / GINI INDEX
24,106
TOTAL POPULATION
12,253
MALE POPULATION
11,853
FEMALE POPULATION
103.37
MALES / 100 FEMALES
96.74
FEMALES / 100 MALES
36.6
MEDIAN AGE
3.3
AVG FAMILY SIZE
2.8
AVG HOUSEHOLD SIZE
12,942
LABOR FORCE [ PEOPLE ]
70.6%
PERCENT IN LABOR FORCE
3.5%
UNEMPLOYMENT RATE
Income in Saginaw
Income Overview in Saginaw
Per Capita Income in Saginaw is $38,217, while median incomes of families and households are $109,569 and $99,752 respectively.
| Characteristic | Number | Measure |
| Per Capita Income | 24,106 | $38,217 |
| Median Family Income | 6,303 | $109,569 |
| Mean Family Income | 6,303 | $110,569 |
| Median Household Income | 8,700 | $99,752 |
| Mean Household Income | 8,700 | $103,809 |
| Income Deficit | 6,303 | $10,065 |
| Wage / Income Gap (%) | 24,106 | 31.35% |
| Wage / Income Gap ($) | 24,106 | 68.65¢ per $1 |
| Gini / Inequality Index | 24,106 | 0.31 |
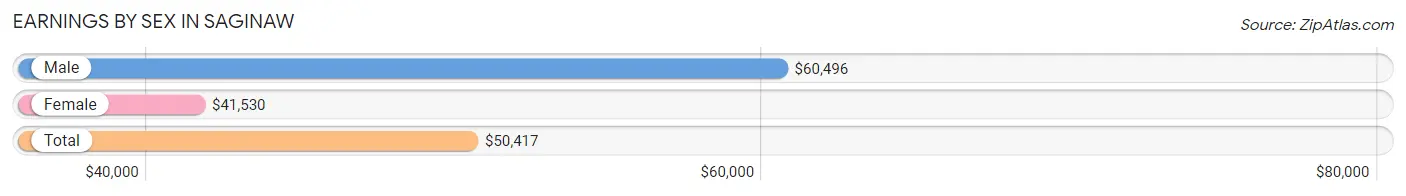
Earnings by Sex in Saginaw
Average Earnings in Saginaw are $50,417, $60,496 for men and $41,530 for women, a difference of 31.4%.
| Sex | Number | Average Earnings |
| Male | 7,115 (54.0%) | $60,496 |
| Female | 6,048 (46.0%) | $41,530 |
| Total | 13,163 (100.0%) | $50,417 |
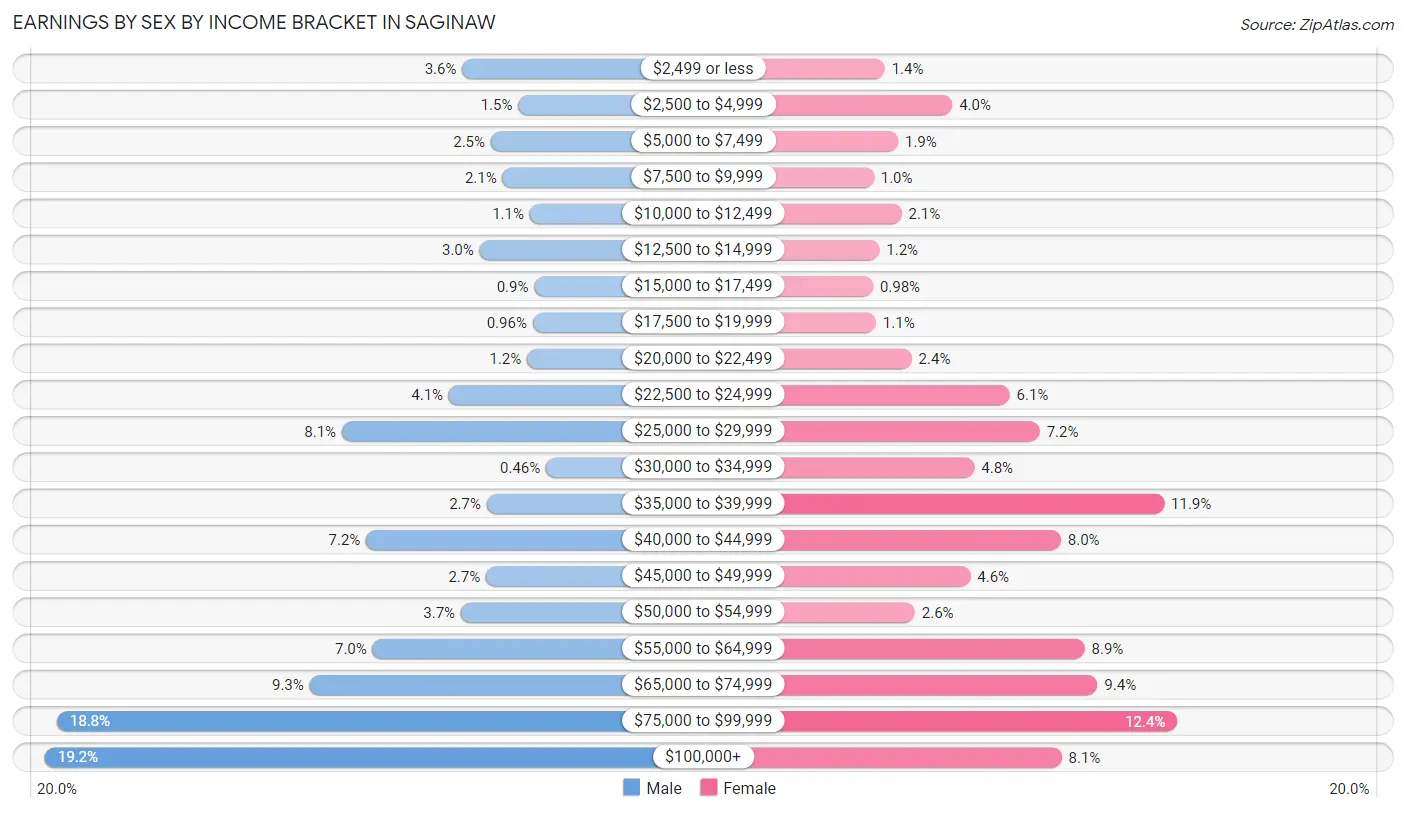
Earnings by Sex by Income Bracket in Saginaw
The most common earnings brackets in Saginaw are $100,000+ for men (1,369 | 19.2%) and $75,000 to $99,999 for women (749 | 12.4%).
| Income | Male | Female |
| $2,499 or less | 256 (3.6%) | 86 (1.4%) |
| $2,500 to $4,999 | 107 (1.5%) | 239 (4.0%) |
| $5,000 to $7,499 | 180 (2.5%) | 116 (1.9%) |
| $7,500 to $9,999 | 149 (2.1%) | 61 (1.0%) |
| $10,000 to $12,499 | 76 (1.1%) | 124 (2.1%) |
| $12,500 to $14,999 | 210 (2.9%) | 74 (1.2%) |
| $15,000 to $17,499 | 64 (0.9%) | 59 (1.0%) |
| $17,500 to $19,999 | 68 (1.0%) | 66 (1.1%) |
| $20,000 to $22,499 | 83 (1.2%) | 147 (2.4%) |
| $22,500 to $24,999 | 292 (4.1%) | 369 (6.1%) |
| $25,000 to $29,999 | 577 (8.1%) | 437 (7.2%) |
| $30,000 to $34,999 | 33 (0.5%) | 289 (4.8%) |
| $35,000 to $39,999 | 191 (2.7%) | 719 (11.9%) |
| $40,000 to $44,999 | 512 (7.2%) | 485 (8.0%) |
| $45,000 to $49,999 | 193 (2.7%) | 280 (4.6%) |
| $50,000 to $54,999 | 260 (3.6%) | 154 (2.5%) |
| $55,000 to $64,999 | 495 (7.0%) | 539 (8.9%) |
| $65,000 to $74,999 | 663 (9.3%) | 568 (9.4%) |
| $75,000 to $99,999 | 1,337 (18.8%) | 749 (12.4%) |
| $100,000+ | 1,369 (19.2%) | 487 (8.1%) |
| Total | 7,115 (100.0%) | 6,048 (100.0%) |
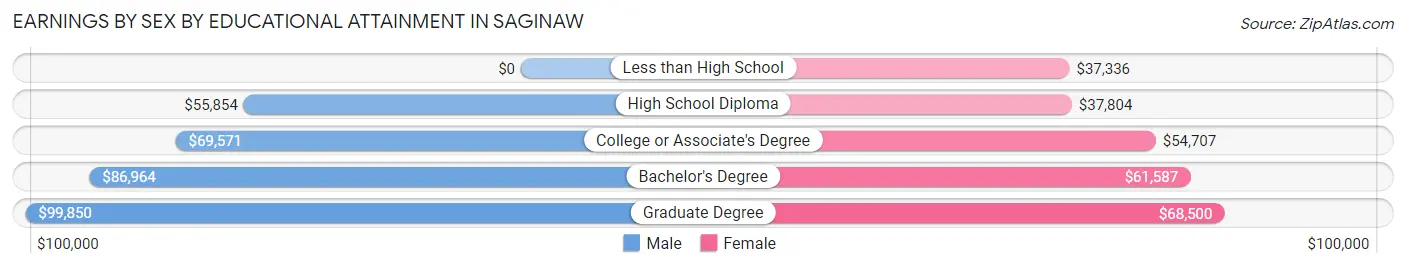
Earnings by Sex by Educational Attainment in Saginaw
Average earnings in Saginaw are $66,989 for men and $45,462 for women, a difference of 32.1%. Men with an educational attainment of graduate degree enjoy the highest average annual earnings of $99,850, while those with high school diploma education earn the least with $55,854. Women with an educational attainment of graduate degree earn the most with the average annual earnings of $68,500, while those with less than high school education have the smallest earnings of $37,336.
| Educational Attainment | Male Income | Female Income |
| Less than High School | - | - |
| High School Diploma | $55,854 | $37,804 |
| College or Associate's Degree | $69,571 | $54,707 |
| Bachelor's Degree | $86,964 | $61,587 |
| Graduate Degree | $99,850 | $68,500 |
| Total | $66,989 | $45,462 |
Family Income in Saginaw
Family Income Brackets in Saginaw
According to the Saginaw family income data, there are 2,401 families falling into the $100,000 to $149,999 income range, which is the most common income bracket and makes up 38.1% of all families. Conversely, the less than $10,000 income bracket is the least frequent group with only 25 families (0.4%) belonging to this category.
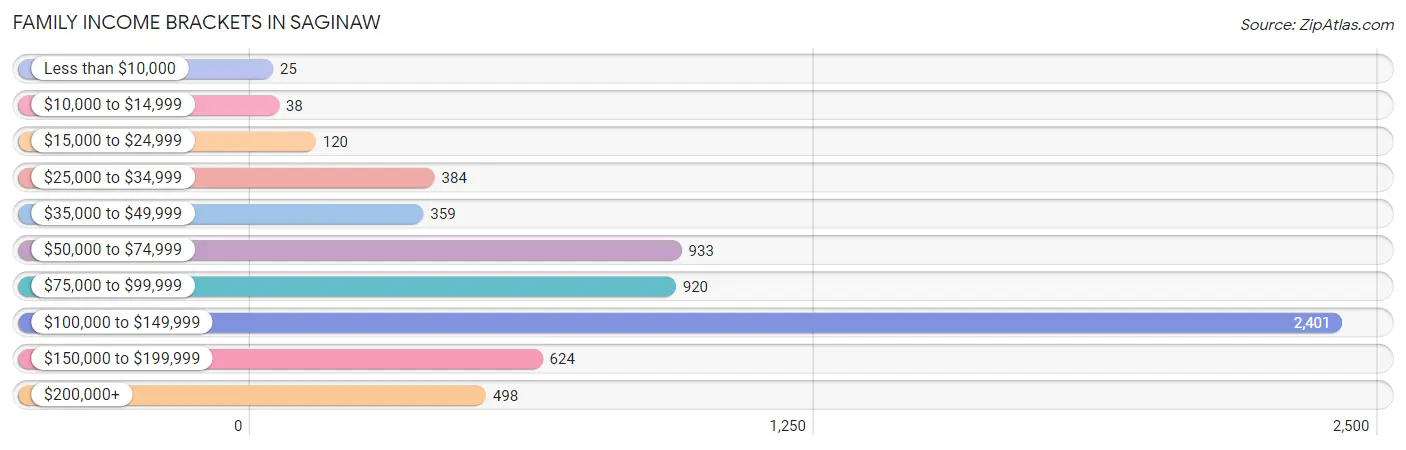
| Income Bracket | # Families | % Families |
| Less than $10,000 | 25 | 0.4% |
| $10,000 to $14,999 | 38 | 0.6% |
| $15,000 to $24,999 | 120 | 1.9% |
| $25,000 to $34,999 | 384 | 6.1% |
| $35,000 to $49,999 | 359 | 5.7% |
| $50,000 to $74,999 | 933 | 14.8% |
| $75,000 to $99,999 | 920 | 14.6% |
| $100,000 to $149,999 | 2,401 | 38.1% |
| $150,000 to $199,999 | 624 | 9.9% |
| $200,000+ | 498 | 7.9% |
Family Income by Famaliy Size in Saginaw
7+ person families (64 | 1.0%) account for the highest median family income in Saginaw with $133,148 per family, while 2-person families (2,864 | 45.4%) have the highest median income of $51,500 per family member.
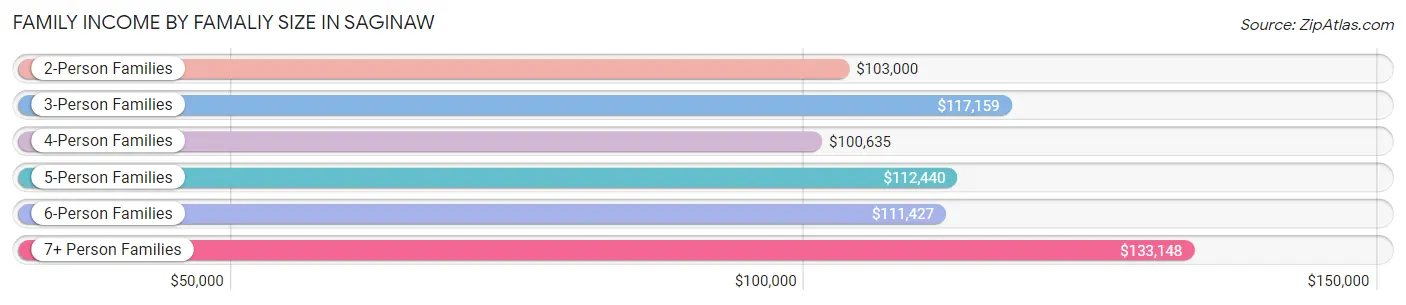
| Income Bracket | # Families | Median Income |
| 2-Person Families | 2,864 (45.4%) | $103,000 |
| 3-Person Families | 1,128 (17.9%) | $117,159 |
| 4-Person Families | 1,545 (24.5%) | $100,635 |
| 5-Person Families | 477 (7.6%) | $112,440 |
| 6-Person Families | 225 (3.6%) | $111,427 |
| 7+ Person Families | 64 (1.0%) | $133,148 |
| Total | 6,303 (100.0%) | $109,569 |
Family Income by Number of Earners in Saginaw
The median family income in Saginaw is $109,569, with families comprising 3+ earners (568) having the highest median family income of $134,281, while families with no earners (616) have the lowest median family income of $51,169, accounting for 9.0% and 9.8% of families, respectively.
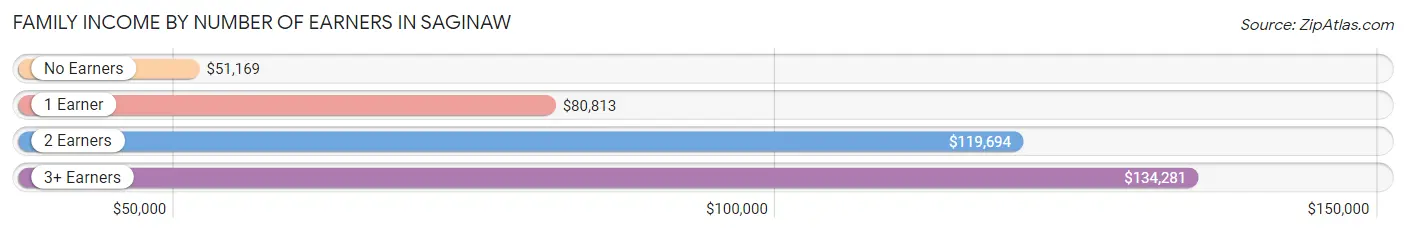
| Number of Earners | # Families | Median Income |
| No Earners | 616 (9.8%) | $51,169 |
| 1 Earner | 2,065 (32.8%) | $80,813 |
| 2 Earners | 3,054 (48.4%) | $119,694 |
| 3+ Earners | 568 (9.0%) | $134,281 |
| Total | 6,303 (100.0%) | $109,569 |
Household Income in Saginaw
Household Income Brackets in Saginaw
With 2,923 households falling in the category, the $100,000 to $149,999 income range is the most frequent in Saginaw, accounting for 33.6% of all households. In contrast, only 104 households (1.2%) fall into the $10,000 to $14,999 income bracket, making it the least populous group.
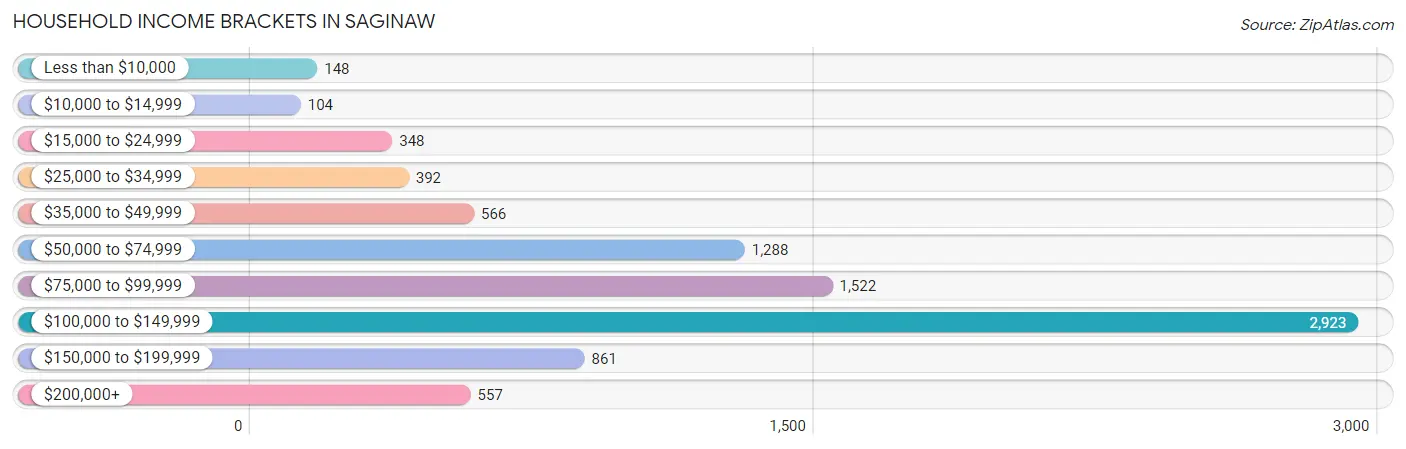
| Income Bracket | # Households | % Households |
| Less than $10,000 | 148 | 1.7% |
| $10,000 to $14,999 | 104 | 1.2% |
| $15,000 to $24,999 | 348 | 4.0% |
| $25,000 to $34,999 | 392 | 4.5% |
| $35,000 to $49,999 | 566 | 6.5% |
| $50,000 to $74,999 | 1,288 | 14.8% |
| $75,000 to $99,999 | 1,522 | 17.5% |
| $100,000 to $149,999 | 2,923 | 33.6% |
| $150,000 to $199,999 | 861 | 9.9% |
| $200,000+ | 557 | 6.4% |
Household Income by Householder Age in Saginaw
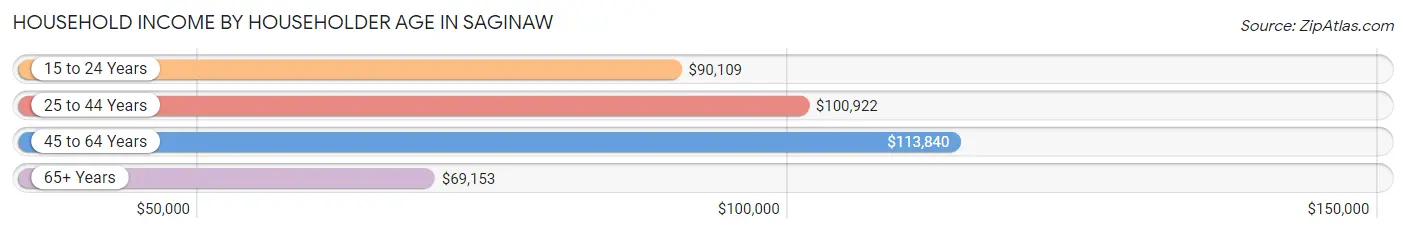
The median household income in Saginaw is $99,752, with the highest median household income of $113,840 found in the 45 to 64 years age bracket for the primary householder. A total of 3,376 households (38.8%) fall into this category. Meanwhile, the 65+ years age bracket for the primary householder has the lowest median household income of $69,153, with 1,943 households (22.3%) in this group.
| Income Bracket | # Households | Median Income |
| 15 to 24 Years | 250 (2.9%) | $90,109 |
| 25 to 44 Years | 3,131 (36.0%) | $100,922 |
| 45 to 64 Years | 3,376 (38.8%) | $113,840 |
| 65+ Years | 1,943 (22.3%) | $69,153 |
| Total | 8,700 (100.0%) | $99,752 |
Poverty in Saginaw
Income Below Poverty by Sex and Age in Saginaw
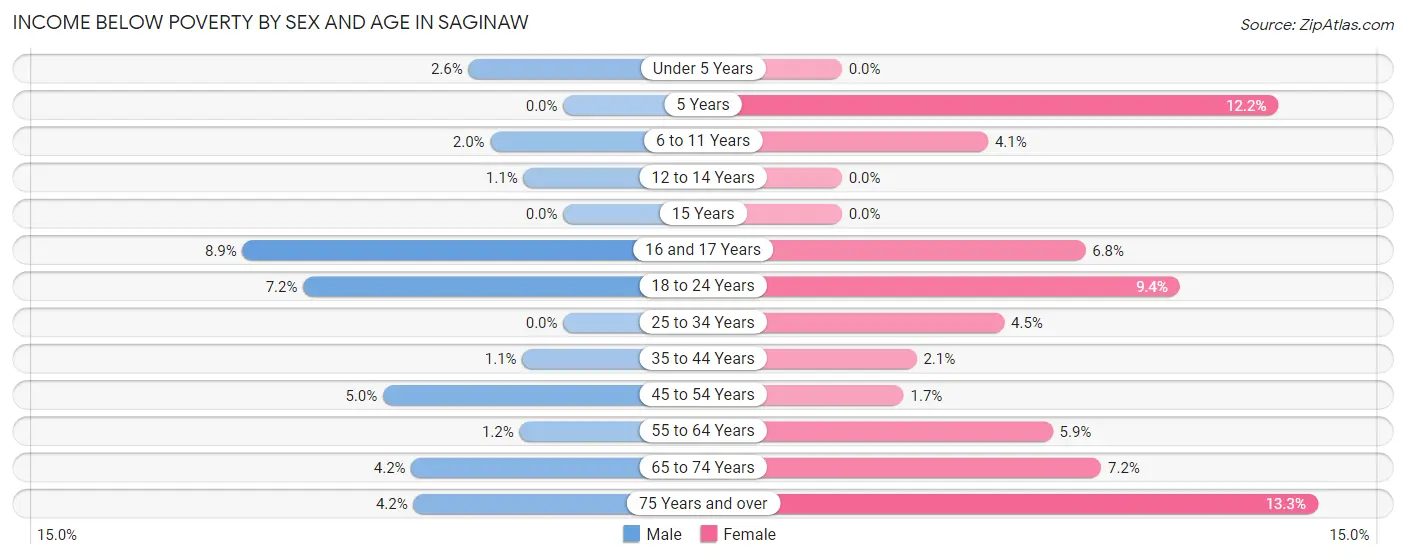
With 2.9% poverty level for males and 4.7% for females among the residents of Saginaw, 16 and 17 year old males and 75 year old and over females are the most vulnerable to poverty, with 36 males (8.9%) and 55 females (13.3%) in their respective age groups living below the poverty level.
| Age Bracket | Male | Female |
| Under 5 Years | 22 (2.6%) | 0 (0.0%) |
| 5 Years | 0 (0.0%) | 35 (12.1%) |
| 6 to 11 Years | 18 (2.0%) | 40 (4.1%) |
| 12 to 14 Years | 12 (1.1%) | 0 (0.0%) |
| 15 Years | 0 (0.0%) | 0 (0.0%) |
| 16 and 17 Years | 36 (8.9%) | 16 (6.8%) |
| 18 to 24 Years | 87 (7.2%) | 97 (9.4%) |
| 25 to 34 Years | 0 (0.0%) | 66 (4.5%) |
| 35 to 44 Years | 20 (1.1%) | 39 (2.1%) |
| 45 to 54 Years | 78 (5.0%) | 23 (1.7%) |
| 55 to 64 Years | 17 (1.2%) | 90 (5.9%) |
| 65 to 74 Years | 46 (4.2%) | 91 (7.2%) |
| 75 Years and over | 15 (4.2%) | 55 (13.3%) |
| Total | 351 (2.9%) | 552 (4.7%) |
Income Above Poverty by Sex and Age in Saginaw
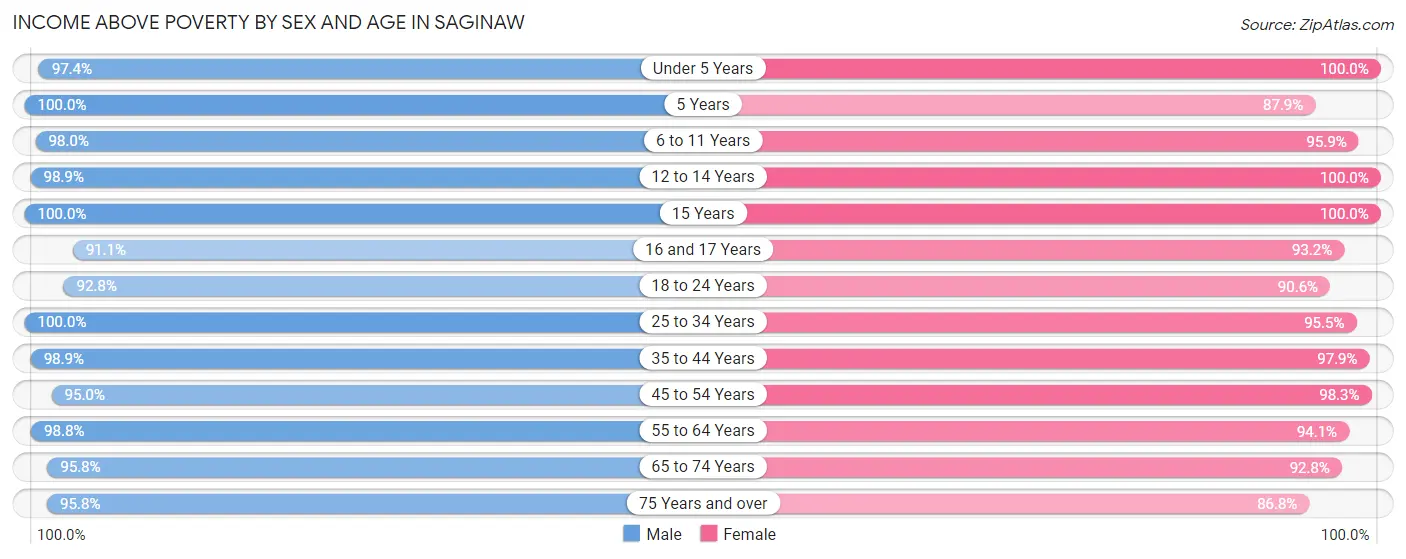
According to the poverty statistics in Saginaw, males aged 5 years and females aged under 5 years are the age groups that are most secure financially, with 100.0% of males and 100.0% of females in these age groups living above the poverty line.
| Age Bracket | Male | Female |
| Under 5 Years | 810 (97.4%) | 773 (100.0%) |
| 5 Years | 99 (100.0%) | 253 (87.8%) |
| 6 to 11 Years | 867 (98.0%) | 944 (95.9%) |
| 12 to 14 Years | 1,073 (98.9%) | 455 (100.0%) |
| 15 Years | 147 (100.0%) | 209 (100.0%) |
| 16 and 17 Years | 367 (91.1%) | 220 (93.2%) |
| 18 to 24 Years | 1,115 (92.8%) | 934 (90.6%) |
| 25 to 34 Years | 1,426 (100.0%) | 1,394 (95.5%) |
| 35 to 44 Years | 1,739 (98.9%) | 1,834 (97.9%) |
| 45 to 54 Years | 1,475 (95.0%) | 1,314 (98.3%) |
| 55 to 64 Years | 1,381 (98.8%) | 1,442 (94.1%) |
| 65 to 74 Years | 1,041 (95.8%) | 1,169 (92.8%) |
| 75 Years and over | 345 (95.8%) | 360 (86.8%) |
| Total | 11,885 (97.1%) | 11,301 (95.3%) |
Income Below Poverty Among Married-Couple Families in Saginaw
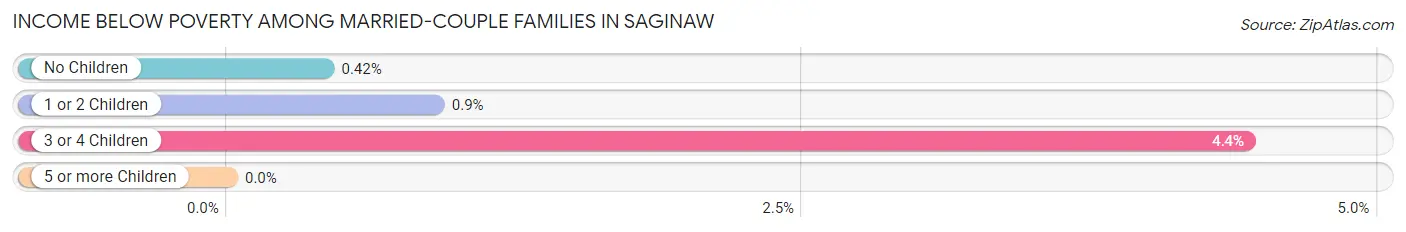
The poverty statistics for married-couple families in Saginaw show that 0.9% or 45 of the total 4,718 families live below the poverty line. Families with 3 or 4 children have the highest poverty rate of 4.4%, comprising of 18 families. On the other hand, families with 5 or more children have the lowest poverty rate of 0.0%, which includes 0 families.
| Children | Above Poverty | Below Poverty |
| No Children | 2,354 (99.6%) | 10 (0.4%) |
| 1 or 2 Children | 1,879 (99.1%) | 17 (0.9%) |
| 3 or 4 Children | 388 (95.6%) | 18 (4.4%) |
| 5 or more Children | 52 (100.0%) | 0 (0.0%) |
| Total | 4,673 (99.1%) | 45 (0.9%) |
Income Below Poverty Among Single-Parent Households in Saginaw
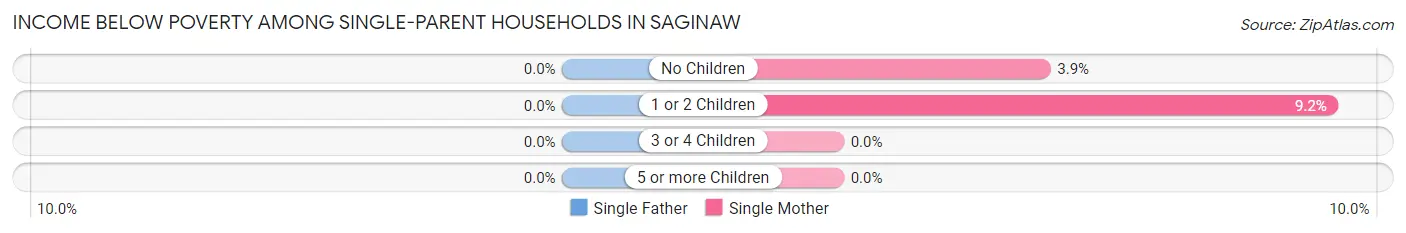
| Children | Single Father | Single Mother |
| No Children | 0 (0.0%) | 18 (3.8%) |
| 1 or 2 Children | 0 (0.0%) | 47 (9.2%) |
| 3 or 4 Children | 0 (0.0%) | 0 (0.0%) |
| 5 or more Children | 0 (0.0%) | 0 (0.0%) |
| Total | 0 (0.0%) | 65 (5.8%) |
Income Below Poverty Among Married-Couple vs Single-Parent Households in Saginaw
The poverty data for Saginaw shows that 45 of the married-couple family households (0.9%) and 65 of the single-parent households (4.1%) are living below the poverty level. Within the married-couple family households, those with 3 or 4 children have the highest poverty rate, with 18 households (4.4%) falling below the poverty line. Among the single-parent households, those with 1 or 2 children have the highest poverty rate, with 47 household (5.8%) living below poverty.
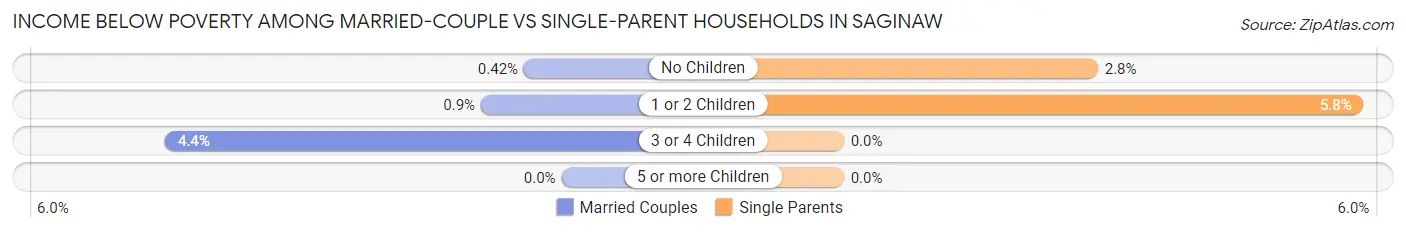
| Children | Married-Couple Families | Single-Parent Households |
| No Children | 10 (0.4%) | 18 (2.8%) |
| 1 or 2 Children | 17 (0.9%) | 47 (5.8%) |
| 3 or 4 Children | 18 (4.4%) | 0 (0.0%) |
| 5 or more Children | 0 (0.0%) | 0 (0.0%) |
| Total | 45 (0.9%) | 65 (4.1%) |
Race in Saginaw
The most populous races in Saginaw are White / Caucasian (17,704 | 73.4%), Hispanic or Latino (9,457 | 39.2%), and Two or more Races (2,272 | 9.4%).
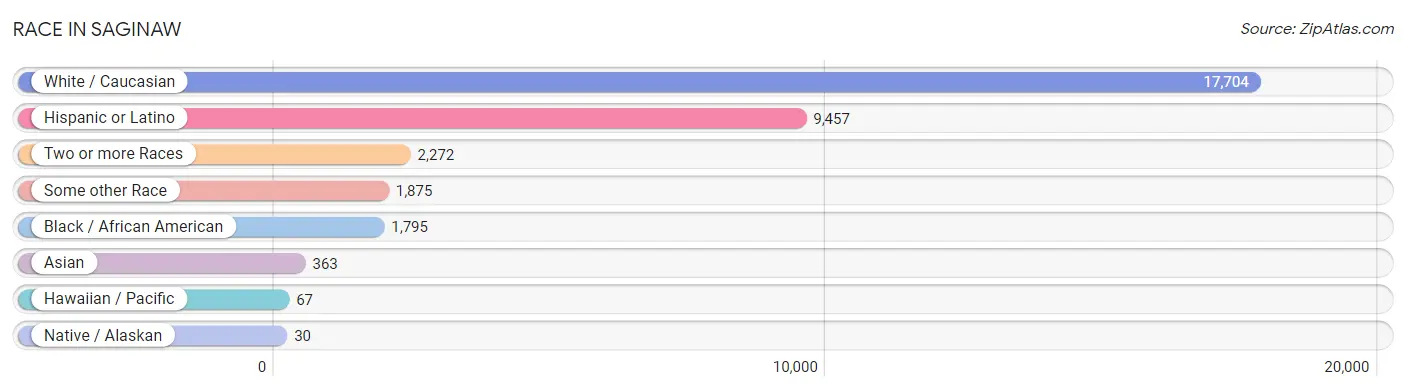
| Race | # Population | % Population |
| Asian | 363 | 1.5% |
| Black / African American | 1,795 | 7.4% |
| Hawaiian / Pacific | 67 | 0.3% |
| Hispanic or Latino | 9,457 | 39.2% |
| Native / Alaskan | 30 | 0.1% |
| White / Caucasian | 17,704 | 73.4% |
| Two or more Races | 2,272 | 9.4% |
| Some other Race | 1,875 | 7.8% |
| Total | 24,106 | 100.0% |
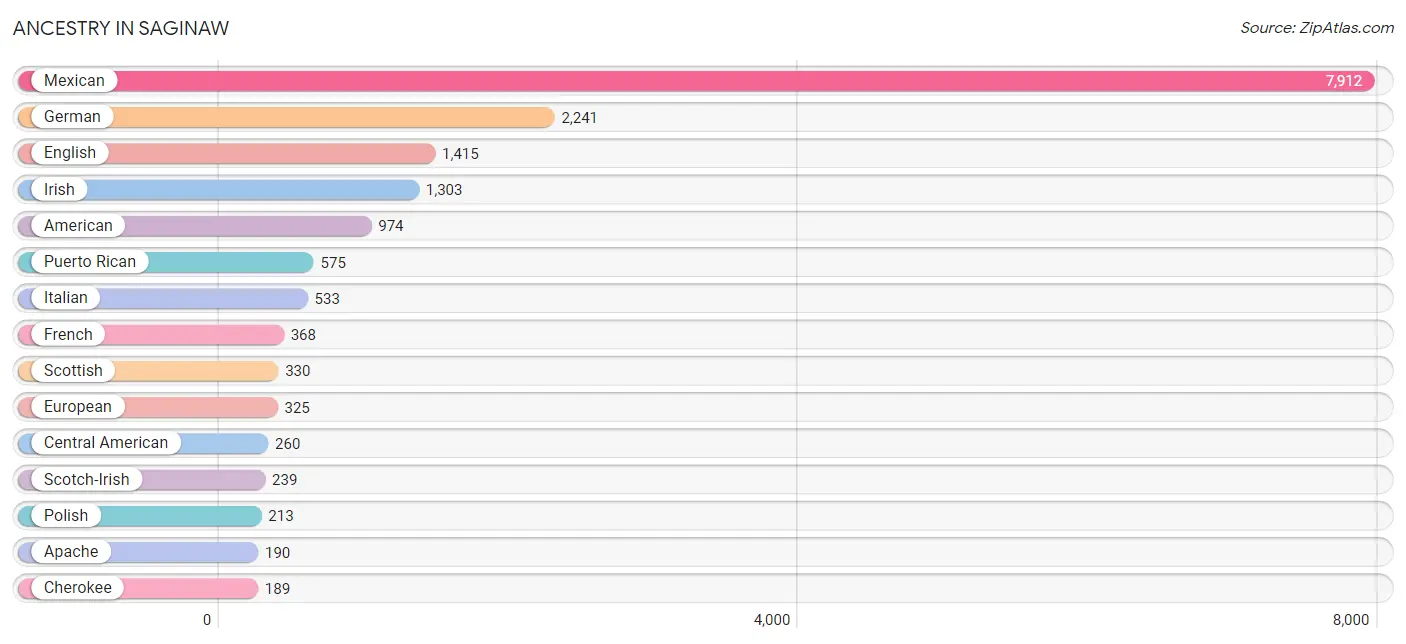
Ancestry in Saginaw
The most populous ancestries reported in Saginaw are Mexican (7,912 | 32.8%), German (2,241 | 9.3%), English (1,415 | 5.9%), Irish (1,303 | 5.4%), and American (974 | 4.0%), together accounting for 57.4% of all Saginaw residents.
| Ancestry | # Population | % Population |
| American | 974 | 4.0% |
| Apache | 190 | 0.8% |
| Arab | 72 | 0.3% |
| Austrian | 15 | 0.1% |
| Bhutanese | 19 | 0.1% |
| British | 54 | 0.2% |
| Burmese | 42 | 0.2% |
| Canadian | 184 | 0.8% |
| Central American | 260 | 1.1% |
| Cherokee | 189 | 0.8% |
| Chickasaw | 3 | 0.0% |
| Choctaw | 72 | 0.3% |
| Colombian | 70 | 0.3% |
| Cuban | 102 | 0.4% |
| Czech | 48 | 0.2% |
| Czechoslovakian | 13 | 0.1% |
| Danish | 84 | 0.4% |
| Dutch | 32 | 0.1% |
| Eastern European | 9 | 0.0% |
| English | 1,415 | 5.9% |
| European | 325 | 1.3% |
| French | 368 | 1.5% |
| French Canadian | 122 | 0.5% |
| German | 2,241 | 9.3% |
| Guatemalan | 53 | 0.2% |
| Honduran | 165 | 0.7% |
| Indian (Asian) | 111 | 0.5% |
| Iranian | 24 | 0.1% |
| Iraqi | 72 | 0.3% |
| Irish | 1,303 | 5.4% |
| Italian | 533 | 2.2% |
| Korean | 42 | 0.2% |
| Lithuanian | 44 | 0.2% |
| Mexican | 7,912 | 32.8% |
| Mexican American Indian | 24 | 0.1% |
| Native Hawaiian | 16 | 0.1% |
| Navajo | 57 | 0.2% |
| Norwegian | 151 | 0.6% |
| Polish | 213 | 0.9% |
| Portuguese | 38 | 0.2% |
| Pueblo | 41 | 0.2% |
| Puerto Rican | 575 | 2.4% |
| Romanian | 79 | 0.3% |
| Russian | 66 | 0.3% |
| Salvadoran | 42 | 0.2% |
| Samoan | 51 | 0.2% |
| Scandinavian | 108 | 0.4% |
| Scotch-Irish | 239 | 1.0% |
| Scottish | 330 | 1.4% |
| South American | 70 | 0.3% |
| Spaniard | 119 | 0.5% |
| Spanish | 40 | 0.2% |
| Sri Lankan | 113 | 0.5% |
| Swedish | 69 | 0.3% |
| Swiss | 10 | 0.0% |
| Thai | 35 | 0.2% |
| Ukrainian | 48 | 0.2% |
| Vietnamese | 60 | 0.3% |
| Welsh | 18 | 0.1% | View All 59 Rows |
Immigrants in Saginaw
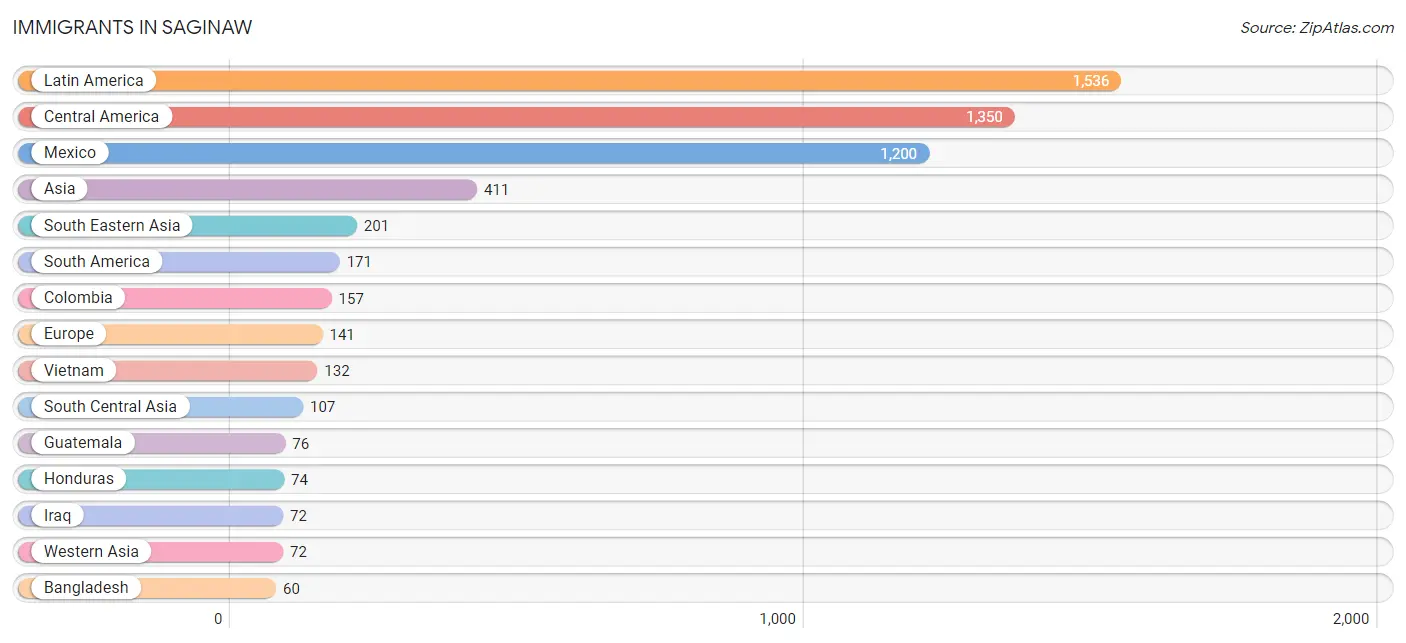
The most numerous immigrant groups reported in Saginaw came from Latin America (1,536 | 6.4%), Central America (1,350 | 5.6%), Mexico (1,200 | 5.0%), Asia (411 | 1.7%), and South Eastern Asia (201 | 0.8%), together accounting for 19.5% of all Saginaw residents.
| Immigration Origin | # Population | % Population |
| Asia | 411 | 1.7% |
| Bangladesh | 60 | 0.3% |
| Brazil | 14 | 0.1% |
| Caribbean | 15 | 0.1% |
| Central America | 1,350 | 5.6% |
| China | 11 | 0.1% |
| Colombia | 157 | 0.6% |
| Cuba | 15 | 0.1% |
| Eastern Asia | 31 | 0.1% |
| Eastern Europe | 59 | 0.2% |
| England | 11 | 0.1% |
| Europe | 141 | 0.6% |
| France | 16 | 0.1% |
| Guatemala | 76 | 0.3% |
| Honduras | 74 | 0.3% |
| Iraq | 72 | 0.3% |
| Korea | 20 | 0.1% |
| Laos | 27 | 0.1% |
| Latin America | 1,536 | 6.4% |
| Mexico | 1,200 | 5.0% |
| Nepal | 47 | 0.2% |
| Northern Europe | 11 | 0.1% |
| Philippines | 42 | 0.2% |
| Romania | 59 | 0.2% |
| South America | 171 | 0.7% |
| South Central Asia | 107 | 0.4% |
| South Eastern Asia | 201 | 0.8% |
| Southern Europe | 55 | 0.2% |
| Spain | 55 | 0.2% |
| Vietnam | 132 | 0.5% |
| Western Asia | 72 | 0.3% |
| Western Europe | 16 | 0.1% | View All 32 Rows |
Sex and Age in Saginaw
Sex and Age in Saginaw
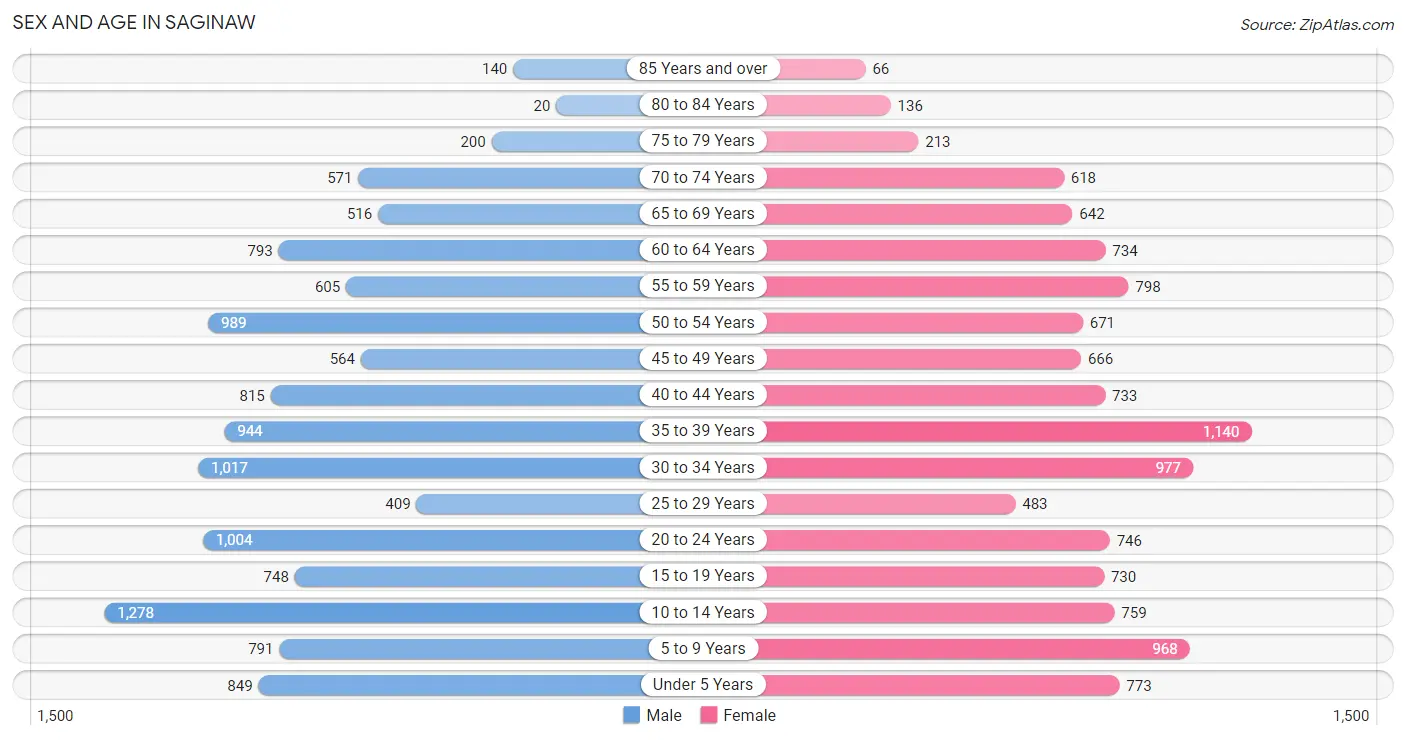
The most populous age groups in Saginaw are 10 to 14 Years (1,278 | 10.4%) for men and 35 to 39 Years (1,140 | 9.6%) for women.
| Age Bracket | Male | Female |
| Under 5 Years | 849 (6.9%) | 773 (6.5%) |
| 5 to 9 Years | 791 (6.5%) | 968 (8.2%) |
| 10 to 14 Years | 1,278 (10.4%) | 759 (6.4%) |
| 15 to 19 Years | 748 (6.1%) | 730 (6.2%) |
| 20 to 24 Years | 1,004 (8.2%) | 746 (6.3%) |
| 25 to 29 Years | 409 (3.3%) | 483 (4.1%) |
| 30 to 34 Years | 1,017 (8.3%) | 977 (8.2%) |
| 35 to 39 Years | 944 (7.7%) | 1,140 (9.6%) |
| 40 to 44 Years | 815 (6.7%) | 733 (6.2%) |
| 45 to 49 Years | 564 (4.6%) | 666 (5.6%) |
| 50 to 54 Years | 989 (8.1%) | 671 (5.7%) |
| 55 to 59 Years | 605 (4.9%) | 798 (6.7%) |
| 60 to 64 Years | 793 (6.5%) | 734 (6.2%) |
| 65 to 69 Years | 516 (4.2%) | 642 (5.4%) |
| 70 to 74 Years | 571 (4.7%) | 618 (5.2%) |
| 75 to 79 Years | 200 (1.6%) | 213 (1.8%) |
| 80 to 84 Years | 20 (0.2%) | 136 (1.1%) |
| 85 Years and over | 140 (1.1%) | 66 (0.6%) |
| Total | 12,253 (100.0%) | 11,853 (100.0%) |
Families and Households in Saginaw
Median Family Size in Saginaw
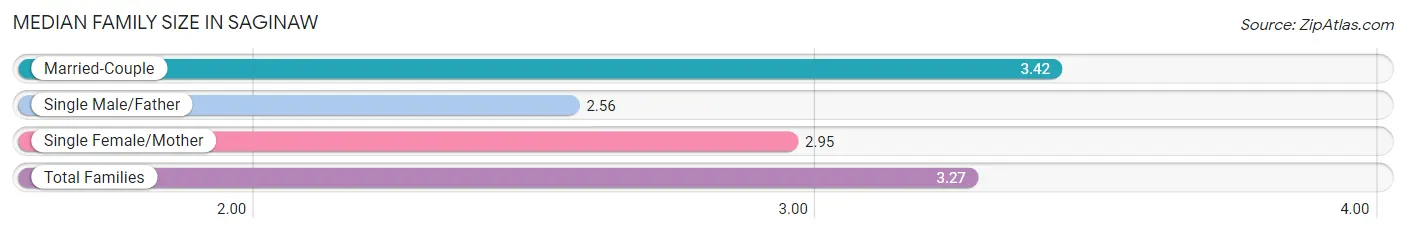
The median family size in Saginaw is 3.27 persons per family, with married-couple families (4,718 | 74.9%) accounting for the largest median family size of 3.42 persons per family. On the other hand, single male/father families (465 | 7.4%) represent the smallest median family size with 2.56 persons per family.
| Family Type | # Families | Family Size |
| Married-Couple | 4,718 (74.9%) | 3.42 |
| Single Male/Father | 465 (7.4%) | 2.56 |
| Single Female/Mother | 1,120 (17.8%) | 2.95 |
| Total Families | 6,303 (100.0%) | 3.27 |
Median Household Size in Saginaw
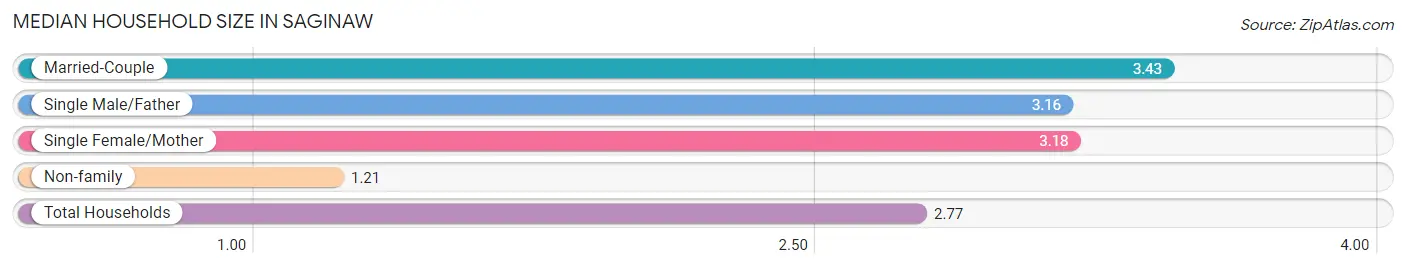
The median household size in Saginaw is 2.77 persons per household, with married-couple households (4,718 | 54.2%) accounting for the largest median household size of 3.43 persons per household. non-family households (2,397 | 27.6%) represent the smallest median household size with 1.21 persons per household.
| Household Type | # Households | Household Size |
| Married-Couple | 4,718 (54.2%) | 3.43 |
| Single Male/Father | 465 (5.3%) | 3.16 |
| Single Female/Mother | 1,120 (12.9%) | 3.18 |
| Non-family | 2,397 (27.6%) | 1.21 |
| Total Households | 8,700 (100.0%) | 2.77 |
Household Size by Marriage Status in Saginaw
Out of a total of 8,700 households in Saginaw, 6,303 (72.5%) are family households, while 2,397 (27.6%) are nonfamily households. The most numerous type of family households are 2-person households, comprising 2,548, and the most common type of nonfamily households are 1-person households, comprising 2,027.
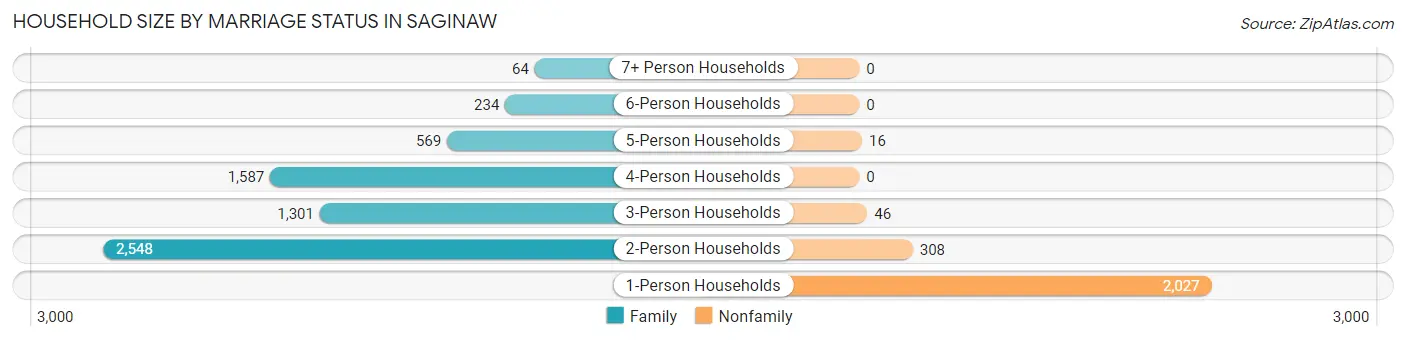
| Household Size | Family Households | Nonfamily Households |
| 1-Person Households | - | 2,027 (23.3%) |
| 2-Person Households | 2,548 (29.3%) | 308 (3.5%) |
| 3-Person Households | 1,301 (14.9%) | 46 (0.5%) |
| 4-Person Households | 1,587 (18.2%) | 0 (0.0%) |
| 5-Person Households | 569 (6.5%) | 16 (0.2%) |
| 6-Person Households | 234 (2.7%) | 0 (0.0%) |
| 7+ Person Households | 64 (0.7%) | 0 (0.0%) |
| Total | 6,303 (72.5%) | 2,397 (27.6%) |
Female Fertility in Saginaw
Fertility by Age in Saginaw
Average fertility rate in Saginaw is 66.0 births per 1,000 women. Women in the age bracket of 20 to 34 years have the highest fertility rate with 135.0 births per 1,000 women. Women in the age bracket of 20 to 34 years acount for 80.7% of all women with births.
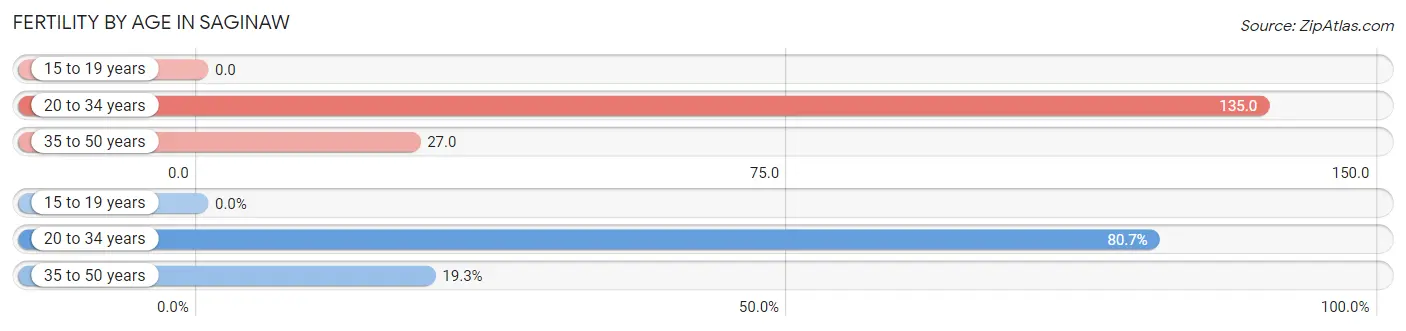
| Age Bracket | Women with Births | Births / 1,000 Women |
| 15 to 19 years | 0 (0.0%) | 0.0 |
| 20 to 34 years | 297 (80.7%) | 135.0 |
| 35 to 50 years | 71 (19.3%) | 27.0 |
| Total | 368 (100.0%) | 66.0 |
Fertility by Age by Marriage Status in Saginaw
90.2% of women with births (368) in Saginaw are married. The highest percentage of unmarried women with births falls into 20 to 34 years age bracket with 12.1% of them unmarried at the time of birth, while the lowest percentage of unmarried women with births belong to 35 to 50 years age bracket with 0.0% of them unmarried.
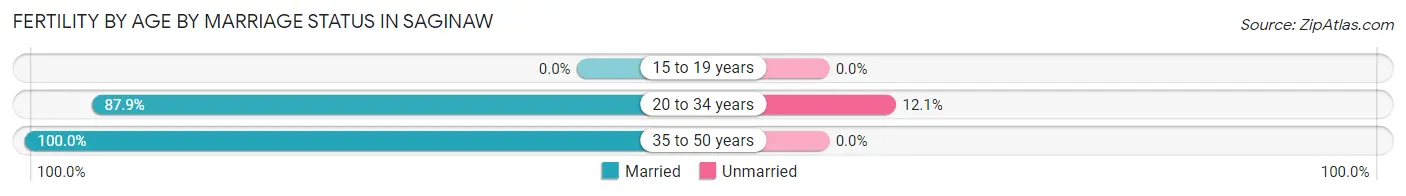
| Age Bracket | Married | Unmarried |
| 15 to 19 years | 0 (0.0%) | 0 (0.0%) |
| 20 to 34 years | 261 (87.9%) | 36 (12.1%) |
| 35 to 50 years | 71 (100.0%) | 0 (0.0%) |
| Total | 332 (90.2%) | 36 (9.8%) |
Fertility by Education in Saginaw
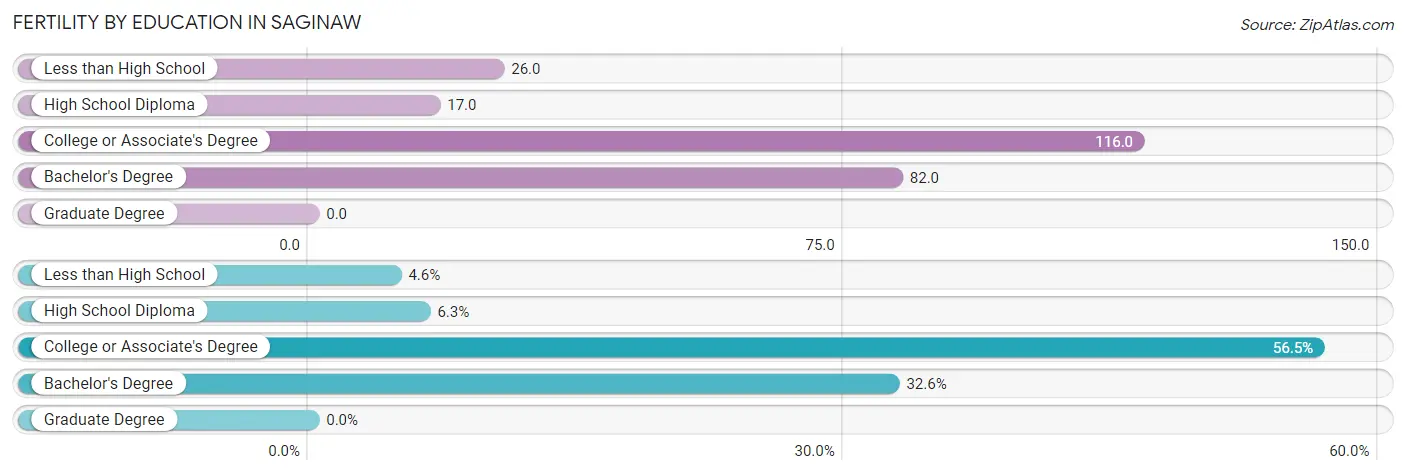
| Educational Attainment | Women with Births | Births / 1,000 Women |
| Less than High School | 17 (4.6%) | 26.0 |
| High School Diploma | 23 (6.2%) | 17.0 |
| College or Associate's Degree | 208 (56.5%) | 116.0 |
| Bachelor's Degree | 120 (32.6%) | 82.0 |
| Graduate Degree | 0 (0.0%) | 0.0 |
| Total | 368 (100.0%) | 66.0 |
Fertility by Education by Marriage Status in Saginaw
9.8% of women with births in Saginaw are unmarried. Women with the educational attainment of high school diploma are most likely to be married with 100.0% of them married at childbirth, while women with the educational attainment of less than high school are least likely to be married with 100.0% of them unmarried at childbirth.
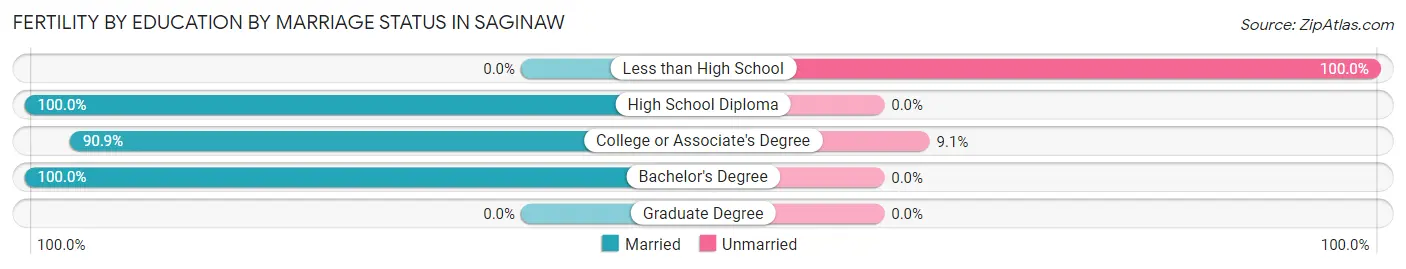
| Educational Attainment | Married | Unmarried |
| Less than High School | 0 (0.0%) | 17 (100.0%) |
| High School Diploma | 23 (100.0%) | 0 (0.0%) |
| College or Associate's Degree | 189 (90.9%) | 19 (9.1%) |
| Bachelor's Degree | 120 (100.0%) | 0 (0.0%) |
| Graduate Degree | 0 (0.0%) | 0 (0.0%) |
| Total | 332 (90.2%) | 36 (9.8%) |
Employment Characteristics in Saginaw
Employment by Class of Employer in Saginaw
Among the 12,458 employed individuals in Saginaw, private company employees (9,370 | 75.2%), local government employees (942 | 7.6%), and self-employed (not incorporated) (599 | 4.8%) make up the most common classes of employment.
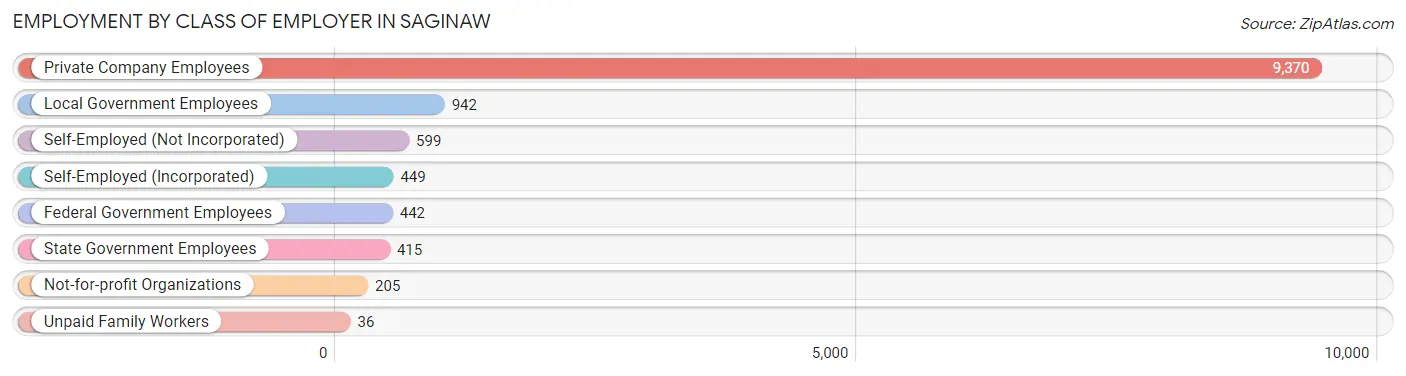
| Employer Class | # Employees | % Employees |
| Private Company Employees | 9,370 | 75.2% |
| Self-Employed (Incorporated) | 449 | 3.6% |
| Self-Employed (Not Incorporated) | 599 | 4.8% |
| Not-for-profit Organizations | 205 | 1.7% |
| Local Government Employees | 942 | 7.6% |
| State Government Employees | 415 | 3.3% |
| Federal Government Employees | 442 | 3.5% |
| Unpaid Family Workers | 36 | 0.3% |
| Total | 12,458 | 100.0% |
Employment Status by Age in Saginaw
According to the labor force statistics for Saginaw, out of the total population over 16 years of age (18,332), 70.6% or 12,942 individuals are in the labor force, with 3.5% or 453 of them unemployed. The age group with the highest labor force participation rate is 25 to 29 years, with 91.4% or 815 individuals in the labor force. Within the labor force, the 16 to 19 years age range has the highest percentage of unemployed individuals, with 43.3% or 93 of them being unemployed.
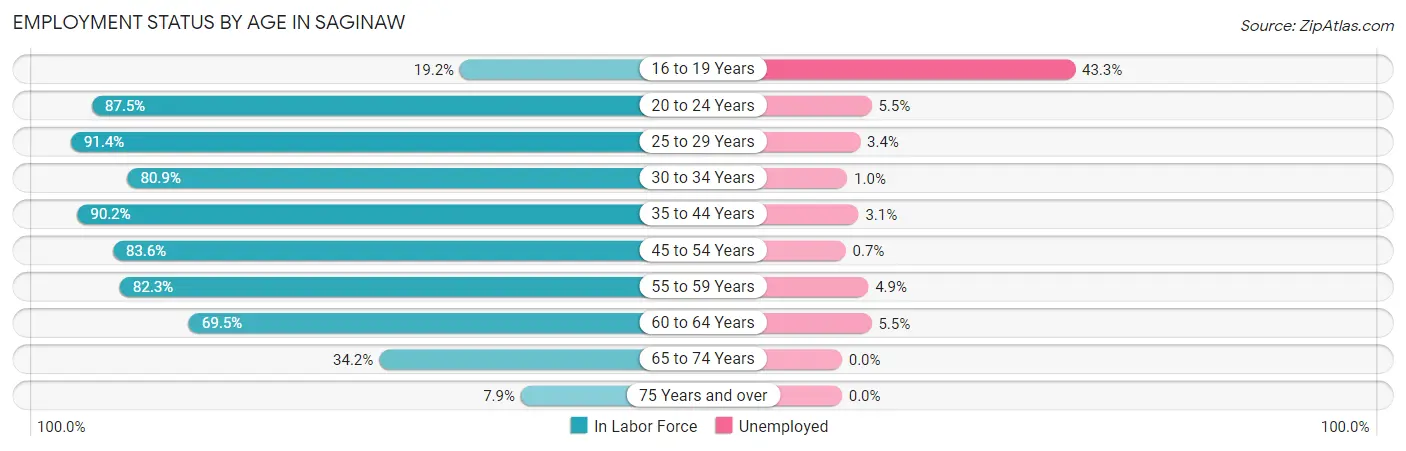
| Age Bracket | In Labor Force | Unemployed |
| 16 to 19 Years | 215 (19.2%) | 93 (43.3%) |
| 20 to 24 Years | 1,531 (87.5%) | 84 (5.5%) |
| 25 to 29 Years | 815 (91.4%) | 28 (3.4%) |
| 30 to 34 Years | 1,613 (80.9%) | 16 (1.0%) |
| 35 to 44 Years | 3,276 (90.2%) | 102 (3.1%) |
| 45 to 54 Years | 2,416 (83.6%) | 17 (0.7%) |
| 55 to 59 Years | 1,155 (82.3%) | 57 (4.9%) |
| 60 to 64 Years | 1,061 (69.5%) | 58 (5.5%) |
| 65 to 74 Years | 803 (34.2%) | 0 (0.0%) |
| 75 Years and over | 61 (7.9%) | 0 (0.0%) |
| Total | 12,942 (70.6%) | 453 (3.5%) |
Employment Status by Educational Attainment in Saginaw
According to labor force statistics for Saginaw, 83.8% of individuals (10,339) out of the total population between 25 and 64 years of age (12,338) are in the labor force, with 2.7% or 279 of them being unemployed. The group with the highest labor force participation rate are those with the educational attainment of bachelor's degree or higher, with 90.2% or 3,164 individuals in the labor force. Within the labor force, individuals with bachelor's degree or higher education have the highest percentage of unemployment, with 4.2% or 133 of them being unemployed.
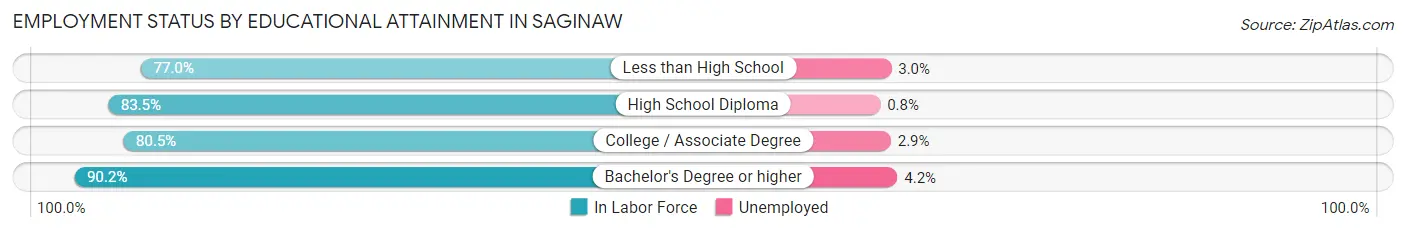
| Educational Attainment | In Labor Force | Unemployed |
| Less than High School | 875 (77.0%) | 34 (3.0%) |
| High School Diploma | 2,860 (83.5%) | 27 (0.8%) |
| College / Associate Degree | 3,436 (80.5%) | 124 (2.9%) |
| Bachelor's Degree or higher | 3,164 (90.2%) | 147 (4.2%) |
| Total | 10,339 (83.8%) | 333 (2.7%) |
Employment Occupations by Sex in Saginaw
Management, Business, Science and Arts Occupations
The most common Management, Business, Science and Arts occupations in Saginaw are Management (1,333 | 10.8%), Community & Social Service (1,080 | 8.7%), Computers, Engineering & Science (919 | 7.4%), Education Instruction & Library (876 | 7.1%), and Business & Financial (673 | 5.4%).
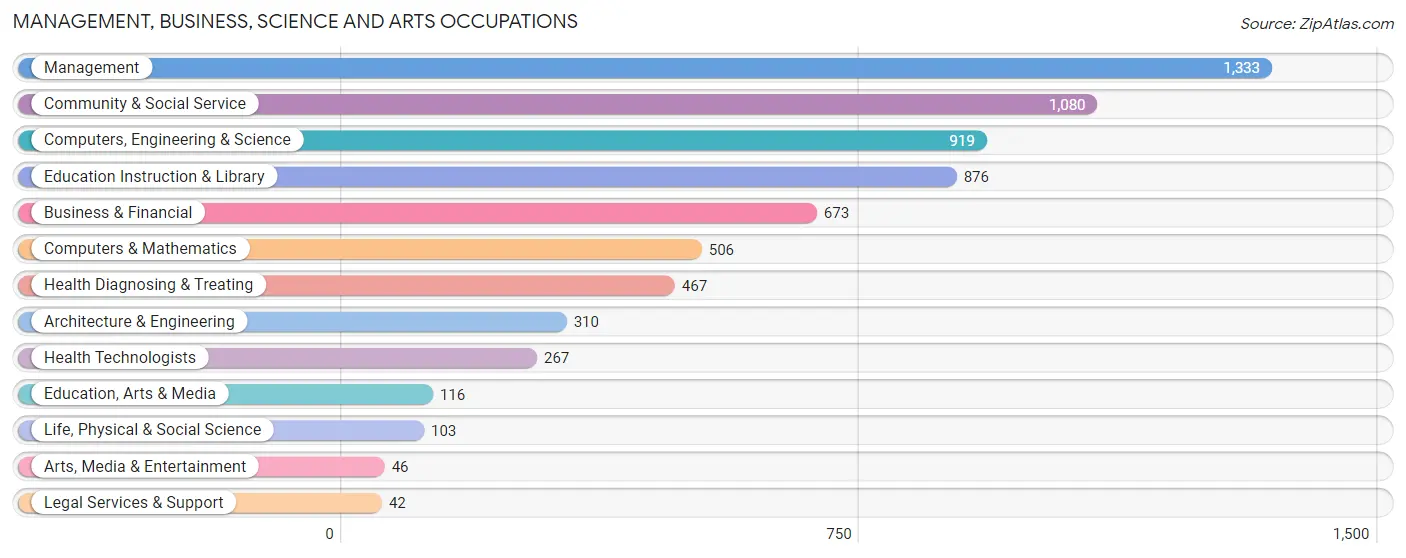
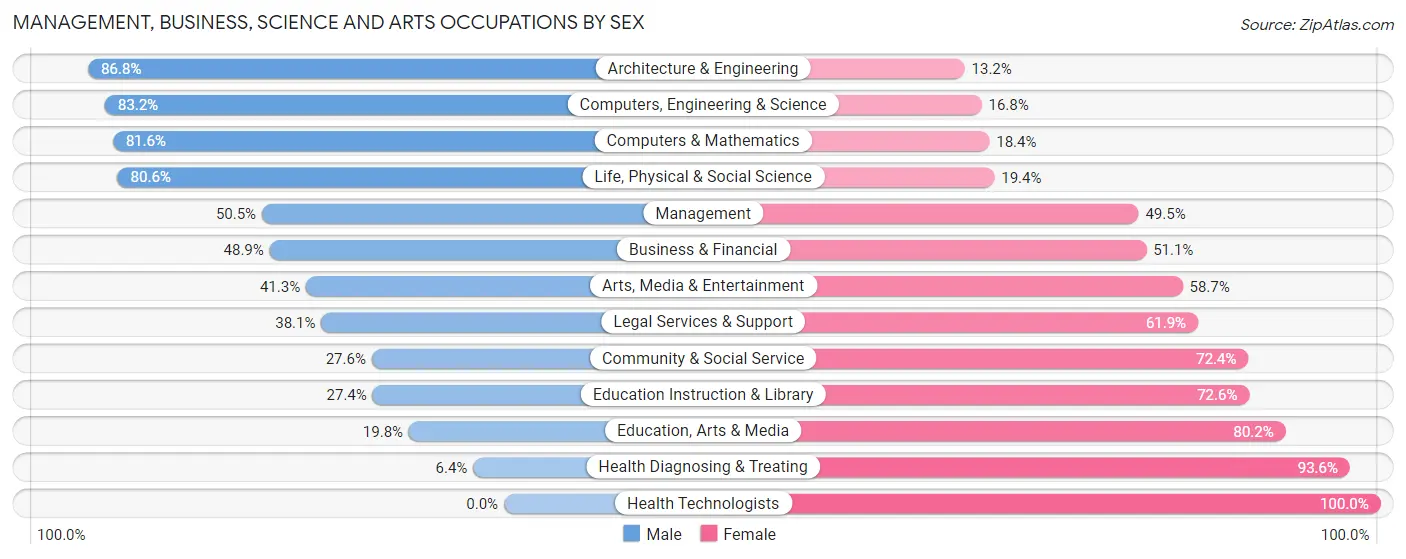
Management, Business, Science and Arts Occupations by Sex
Within the Management, Business, Science and Arts occupations in Saginaw, the most male-oriented occupations are Architecture & Engineering (86.8%), Computers, Engineering & Science (83.2%), and Computers & Mathematics (81.6%), while the most female-oriented occupations are Health Technologists (100.0%), Health Diagnosing & Treating (93.6%), and Education, Arts & Media (80.2%).
| Occupation | Male | Female |
| Management | 673 (50.5%) | 660 (49.5%) |
| Business & Financial | 329 (48.9%) | 344 (51.1%) |
| Computers, Engineering & Science | 765 (83.2%) | 154 (16.8%) |
| Computers & Mathematics | 413 (81.6%) | 93 (18.4%) |
| Architecture & Engineering | 269 (86.8%) | 41 (13.2%) |
| Life, Physical & Social Science | 83 (80.6%) | 20 (19.4%) |
| Community & Social Service | 298 (27.6%) | 782 (72.4%) |
| Education, Arts & Media | 23 (19.8%) | 93 (80.2%) |
| Legal Services & Support | 16 (38.1%) | 26 (61.9%) |
| Education Instruction & Library | 240 (27.4%) | 636 (72.6%) |
| Arts, Media & Entertainment | 19 (41.3%) | 27 (58.7%) |
| Health Diagnosing & Treating | 30 (6.4%) | 437 (93.6%) |
| Health Technologists | 0 (0.0%) | 267 (100.0%) |
| Total (Category) | 2,095 (46.9%) | 2,377 (53.1%) |
| Total (Overall) | 6,614 (53.4%) | 5,760 (46.6%) |
Services Occupations
The most common Services occupations in Saginaw are Security & Protection (543 | 4.4%), Food Preparation & Serving (514 | 4.2%), Law Enforcement (374 | 3.0%), Healthcare Support (371 | 3.0%), and Personal Care & Service (179 | 1.5%).
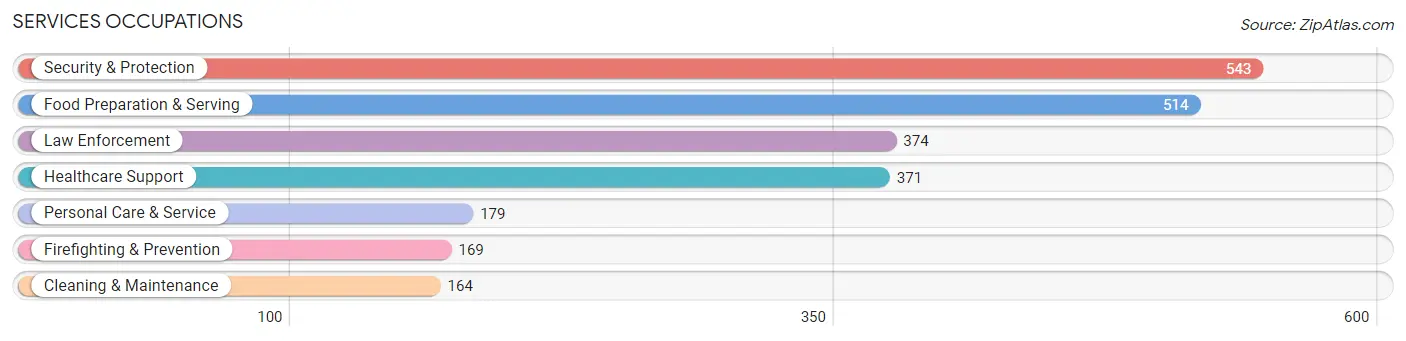
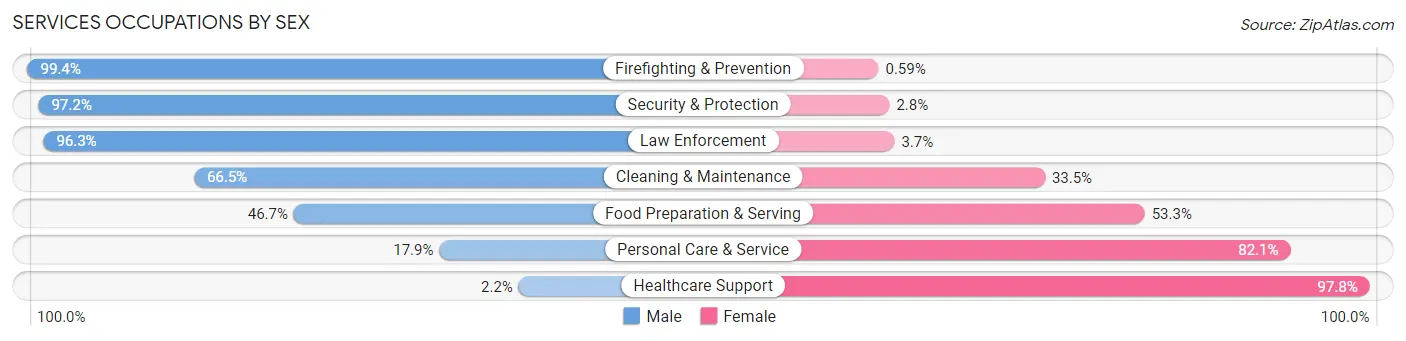
Services Occupations by Sex
Within the Services occupations in Saginaw, the most male-oriented occupations are Firefighting & Prevention (99.4%), Security & Protection (97.2%), and Law Enforcement (96.3%), while the most female-oriented occupations are Healthcare Support (97.8%), Personal Care & Service (82.1%), and Food Preparation & Serving (53.3%).
| Occupation | Male | Female |
| Healthcare Support | 8 (2.2%) | 363 (97.8%) |
| Security & Protection | 528 (97.2%) | 15 (2.8%) |
| Firefighting & Prevention | 168 (99.4%) | 1 (0.6%) |
| Law Enforcement | 360 (96.3%) | 14 (3.7%) |
| Food Preparation & Serving | 240 (46.7%) | 274 (53.3%) |
| Cleaning & Maintenance | 109 (66.5%) | 55 (33.5%) |
| Personal Care & Service | 32 (17.9%) | 147 (82.1%) |
| Total (Category) | 917 (51.8%) | 854 (48.2%) |
| Total (Overall) | 6,614 (53.4%) | 5,760 (46.6%) |
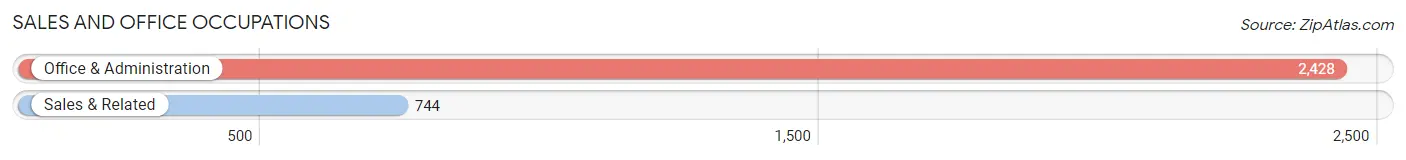
Sales and Office Occupations
The most common Sales and Office occupations in Saginaw are Office & Administration (2,428 | 19.6%), and Sales & Related (744 | 6.0%).
Sales and Office Occupations by Sex
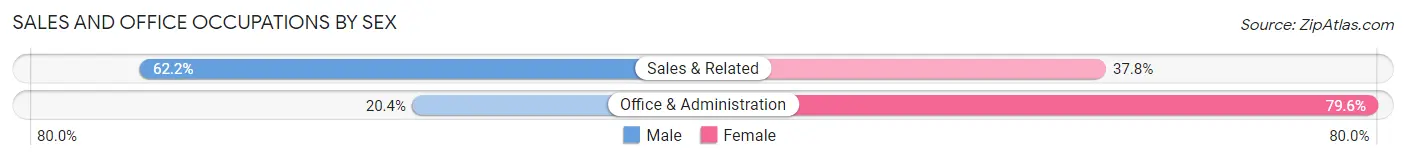
| Occupation | Male | Female |
| Sales & Related | 463 (62.2%) | 281 (37.8%) |
| Office & Administration | 496 (20.4%) | 1,932 (79.6%) |
| Total (Category) | 959 (30.2%) | 2,213 (69.8%) |
| Total (Overall) | 6,614 (53.4%) | 5,760 (46.6%) |
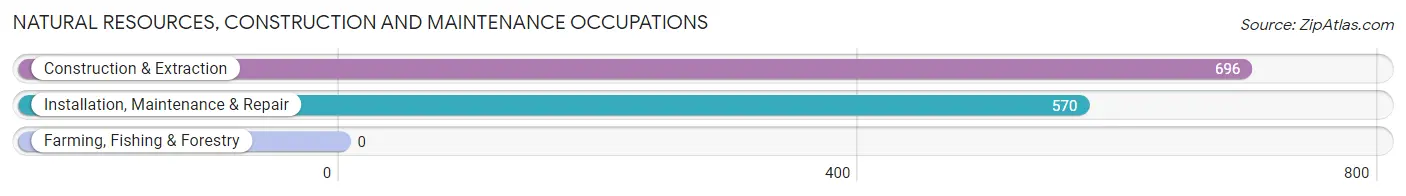
Natural Resources, Construction and Maintenance Occupations
The most common Natural Resources, Construction and Maintenance occupations in Saginaw are Construction & Extraction (696 | 5.6%), and Installation, Maintenance & Repair (570 | 4.6%).
Natural Resources, Construction and Maintenance Occupations by Sex
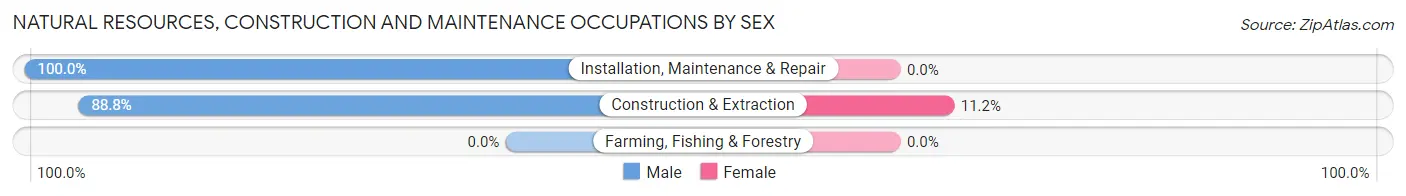
| Occupation | Male | Female |
| Farming, Fishing & Forestry | 0 (0.0%) | 0 (0.0%) |
| Construction & Extraction | 618 (88.8%) | 78 (11.2%) |
| Installation, Maintenance & Repair | 570 (100.0%) | 0 (0.0%) |
| Total (Category) | 1,188 (93.8%) | 78 (6.2%) |
| Total (Overall) | 6,614 (53.4%) | 5,760 (46.6%) |
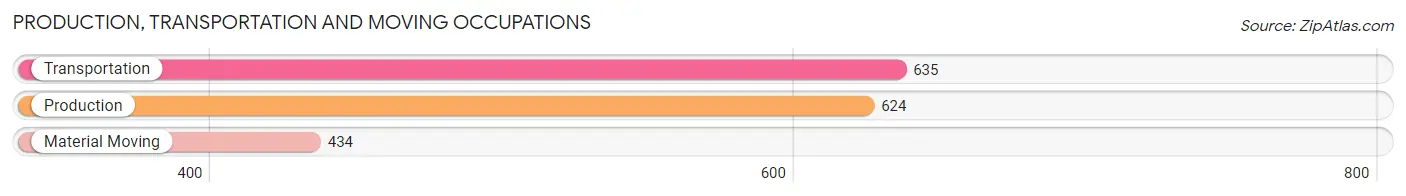
Production, Transportation and Moving Occupations
The most common Production, Transportation and Moving occupations in Saginaw are Transportation (635 | 5.1%), Production (624 | 5.0%), and Material Moving (434 | 3.5%).
Production, Transportation and Moving Occupations by Sex
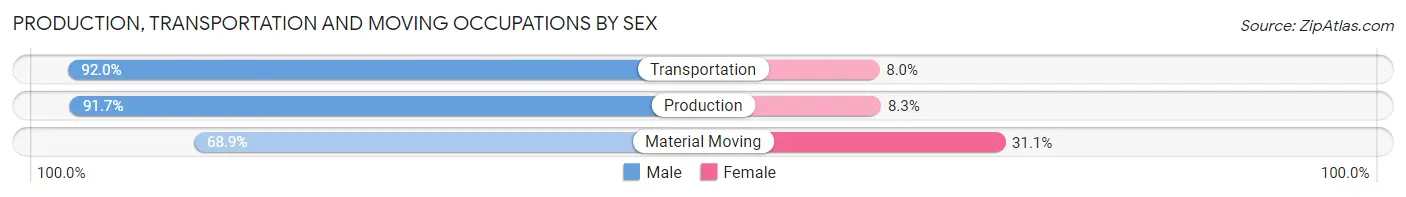
| Occupation | Male | Female |
| Production | 572 (91.7%) | 52 (8.3%) |
| Transportation | 584 (92.0%) | 51 (8.0%) |
| Material Moving | 299 (68.9%) | 135 (31.1%) |
| Total (Category) | 1,455 (85.9%) | 238 (14.1%) |
| Total (Overall) | 6,614 (53.4%) | 5,760 (46.6%) |
Employment Industries by Sex in Saginaw
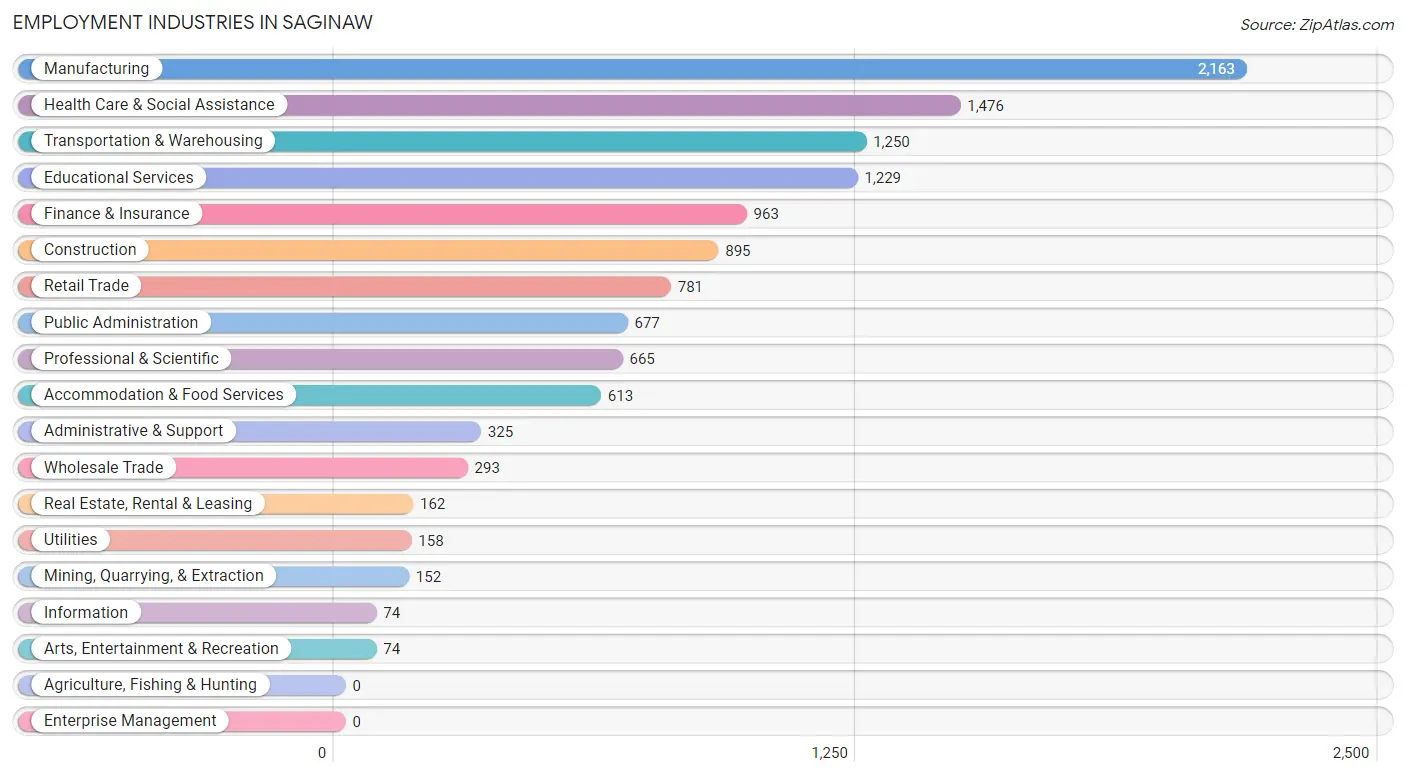
Employment Industries in Saginaw
The major employment industries in Saginaw include Manufacturing (2,163 | 17.5%), Health Care & Social Assistance (1,476 | 11.9%), Transportation & Warehousing (1,250 | 10.1%), Educational Services (1,229 | 9.9%), and Finance & Insurance (963 | 7.8%).
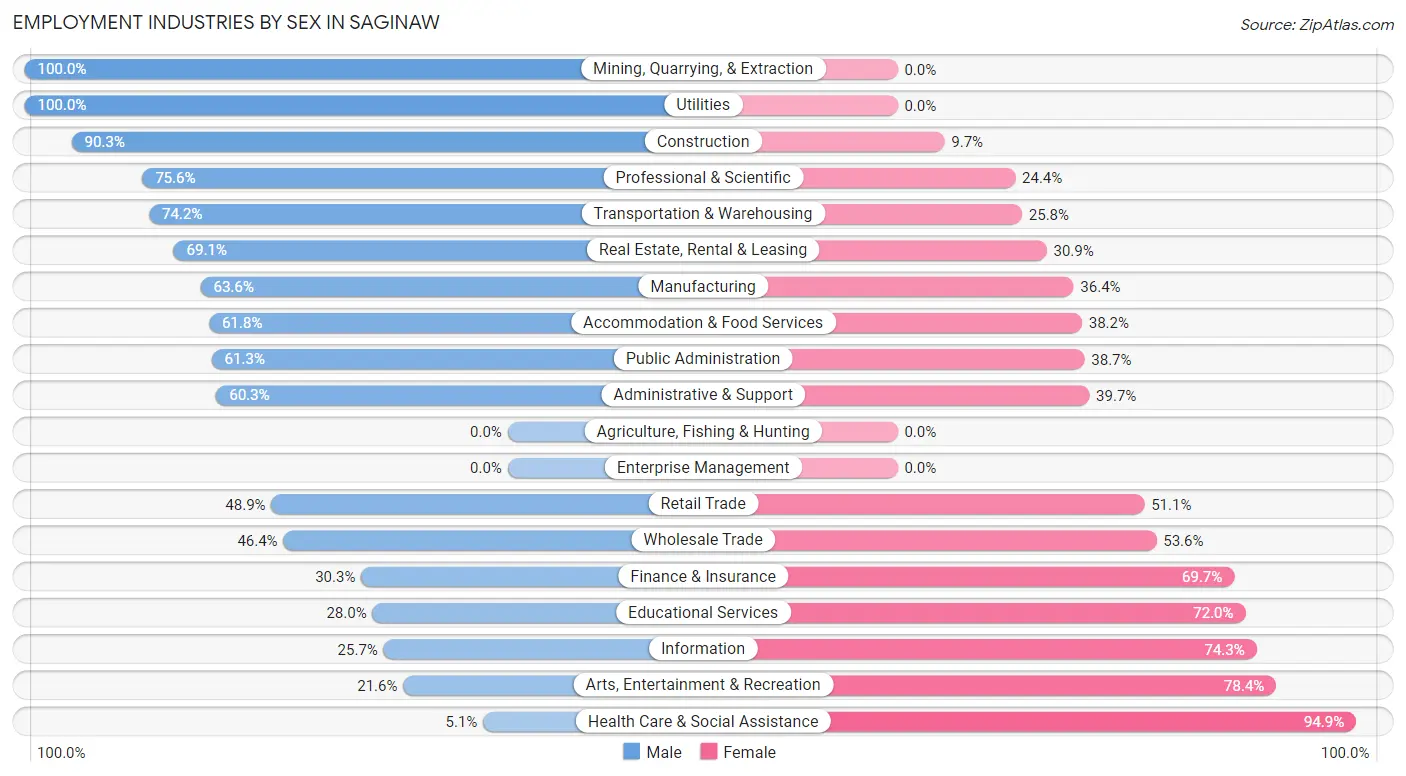
Employment Industries by Sex in Saginaw
The Saginaw industries that see more men than women are Mining, Quarrying, & Extraction (100.0%), Utilities (100.0%), and Construction (90.3%), whereas the industries that tend to have a higher number of women are Health Care & Social Assistance (94.9%), Arts, Entertainment & Recreation (78.4%), and Information (74.3%).
| Industry | Male | Female |
| Agriculture, Fishing & Hunting | 0 (0.0%) | 0 (0.0%) |
| Mining, Quarrying, & Extraction | 152 (100.0%) | 0 (0.0%) |
| Construction | 808 (90.3%) | 87 (9.7%) |
| Manufacturing | 1,375 (63.6%) | 788 (36.4%) |
| Wholesale Trade | 136 (46.4%) | 157 (53.6%) |
| Retail Trade | 382 (48.9%) | 399 (51.1%) |
| Transportation & Warehousing | 928 (74.2%) | 322 (25.8%) |
| Utilities | 158 (100.0%) | 0 (0.0%) |
| Information | 19 (25.7%) | 55 (74.3%) |
| Finance & Insurance | 292 (30.3%) | 671 (69.7%) |
| Real Estate, Rental & Leasing | 112 (69.1%) | 50 (30.9%) |
| Professional & Scientific | 503 (75.6%) | 162 (24.4%) |
| Enterprise Management | 0 (0.0%) | 0 (0.0%) |
| Administrative & Support | 196 (60.3%) | 129 (39.7%) |
| Educational Services | 344 (28.0%) | 885 (72.0%) |
| Health Care & Social Assistance | 75 (5.1%) | 1,401 (94.9%) |
| Arts, Entertainment & Recreation | 16 (21.6%) | 58 (78.4%) |
| Accommodation & Food Services | 379 (61.8%) | 234 (38.2%) |
| Public Administration | 415 (61.3%) | 262 (38.7%) |
| Total | 6,614 (53.4%) | 5,760 (46.6%) |
Education in Saginaw
School Enrollment in Saginaw
The most common levels of schooling among the 6,317 students in Saginaw are middle school (1,906 | 30.2%), high school (1,344 | 21.3%), and elementary school (992 | 15.7%).
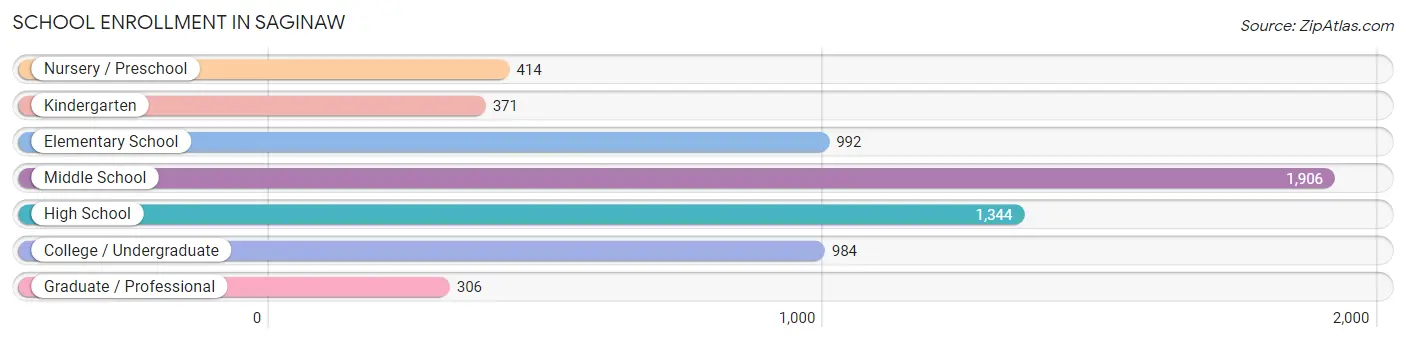
| School Level | # Students | % Students |
| Nursery / Preschool | 414 | 6.6% |
| Kindergarten | 371 | 5.9% |
| Elementary School | 992 | 15.7% |
| Middle School | 1,906 | 30.2% |
| High School | 1,344 | 21.3% |
| College / Undergraduate | 984 | 15.6% |
| Graduate / Professional | 306 | 4.8% |
| Total | 6,317 | 100.0% |
School Enrollment by Age by Funding Source in Saginaw
Out of a total of 6,317 students who are enrolled in schools in Saginaw, 910 (14.4%) attend a private institution, while the remaining 5,407 (85.6%) are enrolled in public schools. The age group of 3 to 4 year olds has the highest likelihood of being enrolled in private schools, with 137 (50.5% in the age bracket) enrolled. Conversely, the age group of 15 to 17 year olds has the lowest likelihood of being enrolled in a private school, with 944 (94.9% in the age bracket) attending a public institution.
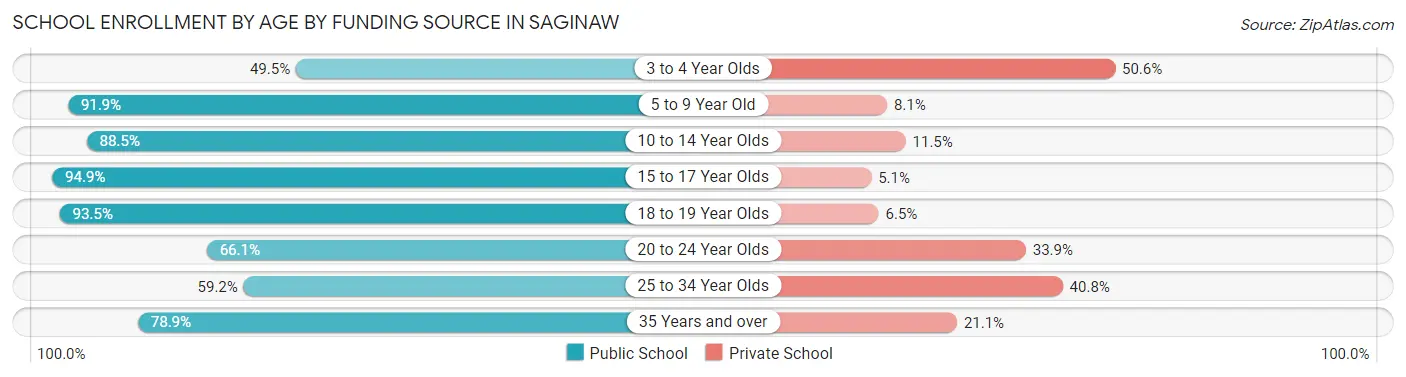
| Age Bracket | Public School | Private School |
| 3 to 4 Year Olds | 134 (49.4%) | 137 (50.5%) |
| 5 to 9 Year Old | 1,392 (91.9%) | 122 (8.1%) |
| 10 to 14 Year Olds | 1,802 (88.5%) | 235 (11.5%) |
| 15 to 17 Year Olds | 944 (94.9%) | 51 (5.1%) |
| 18 to 19 Year Olds | 431 (93.5%) | 30 (6.5%) |
| 20 to 24 Year Olds | 442 (66.1%) | 227 (33.9%) |
| 25 to 34 Year Olds | 90 (59.2%) | 62 (40.8%) |
| 35 Years and over | 172 (78.9%) | 46 (21.1%) |
| Total | 5,407 (85.6%) | 910 (14.4%) |
Educational Attainment by Field of Study in Saginaw
Business (1,039 | 24.2%), education (450 | 10.5%), science & technology (443 | 10.3%), arts & humanities (434 | 10.1%), and engineering (371 | 8.6%) are the most common fields of study among 4,292 individuals in Saginaw who have obtained a bachelor's degree or higher.
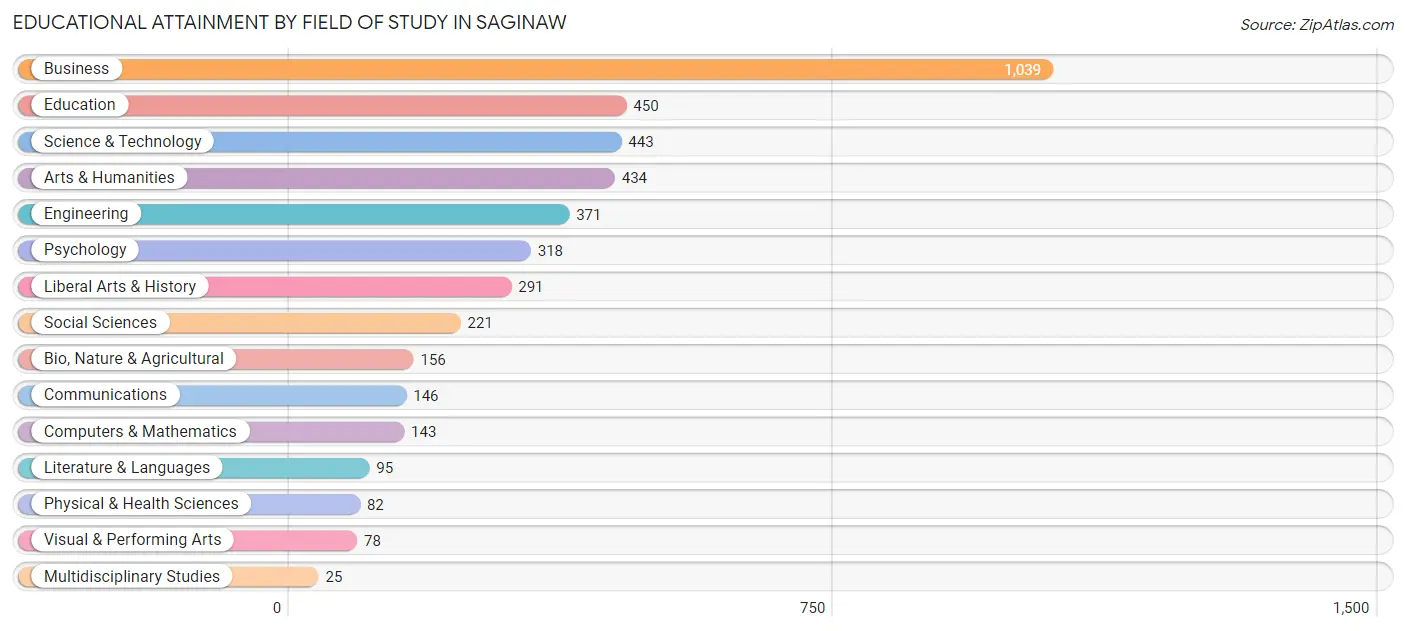
| Field of Study | # Graduates | % Graduates |
| Computers & Mathematics | 143 | 3.3% |
| Bio, Nature & Agricultural | 156 | 3.6% |
| Physical & Health Sciences | 82 | 1.9% |
| Psychology | 318 | 7.4% |
| Social Sciences | 221 | 5.1% |
| Engineering | 371 | 8.6% |
| Multidisciplinary Studies | 25 | 0.6% |
| Science & Technology | 443 | 10.3% |
| Business | 1,039 | 24.2% |
| Education | 450 | 10.5% |
| Literature & Languages | 95 | 2.2% |
| Liberal Arts & History | 291 | 6.8% |
| Visual & Performing Arts | 78 | 1.8% |
| Communications | 146 | 3.4% |
| Arts & Humanities | 434 | 10.1% |
| Total | 4,292 | 100.0% |
Transportation & Commute in Saginaw
Vehicle Availability by Sex in Saginaw
The most prevalent vehicle ownership categories in Saginaw are males with 2 vehicles (3,001, accounting for 45.2%) and females with 2 vehicles (2,842, making up 51.6%).
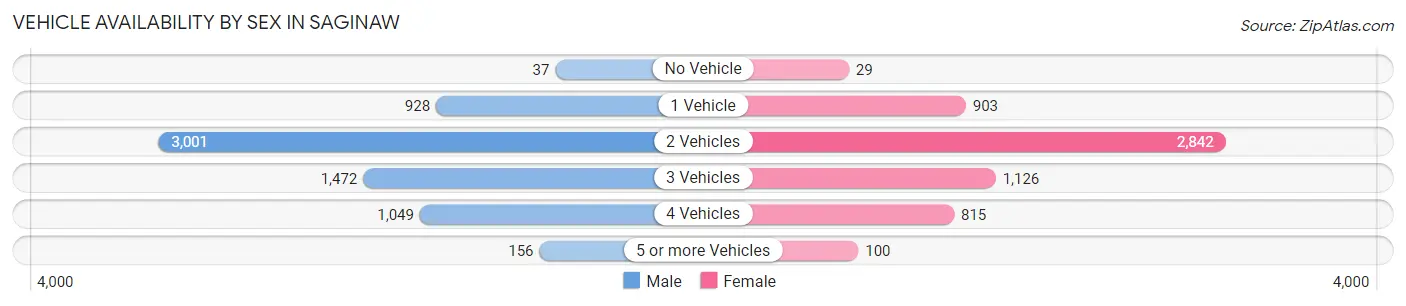
| Vehicles Available | Male | Female |
| No Vehicle | 37 (0.6%) | 29 (0.5%) |
| 1 Vehicle | 928 (14.0%) | 903 (15.5%) |
| 2 Vehicles | 3,001 (45.2%) | 2,842 (48.9%) |
| 3 Vehicles | 1,472 (22.2%) | 1,126 (19.4%) |
| 4 Vehicles | 1,049 (15.8%) | 815 (14.0%) |
| 5 or more Vehicles | 156 (2.4%) | 100 (1.7%) |
| Total | 6,643 (100.0%) | 5,815 (100.0%) |
Commute Time in Saginaw
The most frequently occuring commute durations in Saginaw are 30 to 34 minutes (2,305 commuters, 20.9%), 20 to 24 minutes (1,839 commuters, 16.7%), and 10 to 14 minutes (1,654 commuters, 15.0%).
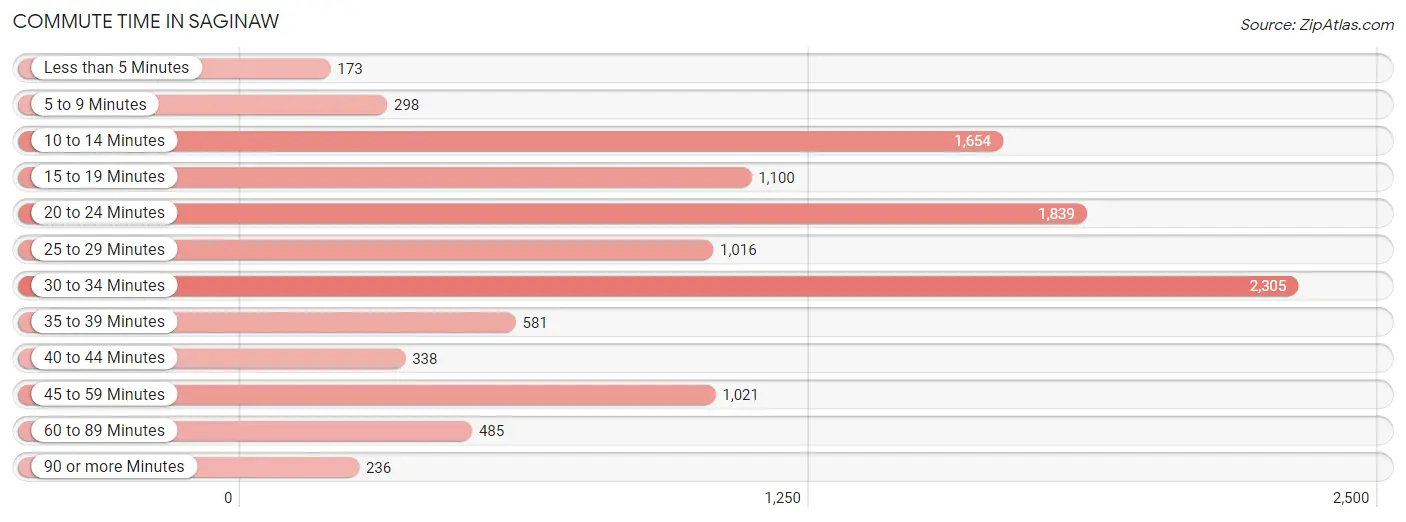
| Commute Time | # Commuters | % Commuters |
| Less than 5 Minutes | 173 | 1.6% |
| 5 to 9 Minutes | 298 | 2.7% |
| 10 to 14 Minutes | 1,654 | 15.0% |
| 15 to 19 Minutes | 1,100 | 10.0% |
| 20 to 24 Minutes | 1,839 | 16.7% |
| 25 to 29 Minutes | 1,016 | 9.2% |
| 30 to 34 Minutes | 2,305 | 20.9% |
| 35 to 39 Minutes | 581 | 5.3% |
| 40 to 44 Minutes | 338 | 3.1% |
| 45 to 59 Minutes | 1,021 | 9.2% |
| 60 to 89 Minutes | 485 | 4.4% |
| 90 or more Minutes | 236 | 2.1% |
Commute Time by Sex in Saginaw
The most common commute times in Saginaw are 30 to 34 minutes (1,325 commuters, 22.2%) for males and 20 to 24 minutes (997 commuters, 19.6%) for females.
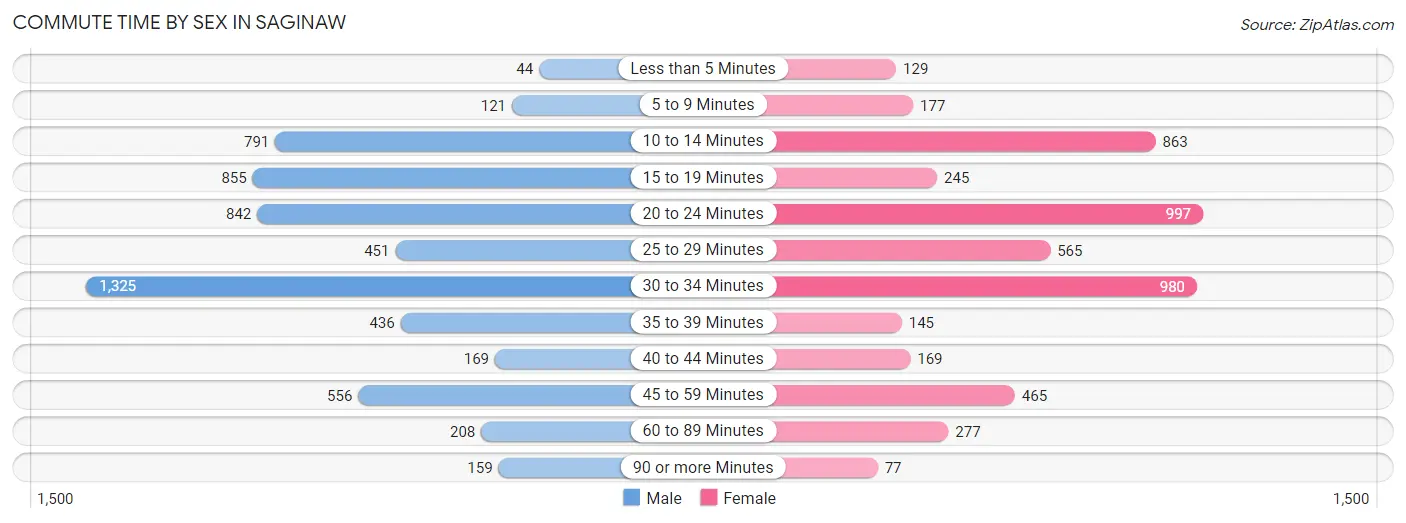
| Commute Time | Male | Female |
| Less than 5 Minutes | 44 (0.7%) | 129 (2.5%) |
| 5 to 9 Minutes | 121 (2.0%) | 177 (3.5%) |
| 10 to 14 Minutes | 791 (13.3%) | 863 (17.0%) |
| 15 to 19 Minutes | 855 (14.3%) | 245 (4.8%) |
| 20 to 24 Minutes | 842 (14.1%) | 997 (19.6%) |
| 25 to 29 Minutes | 451 (7.6%) | 565 (11.1%) |
| 30 to 34 Minutes | 1,325 (22.2%) | 980 (19.3%) |
| 35 to 39 Minutes | 436 (7.3%) | 145 (2.9%) |
| 40 to 44 Minutes | 169 (2.8%) | 169 (3.3%) |
| 45 to 59 Minutes | 556 (9.3%) | 465 (9.1%) |
| 60 to 89 Minutes | 208 (3.5%) | 277 (5.4%) |
| 90 or more Minutes | 159 (2.7%) | 77 (1.5%) |
Time of Departure to Work by Sex in Saginaw
The most frequent times of departure to work in Saginaw are 7:00 AM to 7:29 AM (1,270, 21.3%) for males and 7:00 AM to 7:29 AM (1,300, 25.6%) for females.
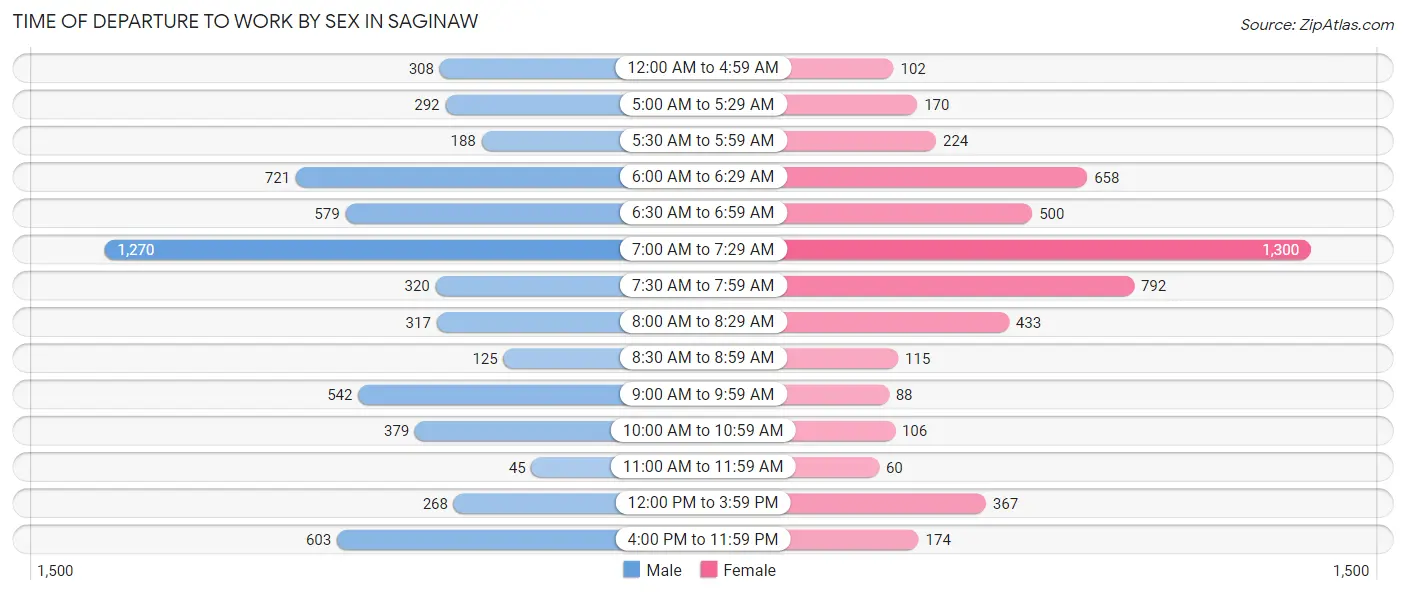
| Time of Departure | Male | Female |
| 12:00 AM to 4:59 AM | 308 (5.2%) | 102 (2.0%) |
| 5:00 AM to 5:29 AM | 292 (4.9%) | 170 (3.3%) |
| 5:30 AM to 5:59 AM | 188 (3.2%) | 224 (4.4%) |
| 6:00 AM to 6:29 AM | 721 (12.1%) | 658 (12.9%) |
| 6:30 AM to 6:59 AM | 579 (9.7%) | 500 (9.8%) |
| 7:00 AM to 7:29 AM | 1,270 (21.3%) | 1,300 (25.6%) |
| 7:30 AM to 7:59 AM | 320 (5.4%) | 792 (15.6%) |
| 8:00 AM to 8:29 AM | 317 (5.3%) | 433 (8.5%) |
| 8:30 AM to 8:59 AM | 125 (2.1%) | 115 (2.3%) |
| 9:00 AM to 9:59 AM | 542 (9.1%) | 88 (1.7%) |
| 10:00 AM to 10:59 AM | 379 (6.4%) | 106 (2.1%) |
| 11:00 AM to 11:59 AM | 45 (0.8%) | 60 (1.2%) |
| 12:00 PM to 3:59 PM | 268 (4.5%) | 367 (7.2%) |
| 4:00 PM to 11:59 PM | 603 (10.1%) | 174 (3.4%) |
| Total | 5,957 (100.0%) | 5,089 (100.0%) |
Housing Occupancy in Saginaw
Occupancy by Ownership in Saginaw
Of the total 8,700 dwellings in Saginaw, owner-occupied units account for 6,298 (72.4%), while renter-occupied units make up 2,402 (27.6%).
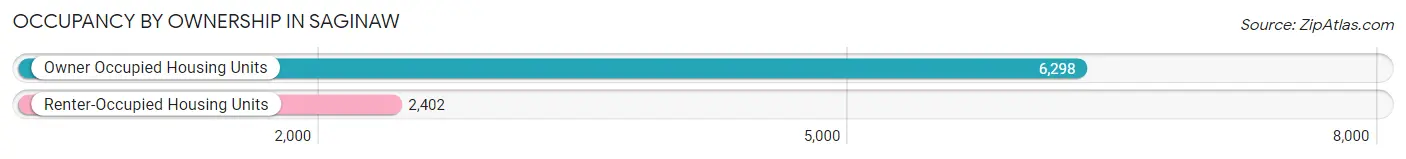
| Occupancy | # Housing Units | % Housing Units |
| Owner Occupied Housing Units | 6,298 | 72.4% |
| Renter-Occupied Housing Units | 2,402 | 27.6% |
| Total Occupied Housing Units | 8,700 | 100.0% |
Occupancy by Household Size in Saginaw
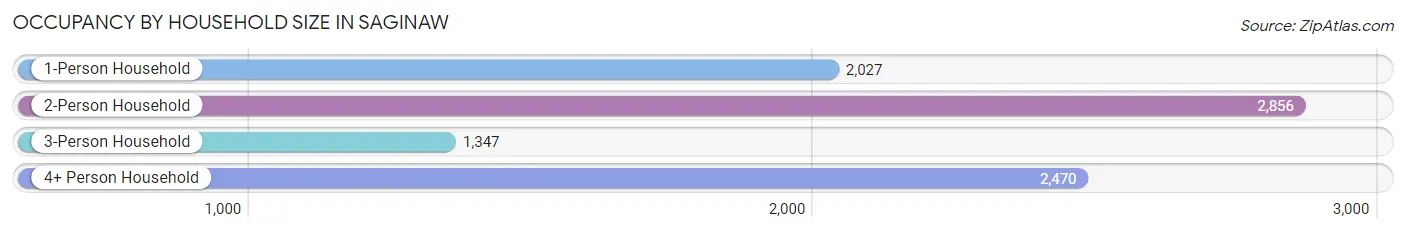
| Household Size | # Housing Units | % Housing Units |
| 1-Person Household | 2,027 | 23.3% |
| 2-Person Household | 2,856 | 32.8% |
| 3-Person Household | 1,347 | 15.5% |
| 4+ Person Household | 2,470 | 28.4% |
| Total Housing Units | 8,700 | 100.0% |
Occupancy by Ownership by Household Size in Saginaw
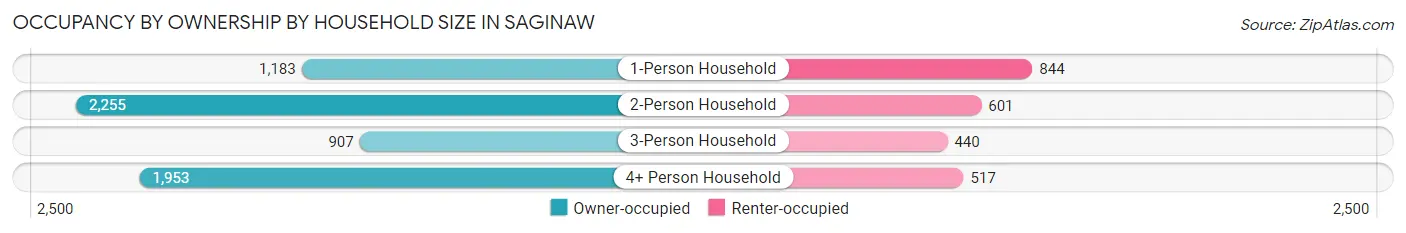
| Household Size | Owner-occupied | Renter-occupied |
| 1-Person Household | 1,183 (58.4%) | 844 (41.6%) |
| 2-Person Household | 2,255 (79.0%) | 601 (21.0%) |
| 3-Person Household | 907 (67.3%) | 440 (32.7%) |
| 4+ Person Household | 1,953 (79.1%) | 517 (20.9%) |
| Total Housing Units | 6,298 (72.4%) | 2,402 (27.6%) |
Occupancy by Educational Attainment in Saginaw
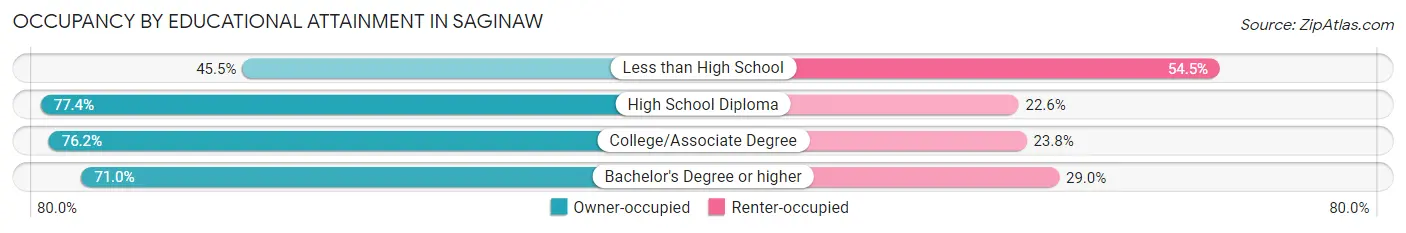
| Household Size | Owner-occupied | Renter-occupied |
| Less than High School | 297 (45.5%) | 356 (54.5%) |
| High School Diploma | 1,361 (77.4%) | 397 (22.6%) |
| College/Associate Degree | 2,581 (76.2%) | 808 (23.8%) |
| Bachelor's Degree or higher | 2,059 (71.0%) | 841 (29.0%) |
Occupancy by Age of Householder in Saginaw
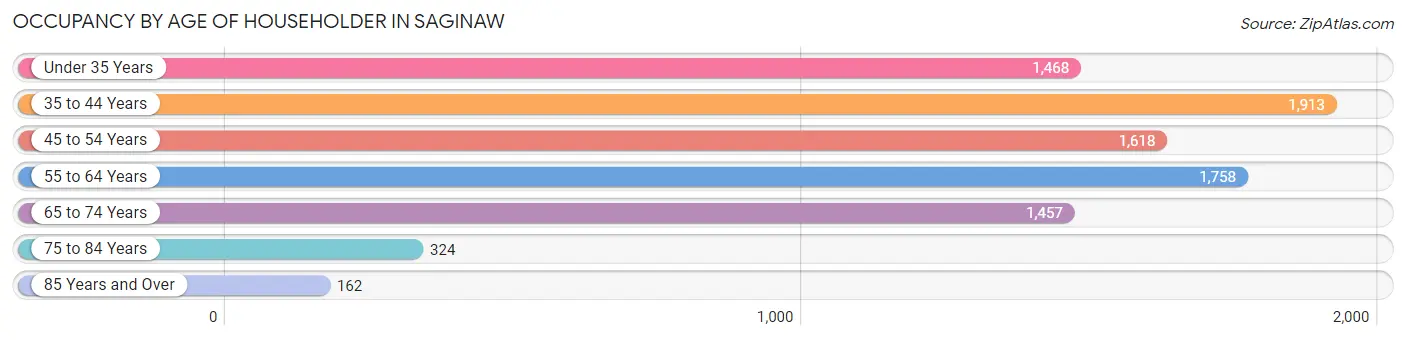
| Age Bracket | # Households | % Households |
| Under 35 Years | 1,468 | 16.9% |
| 35 to 44 Years | 1,913 | 22.0% |
| 45 to 54 Years | 1,618 | 18.6% |
| 55 to 64 Years | 1,758 | 20.2% |
| 65 to 74 Years | 1,457 | 16.8% |
| 75 to 84 Years | 324 | 3.7% |
| 85 Years and Over | 162 | 1.9% |
| Total | 8,700 | 100.0% |
Housing Finances in Saginaw
Median Income by Occupancy in Saginaw
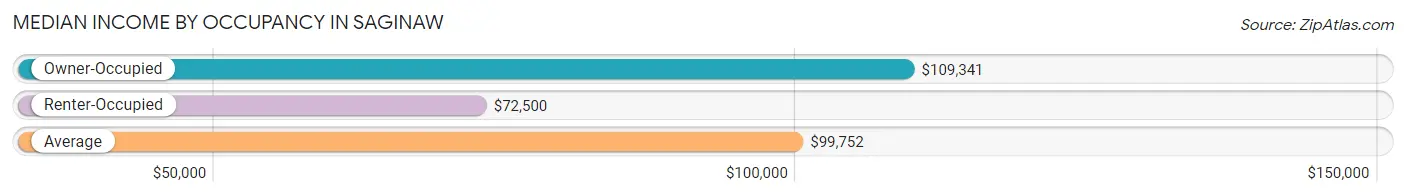
| Occupancy Type | # Households | Median Income |
| Owner-Occupied | 6,298 (72.4%) | $109,341 |
| Renter-Occupied | 2,402 (27.6%) | $72,500 |
| Average | 8,700 (100.0%) | $99,752 |
Occupancy by Householder Income Bracket in Saginaw
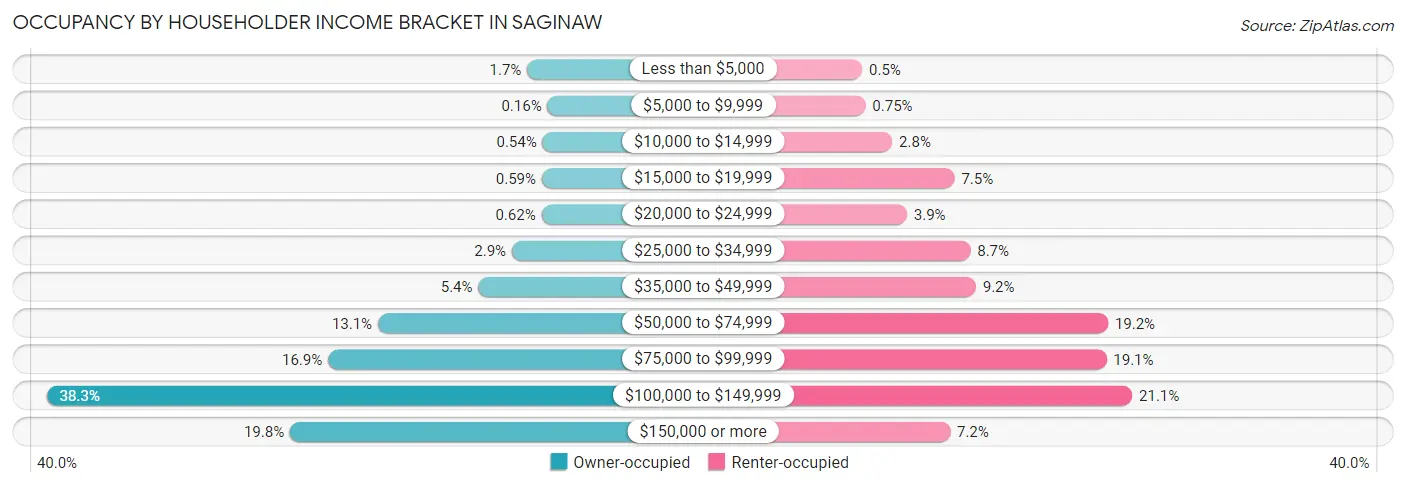
| Income Bracket | Owner-occupied | Renter-occupied |
| Less than $5,000 | 108 (1.7%) | 12 (0.5%) |
| $5,000 to $9,999 | 10 (0.2%) | 18 (0.7%) |
| $10,000 to $14,999 | 34 (0.5%) | 67 (2.8%) |
| $15,000 to $19,999 | 37 (0.6%) | 181 (7.5%) |
| $20,000 to $24,999 | 39 (0.6%) | 94 (3.9%) |
| $25,000 to $34,999 | 181 (2.9%) | 210 (8.7%) |
| $35,000 to $49,999 | 342 (5.4%) | 220 (9.2%) |
| $50,000 to $74,999 | 824 (13.1%) | 462 (19.2%) |
| $75,000 to $99,999 | 1,063 (16.9%) | 459 (19.1%) |
| $100,000 to $149,999 | 2,414 (38.3%) | 506 (21.1%) |
| $150,000 or more | 1,246 (19.8%) | 173 (7.2%) |
| Total | 6,298 (100.0%) | 2,402 (100.0%) |
Monthly Housing Cost Tiers in Saginaw
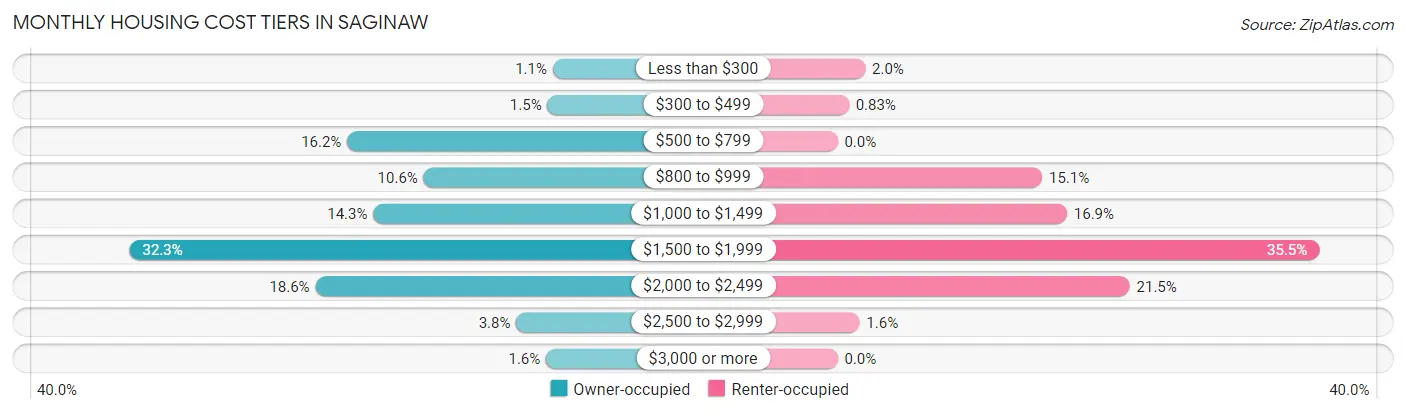
| Monthly Cost | Owner-occupied | Renter-occupied |
| Less than $300 | 69 (1.1%) | 49 (2.0%) |
| $300 to $499 | 94 (1.5%) | 20 (0.8%) |
| $500 to $799 | 1,023 (16.2%) | 0 (0.0%) |
| $800 to $999 | 668 (10.6%) | 362 (15.1%) |
| $1,000 to $1,499 | 902 (14.3%) | 406 (16.9%) |
| $1,500 to $1,999 | 2,033 (32.3%) | 852 (35.5%) |
| $2,000 to $2,499 | 1,170 (18.6%) | 517 (21.5%) |
| $2,500 to $2,999 | 239 (3.8%) | 39 (1.6%) |
| $3,000 or more | 100 (1.6%) | 0 (0.0%) |
| Total | 6,298 (100.0%) | 2,402 (100.0%) |
Physical Housing Characteristics in Saginaw
Housing Structures in Saginaw
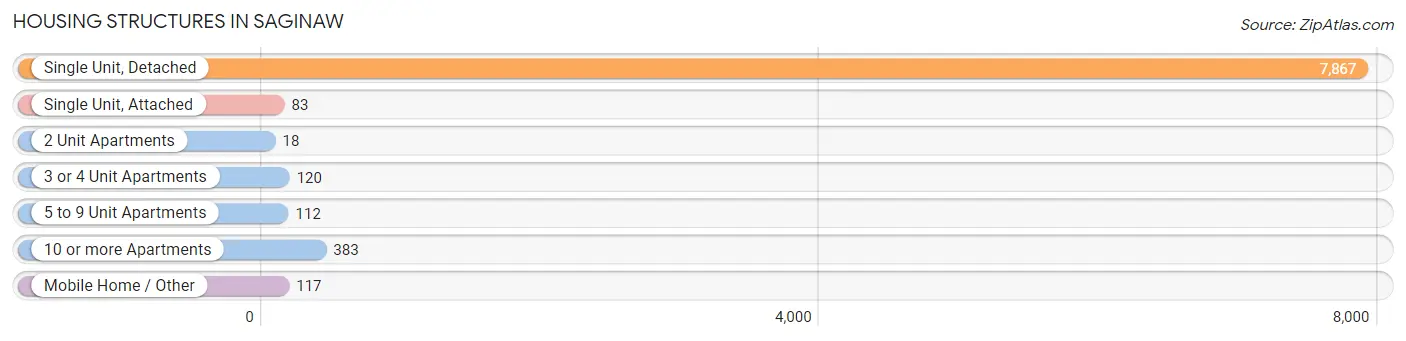
| Structure Type | # Housing Units | % Housing Units |
| Single Unit, Detached | 7,867 | 90.4% |
| Single Unit, Attached | 83 | 0.9% |
| 2 Unit Apartments | 18 | 0.2% |
| 3 or 4 Unit Apartments | 120 | 1.4% |
| 5 to 9 Unit Apartments | 112 | 1.3% |
| 10 or more Apartments | 383 | 4.4% |
| Mobile Home / Other | 117 | 1.3% |
| Total | 8,700 | 100.0% |
Housing Structures by Occupancy in Saginaw
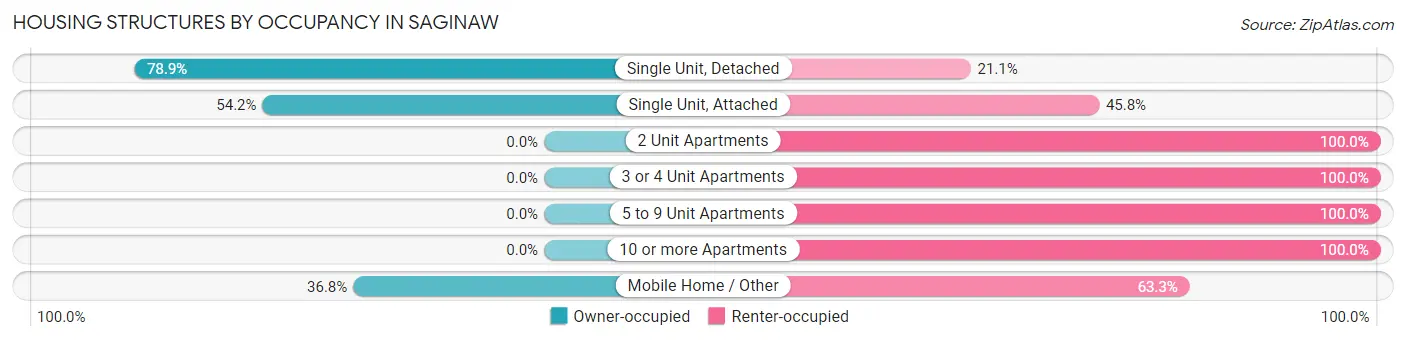
| Structure Type | Owner-occupied | Renter-occupied |
| Single Unit, Detached | 6,210 (78.9%) | 1,657 (21.1%) |
| Single Unit, Attached | 45 (54.2%) | 38 (45.8%) |
| 2 Unit Apartments | 0 (0.0%) | 18 (100.0%) |
| 3 or 4 Unit Apartments | 0 (0.0%) | 120 (100.0%) |
| 5 to 9 Unit Apartments | 0 (0.0%) | 112 (100.0%) |
| 10 or more Apartments | 0 (0.0%) | 383 (100.0%) |
| Mobile Home / Other | 43 (36.7%) | 74 (63.2%) |
| Total | 6,298 (72.4%) | 2,402 (27.6%) |
Housing Structures by Number of Rooms in Saginaw
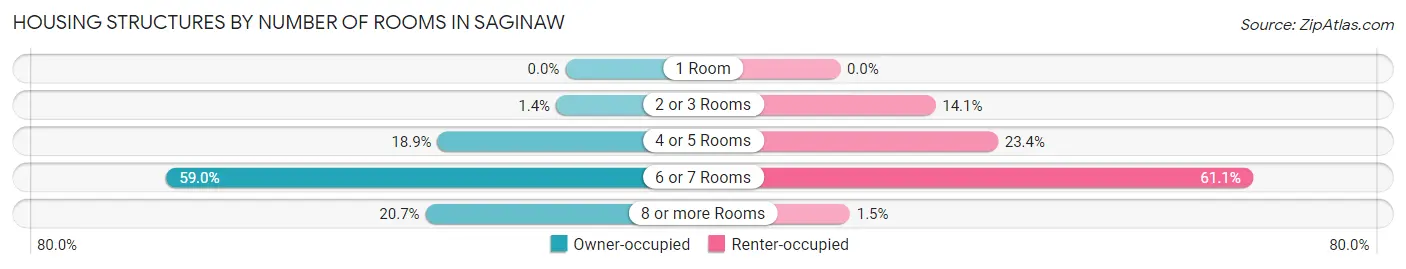
| Number of Rooms | Owner-occupied | Renter-occupied |
| 1 Room | 0 (0.0%) | 0 (0.0%) |
| 2 or 3 Rooms | 86 (1.4%) | 339 (14.1%) |
| 4 or 5 Rooms | 1,191 (18.9%) | 561 (23.4%) |
| 6 or 7 Rooms | 3,718 (59.0%) | 1,467 (61.1%) |
| 8 or more Rooms | 1,303 (20.7%) | 35 (1.5%) |
| Total | 6,298 (100.0%) | 2,402 (100.0%) |
Housing Structure by Heating Type in Saginaw
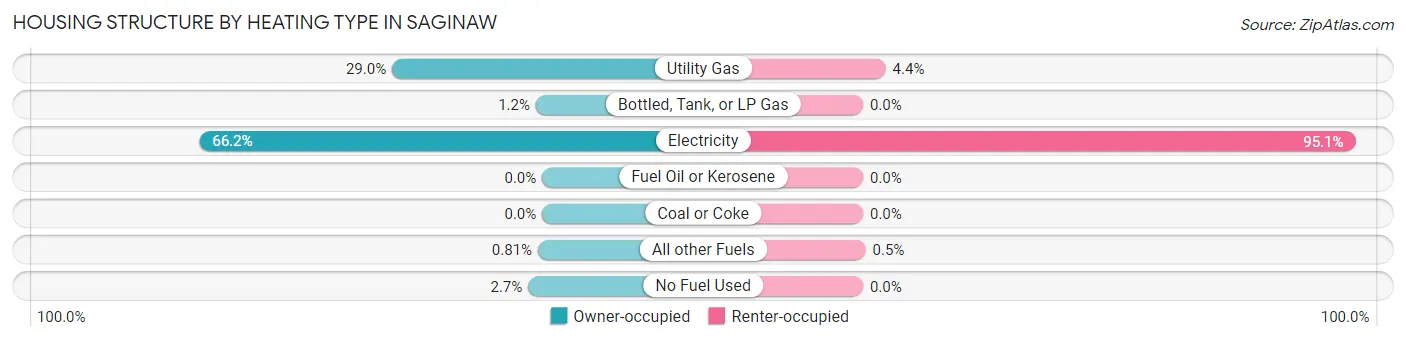
| Heating Type | Owner-occupied | Renter-occupied |
| Utility Gas | 1,827 (29.0%) | 105 (4.4%) |
| Bottled, Tank, or LP Gas | 77 (1.2%) | 0 (0.0%) |
| Electricity | 4,172 (66.2%) | 2,285 (95.1%) |
| Fuel Oil or Kerosene | 0 (0.0%) | 0 (0.0%) |
| Coal or Coke | 0 (0.0%) | 0 (0.0%) |
| All other Fuels | 51 (0.8%) | 12 (0.5%) |
| No Fuel Used | 171 (2.7%) | 0 (0.0%) |
| Total | 6,298 (100.0%) | 2,402 (100.0%) |
Household Vehicle Usage in Saginaw
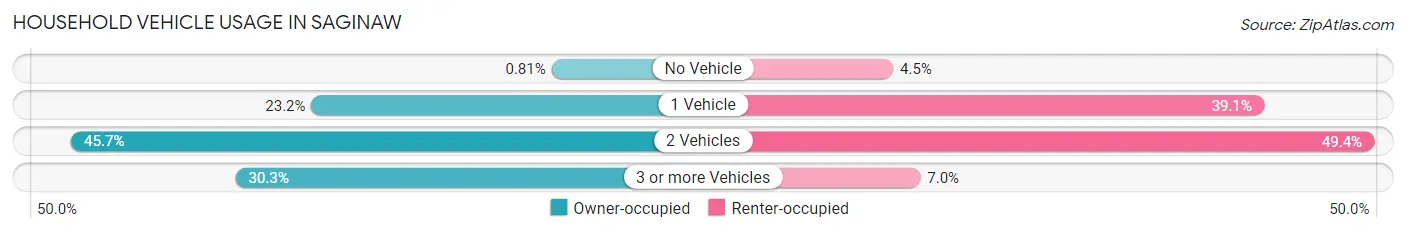
| Vehicles per Household | Owner-occupied | Renter-occupied |
| No Vehicle | 51 (0.8%) | 108 (4.5%) |
| 1 Vehicle | 1,463 (23.2%) | 939 (39.1%) |
| 2 Vehicles | 2,875 (45.7%) | 1,186 (49.4%) |
| 3 or more Vehicles | 1,909 (30.3%) | 169 (7.0%) |
| Total | 6,298 (100.0%) | 2,402 (100.0%) |
Real Estate & Mortgages in Saginaw
Real Estate and Mortgage Overview in Saginaw
| Characteristic | Without Mortgage | With Mortgage |
| Housing Units | 1,861 | 4,437 |
| Median Property Value | $206,200 | $258,300 |
| Median Household Income | $103,790 | $991 |
| Monthly Housing Costs | $725 | $100 |
| Real Estate Taxes | $3,231 | $117 |
Property Value by Mortgage Status in Saginaw
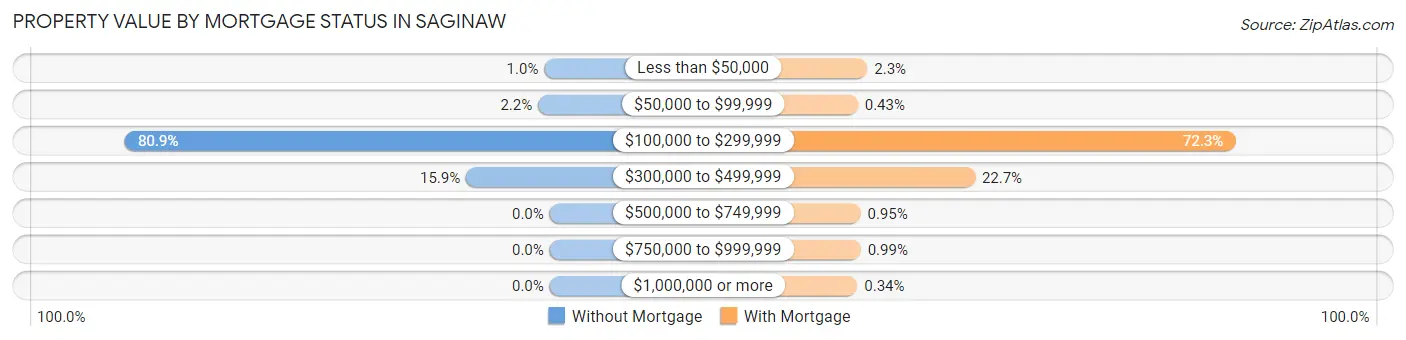
| Property Value | Without Mortgage | With Mortgage |
| Less than $50,000 | 19 (1.0%) | 100 (2.2%) |
| $50,000 to $99,999 | 41 (2.2%) | 19 (0.4%) |
| $100,000 to $299,999 | 1,505 (80.9%) | 3,208 (72.3%) |
| $300,000 to $499,999 | 296 (15.9%) | 1,009 (22.7%) |
| $500,000 to $749,999 | 0 (0.0%) | 42 (0.9%) |
| $750,000 to $999,999 | 0 (0.0%) | 44 (1.0%) |
| $1,000,000 or more | 0 (0.0%) | 15 (0.3%) |
| Total | 1,861 (100.0%) | 4,437 (100.0%) |
Household Income by Mortgage Status in Saginaw
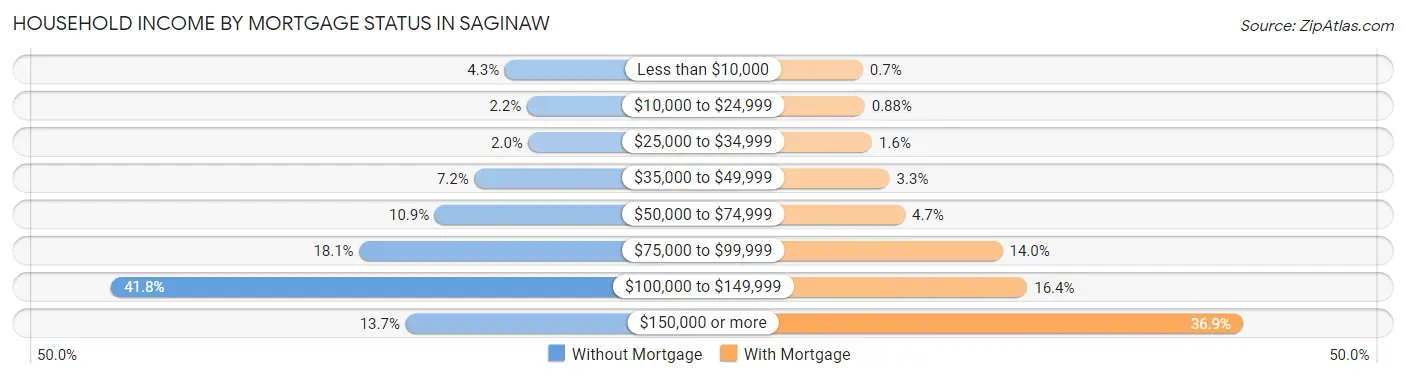
| Household Income | Without Mortgage | With Mortgage |
| Less than $10,000 | 79 (4.3%) | 31 (0.7%) |
| $10,000 to $24,999 | 40 (2.1%) | 39 (0.9%) |
| $25,000 to $34,999 | 37 (2.0%) | 70 (1.6%) |
| $35,000 to $49,999 | 133 (7.1%) | 144 (3.3%) |
| $50,000 to $74,999 | 203 (10.9%) | 209 (4.7%) |
| $75,000 to $99,999 | 337 (18.1%) | 621 (14.0%) |
| $100,000 to $149,999 | 777 (41.7%) | 726 (16.4%) |
| $150,000 or more | 255 (13.7%) | 1,637 (36.9%) |
| Total | 1,861 (100.0%) | 4,437 (100.0%) |
Property Value to Household Income Ratio in Saginaw
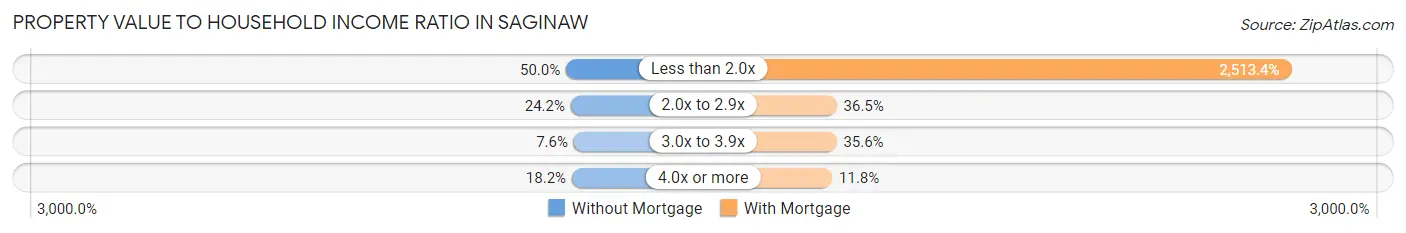
| Value-to-Income Ratio | Without Mortgage | With Mortgage |
| Less than 2.0x | 931 (50.0%) | 111,520 (2,513.4%) |
| 2.0x to 2.9x | 450 (24.2%) | 1,620 (36.5%) |
| 3.0x to 3.9x | 142 (7.6%) | 1,580 (35.6%) |
| 4.0x or more | 338 (18.2%) | 525 (11.8%) |
| Total | 1,861 (100.0%) | 4,437 (100.0%) |
Real Estate Taxes by Mortgage Status in Saginaw
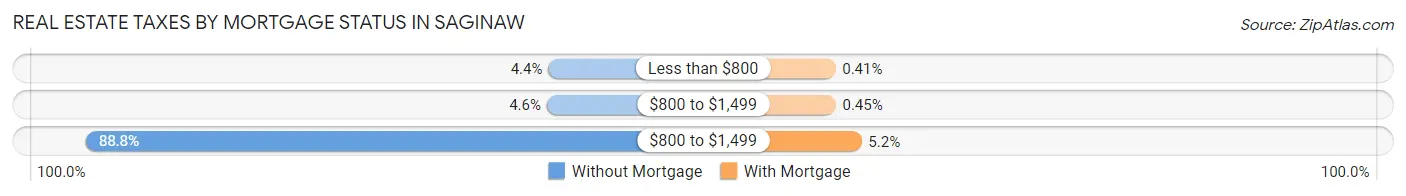
| Property Taxes | Without Mortgage | With Mortgage |
| Less than $800 | 81 (4.3%) | 18 (0.4%) |
| $800 to $1,499 | 86 (4.6%) | 20 (0.4%) |
| $800 to $1,499 | 1,653 (88.8%) | 230 (5.2%) |
| Total | 1,861 (100.0%) | 4,437 (100.0%) |
Health & Disability in Saginaw
Health Insurance Coverage by Age in Saginaw
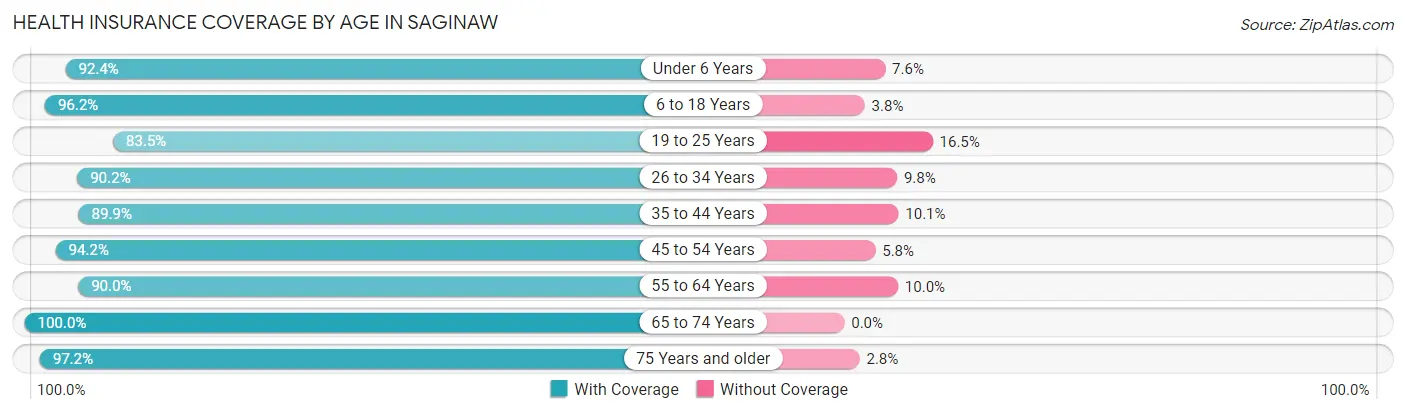
| Age Bracket | With Coverage | Without Coverage |
| Under 6 Years | 1,856 (92.4%) | 153 (7.6%) |
| 6 to 18 Years | 4,586 (96.2%) | 181 (3.8%) |
| 19 to 25 Years | 1,755 (83.5%) | 346 (16.5%) |
| 26 to 34 Years | 2,351 (90.2%) | 256 (9.8%) |
| 35 to 44 Years | 3,203 (89.9%) | 359 (10.1%) |
| 45 to 54 Years | 2,723 (94.2%) | 167 (5.8%) |
| 55 to 64 Years | 2,637 (90.0%) | 293 (10.0%) |
| 65 to 74 Years | 2,347 (100.0%) | 0 (0.0%) |
| 75 Years and older | 753 (97.2%) | 22 (2.8%) |
| Total | 22,211 (92.6%) | 1,777 (7.4%) |
Health Insurance Coverage by Citizenship Status in Saginaw
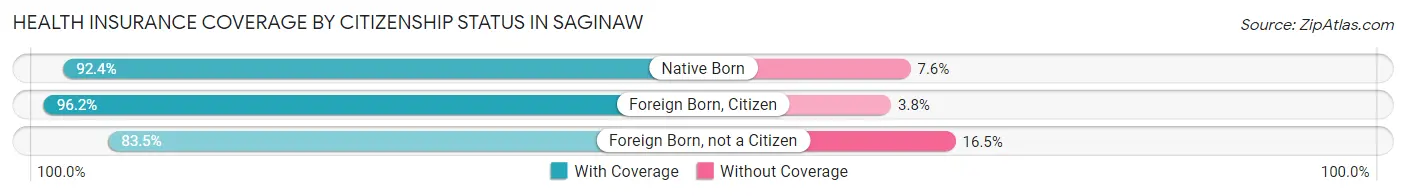
| Citizenship Status | With Coverage | Without Coverage |
| Native Born | 1,856 (92.4%) | 153 (7.6%) |
| Foreign Born, Citizen | 4,586 (96.2%) | 181 (3.8%) |
| Foreign Born, not a Citizen | 1,755 (83.5%) | 346 (16.5%) |
Health Insurance Coverage by Household Income in Saginaw
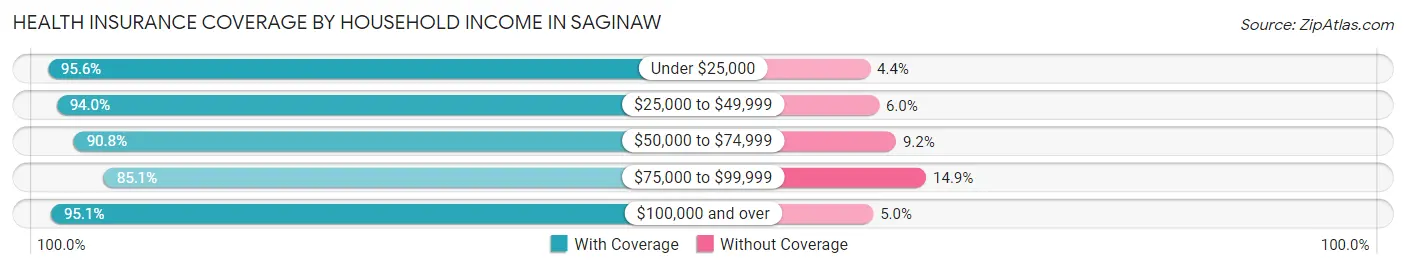
| Household Income | With Coverage | Without Coverage |
| Under $25,000 | 876 (95.6%) | 40 (4.4%) |
| $25,000 to $49,999 | 1,729 (94.0%) | 111 (6.0%) |
| $50,000 to $74,999 | 3,462 (90.8%) | 351 (9.2%) |
| $75,000 to $99,999 | 3,540 (85.1%) | 618 (14.9%) |
| $100,000 and over | 12,604 (95.1%) | 657 (5.0%) |
Public vs Private Health Insurance Coverage by Age in Saginaw
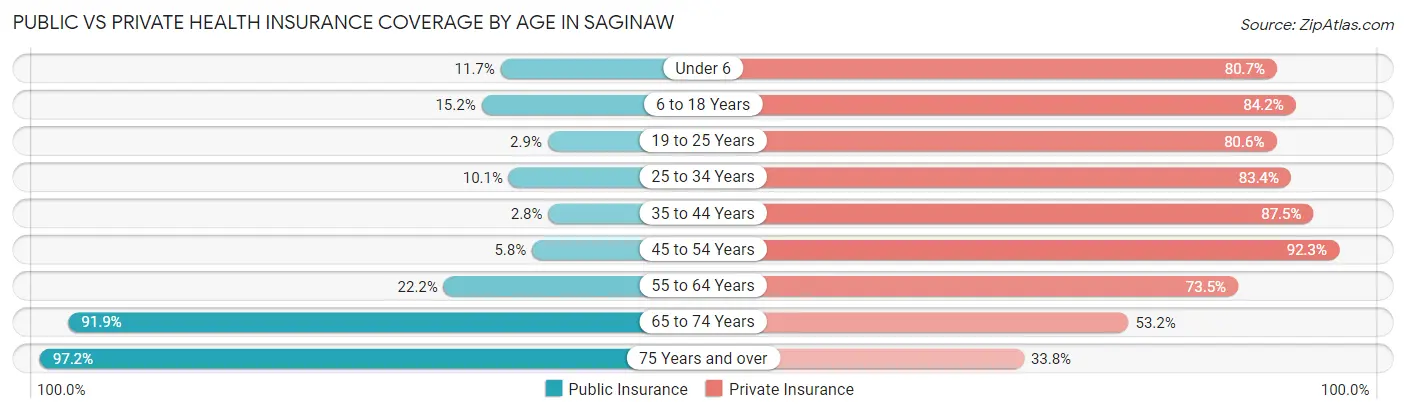
| Age Bracket | Public Insurance | Private Insurance |
| Under 6 | 234 (11.7%) | 1,622 (80.7%) |
| 6 to 18 Years | 724 (15.2%) | 4,015 (84.2%) |
| 19 to 25 Years | 61 (2.9%) | 1,694 (80.6%) |
| 25 to 34 Years | 264 (10.1%) | 2,173 (83.4%) |
| 35 to 44 Years | 99 (2.8%) | 3,117 (87.5%) |
| 45 to 54 Years | 168 (5.8%) | 2,666 (92.2%) |
| 55 to 64 Years | 651 (22.2%) | 2,154 (73.5%) |
| 65 to 74 Years | 2,156 (91.9%) | 1,249 (53.2%) |
| 75 Years and over | 753 (97.2%) | 262 (33.8%) |
| Total | 5,110 (21.3%) | 18,952 (79.0%) |
Disability Status by Sex by Age in Saginaw
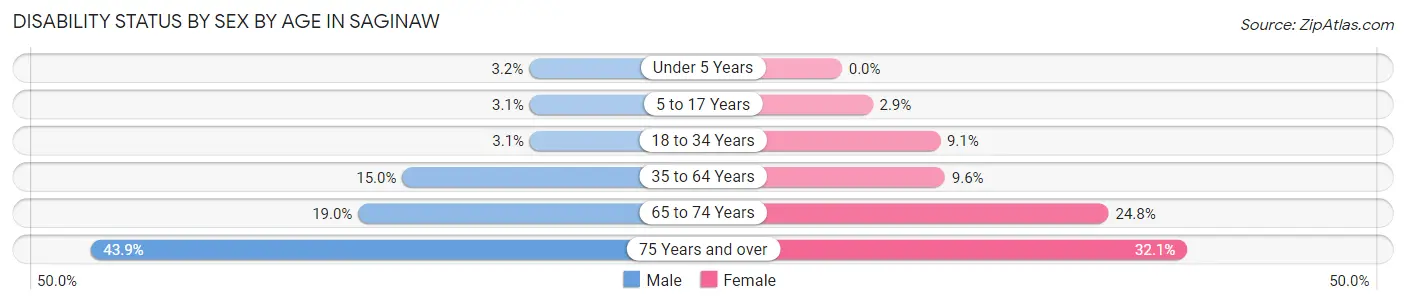
| Age Bracket | Male | Female |
| Under 5 Years | 27 (3.2%) | 0 (0.0%) |
| 5 to 17 Years | 82 (3.1%) | 62 (2.9%) |
| 18 to 34 Years | 80 (3.1%) | 227 (9.1%) |
| 35 to 64 Years | 702 (14.9%) | 448 (9.6%) |
| 65 to 74 Years | 207 (19.0%) | 312 (24.8%) |
| 75 Years and over | 158 (43.9%) | 133 (32.1%) |
Disability Class by Sex by Age in Saginaw
Disability Class: Hearing Difficulty
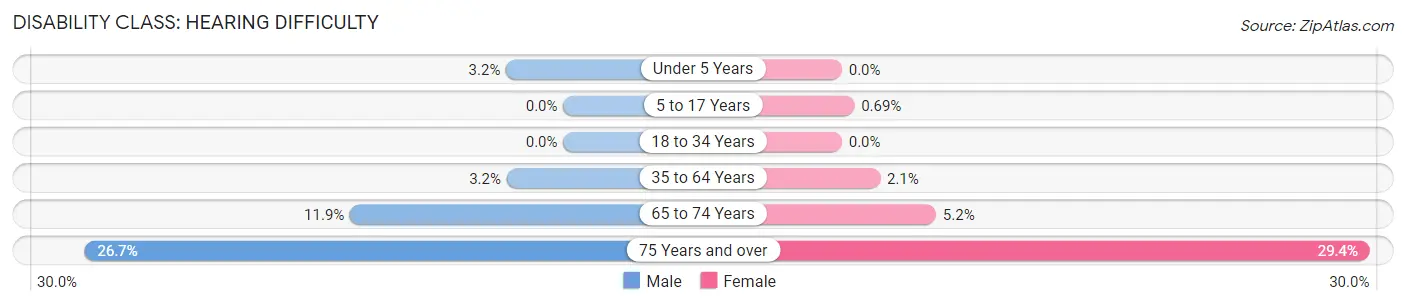
| Age Bracket | Male | Female |
| Under 5 Years | 27 (3.2%) | 0 (0.0%) |
| 5 to 17 Years | 0 (0.0%) | 15 (0.7%) |
| 18 to 34 Years | 0 (0.0%) | 0 (0.0%) |
| 35 to 64 Years | 148 (3.2%) | 100 (2.1%) |
| 65 to 74 Years | 129 (11.9%) | 66 (5.2%) |
| 75 Years and over | 96 (26.7%) | 122 (29.4%) |
Disability Class: Vision Difficulty
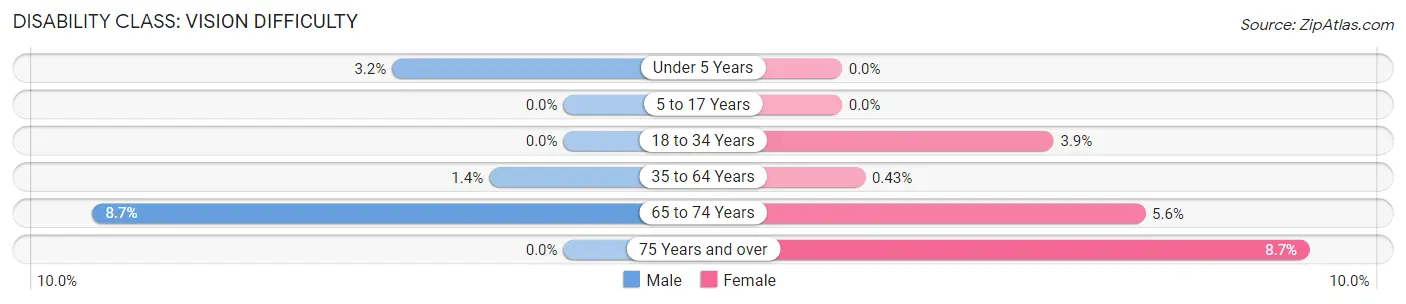
| Age Bracket | Male | Female |
| Under 5 Years | 27 (3.2%) | 0 (0.0%) |
| 5 to 17 Years | 0 (0.0%) | 0 (0.0%) |
| 18 to 34 Years | 0 (0.0%) | 98 (3.9%) |
| 35 to 64 Years | 65 (1.4%) | 20 (0.4%) |
| 65 to 74 Years | 95 (8.7%) | 71 (5.6%) |
| 75 Years and over | 0 (0.0%) | 36 (8.7%) |
Disability Class: Cognitive Difficulty
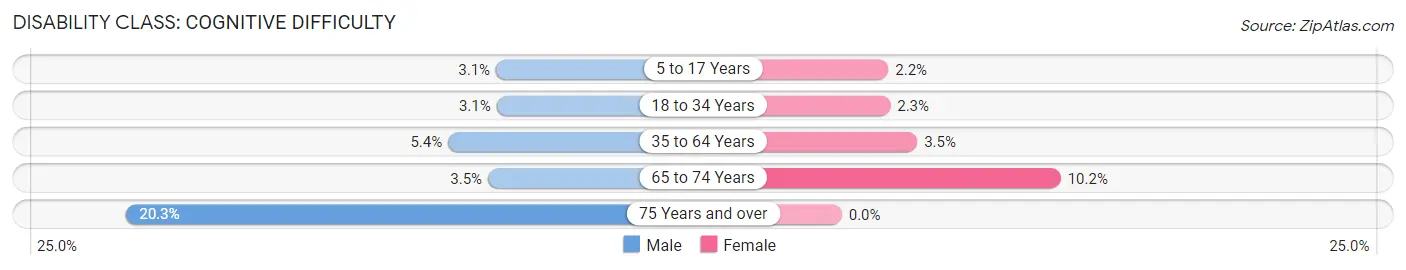
| Age Bracket | Male | Female |
| 5 to 17 Years | 82 (3.1%) | 47 (2.2%) |
| 18 to 34 Years | 80 (3.1%) | 56 (2.2%) |
| 35 to 64 Years | 251 (5.3%) | 164 (3.5%) |
| 65 to 74 Years | 38 (3.5%) | 128 (10.2%) |
| 75 Years and over | 73 (20.3%) | 0 (0.0%) |
Disability Class: Ambulatory Difficulty
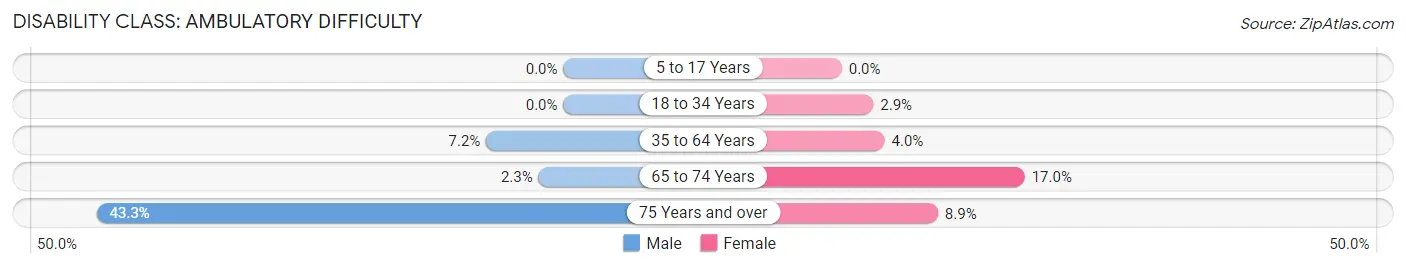
| Age Bracket | Male | Female |
| 5 to 17 Years | 0 (0.0%) | 0 (0.0%) |
| 18 to 34 Years | 0 (0.0%) | 73 (2.9%) |
| 35 to 64 Years | 336 (7.2%) | 186 (4.0%) |
| 65 to 74 Years | 25 (2.3%) | 214 (17.0%) |
| 75 Years and over | 156 (43.3%) | 37 (8.9%) |
Disability Class: Self-Care Difficulty
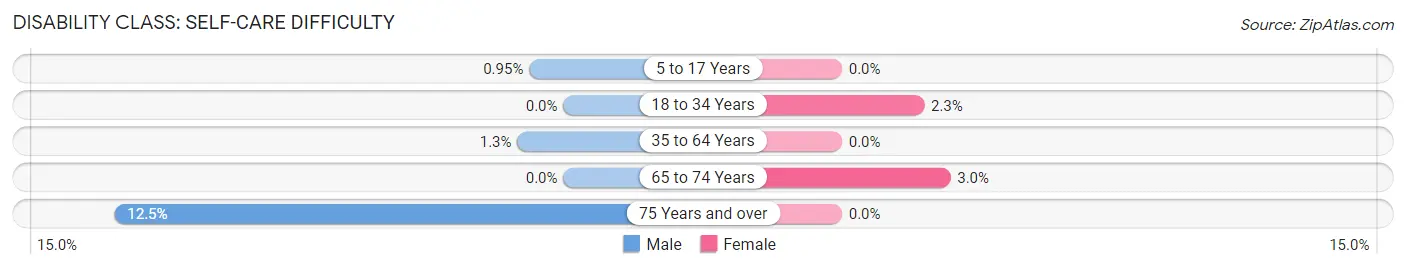
| Age Bracket | Male | Female |
| 5 to 17 Years | 25 (0.9%) | 0 (0.0%) |
| 18 to 34 Years | 0 (0.0%) | 57 (2.3%) |
| 35 to 64 Years | 60 (1.3%) | 0 (0.0%) |
| 65 to 74 Years | 0 (0.0%) | 38 (3.0%) |
| 75 Years and over | 45 (12.5%) | 0 (0.0%) |
Technology Access in Saginaw
Computing Device Access in Saginaw
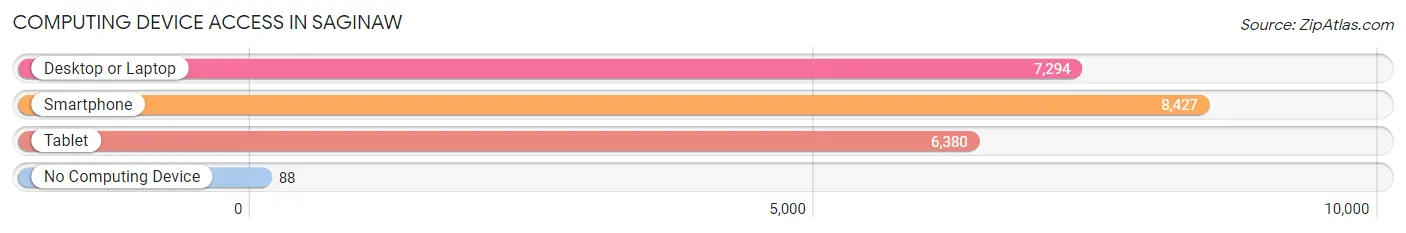
| Device Type | # Households | % Households |
| Desktop or Laptop | 7,294 | 83.8% |
| Smartphone | 8,427 | 96.9% |
| Tablet | 6,380 | 73.3% |
| No Computing Device | 88 | 1.0% |
| Total | 8,700 | 100.0% |
Internet Access in Saginaw
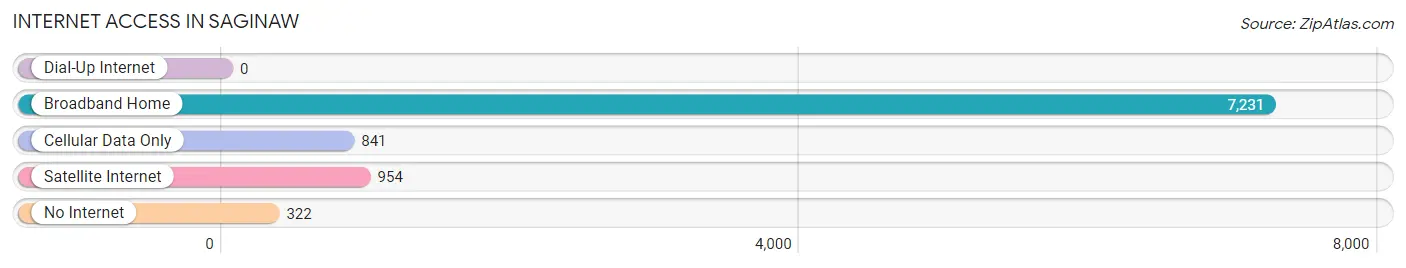
| Internet Type | # Households | % Households |
| Dial-Up Internet | 0 | 0.0% |
| Broadband Home | 7,231 | 83.1% |
| Cellular Data Only | 841 | 9.7% |
| Satellite Internet | 954 | 11.0% |
| No Internet | 322 | 3.7% |
| Total | 8,700 | 100.0% |
Saginaw Summary
Saginaw, Texas is a small city located in Tarrant County, Texas, United States. It is part of the Dallas-Fort Worth-Arlington metropolitan area. The city is located about 20 miles northwest of downtown Fort Worth and is part of the larger Fort Worth-Arlington-Dallas-Fort Worth-Arlington Combined Statistical Area. The population of Saginaw was estimated to be 24,837 in 2019.
History
Saginaw was founded in 1876 by a group of settlers from the nearby town of Weatherford. The town was named after the Saginaw River in Michigan. The first post office was established in 1877 and the town was incorporated in 1881.
The town grew slowly until the 1950s when the population began to increase rapidly due to the growth of the Dallas-Fort Worth metropolitan area. The population of Saginaw increased from 1,000 in 1950 to over 24,000 in 2019.
Geography
Saginaw is located in Tarrant County, Texas, United States. It is part of the Dallas-Fort Worth-Arlington metropolitan area. The city is located about 20 miles northwest of downtown Fort Worth and is part of the larger Fort Worth-Arlington-Dallas-Fort Worth-Arlington Combined Statistical Area.
The city has a total area of 8.3 square miles, of which 8.2 square miles is land and 0.1 square miles is water. The city is located in the Central Time Zone and observes Daylight Saving Time.
Economy
Saginaw is a small city with a diverse economy. The city is home to a variety of businesses, including manufacturing, retail, and service industries. The city is also home to several large employers, including Lockheed Martin, Bell Helicopter, and the University of Texas at Arlington.
The median household income in Saginaw is $63,845, which is higher than the national average of $57,652. The median home value in Saginaw is $182,400, which is higher than the national average of $184,700.
Demographics
As of 2019, the population of Saginaw was estimated to be 24,837. The racial makeup of the city was 79.2% White, 8.3% African American, 0.3% Native American, 4.2% Asian, 0.1% Pacific Islander, 4.7% from other races, and 3.4% from two or more races. Hispanic or Latino of any race were 13.2% of the population.
The median age in Saginaw is 34.7 years, which is lower than the national average of 37.7 years. The gender makeup of the city was 48.7% male and 51.3% female.
The city has a high rate of homeownership, with 73.2% of residents owning their homes. The average commute time for residents is 25.3 minutes, which is lower than the national average of 26.4 minutes. The city has a low crime rate, with only 1,845 crimes per 100,000 people, which is lower than the national average of 2,837 crimes per 100,000 people.
Common Questions
What is Per Capita Income in Saginaw?
Per Capita income in Saginaw is $38,217.
What is the Median Family Income in Saginaw?
Median Family Income in Saginaw is $109,569.
What is the Median Household income in Saginaw?
Median Household Income in Saginaw is $99,752.
What is Income or Wage Gap in Saginaw?
Income or Wage Gap in Saginaw is 31.4%.
Women in Saginaw earn 68.6 cents for every dollar earned by a man.
What is Family Income Deficit in Saginaw?
Family Income Deficit in Saginaw is $10,065.
Families that are below poverty line in Saginaw earn $10,065 less on average than the poverty threshold level.
What is Inequality or Gini Index in Saginaw?
Inequality or Gini Index in Saginaw is 0.31.
What is the Total Population of Saginaw?
Total Population of Saginaw is 24,106.
What is the Total Male Population of Saginaw?
Total Male Population of Saginaw is 12,253.
What is the Total Female Population of Saginaw?
Total Female Population of Saginaw is 11,853.
What is the Ratio of Males per 100 Females in Saginaw?
There are 103.37 Males per 100 Females in Saginaw.
What is the Ratio of Females per 100 Males in Saginaw?
There are 96.74 Females per 100 Males in Saginaw.
What is the Median Population Age in Saginaw?
Median Population Age in Saginaw is 36.6 Years.
What is the Average Family Size in Saginaw
Average Family Size in Saginaw is 3.3 People.
What is the Average Household Size in Saginaw
Average Household Size in Saginaw is 2.8 People.
How Large is the Labor Force in Saginaw?
There are 12,942 People in the Labor Forcein in Saginaw.
What is the Percentage of People in the Labor Force in Saginaw?
70.6% of People are in the Labor Force in Saginaw.
What is the Unemployment Rate in Saginaw?
Unemployment Rate in Saginaw is 3.5%.