New Braunfels, TX Map & Demographics
New Braunfels Map
New Braunfels Overview
$41,277
PER CAPITA INCOME
$100,761
AVG FAMILY INCOME
$85,827
AVG HOUSEHOLD INCOME
24.0%
WAGE / INCOME GAP [ % ]
76.0¢/ $1
WAGE / INCOME GAP [ $ ]
$9,125
FAMILY INCOME DEFICIT
0.42
INEQUALITY / GINI INDEX
92,993
TOTAL POPULATION
46,748
MALE POPULATION
46,245
FEMALE POPULATION
101.09
MALES / 100 FEMALES
98.92
FEMALES / 100 MALES
36.1
MEDIAN AGE
3.1
AVG FAMILY SIZE
2.5
AVG HOUSEHOLD SIZE
48,878
LABOR FORCE [ PEOPLE ]
66.8%
PERCENT IN LABOR FORCE
3.8%
UNEMPLOYMENT RATE
New Braunfels Area Codes
Income in New Braunfels
Income Overview in New Braunfels
Per Capita Income in New Braunfels is $41,277, while median incomes of families and households are $100,761 and $85,827 respectively.
| Characteristic | Number | Measure |
| Per Capita Income | 92,993 | $41,277 |
| Median Family Income | 24,182 | $100,761 |
| Mean Family Income | 24,182 | $123,326 |
| Median Household Income | 36,068 | $85,827 |
| Mean Household Income | 36,068 | $105,541 |
| Income Deficit | 24,182 | $9,125 |
| Wage / Income Gap (%) | 92,993 | 23.99% |
| Wage / Income Gap ($) | 92,993 | 76.01¢ per $1 |
| Gini / Inequality Index | 92,993 | 0.42 |
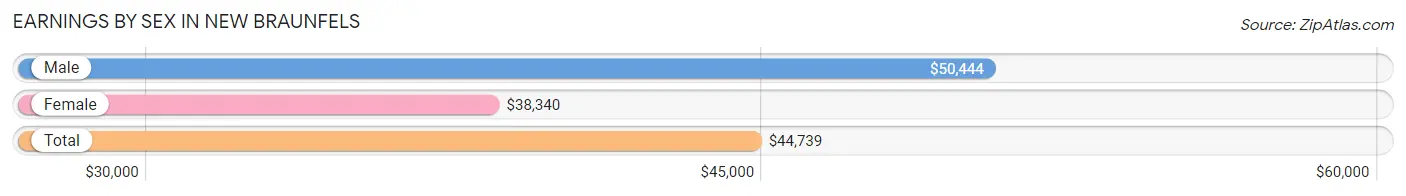
Earnings by Sex in New Braunfels
Average Earnings in New Braunfels are $44,739, $50,444 for men and $38,340 for women, a difference of 24.0%.
| Sex | Number | Average Earnings |
| Male | 27,925 (54.6%) | $50,444 |
| Female | 23,247 (45.4%) | $38,340 |
| Total | 51,172 (100.0%) | $44,739 |
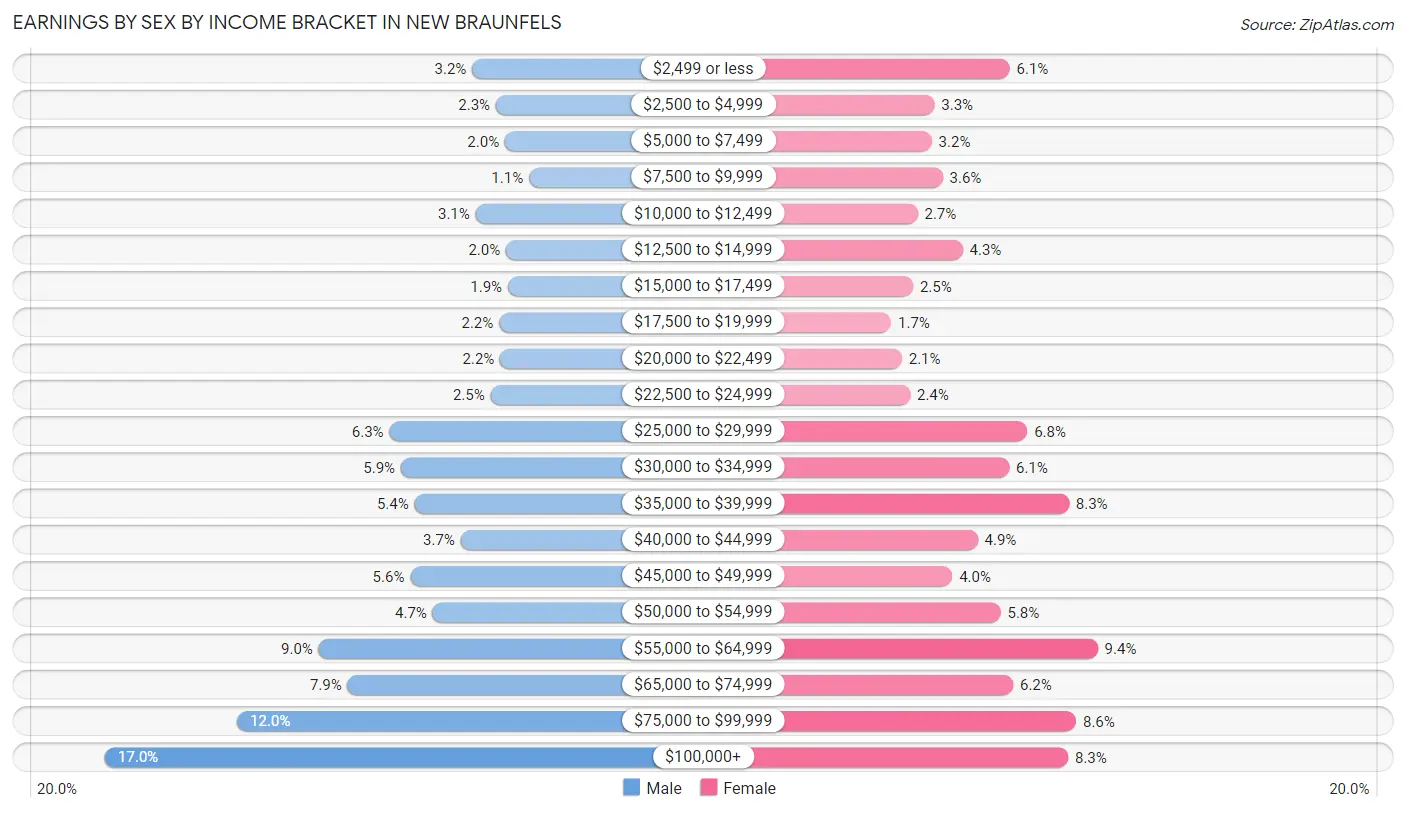
Earnings by Sex by Income Bracket in New Braunfels
The most common earnings brackets in New Braunfels are $100,000+ for men (4,744 | 17.0%) and $55,000 to $64,999 for women (2,185 | 9.4%).
| Income | Male | Female |
| $2,499 or less | 901 (3.2%) | 1,418 (6.1%) |
| $2,500 to $4,999 | 654 (2.3%) | 763 (3.3%) |
| $5,000 to $7,499 | 559 (2.0%) | 739 (3.2%) |
| $7,500 to $9,999 | 307 (1.1%) | 835 (3.6%) |
| $10,000 to $12,499 | 866 (3.1%) | 617 (2.6%) |
| $12,500 to $14,999 | 546 (2.0%) | 1,008 (4.3%) |
| $15,000 to $17,499 | 527 (1.9%) | 576 (2.5%) |
| $17,500 to $19,999 | 619 (2.2%) | 386 (1.7%) |
| $20,000 to $22,499 | 609 (2.2%) | 480 (2.1%) |
| $22,500 to $24,999 | 710 (2.5%) | 550 (2.4%) |
| $25,000 to $29,999 | 1,769 (6.3%) | 1,571 (6.8%) |
| $30,000 to $34,999 | 1,647 (5.9%) | 1,414 (6.1%) |
| $35,000 to $39,999 | 1,506 (5.4%) | 1,934 (8.3%) |
| $40,000 to $44,999 | 1,022 (3.7%) | 1,140 (4.9%) |
| $45,000 to $49,999 | 1,549 (5.6%) | 918 (4.0%) |
| $50,000 to $54,999 | 1,314 (4.7%) | 1,340 (5.8%) |
| $55,000 to $64,999 | 2,507 (9.0%) | 2,185 (9.4%) |
| $65,000 to $74,999 | 2,207 (7.9%) | 1,449 (6.2%) |
| $75,000 to $99,999 | 3,362 (12.0%) | 1,997 (8.6%) |
| $100,000+ | 4,744 (17.0%) | 1,927 (8.3%) |
| Total | 27,925 (100.0%) | 23,247 (100.0%) |
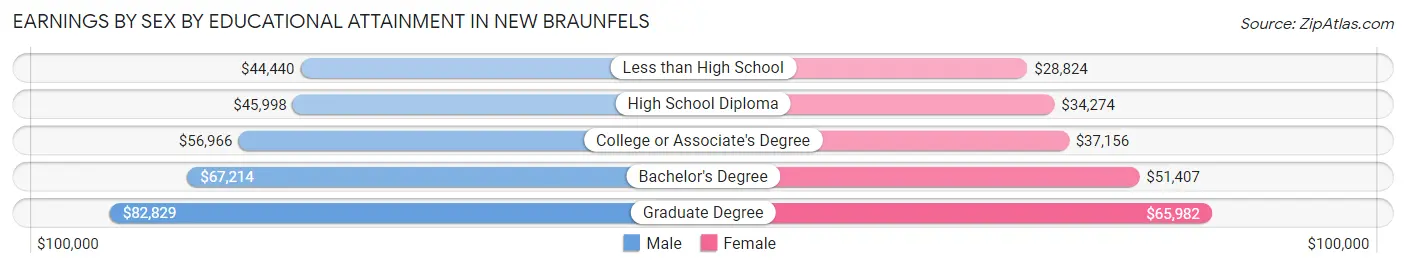
Earnings by Sex by Educational Attainment in New Braunfels
Average earnings in New Braunfels are $57,635 for men and $41,865 for women, a difference of 27.4%. Men with an educational attainment of graduate degree enjoy the highest average annual earnings of $82,829, while those with less than high school education earn the least with $44,440. Women with an educational attainment of graduate degree earn the most with the average annual earnings of $65,982, while those with less than high school education have the smallest earnings of $28,824.
| Educational Attainment | Male Income | Female Income |
| Less than High School | $44,440 | $28,824 |
| High School Diploma | $45,998 | $34,274 |
| College or Associate's Degree | $56,966 | $37,156 |
| Bachelor's Degree | $67,214 | $51,407 |
| Graduate Degree | $82,829 | $65,982 |
| Total | $57,635 | $41,865 |
Family Income in New Braunfels
Family Income Brackets in New Braunfels
According to the New Braunfels family income data, there are 5,755 families falling into the $100,000 to $149,999 income range, which is the most common income bracket and makes up 23.8% of all families. Conversely, the $10,000 to $14,999 income bracket is the least frequent group with only 242 families (1.0%) belonging to this category.
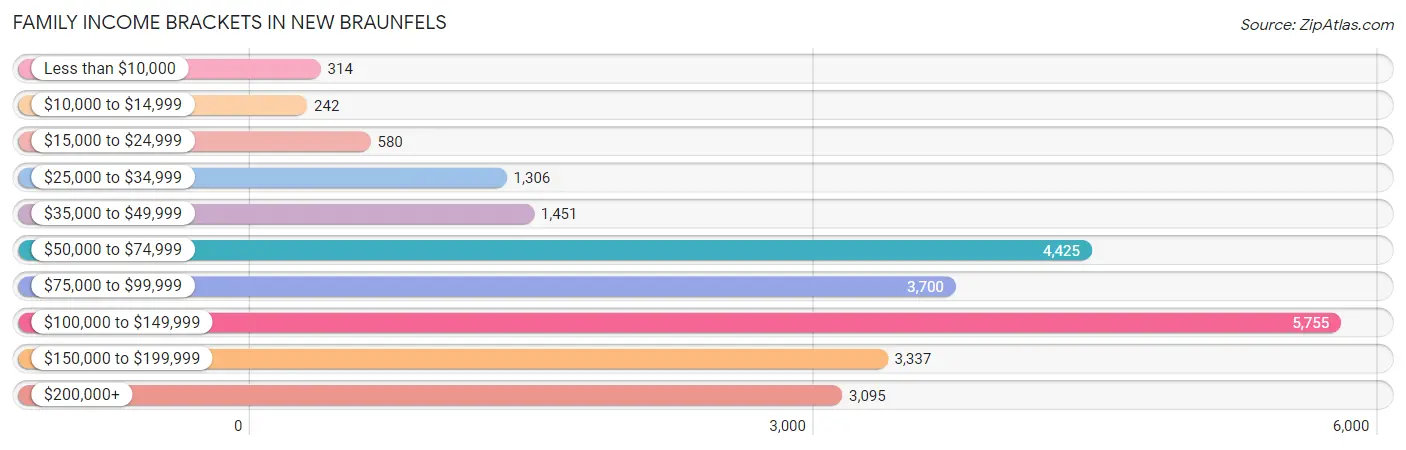
| Income Bracket | # Families | % Families |
| Less than $10,000 | 314 | 1.3% |
| $10,000 to $14,999 | 242 | 1.0% |
| $15,000 to $24,999 | 580 | 2.4% |
| $25,000 to $34,999 | 1,306 | 5.4% |
| $35,000 to $49,999 | 1,451 | 6.0% |
| $50,000 to $74,999 | 4,425 | 18.3% |
| $75,000 to $99,999 | 3,700 | 15.3% |
| $100,000 to $149,999 | 5,755 | 23.8% |
| $150,000 to $199,999 | 3,337 | 13.8% |
| $200,000+ | 3,095 | 12.8% |
Family Income by Famaliy Size in New Braunfels
7+ person families (416 | 1.7%) account for the highest median family income in New Braunfels with $164,539 per family, while 2-person families (10,114 | 41.8%) have the highest median income of $46,298 per family member.
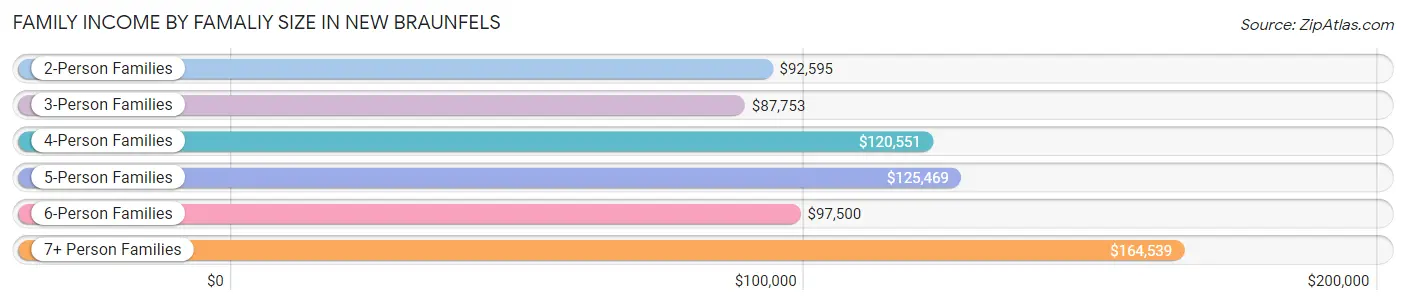
| Income Bracket | # Families | Median Income |
| 2-Person Families | 10,114 (41.8%) | $92,595 |
| 3-Person Families | 6,299 (26.1%) | $87,753 |
| 4-Person Families | 4,797 (19.8%) | $120,551 |
| 5-Person Families | 1,854 (7.7%) | $125,469 |
| 6-Person Families | 702 (2.9%) | $97,500 |
| 7+ Person Families | 416 (1.7%) | $164,539 |
| Total | 24,182 (100.0%) | $100,761 |
Family Income by Number of Earners in New Braunfels
The median family income in New Braunfels is $100,761, with families comprising 3+ earners (2,889) having the highest median family income of $153,815, while families with no earners (2,731) have the lowest median family income of $67,405, accounting for 11.9% and 11.3% of families, respectively.
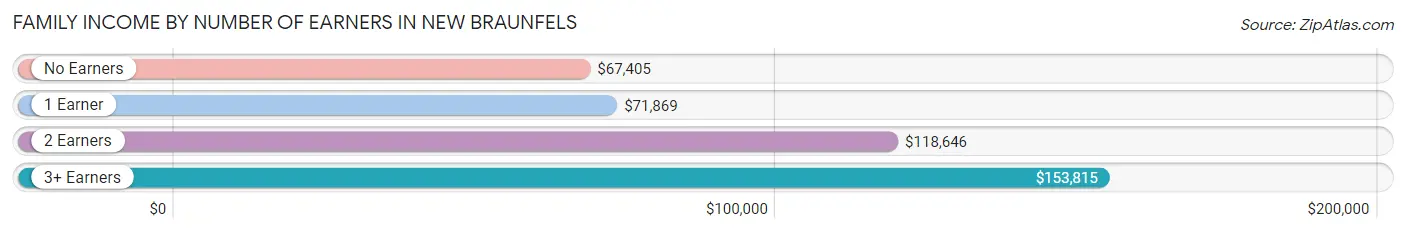
| Number of Earners | # Families | Median Income |
| No Earners | 2,731 (11.3%) | $67,405 |
| 1 Earner | 8,128 (33.6%) | $71,869 |
| 2 Earners | 10,434 (43.1%) | $118,646 |
| 3+ Earners | 2,889 (11.9%) | $153,815 |
| Total | 24,182 (100.0%) | $100,761 |
Household Income in New Braunfels
Household Income Brackets in New Braunfels
With 7,682 households falling in the category, the $100,000 to $149,999 income range is the most frequent in New Braunfels, accounting for 21.3% of all households. In contrast, only 866 households (2.4%) fall into the $10,000 to $14,999 income bracket, making it the least populous group.
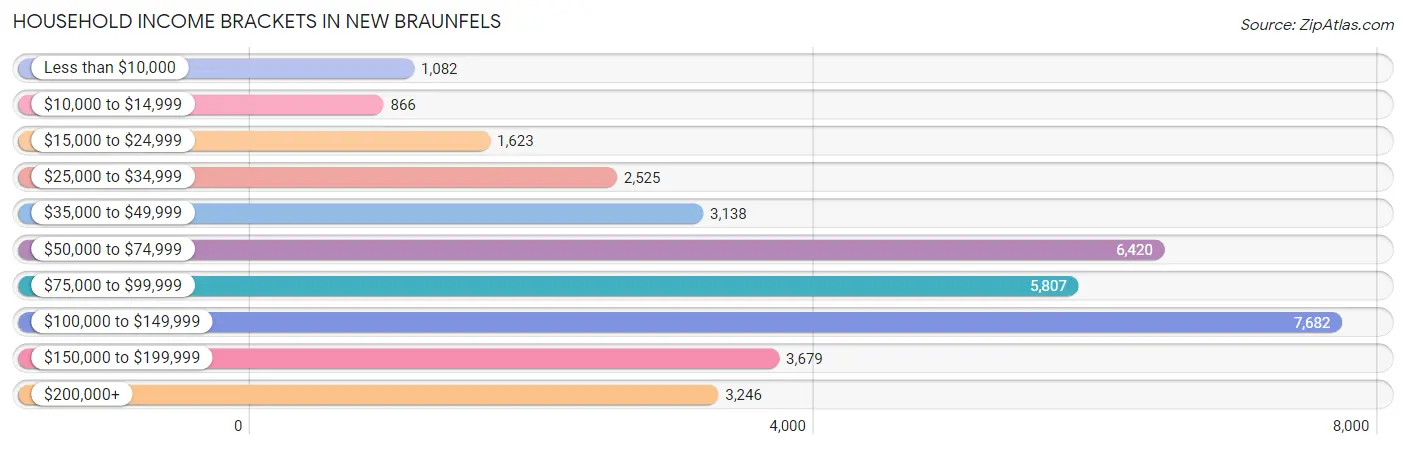
| Income Bracket | # Households | % Households |
| Less than $10,000 | 1,082 | 3.0% |
| $10,000 to $14,999 | 866 | 2.4% |
| $15,000 to $24,999 | 1,623 | 4.5% |
| $25,000 to $34,999 | 2,525 | 7.0% |
| $35,000 to $49,999 | 3,138 | 8.7% |
| $50,000 to $74,999 | 6,420 | 17.8% |
| $75,000 to $99,999 | 5,807 | 16.1% |
| $100,000 to $149,999 | 7,682 | 21.3% |
| $150,000 to $199,999 | 3,679 | 10.2% |
| $200,000+ | 3,246 | 9.0% |
Household Income by Householder Age in New Braunfels
The median household income in New Braunfels is $85,827, with the highest median household income of $98,338 found in the 45 to 64 years age bracket for the primary householder. A total of 12,984 households (36.0%) fall into this category. Meanwhile, the 15 to 24 years age bracket for the primary householder has the lowest median household income of $49,645, with 1,895 households (5.2%) in this group.
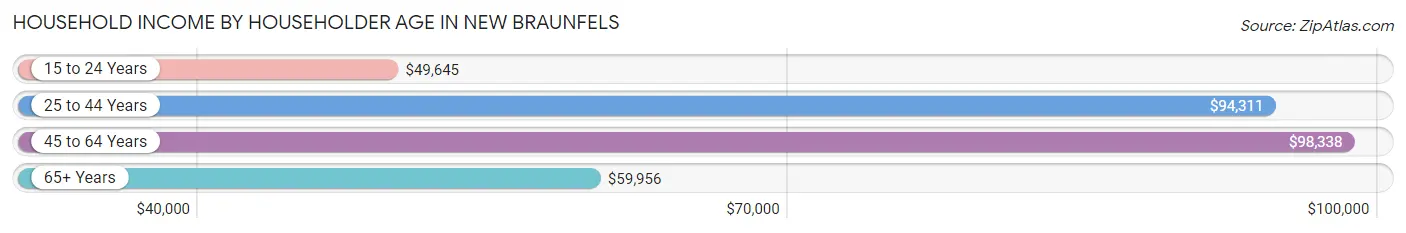
| Income Bracket | # Households | Median Income |
| 15 to 24 Years | 1,895 (5.2%) | $49,645 |
| 25 to 44 Years | 13,406 (37.2%) | $94,311 |
| 45 to 64 Years | 12,984 (36.0%) | $98,338 |
| 65+ Years | 7,783 (21.6%) | $59,956 |
| Total | 36,068 (100.0%) | $85,827 |
Poverty in New Braunfels
Income Below Poverty by Sex and Age in New Braunfels
With 5.4% poverty level for males and 6.7% for females among the residents of New Braunfels, 75 year old and over males and 18 to 24 year old females are the most vulnerable to poverty, with 178 males (9.3%) and 541 females (12.2%) in their respective age groups living below the poverty level.
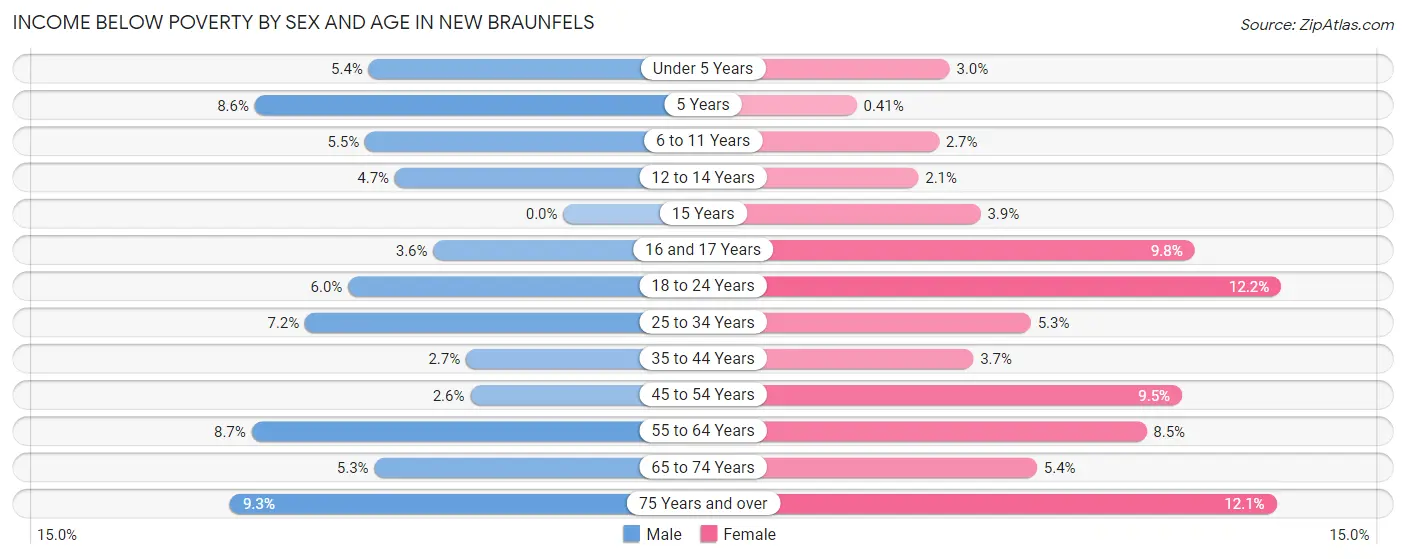
| Age Bracket | Male | Female |
| Under 5 Years | 178 (5.4%) | 79 (3.0%) |
| 5 Years | 50 (8.6%) | 2 (0.4%) |
| 6 to 11 Years | 234 (5.5%) | 110 (2.7%) |
| 12 to 14 Years | 91 (4.7%) | 28 (2.1%) |
| 15 Years | 0 (0.0%) | 22 (3.9%) |
| 16 and 17 Years | 49 (3.6%) | 113 (9.8%) |
| 18 to 24 Years | 251 (6.0%) | 541 (12.2%) |
| 25 to 34 Years | 537 (7.2%) | 362 (5.3%) |
| 35 to 44 Years | 184 (2.7%) | 230 (3.7%) |
| 45 to 54 Years | 151 (2.6%) | 555 (9.5%) |
| 55 to 64 Years | 417 (8.7%) | 413 (8.5%) |
| 65 to 74 Years | 177 (5.3%) | 215 (5.4%) |
| 75 Years and over | 178 (9.3%) | 389 (12.1%) |
| Total | 2,497 (5.4%) | 3,059 (6.7%) |
Income Above Poverty by Sex and Age in New Braunfels
According to the poverty statistics in New Braunfels, males aged 15 years and females aged 5 years are the age groups that are most secure financially, with 100.0% of males and 99.6% of females in these age groups living above the poverty line.
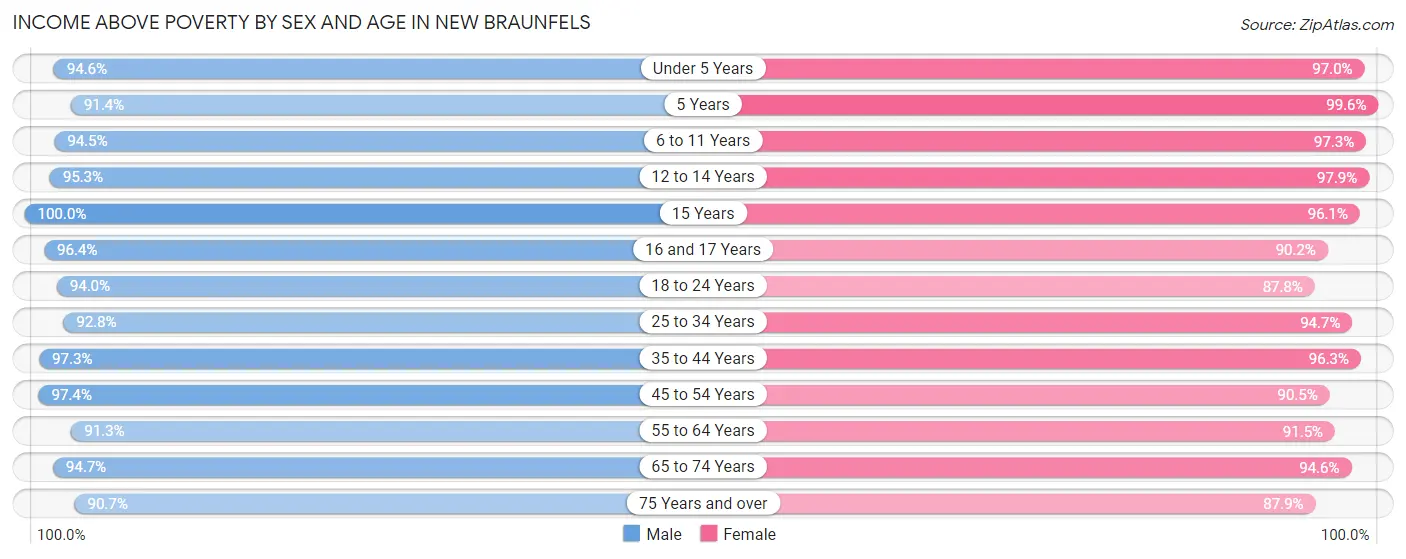
| Age Bracket | Male | Female |
| Under 5 Years | 3,105 (94.6%) | 2,556 (97.0%) |
| 5 Years | 532 (91.4%) | 488 (99.6%) |
| 6 to 11 Years | 4,004 (94.5%) | 3,960 (97.3%) |
| 12 to 14 Years | 1,848 (95.3%) | 1,285 (97.9%) |
| 15 Years | 594 (100.0%) | 548 (96.1%) |
| 16 and 17 Years | 1,303 (96.4%) | 1,038 (90.2%) |
| 18 to 24 Years | 3,940 (94.0%) | 3,882 (87.8%) |
| 25 to 34 Years | 6,932 (92.8%) | 6,521 (94.7%) |
| 35 to 44 Years | 6,610 (97.3%) | 6,056 (96.3%) |
| 45 to 54 Years | 5,673 (97.4%) | 5,307 (90.5%) |
| 55 to 64 Years | 4,385 (91.3%) | 4,458 (91.5%) |
| 65 to 74 Years | 3,190 (94.7%) | 3,745 (94.6%) |
| 75 Years and over | 1,740 (90.7%) | 2,827 (87.9%) |
| Total | 43,856 (94.6%) | 42,671 (93.3%) |
Income Below Poverty Among Married-Couple Families in New Braunfels
The poverty statistics for married-couple families in New Braunfels show that 3.1% or 578 of the total 18,867 families live below the poverty line. Families with 1 or 2 children have the highest poverty rate of 3.5%, comprising of 250 families. On the other hand, families with 5 or more children have the lowest poverty rate of 0.0%, which includes 0 families.
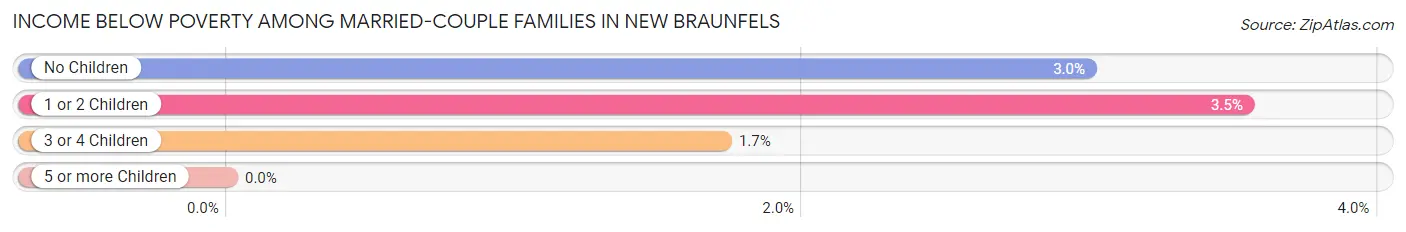
| Children | Above Poverty | Below Poverty |
| No Children | 9,596 (97.0%) | 296 (3.0%) |
| 1 or 2 Children | 6,814 (96.5%) | 250 (3.5%) |
| 3 or 4 Children | 1,830 (98.3%) | 32 (1.7%) |
| 5 or more Children | 49 (100.0%) | 0 (0.0%) |
| Total | 18,289 (96.9%) | 578 (3.1%) |
Income Below Poverty Among Single-Parent Households in New Braunfels
According to the poverty data in New Braunfels, 7.5% or 156 single-father households and 8.3% or 267 single-mother households are living below the poverty line. Among single-father households, those with 1 or 2 children have the highest poverty rate, with 111 households (9.0%) experiencing poverty. Likewise, among single-mother households, those with 3 or 4 children have the highest poverty rate, with 51 households (12.3%) falling below the poverty line.
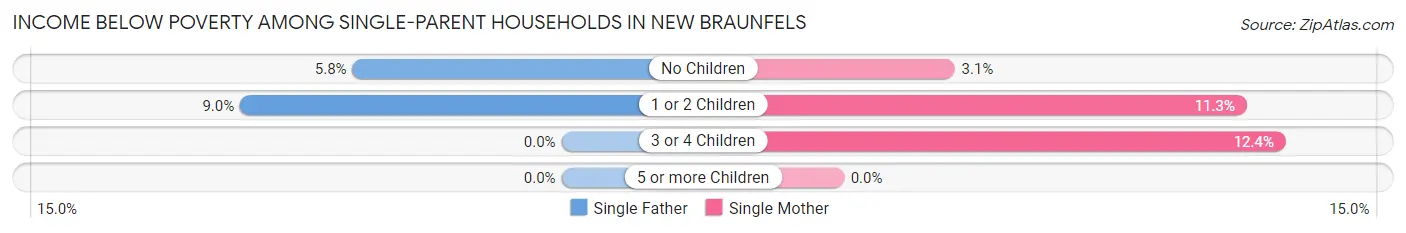
| Children | Single Father | Single Mother |
| No Children | 45 (5.8%) | 37 (3.1%) |
| 1 or 2 Children | 111 (9.0%) | 179 (11.3%) |
| 3 or 4 Children | 0 (0.0%) | 51 (12.3%) |
| 5 or more Children | 0 (0.0%) | 0 (0.0%) |
| Total | 156 (7.5%) | 267 (8.3%) |
Income Below Poverty Among Married-Couple vs Single-Parent Households in New Braunfels
The poverty data for New Braunfels shows that 578 of the married-couple family households (3.1%) and 423 of the single-parent households (8.0%) are living below the poverty level. Within the married-couple family households, those with 1 or 2 children have the highest poverty rate, with 250 households (3.5%) falling below the poverty line. Among the single-parent households, those with 3 or 4 children have the highest poverty rate, with 51 household (10.5%) living below poverty.
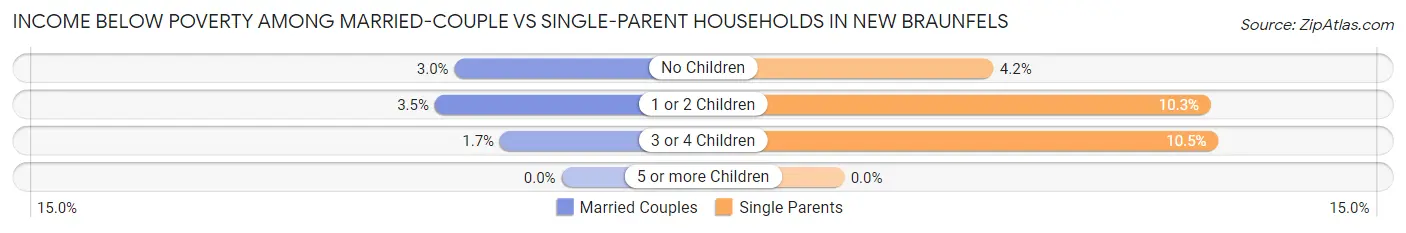
| Children | Married-Couple Families | Single-Parent Households |
| No Children | 296 (3.0%) | 82 (4.2%) |
| 1 or 2 Children | 250 (3.5%) | 290 (10.3%) |
| 3 or 4 Children | 32 (1.7%) | 51 (10.5%) |
| 5 or more Children | 0 (0.0%) | 0 (0.0%) |
| Total | 578 (3.1%) | 423 (8.0%) |
Race in New Braunfels
The most populous races in New Braunfels are White / Caucasian (72,588 | 78.1%), Hispanic or Latino (34,036 | 36.6%), and Two or more Races (13,045 | 14.0%).
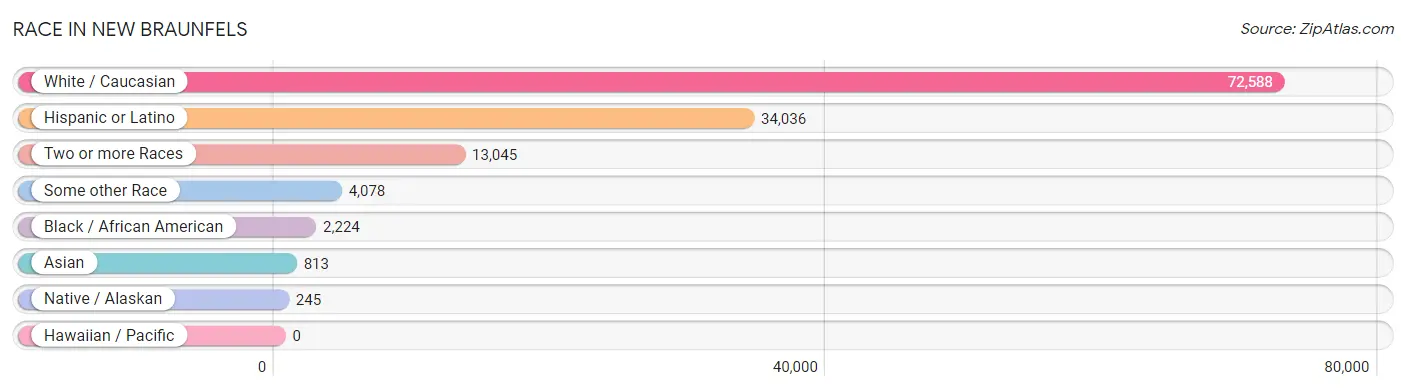
| Race | # Population | % Population |
| Asian | 813 | 0.9% |
| Black / African American | 2,224 | 2.4% |
| Hawaiian / Pacific | 0 | 0.0% |
| Hispanic or Latino | 34,036 | 36.6% |
| Native / Alaskan | 245 | 0.3% |
| White / Caucasian | 72,588 | 78.1% |
| Two or more Races | 13,045 | 14.0% |
| Some other Race | 4,078 | 4.4% |
| Total | 92,993 | 100.0% |
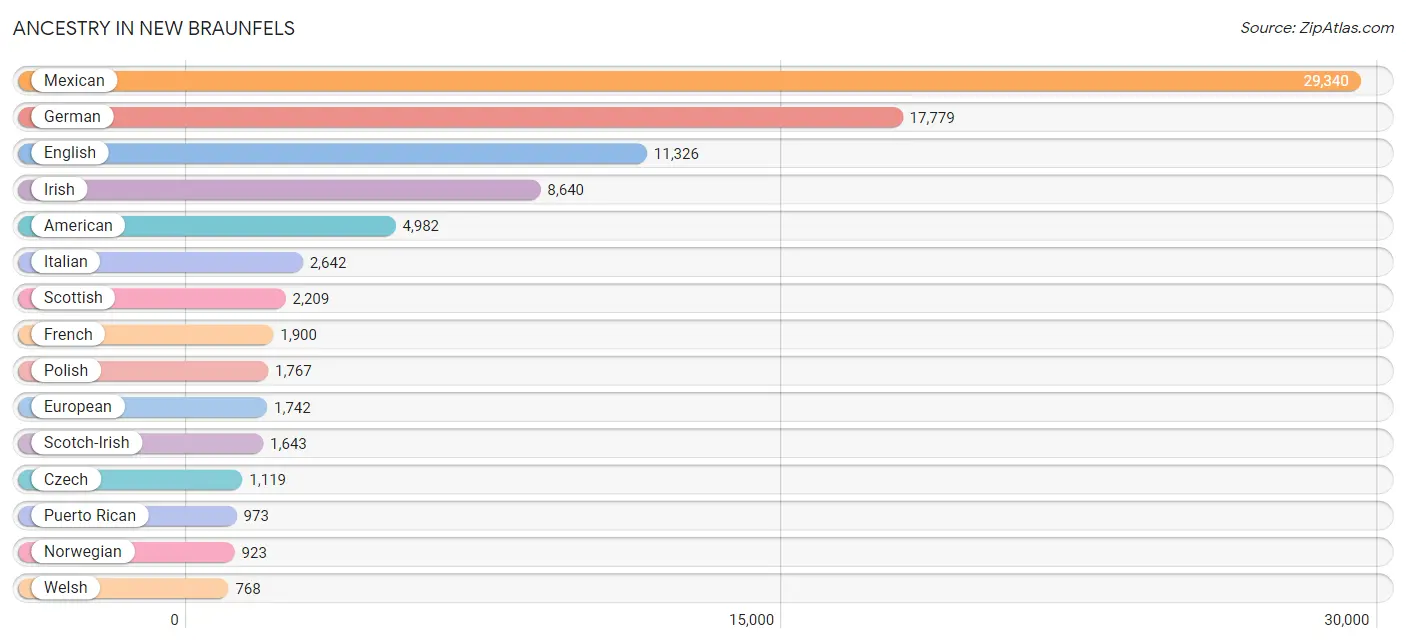
Ancestry in New Braunfels
The most populous ancestries reported in New Braunfels are Mexican (29,340 | 31.6%), German (17,779 | 19.1%), English (11,326 | 12.2%), Irish (8,640 | 9.3%), and American (4,982 | 5.4%), together accounting for 77.5% of all New Braunfels residents.
| Ancestry | # Population | % Population |
| African | 85 | 0.1% |
| American | 4,982 | 5.4% |
| Apache | 36 | 0.0% |
| Arab | 143 | 0.2% |
| Armenian | 19 | 0.0% |
| Australian | 34 | 0.0% |
| Austrian | 117 | 0.1% |
| Bangladeshi | 35 | 0.0% |
| Basque | 50 | 0.1% |
| Belgian | 58 | 0.1% |
| Bhutanese | 334 | 0.4% |
| Brazilian | 173 | 0.2% |
| British | 702 | 0.7% |
| Burmese | 143 | 0.2% |
| Canadian | 82 | 0.1% |
| Celtic | 70 | 0.1% |
| Central American | 546 | 0.6% |
| Central American Indian | 52 | 0.1% |
| Cherokee | 215 | 0.2% |
| Chickasaw | 37 | 0.0% |
| Chilean | 79 | 0.1% |
| Choctaw | 41 | 0.0% |
| Colombian | 38 | 0.0% |
| Comanche | 44 | 0.1% |
| Costa Rican | 45 | 0.1% |
| Cuban | 244 | 0.3% |
| Czech | 1,119 | 1.2% |
| Czechoslovakian | 83 | 0.1% |
| Danish | 251 | 0.3% |
| Dominican | 22 | 0.0% |
| Dutch | 749 | 0.8% |
| Eastern European | 137 | 0.2% |
| English | 11,326 | 12.2% |
| European | 1,742 | 1.9% |
| Filipino | 27 | 0.0% |
| Finnish | 52 | 0.1% |
| French | 1,900 | 2.0% |
| French Canadian | 329 | 0.4% |
| German | 17,779 | 19.1% |
| Greek | 228 | 0.3% |
| Guamanian / Chamorro | 32 | 0.0% |
| Guatemalan | 75 | 0.1% |
| Honduran | 79 | 0.1% |
| Hopi | 44 | 0.1% |
| Hungarian | 155 | 0.2% |
| Indian (Asian) | 179 | 0.2% |
| Iranian | 27 | 0.0% |
| Irish | 8,640 | 9.3% |
| Italian | 2,642 | 2.8% |
| Japanese | 9 | 0.0% |
| Jordanian | 76 | 0.1% |
| Korean | 567 | 0.6% |
| Lebanese | 64 | 0.1% |
| Lithuanian | 42 | 0.1% |
| Macedonian | 15 | 0.0% |
| Malaysian | 18 | 0.0% |
| Mexican | 29,340 | 31.6% |
| Mexican American Indian | 274 | 0.3% |
| Native Hawaiian | 208 | 0.2% |
| Navajo | 83 | 0.1% |
| Nicaraguan | 68 | 0.1% |
| Nigerian | 28 | 0.0% |
| Northern European | 47 | 0.1% |
| Norwegian | 923 | 1.0% |
| Pakistani | 29 | 0.0% |
| Panamanian | 134 | 0.1% |
| Pennsylvania German | 64 | 0.1% |
| Peruvian | 211 | 0.2% |
| Polish | 1,767 | 1.9% |
| Portuguese | 215 | 0.2% |
| Puerto Rican | 973 | 1.1% |
| Romanian | 29 | 0.0% |
| Russian | 267 | 0.3% |
| Salvadoran | 145 | 0.2% |
| Scandinavian | 355 | 0.4% |
| Scotch-Irish | 1,643 | 1.8% |
| Scottish | 2,209 | 2.4% |
| Sioux | 15 | 0.0% |
| Slavic | 25 | 0.0% |
| Slovak | 75 | 0.1% |
| Slovene | 25 | 0.0% |
| South American | 416 | 0.4% |
| Spaniard | 585 | 0.6% |
| Spanish | 548 | 0.6% |
| Spanish American Indian | 18 | 0.0% |
| Sri Lankan | 28 | 0.0% |
| Subsaharan African | 113 | 0.1% |
| Swedish | 701 | 0.7% |
| Swiss | 163 | 0.2% |
| Thai | 128 | 0.1% |
| Tohono O'Odham | 18 | 0.0% |
| Ukrainian | 139 | 0.2% |
| Venezuelan | 88 | 0.1% |
| Welsh | 768 | 0.8% |
| West Indian | 129 | 0.1% |
| Yaqui | 80 | 0.1% | View All 96 Rows |
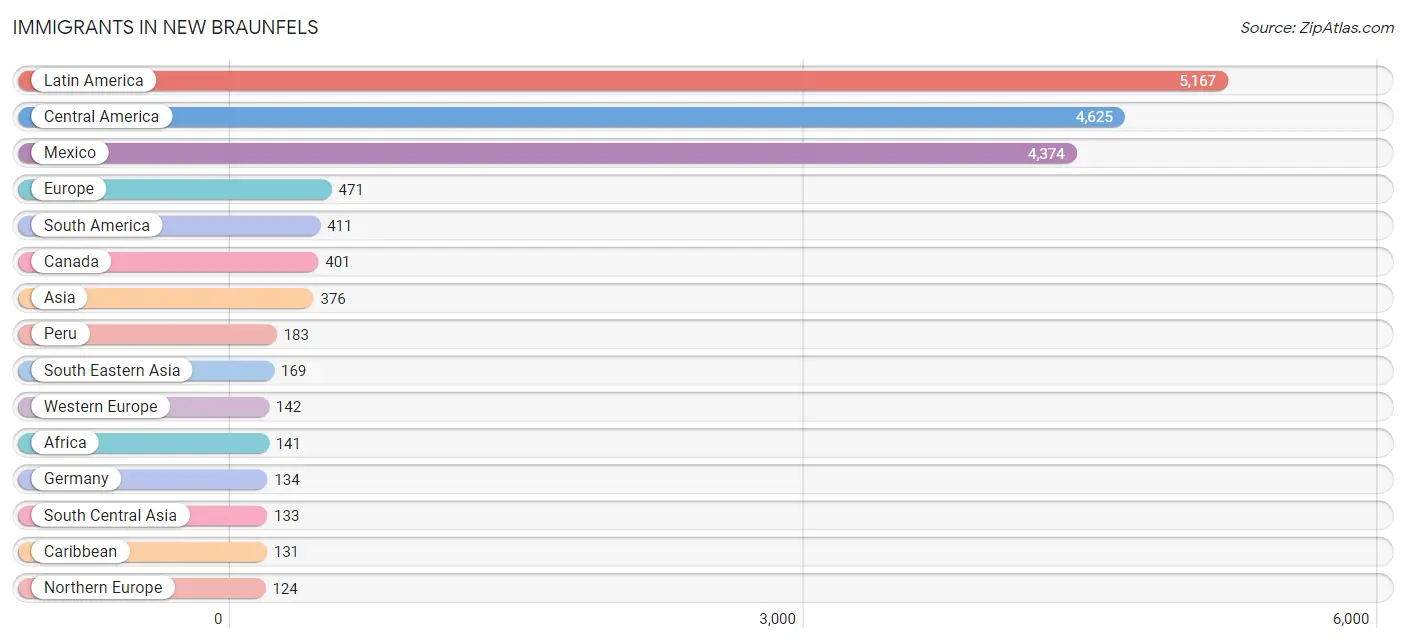
Immigrants in New Braunfels
The most numerous immigrant groups reported in New Braunfels came from Latin America (5,167 | 5.6%), Central America (4,625 | 5.0%), Mexico (4,374 | 4.7%), Europe (471 | 0.5%), and South America (411 | 0.4%), together accounting for 16.2% of all New Braunfels residents.
| Immigration Origin | # Population | % Population |
| Africa | 141 | 0.2% |
| Asia | 376 | 0.4% |
| Australia | 34 | 0.0% |
| Barbados | 20 | 0.0% |
| Belarus | 34 | 0.0% |
| Brazil | 14 | 0.0% |
| Cambodia | 8 | 0.0% |
| Canada | 401 | 0.4% |
| Caribbean | 131 | 0.1% |
| Central America | 4,625 | 5.0% |
| China | 27 | 0.0% |
| Colombia | 15 | 0.0% |
| Cuba | 111 | 0.1% |
| Czechoslovakia | 35 | 0.0% |
| Eastern Africa | 69 | 0.1% |
| Eastern Asia | 74 | 0.1% |
| Eastern Europe | 113 | 0.1% |
| El Salvador | 85 | 0.1% |
| England | 55 | 0.1% |
| Ethiopia | 36 | 0.0% |
| Europe | 471 | 0.5% |
| Germany | 134 | 0.1% |
| Guatemala | 75 | 0.1% |
| Guyana | 30 | 0.0% |
| Honduras | 30 | 0.0% |
| India | 108 | 0.1% |
| Ireland | 27 | 0.0% |
| Japan | 26 | 0.0% |
| Korea | 21 | 0.0% |
| Laos | 38 | 0.0% |
| Latin America | 5,167 | 5.6% |
| Liberia | 28 | 0.0% |
| Mexico | 4,374 | 4.7% |
| Moldova | 9 | 0.0% |
| Netherlands | 8 | 0.0% |
| Northern Africa | 13 | 0.0% |
| Northern Europe | 124 | 0.1% |
| Oceania | 34 | 0.0% |
| Pakistan | 25 | 0.0% |
| Panama | 61 | 0.1% |
| Peru | 183 | 0.2% |
| Philippines | 85 | 0.1% |
| Russia | 23 | 0.0% |
| South Africa | 31 | 0.0% |
| South America | 411 | 0.4% |
| South Central Asia | 133 | 0.1% |
| South Eastern Asia | 169 | 0.2% |
| Southern Europe | 92 | 0.1% |
| Spain | 92 | 0.1% |
| Taiwan | 27 | 0.0% |
| Ukraine | 12 | 0.0% |
| Venezuela | 88 | 0.1% |
| Vietnam | 38 | 0.0% |
| Western Africa | 28 | 0.0% |
| Western Europe | 142 | 0.2% |
| Zimbabwe | 33 | 0.0% | View All 56 Rows |
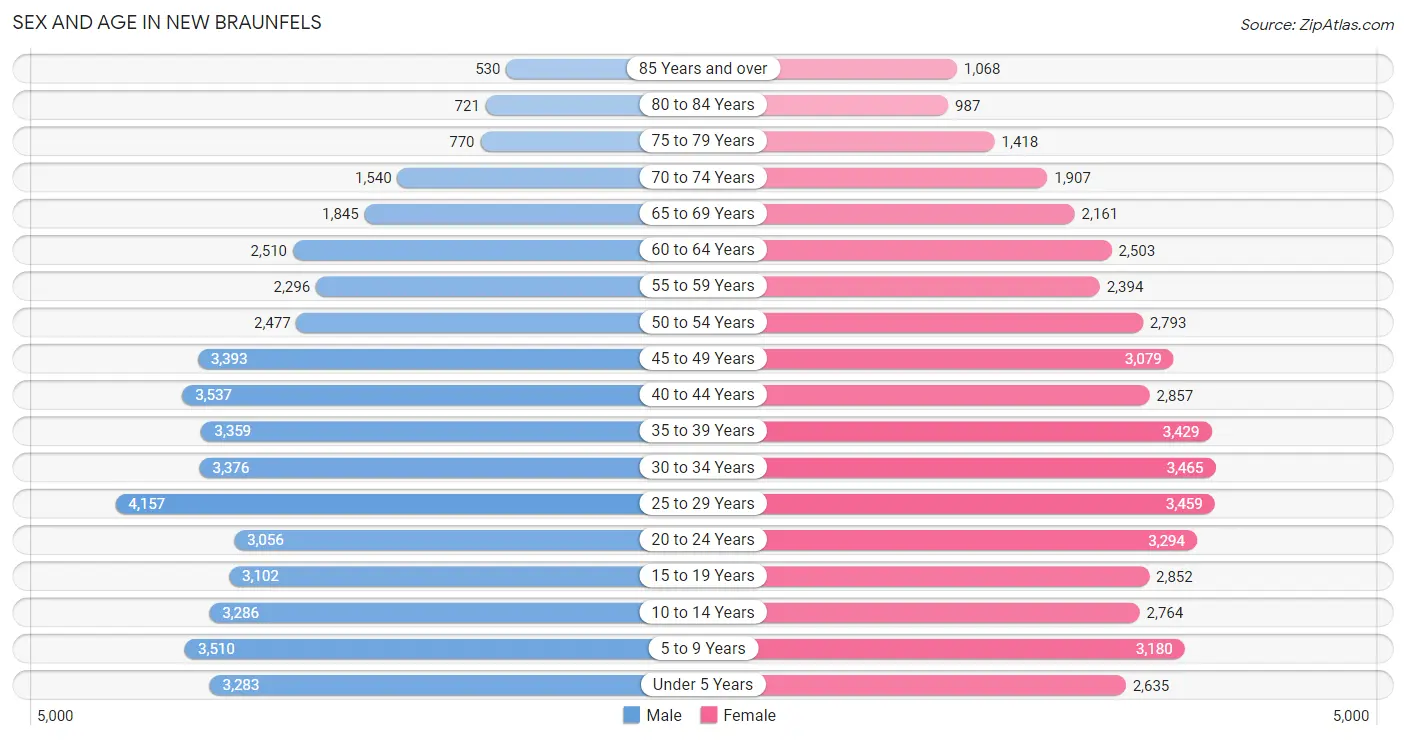
Sex and Age in New Braunfels
Sex and Age in New Braunfels
The most populous age groups in New Braunfels are 25 to 29 Years (4,157 | 8.9%) for men and 30 to 34 Years (3,465 | 7.5%) for women.
| Age Bracket | Male | Female |
| Under 5 Years | 3,283 (7.0%) | 2,635 (5.7%) |
| 5 to 9 Years | 3,510 (7.5%) | 3,180 (6.9%) |
| 10 to 14 Years | 3,286 (7.0%) | 2,764 (6.0%) |
| 15 to 19 Years | 3,102 (6.6%) | 2,852 (6.2%) |
| 20 to 24 Years | 3,056 (6.5%) | 3,294 (7.1%) |
| 25 to 29 Years | 4,157 (8.9%) | 3,459 (7.5%) |
| 30 to 34 Years | 3,376 (7.2%) | 3,465 (7.5%) |
| 35 to 39 Years | 3,359 (7.2%) | 3,429 (7.4%) |
| 40 to 44 Years | 3,537 (7.6%) | 2,857 (6.2%) |
| 45 to 49 Years | 3,393 (7.3%) | 3,079 (6.7%) |
| 50 to 54 Years | 2,477 (5.3%) | 2,793 (6.0%) |
| 55 to 59 Years | 2,296 (4.9%) | 2,394 (5.2%) |
| 60 to 64 Years | 2,510 (5.4%) | 2,503 (5.4%) |
| 65 to 69 Years | 1,845 (4.0%) | 2,161 (4.7%) |
| 70 to 74 Years | 1,540 (3.3%) | 1,907 (4.1%) |
| 75 to 79 Years | 770 (1.7%) | 1,418 (3.1%) |
| 80 to 84 Years | 721 (1.5%) | 987 (2.1%) |
| 85 Years and over | 530 (1.1%) | 1,068 (2.3%) |
| Total | 46,748 (100.0%) | 46,245 (100.0%) |
Families and Households in New Braunfels
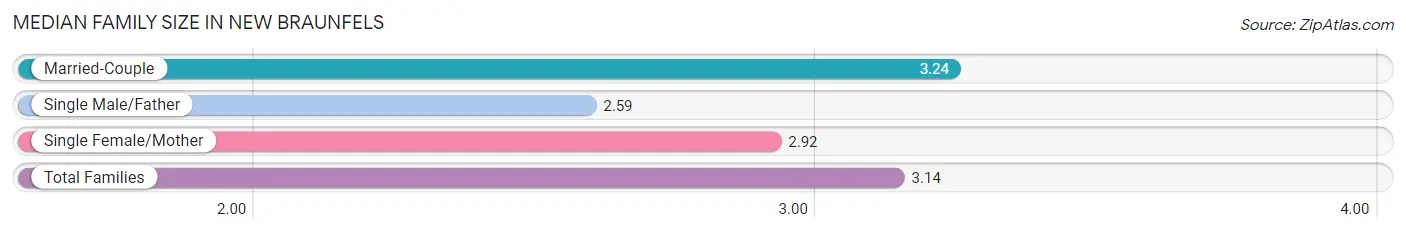
Median Family Size in New Braunfels
The median family size in New Braunfels is 3.14 persons per family, with married-couple families (18,867 | 78.0%) accounting for the largest median family size of 3.24 persons per family. On the other hand, single male/father families (2,081 | 8.6%) represent the smallest median family size with 2.59 persons per family.
| Family Type | # Families | Family Size |
| Married-Couple | 18,867 (78.0%) | 3.24 |
| Single Male/Father | 2,081 (8.6%) | 2.59 |
| Single Female/Mother | 3,234 (13.4%) | 2.92 |
| Total Families | 24,182 (100.0%) | 3.14 |
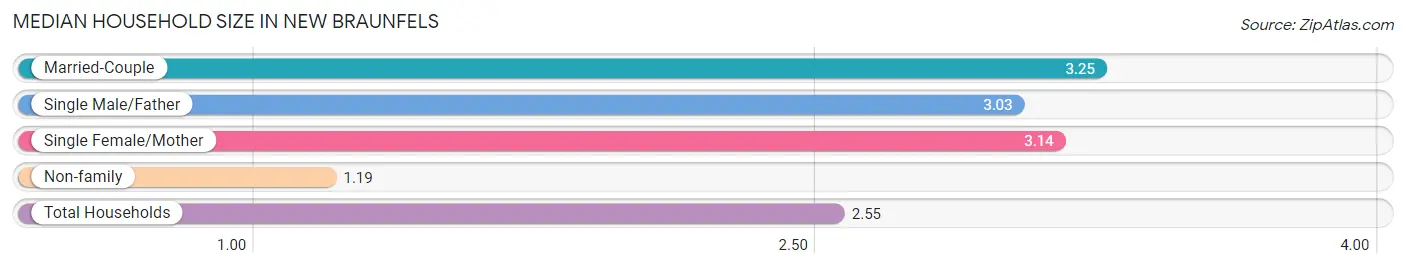
Median Household Size in New Braunfels
The median household size in New Braunfels is 2.55 persons per household, with married-couple households (18,867 | 52.3%) accounting for the largest median household size of 3.25 persons per household. non-family households (11,886 | 33.0%) represent the smallest median household size with 1.19 persons per household.
| Household Type | # Households | Household Size |
| Married-Couple | 18,867 (52.3%) | 3.25 |
| Single Male/Father | 2,081 (5.8%) | 3.03 |
| Single Female/Mother | 3,234 (9.0%) | 3.14 |
| Non-family | 11,886 (33.0%) | 1.19 |
| Total Households | 36,068 (100.0%) | 2.55 |
Household Size by Marriage Status in New Braunfels
Out of a total of 36,068 households in New Braunfels, 24,182 (67.0%) are family households, while 11,886 (33.0%) are nonfamily households. The most numerous type of family households are 2-person households, comprising 9,451, and the most common type of nonfamily households are 1-person households, comprising 9,639.
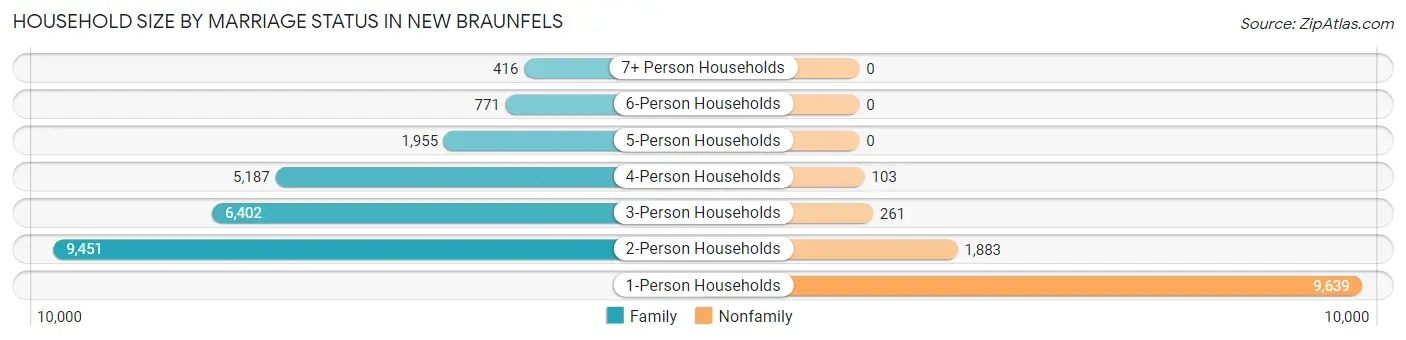
| Household Size | Family Households | Nonfamily Households |
| 1-Person Households | - | 9,639 (26.7%) |
| 2-Person Households | 9,451 (26.2%) | 1,883 (5.2%) |
| 3-Person Households | 6,402 (17.7%) | 261 (0.7%) |
| 4-Person Households | 5,187 (14.4%) | 103 (0.3%) |
| 5-Person Households | 1,955 (5.4%) | 0 (0.0%) |
| 6-Person Households | 771 (2.1%) | 0 (0.0%) |
| 7+ Person Households | 416 (1.1%) | 0 (0.0%) |
| Total | 24,182 (67.0%) | 11,886 (33.0%) |
Female Fertility in New Braunfels
Fertility by Age in New Braunfels
Average fertility rate in New Braunfels is 66.0 births per 1,000 women. Women in the age bracket of 20 to 34 years have the highest fertility rate with 101.0 births per 1,000 women. Women in the age bracket of 20 to 34 years acount for 67.9% of all women with births.
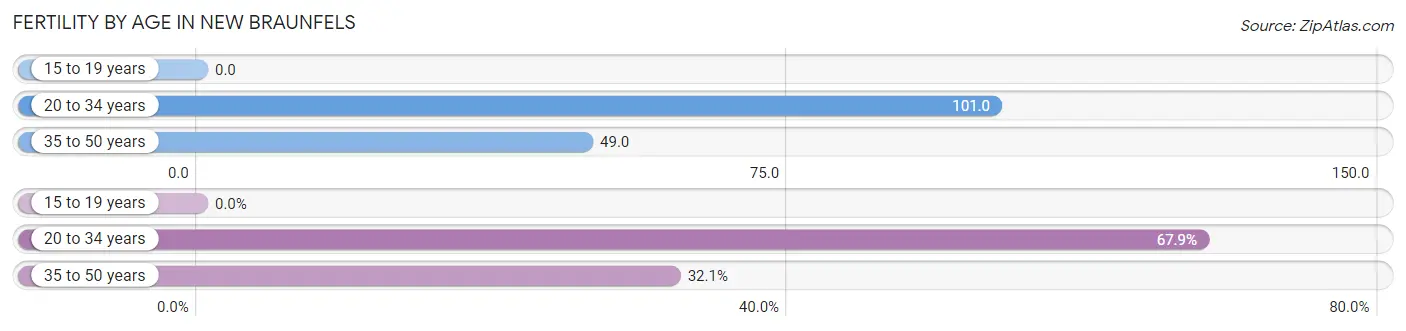
| Age Bracket | Women with Births | Births / 1,000 Women |
| 15 to 19 years | 0 (0.0%) | 0.0 |
| 20 to 34 years | 1,033 (67.9%) | 101.0 |
| 35 to 50 years | 488 (32.1%) | 49.0 |
| Total | 1,521 (100.0%) | 66.0 |
Fertility by Age by Marriage Status in New Braunfels
87.4% of women with births (1,521) in New Braunfels are married. The highest percentage of unmarried women with births falls into 35 to 50 years age bracket with 13.1% of them unmarried at the time of birth, while the lowest percentage of unmarried women with births belong to 20 to 34 years age bracket with 12.3% of them unmarried.
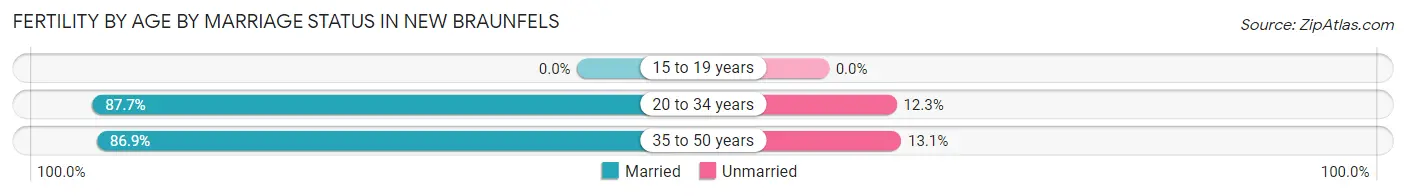
| Age Bracket | Married | Unmarried |
| 15 to 19 years | 0 (0.0%) | 0 (0.0%) |
| 20 to 34 years | 906 (87.7%) | 127 (12.3%) |
| 35 to 50 years | 424 (86.9%) | 64 (13.1%) |
| Total | 1,329 (87.4%) | 192 (12.6%) |
Fertility by Education in New Braunfels
Average fertility rate in New Braunfels is 66.0 births per 1,000 women. Women with the education attainment of bachelor's degree have the highest fertility rate of 114.0 births per 1,000 women, while women with the education attainment of high school diploma have the lowest fertility at 29.0 births per 1,000 women. Women with the education attainment of bachelor's degree represent 47.2% of all women with births.
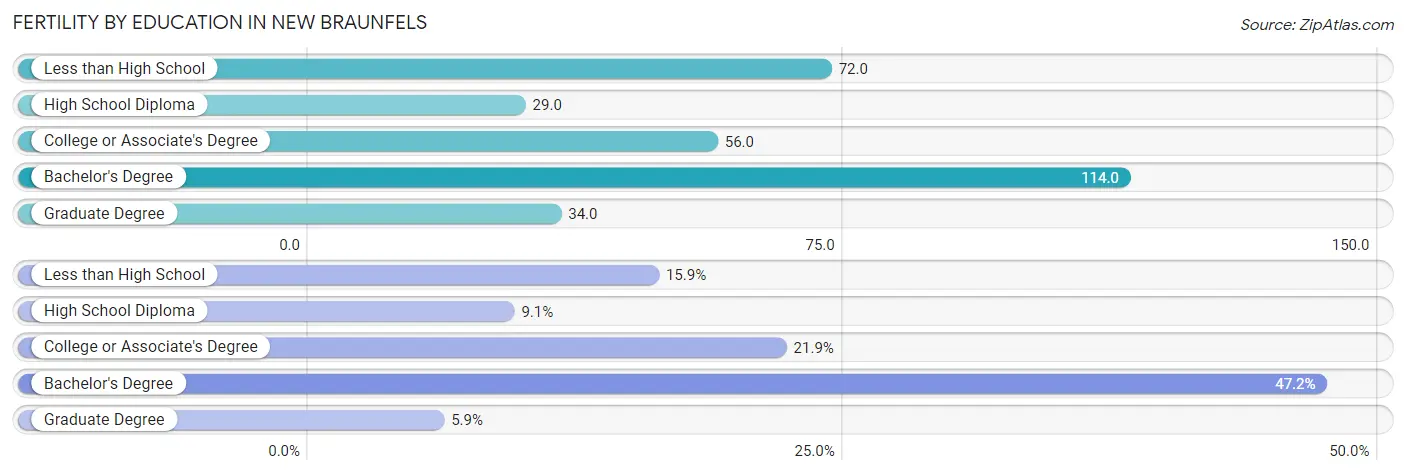
| Educational Attainment | Women with Births | Births / 1,000 Women |
| Less than High School | 242 (15.9%) | 72.0 |
| High School Diploma | 139 (9.1%) | 29.0 |
| College or Associate's Degree | 333 (21.9%) | 56.0 |
| Bachelor's Degree | 718 (47.2%) | 114.0 |
| Graduate Degree | 89 (5.9%) | 34.0 |
| Total | 1,521 (100.0%) | 66.0 |
Fertility by Education by Marriage Status in New Braunfels
12.6% of women with births in New Braunfels are unmarried. Women with the educational attainment of bachelor's degree are most likely to be married with 100.0% of them married at childbirth, while women with the educational attainment of college or associate's degree are least likely to be married with 34.5% of them unmarried at childbirth.
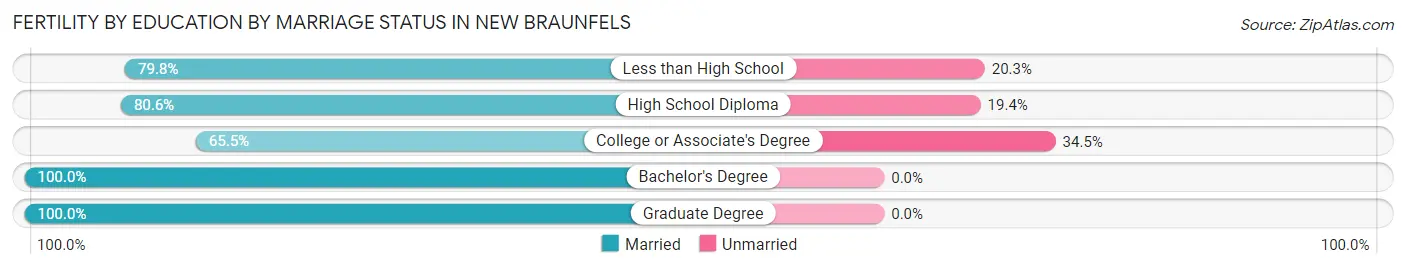
| Educational Attainment | Married | Unmarried |
| Less than High School | 193 (79.7%) | 49 (20.3%) |
| High School Diploma | 112 (80.6%) | 27 (19.4%) |
| College or Associate's Degree | 218 (65.5%) | 115 (34.5%) |
| Bachelor's Degree | 718 (100.0%) | 0 (0.0%) |
| Graduate Degree | 89 (100.0%) | 0 (0.0%) |
| Total | 1,329 (87.4%) | 192 (12.6%) |
Employment Characteristics in New Braunfels
Employment by Class of Employer in New Braunfels
Among the 46,517 employed individuals in New Braunfels, private company employees (31,610 | 67.9%), local government employees (3,957 | 8.5%), and not-for-profit organizations (3,455 | 7.4%) make up the most common classes of employment.
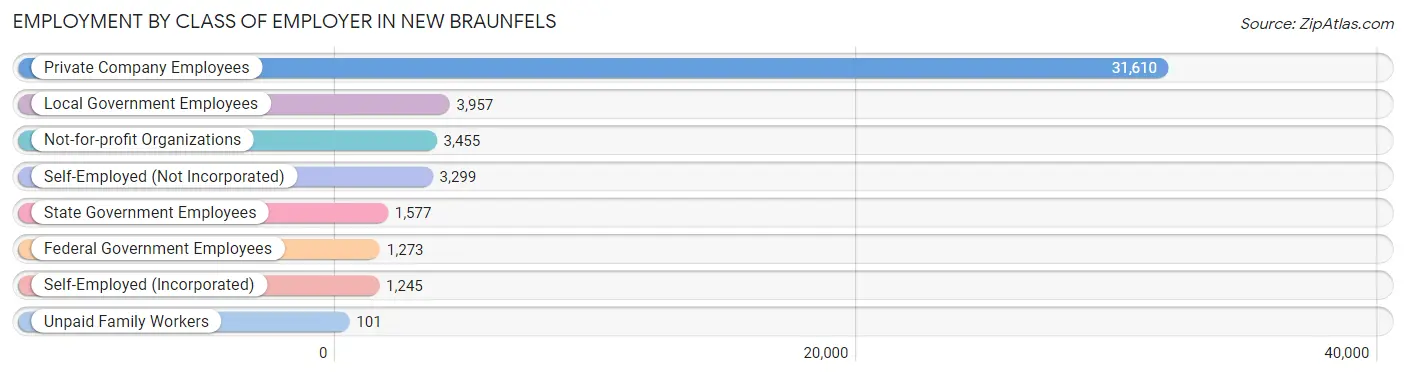
| Employer Class | # Employees | % Employees |
| Private Company Employees | 31,610 | 67.9% |
| Self-Employed (Incorporated) | 1,245 | 2.7% |
| Self-Employed (Not Incorporated) | 3,299 | 7.1% |
| Not-for-profit Organizations | 3,455 | 7.4% |
| Local Government Employees | 3,957 | 8.5% |
| State Government Employees | 1,577 | 3.4% |
| Federal Government Employees | 1,273 | 2.7% |
| Unpaid Family Workers | 101 | 0.2% |
| Total | 46,517 | 100.0% |
Employment Status by Age in New Braunfels
According to the labor force statistics for New Braunfels, out of the total population over 16 years of age (73,170), 66.8% or 48,878 individuals are in the labor force, with 3.8% or 1,857 of them unemployed. The age group with the highest labor force participation rate is 25 to 29 years, with 91.0% or 6,931 individuals in the labor force. Within the labor force, the 16 to 19 years age range has the highest percentage of unemployed individuals, with 13.0% or 238 of them being unemployed.
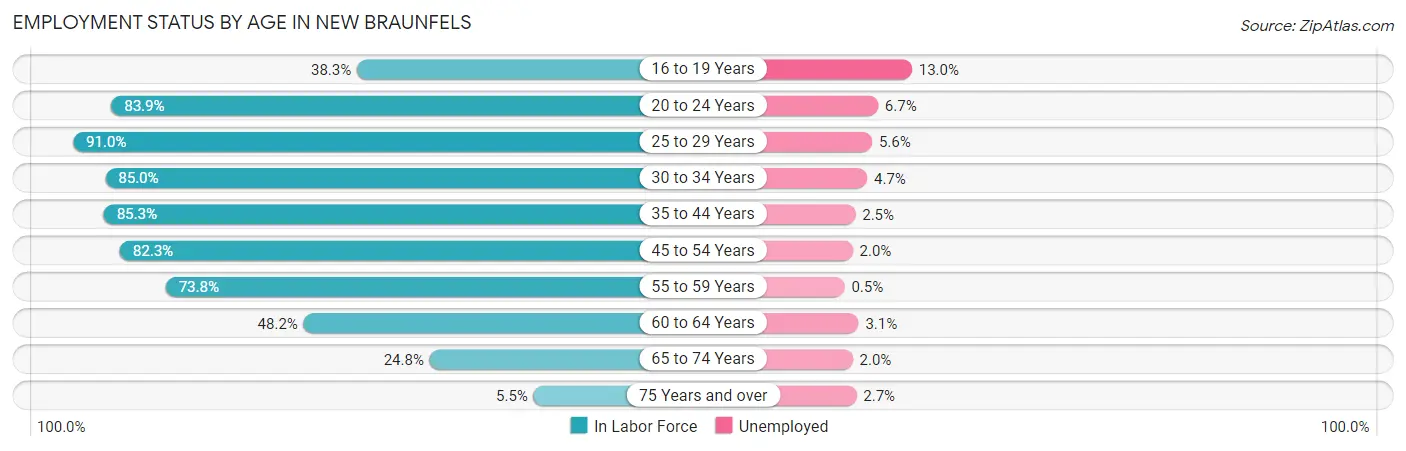
| Age Bracket | In Labor Force | Unemployed |
| 16 to 19 Years | 1,834 (38.3%) | 238 (13.0%) |
| 20 to 24 Years | 5,328 (83.9%) | 357 (6.7%) |
| 25 to 29 Years | 6,931 (91.0%) | 388 (5.6%) |
| 30 to 34 Years | 5,815 (85.0%) | 273 (4.7%) |
| 35 to 44 Years | 11,244 (85.3%) | 281 (2.5%) |
| 45 to 54 Years | 9,664 (82.3%) | 193 (2.0%) |
| 55 to 59 Years | 3,461 (73.8%) | 17 (0.5%) |
| 60 to 64 Years | 2,416 (48.2%) | 75 (3.1%) |
| 65 to 74 Years | 1,848 (24.8%) | 37 (2.0%) |
| 75 Years and over | 302 (5.5%) | 8 (2.7%) |
| Total | 48,878 (66.8%) | 1,857 (3.8%) |
Employment Status by Educational Attainment in New Braunfels
According to labor force statistics for New Braunfels, 80.5% of individuals (39,513) out of the total population between 25 and 64 years of age (49,084) are in the labor force, with 3.1% or 1,225 of them being unemployed. The group with the highest labor force participation rate are those with the educational attainment of bachelor's degree or higher, with 85.4% or 16,669 individuals in the labor force. Within the labor force, individuals with college / associate degree education have the highest percentage of unemployment, with 5.2% or 607 of them being unemployed.
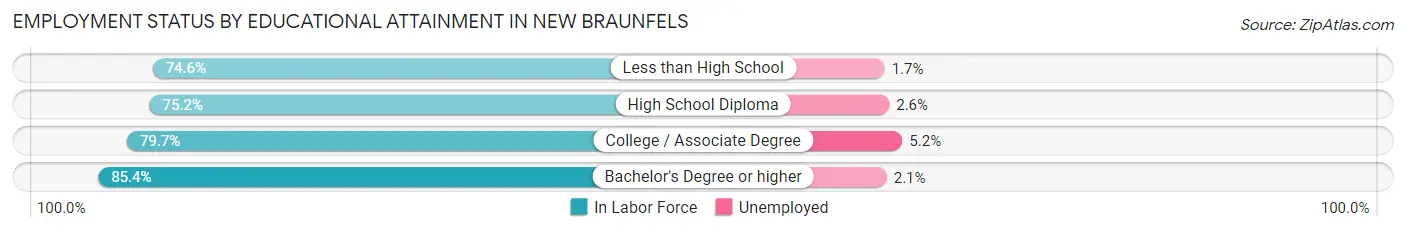
| Educational Attainment | In Labor Force | Unemployed |
| Less than High School | 2,798 (74.6%) | 64 (1.7%) |
| High School Diploma | 8,400 (75.2%) | 290 (2.6%) |
| College / Associate Degree | 11,672 (79.7%) | 762 (5.2%) |
| Bachelor's Degree or higher | 16,669 (85.4%) | 410 (2.1%) |
| Total | 39,513 (80.5%) | 1,522 (3.1%) |
Employment Occupations by Sex in New Braunfels
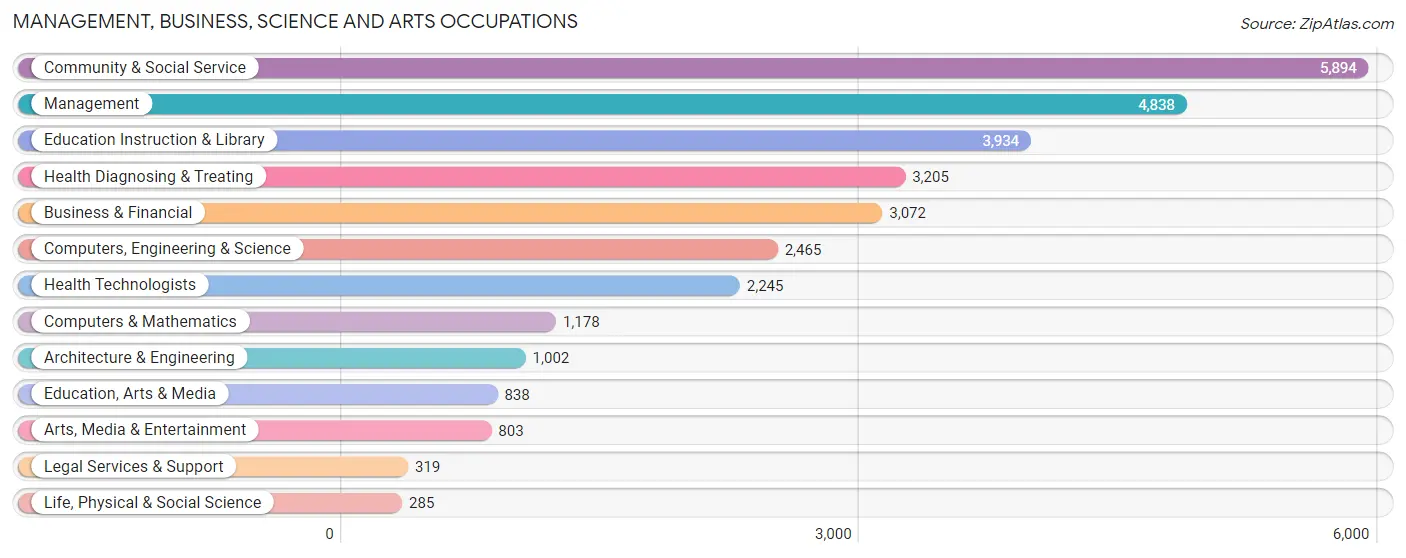
Management, Business, Science and Arts Occupations
The most common Management, Business, Science and Arts occupations in New Braunfels are Community & Social Service (5,894 | 12.6%), Management (4,838 | 10.4%), Education Instruction & Library (3,934 | 8.4%), Health Diagnosing & Treating (3,205 | 6.9%), and Business & Financial (3,072 | 6.6%).
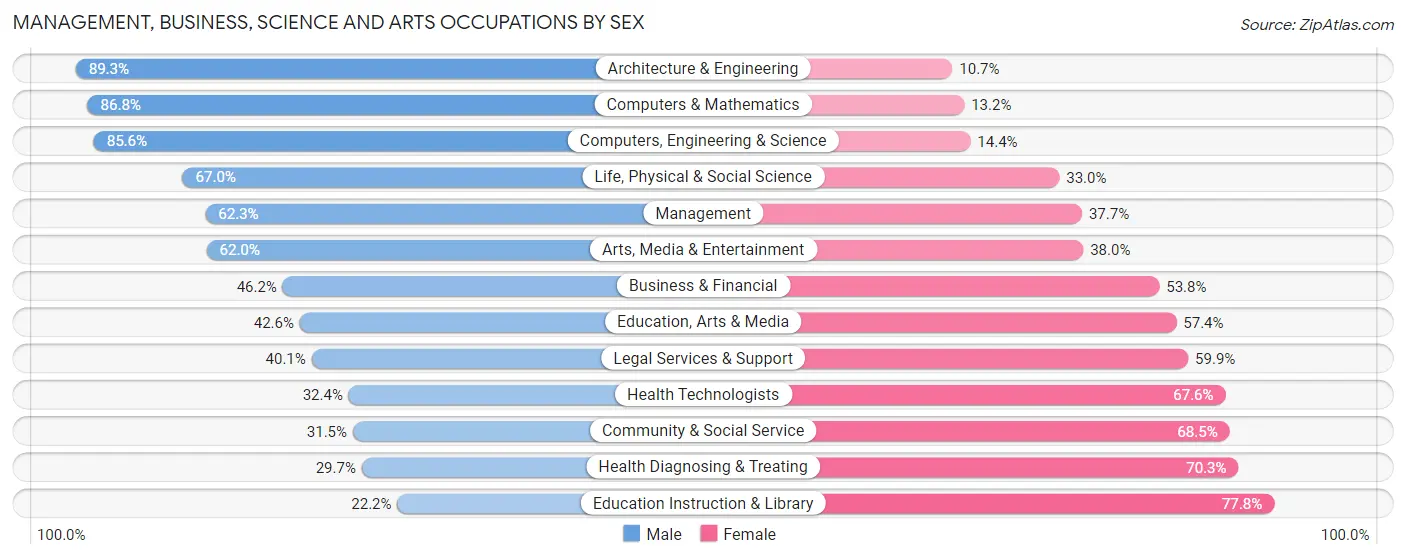
Management, Business, Science and Arts Occupations by Sex
Within the Management, Business, Science and Arts occupations in New Braunfels, the most male-oriented occupations are Architecture & Engineering (89.3%), Computers & Mathematics (86.8%), and Computers, Engineering & Science (85.6%), while the most female-oriented occupations are Education Instruction & Library (77.8%), Health Diagnosing & Treating (70.3%), and Community & Social Service (68.5%).
| Occupation | Male | Female |
| Management | 3,013 (62.3%) | 1,825 (37.7%) |
| Business & Financial | 1,418 (46.2%) | 1,654 (53.8%) |
| Computers, Engineering & Science | 2,109 (85.6%) | 356 (14.4%) |
| Computers & Mathematics | 1,023 (86.8%) | 155 (13.2%) |
| Architecture & Engineering | 895 (89.3%) | 107 (10.7%) |
| Life, Physical & Social Science | 191 (67.0%) | 94 (33.0%) |
| Community & Social Service | 1,858 (31.5%) | 4,036 (68.5%) |
| Education, Arts & Media | 357 (42.6%) | 481 (57.4%) |
| Legal Services & Support | 128 (40.1%) | 191 (59.9%) |
| Education Instruction & Library | 875 (22.2%) | 3,059 (77.8%) |
| Arts, Media & Entertainment | 498 (62.0%) | 305 (38.0%) |
| Health Diagnosing & Treating | 951 (29.7%) | 2,254 (70.3%) |
| Health Technologists | 727 (32.4%) | 1,518 (67.6%) |
| Total (Category) | 9,349 (48.0%) | 10,125 (52.0%) |
| Total (Overall) | 25,699 (55.0%) | 20,993 (45.0%) |
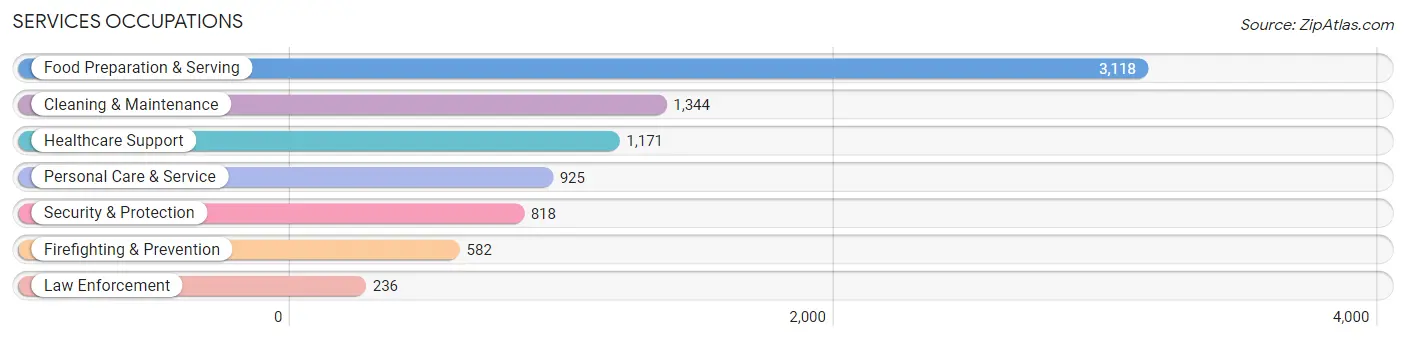
Services Occupations
The most common Services occupations in New Braunfels are Food Preparation & Serving (3,118 | 6.7%), Cleaning & Maintenance (1,344 | 2.9%), Healthcare Support (1,171 | 2.5%), Personal Care & Service (925 | 2.0%), and Security & Protection (818 | 1.8%).
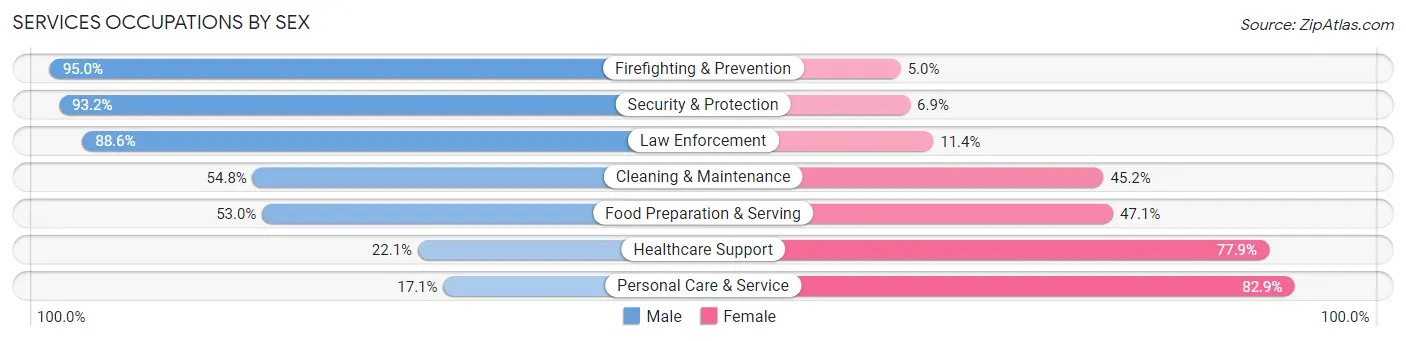
Services Occupations by Sex
Within the Services occupations in New Braunfels, the most male-oriented occupations are Firefighting & Prevention (95.0%), Security & Protection (93.1%), and Law Enforcement (88.6%), while the most female-oriented occupations are Personal Care & Service (82.9%), Healthcare Support (77.9%), and Food Preparation & Serving (47.0%).
| Occupation | Male | Female |
| Healthcare Support | 259 (22.1%) | 912 (77.9%) |
| Security & Protection | 762 (93.1%) | 56 (6.9%) |
| Firefighting & Prevention | 553 (95.0%) | 29 (5.0%) |
| Law Enforcement | 209 (88.6%) | 27 (11.4%) |
| Food Preparation & Serving | 1,651 (52.9%) | 1,467 (47.0%) |
| Cleaning & Maintenance | 737 (54.8%) | 607 (45.2%) |
| Personal Care & Service | 158 (17.1%) | 767 (82.9%) |
| Total (Category) | 3,567 (48.4%) | 3,809 (51.6%) |
| Total (Overall) | 25,699 (55.0%) | 20,993 (45.0%) |
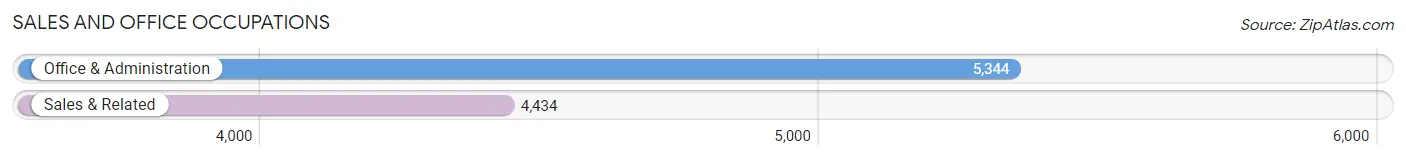
Sales and Office Occupations
The most common Sales and Office occupations in New Braunfels are Office & Administration (5,344 | 11.5%), and Sales & Related (4,434 | 9.5%).
Sales and Office Occupations by Sex
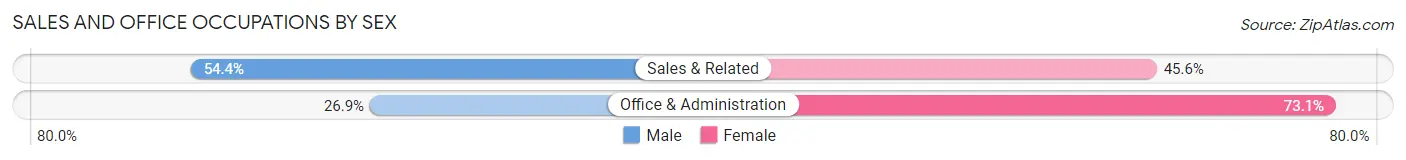
| Occupation | Male | Female |
| Sales & Related | 2,414 (54.4%) | 2,020 (45.6%) |
| Office & Administration | 1,436 (26.9%) | 3,908 (73.1%) |
| Total (Category) | 3,850 (39.4%) | 5,928 (60.6%) |
| Total (Overall) | 25,699 (55.0%) | 20,993 (45.0%) |
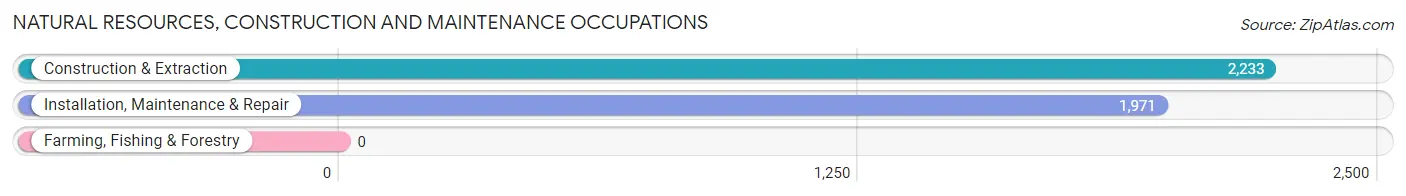
Natural Resources, Construction and Maintenance Occupations
The most common Natural Resources, Construction and Maintenance occupations in New Braunfels are Construction & Extraction (2,233 | 4.8%), and Installation, Maintenance & Repair (1,971 | 4.2%).
Natural Resources, Construction and Maintenance Occupations by Sex
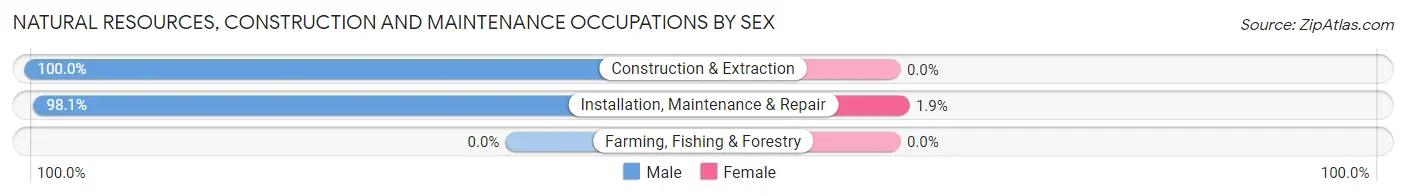
| Occupation | Male | Female |
| Farming, Fishing & Forestry | 0 (0.0%) | 0 (0.0%) |
| Construction & Extraction | 2,233 (100.0%) | 0 (0.0%) |
| Installation, Maintenance & Repair | 1,934 (98.1%) | 37 (1.9%) |
| Total (Category) | 4,167 (99.1%) | 37 (0.9%) |
| Total (Overall) | 25,699 (55.0%) | 20,993 (45.0%) |
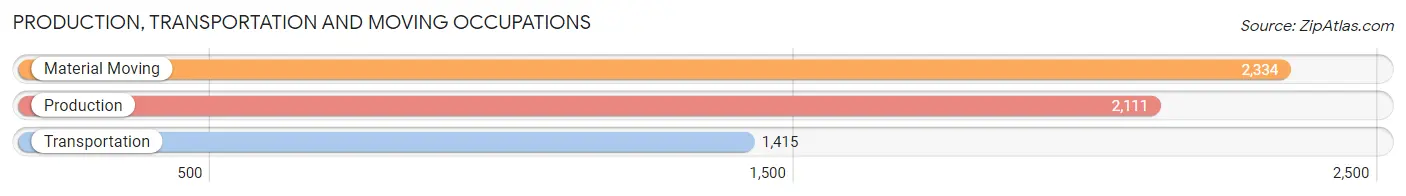
Production, Transportation and Moving Occupations
The most common Production, Transportation and Moving occupations in New Braunfels are Material Moving (2,334 | 5.0%), Production (2,111 | 4.5%), and Transportation (1,415 | 3.0%).
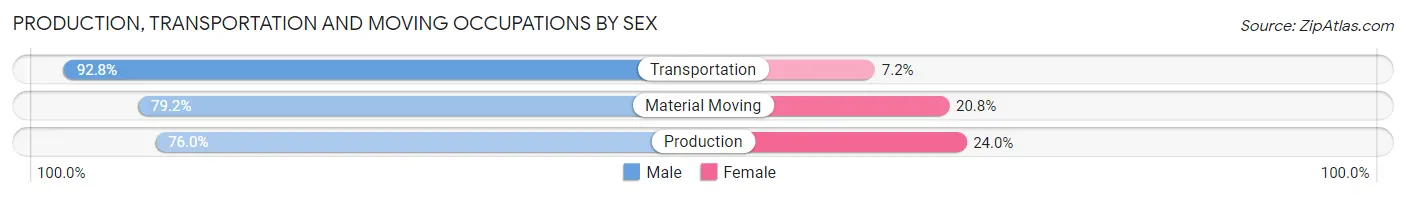
Production, Transportation and Moving Occupations by Sex
| Occupation | Male | Female |
| Production | 1,605 (76.0%) | 506 (24.0%) |
| Transportation | 1,313 (92.8%) | 102 (7.2%) |
| Material Moving | 1,848 (79.2%) | 486 (20.8%) |
| Total (Category) | 4,766 (81.3%) | 1,094 (18.7%) |
| Total (Overall) | 25,699 (55.0%) | 20,993 (45.0%) |
Employment Industries by Sex in New Braunfels
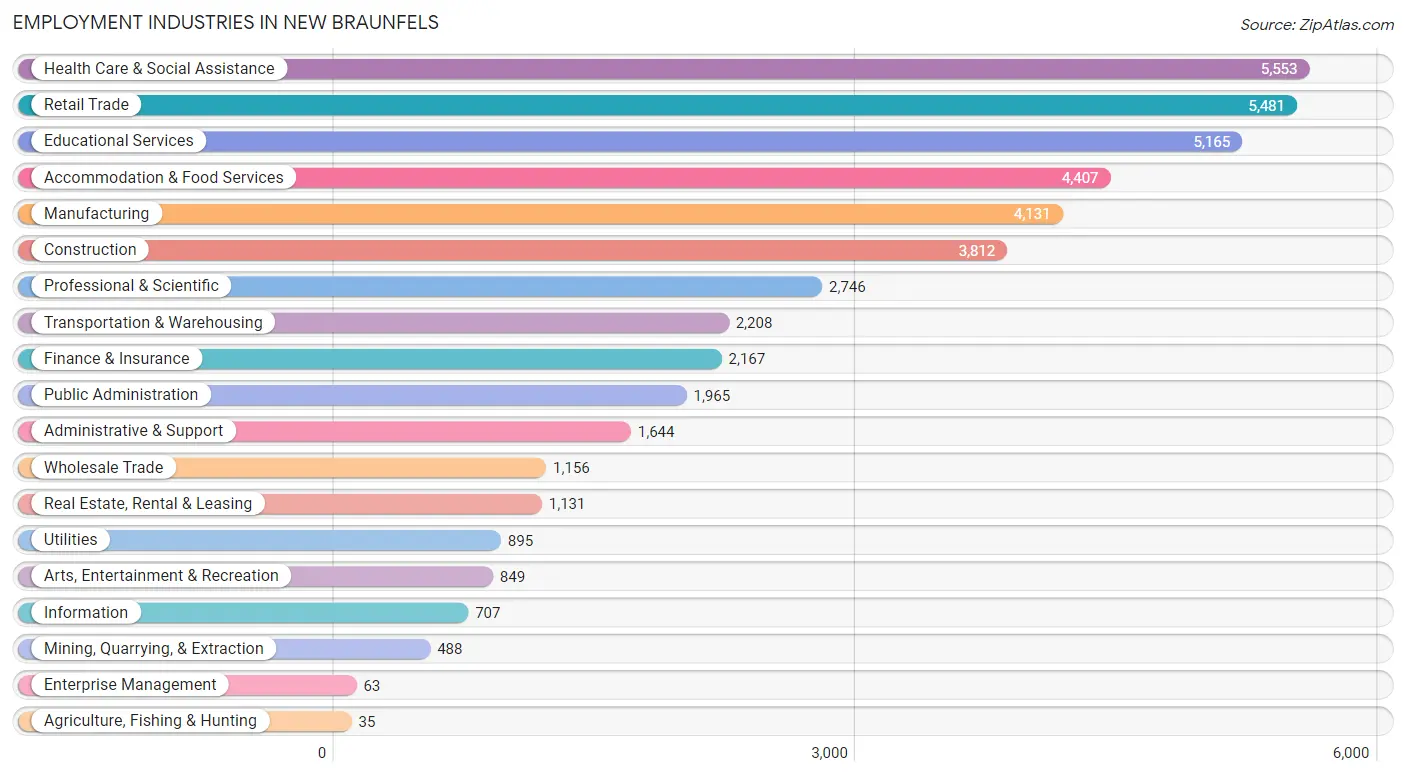
Employment Industries in New Braunfels
The major employment industries in New Braunfels include Health Care & Social Assistance (5,553 | 11.9%), Retail Trade (5,481 | 11.7%), Educational Services (5,165 | 11.1%), Accommodation & Food Services (4,407 | 9.4%), and Manufacturing (4,131 | 8.8%).
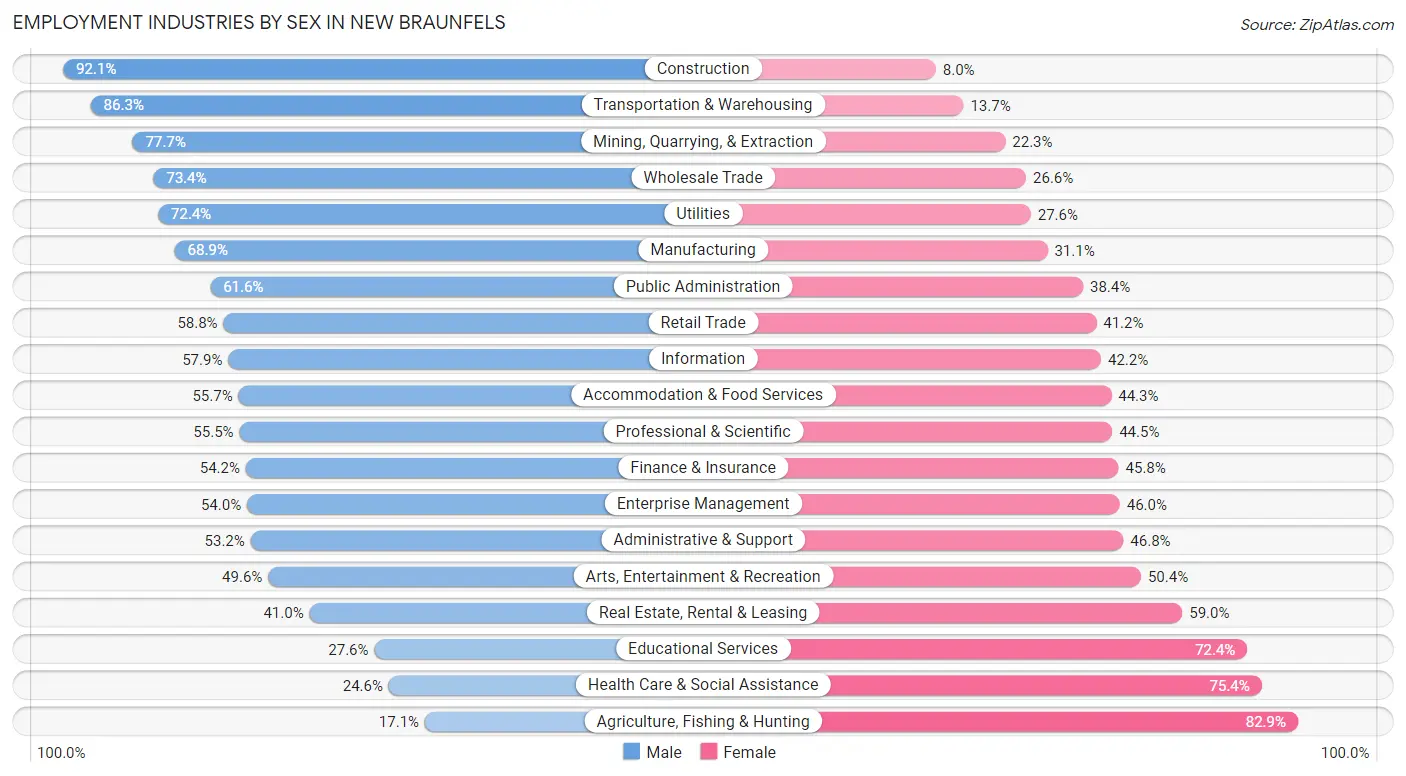
Employment Industries by Sex in New Braunfels
The New Braunfels industries that see more men than women are Construction (92.0%), Transportation & Warehousing (86.3%), and Mining, Quarrying, & Extraction (77.7%), whereas the industries that tend to have a higher number of women are Agriculture, Fishing & Hunting (82.9%), Health Care & Social Assistance (75.4%), and Educational Services (72.4%).
| Industry | Male | Female |
| Agriculture, Fishing & Hunting | 6 (17.1%) | 29 (82.9%) |
| Mining, Quarrying, & Extraction | 379 (77.7%) | 109 (22.3%) |
| Construction | 3,509 (92.0%) | 303 (8.0%) |
| Manufacturing | 2,848 (68.9%) | 1,283 (31.1%) |
| Wholesale Trade | 848 (73.4%) | 308 (26.6%) |
| Retail Trade | 3,225 (58.8%) | 2,256 (41.2%) |
| Transportation & Warehousing | 1,906 (86.3%) | 302 (13.7%) |
| Utilities | 648 (72.4%) | 247 (27.6%) |
| Information | 409 (57.9%) | 298 (42.1%) |
| Finance & Insurance | 1,175 (54.2%) | 992 (45.8%) |
| Real Estate, Rental & Leasing | 464 (41.0%) | 667 (59.0%) |
| Professional & Scientific | 1,525 (55.5%) | 1,221 (44.5%) |
| Enterprise Management | 34 (54.0%) | 29 (46.0%) |
| Administrative & Support | 875 (53.2%) | 769 (46.8%) |
| Educational Services | 1,426 (27.6%) | 3,739 (72.4%) |
| Health Care & Social Assistance | 1,367 (24.6%) | 4,186 (75.4%) |
| Arts, Entertainment & Recreation | 421 (49.6%) | 428 (50.4%) |
| Accommodation & Food Services | 2,456 (55.7%) | 1,951 (44.3%) |
| Public Administration | 1,210 (61.6%) | 755 (38.4%) |
| Total | 25,699 (55.0%) | 20,993 (45.0%) |
Education in New Braunfels
School Enrollment in New Braunfels
The most common levels of schooling among the 21,575 students in New Braunfels are elementary school (5,560 | 25.8%), middle school (4,916 | 22.8%), and high school (4,562 | 21.1%).
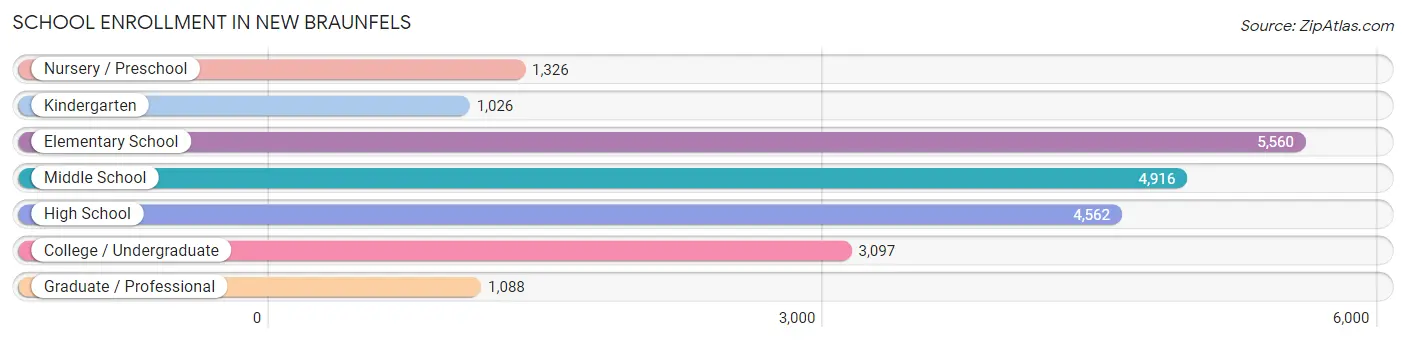
| School Level | # Students | % Students |
| Nursery / Preschool | 1,326 | 6.1% |
| Kindergarten | 1,026 | 4.8% |
| Elementary School | 5,560 | 25.8% |
| Middle School | 4,916 | 22.8% |
| High School | 4,562 | 21.1% |
| College / Undergraduate | 3,097 | 14.3% |
| Graduate / Professional | 1,088 | 5.0% |
| Total | 21,575 | 100.0% |
School Enrollment by Age by Funding Source in New Braunfels
Out of a total of 21,575 students who are enrolled in schools in New Braunfels, 3,754 (17.4%) attend a private institution, while the remaining 17,821 (82.6%) are enrolled in public schools. The age group of 3 to 4 year olds has the highest likelihood of being enrolled in private schools, with 392 (40.5% in the age bracket) enrolled. Conversely, the age group of 5 to 9 year old has the lowest likelihood of being enrolled in a private school, with 5,500 (88.9% in the age bracket) attending a public institution.
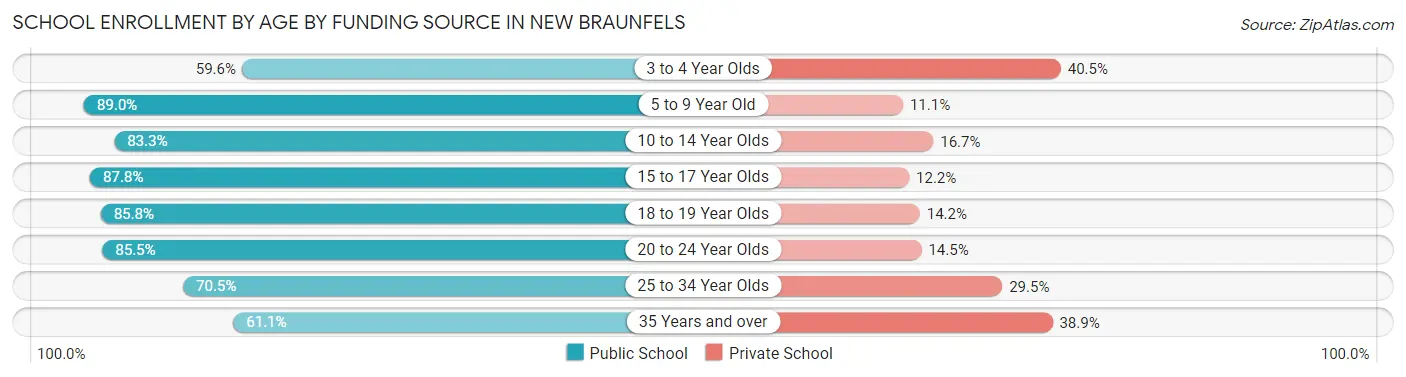
| Age Bracket | Public School | Private School |
| 3 to 4 Year Olds | 577 (59.6%) | 392 (40.5%) |
| 5 to 9 Year Old | 5,500 (88.9%) | 683 (11.1%) |
| 10 to 14 Year Olds | 4,973 (83.3%) | 997 (16.7%) |
| 15 to 17 Year Olds | 3,010 (87.8%) | 418 (12.2%) |
| 18 to 19 Year Olds | 968 (85.8%) | 160 (14.2%) |
| 20 to 24 Year Olds | 956 (85.5%) | 162 (14.5%) |
| 25 to 34 Year Olds | 969 (70.5%) | 406 (29.5%) |
| 35 Years and over | 858 (61.1%) | 546 (38.9%) |
| Total | 17,821 (82.6%) | 3,754 (17.4%) |
Educational Attainment by Field of Study in New Braunfels
Business (4,919 | 19.6%), education (3,361 | 13.4%), science & technology (2,936 | 11.7%), arts & humanities (2,638 | 10.5%), and engineering (1,531 | 6.1%) are the most common fields of study among 25,098 individuals in New Braunfels who have obtained a bachelor's degree or higher.
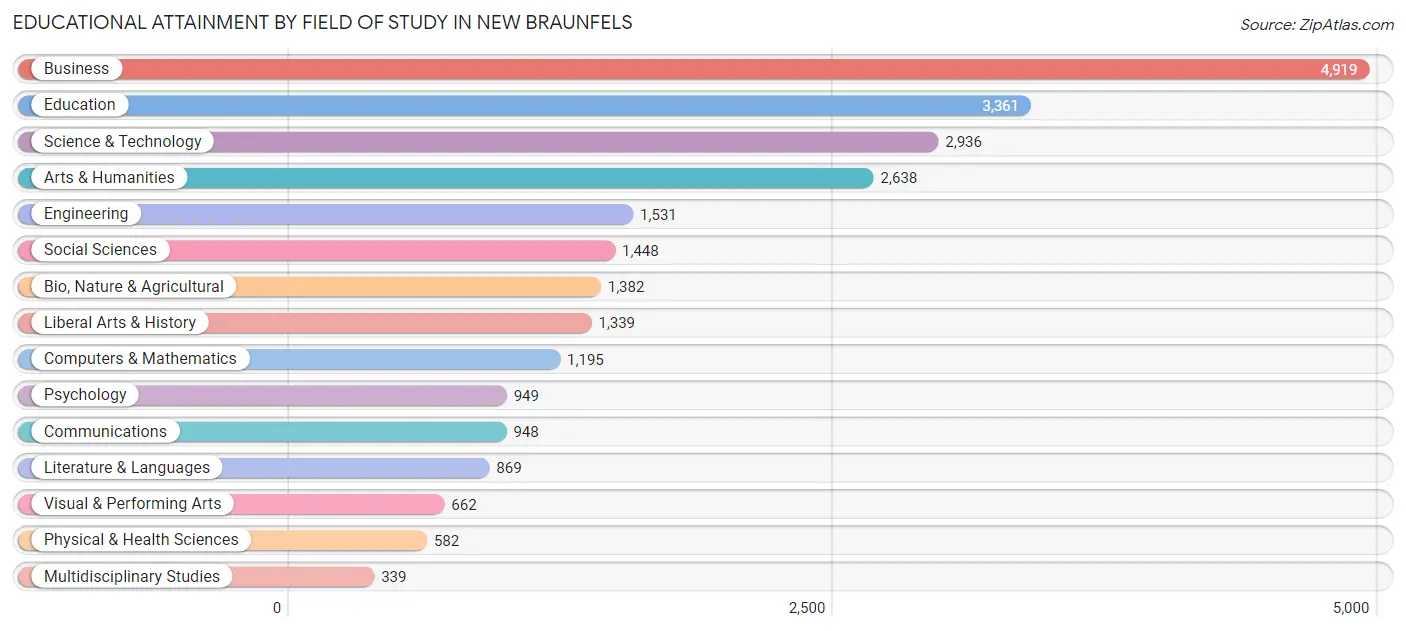
| Field of Study | # Graduates | % Graduates |
| Computers & Mathematics | 1,195 | 4.8% |
| Bio, Nature & Agricultural | 1,382 | 5.5% |
| Physical & Health Sciences | 582 | 2.3% |
| Psychology | 949 | 3.8% |
| Social Sciences | 1,448 | 5.8% |
| Engineering | 1,531 | 6.1% |
| Multidisciplinary Studies | 339 | 1.3% |
| Science & Technology | 2,936 | 11.7% |
| Business | 4,919 | 19.6% |
| Education | 3,361 | 13.4% |
| Literature & Languages | 869 | 3.5% |
| Liberal Arts & History | 1,339 | 5.3% |
| Visual & Performing Arts | 662 | 2.6% |
| Communications | 948 | 3.8% |
| Arts & Humanities | 2,638 | 10.5% |
| Total | 25,098 | 100.0% |
Transportation & Commute in New Braunfels
Vehicle Availability by Sex in New Braunfels
The most prevalent vehicle ownership categories in New Braunfels are males with 2 vehicles (11,557, accounting for 45.1%) and females with 2 vehicles (8,871, making up 55.4%).
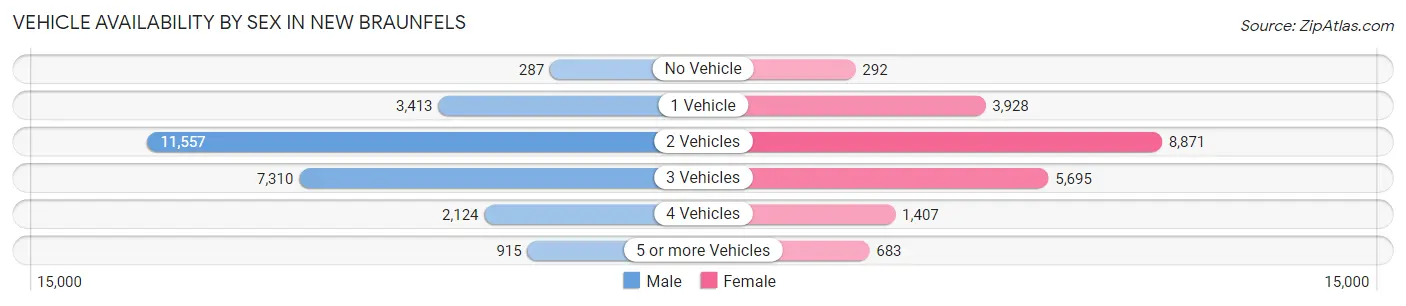
| Vehicles Available | Male | Female |
| No Vehicle | 287 (1.1%) | 292 (1.4%) |
| 1 Vehicle | 3,413 (13.3%) | 3,928 (18.8%) |
| 2 Vehicles | 11,557 (45.1%) | 8,871 (42.5%) |
| 3 Vehicles | 7,310 (28.5%) | 5,695 (27.3%) |
| 4 Vehicles | 2,124 (8.3%) | 1,407 (6.7%) |
| 5 or more Vehicles | 915 (3.6%) | 683 (3.3%) |
| Total | 25,606 (100.0%) | 20,876 (100.0%) |
Commute Time in New Braunfels
The most frequently occuring commute durations in New Braunfels are 10 to 14 minutes (7,580 commuters, 18.4%), 15 to 19 minutes (6,112 commuters, 14.8%), and 20 to 24 minutes (4,888 commuters, 11.9%).
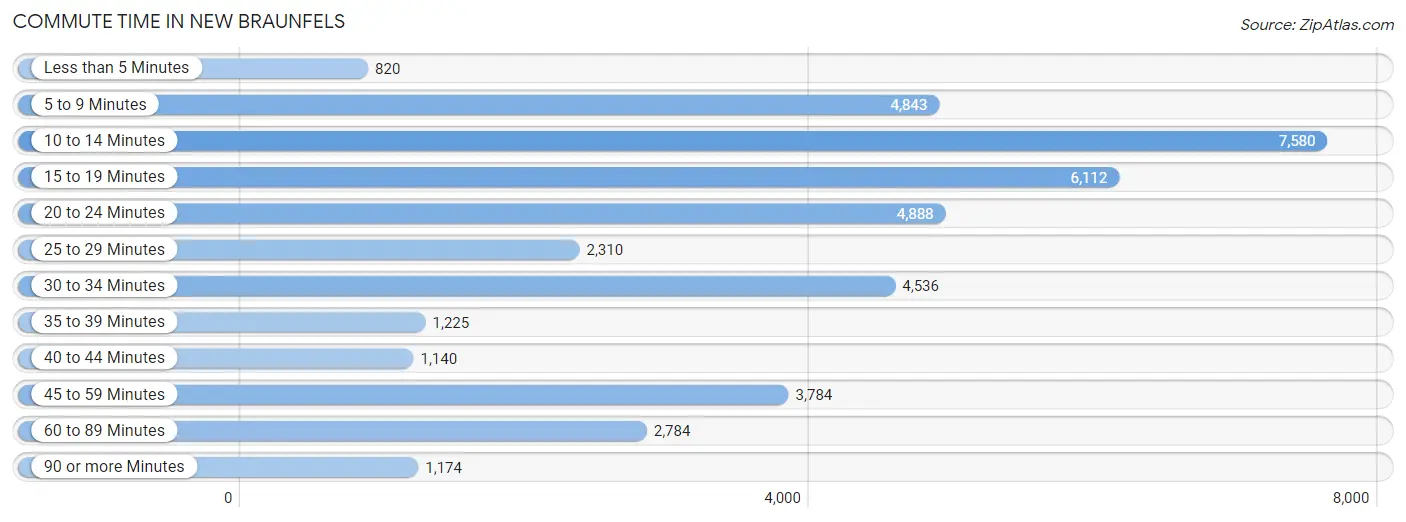
| Commute Time | # Commuters | % Commuters |
| Less than 5 Minutes | 820 | 2.0% |
| 5 to 9 Minutes | 4,843 | 11.8% |
| 10 to 14 Minutes | 7,580 | 18.4% |
| 15 to 19 Minutes | 6,112 | 14.8% |
| 20 to 24 Minutes | 4,888 | 11.9% |
| 25 to 29 Minutes | 2,310 | 5.6% |
| 30 to 34 Minutes | 4,536 | 11.0% |
| 35 to 39 Minutes | 1,225 | 3.0% |
| 40 to 44 Minutes | 1,140 | 2.8% |
| 45 to 59 Minutes | 3,784 | 9.2% |
| 60 to 89 Minutes | 2,784 | 6.8% |
| 90 or more Minutes | 1,174 | 2.9% |
Commute Time by Sex in New Braunfels
The most common commute times in New Braunfels are 10 to 14 minutes (3,929 commuters, 17.1%) for males and 10 to 14 minutes (3,651 commuters, 20.1%) for females.
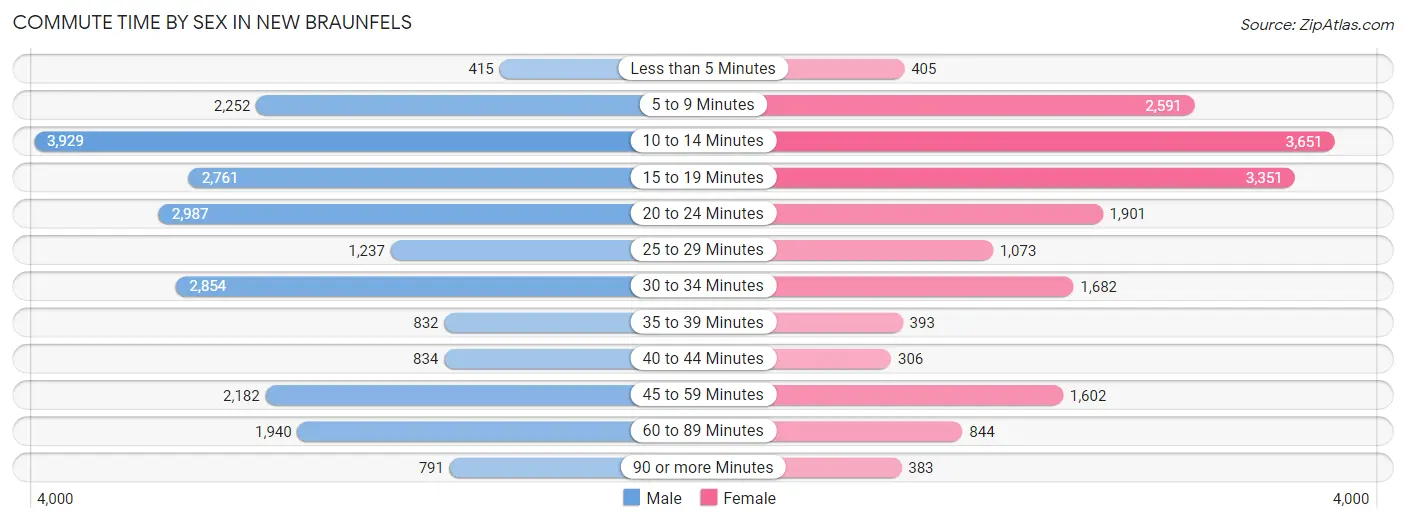
| Commute Time | Male | Female |
| Less than 5 Minutes | 415 (1.8%) | 405 (2.2%) |
| 5 to 9 Minutes | 2,252 (9.8%) | 2,591 (14.2%) |
| 10 to 14 Minutes | 3,929 (17.1%) | 3,651 (20.1%) |
| 15 to 19 Minutes | 2,761 (12.0%) | 3,351 (18.4%) |
| 20 to 24 Minutes | 2,987 (13.0%) | 1,901 (10.5%) |
| 25 to 29 Minutes | 1,237 (5.4%) | 1,073 (5.9%) |
| 30 to 34 Minutes | 2,854 (12.4%) | 1,682 (9.2%) |
| 35 to 39 Minutes | 832 (3.6%) | 393 (2.2%) |
| 40 to 44 Minutes | 834 (3.6%) | 306 (1.7%) |
| 45 to 59 Minutes | 2,182 (9.5%) | 1,602 (8.8%) |
| 60 to 89 Minutes | 1,940 (8.4%) | 844 (4.6%) |
| 90 or more Minutes | 791 (3.4%) | 383 (2.1%) |
Time of Departure to Work by Sex in New Braunfels
The most frequent times of departure to work in New Braunfels are 7:00 AM to 7:29 AM (3,572, 15.5%) for males and 7:00 AM to 7:29 AM (3,303, 18.2%) for females.
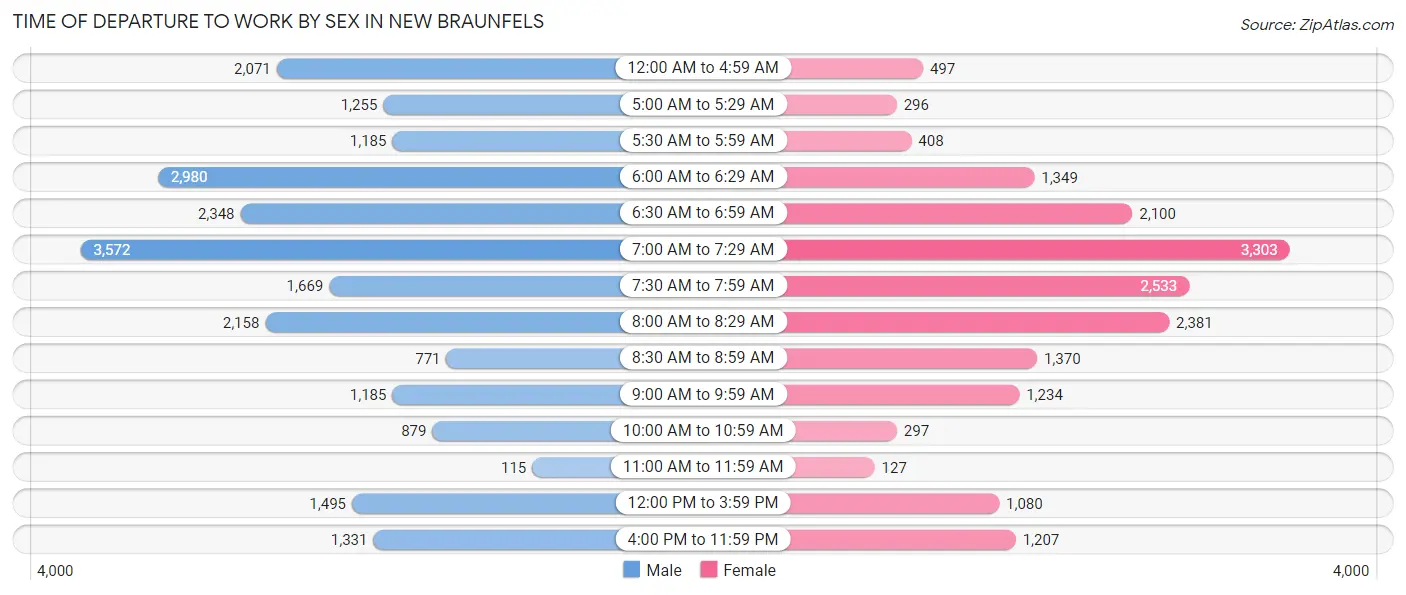
| Time of Departure | Male | Female |
| 12:00 AM to 4:59 AM | 2,071 (9.0%) | 497 (2.7%) |
| 5:00 AM to 5:29 AM | 1,255 (5.4%) | 296 (1.6%) |
| 5:30 AM to 5:59 AM | 1,185 (5.1%) | 408 (2.2%) |
| 6:00 AM to 6:29 AM | 2,980 (13.0%) | 1,349 (7.4%) |
| 6:30 AM to 6:59 AM | 2,348 (10.2%) | 2,100 (11.6%) |
| 7:00 AM to 7:29 AM | 3,572 (15.5%) | 3,303 (18.2%) |
| 7:30 AM to 7:59 AM | 1,669 (7.2%) | 2,533 (13.9%) |
| 8:00 AM to 8:29 AM | 2,158 (9.4%) | 2,381 (13.1%) |
| 8:30 AM to 8:59 AM | 771 (3.4%) | 1,370 (7.5%) |
| 9:00 AM to 9:59 AM | 1,185 (5.1%) | 1,234 (6.8%) |
| 10:00 AM to 10:59 AM | 879 (3.8%) | 297 (1.6%) |
| 11:00 AM to 11:59 AM | 115 (0.5%) | 127 (0.7%) |
| 12:00 PM to 3:59 PM | 1,495 (6.5%) | 1,080 (5.9%) |
| 4:00 PM to 11:59 PM | 1,331 (5.8%) | 1,207 (6.6%) |
| Total | 23,014 (100.0%) | 18,182 (100.0%) |
Housing Occupancy in New Braunfels
Occupancy by Ownership in New Braunfels
Of the total 36,068 dwellings in New Braunfels, owner-occupied units account for 23,020 (63.8%), while renter-occupied units make up 13,048 (36.2%).
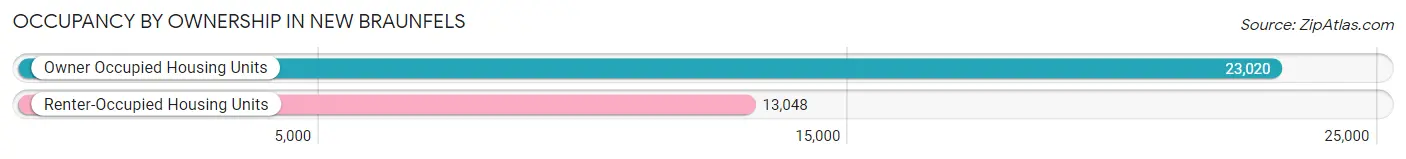
| Occupancy | # Housing Units | % Housing Units |
| Owner Occupied Housing Units | 23,020 | 63.8% |
| Renter-Occupied Housing Units | 13,048 | 36.2% |
| Total Occupied Housing Units | 36,068 | 100.0% |
Occupancy by Household Size in New Braunfels
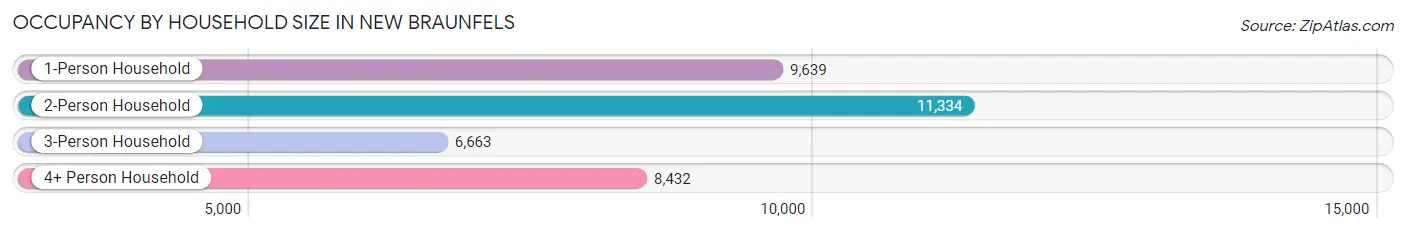
| Household Size | # Housing Units | % Housing Units |
| 1-Person Household | 9,639 | 26.7% |
| 2-Person Household | 11,334 | 31.4% |
| 3-Person Household | 6,663 | 18.5% |
| 4+ Person Household | 8,432 | 23.4% |
| Total Housing Units | 36,068 | 100.0% |
Occupancy by Ownership by Household Size in New Braunfels
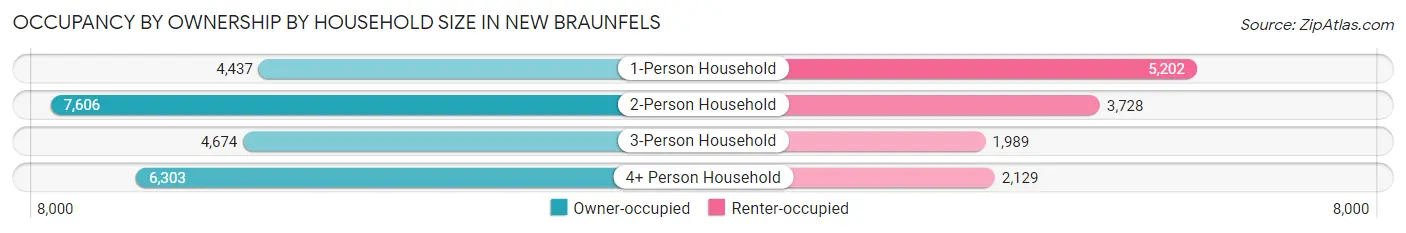
| Household Size | Owner-occupied | Renter-occupied |
| 1-Person Household | 4,437 (46.0%) | 5,202 (54.0%) |
| 2-Person Household | 7,606 (67.1%) | 3,728 (32.9%) |
| 3-Person Household | 4,674 (70.2%) | 1,989 (29.8%) |
| 4+ Person Household | 6,303 (74.8%) | 2,129 (25.3%) |
| Total Housing Units | 23,020 (63.8%) | 13,048 (36.2%) |
Occupancy by Educational Attainment in New Braunfels
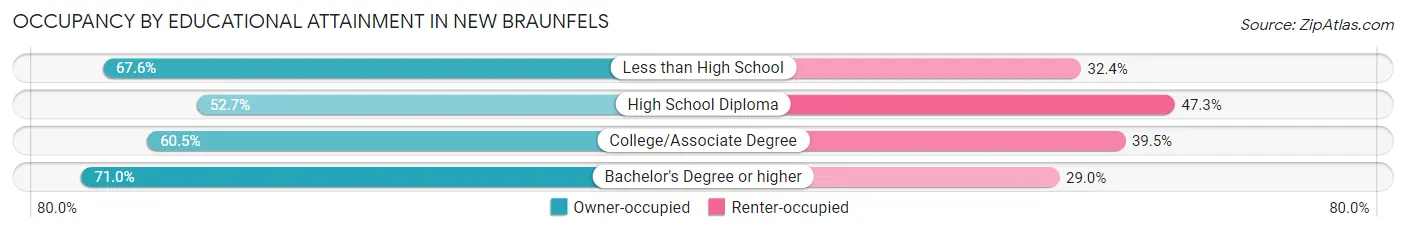
| Household Size | Owner-occupied | Renter-occupied |
| Less than High School | 1,517 (67.6%) | 728 (32.4%) |
| High School Diploma | 3,940 (52.7%) | 3,541 (47.3%) |
| College/Associate Degree | 6,597 (60.5%) | 4,300 (39.5%) |
| Bachelor's Degree or higher | 10,966 (71.0%) | 4,479 (29.0%) |
Occupancy by Age of Householder in New Braunfels
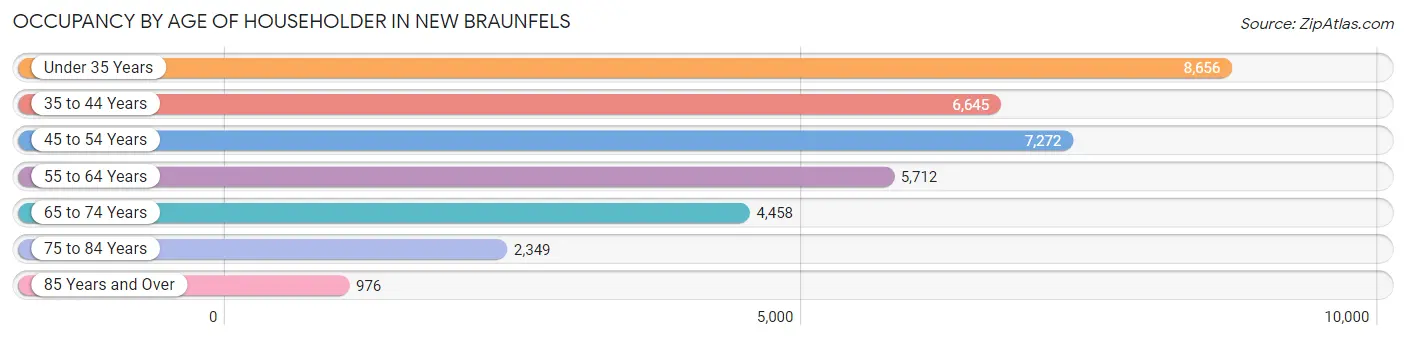
| Age Bracket | # Households | % Households |
| Under 35 Years | 8,656 | 24.0% |
| 35 to 44 Years | 6,645 | 18.4% |
| 45 to 54 Years | 7,272 | 20.2% |
| 55 to 64 Years | 5,712 | 15.8% |
| 65 to 74 Years | 4,458 | 12.4% |
| 75 to 84 Years | 2,349 | 6.5% |
| 85 Years and Over | 976 | 2.7% |
| Total | 36,068 | 100.0% |
Housing Finances in New Braunfels
Median Income by Occupancy in New Braunfels
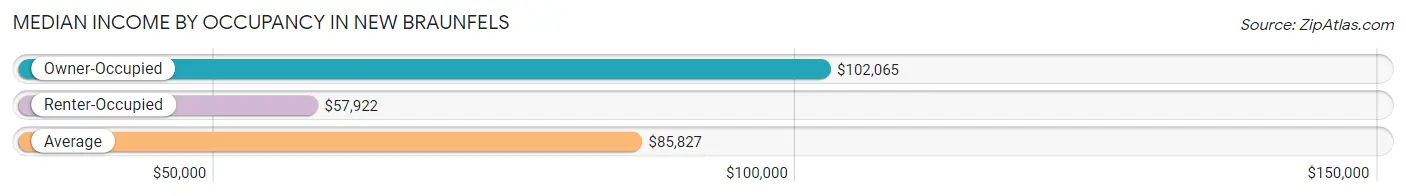
| Occupancy Type | # Households | Median Income |
| Owner-Occupied | 23,020 (63.8%) | $102,065 |
| Renter-Occupied | 13,048 (36.2%) | $57,922 |
| Average | 36,068 (100.0%) | $85,827 |
Occupancy by Householder Income Bracket in New Braunfels
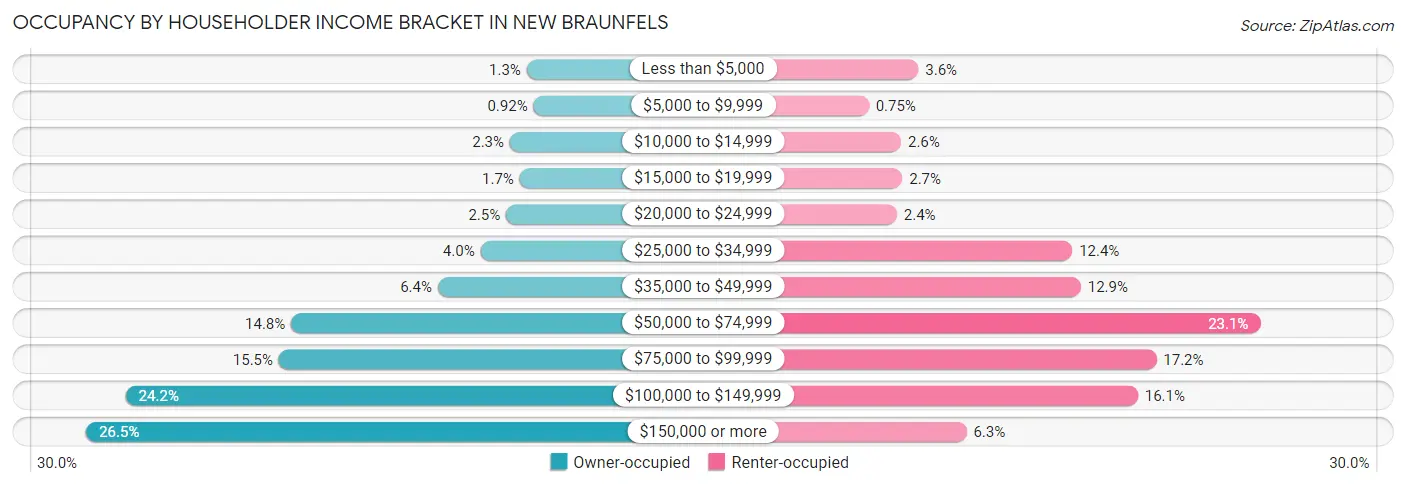
| Income Bracket | Owner-occupied | Renter-occupied |
| Less than $5,000 | 301 (1.3%) | 469 (3.6%) |
| $5,000 to $9,999 | 211 (0.9%) | 98 (0.7%) |
| $10,000 to $14,999 | 523 (2.3%) | 339 (2.6%) |
| $15,000 to $19,999 | 394 (1.7%) | 348 (2.7%) |
| $20,000 to $24,999 | 574 (2.5%) | 308 (2.4%) |
| $25,000 to $34,999 | 909 (4.0%) | 1,615 (12.4%) |
| $35,000 to $49,999 | 1,471 (6.4%) | 1,679 (12.9%) |
| $50,000 to $74,999 | 3,400 (14.8%) | 3,017 (23.1%) |
| $75,000 to $99,999 | 3,561 (15.5%) | 2,243 (17.2%) |
| $100,000 to $149,999 | 5,577 (24.2%) | 2,105 (16.1%) |
| $150,000 or more | 6,099 (26.5%) | 827 (6.3%) |
| Total | 23,020 (100.0%) | 13,048 (100.0%) |
Monthly Housing Cost Tiers in New Braunfels
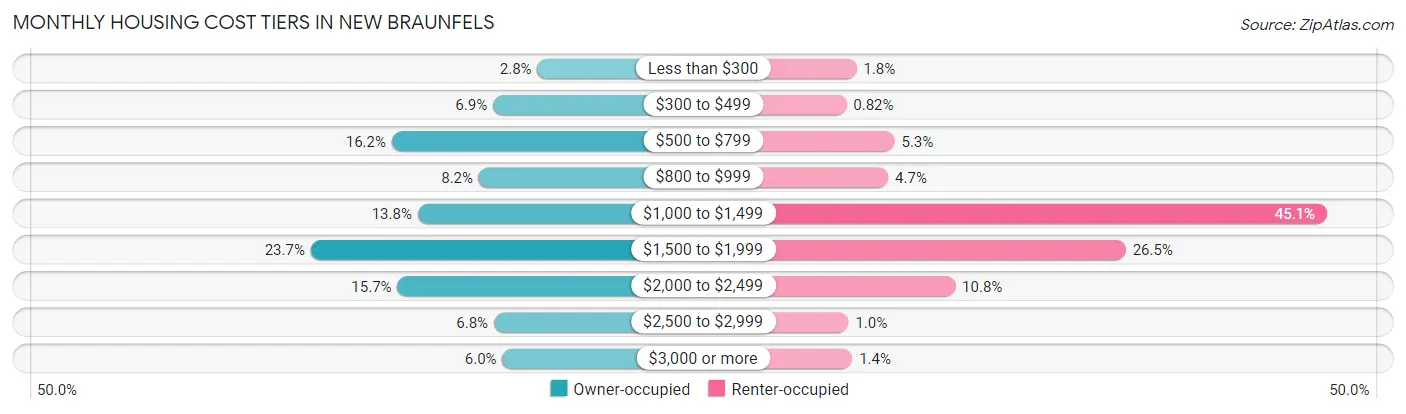
| Monthly Cost | Owner-occupied | Renter-occupied |
| Less than $300 | 643 (2.8%) | 228 (1.8%) |
| $300 to $499 | 1,584 (6.9%) | 107 (0.8%) |
| $500 to $799 | 3,729 (16.2%) | 686 (5.3%) |
| $800 to $999 | 1,883 (8.2%) | 609 (4.7%) |
| $1,000 to $1,499 | 3,179 (13.8%) | 5,880 (45.1%) |
| $1,500 to $1,999 | 5,447 (23.7%) | 3,463 (26.5%) |
| $2,000 to $2,499 | 3,609 (15.7%) | 1,415 (10.8%) |
| $2,500 to $2,999 | 1,563 (6.8%) | 133 (1.0%) |
| $3,000 or more | 1,383 (6.0%) | 178 (1.4%) |
| Total | 23,020 (100.0%) | 13,048 (100.0%) |
Physical Housing Characteristics in New Braunfels
Housing Structures in New Braunfels
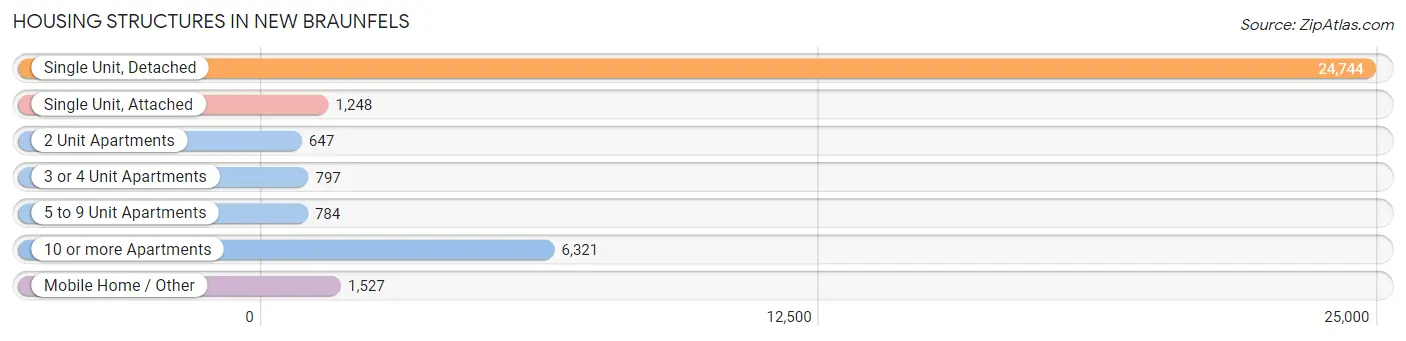
| Structure Type | # Housing Units | % Housing Units |
| Single Unit, Detached | 24,744 | 68.6% |
| Single Unit, Attached | 1,248 | 3.5% |
| 2 Unit Apartments | 647 | 1.8% |
| 3 or 4 Unit Apartments | 797 | 2.2% |
| 5 to 9 Unit Apartments | 784 | 2.2% |
| 10 or more Apartments | 6,321 | 17.5% |
| Mobile Home / Other | 1,527 | 4.2% |
| Total | 36,068 | 100.0% |
Housing Structures by Occupancy in New Braunfels
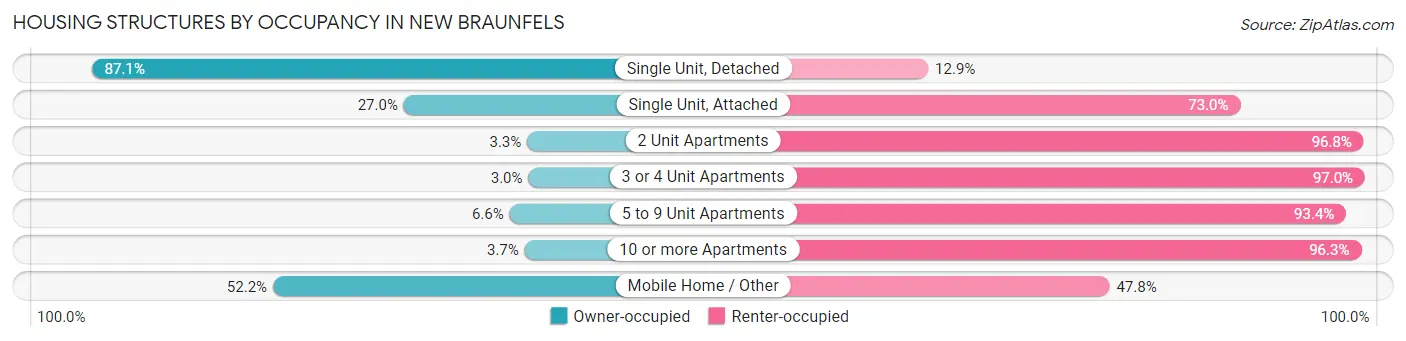
| Structure Type | Owner-occupied | Renter-occupied |
| Single Unit, Detached | 21,553 (87.1%) | 3,191 (12.9%) |
| Single Unit, Attached | 337 (27.0%) | 911 (73.0%) |
| 2 Unit Apartments | 21 (3.3%) | 626 (96.8%) |
| 3 or 4 Unit Apartments | 24 (3.0%) | 773 (97.0%) |
| 5 to 9 Unit Apartments | 52 (6.6%) | 732 (93.4%) |
| 10 or more Apartments | 236 (3.7%) | 6,085 (96.3%) |
| Mobile Home / Other | 797 (52.2%) | 730 (47.8%) |
| Total | 23,020 (63.8%) | 13,048 (36.2%) |
Housing Structures by Number of Rooms in New Braunfels
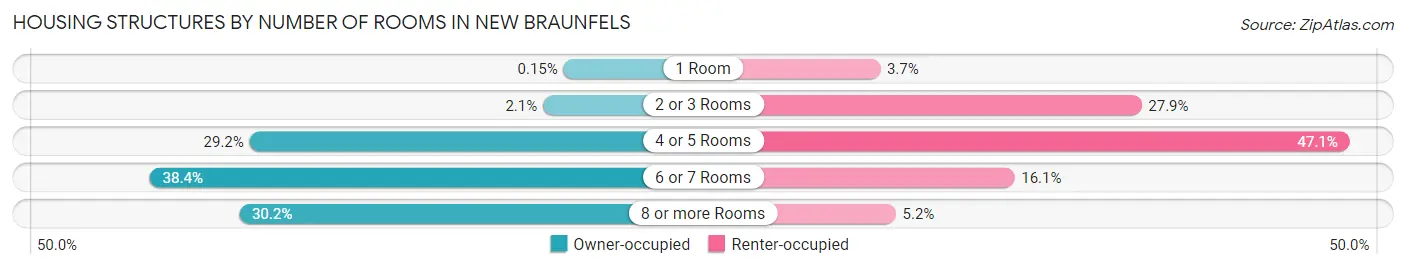
| Number of Rooms | Owner-occupied | Renter-occupied |
| 1 Room | 35 (0.2%) | 483 (3.7%) |
| 2 or 3 Rooms | 472 (2.1%) | 3,638 (27.9%) |
| 4 or 5 Rooms | 6,720 (29.2%) | 6,151 (47.1%) |
| 6 or 7 Rooms | 8,847 (38.4%) | 2,104 (16.1%) |
| 8 or more Rooms | 6,946 (30.2%) | 672 (5.1%) |
| Total | 23,020 (100.0%) | 13,048 (100.0%) |
Housing Structure by Heating Type in New Braunfels
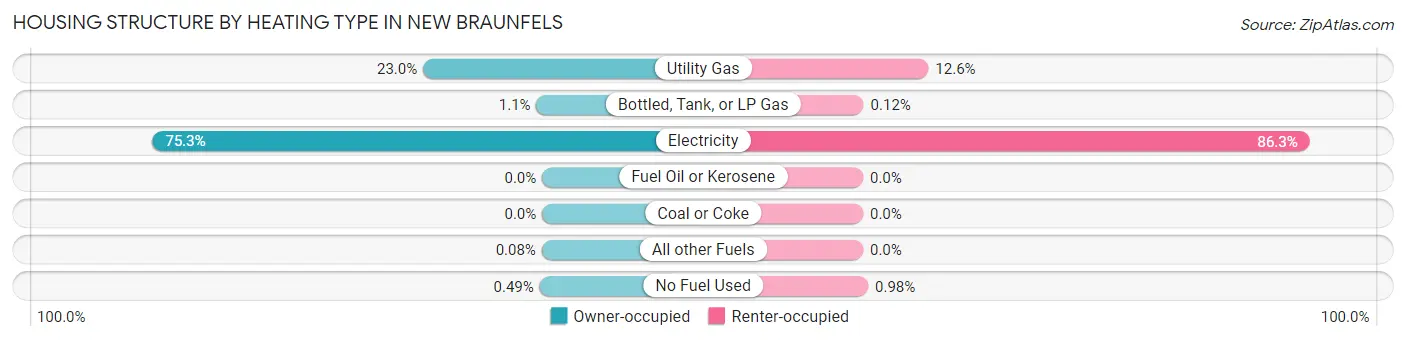
| Heating Type | Owner-occupied | Renter-occupied |
| Utility Gas | 5,298 (23.0%) | 1,648 (12.6%) |
| Bottled, Tank, or LP Gas | 253 (1.1%) | 16 (0.1%) |
| Electricity | 17,337 (75.3%) | 11,256 (86.3%) |
| Fuel Oil or Kerosene | 0 (0.0%) | 0 (0.0%) |
| Coal or Coke | 0 (0.0%) | 0 (0.0%) |
| All other Fuels | 19 (0.1%) | 0 (0.0%) |
| No Fuel Used | 113 (0.5%) | 128 (1.0%) |
| Total | 23,020 (100.0%) | 13,048 (100.0%) |
Household Vehicle Usage in New Braunfels
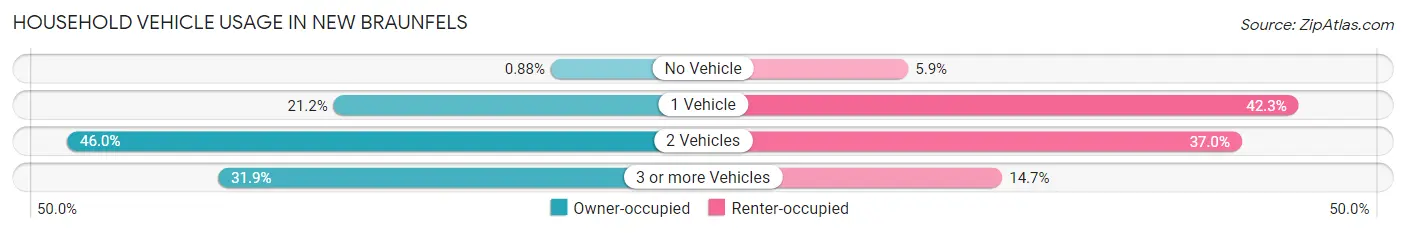
| Vehicles per Household | Owner-occupied | Renter-occupied |
| No Vehicle | 203 (0.9%) | 773 (5.9%) |
| 1 Vehicle | 4,871 (21.2%) | 5,525 (42.3%) |
| 2 Vehicles | 10,596 (46.0%) | 4,833 (37.0%) |
| 3 or more Vehicles | 7,350 (31.9%) | 1,917 (14.7%) |
| Total | 23,020 (100.0%) | 13,048 (100.0%) |
Real Estate & Mortgages in New Braunfels
Real Estate and Mortgage Overview in New Braunfels
| Characteristic | Without Mortgage | With Mortgage |
| Housing Units | 7,997 | 15,023 |
| Median Property Value | $267,500 | $302,700 |
| Median Household Income | $70,111 | $4,737 |
| Monthly Housing Costs | $662 | $1,367 |
| Real Estate Taxes | $3,586 | $899 |
Property Value by Mortgage Status in New Braunfels
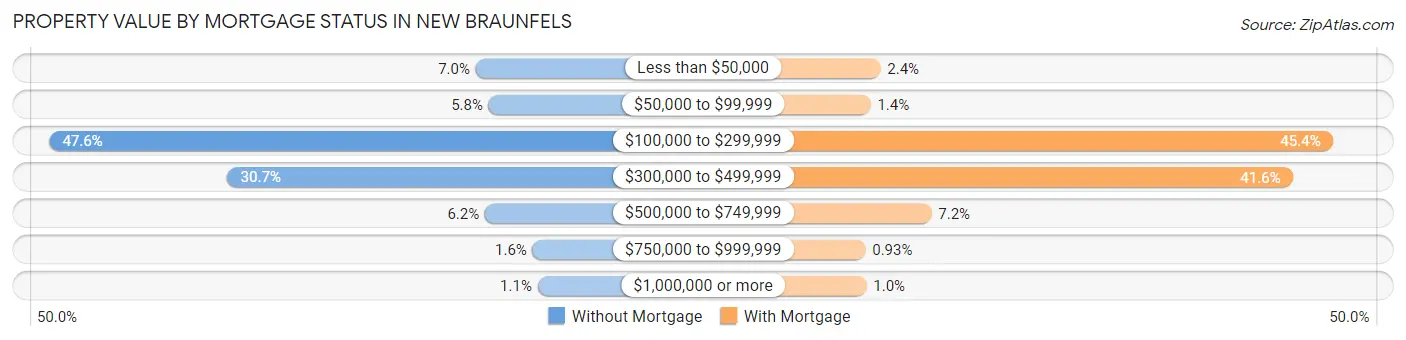
| Property Value | Without Mortgage | With Mortgage |
| Less than $50,000 | 562 (7.0%) | 354 (2.4%) |
| $50,000 to $99,999 | 463 (5.8%) | 214 (1.4%) |
| $100,000 to $299,999 | 3,809 (47.6%) | 6,823 (45.4%) |
| $300,000 to $499,999 | 2,452 (30.7%) | 6,253 (41.6%) |
| $500,000 to $749,999 | 492 (6.1%) | 1,085 (7.2%) |
| $750,000 to $999,999 | 129 (1.6%) | 139 (0.9%) |
| $1,000,000 or more | 90 (1.1%) | 155 (1.0%) |
| Total | 7,997 (100.0%) | 15,023 (100.0%) |
Household Income by Mortgage Status in New Braunfels
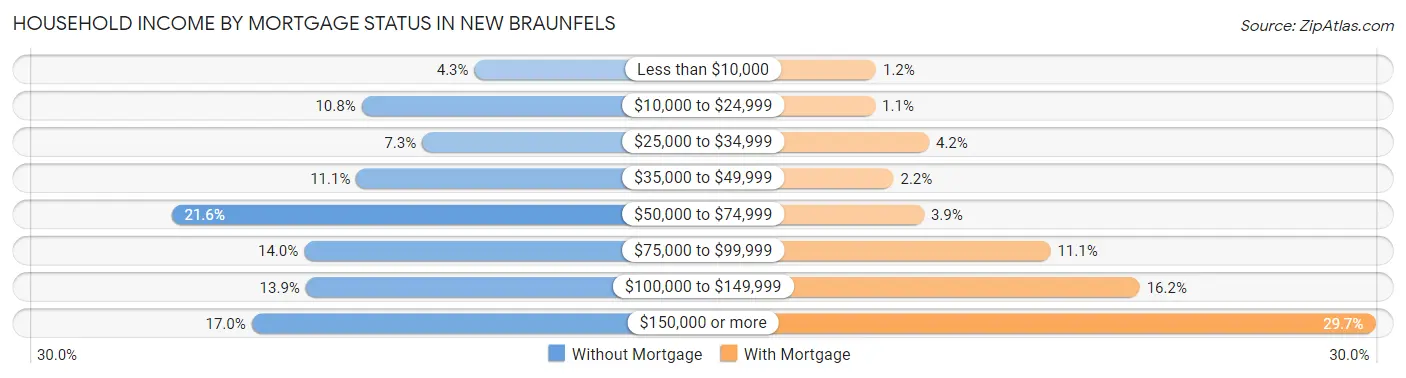
| Household Income | Without Mortgage | With Mortgage |
| Less than $10,000 | 344 (4.3%) | 176 (1.2%) |
| $10,000 to $24,999 | 860 (10.7%) | 168 (1.1%) |
| $25,000 to $34,999 | 583 (7.3%) | 631 (4.2%) |
| $35,000 to $49,999 | 884 (11.1%) | 326 (2.2%) |
| $50,000 to $74,999 | 1,727 (21.6%) | 587 (3.9%) |
| $75,000 to $99,999 | 1,122 (14.0%) | 1,673 (11.1%) |
| $100,000 to $149,999 | 1,115 (13.9%) | 2,439 (16.2%) |
| $150,000 or more | 1,362 (17.0%) | 4,462 (29.7%) |
| Total | 7,997 (100.0%) | 15,023 (100.0%) |
Property Value to Household Income Ratio in New Braunfels
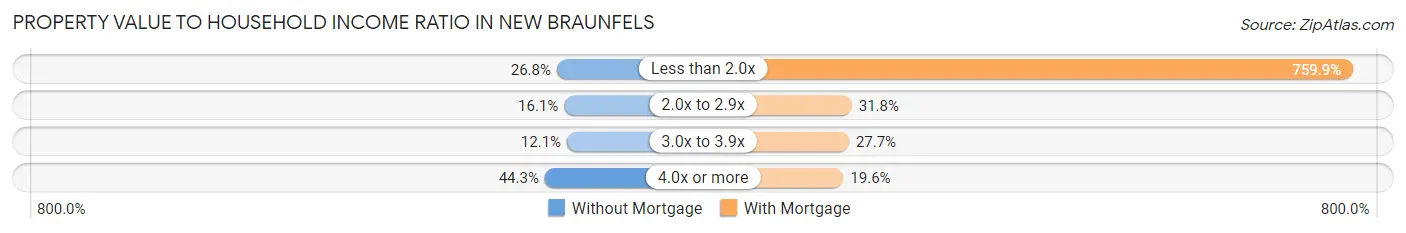
| Value-to-Income Ratio | Without Mortgage | With Mortgage |
| Less than 2.0x | 2,145 (26.8%) | 114,158 (759.9%) |
| 2.0x to 2.9x | 1,286 (16.1%) | 4,779 (31.8%) |
| 3.0x to 3.9x | 966 (12.1%) | 4,155 (27.7%) |
| 4.0x or more | 3,544 (44.3%) | 2,945 (19.6%) |
| Total | 7,997 (100.0%) | 15,023 (100.0%) |
Real Estate Taxes by Mortgage Status in New Braunfels
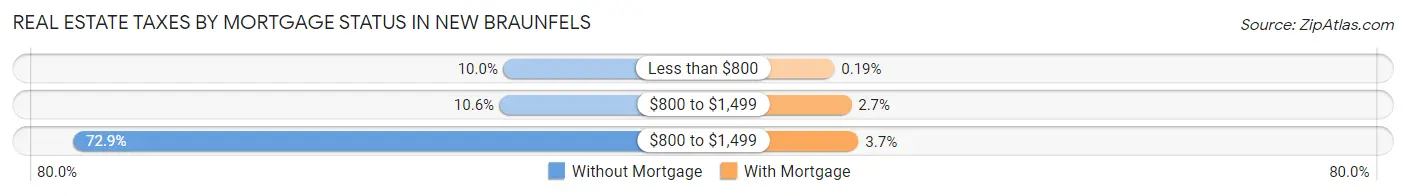
| Property Taxes | Without Mortgage | With Mortgage |
| Less than $800 | 799 (10.0%) | 29 (0.2%) |
| $800 to $1,499 | 844 (10.5%) | 400 (2.7%) |
| $800 to $1,499 | 5,831 (72.9%) | 557 (3.7%) |
| Total | 7,997 (100.0%) | 15,023 (100.0%) |
Health & Disability in New Braunfels
Health Insurance Coverage by Age in New Braunfels
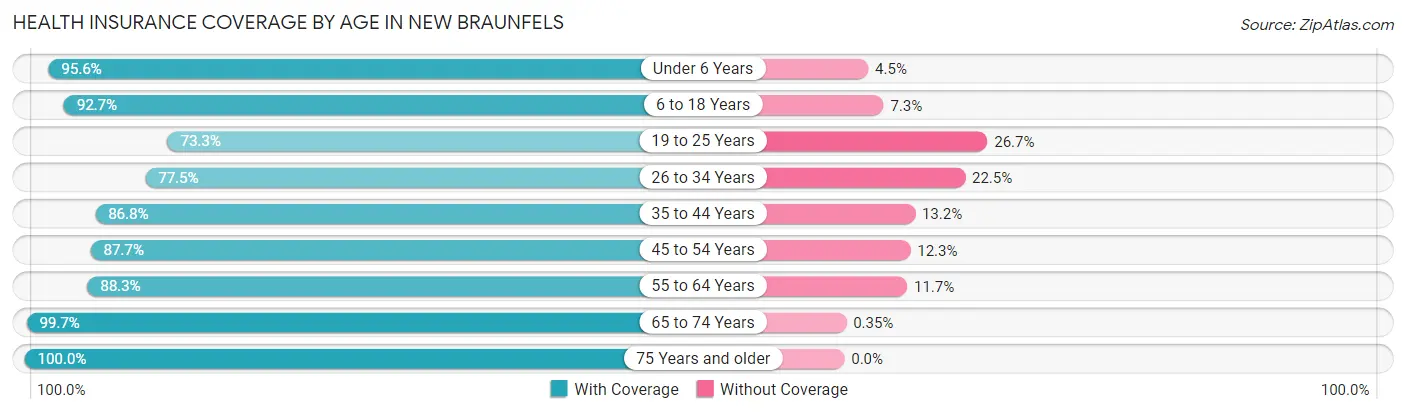
| Age Bracket | With Coverage | Without Coverage |
| Under 6 Years | 6,679 (95.6%) | 311 (4.4%) |
| 6 to 18 Years | 15,379 (92.7%) | 1,212 (7.3%) |
| 19 to 25 Years | 6,421 (73.3%) | 2,335 (26.7%) |
| 26 to 34 Years | 9,974 (77.5%) | 2,898 (22.5%) |
| 35 to 44 Years | 11,242 (86.8%) | 1,707 (13.2%) |
| 45 to 54 Years | 10,177 (87.7%) | 1,428 (12.3%) |
| 55 to 64 Years | 8,541 (88.3%) | 1,132 (11.7%) |
| 65 to 74 Years | 7,301 (99.7%) | 26 (0.4%) |
| 75 Years and older | 5,134 (100.0%) | 0 (0.0%) |
| Total | 80,848 (88.0%) | 11,049 (12.0%) |
Health Insurance Coverage by Citizenship Status in New Braunfels
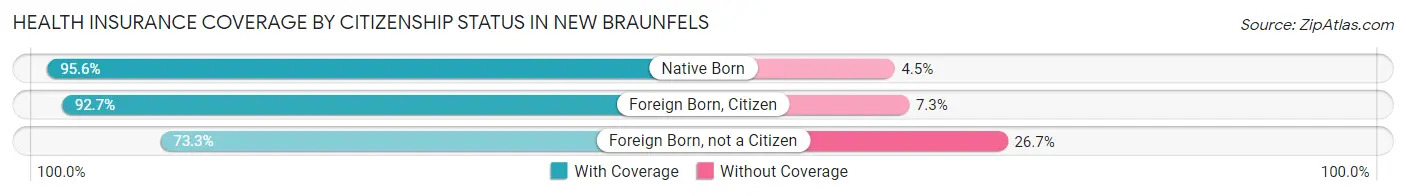
| Citizenship Status | With Coverage | Without Coverage |
| Native Born | 6,679 (95.6%) | 311 (4.4%) |
| Foreign Born, Citizen | 15,379 (92.7%) | 1,212 (7.3%) |
| Foreign Born, not a Citizen | 6,421 (73.3%) | 2,335 (26.7%) |
Health Insurance Coverage by Household Income in New Braunfels
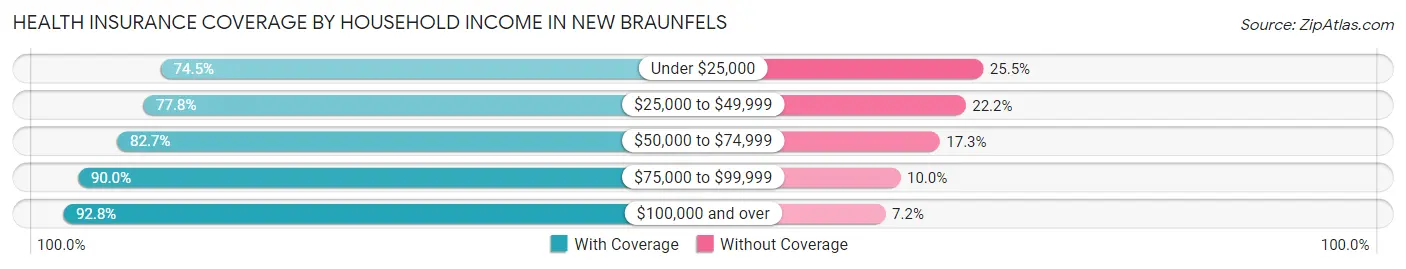
| Household Income | With Coverage | Without Coverage |
| Under $25,000 | 3,945 (74.5%) | 1,350 (25.5%) |
| $25,000 to $49,999 | 7,783 (77.8%) | 2,221 (22.2%) |
| $50,000 to $74,999 | 12,352 (82.7%) | 2,592 (17.3%) |
| $75,000 to $99,999 | 14,370 (90.0%) | 1,592 (10.0%) |
| $100,000 and over | 42,164 (92.8%) | 3,266 (7.2%) |
Public vs Private Health Insurance Coverage by Age in New Braunfels
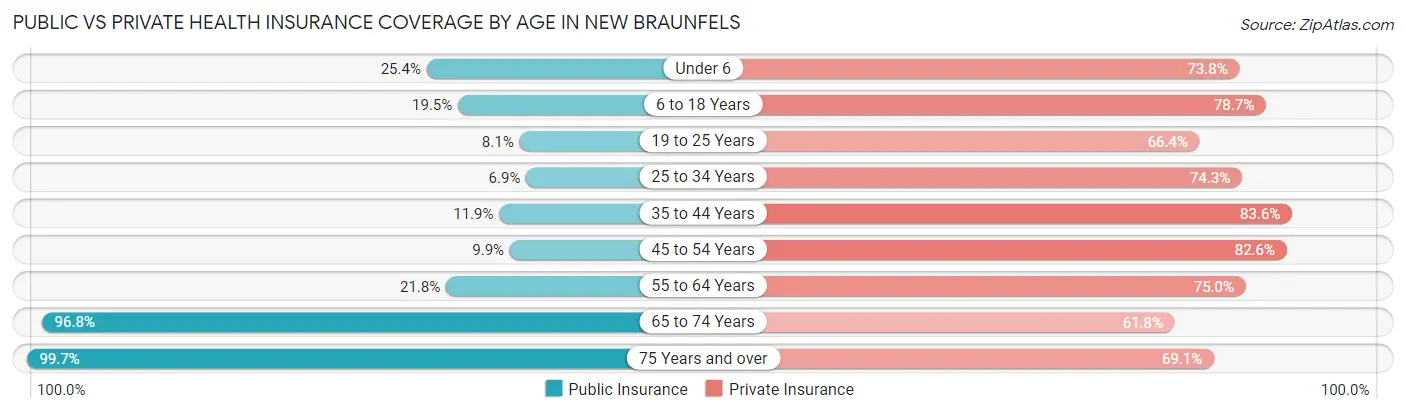
| Age Bracket | Public Insurance | Private Insurance |
| Under 6 | 1,773 (25.4%) | 5,159 (73.8%) |
| 6 to 18 Years | 3,242 (19.5%) | 13,062 (78.7%) |
| 19 to 25 Years | 713 (8.1%) | 5,817 (66.4%) |
| 25 to 34 Years | 887 (6.9%) | 9,564 (74.3%) |
| 35 to 44 Years | 1,539 (11.9%) | 10,824 (83.6%) |
| 45 to 54 Years | 1,151 (9.9%) | 9,585 (82.6%) |
| 55 to 64 Years | 2,106 (21.8%) | 7,253 (75.0%) |
| 65 to 74 Years | 7,095 (96.8%) | 4,529 (61.8%) |
| 75 Years and over | 5,116 (99.7%) | 3,547 (69.1%) |
| Total | 23,622 (25.7%) | 69,340 (75.4%) |
Disability Status by Sex by Age in New Braunfels
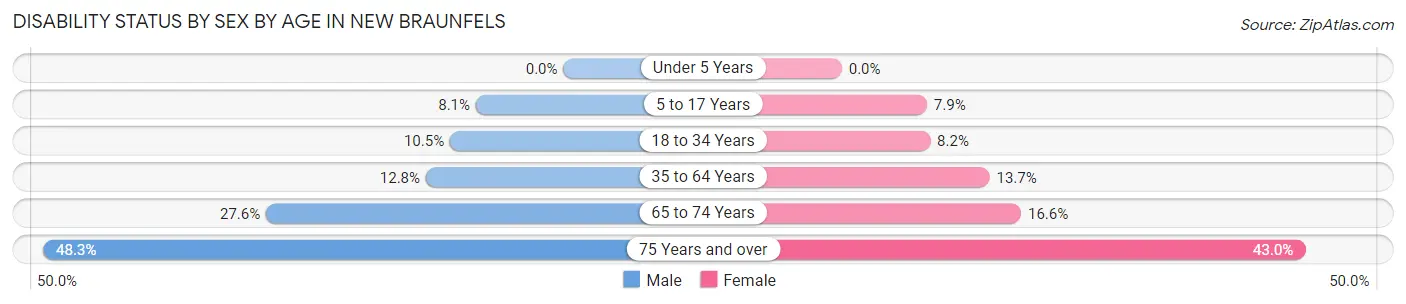
| Age Bracket | Male | Female |
| Under 5 Years | 0 (0.0%) | 0 (0.0%) |
| 5 to 17 Years | 710 (8.1%) | 605 (7.9%) |
| 18 to 34 Years | 1,222 (10.5%) | 924 (8.2%) |
| 35 to 64 Years | 2,203 (12.8%) | 2,325 (13.7%) |
| 65 to 74 Years | 929 (27.6%) | 659 (16.6%) |
| 75 Years and over | 926 (48.3%) | 1,383 (43.0%) |
Disability Class by Sex by Age in New Braunfels
Disability Class: Hearing Difficulty
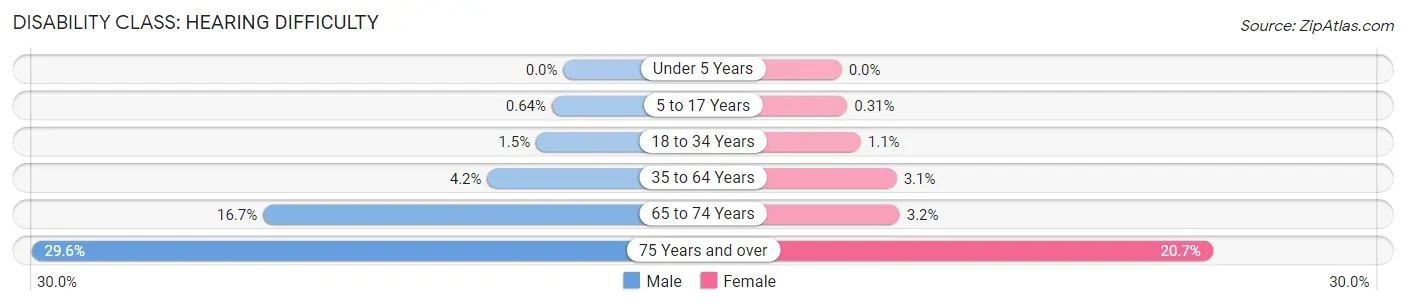
| Age Bracket | Male | Female |
| Under 5 Years | 0 (0.0%) | 0 (0.0%) |
| 5 to 17 Years | 56 (0.6%) | 24 (0.3%) |
| 18 to 34 Years | 177 (1.5%) | 120 (1.1%) |
| 35 to 64 Years | 730 (4.2%) | 519 (3.1%) |
| 65 to 74 Years | 563 (16.7%) | 128 (3.2%) |
| 75 Years and over | 568 (29.6%) | 664 (20.6%) |
Disability Class: Vision Difficulty
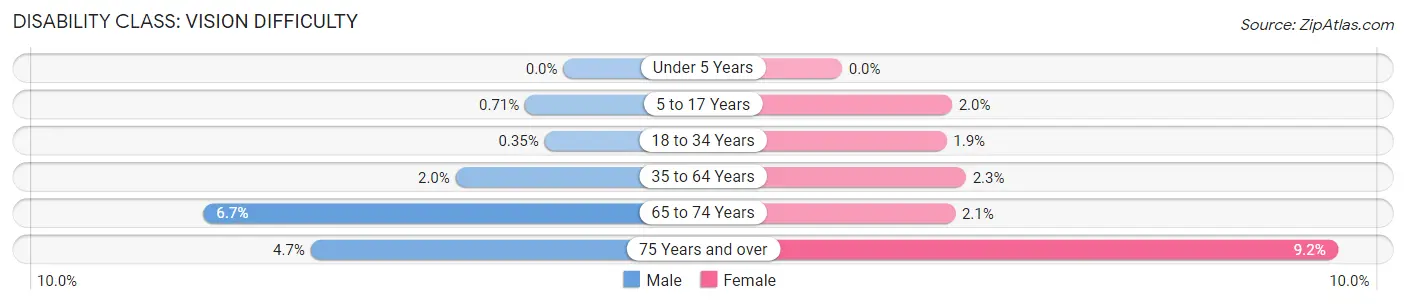
| Age Bracket | Male | Female |
| Under 5 Years | 0 (0.0%) | 0 (0.0%) |
| 5 to 17 Years | 62 (0.7%) | 156 (2.0%) |
| 18 to 34 Years | 41 (0.4%) | 219 (1.9%) |
| 35 to 64 Years | 345 (2.0%) | 390 (2.3%) |
| 65 to 74 Years | 225 (6.7%) | 83 (2.1%) |
| 75 Years and over | 90 (4.7%) | 296 (9.2%) |
Disability Class: Cognitive Difficulty
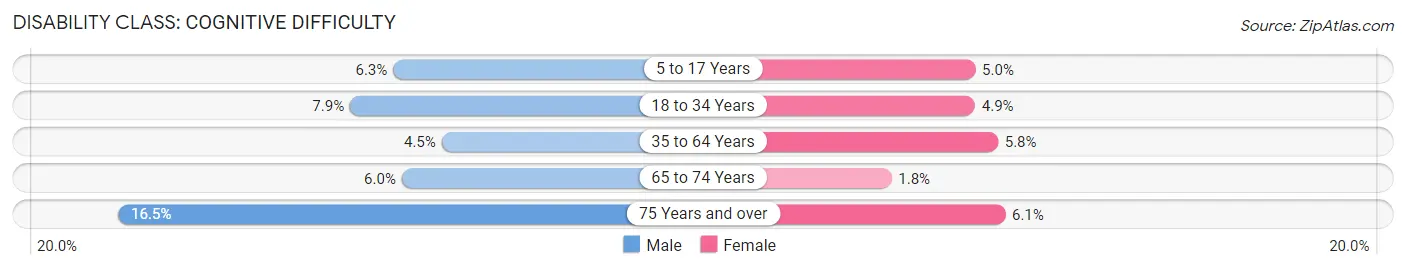
| Age Bracket | Male | Female |
| 5 to 17 Years | 552 (6.3%) | 379 (5.0%) |
| 18 to 34 Years | 920 (7.9%) | 557 (4.9%) |
| 35 to 64 Years | 781 (4.5%) | 981 (5.8%) |
| 65 to 74 Years | 202 (6.0%) | 73 (1.8%) |
| 75 Years and over | 317 (16.5%) | 195 (6.1%) |
Disability Class: Ambulatory Difficulty

| Age Bracket | Male | Female |
| 5 to 17 Years | 111 (1.3%) | 216 (2.8%) |
| 18 to 34 Years | 155 (1.3%) | 228 (2.0%) |
| 35 to 64 Years | 1,209 (7.0%) | 1,226 (7.2%) |
| 65 to 74 Years | 379 (11.3%) | 472 (11.9%) |
| 75 Years and over | 491 (25.6%) | 841 (26.2%) |
Disability Class: Self-Care Difficulty
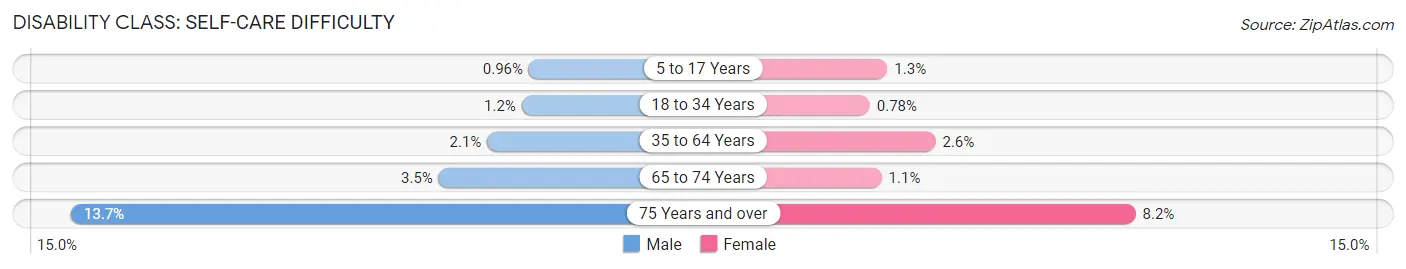
| Age Bracket | Male | Female |
| 5 to 17 Years | 84 (1.0%) | 97 (1.3%) |
| 18 to 34 Years | 135 (1.2%) | 88 (0.8%) |
| 35 to 64 Years | 366 (2.1%) | 442 (2.6%) |
| 65 to 74 Years | 117 (3.5%) | 44 (1.1%) |
| 75 Years and over | 263 (13.7%) | 263 (8.2%) |
Technology Access in New Braunfels
Computing Device Access in New Braunfels
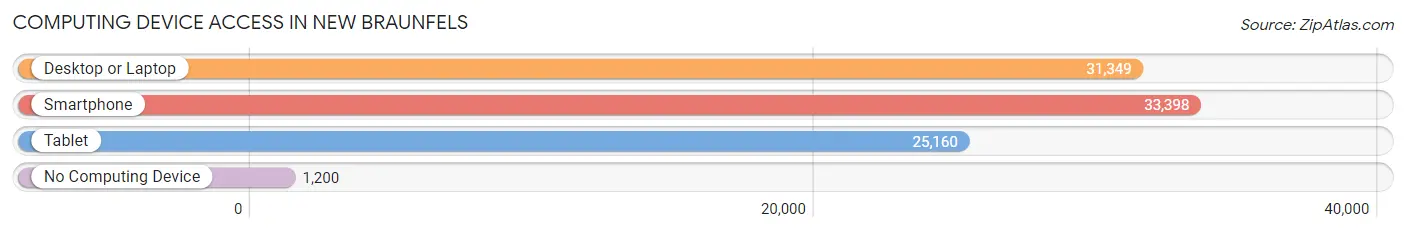
| Device Type | # Households | % Households |
| Desktop or Laptop | 31,349 | 86.9% |
| Smartphone | 33,398 | 92.6% |
| Tablet | 25,160 | 69.8% |
| No Computing Device | 1,200 | 3.3% |
| Total | 36,068 | 100.0% |
Internet Access in New Braunfels
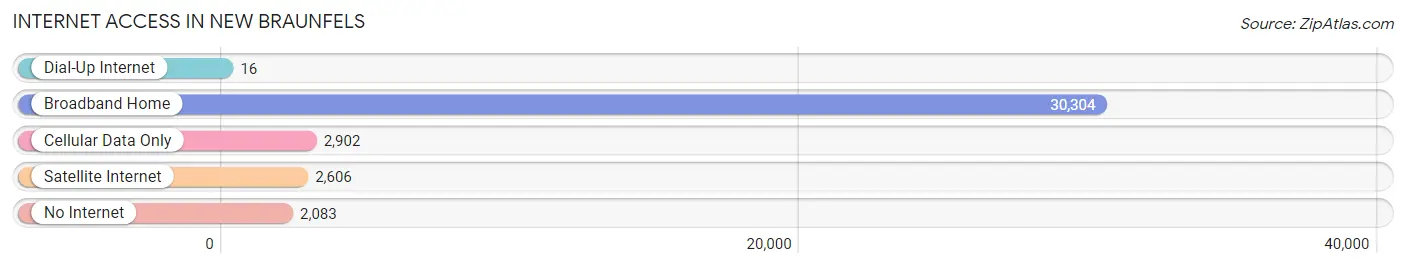
| Internet Type | # Households | % Households |
| Dial-Up Internet | 16 | 0.0% |
| Broadband Home | 30,304 | 84.0% |
| Cellular Data Only | 2,902 | 8.1% |
| Satellite Internet | 2,606 | 7.2% |
| No Internet | 2,083 | 5.8% |
| Total | 36,068 | 100.0% |
New Braunfels Summary
New Braunfels, Texas is a city located in Comal County, Texas, United States. It is situated on the banks of the Comal and Guadalupe Rivers, and is part of the Greater San Antonio metropolitan area. The city has a population of approximately 70,543, making it the second-largest city in the county.
History
New Braunfels was founded in 1845 by German settlers, led by Prince Carl of Solms-Braunfels. The settlers named the city after Braunfels, Germany, the ancestral home of the prince. The city was incorporated in 1852, and has since grown to become a major tourist destination in the region.
Geography
New Braunfels is located in south-central Texas, approximately 30 miles northeast of San Antonio. It is situated on the banks of the Comal and Guadalupe Rivers, and is part of the Greater San Antonio metropolitan area. The city has a total area of 28.2 square miles, of which 27.9 square miles is land and 0.3 square miles is water.
Economy
New Braunfels has a diverse economy, with a variety of industries represented. The city is home to several large employers, including Schlitterbahn Waterpark and Resort, Gruene Historic District, and the New Braunfels Independent School District. Other major employers include the Comal County government, the New Braunfels Utilities, and the New Braunfels Regional Medical Center.
Demographics
As of the 2010 census, New Braunfels had a population of 57,740. The racial makeup of the city was 79.2% White, 4.3% African American, 0.7% Native American, 1.3% Asian, 0.1% Pacific Islander, 11.7% from other races, and 2.7% from two or more races. Hispanic or Latino of any race were 33.2% of the population.
The median income for a household in the city was $50,943, and the median income for a family was $60,943. The per capita income for the city was $25,943. About 11.7% of families and 14.7% of the population were below the poverty line, including 19.2% of those under age 18 and 8.7% of those age 65 or over.
New Braunfels is a vibrant and growing city, with a diverse population and a strong economy. The city is home to a variety of attractions, including Schlitterbahn Waterpark and Resort, Gruene Historic District, and the New Braunfels Independent School District. With its rich history, beautiful geography, and strong economy, New Braunfels is an ideal place to live and work.
Common Questions
What is Per Capita Income in New Braunfels?
Per Capita income in New Braunfels is $41,277.
What is the Median Family Income in New Braunfels?
Median Family Income in New Braunfels is $100,761.
What is the Median Household income in New Braunfels?
Median Household Income in New Braunfels is $85,827.
What is Income or Wage Gap in New Braunfels?
Income or Wage Gap in New Braunfels is 24.0%.
Women in New Braunfels earn 76.0 cents for every dollar earned by a man.
What is Family Income Deficit in New Braunfels?
Family Income Deficit in New Braunfels is $9,125.
Families that are below poverty line in New Braunfels earn $9,125 less on average than the poverty threshold level.
What is Inequality or Gini Index in New Braunfels?
Inequality or Gini Index in New Braunfels is 0.42.
What is the Total Population of New Braunfels?
Total Population of New Braunfels is 92,993.
What is the Total Male Population of New Braunfels?
Total Male Population of New Braunfels is 46,748.
What is the Total Female Population of New Braunfels?
Total Female Population of New Braunfels is 46,245.
What is the Ratio of Males per 100 Females in New Braunfels?
There are 101.09 Males per 100 Females in New Braunfels.
What is the Ratio of Females per 100 Males in New Braunfels?
There are 98.92 Females per 100 Males in New Braunfels.
What is the Median Population Age in New Braunfels?
Median Population Age in New Braunfels is 36.1 Years.
What is the Average Family Size in New Braunfels
Average Family Size in New Braunfels is 3.1 People.
What is the Average Household Size in New Braunfels
Average Household Size in New Braunfels is 2.5 People.
How Large is the Labor Force in New Braunfels?
There are 48,878 People in the Labor Forcein in New Braunfels.
What is the Percentage of People in the Labor Force in New Braunfels?
66.8% of People are in the Labor Force in New Braunfels.
What is the Unemployment Rate in New Braunfels?
Unemployment Rate in New Braunfels is 3.8%.