Dean, TX Map & Demographics
Dean Map
Dean Overview
$36,135
PER CAPITA INCOME
$76,250
AVG FAMILY INCOME
$49,931
AVG HOUSEHOLD INCOME
21.3%
WAGE / INCOME GAP [ % ]
78.7¢/ $1
WAGE / INCOME GAP [ $ ]
$9,238
FAMILY INCOME DEFICIT
0.41
INEQUALITY / GINI INDEX
453
TOTAL POPULATION
211
MALE POPULATION
242
FEMALE POPULATION
87.19
MALES / 100 FEMALES
114.69
FEMALES / 100 MALES
43.7
MEDIAN AGE
2.6
AVG FAMILY SIZE
2.3
AVG HOUSEHOLD SIZE
198
LABOR FORCE [ PEOPLE ]
51.3%
PERCENT IN LABOR FORCE
1.0%
UNEMPLOYMENT RATE
Dean Area Codes
Income in Dean
Income Overview in Dean
Per Capita Income in Dean is $36,135, while median incomes of families and households are $76,250 and $49,931 respectively.
| Characteristic | Number | Measure |
| Per Capita Income | 453 | $36,135 |
| Median Family Income | 153 | $76,250 |
| Mean Family Income | 153 | $92,289 |
| Median Household Income | 197 | $49,931 |
| Mean Household Income | 197 | $80,393 |
| Income Deficit | 153 | $9,238 |
| Wage / Income Gap (%) | 453 | 21.26% |
| Wage / Income Gap ($) | 453 | 78.74¢ per $1 |
| Gini / Inequality Index | 453 | 0.41 |
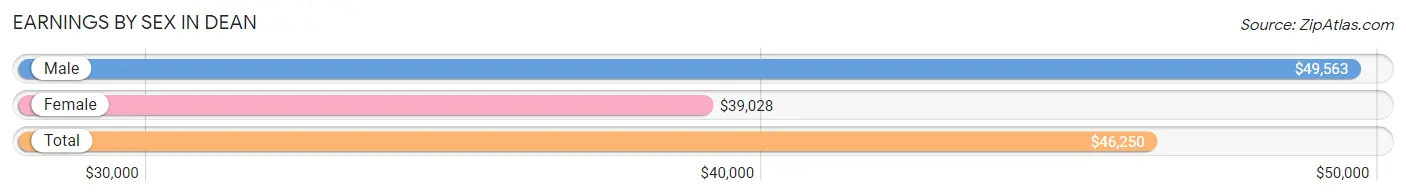
Earnings by Sex in Dean
Average Earnings in Dean are $46,250, $49,563 for men and $39,028 for women, a difference of 21.3%.
| Sex | Number | Average Earnings |
| Male | 121 (60.5%) | $49,563 |
| Female | 79 (39.5%) | $39,028 |
| Total | 200 (100.0%) | $46,250 |
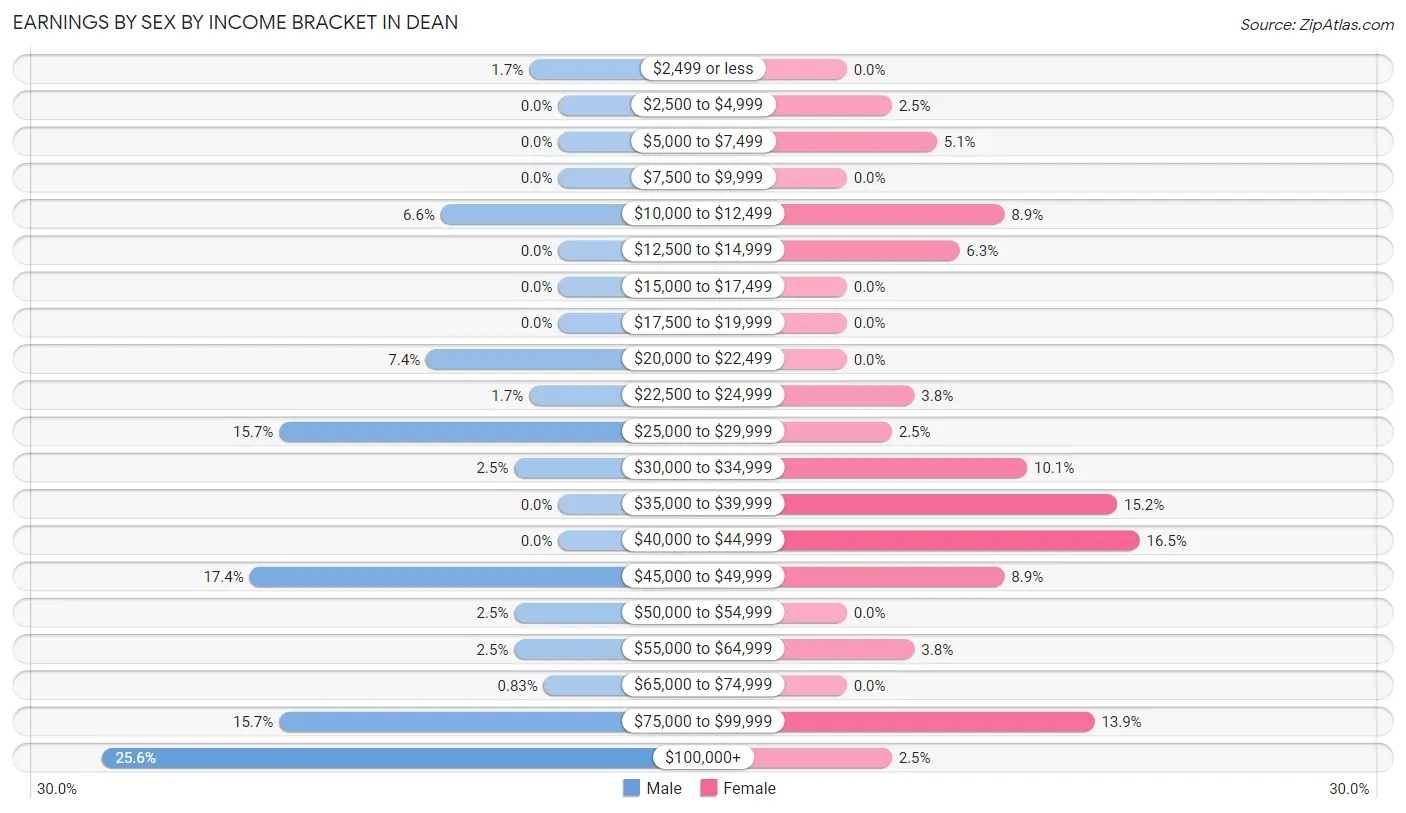
Earnings by Sex by Income Bracket in Dean
The most common earnings brackets in Dean are $100,000+ for men (31 | 25.6%) and $40,000 to $44,999 for women (13 | 16.5%).
| Income | Male | Female |
| $2,499 or less | 2 (1.7%) | 0 (0.0%) |
| $2,500 to $4,999 | 0 (0.0%) | 2 (2.5%) |
| $5,000 to $7,499 | 0 (0.0%) | 4 (5.1%) |
| $7,500 to $9,999 | 0 (0.0%) | 0 (0.0%) |
| $10,000 to $12,499 | 8 (6.6%) | 7 (8.9%) |
| $12,500 to $14,999 | 0 (0.0%) | 5 (6.3%) |
| $15,000 to $17,499 | 0 (0.0%) | 0 (0.0%) |
| $17,500 to $19,999 | 0 (0.0%) | 0 (0.0%) |
| $20,000 to $22,499 | 9 (7.4%) | 0 (0.0%) |
| $22,500 to $24,999 | 2 (1.7%) | 3 (3.8%) |
| $25,000 to $29,999 | 19 (15.7%) | 2 (2.5%) |
| $30,000 to $34,999 | 3 (2.5%) | 8 (10.1%) |
| $35,000 to $39,999 | 0 (0.0%) | 12 (15.2%) |
| $40,000 to $44,999 | 0 (0.0%) | 13 (16.5%) |
| $45,000 to $49,999 | 21 (17.4%) | 7 (8.9%) |
| $50,000 to $54,999 | 3 (2.5%) | 0 (0.0%) |
| $55,000 to $64,999 | 3 (2.5%) | 3 (3.8%) |
| $65,000 to $74,999 | 1 (0.8%) | 0 (0.0%) |
| $75,000 to $99,999 | 19 (15.7%) | 11 (13.9%) |
| $100,000+ | 31 (25.6%) | 2 (2.5%) |
| Total | 121 (100.0%) | 79 (100.0%) |
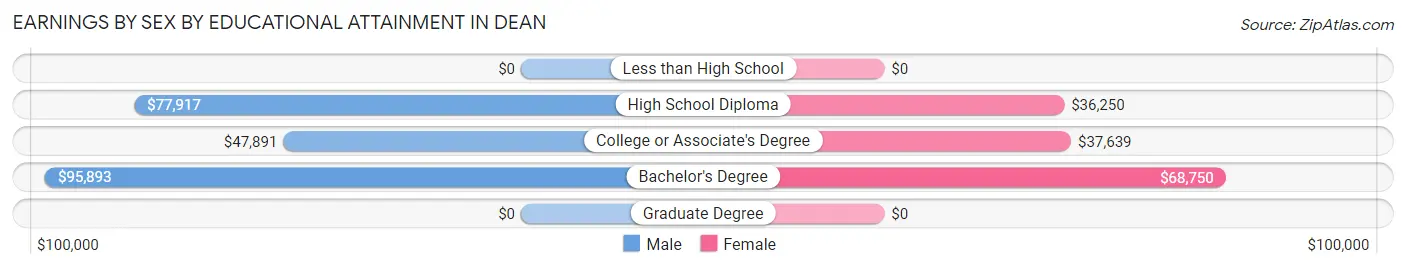
Earnings by Sex by Educational Attainment in Dean
Average earnings in Dean are $53,750 for men and $39,861 for women, a difference of 25.8%. Men with an educational attainment of bachelor's degree enjoy the highest average annual earnings of $95,893, while those with college or associate's degree education earn the least with $47,891. Women with an educational attainment of bachelor's degree earn the most with the average annual earnings of $68,750, while those with high school diploma education have the smallest earnings of $36,250.
| Educational Attainment | Male Income | Female Income |
| Less than High School | - | - |
| High School Diploma | $77,917 | $36,250 |
| College or Associate's Degree | $47,891 | $37,639 |
| Bachelor's Degree | $95,893 | $68,750 |
| Graduate Degree | - | - |
| Total | $53,750 | $39,861 |
Family Income in Dean
Family Income Brackets in Dean
According to the Dean family income data, there are 34 families falling into the $100,000 to $149,999 income range, which is the most common income bracket and makes up 22.2% of all families.
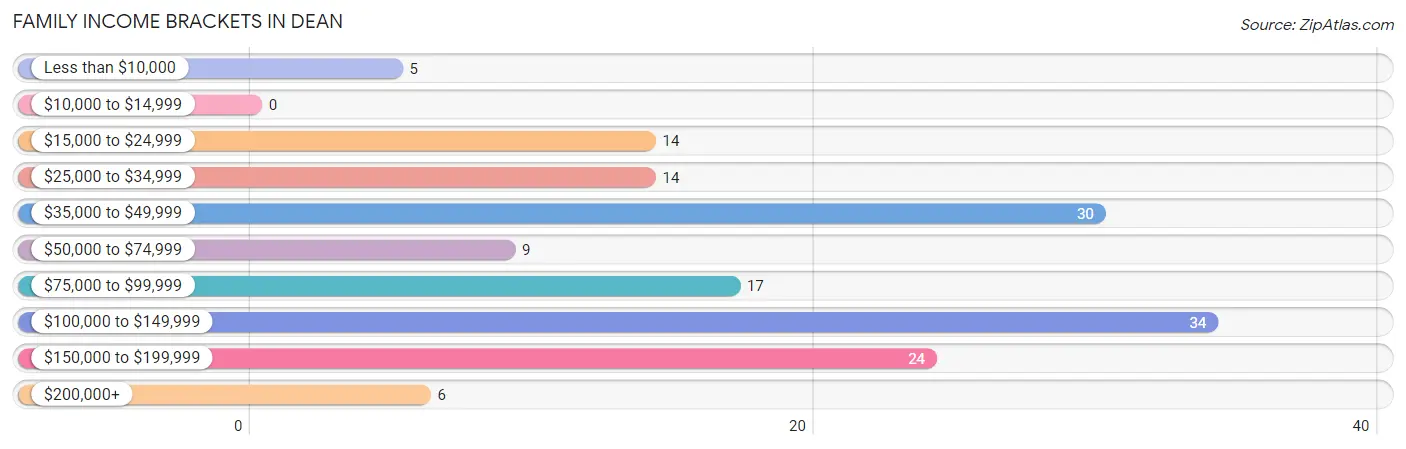
| Income Bracket | # Families | % Families |
| Less than $10,000 | 5 | 3.3% |
| $10,000 to $14,999 | 0 | 0.0% |
| $15,000 to $24,999 | 14 | 9.2% |
| $25,000 to $34,999 | 14 | 9.2% |
| $35,000 to $49,999 | 30 | 19.6% |
| $50,000 to $74,999 | 9 | 5.9% |
| $75,000 to $99,999 | 17 | 11.1% |
| $100,000 to $149,999 | 34 | 22.2% |
| $150,000 to $199,999 | 24 | 15.7% |
| $200,000+ | 6 | 3.9% |
Family Income by Famaliy Size in Dean
3-person families (23 | 15.0%) account for the highest median family income in Dean with $172,917 per family, while 3-person families (23 | 15.0%) have the highest median income of $57,639 per family member.
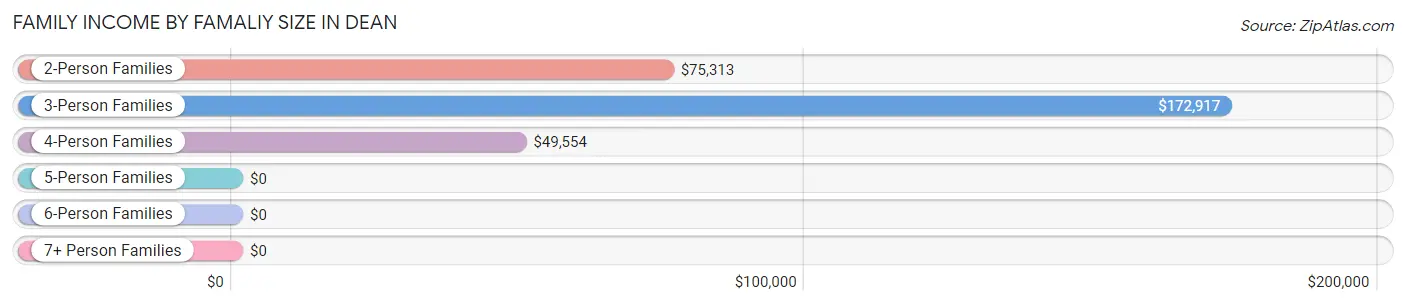
| Income Bracket | # Families | Median Income |
| 2-Person Families | 95 (62.1%) | $75,313 |
| 3-Person Families | 23 (15.0%) | $172,917 |
| 4-Person Families | 29 (19.0%) | $49,554 |
| 5-Person Families | 6 (3.9%) | $0 |
| 6-Person Families | 0 (0.0%) | $0 |
| 7+ Person Families | 0 (0.0%) | $0 |
| Total | 153 (100.0%) | $76,250 |
Family Income by Number of Earners in Dean
The median family income in Dean is $76,250, with families comprising 3+ earners (4) having the highest median family income of $187,500, while families with no earners (54) have the lowest median family income of $31,667, accounting for 2.6% and 35.3% of families, respectively.
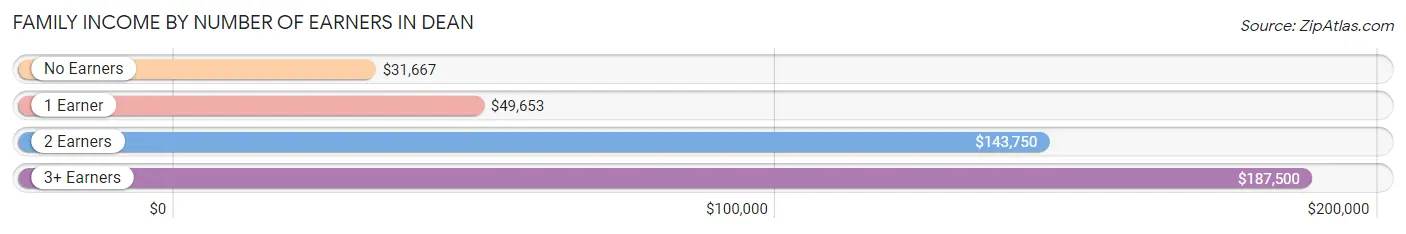
| Number of Earners | # Families | Median Income |
| No Earners | 54 (35.3%) | $31,667 |
| 1 Earner | 41 (26.8%) | $49,653 |
| 2 Earners | 54 (35.3%) | $143,750 |
| 3+ Earners | 4 (2.6%) | $187,500 |
| Total | 153 (100.0%) | $76,250 |
Household Income in Dean
Household Income Brackets in Dean
With 44 households falling in the category, the $35,000 to $49,999 income range is the most frequent in Dean, accounting for 22.3% of all households. In contrast, only 5 households (2.5%) fall into the less than $10,000 income bracket, making it the least populous group.
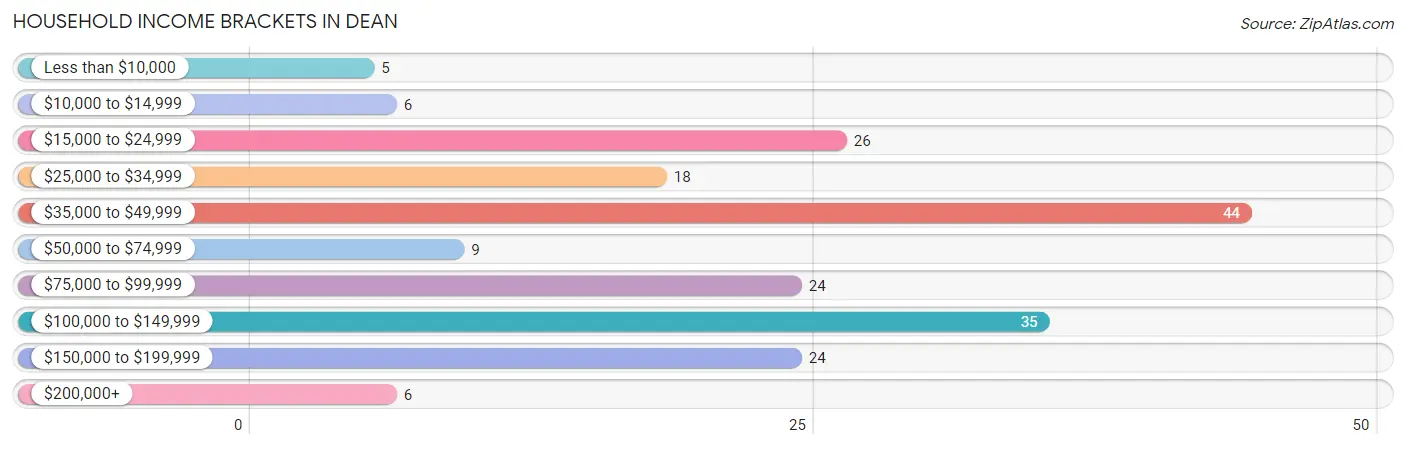
| Income Bracket | # Households | % Households |
| Less than $10,000 | 5 | 2.5% |
| $10,000 to $14,999 | 6 | 3.0% |
| $15,000 to $24,999 | 26 | 13.2% |
| $25,000 to $34,999 | 18 | 9.1% |
| $35,000 to $49,999 | 44 | 22.3% |
| $50,000 to $74,999 | 9 | 4.6% |
| $75,000 to $99,999 | 24 | 12.2% |
| $100,000 to $149,999 | 35 | 17.8% |
| $150,000 to $199,999 | 24 | 12.2% |
| $200,000+ | 6 | 3.0% |
Household Income by Householder Age in Dean
The median household income in Dean is $49,931, with the highest median household income of $113,750 found in the 25 to 44 years age bracket for the primary householder. A total of 63 households (32.0%) fall into this category.
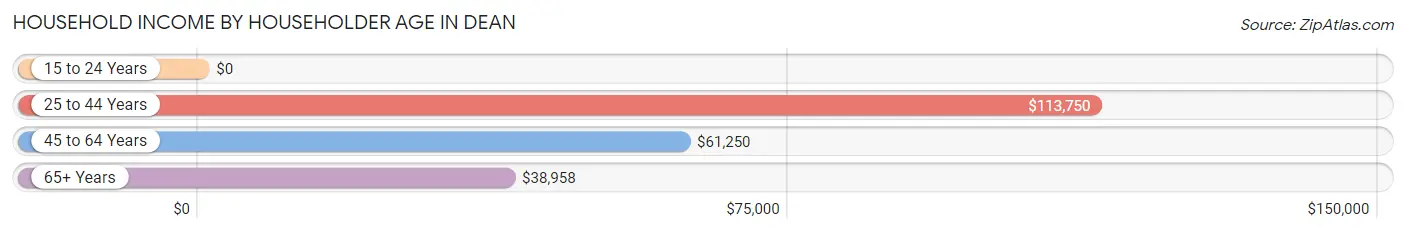
| Income Bracket | # Households | Median Income |
| 15 to 24 Years | 0 (0.0%) | $0 |
| 25 to 44 Years | 63 (32.0%) | $113,750 |
| 45 to 64 Years | 50 (25.4%) | $61,250 |
| 65+ Years | 84 (42.6%) | $38,958 |
| Total | 197 (100.0%) | $49,931 |
Poverty in Dean
Income Below Poverty by Sex and Age in Dean
With 4.7% poverty level for males and 5.4% for females among the residents of Dean, under 5 year old males and 6 to 11 year old females are the most vulnerable to poverty, with 1 males (14.3%) and 2 females (22.2%) in their respective age groups living below the poverty level.
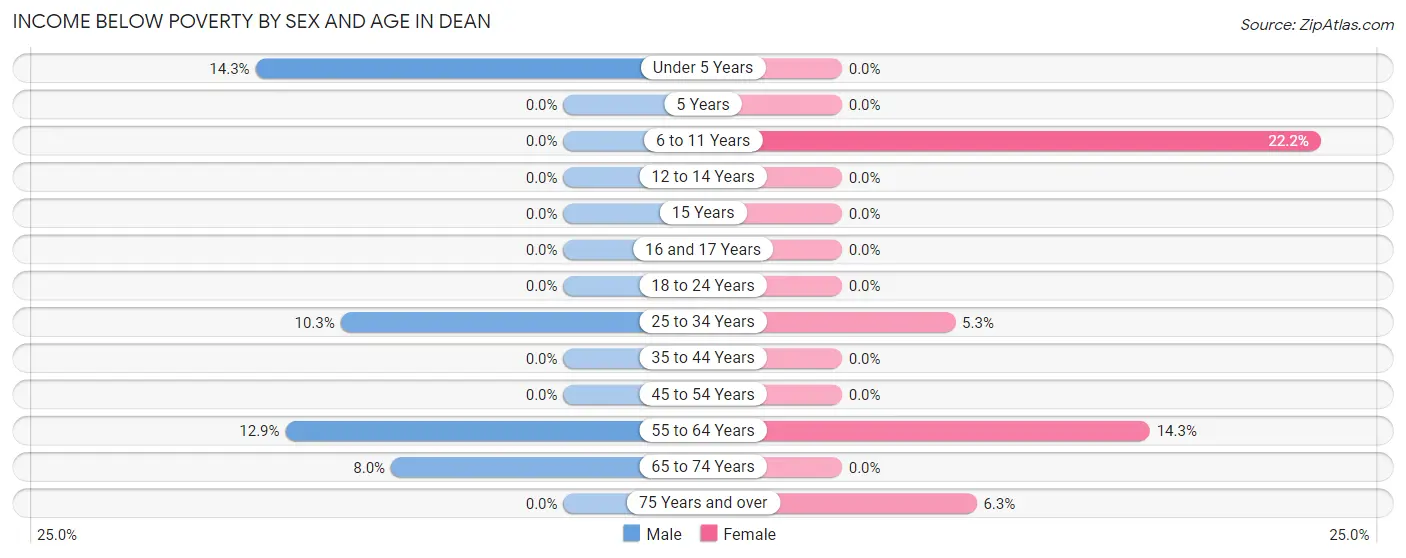
| Age Bracket | Male | Female |
| Under 5 Years | 1 (14.3%) | 0 (0.0%) |
| 5 Years | 0 (0.0%) | 0 (0.0%) |
| 6 to 11 Years | 0 (0.0%) | 2 (22.2%) |
| 12 to 14 Years | 0 (0.0%) | 0 (0.0%) |
| 15 Years | 0 (0.0%) | 0 (0.0%) |
| 16 and 17 Years | 0 (0.0%) | 0 (0.0%) |
| 18 to 24 Years | 0 (0.0%) | 0 (0.0%) |
| 25 to 34 Years | 3 (10.3%) | 3 (5.3%) |
| 35 to 44 Years | 0 (0.0%) | 0 (0.0%) |
| 45 to 54 Years | 0 (0.0%) | 0 (0.0%) |
| 55 to 64 Years | 4 (12.9%) | 4 (14.3%) |
| 65 to 74 Years | 2 (8.0%) | 0 (0.0%) |
| 75 Years and over | 0 (0.0%) | 4 (6.2%) |
| Total | 10 (4.7%) | 13 (5.4%) |
Income Above Poverty by Sex and Age in Dean
According to the poverty statistics in Dean, males aged 5 years and females aged under 5 years are the age groups that are most secure financially, with 100.0% of males and 100.0% of females in these age groups living above the poverty line.
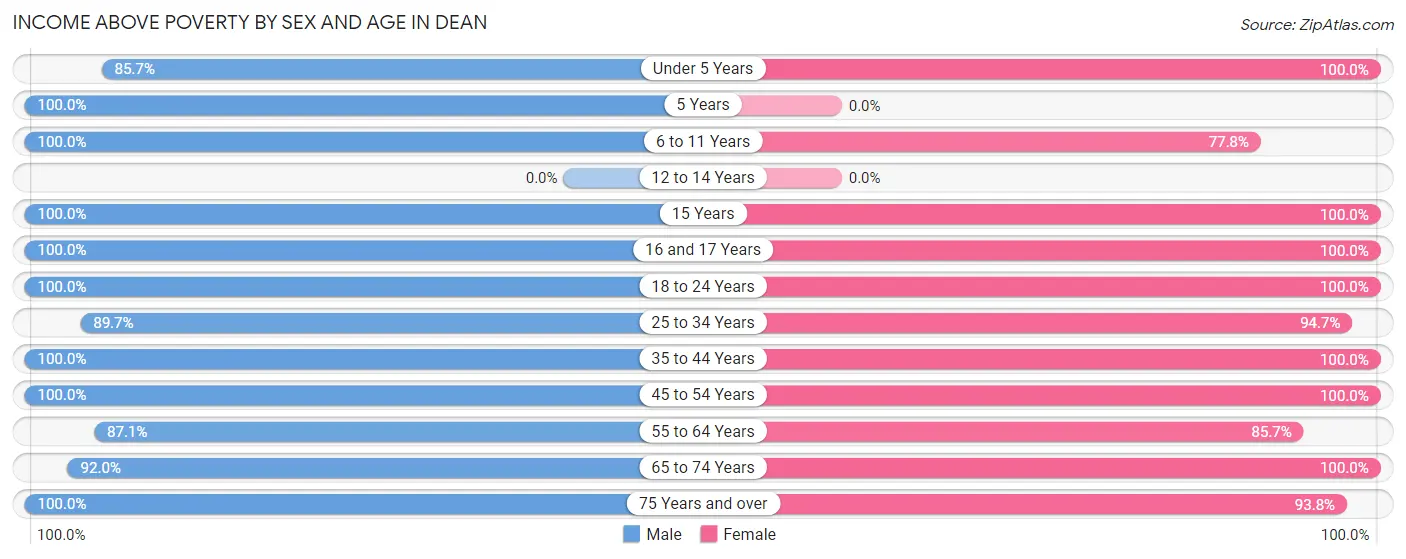
| Age Bracket | Male | Female |
| Under 5 Years | 6 (85.7%) | 25 (100.0%) |
| 5 Years | 3 (100.0%) | 0 (0.0%) |
| 6 to 11 Years | 19 (100.0%) | 7 (77.8%) |
| 12 to 14 Years | 0 (0.0%) | 0 (0.0%) |
| 15 Years | 2 (100.0%) | 2 (100.0%) |
| 16 and 17 Years | 4 (100.0%) | 3 (100.0%) |
| 18 to 24 Years | 6 (100.0%) | 6 (100.0%) |
| 25 to 34 Years | 26 (89.7%) | 54 (94.7%) |
| 35 to 44 Years | 38 (100.0%) | 24 (100.0%) |
| 45 to 54 Years | 24 (100.0%) | 13 (100.0%) |
| 55 to 64 Years | 27 (87.1%) | 24 (85.7%) |
| 65 to 74 Years | 23 (92.0%) | 11 (100.0%) |
| 75 Years and over | 23 (100.0%) | 60 (93.8%) |
| Total | 201 (95.3%) | 229 (94.6%) |
Income Below Poverty Among Married-Couple Families in Dean
The poverty statistics for married-couple families in Dean show that 5.3% or 8 of the total 150 families live below the poverty line. Families with 1 or 2 children have the highest poverty rate of 6.7%, comprising of 3 families. On the other hand, families with 3 or 4 children have the lowest poverty rate of 0.0%, which includes 0 families.
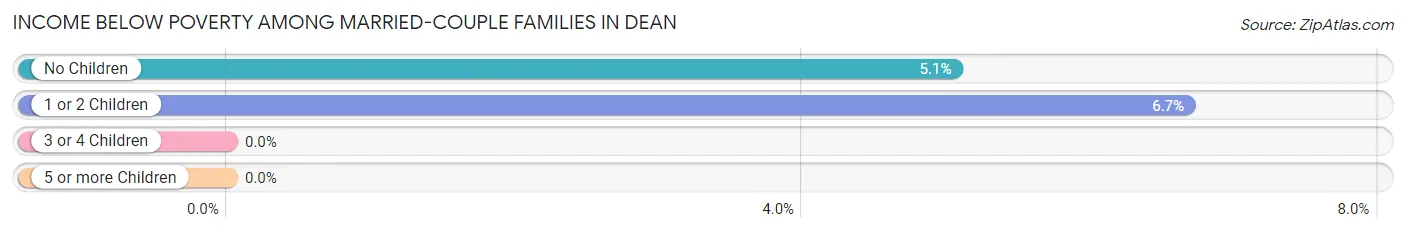
| Children | Above Poverty | Below Poverty |
| No Children | 94 (95.0%) | 5 (5.1%) |
| 1 or 2 Children | 42 (93.3%) | 3 (6.7%) |
| 3 or 4 Children | 6 (100.0%) | 0 (0.0%) |
| 5 or more Children | 0 (0.0%) | 0 (0.0%) |
| Total | 142 (94.7%) | 8 (5.3%) |
Income Below Poverty Among Single-Parent Households in Dean
| Children | Single Father | Single Mother |
| No Children | 0 (0.0%) | 0 (0.0%) |
| 1 or 2 Children | 0 (0.0%) | 0 (0.0%) |
| 3 or 4 Children | 0 (0.0%) | 0 (0.0%) |
| 5 or more Children | 0 (0.0%) | 0 (0.0%) |
| Total | 0 (0.0%) | 0 (0.0%) |
Income Below Poverty Among Married-Couple vs Single-Parent Households in Dean
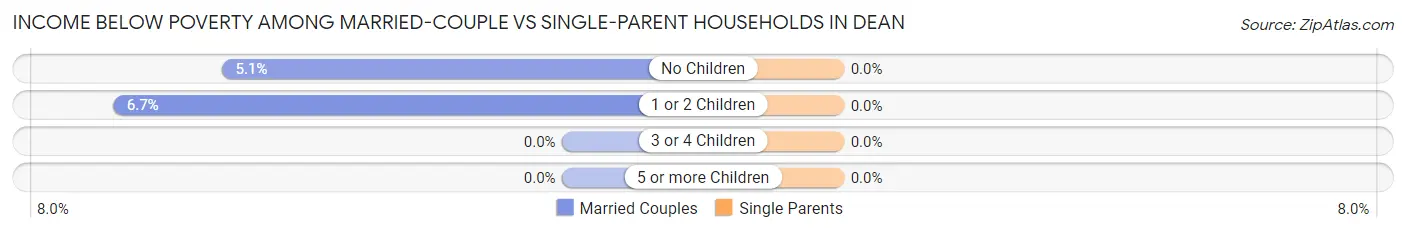
| Children | Married-Couple Families | Single-Parent Households |
| No Children | 5 (5.1%) | 0 (0.0%) |
| 1 or 2 Children | 3 (6.7%) | 0 (0.0%) |
| 3 or 4 Children | 0 (0.0%) | 0 (0.0%) |
| 5 or more Children | 0 (0.0%) | 0 (0.0%) |
| Total | 8 (5.3%) | 0 (0.0%) |
Race in Dean
The most populous races in Dean are White / Caucasian (388 | 85.7%), Hispanic or Latino (74 | 16.3%), and Two or more Races (63 | 13.9%).
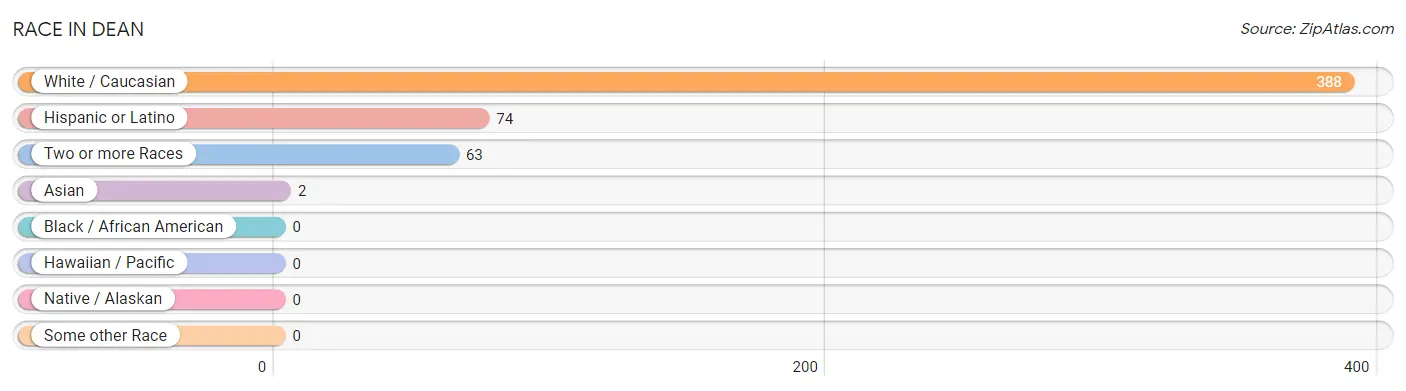
| Race | # Population | % Population |
| Asian | 2 | 0.4% |
| Black / African American | 0 | 0.0% |
| Hawaiian / Pacific | 0 | 0.0% |
| Hispanic or Latino | 74 | 16.3% |
| Native / Alaskan | 0 | 0.0% |
| White / Caucasian | 388 | 85.7% |
| Two or more Races | 63 | 13.9% |
| Some other Race | 0 | 0.0% |
| Total | 453 | 100.0% |
Ancestry in Dean
The most populous ancestries reported in Dean are American (56 | 12.4%), Central American (54 | 11.9%), Salvadoran (54 | 11.9%), English (32 | 7.1%), and Portuguese (28 | 6.2%), together accounting for 49.4% of all Dean residents.
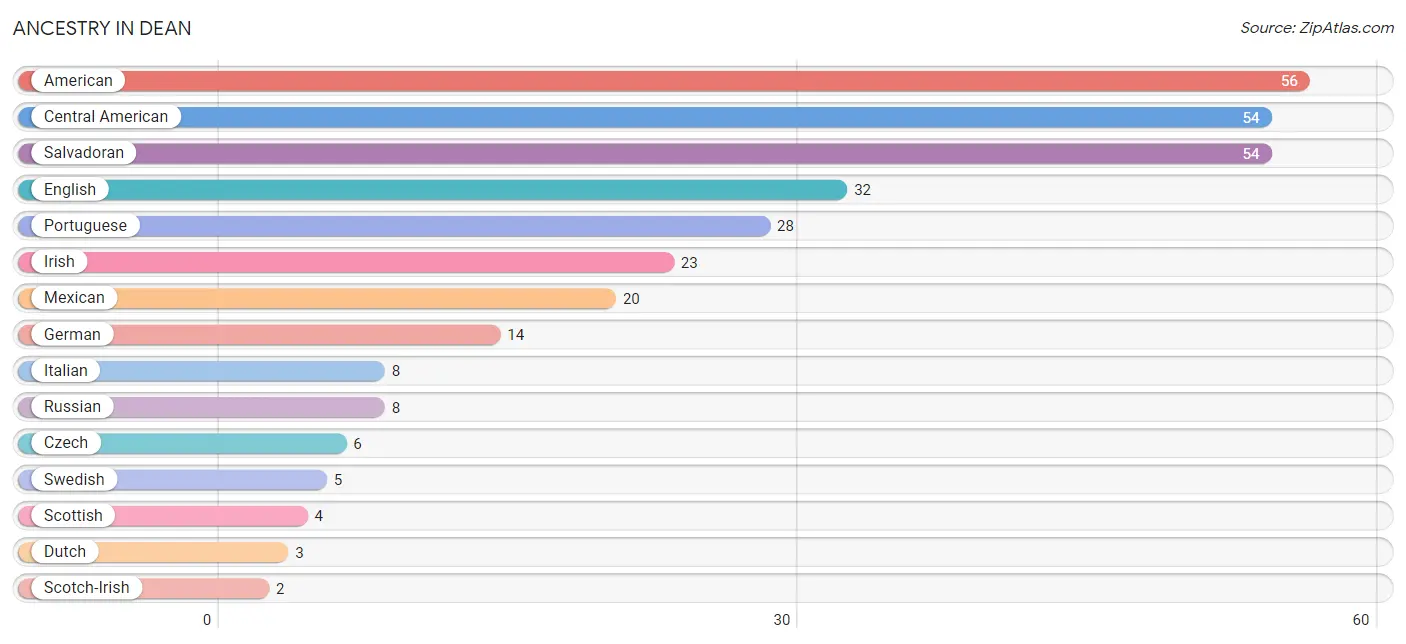
| Ancestry | # Population | % Population |
| American | 56 | 12.4% |
| Bhutanese | 1 | 0.2% |
| Celtic | 1 | 0.2% |
| Central American | 54 | 11.9% |
| Czech | 6 | 1.3% |
| Dutch | 3 | 0.7% |
| English | 32 | 7.1% |
| German | 14 | 3.1% |
| Irish | 23 | 5.1% |
| Italian | 8 | 1.8% |
| Mexican | 20 | 4.4% |
| Pakistani | 1 | 0.2% |
| Polish | 1 | 0.2% |
| Portuguese | 28 | 6.2% |
| Russian | 8 | 1.8% |
| Salvadoran | 54 | 11.9% |
| Scotch-Irish | 2 | 0.4% |
| Scottish | 4 | 0.9% |
| Swedish | 5 | 1.1% |
| Welsh | 1 | 0.2% | View All 20 Rows |
Immigrants in Dean
The most numerous immigrant groups reported in Dean came from Eastern Europe (8 | 1.8%), Europe (8 | 1.8%), Russia (8 | 1.8%), Latin America (7 | 1.5%), and Ecuador (4 | 0.9%), together accounting for 7.7% of all Dean residents.
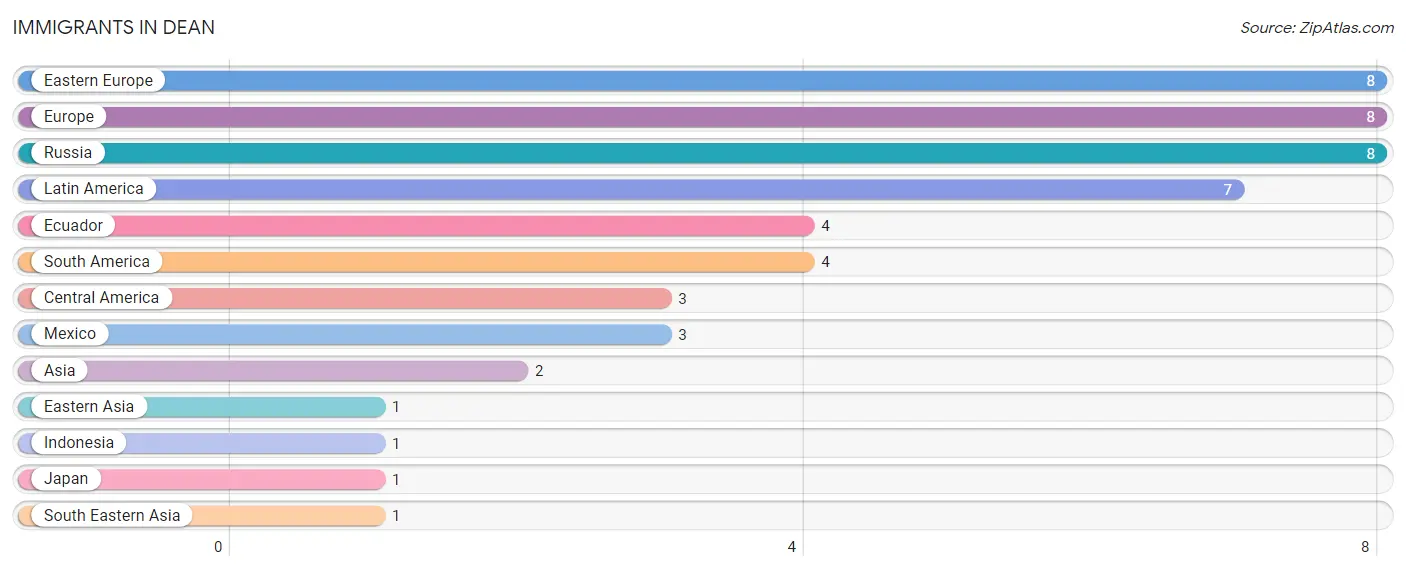
| Immigration Origin | # Population | % Population |
| Asia | 2 | 0.4% |
| Central America | 3 | 0.7% |
| Eastern Asia | 1 | 0.2% |
| Eastern Europe | 8 | 1.8% |
| Ecuador | 4 | 0.9% |
| Europe | 8 | 1.8% |
| Indonesia | 1 | 0.2% |
| Japan | 1 | 0.2% |
| Latin America | 7 | 1.5% |
| Mexico | 3 | 0.7% |
| Russia | 8 | 1.8% |
| South America | 4 | 0.9% |
| South Eastern Asia | 1 | 0.2% | View All 13 Rows |
Sex and Age in Dean
Sex and Age in Dean
The most populous age groups in Dean are 35 to 39 Years (33 | 15.6%) for men and 30 to 34 Years (43 | 17.8%) for women.
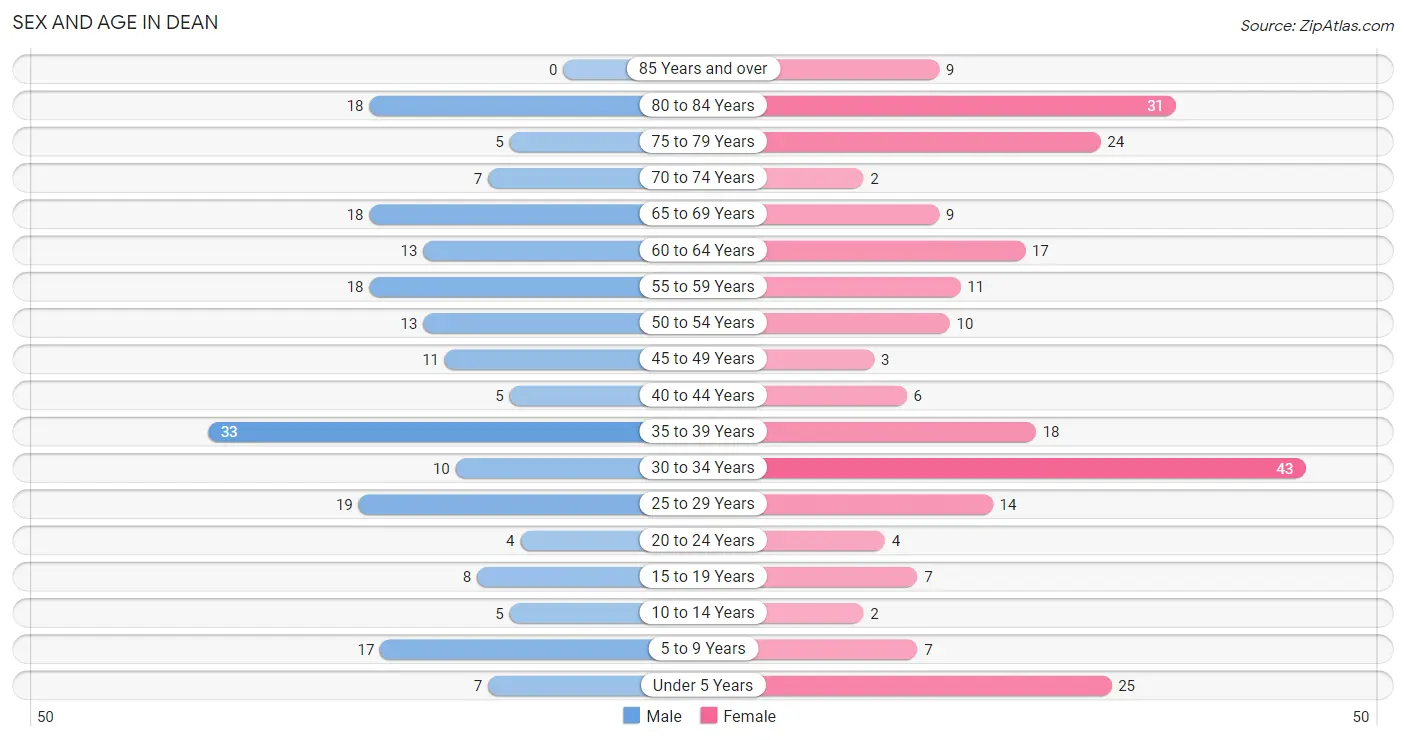
| Age Bracket | Male | Female |
| Under 5 Years | 7 (3.3%) | 25 (10.3%) |
| 5 to 9 Years | 17 (8.1%) | 7 (2.9%) |
| 10 to 14 Years | 5 (2.4%) | 2 (0.8%) |
| 15 to 19 Years | 8 (3.8%) | 7 (2.9%) |
| 20 to 24 Years | 4 (1.9%) | 4 (1.7%) |
| 25 to 29 Years | 19 (9.0%) | 14 (5.8%) |
| 30 to 34 Years | 10 (4.7%) | 43 (17.8%) |
| 35 to 39 Years | 33 (15.6%) | 18 (7.4%) |
| 40 to 44 Years | 5 (2.4%) | 6 (2.5%) |
| 45 to 49 Years | 11 (5.2%) | 3 (1.2%) |
| 50 to 54 Years | 13 (6.2%) | 10 (4.1%) |
| 55 to 59 Years | 18 (8.5%) | 11 (4.5%) |
| 60 to 64 Years | 13 (6.2%) | 17 (7.0%) |
| 65 to 69 Years | 18 (8.5%) | 9 (3.7%) |
| 70 to 74 Years | 7 (3.3%) | 2 (0.8%) |
| 75 to 79 Years | 5 (2.4%) | 24 (9.9%) |
| 80 to 84 Years | 18 (8.5%) | 31 (12.8%) |
| 85 Years and over | 0 (0.0%) | 9 (3.7%) |
| Total | 211 (100.0%) | 242 (100.0%) |
Families and Households in Dean
Median Family Size in Dean
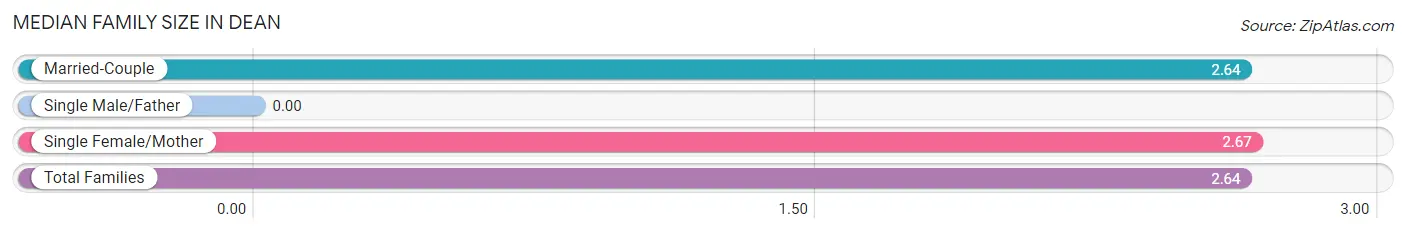
| Family Type | # Families | Family Size |
| Married-Couple | 150 (98.0%) | 2.64 |
| Single Male/Father | 0 (0.0%) | - |
| Single Female/Mother | 3 (2.0%) | 2.67 |
| Total Families | 153 (100.0%) | 2.64 |
Median Household Size in Dean
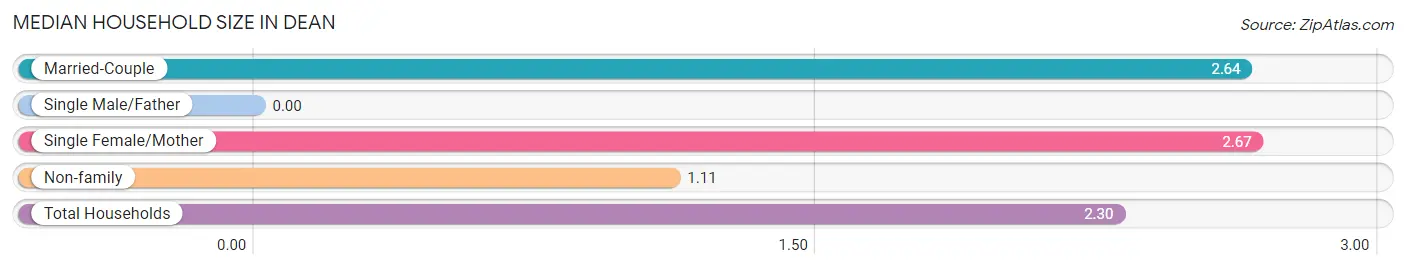
| Household Type | # Households | Household Size |
| Married-Couple | 150 (76.1%) | 2.64 |
| Single Male/Father | 0 (0.0%) | - |
| Single Female/Mother | 3 (1.5%) | 2.67 |
| Non-family | 44 (22.3%) | 1.11 |
| Total Households | 197 (100.0%) | 2.30 |
Household Size by Marriage Status in Dean
Out of a total of 197 households in Dean, 153 (77.7%) are family households, while 44 (22.3%) are nonfamily households. The most numerous type of family households are 2-person households, comprising 95, and the most common type of nonfamily households are 1-person households, comprising 38.
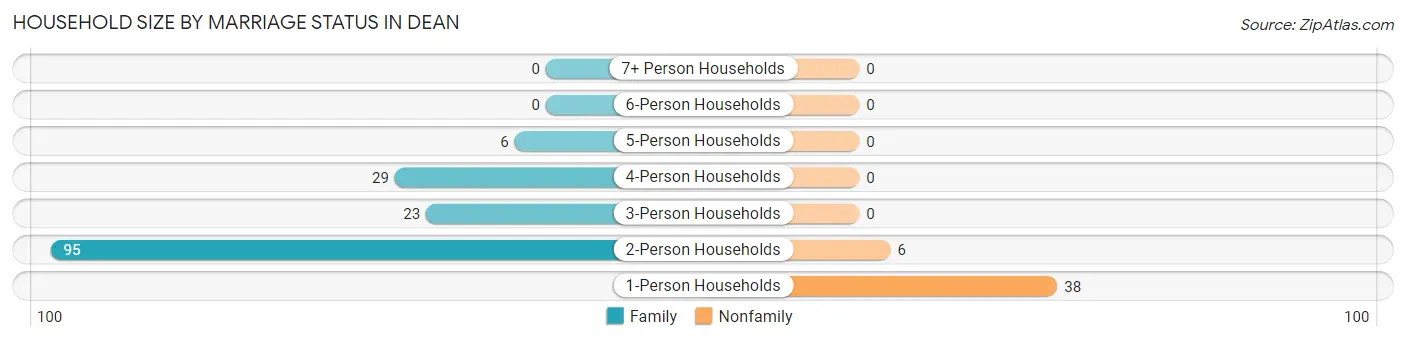
| Household Size | Family Households | Nonfamily Households |
| 1-Person Households | - | 38 (19.3%) |
| 2-Person Households | 95 (48.2%) | 6 (3.0%) |
| 3-Person Households | 23 (11.7%) | 0 (0.0%) |
| 4-Person Households | 29 (14.7%) | 0 (0.0%) |
| 5-Person Households | 6 (3.0%) | 0 (0.0%) |
| 6-Person Households | 0 (0.0%) | 0 (0.0%) |
| 7+ Person Households | 0 (0.0%) | 0 (0.0%) |
| Total | 153 (77.7%) | 44 (22.3%) |
Female Fertility in Dean
Fertility by Age in Dean
Average fertility rate in Dean is 11.0 births per 1,000 women. Women in the age bracket of 35 to 50 years have the highest fertility rate with 37.0 births per 1,000 women. Women in the age bracket of 35 to 50 years acount for 100.0% of all women with births.
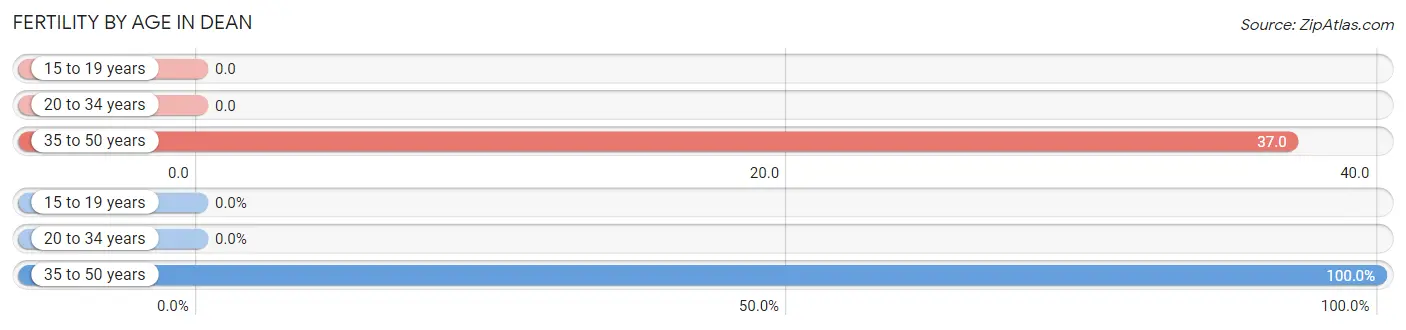
| Age Bracket | Women with Births | Births / 1,000 Women |
| 15 to 19 years | 0 (0.0%) | 0.0 |
| 20 to 34 years | 0 (0.0%) | 0.0 |
| 35 to 50 years | 1 (100.0%) | 37.0 |
| Total | 1 (100.0%) | 11.0 |
Fertility by Age by Marriage Status in Dean
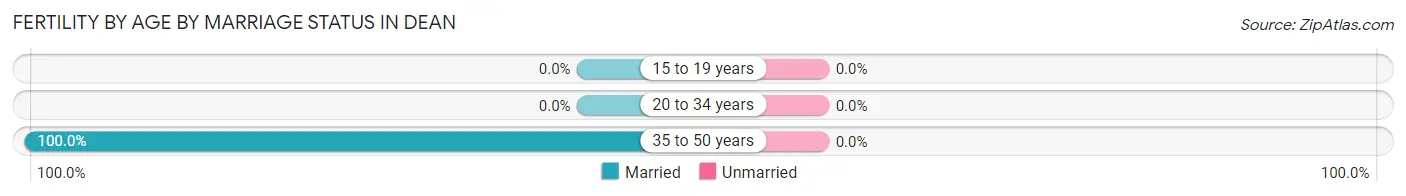
| Age Bracket | Married | Unmarried |
| 15 to 19 years | 0 (0.0%) | 0 (0.0%) |
| 20 to 34 years | 0 (0.0%) | 0 (0.0%) |
| 35 to 50 years | 1 (100.0%) | 0 (0.0%) |
| Total | 1 (100.0%) | 0 (0.0%) |
Fertility by Education in Dean
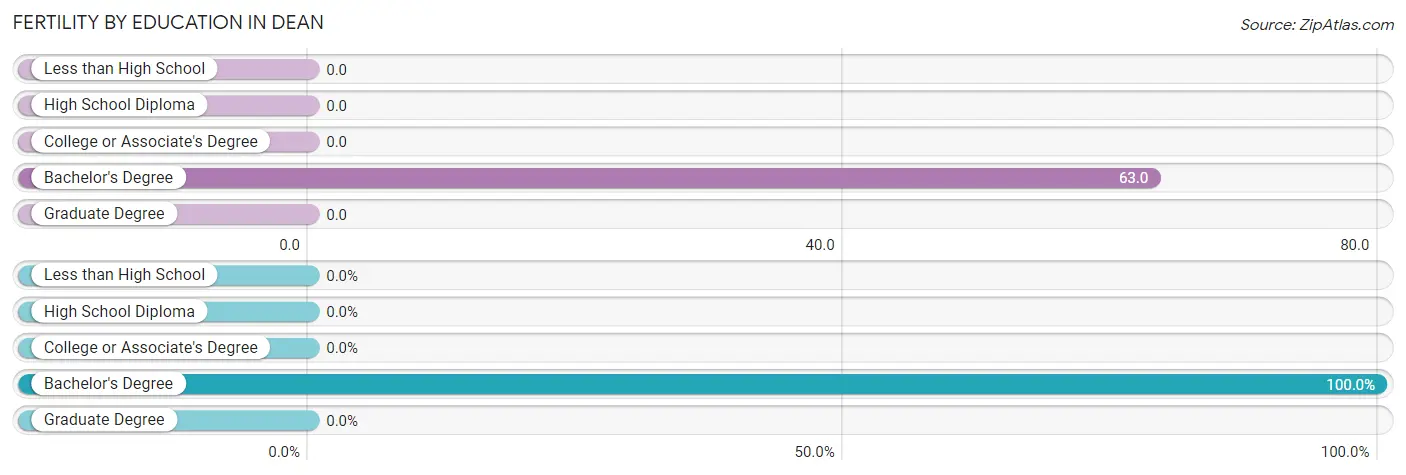
| Educational Attainment | Women with Births | Births / 1,000 Women |
| Less than High School | 0 (0.0%) | 0.0 |
| High School Diploma | 0 (0.0%) | 0.0 |
| College or Associate's Degree | 0 (0.0%) | 0.0 |
| Bachelor's Degree | 1 (100.0%) | 63.0 |
| Graduate Degree | 0 (0.0%) | 0.0 |
| Total | 1 (100.0%) | 11.0 |
Fertility by Education by Marriage Status in Dean
| Educational Attainment | Married | Unmarried |
| Less than High School | 0 (0.0%) | 0 (0.0%) |
| High School Diploma | 0 (0.0%) | 0 (0.0%) |
| College or Associate's Degree | 0 (0.0%) | 0 (0.0%) |
| Bachelor's Degree | 1 (100.0%) | 0 (0.0%) |
| Graduate Degree | 0 (0.0%) | 0 (0.0%) |
| Total | 1 (100.0%) | 0 (0.0%) |
Employment Characteristics in Dean
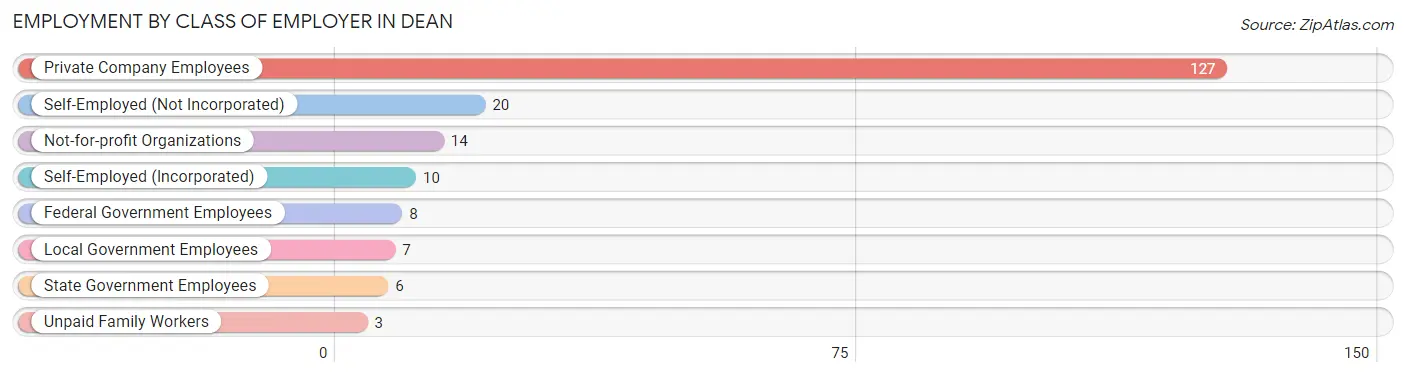
Employment by Class of Employer in Dean
Among the 195 employed individuals in Dean, private company employees (127 | 65.1%), self-employed (not incorporated) (20 | 10.3%), and not-for-profit organizations (14 | 7.2%) make up the most common classes of employment.
| Employer Class | # Employees | % Employees |
| Private Company Employees | 127 | 65.1% |
| Self-Employed (Incorporated) | 10 | 5.1% |
| Self-Employed (Not Incorporated) | 20 | 10.3% |
| Not-for-profit Organizations | 14 | 7.2% |
| Local Government Employees | 7 | 3.6% |
| State Government Employees | 6 | 3.1% |
| Federal Government Employees | 8 | 4.1% |
| Unpaid Family Workers | 3 | 1.5% |
| Total | 195 | 100.0% |
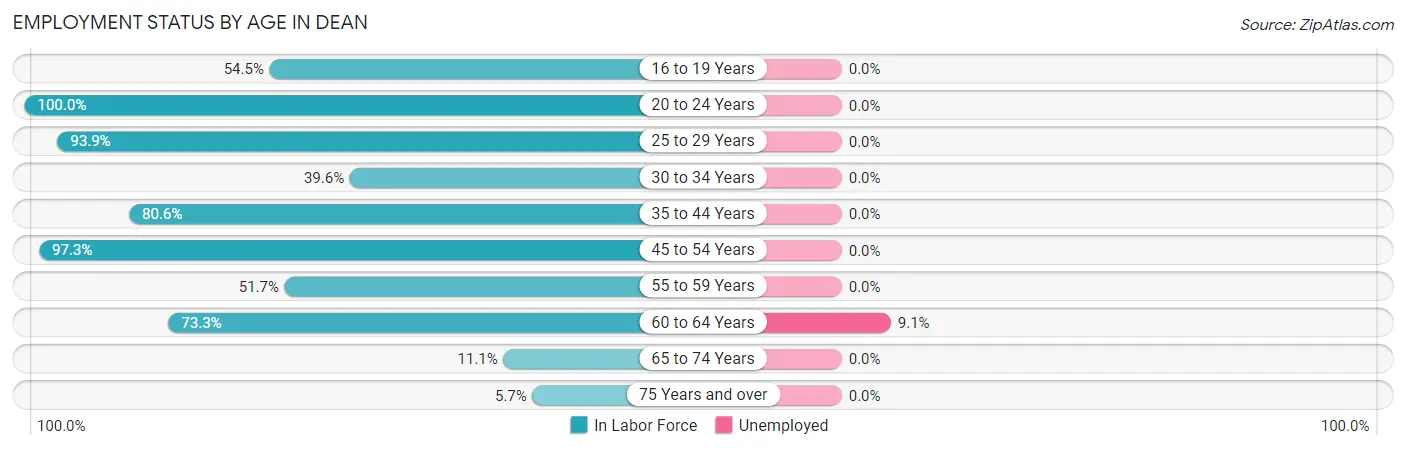
Employment Status by Age in Dean
According to the labor force statistics for Dean, out of the total population over 16 years of age (386), 51.3% or 198 individuals are in the labor force, with 1.0% or 2 of them unemployed. The age group with the highest labor force participation rate is 20 to 24 years, with 100.0% or 8 individuals in the labor force. Within the labor force, the 60 to 64 years age range has the highest percentage of unemployed individuals, with 9.1% or 2 of them being unemployed.
| Age Bracket | In Labor Force | Unemployed |
| 16 to 19 Years | 6 (54.5%) | 0 (0.0%) |
| 20 to 24 Years | 8 (100.0%) | 0 (0.0%) |
| 25 to 29 Years | 31 (93.9%) | 0 (0.0%) |
| 30 to 34 Years | 21 (39.6%) | 0 (0.0%) |
| 35 to 44 Years | 50 (80.6%) | 0 (0.0%) |
| 45 to 54 Years | 36 (97.3%) | 0 (0.0%) |
| 55 to 59 Years | 15 (51.7%) | 0 (0.0%) |
| 60 to 64 Years | 22 (73.3%) | 2 (9.1%) |
| 65 to 74 Years | 4 (11.1%) | 0 (0.0%) |
| 75 Years and over | 5 (5.7%) | 0 (0.0%) |
| Total | 198 (51.3%) | 2 (1.0%) |
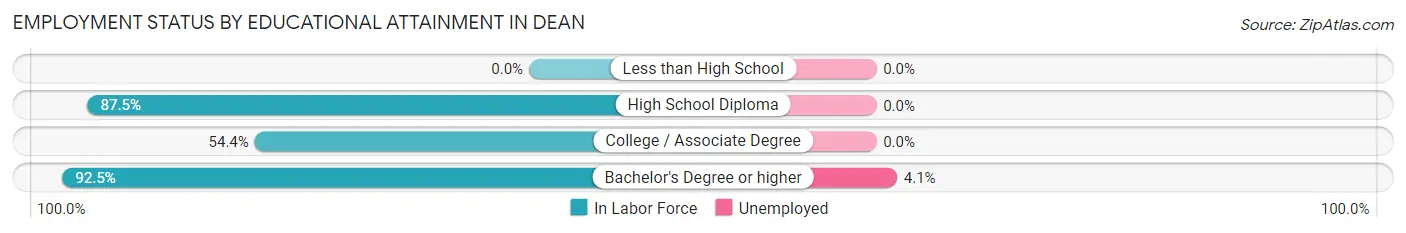
Employment Status by Educational Attainment in Dean
According to labor force statistics for Dean, 71.7% of individuals (175) out of the total population between 25 and 64 years of age (244) are in the labor force, with 1.1% or 2 of them being unemployed. The group with the highest labor force participation rate are those with the educational attainment of bachelor's degree or higher, with 92.5% or 49 individuals in the labor force. Within the labor force, individuals with bachelor's degree or higher education have the highest percentage of unemployment, with 4.1% or 2 of them being unemployed.
| Educational Attainment | In Labor Force | Unemployed |
| Less than High School | 0 (0.0%) | 0 (0.0%) |
| High School Diploma | 70 (87.5%) | 0 (0.0%) |
| College / Associate Degree | 56 (54.4%) | 0 (0.0%) |
| Bachelor's Degree or higher | 49 (92.5%) | 2 (4.1%) |
| Total | 175 (71.7%) | 3 (1.1%) |
Employment Occupations by Sex in Dean
Management, Business, Science and Arts Occupations
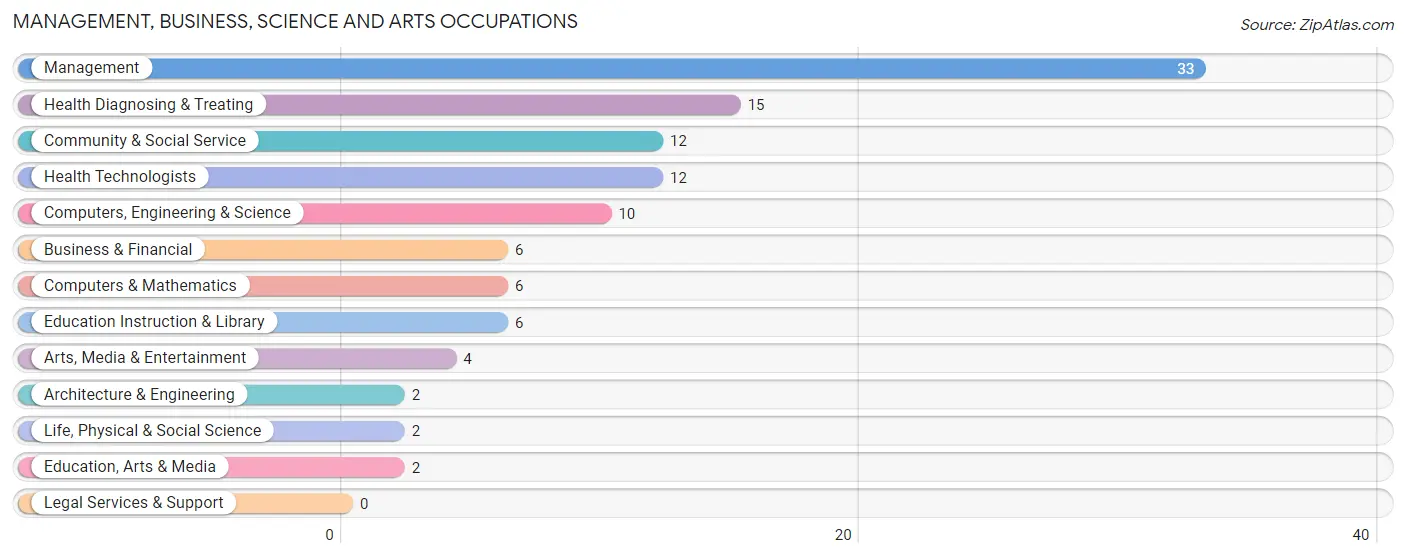
The most common Management, Business, Science and Arts occupations in Dean are Management (33 | 16.8%), Health Diagnosing & Treating (15 | 7.6%), Community & Social Service (12 | 6.1%), Health Technologists (12 | 6.1%), and Computers, Engineering & Science (10 | 5.1%).
Management, Business, Science and Arts Occupations by Sex
Within the Management, Business, Science and Arts occupations in Dean, the most male-oriented occupations are Computers, Engineering & Science (100.0%), Computers & Mathematics (100.0%), and Architecture & Engineering (100.0%), while the most female-oriented occupations are Education, Arts & Media (100.0%), Health Technologists (100.0%), and Health Diagnosing & Treating (80.0%).
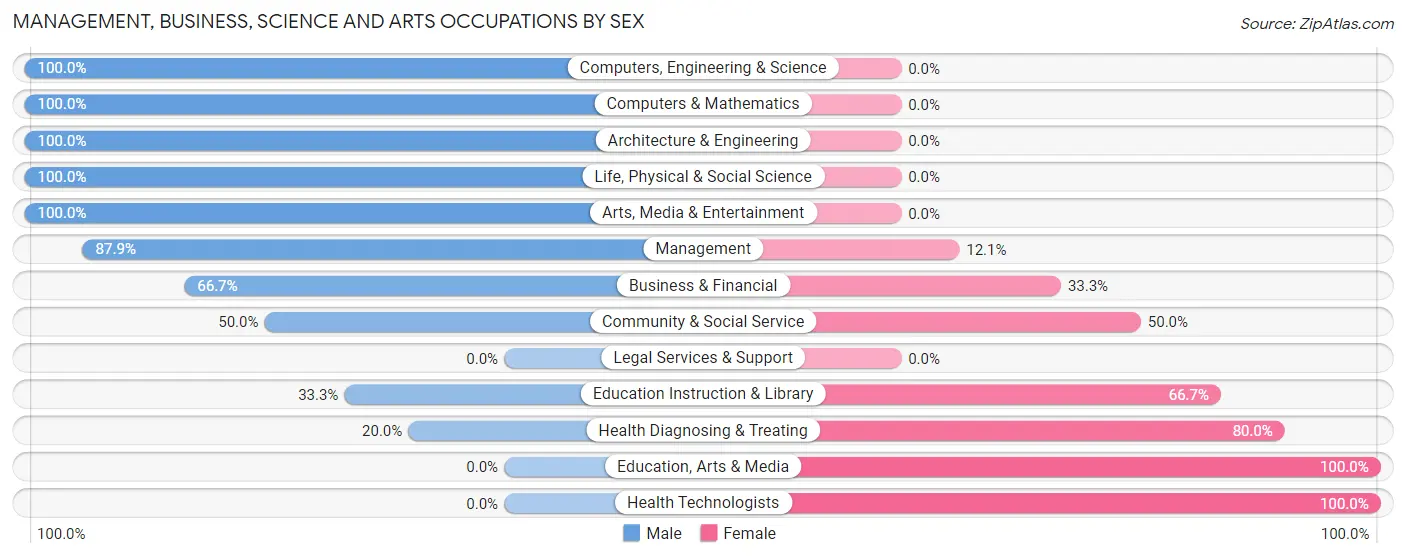
| Occupation | Male | Female |
| Management | 29 (87.9%) | 4 (12.1%) |
| Business & Financial | 4 (66.7%) | 2 (33.3%) |
| Computers, Engineering & Science | 10 (100.0%) | 0 (0.0%) |
| Computers & Mathematics | 6 (100.0%) | 0 (0.0%) |
| Architecture & Engineering | 2 (100.0%) | 0 (0.0%) |
| Life, Physical & Social Science | 2 (100.0%) | 0 (0.0%) |
| Community & Social Service | 6 (50.0%) | 6 (50.0%) |
| Education, Arts & Media | 0 (0.0%) | 2 (100.0%) |
| Legal Services & Support | 0 (0.0%) | 0 (0.0%) |
| Education Instruction & Library | 2 (33.3%) | 4 (66.7%) |
| Arts, Media & Entertainment | 4 (100.0%) | 0 (0.0%) |
| Health Diagnosing & Treating | 3 (20.0%) | 12 (80.0%) |
| Health Technologists | 0 (0.0%) | 12 (100.0%) |
| Total (Category) | 52 (68.4%) | 24 (31.6%) |
| Total (Overall) | 119 (60.7%) | 77 (39.3%) |
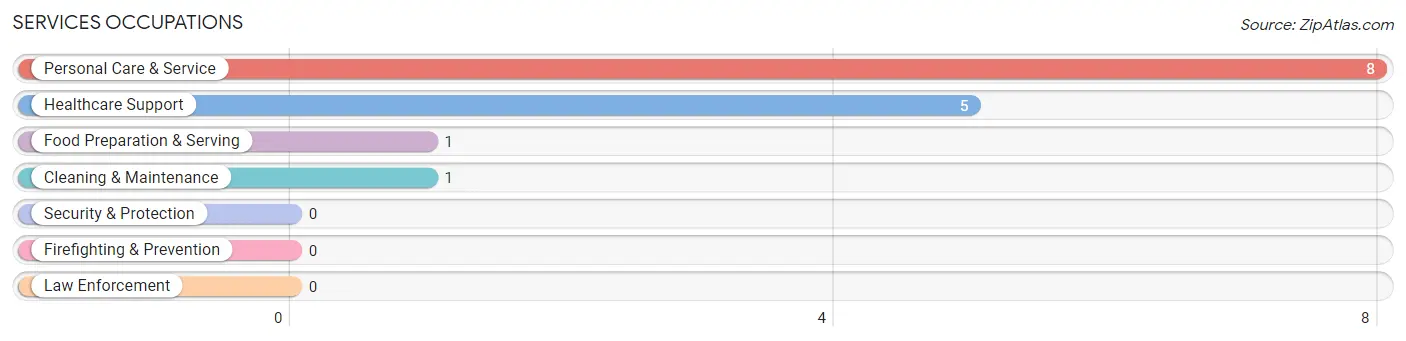
Services Occupations
The most common Services occupations in Dean are Personal Care & Service (8 | 4.1%), Healthcare Support (5 | 2.5%), Food Preparation & Serving (1 | 0.5%), and Cleaning & Maintenance (1 | 0.5%).
Services Occupations by Sex
Within the Services occupations in Dean, the most male-oriented occupations are Personal Care & Service (50.0%), and Healthcare Support (40.0%), while the most female-oriented occupations are Food Preparation & Serving (100.0%), Cleaning & Maintenance (100.0%), and Healthcare Support (60.0%).
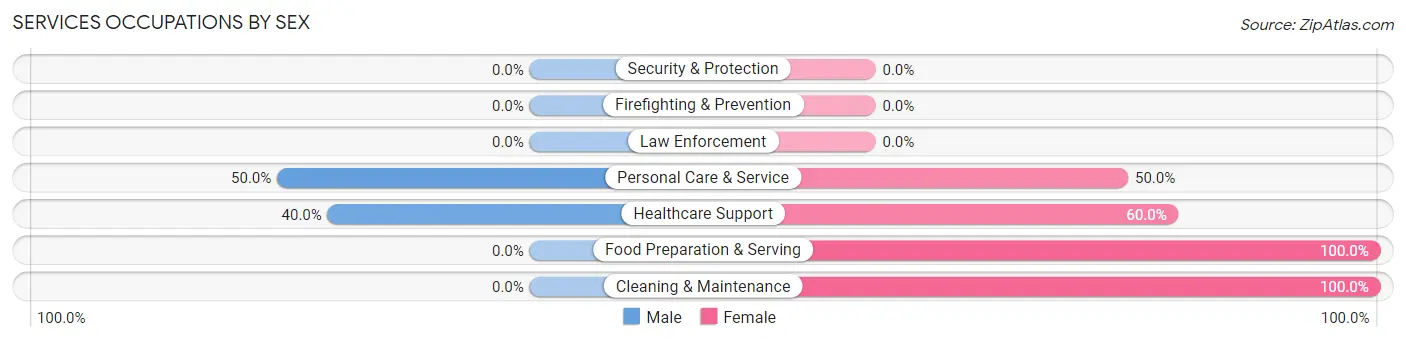
| Occupation | Male | Female |
| Healthcare Support | 2 (40.0%) | 3 (60.0%) |
| Security & Protection | 0 (0.0%) | 0 (0.0%) |
| Firefighting & Prevention | 0 (0.0%) | 0 (0.0%) |
| Law Enforcement | 0 (0.0%) | 0 (0.0%) |
| Food Preparation & Serving | 0 (0.0%) | 1 (100.0%) |
| Cleaning & Maintenance | 0 (0.0%) | 1 (100.0%) |
| Personal Care & Service | 4 (50.0%) | 4 (50.0%) |
| Total (Category) | 6 (40.0%) | 9 (60.0%) |
| Total (Overall) | 119 (60.7%) | 77 (39.3%) |
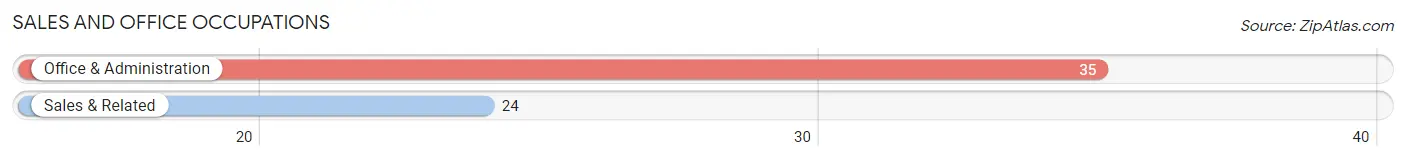
Sales and Office Occupations
The most common Sales and Office occupations in Dean are Office & Administration (35 | 17.9%), and Sales & Related (24 | 12.2%).
Sales and Office Occupations by Sex
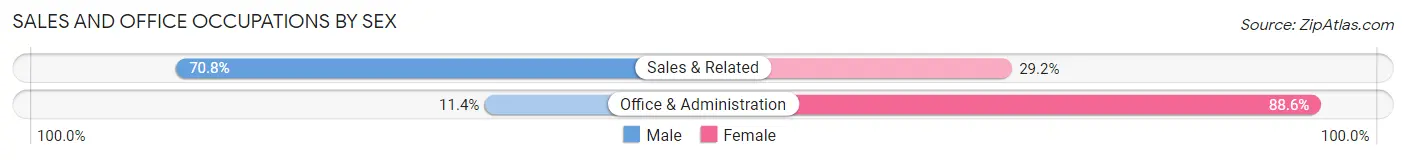
| Occupation | Male | Female |
| Sales & Related | 17 (70.8%) | 7 (29.2%) |
| Office & Administration | 4 (11.4%) | 31 (88.6%) |
| Total (Category) | 21 (35.6%) | 38 (64.4%) |
| Total (Overall) | 119 (60.7%) | 77 (39.3%) |
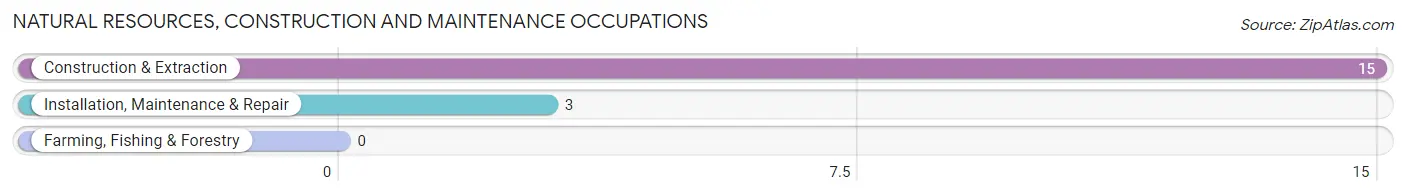
Natural Resources, Construction and Maintenance Occupations
The most common Natural Resources, Construction and Maintenance occupations in Dean are Construction & Extraction (15 | 7.6%), and Installation, Maintenance & Repair (3 | 1.5%).
Natural Resources, Construction and Maintenance Occupations by Sex
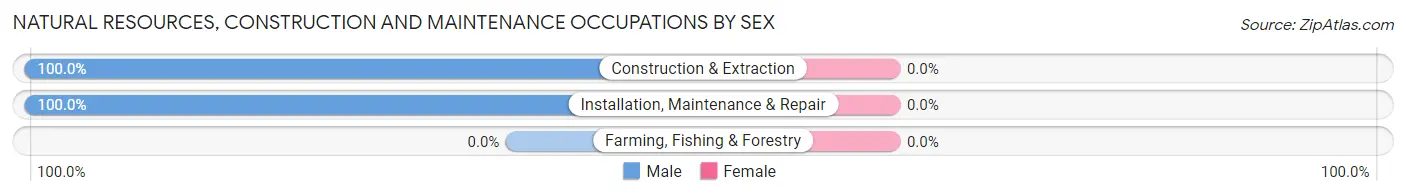
| Occupation | Male | Female |
| Farming, Fishing & Forestry | 0 (0.0%) | 0 (0.0%) |
| Construction & Extraction | 15 (100.0%) | 0 (0.0%) |
| Installation, Maintenance & Repair | 3 (100.0%) | 0 (0.0%) |
| Total (Category) | 18 (100.0%) | 0 (0.0%) |
| Total (Overall) | 119 (60.7%) | 77 (39.3%) |
Production, Transportation and Moving Occupations
The most common Production, Transportation and Moving occupations in Dean are Production (19 | 9.7%), Transportation (5 | 2.5%), and Material Moving (4 | 2.0%).
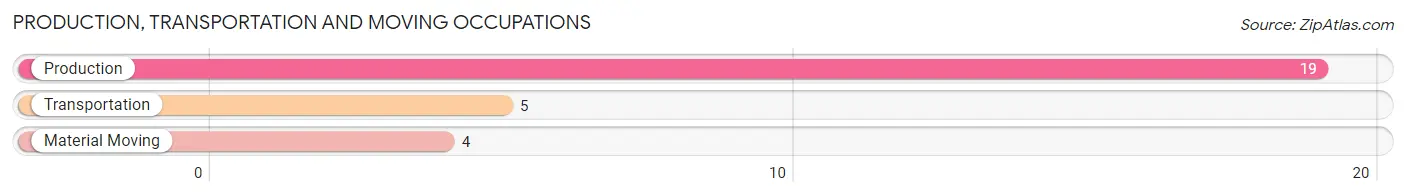
Production, Transportation and Moving Occupations by Sex
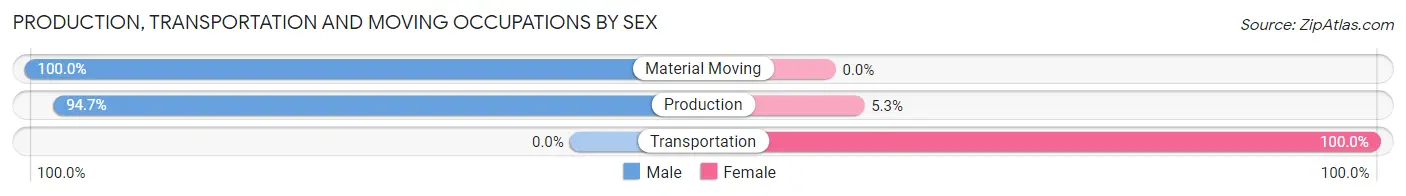
| Occupation | Male | Female |
| Production | 18 (94.7%) | 1 (5.3%) |
| Transportation | 0 (0.0%) | 5 (100.0%) |
| Material Moving | 4 (100.0%) | 0 (0.0%) |
| Total (Category) | 22 (78.6%) | 6 (21.4%) |
| Total (Overall) | 119 (60.7%) | 77 (39.3%) |
Employment Industries by Sex in Dean
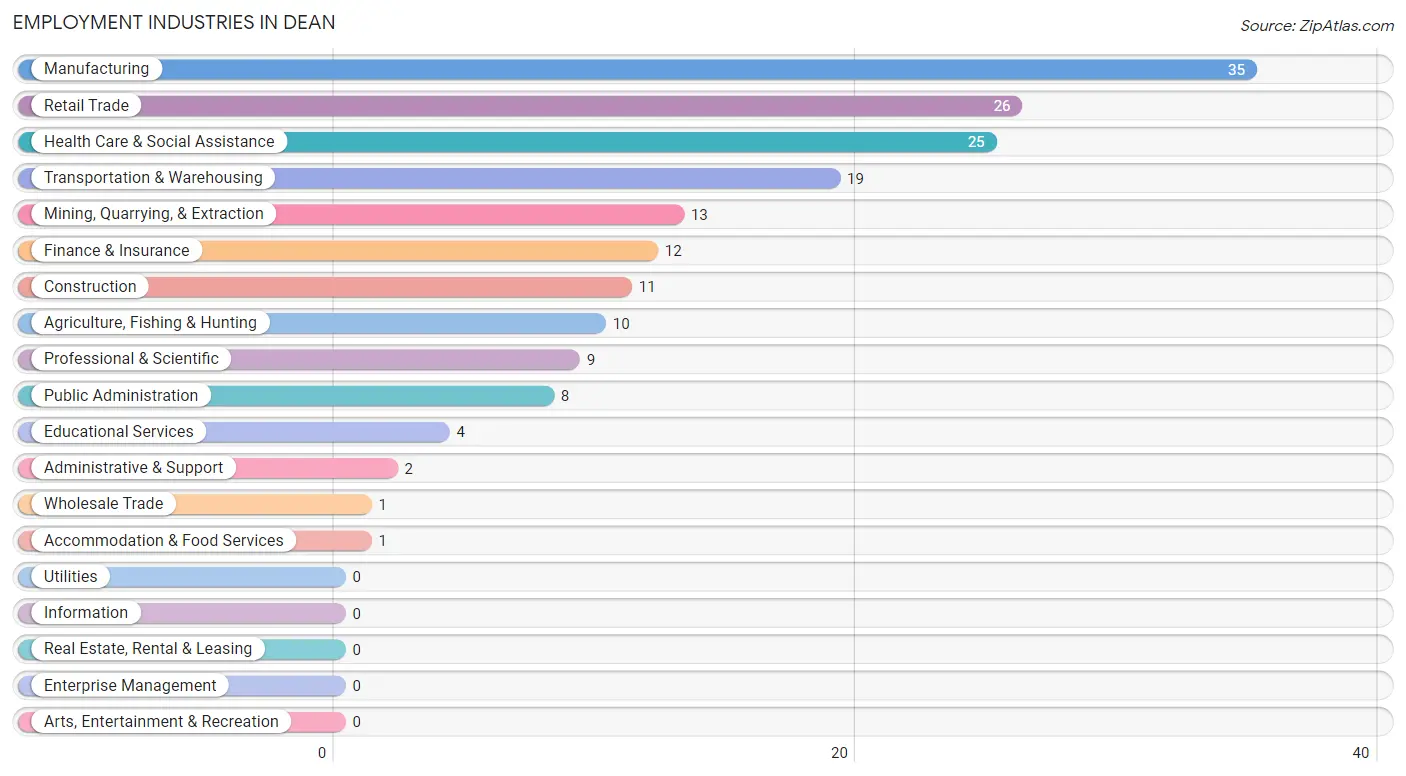
Employment Industries in Dean
The major employment industries in Dean include Manufacturing (35 | 17.9%), Retail Trade (26 | 13.3%), Health Care & Social Assistance (25 | 12.8%), Transportation & Warehousing (19 | 9.7%), and Mining, Quarrying, & Extraction (13 | 6.6%).
Employment Industries by Sex in Dean
The Dean industries that see more men than women are Wholesale Trade (100.0%), Retail Trade (88.5%), and Mining, Quarrying, & Extraction (84.6%), whereas the industries that tend to have a higher number of women are Administrative & Support (100.0%), Accommodation & Food Services (100.0%), and Health Care & Social Assistance (92.0%).
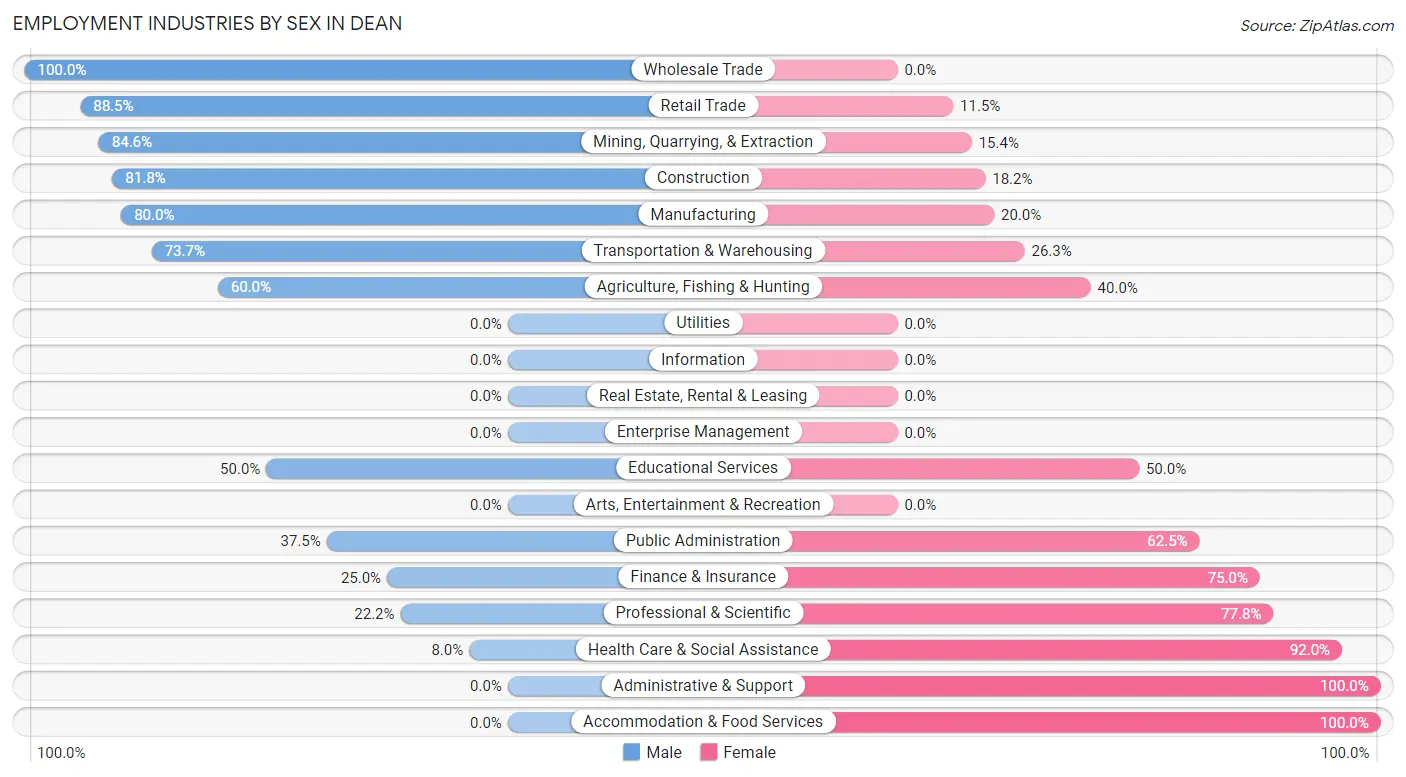
| Industry | Male | Female |
| Agriculture, Fishing & Hunting | 6 (60.0%) | 4 (40.0%) |
| Mining, Quarrying, & Extraction | 11 (84.6%) | 2 (15.4%) |
| Construction | 9 (81.8%) | 2 (18.2%) |
| Manufacturing | 28 (80.0%) | 7 (20.0%) |
| Wholesale Trade | 1 (100.0%) | 0 (0.0%) |
| Retail Trade | 23 (88.5%) | 3 (11.5%) |
| Transportation & Warehousing | 14 (73.7%) | 5 (26.3%) |
| Utilities | 0 (0.0%) | 0 (0.0%) |
| Information | 0 (0.0%) | 0 (0.0%) |
| Finance & Insurance | 3 (25.0%) | 9 (75.0%) |
| Real Estate, Rental & Leasing | 0 (0.0%) | 0 (0.0%) |
| Professional & Scientific | 2 (22.2%) | 7 (77.8%) |
| Enterprise Management | 0 (0.0%) | 0 (0.0%) |
| Administrative & Support | 0 (0.0%) | 2 (100.0%) |
| Educational Services | 2 (50.0%) | 2 (50.0%) |
| Health Care & Social Assistance | 2 (8.0%) | 23 (92.0%) |
| Arts, Entertainment & Recreation | 0 (0.0%) | 0 (0.0%) |
| Accommodation & Food Services | 0 (0.0%) | 1 (100.0%) |
| Public Administration | 3 (37.5%) | 5 (62.5%) |
| Total | 119 (60.7%) | 77 (39.3%) |
Education in Dean
School Enrollment in Dean
The most common levels of schooling among the 57 students in Dean are elementary school (22 | 38.6%), high school (13 | 22.8%), and nursery / preschool (6 | 10.5%).
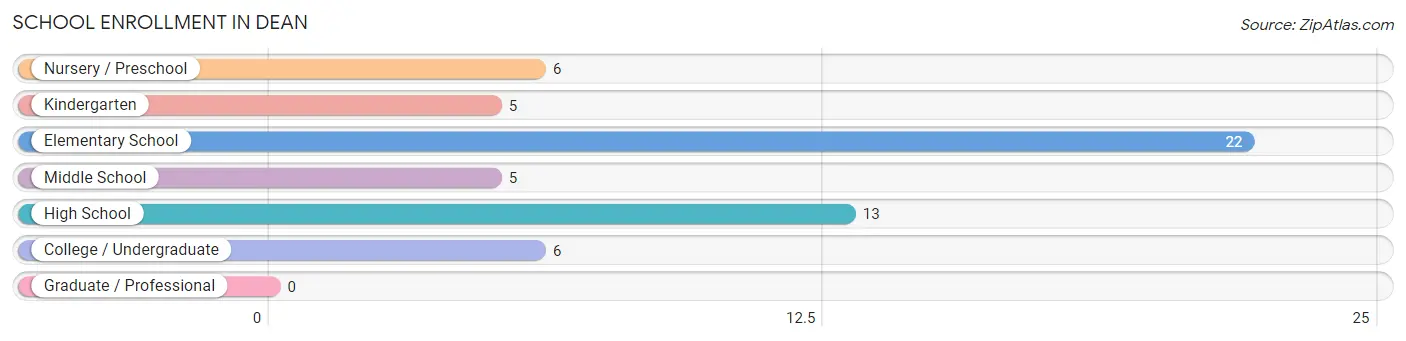
| School Level | # Students | % Students |
| Nursery / Preschool | 6 | 10.5% |
| Kindergarten | 5 | 8.8% |
| Elementary School | 22 | 38.6% |
| Middle School | 5 | 8.8% |
| High School | 13 | 22.8% |
| College / Undergraduate | 6 | 10.5% |
| Graduate / Professional | 0 | 0.0% |
| Total | 57 | 100.0% |
School Enrollment by Age by Funding Source in Dean
Out of a total of 57 students who are enrolled in schools in Dean, 10 (17.5%) attend a private institution, while the remaining 47 (82.5%) are enrolled in public schools. The age group of 20 to 24 year olds has the highest likelihood of being enrolled in private schools, with 4 (100.0% in the age bracket) enrolled. Conversely, the age group of 10 to 14 year olds has the lowest likelihood of being enrolled in a private school, with 7 (100.0% in the age bracket) attending a public institution.
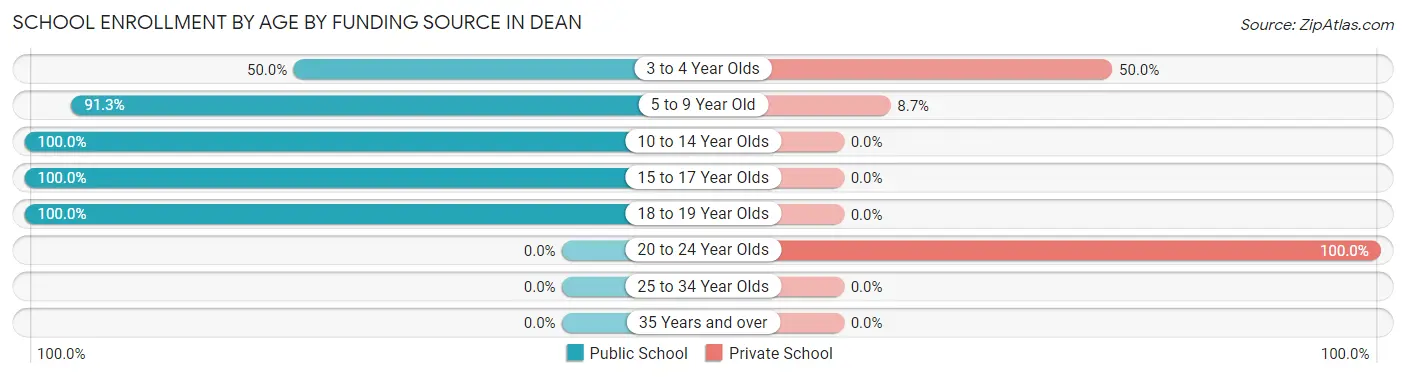
| Age Bracket | Public School | Private School |
| 3 to 4 Year Olds | 4 (50.0%) | 4 (50.0%) |
| 5 to 9 Year Old | 21 (91.3%) | 2 (8.7%) |
| 10 to 14 Year Olds | 7 (100.0%) | 0 (0.0%) |
| 15 to 17 Year Olds | 11 (100.0%) | 0 (0.0%) |
| 18 to 19 Year Olds | 4 (100.0%) | 0 (0.0%) |
| 20 to 24 Year Olds | 0 (0.0%) | 4 (100.0%) |
| 25 to 34 Year Olds | 0 (0.0%) | 0 (0.0%) |
| 35 Years and over | 0 (0.0%) | 0 (0.0%) |
| Total | 47 (82.5%) | 10 (17.5%) |
Educational Attainment by Field of Study in Dean
Business (21 | 27.3%), education (14 | 18.2%), bio, nature & agricultural (7 | 9.1%), science & technology (7 | 9.1%), and liberal arts & history (7 | 9.1%) are the most common fields of study among 77 individuals in Dean who have obtained a bachelor's degree or higher.
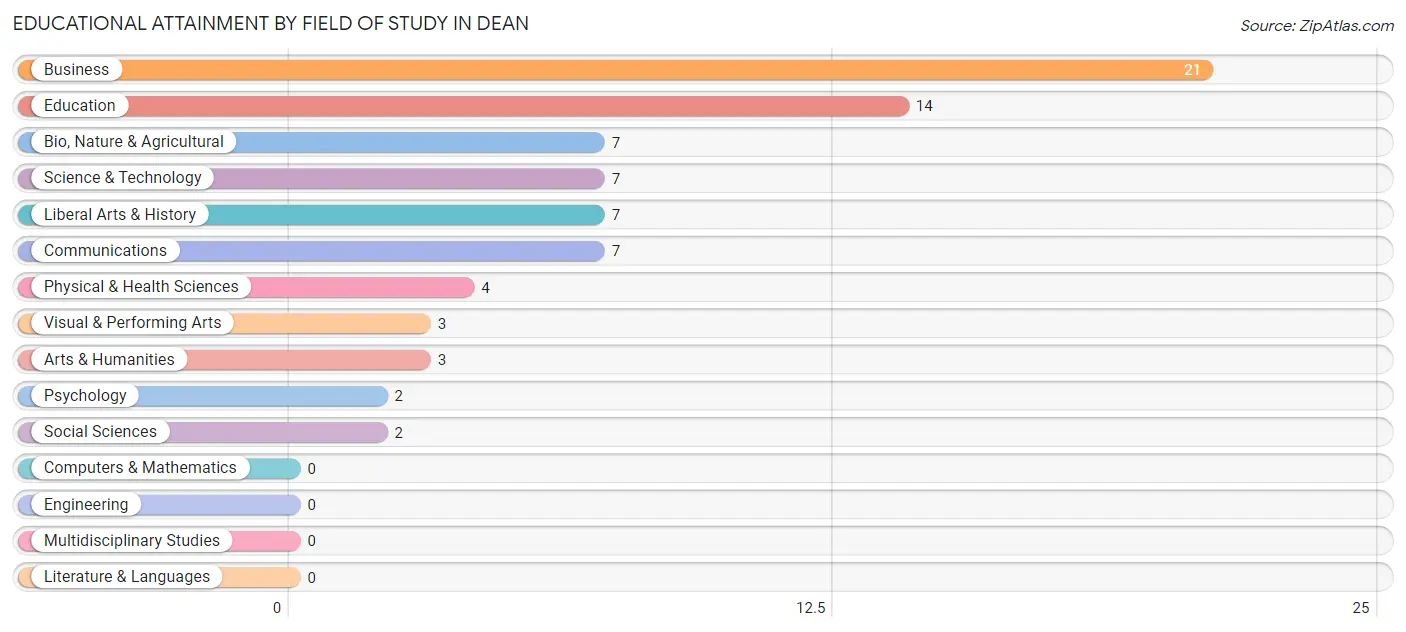
| Field of Study | # Graduates | % Graduates |
| Computers & Mathematics | 0 | 0.0% |
| Bio, Nature & Agricultural | 7 | 9.1% |
| Physical & Health Sciences | 4 | 5.2% |
| Psychology | 2 | 2.6% |
| Social Sciences | 2 | 2.6% |
| Engineering | 0 | 0.0% |
| Multidisciplinary Studies | 0 | 0.0% |
| Science & Technology | 7 | 9.1% |
| Business | 21 | 27.3% |
| Education | 14 | 18.2% |
| Literature & Languages | 0 | 0.0% |
| Liberal Arts & History | 7 | 9.1% |
| Visual & Performing Arts | 3 | 3.9% |
| Communications | 7 | 9.1% |
| Arts & Humanities | 3 | 3.9% |
| Total | 77 | 100.0% |
Transportation & Commute in Dean
Vehicle Availability by Sex in Dean
The most prevalent vehicle ownership categories in Dean are males with 3 vehicles (53, accounting for 44.5%) and females with 3 vehicles (28, making up 69.7%).
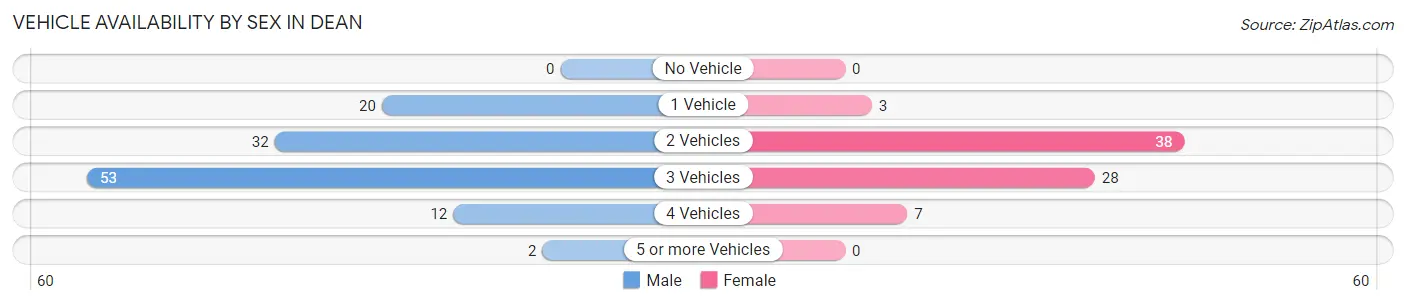
| Vehicles Available | Male | Female |
| No Vehicle | 0 (0.0%) | 0 (0.0%) |
| 1 Vehicle | 20 (16.8%) | 3 (4.0%) |
| 2 Vehicles | 32 (26.9%) | 38 (50.0%) |
| 3 Vehicles | 53 (44.5%) | 28 (36.8%) |
| 4 Vehicles | 12 (10.1%) | 7 (9.2%) |
| 5 or more Vehicles | 2 (1.7%) | 0 (0.0%) |
| Total | 119 (100.0%) | 76 (100.0%) |
Commute Time in Dean
The most frequently occuring commute durations in Dean are 20 to 24 minutes (48 commuters, 26.1%), 15 to 19 minutes (38 commuters, 20.6%), and 25 to 29 minutes (29 commuters, 15.8%).
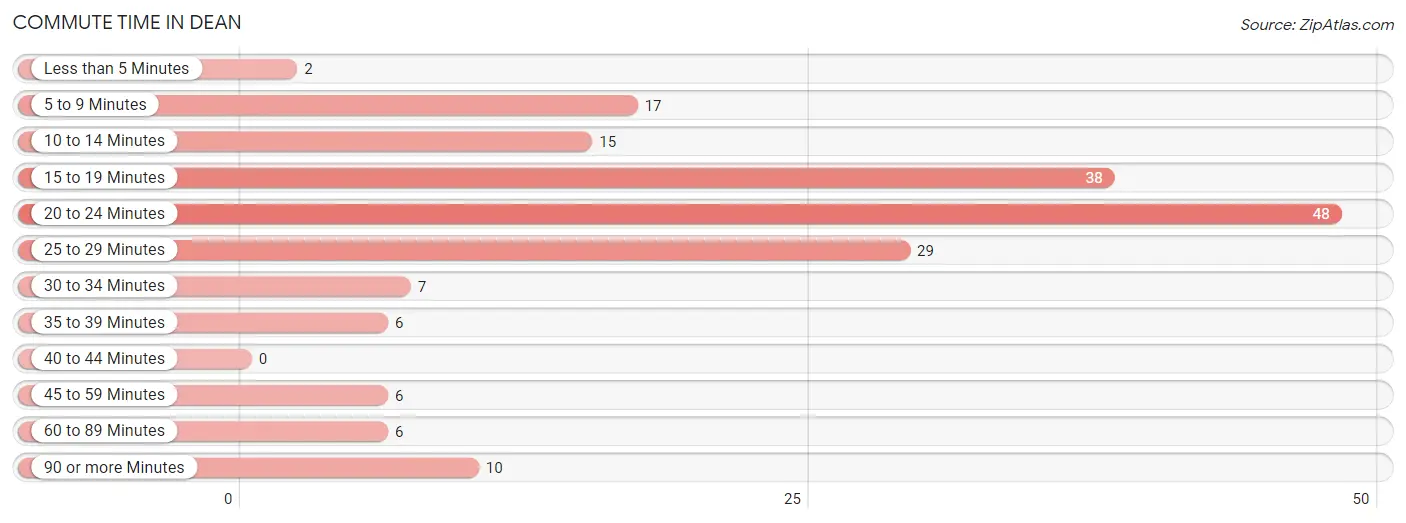
| Commute Time | # Commuters | % Commuters |
| Less than 5 Minutes | 2 | 1.1% |
| 5 to 9 Minutes | 17 | 9.2% |
| 10 to 14 Minutes | 15 | 8.2% |
| 15 to 19 Minutes | 38 | 20.6% |
| 20 to 24 Minutes | 48 | 26.1% |
| 25 to 29 Minutes | 29 | 15.8% |
| 30 to 34 Minutes | 7 | 3.8% |
| 35 to 39 Minutes | 6 | 3.3% |
| 40 to 44 Minutes | 0 | 0.0% |
| 45 to 59 Minutes | 6 | 3.3% |
| 60 to 89 Minutes | 6 | 3.3% |
| 90 or more Minutes | 10 | 5.4% |
Commute Time by Sex in Dean
The most common commute times in Dean are 25 to 29 minutes (28 commuters, 23.5%) for males and 20 to 24 minutes (23 commuters, 35.4%) for females.
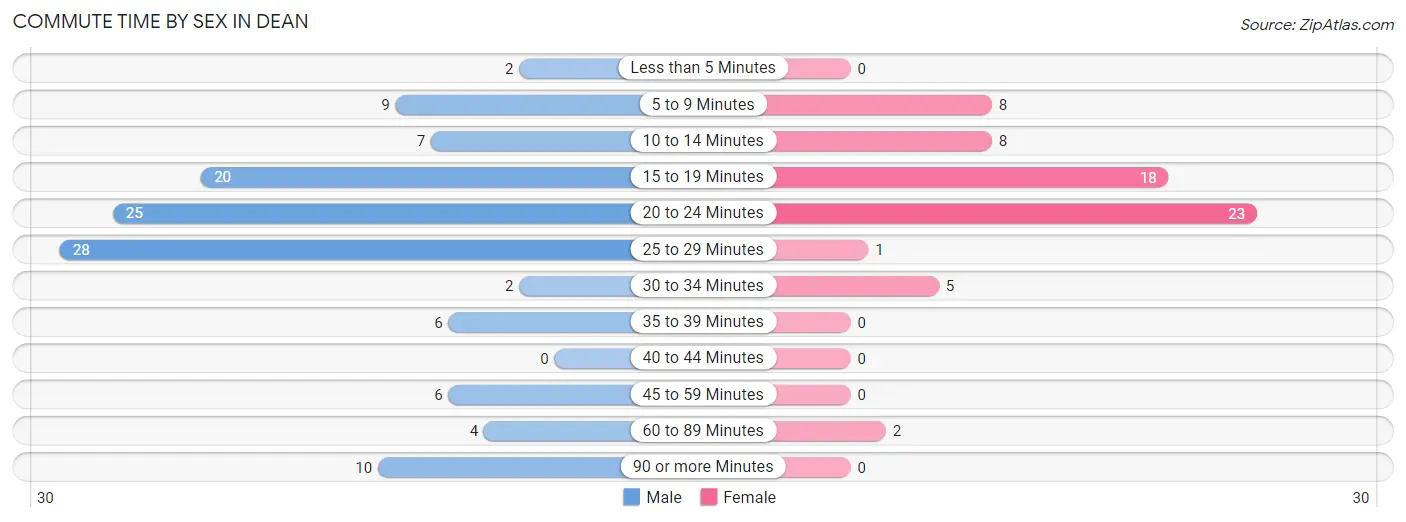
| Commute Time | Male | Female |
| Less than 5 Minutes | 2 (1.7%) | 0 (0.0%) |
| 5 to 9 Minutes | 9 (7.6%) | 8 (12.3%) |
| 10 to 14 Minutes | 7 (5.9%) | 8 (12.3%) |
| 15 to 19 Minutes | 20 (16.8%) | 18 (27.7%) |
| 20 to 24 Minutes | 25 (21.0%) | 23 (35.4%) |
| 25 to 29 Minutes | 28 (23.5%) | 1 (1.5%) |
| 30 to 34 Minutes | 2 (1.7%) | 5 (7.7%) |
| 35 to 39 Minutes | 6 (5.0%) | 0 (0.0%) |
| 40 to 44 Minutes | 0 (0.0%) | 0 (0.0%) |
| 45 to 59 Minutes | 6 (5.0%) | 0 (0.0%) |
| 60 to 89 Minutes | 4 (3.4%) | 2 (3.1%) |
| 90 or more Minutes | 10 (8.4%) | 0 (0.0%) |
Time of Departure to Work by Sex in Dean
The most frequent times of departure to work in Dean are 7:30 AM to 7:59 AM (26, 21.8%) for males and 7:30 AM to 7:59 AM (19, 29.2%) for females.
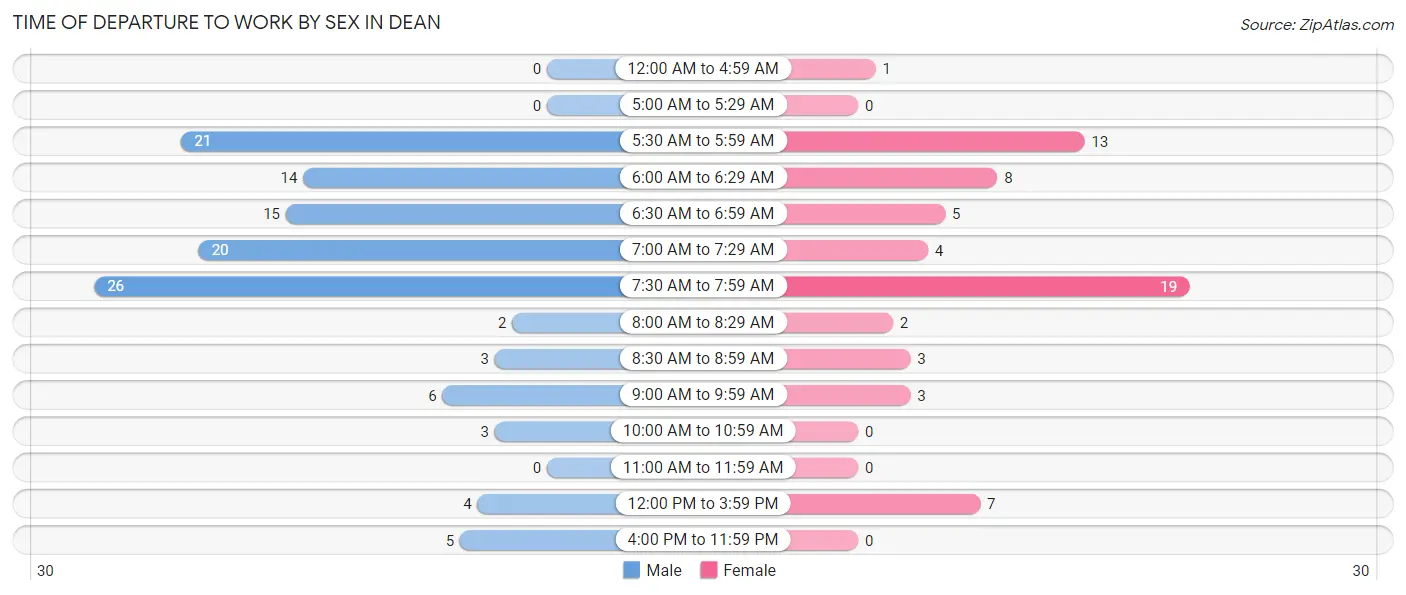
| Time of Departure | Male | Female |
| 12:00 AM to 4:59 AM | 0 (0.0%) | 1 (1.5%) |
| 5:00 AM to 5:29 AM | 0 (0.0%) | 0 (0.0%) |
| 5:30 AM to 5:59 AM | 21 (17.6%) | 13 (20.0%) |
| 6:00 AM to 6:29 AM | 14 (11.8%) | 8 (12.3%) |
| 6:30 AM to 6:59 AM | 15 (12.6%) | 5 (7.7%) |
| 7:00 AM to 7:29 AM | 20 (16.8%) | 4 (6.1%) |
| 7:30 AM to 7:59 AM | 26 (21.8%) | 19 (29.2%) |
| 8:00 AM to 8:29 AM | 2 (1.7%) | 2 (3.1%) |
| 8:30 AM to 8:59 AM | 3 (2.5%) | 3 (4.6%) |
| 9:00 AM to 9:59 AM | 6 (5.0%) | 3 (4.6%) |
| 10:00 AM to 10:59 AM | 3 (2.5%) | 0 (0.0%) |
| 11:00 AM to 11:59 AM | 0 (0.0%) | 0 (0.0%) |
| 12:00 PM to 3:59 PM | 4 (3.4%) | 7 (10.8%) |
| 4:00 PM to 11:59 PM | 5 (4.2%) | 0 (0.0%) |
| Total | 119 (100.0%) | 65 (100.0%) |
Housing Occupancy in Dean
Occupancy by Ownership in Dean
Of the total 197 dwellings in Dean, owner-occupied units account for 186 (94.4%), while renter-occupied units make up 11 (5.6%).
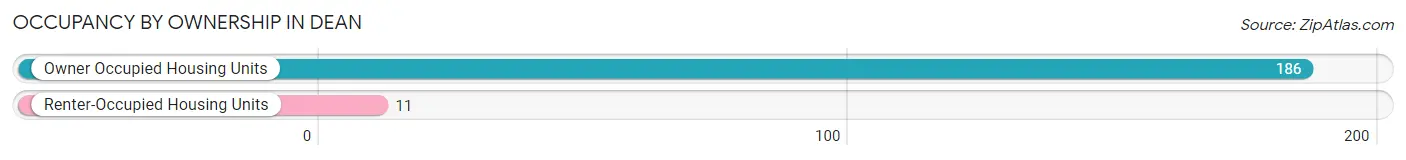
| Occupancy | # Housing Units | % Housing Units |
| Owner Occupied Housing Units | 186 | 94.4% |
| Renter-Occupied Housing Units | 11 | 5.6% |
| Total Occupied Housing Units | 197 | 100.0% |
Occupancy by Household Size in Dean
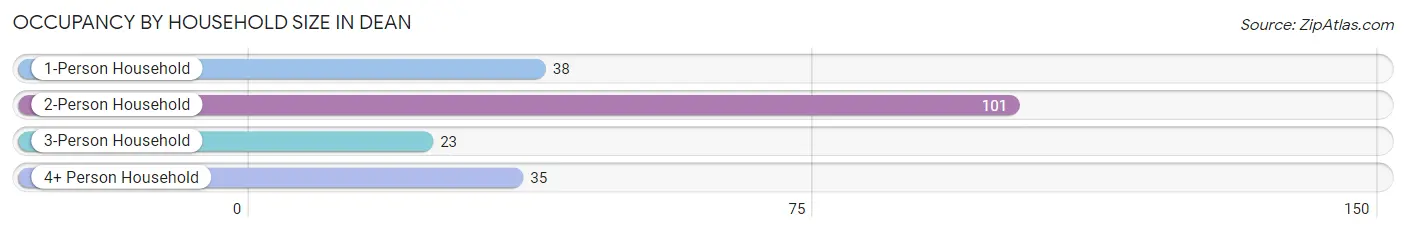
| Household Size | # Housing Units | % Housing Units |
| 1-Person Household | 38 | 19.3% |
| 2-Person Household | 101 | 51.3% |
| 3-Person Household | 23 | 11.7% |
| 4+ Person Household | 35 | 17.8% |
| Total Housing Units | 197 | 100.0% |
Occupancy by Ownership by Household Size in Dean
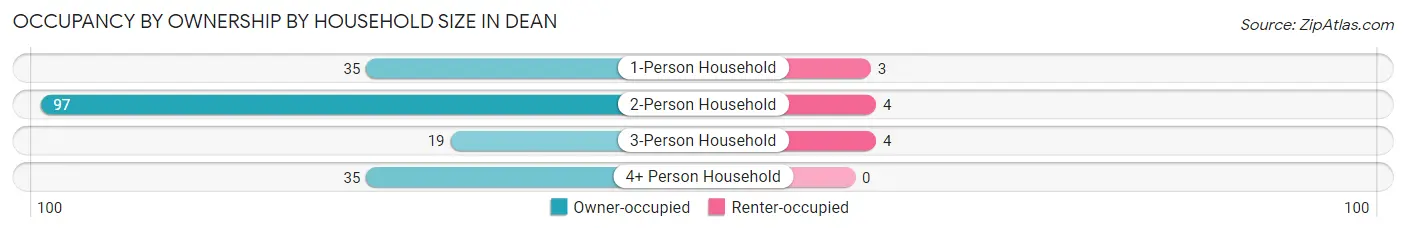
| Household Size | Owner-occupied | Renter-occupied |
| 1-Person Household | 35 (92.1%) | 3 (7.9%) |
| 2-Person Household | 97 (96.0%) | 4 (4.0%) |
| 3-Person Household | 19 (82.6%) | 4 (17.4%) |
| 4+ Person Household | 35 (100.0%) | 0 (0.0%) |
| Total Housing Units | 186 (94.4%) | 11 (5.6%) |
Occupancy by Educational Attainment in Dean
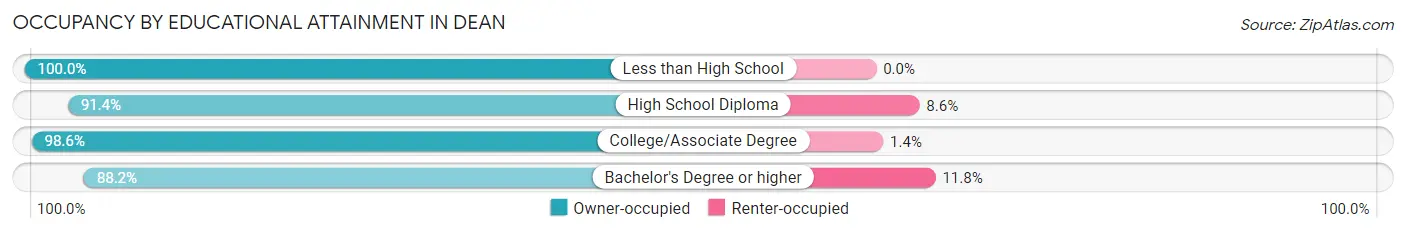
| Household Size | Owner-occupied | Renter-occupied |
| Less than High School | 21 (100.0%) | 0 (0.0%) |
| High School Diploma | 64 (91.4%) | 6 (8.6%) |
| College/Associate Degree | 71 (98.6%) | 1 (1.4%) |
| Bachelor's Degree or higher | 30 (88.2%) | 4 (11.8%) |
Occupancy by Age of Householder in Dean
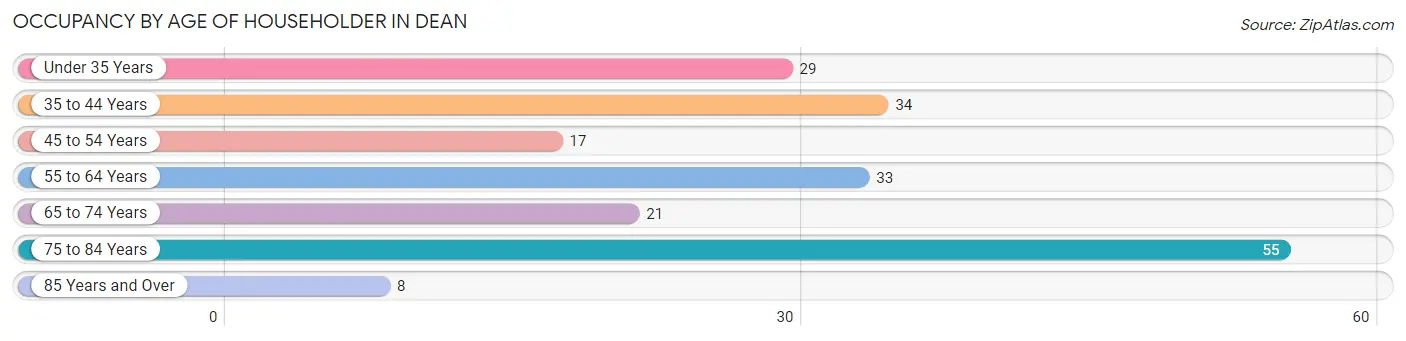
| Age Bracket | # Households | % Households |
| Under 35 Years | 29 | 14.7% |
| 35 to 44 Years | 34 | 17.3% |
| 45 to 54 Years | 17 | 8.6% |
| 55 to 64 Years | 33 | 16.8% |
| 65 to 74 Years | 21 | 10.7% |
| 75 to 84 Years | 55 | 27.9% |
| 85 Years and Over | 8 | 4.1% |
| Total | 197 | 100.0% |
Housing Finances in Dean
Median Income by Occupancy in Dean
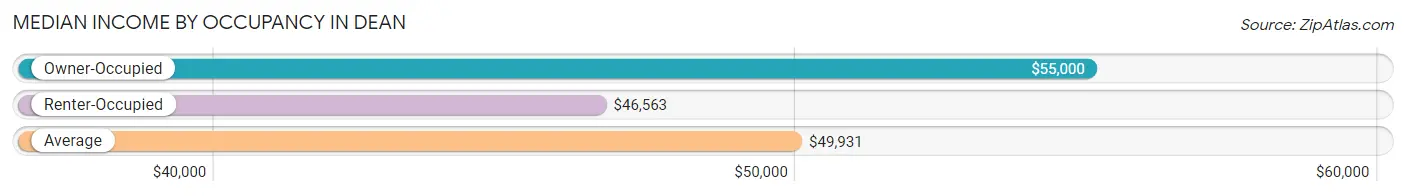
| Occupancy Type | # Households | Median Income |
| Owner-Occupied | 186 (94.4%) | $55,000 |
| Renter-Occupied | 11 (5.6%) | $46,563 |
| Average | 197 (100.0%) | $49,931 |
Occupancy by Householder Income Bracket in Dean
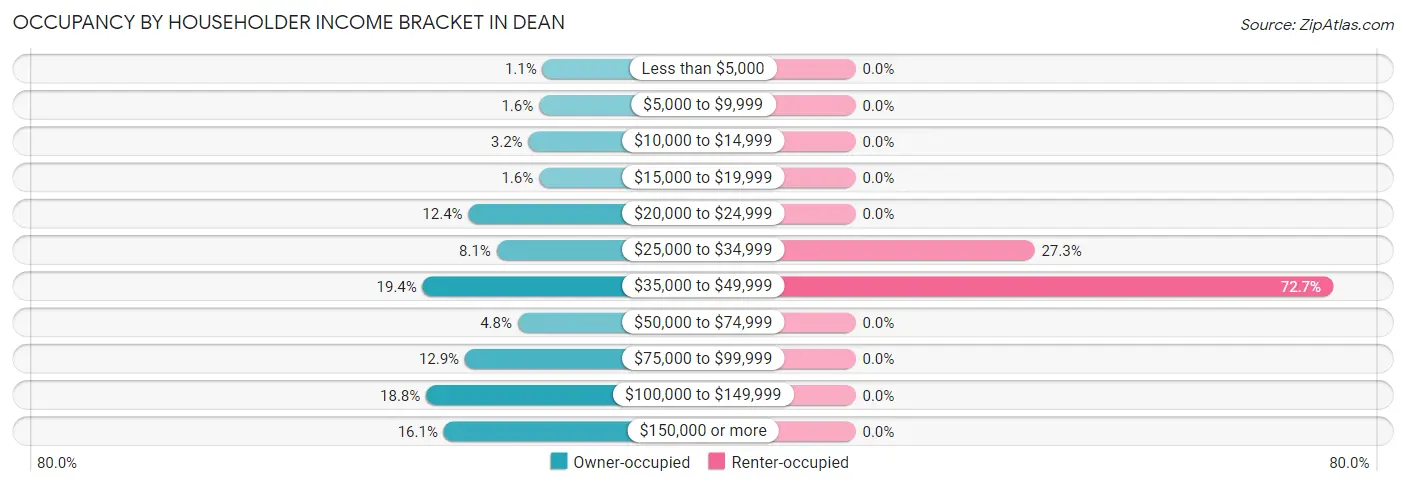
| Income Bracket | Owner-occupied | Renter-occupied |
| Less than $5,000 | 2 (1.1%) | 0 (0.0%) |
| $5,000 to $9,999 | 3 (1.6%) | 0 (0.0%) |
| $10,000 to $14,999 | 6 (3.2%) | 0 (0.0%) |
| $15,000 to $19,999 | 3 (1.6%) | 0 (0.0%) |
| $20,000 to $24,999 | 23 (12.4%) | 0 (0.0%) |
| $25,000 to $34,999 | 15 (8.1%) | 3 (27.3%) |
| $35,000 to $49,999 | 36 (19.4%) | 8 (72.7%) |
| $50,000 to $74,999 | 9 (4.8%) | 0 (0.0%) |
| $75,000 to $99,999 | 24 (12.9%) | 0 (0.0%) |
| $100,000 to $149,999 | 35 (18.8%) | 0 (0.0%) |
| $150,000 or more | 30 (16.1%) | 0 (0.0%) |
| Total | 186 (100.0%) | 11 (100.0%) |
Monthly Housing Cost Tiers in Dean
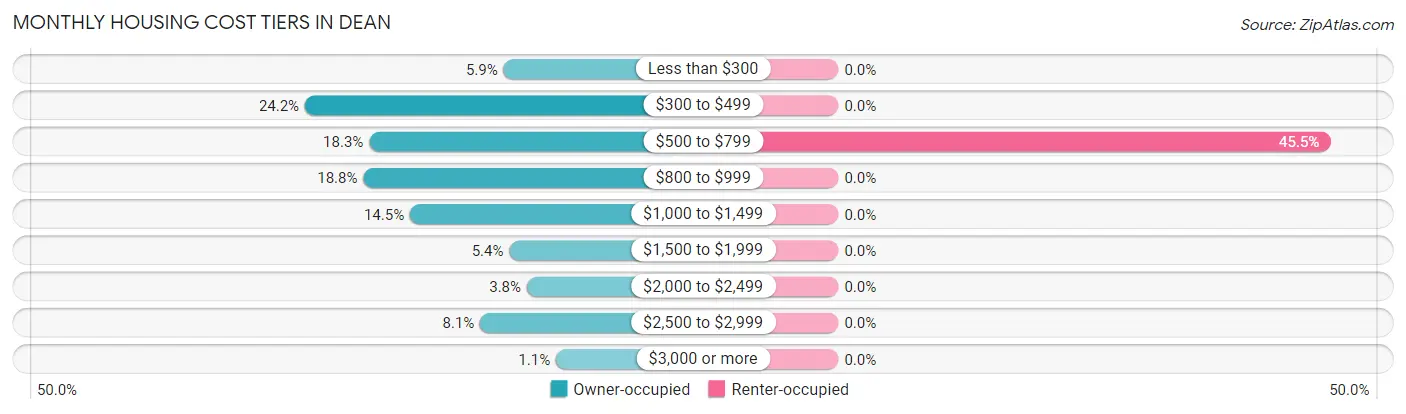
| Monthly Cost | Owner-occupied | Renter-occupied |
| Less than $300 | 11 (5.9%) | 0 (0.0%) |
| $300 to $499 | 45 (24.2%) | 0 (0.0%) |
| $500 to $799 | 34 (18.3%) | 5 (45.5%) |
| $800 to $999 | 35 (18.8%) | 0 (0.0%) |
| $1,000 to $1,499 | 27 (14.5%) | 0 (0.0%) |
| $1,500 to $1,999 | 10 (5.4%) | 0 (0.0%) |
| $2,000 to $2,499 | 7 (3.8%) | 0 (0.0%) |
| $2,500 to $2,999 | 15 (8.1%) | 0 (0.0%) |
| $3,000 or more | 2 (1.1%) | 0 (0.0%) |
| Total | 186 (100.0%) | 11 (100.0%) |
Physical Housing Characteristics in Dean
Housing Structures in Dean
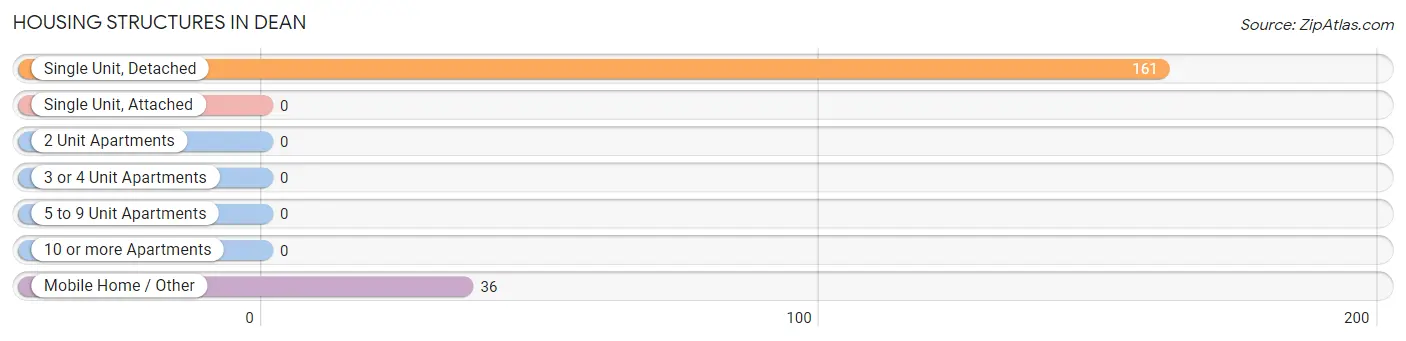
| Structure Type | # Housing Units | % Housing Units |
| Single Unit, Detached | 161 | 81.7% |
| Single Unit, Attached | 0 | 0.0% |
| 2 Unit Apartments | 0 | 0.0% |
| 3 or 4 Unit Apartments | 0 | 0.0% |
| 5 to 9 Unit Apartments | 0 | 0.0% |
| 10 or more Apartments | 0 | 0.0% |
| Mobile Home / Other | 36 | 18.3% |
| Total | 197 | 100.0% |
Housing Structures by Occupancy in Dean
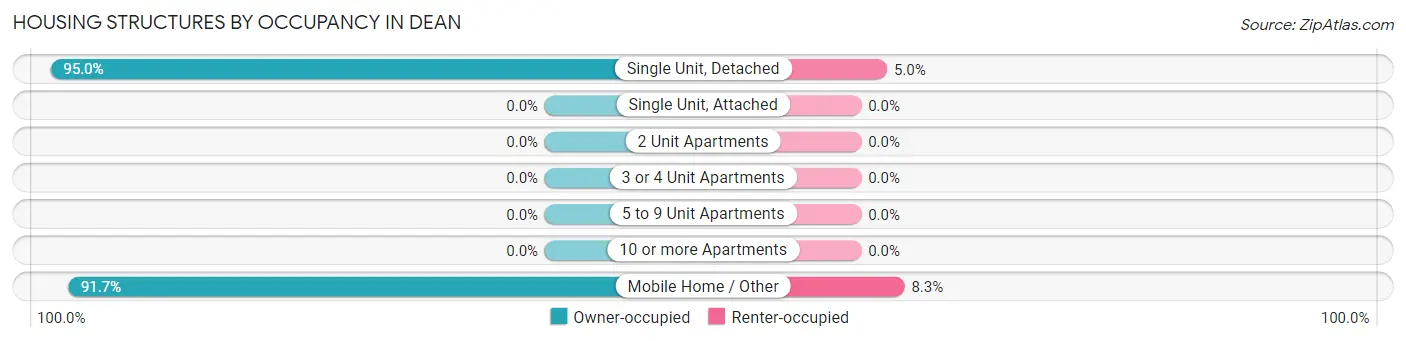
| Structure Type | Owner-occupied | Renter-occupied |
| Single Unit, Detached | 153 (95.0%) | 8 (5.0%) |
| Single Unit, Attached | 0 (0.0%) | 0 (0.0%) |
| 2 Unit Apartments | 0 (0.0%) | 0 (0.0%) |
| 3 or 4 Unit Apartments | 0 (0.0%) | 0 (0.0%) |
| 5 to 9 Unit Apartments | 0 (0.0%) | 0 (0.0%) |
| 10 or more Apartments | 0 (0.0%) | 0 (0.0%) |
| Mobile Home / Other | 33 (91.7%) | 3 (8.3%) |
| Total | 186 (94.4%) | 11 (5.6%) |
Housing Structures by Number of Rooms in Dean
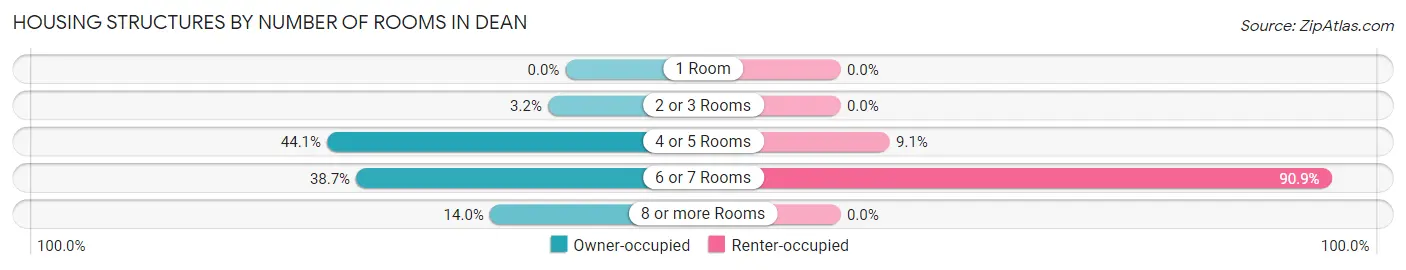
| Number of Rooms | Owner-occupied | Renter-occupied |
| 1 Room | 0 (0.0%) | 0 (0.0%) |
| 2 or 3 Rooms | 6 (3.2%) | 0 (0.0%) |
| 4 or 5 Rooms | 82 (44.1%) | 1 (9.1%) |
| 6 or 7 Rooms | 72 (38.7%) | 10 (90.9%) |
| 8 or more Rooms | 26 (14.0%) | 0 (0.0%) |
| Total | 186 (100.0%) | 11 (100.0%) |
Housing Structure by Heating Type in Dean
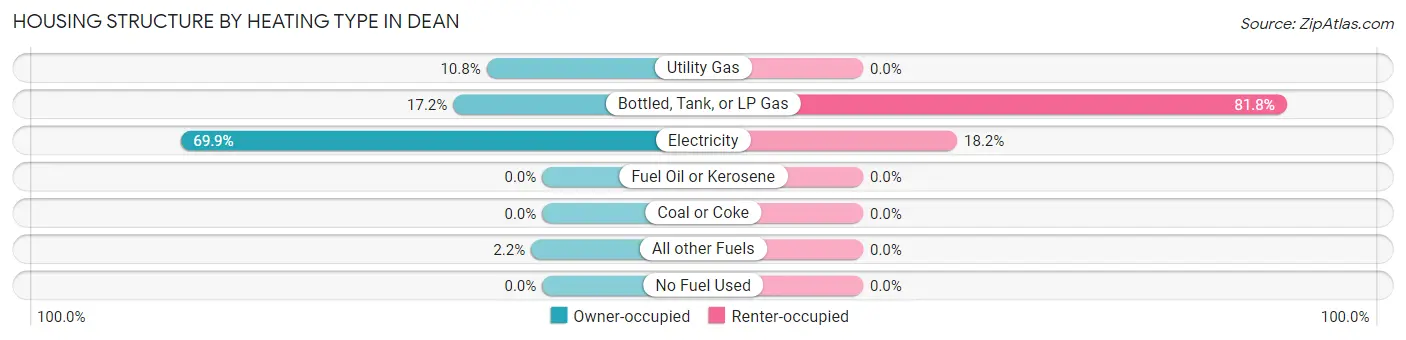
| Heating Type | Owner-occupied | Renter-occupied |
| Utility Gas | 20 (10.7%) | 0 (0.0%) |
| Bottled, Tank, or LP Gas | 32 (17.2%) | 9 (81.8%) |
| Electricity | 130 (69.9%) | 2 (18.2%) |
| Fuel Oil or Kerosene | 0 (0.0%) | 0 (0.0%) |
| Coal or Coke | 0 (0.0%) | 0 (0.0%) |
| All other Fuels | 4 (2.1%) | 0 (0.0%) |
| No Fuel Used | 0 (0.0%) | 0 (0.0%) |
| Total | 186 (100.0%) | 11 (100.0%) |
Household Vehicle Usage in Dean
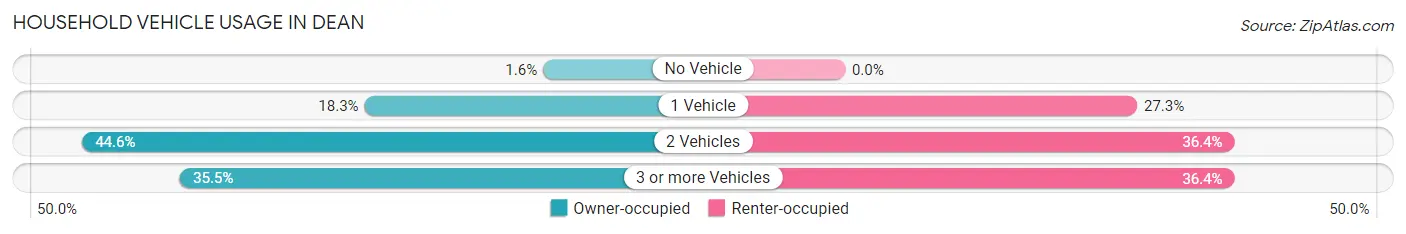
| Vehicles per Household | Owner-occupied | Renter-occupied |
| No Vehicle | 3 (1.6%) | 0 (0.0%) |
| 1 Vehicle | 34 (18.3%) | 3 (27.3%) |
| 2 Vehicles | 83 (44.6%) | 4 (36.4%) |
| 3 or more Vehicles | 66 (35.5%) | 4 (36.4%) |
| Total | 186 (100.0%) | 11 (100.0%) |
Real Estate & Mortgages in Dean
Real Estate and Mortgage Overview in Dean
| Characteristic | Without Mortgage | With Mortgage |
| Housing Units | 122 | 64 |
| Median Property Value | $132,100 | $246,200 |
| Median Household Income | $43,500 | $23 |
| Monthly Housing Costs | $600 | $2 |
| Real Estate Taxes | $1,550 | $3 |
Property Value by Mortgage Status in Dean
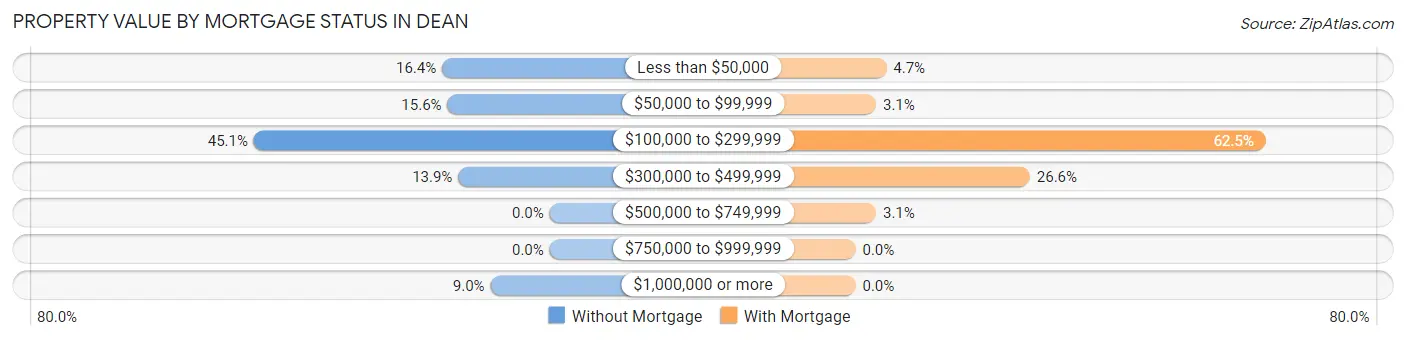
| Property Value | Without Mortgage | With Mortgage |
| Less than $50,000 | 20 (16.4%) | 3 (4.7%) |
| $50,000 to $99,999 | 19 (15.6%) | 2 (3.1%) |
| $100,000 to $299,999 | 55 (45.1%) | 40 (62.5%) |
| $300,000 to $499,999 | 17 (13.9%) | 17 (26.6%) |
| $500,000 to $749,999 | 0 (0.0%) | 2 (3.1%) |
| $750,000 to $999,999 | 0 (0.0%) | 0 (0.0%) |
| $1,000,000 or more | 11 (9.0%) | 0 (0.0%) |
| Total | 122 (100.0%) | 64 (100.0%) |
Household Income by Mortgage Status in Dean
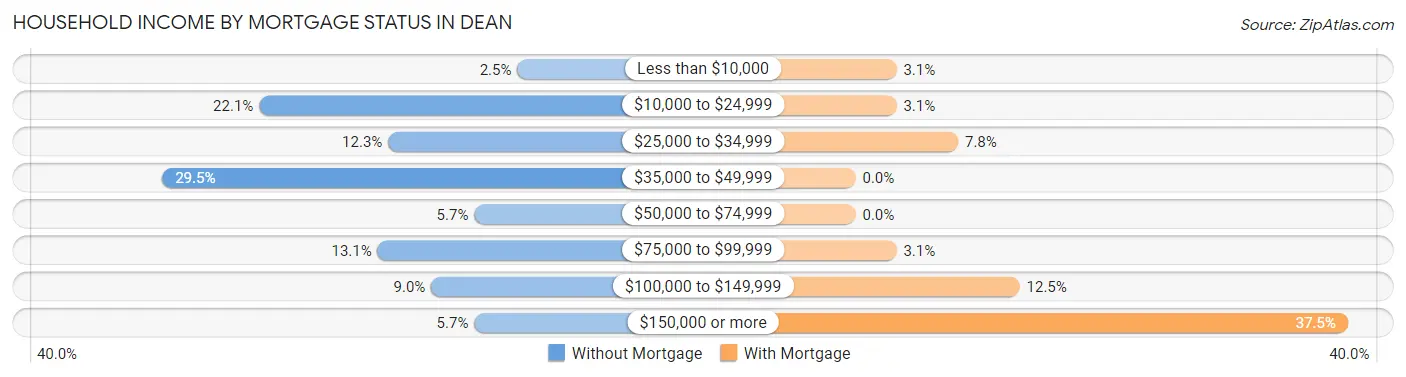
| Household Income | Without Mortgage | With Mortgage |
| Less than $10,000 | 3 (2.5%) | 2 (3.1%) |
| $10,000 to $24,999 | 27 (22.1%) | 2 (3.1%) |
| $25,000 to $34,999 | 15 (12.3%) | 5 (7.8%) |
| $35,000 to $49,999 | 36 (29.5%) | 0 (0.0%) |
| $50,000 to $74,999 | 7 (5.7%) | 0 (0.0%) |
| $75,000 to $99,999 | 16 (13.1%) | 2 (3.1%) |
| $100,000 to $149,999 | 11 (9.0%) | 8 (12.5%) |
| $150,000 or more | 7 (5.7%) | 24 (37.5%) |
| Total | 122 (100.0%) | 64 (100.0%) |
Property Value to Household Income Ratio in Dean
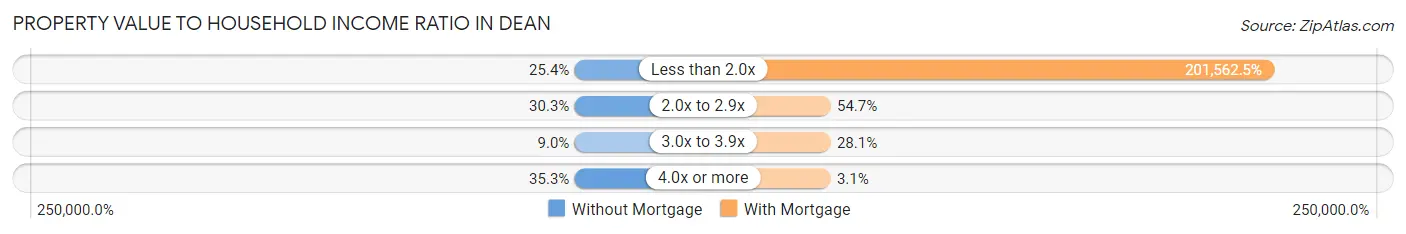
| Value-to-Income Ratio | Without Mortgage | With Mortgage |
| Less than 2.0x | 31 (25.4%) | 129,000 (201,562.5%) |
| 2.0x to 2.9x | 37 (30.3%) | 35 (54.7%) |
| 3.0x to 3.9x | 11 (9.0%) | 18 (28.1%) |
| 4.0x or more | 43 (35.2%) | 2 (3.1%) |
| Total | 122 (100.0%) | 64 (100.0%) |
Real Estate Taxes by Mortgage Status in Dean
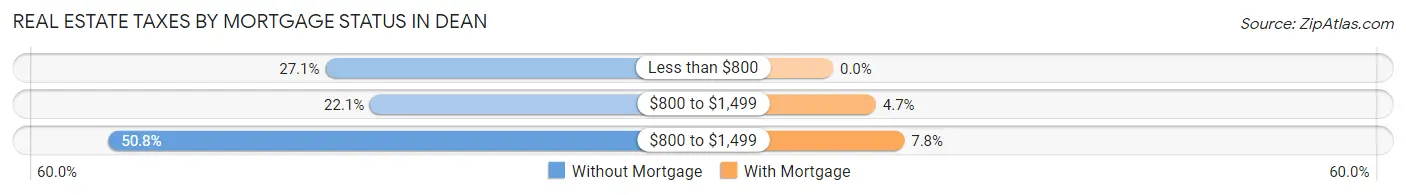
| Property Taxes | Without Mortgage | With Mortgage |
| Less than $800 | 33 (27.1%) | 0 (0.0%) |
| $800 to $1,499 | 27 (22.1%) | 3 (4.7%) |
| $800 to $1,499 | 62 (50.8%) | 5 (7.8%) |
| Total | 122 (100.0%) | 64 (100.0%) |
Health & Disability in Dean
Health Insurance Coverage by Age in Dean
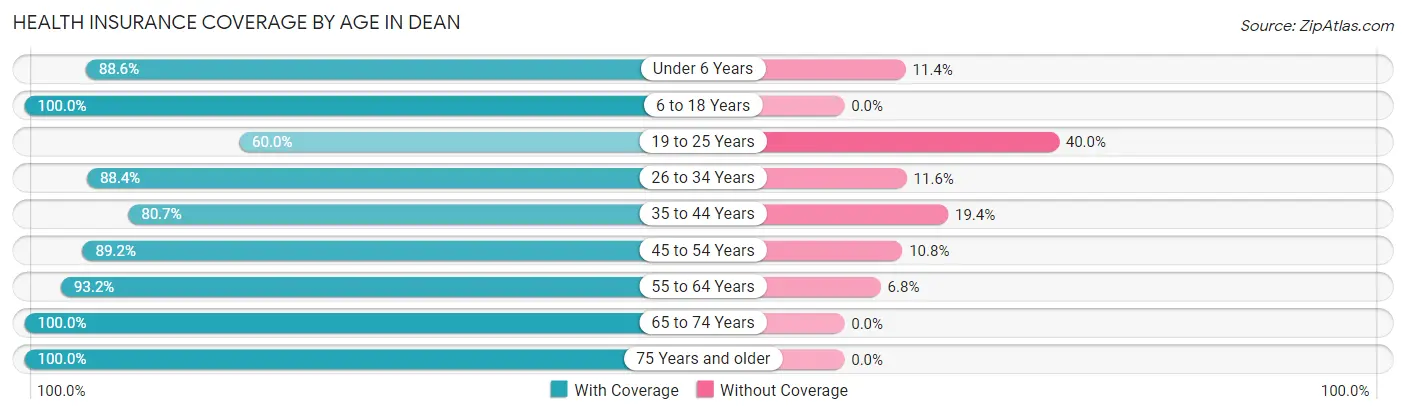
| Age Bracket | With Coverage | Without Coverage |
| Under 6 Years | 31 (88.6%) | 4 (11.4%) |
| 6 to 18 Years | 41 (100.0%) | 0 (0.0%) |
| 19 to 25 Years | 6 (60.0%) | 4 (40.0%) |
| 26 to 34 Years | 76 (88.4%) | 10 (11.6%) |
| 35 to 44 Years | 50 (80.6%) | 12 (19.4%) |
| 45 to 54 Years | 33 (89.2%) | 4 (10.8%) |
| 55 to 64 Years | 55 (93.2%) | 4 (6.8%) |
| 65 to 74 Years | 36 (100.0%) | 0 (0.0%) |
| 75 Years and older | 87 (100.0%) | 0 (0.0%) |
| Total | 415 (91.6%) | 38 (8.4%) |
Health Insurance Coverage by Citizenship Status in Dean
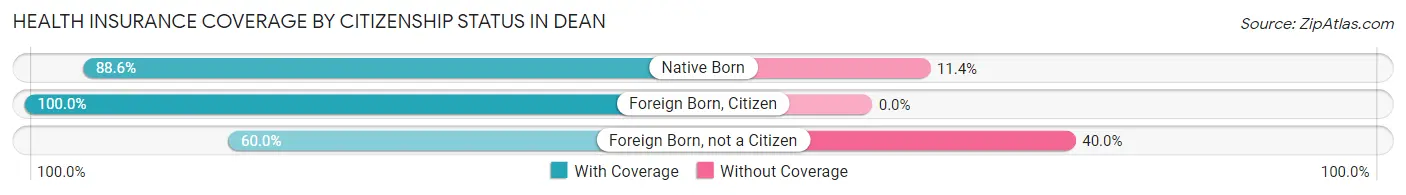
| Citizenship Status | With Coverage | Without Coverage |
| Native Born | 31 (88.6%) | 4 (11.4%) |
| Foreign Born, Citizen | 41 (100.0%) | 0 (0.0%) |
| Foreign Born, not a Citizen | 6 (60.0%) | 4 (40.0%) |
Health Insurance Coverage by Household Income in Dean
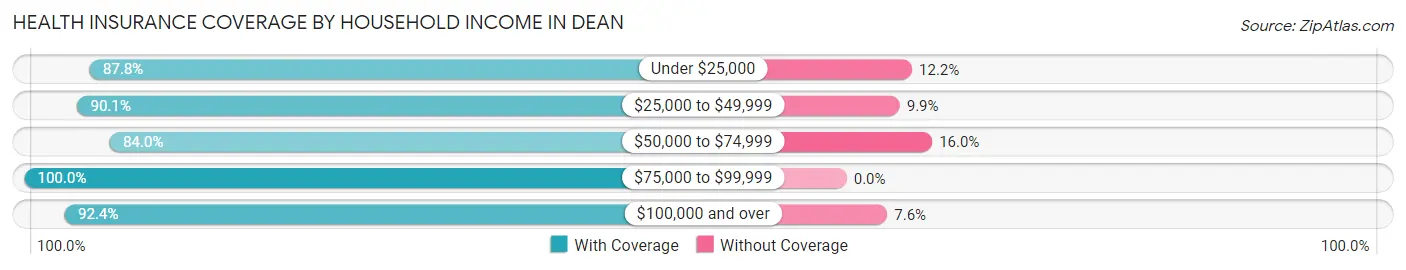
| Household Income | With Coverage | Without Coverage |
| Under $25,000 | 43 (87.8%) | 6 (12.2%) |
| $25,000 to $49,999 | 136 (90.1%) | 15 (9.9%) |
| $50,000 to $74,999 | 21 (84.0%) | 4 (16.0%) |
| $75,000 to $99,999 | 57 (100.0%) | 0 (0.0%) |
| $100,000 and over | 158 (92.4%) | 13 (7.6%) |
Public vs Private Health Insurance Coverage by Age in Dean
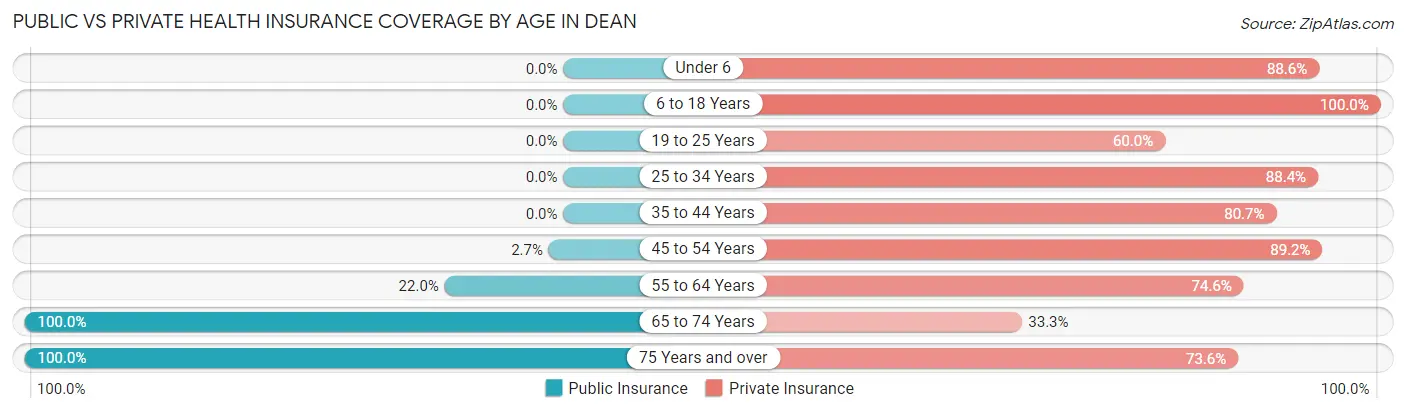
| Age Bracket | Public Insurance | Private Insurance |
| Under 6 | 0 (0.0%) | 31 (88.6%) |
| 6 to 18 Years | 0 (0.0%) | 41 (100.0%) |
| 19 to 25 Years | 0 (0.0%) | 6 (60.0%) |
| 25 to 34 Years | 0 (0.0%) | 76 (88.4%) |
| 35 to 44 Years | 0 (0.0%) | 50 (80.6%) |
| 45 to 54 Years | 1 (2.7%) | 33 (89.2%) |
| 55 to 64 Years | 13 (22.0%) | 44 (74.6%) |
| 65 to 74 Years | 36 (100.0%) | 12 (33.3%) |
| 75 Years and over | 87 (100.0%) | 64 (73.6%) |
| Total | 137 (30.2%) | 357 (78.8%) |
Disability Status by Sex by Age in Dean
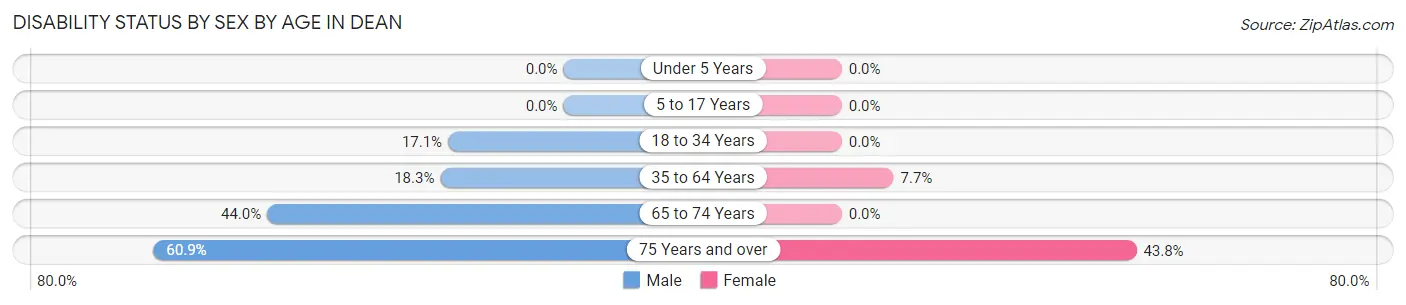
| Age Bracket | Male | Female |
| Under 5 Years | 0 (0.0%) | 0 (0.0%) |
| 5 to 17 Years | 0 (0.0%) | 0 (0.0%) |
| 18 to 34 Years | 6 (17.1%) | 0 (0.0%) |
| 35 to 64 Years | 17 (18.3%) | 5 (7.7%) |
| 65 to 74 Years | 11 (44.0%) | 0 (0.0%) |
| 75 Years and over | 14 (60.9%) | 28 (43.8%) |
Disability Class by Sex by Age in Dean
Disability Class: Hearing Difficulty
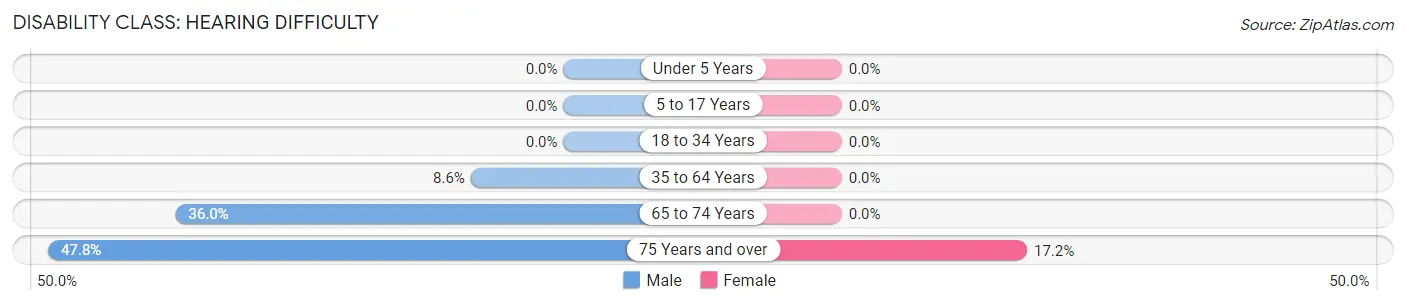
| Age Bracket | Male | Female |
| Under 5 Years | 0 (0.0%) | 0 (0.0%) |
| 5 to 17 Years | 0 (0.0%) | 0 (0.0%) |
| 18 to 34 Years | 0 (0.0%) | 0 (0.0%) |
| 35 to 64 Years | 8 (8.6%) | 0 (0.0%) |
| 65 to 74 Years | 9 (36.0%) | 0 (0.0%) |
| 75 Years and over | 11 (47.8%) | 11 (17.2%) |
Disability Class: Vision Difficulty
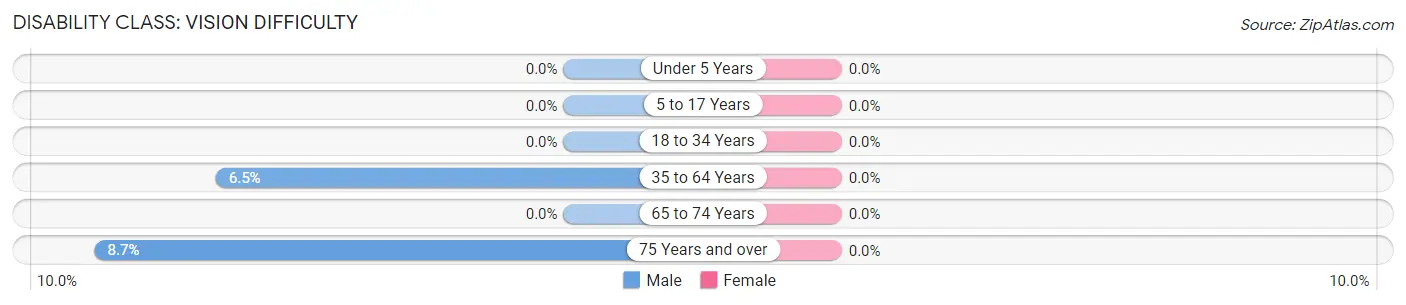
| Age Bracket | Male | Female |
| Under 5 Years | 0 (0.0%) | 0 (0.0%) |
| 5 to 17 Years | 0 (0.0%) | 0 (0.0%) |
| 18 to 34 Years | 0 (0.0%) | 0 (0.0%) |
| 35 to 64 Years | 6 (6.5%) | 0 (0.0%) |
| 65 to 74 Years | 0 (0.0%) | 0 (0.0%) |
| 75 Years and over | 2 (8.7%) | 0 (0.0%) |
Disability Class: Cognitive Difficulty
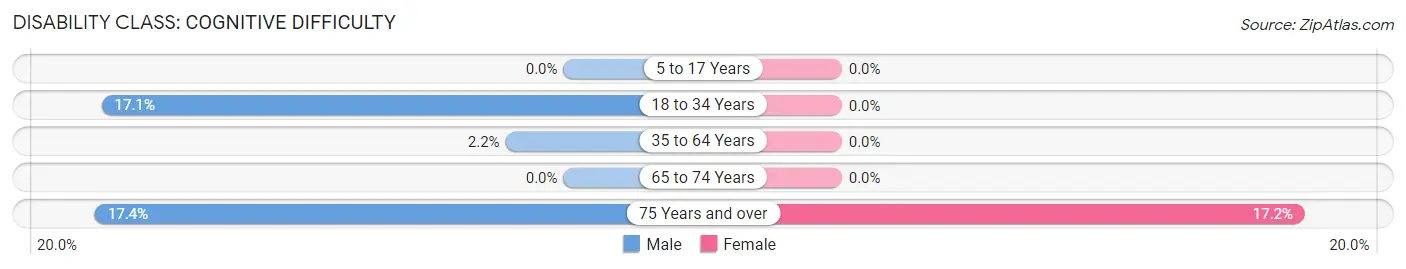
| Age Bracket | Male | Female |
| 5 to 17 Years | 0 (0.0%) | 0 (0.0%) |
| 18 to 34 Years | 6 (17.1%) | 0 (0.0%) |
| 35 to 64 Years | 2 (2.1%) | 0 (0.0%) |
| 65 to 74 Years | 0 (0.0%) | 0 (0.0%) |
| 75 Years and over | 4 (17.4%) | 11 (17.2%) |
Disability Class: Ambulatory Difficulty
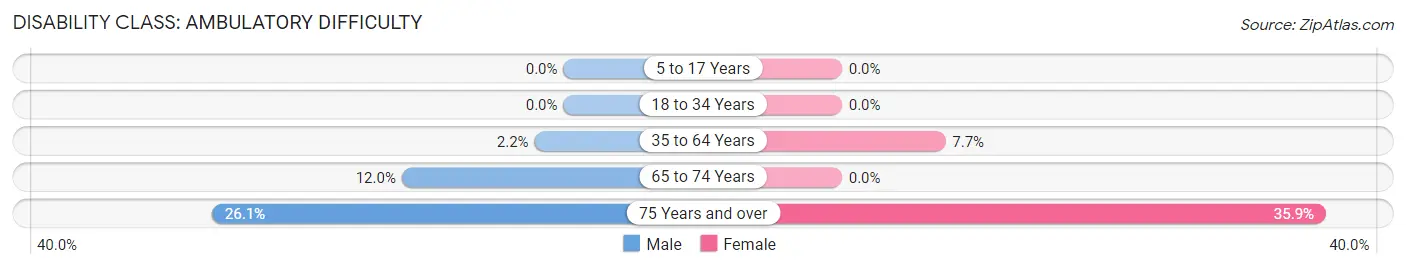
| Age Bracket | Male | Female |
| 5 to 17 Years | 0 (0.0%) | 0 (0.0%) |
| 18 to 34 Years | 0 (0.0%) | 0 (0.0%) |
| 35 to 64 Years | 2 (2.1%) | 5 (7.7%) |
| 65 to 74 Years | 3 (12.0%) | 0 (0.0%) |
| 75 Years and over | 6 (26.1%) | 23 (35.9%) |
Disability Class: Self-Care Difficulty
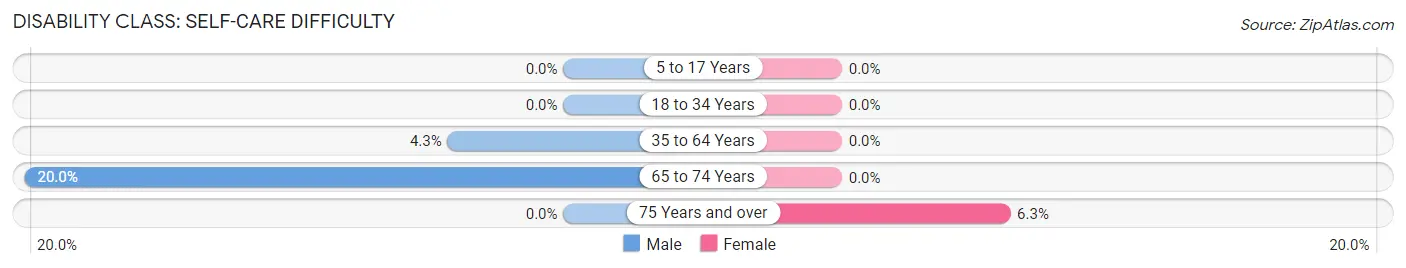
| Age Bracket | Male | Female |
| 5 to 17 Years | 0 (0.0%) | 0 (0.0%) |
| 18 to 34 Years | 0 (0.0%) | 0 (0.0%) |
| 35 to 64 Years | 4 (4.3%) | 0 (0.0%) |
| 65 to 74 Years | 5 (20.0%) | 0 (0.0%) |
| 75 Years and over | 0 (0.0%) | 4 (6.2%) |
Technology Access in Dean
Computing Device Access in Dean
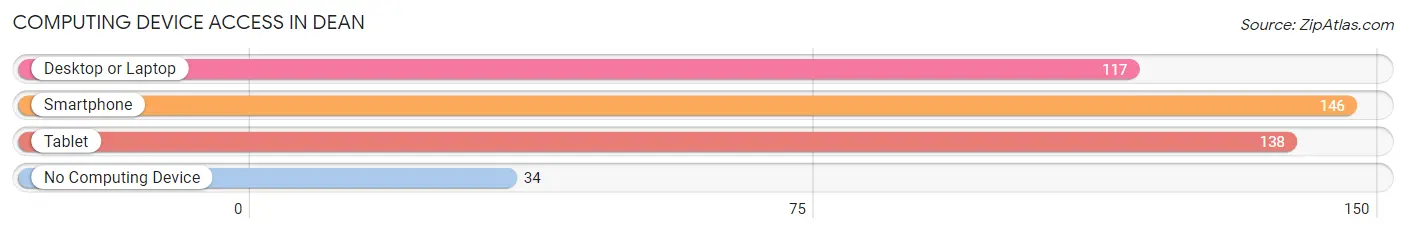
| Device Type | # Households | % Households |
| Desktop or Laptop | 117 | 59.4% |
| Smartphone | 146 | 74.1% |
| Tablet | 138 | 70.1% |
| No Computing Device | 34 | 17.3% |
| Total | 197 | 100.0% |
Internet Access in Dean
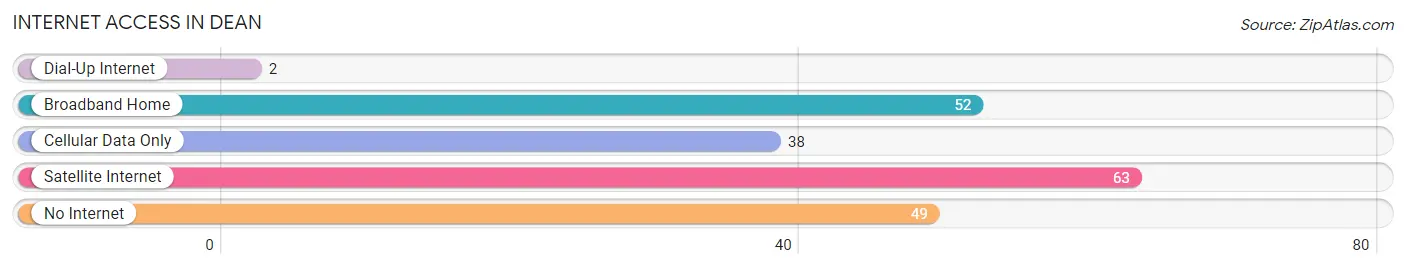
| Internet Type | # Households | % Households |
| Dial-Up Internet | 2 | 1.0% |
| Broadband Home | 52 | 26.4% |
| Cellular Data Only | 38 | 19.3% |
| Satellite Internet | 63 | 32.0% |
| No Internet | 49 | 24.9% |
| Total | 197 | 100.0% |
Dean Summary
Dean, Texas is a small town located in the western part of Stephens County, Texas. It is situated about 20 miles east of Breckenridge and about 30 miles west of Eastland. The population of Dean, Texas was estimated to be around 200 people in 2020.
History
Dean, Texas was founded in 1881 by a group of settlers from Missouri. The town was named after the Dean family, who were among the first settlers. The town was originally located in the eastern part of Stephens County, but was moved to its current location in 1883.
The town was a thriving community in the early 1900s, with a population of over 500 people. It had a post office, a school, a church, a general store, and a cotton gin. The town also had a blacksmith shop, a livery stable, and a hotel.
In the 1920s, the town began to decline due to the Great Depression and the Dust Bowl. By the 1940s, the population had dropped to around 200 people. The town continued to decline until the 1970s, when it began to experience a resurgence.
Geography
Dean, Texas is located in the western part of Stephens County, Texas. It is situated about 20 miles east of Breckenridge and about 30 miles west of Eastland. The town is located in the rolling hills of the Texas Hill Country. The terrain is mostly flat, with some hills and valleys.
The climate in Dean, Texas is semi-arid, with hot summers and mild winters. The average annual temperature is around 70 degrees Fahrenheit. The average annual precipitation is around 25 inches.
Economy
The economy of Dean, Texas is largely based on agriculture. The town is home to several farms and ranches, which produce a variety of crops, including cotton, corn, wheat, and hay. The town also has a few small businesses, including a gas station, a grocery store, and a few restaurants.
Demographics
The population of Dean, Texas was estimated to be around 200 people in 2020. The racial makeup of the town is predominantly white, with a small percentage of African Americans and Hispanics. The median household income is around $35,000, and the median home value is around $90,000.
The town is served by the Breckenridge Independent School District. The town has one elementary school, one middle school, and one high school. The town also has a public library and a few churches.
Conclusion
Dean, Texas is a small town located in the western part of Stephens County, Texas. It is situated about 20 miles east of Breckenridge and about 30 miles west of Eastland. The population of Dean, Texas was estimated to be around 200 people in 2020. The town is largely based on agriculture, with a few small businesses and a few churches. The racial makeup of the town is predominantly white, with a small percentage of African Americans and Hispanics. The median household income is around $35,000, and the median home value is around $90,000.
Common Questions
What is Per Capita Income in Dean?
Per Capita income in Dean is $36,135.
What is the Median Family Income in Dean?
Median Family Income in Dean is $76,250.
What is the Median Household income in Dean?
Median Household Income in Dean is $49,931.
What is Income or Wage Gap in Dean?
Income or Wage Gap in Dean is 21.3%.
Women in Dean earn 78.7 cents for every dollar earned by a man.
What is Family Income Deficit in Dean?
Family Income Deficit in Dean is $9,238.
Families that are below poverty line in Dean earn $9,238 less on average than the poverty threshold level.
What is Inequality or Gini Index in Dean?
Inequality or Gini Index in Dean is 0.41.
What is the Total Population of Dean?
Total Population of Dean is 453.
What is the Total Male Population of Dean?
Total Male Population of Dean is 211.
What is the Total Female Population of Dean?
Total Female Population of Dean is 242.
What is the Ratio of Males per 100 Females in Dean?
There are 87.19 Males per 100 Females in Dean.
What is the Ratio of Females per 100 Males in Dean?
There are 114.69 Females per 100 Males in Dean.
What is the Median Population Age in Dean?
Median Population Age in Dean is 43.7 Years.
What is the Average Family Size in Dean
Average Family Size in Dean is 2.6 People.
What is the Average Household Size in Dean
Average Household Size in Dean is 2.3 People.
How Large is the Labor Force in Dean?
There are 198 People in the Labor Forcein in Dean.
What is the Percentage of People in the Labor Force in Dean?
51.3% of People are in the Labor Force in Dean.
What is the Unemployment Rate in Dean?
Unemployment Rate in Dean is 1.0%.