Timberwood Park, TX Map & Demographics
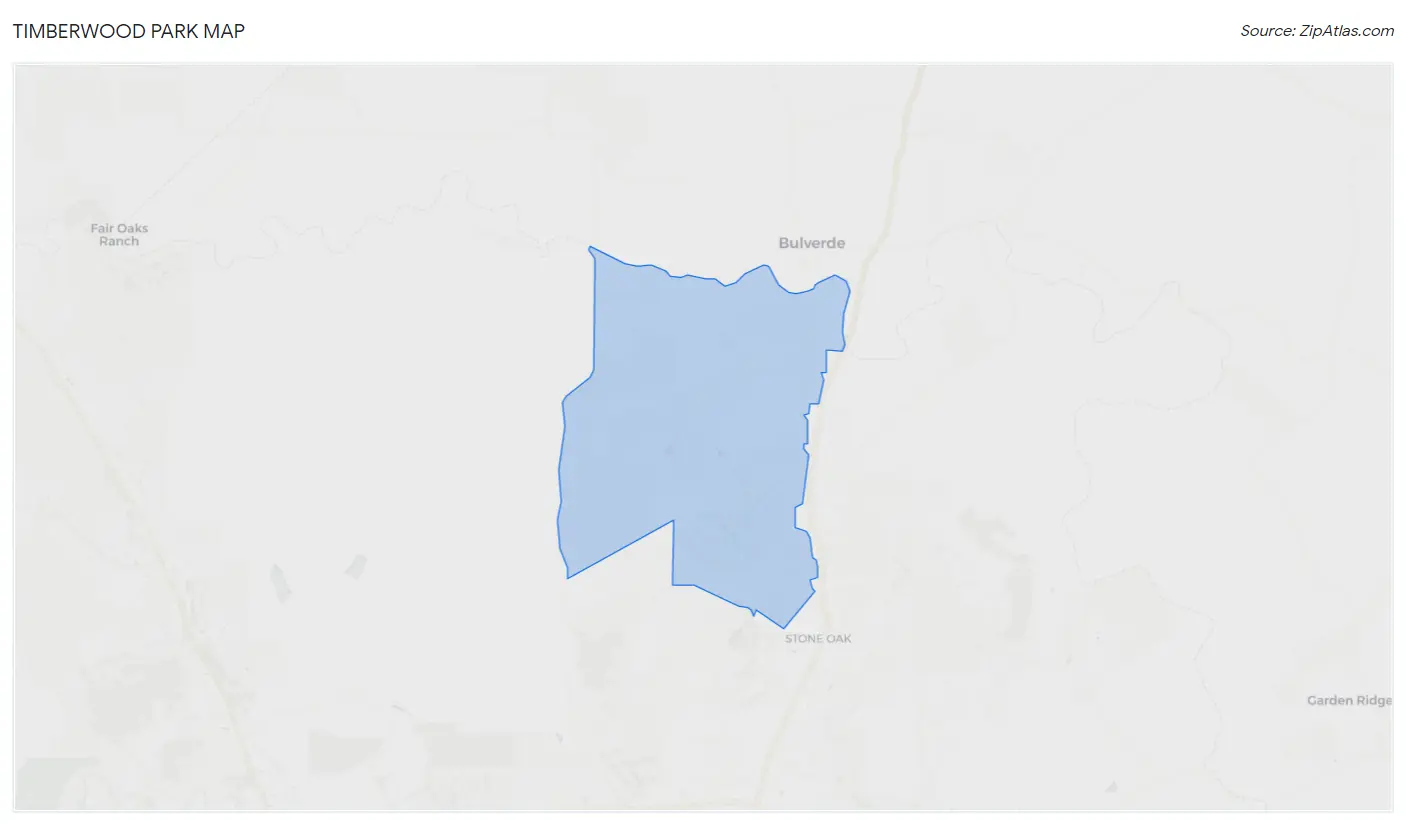
Timberwood Park Map
Timberwood Park Overview
$54,878
PER CAPITA INCOME
$155,056
AVG FAMILY INCOME
$135,709
AVG HOUSEHOLD INCOME
46.1%
WAGE / INCOME GAP [ % ]
53.9¢/ $1
WAGE / INCOME GAP [ $ ]
0.41
INEQUALITY / GINI INDEX
34,253
TOTAL POPULATION
16,606
MALE POPULATION
17,647
FEMALE POPULATION
94.10
MALES / 100 FEMALES
106.27
FEMALES / 100 MALES
39.1
MEDIAN AGE
3.5
AVG FAMILY SIZE
3.0
AVG HOUSEHOLD SIZE
18,028
LABOR FORCE [ PEOPLE ]
69.6%
PERCENT IN LABOR FORCE
3.5%
UNEMPLOYMENT RATE
Income in Timberwood Park
Income Overview in Timberwood Park
Per Capita Income in Timberwood Park is $54,878, while median incomes of families and households are $155,056 and $135,709 respectively.
| Characteristic | Number | Measure |
| Per Capita Income | 34,253 | $54,878 |
| Median Family Income | 8,987 | $155,056 |
| Mean Family Income | 8,987 | $181,688 |
| Median Household Income | 11,386 | $135,709 |
| Mean Household Income | 11,386 | $163,912 |
| Income Deficit | 8,987 | $0 |
| Wage / Income Gap (%) | 34,253 | 46.15% |
| Wage / Income Gap ($) | 34,253 | 53.85¢ per $1 |
| Gini / Inequality Index | 34,253 | 0.41 |
Earnings by Sex in Timberwood Park
Average Earnings in Timberwood Park are $59,031, $80,202 for men and $43,191 for women, a difference of 46.2%.
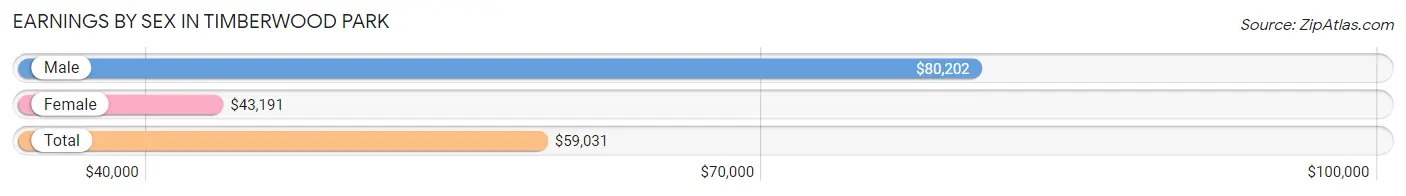
| Sex | Number | Average Earnings |
| Male | 10,363 (56.0%) | $80,202 |
| Female | 8,156 (44.0%) | $43,191 |
| Total | 18,519 (100.0%) | $59,031 |
Earnings by Sex by Income Bracket in Timberwood Park
The most common earnings brackets in Timberwood Park are $100,000+ for men (3,964 | 38.3%) and $100,000+ for women (1,681 | 20.6%).
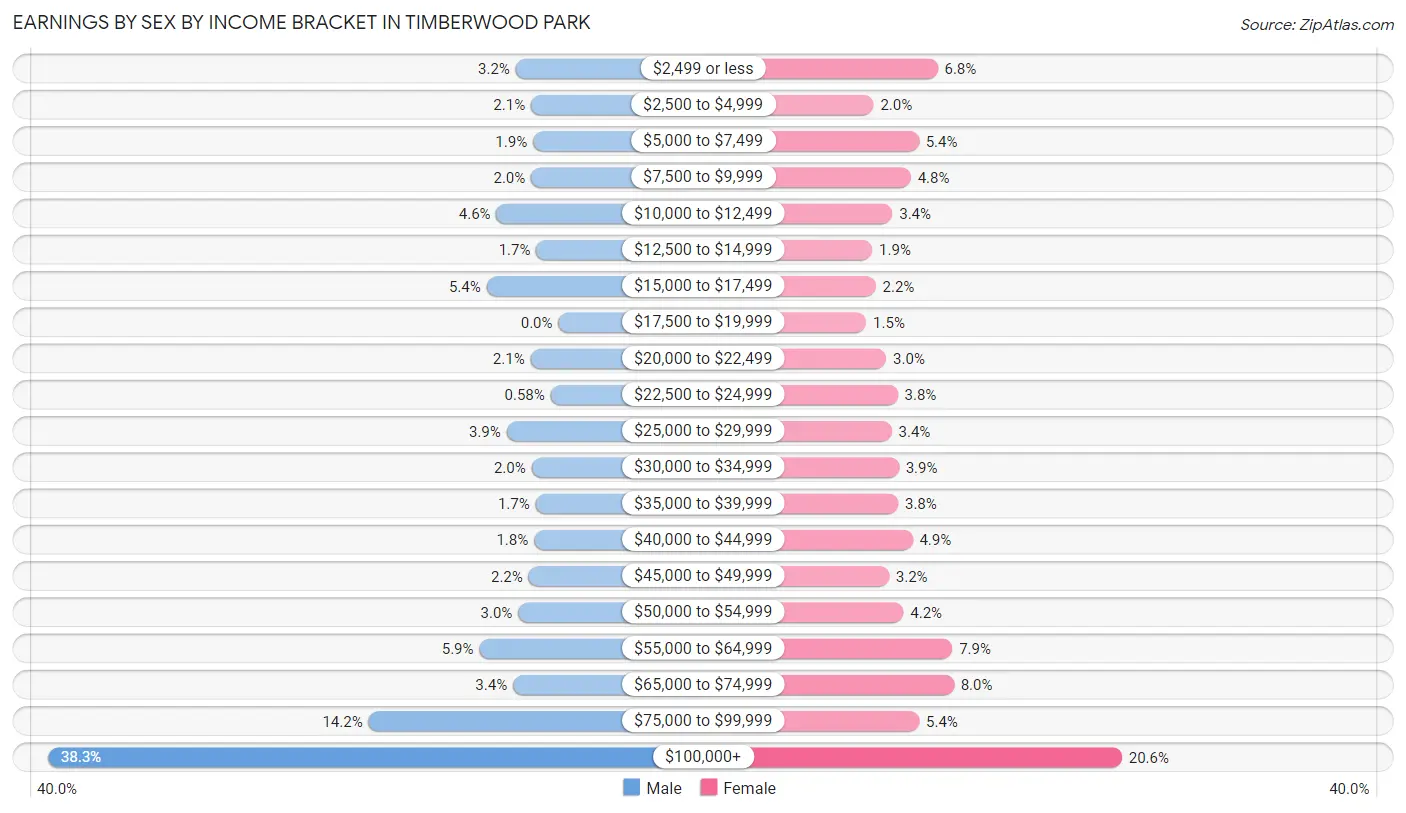
| Income | Male | Female |
| $2,499 or less | 332 (3.2%) | 555 (6.8%) |
| $2,500 to $4,999 | 212 (2.1%) | 163 (2.0%) |
| $5,000 to $7,499 | 197 (1.9%) | 440 (5.4%) |
| $7,500 to $9,999 | 211 (2.0%) | 391 (4.8%) |
| $10,000 to $12,499 | 481 (4.6%) | 278 (3.4%) |
| $12,500 to $14,999 | 171 (1.7%) | 155 (1.9%) |
| $15,000 to $17,499 | 558 (5.4%) | 176 (2.2%) |
| $17,500 to $19,999 | 0 (0.0%) | 118 (1.5%) |
| $20,000 to $22,499 | 217 (2.1%) | 241 (2.9%) |
| $22,500 to $24,999 | 60 (0.6%) | 311 (3.8%) |
| $25,000 to $29,999 | 402 (3.9%) | 274 (3.4%) |
| $30,000 to $34,999 | 208 (2.0%) | 317 (3.9%) |
| $35,000 to $39,999 | 177 (1.7%) | 313 (3.8%) |
| $40,000 to $44,999 | 189 (1.8%) | 401 (4.9%) |
| $45,000 to $49,999 | 231 (2.2%) | 257 (3.2%) |
| $50,000 to $54,999 | 312 (3.0%) | 346 (4.2%) |
| $55,000 to $64,999 | 614 (5.9%) | 644 (7.9%) |
| $65,000 to $74,999 | 352 (3.4%) | 653 (8.0%) |
| $75,000 to $99,999 | 1,475 (14.2%) | 442 (5.4%) |
| $100,000+ | 3,964 (38.3%) | 1,681 (20.6%) |
| Total | 10,363 (100.0%) | 8,156 (100.0%) |
Earnings by Sex by Educational Attainment in Timberwood Park
Average earnings in Timberwood Park are $90,329 for men and $53,263 for women, a difference of 41.0%. Men with an educational attainment of graduate degree enjoy the highest average annual earnings of $137,813, while those with high school diploma education earn the least with $54,809. Women with an educational attainment of graduate degree earn the most with the average annual earnings of $74,481, while those with college or associate's degree education have the smallest earnings of $30,000.
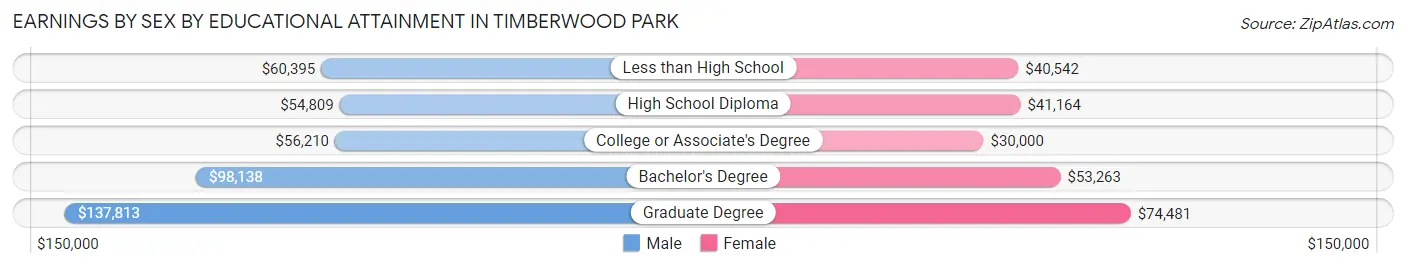
| Educational Attainment | Male Income | Female Income |
| Less than High School | $60,395 | $40,542 |
| High School Diploma | $54,809 | $41,164 |
| College or Associate's Degree | $56,210 | $30,000 |
| Bachelor's Degree | $98,138 | $53,263 |
| Graduate Degree | $137,813 | $74,481 |
| Total | $90,329 | $53,263 |
Family Income in Timberwood Park
Family Income Brackets in Timberwood Park
According to the Timberwood Park family income data, there are 2,741 families falling into the $200,000+ income range, which is the most common income bracket and makes up 30.5% of all families. Conversely, the $10,000 to $14,999 income bracket is the least frequent group with only 45 families (0.5%) belonging to this category.
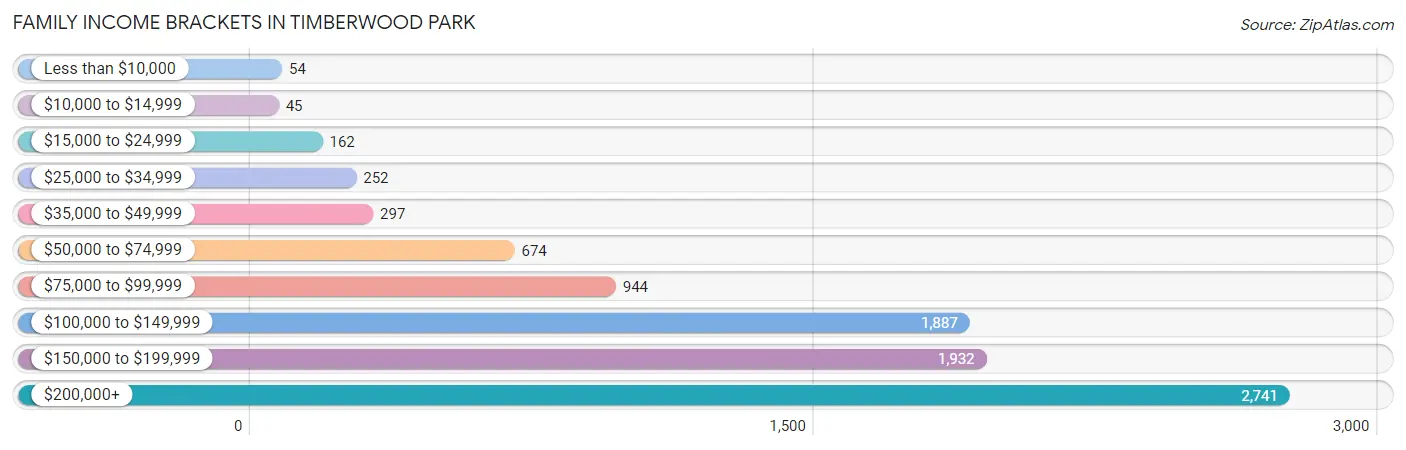
| Income Bracket | # Families | % Families |
| Less than $10,000 | 54 | 0.6% |
| $10,000 to $14,999 | 45 | 0.5% |
| $15,000 to $24,999 | 162 | 1.8% |
| $25,000 to $34,999 | 252 | 2.8% |
| $35,000 to $49,999 | 297 | 3.3% |
| $50,000 to $74,999 | 674 | 7.5% |
| $75,000 to $99,999 | 944 | 10.5% |
| $100,000 to $149,999 | 1,887 | 21.0% |
| $150,000 to $199,999 | 1,932 | 21.5% |
| $200,000+ | 2,741 | 30.5% |
Family Income by Famaliy Size in Timberwood Park
6-person families (199 | 2.2%) account for the highest median family income in Timberwood Park with $250,001 per family, while 2-person families (3,418 | 38.0%) have the highest median income of $64,718 per family member.
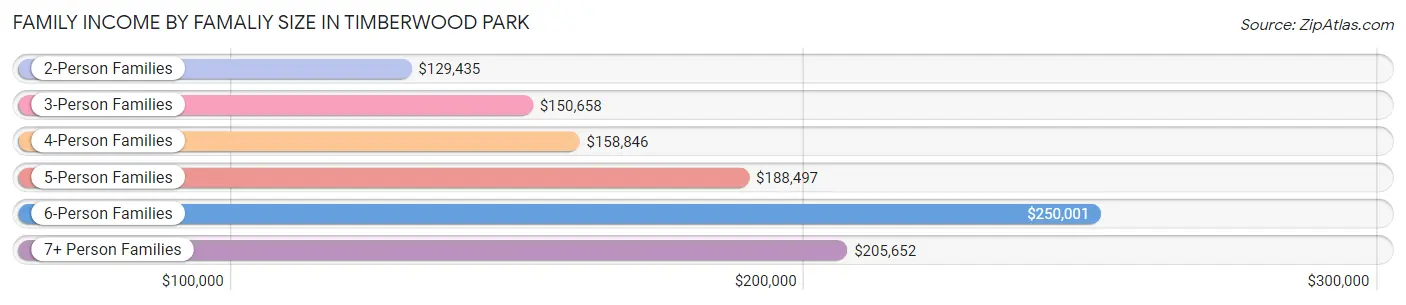
| Income Bracket | # Families | Median Income |
| 2-Person Families | 3,418 (38.0%) | $129,435 |
| 3-Person Families | 1,314 (14.6%) | $150,658 |
| 4-Person Families | 2,404 (26.8%) | $158,846 |
| 5-Person Families | 1,344 (14.9%) | $188,497 |
| 6-Person Families | 199 (2.2%) | $250,001 |
| 7+ Person Families | 308 (3.4%) | $205,652 |
| Total | 8,987 (100.0%) | $155,056 |
Family Income by Number of Earners in Timberwood Park
The median family income in Timberwood Park is $155,056, with families comprising 3+ earners (1,439) having the highest median family income of $196,938, while families with no earners (837) have the lowest median family income of $75,052, accounting for 16.0% and 9.3% of families, respectively.
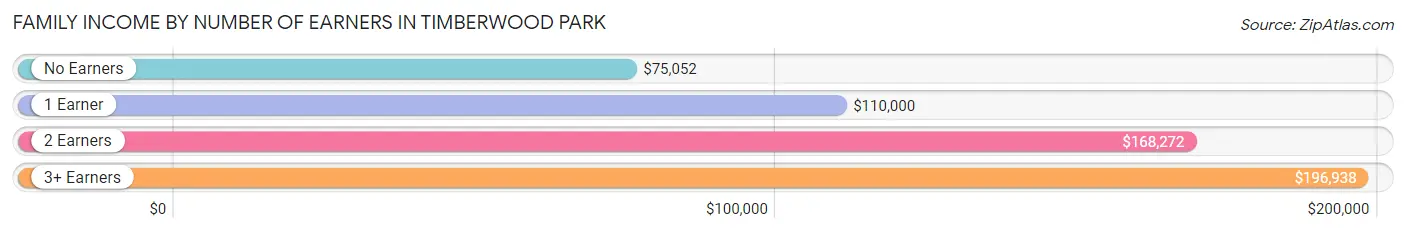
| Number of Earners | # Families | Median Income |
| No Earners | 837 (9.3%) | $75,052 |
| 1 Earner | 2,398 (26.7%) | $110,000 |
| 2 Earners | 4,313 (48.0%) | $168,272 |
| 3+ Earners | 1,439 (16.0%) | $196,938 |
| Total | 8,987 (100.0%) | $155,056 |
Household Income in Timberwood Park
Household Income Brackets in Timberwood Park
With 2,960 households falling in the category, the $200,000+ income range is the most frequent in Timberwood Park, accounting for 26.0% of all households. In contrast, only 68 households (0.6%) fall into the $10,000 to $14,999 income bracket, making it the least populous group.
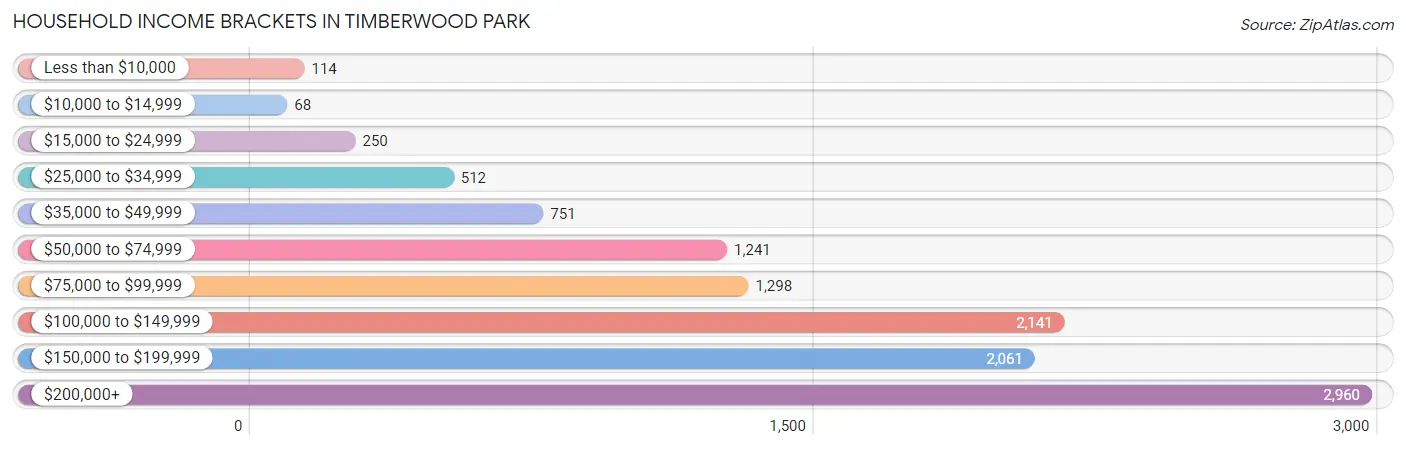
| Income Bracket | # Households | % Households |
| Less than $10,000 | 114 | 1.0% |
| $10,000 to $14,999 | 68 | 0.6% |
| $15,000 to $24,999 | 250 | 2.2% |
| $25,000 to $34,999 | 512 | 4.5% |
| $35,000 to $49,999 | 751 | 6.6% |
| $50,000 to $74,999 | 1,241 | 10.9% |
| $75,000 to $99,999 | 1,298 | 11.4% |
| $100,000 to $149,999 | 2,141 | 18.8% |
| $150,000 to $199,999 | 2,061 | 18.1% |
| $200,000+ | 2,960 | 26.0% |
Household Income by Householder Age in Timberwood Park
The median household income in Timberwood Park is $135,709, with the highest median household income of $164,424 found in the 45 to 64 years age bracket for the primary householder. A total of 5,021 households (44.1%) fall into this category. Meanwhile, the 15 to 24 years age bracket for the primary householder has the lowest median household income of $49,528, with 159 households (1.4%) in this group.
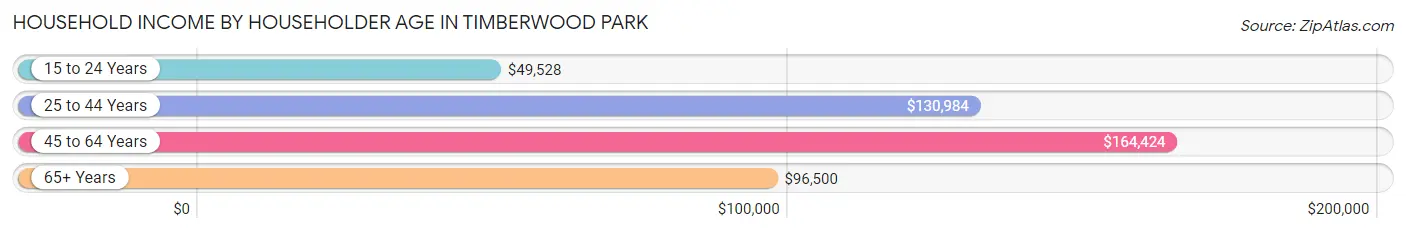
| Income Bracket | # Households | Median Income |
| 15 to 24 Years | 159 (1.4%) | $49,528 |
| 25 to 44 Years | 4,122 (36.2%) | $130,984 |
| 45 to 64 Years | 5,021 (44.1%) | $164,424 |
| 65+ Years | 2,084 (18.3%) | $96,500 |
| Total | 11,386 (100.0%) | $135,709 |
Poverty in Timberwood Park
Income Below Poverty by Sex and Age in Timberwood Park
With 4.9% poverty level for males and 5.2% for females among the residents of Timberwood Park, 12 to 14 year old males and 5 year old females are the most vulnerable to poverty, with 210 males (25.6%) and 79 females (19.8%) in their respective age groups living below the poverty level.
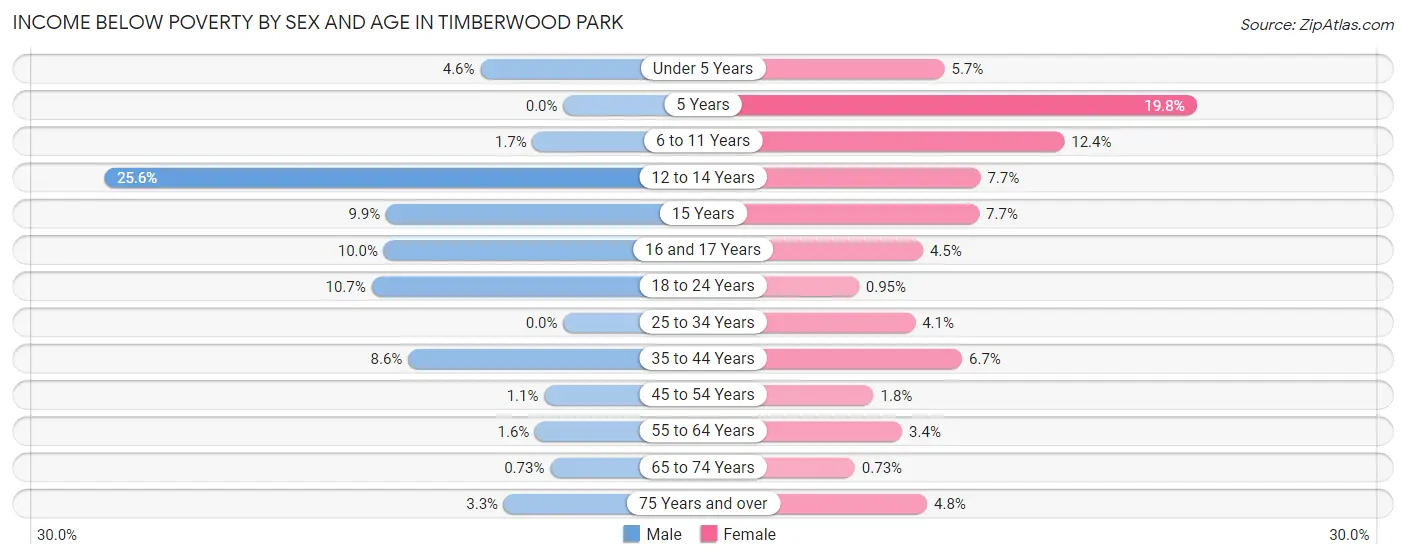
| Age Bracket | Male | Female |
| Under 5 Years | 35 (4.6%) | 70 (5.7%) |
| 5 Years | 0 (0.0%) | 79 (19.8%) |
| 6 to 11 Years | 26 (1.7%) | 204 (12.4%) |
| 12 to 14 Years | 210 (25.6%) | 91 (7.7%) |
| 15 Years | 15 (9.9%) | 27 (7.6%) |
| 16 and 17 Years | 41 (10.0%) | 25 (4.5%) |
| 18 to 24 Years | 133 (10.7%) | 9 (0.9%) |
| 25 to 34 Years | 0 (0.0%) | 70 (4.1%) |
| 35 to 44 Years | 251 (8.6%) | 188 (6.7%) |
| 45 to 54 Years | 30 (1.1%) | 46 (1.8%) |
| 55 to 64 Years | 32 (1.6%) | 61 (3.4%) |
| 65 to 74 Years | 11 (0.7%) | 11 (0.7%) |
| 75 Years and over | 24 (3.3%) | 43 (4.8%) |
| Total | 808 (4.9%) | 924 (5.2%) |
Income Above Poverty by Sex and Age in Timberwood Park
According to the poverty statistics in Timberwood Park, males aged 5 years and females aged 65 to 74 years are the age groups that are most secure financially, with 100.0% of males and 99.3% of females in these age groups living above the poverty line.
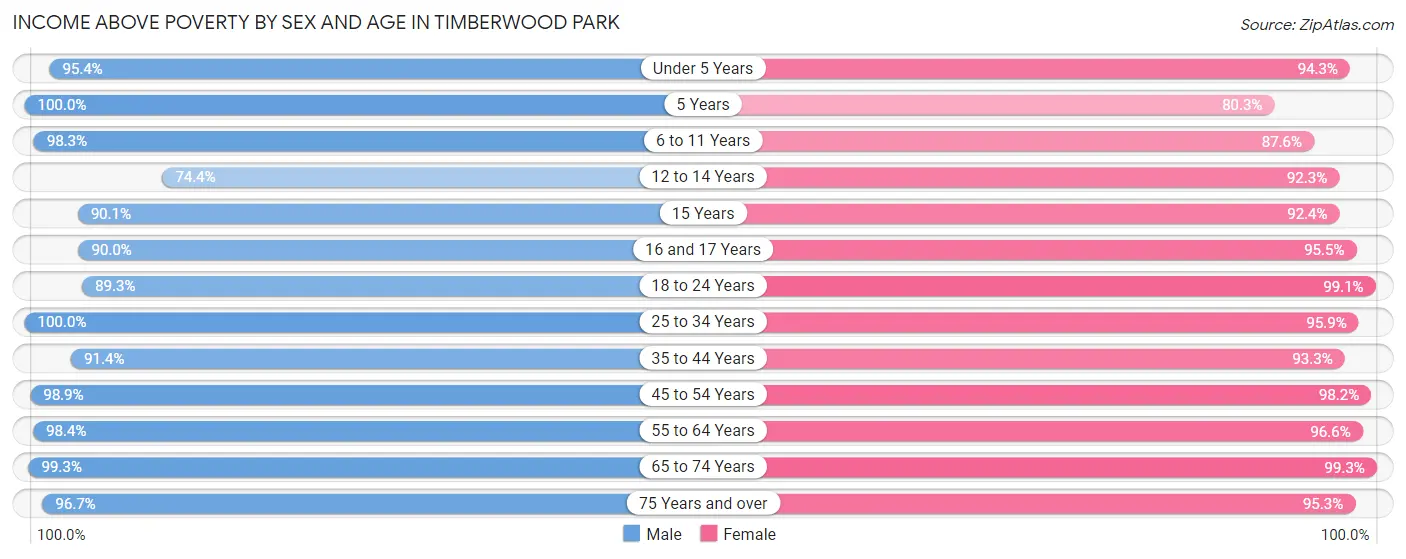
| Age Bracket | Male | Female |
| Under 5 Years | 722 (95.4%) | 1,153 (94.3%) |
| 5 Years | 270 (100.0%) | 321 (80.2%) |
| 6 to 11 Years | 1,494 (98.3%) | 1,442 (87.6%) |
| 12 to 14 Years | 611 (74.4%) | 1,087 (92.3%) |
| 15 Years | 137 (90.1%) | 326 (92.3%) |
| 16 and 17 Years | 369 (90.0%) | 528 (95.5%) |
| 18 to 24 Years | 1,112 (89.3%) | 942 (99.1%) |
| 25 to 34 Years | 1,389 (100.0%) | 1,643 (95.9%) |
| 35 to 44 Years | 2,654 (91.4%) | 2,616 (93.3%) |
| 45 to 54 Years | 2,809 (98.9%) | 2,554 (98.2%) |
| 55 to 64 Years | 2,011 (98.4%) | 1,754 (96.6%) |
| 65 to 74 Years | 1,488 (99.3%) | 1,494 (99.3%) |
| 75 Years and over | 702 (96.7%) | 863 (95.3%) |
| Total | 15,768 (95.1%) | 16,723 (94.8%) |
Income Below Poverty Among Married-Couple Families in Timberwood Park
The poverty statistics for married-couple families in Timberwood Park show that 3.2% or 263 of the total 8,128 families live below the poverty line. Families with 5 or more children have the highest poverty rate of 51.4%, comprising of 55 families. On the other hand, families with no children have the lowest poverty rate of 0.3%, which includes 11 families.
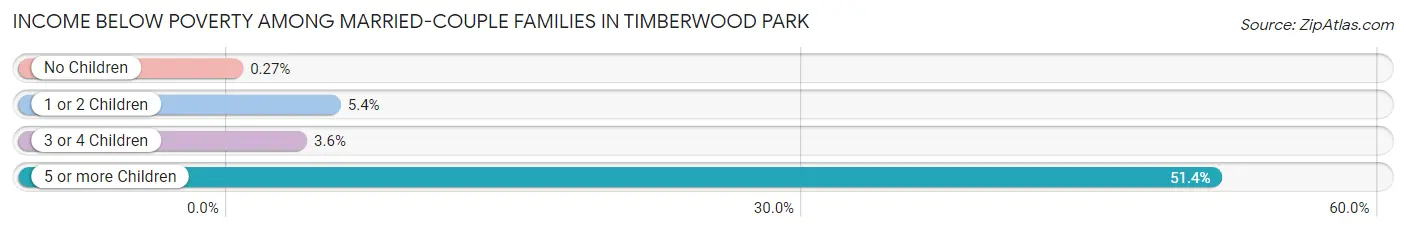
| Children | Above Poverty | Below Poverty |
| No Children | 4,103 (99.7%) | 11 (0.3%) |
| 1 or 2 Children | 3,015 (94.6%) | 171 (5.4%) |
| 3 or 4 Children | 695 (96.4%) | 26 (3.6%) |
| 5 or more Children | 52 (48.6%) | 55 (51.4%) |
| Total | 7,865 (96.8%) | 263 (3.2%) |
Income Below Poverty Among Single-Parent Households in Timberwood Park
According to the poverty data in Timberwood Park, 3.4% or 8 single-father households and 9.3% or 58 single-mother households are living below the poverty line. Among single-father households, those with no children have the highest poverty rate, with 8 households (13.8%) experiencing poverty. Likewise, among single-mother households, those with 3 or 4 children have the highest poverty rate, with 9 households (47.4%) falling below the poverty line.
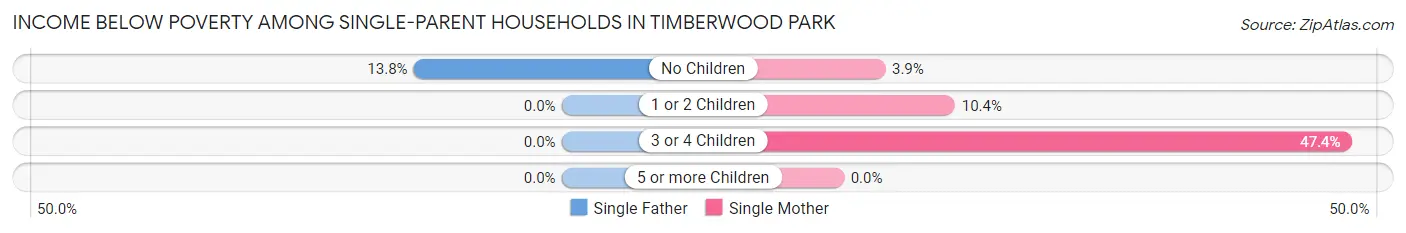
| Children | Single Father | Single Mother |
| No Children | 8 (13.8%) | 8 (3.8%) |
| 1 or 2 Children | 0 (0.0%) | 41 (10.3%) |
| 3 or 4 Children | 0 (0.0%) | 9 (47.4%) |
| 5 or more Children | 0 (0.0%) | 0 (0.0%) |
| Total | 8 (3.4%) | 58 (9.3%) |
Income Below Poverty Among Married-Couple vs Single-Parent Households in Timberwood Park
The poverty data for Timberwood Park shows that 263 of the married-couple family households (3.2%) and 66 of the single-parent households (7.7%) are living below the poverty level. Within the married-couple family households, those with 5 or more children have the highest poverty rate, with 55 households (51.4%) falling below the poverty line. Among the single-parent households, those with 3 or 4 children have the highest poverty rate, with 9 household (13.9%) living below poverty.
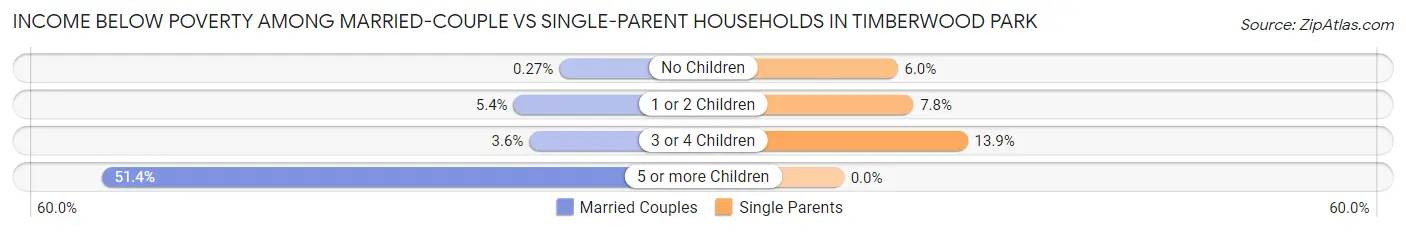
| Children | Married-Couple Families | Single-Parent Households |
| No Children | 11 (0.3%) | 16 (6.0%) |
| 1 or 2 Children | 171 (5.4%) | 41 (7.8%) |
| 3 or 4 Children | 26 (3.6%) | 9 (13.9%) |
| 5 or more Children | 55 (51.4%) | 0 (0.0%) |
| Total | 263 (3.2%) | 66 (7.7%) |
Race in Timberwood Park
The most populous races in Timberwood Park are White / Caucasian (22,908 | 66.9%), Hispanic or Latino (12,208 | 35.6%), and Two or more Races (5,949 | 17.4%).
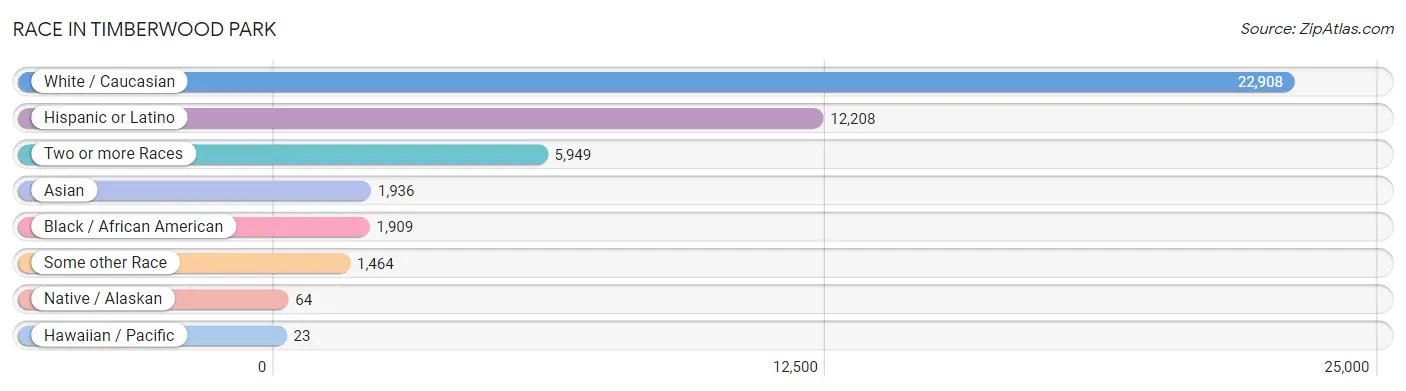
| Race | # Population | % Population |
| Asian | 1,936 | 5.7% |
| Black / African American | 1,909 | 5.6% |
| Hawaiian / Pacific | 23 | 0.1% |
| Hispanic or Latino | 12,208 | 35.6% |
| Native / Alaskan | 64 | 0.2% |
| White / Caucasian | 22,908 | 66.9% |
| Two or more Races | 5,949 | 17.4% |
| Some other Race | 1,464 | 4.3% |
| Total | 34,253 | 100.0% |
Ancestry in Timberwood Park
The most populous ancestries reported in Timberwood Park are Mexican (9,880 | 28.8%), German (4,438 | 13.0%), English (2,970 | 8.7%), Irish (2,425 | 7.1%), and American (1,957 | 5.7%), together accounting for 63.3% of all Timberwood Park residents.
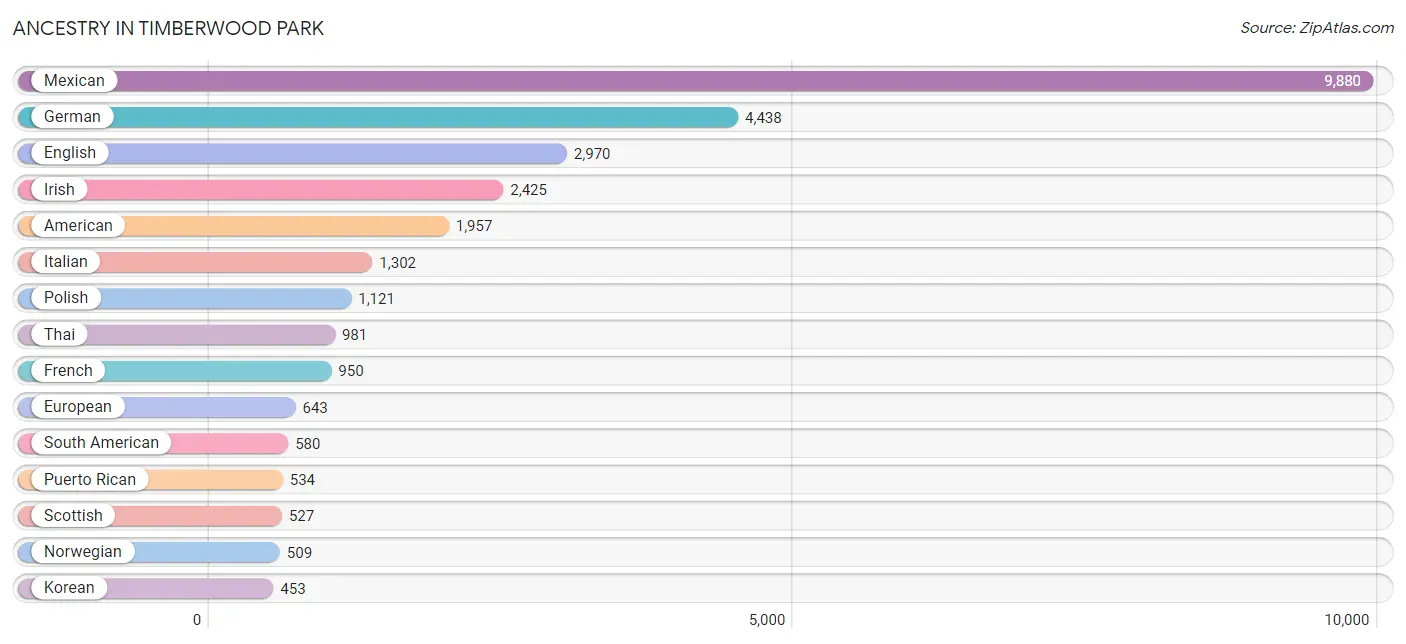
| Ancestry | # Population | % Population |
| African | 59 | 0.2% |
| Alsatian | 44 | 0.1% |
| American | 1,957 | 5.7% |
| Apache | 15 | 0.0% |
| Arab | 317 | 0.9% |
| Basque | 27 | 0.1% |
| Bhutanese | 20 | 0.1% |
| Blackfeet | 63 | 0.2% |
| Brazilian | 7 | 0.0% |
| British | 243 | 0.7% |
| Bulgarian | 9 | 0.0% |
| Burmese | 185 | 0.5% |
| Canadian | 66 | 0.2% |
| Central American | 375 | 1.1% |
| Central American Indian | 47 | 0.1% |
| Cherokee | 41 | 0.1% |
| Chilean | 48 | 0.1% |
| Chippewa | 12 | 0.0% |
| Choctaw | 72 | 0.2% |
| Colombian | 335 | 1.0% |
| Comanche | 9 | 0.0% |
| Costa Rican | 219 | 0.6% |
| Croatian | 35 | 0.1% |
| Cuban | 75 | 0.2% |
| Czech | 251 | 0.7% |
| Czechoslovakian | 35 | 0.1% |
| Danish | 349 | 1.0% |
| Dominican | 157 | 0.5% |
| Dutch | 394 | 1.1% |
| Ecuadorian | 89 | 0.3% |
| Egyptian | 56 | 0.2% |
| English | 2,970 | 8.7% |
| Estonian | 30 | 0.1% |
| European | 643 | 1.9% |
| Finnish | 46 | 0.1% |
| French | 950 | 2.8% |
| French Canadian | 80 | 0.2% |
| German | 4,438 | 13.0% |
| Greek | 114 | 0.3% |
| Guamanian / Chamorro | 56 | 0.2% |
| Guatemalan | 36 | 0.1% |
| Honduran | 12 | 0.0% |
| Hungarian | 21 | 0.1% |
| Indian (Asian) | 412 | 1.2% |
| Iranian | 49 | 0.1% |
| Irish | 2,425 | 7.1% |
| Italian | 1,302 | 3.8% |
| Korean | 453 | 1.3% |
| Laotian | 15 | 0.0% |
| Lebanese | 32 | 0.1% |
| Lithuanian | 331 | 1.0% |
| Mexican | 9,880 | 28.8% |
| Mexican American Indian | 13 | 0.0% |
| Navajo | 39 | 0.1% |
| Nicaraguan | 37 | 0.1% |
| Nigerian | 120 | 0.4% |
| Northern European | 60 | 0.2% |
| Norwegian | 509 | 1.5% |
| Panamanian | 11 | 0.0% |
| Polish | 1,121 | 3.3% |
| Portuguese | 56 | 0.2% |
| Puerto Rican | 534 | 1.6% |
| Russian | 251 | 0.7% |
| Salvadoran | 60 | 0.2% |
| Scandinavian | 11 | 0.0% |
| Scotch-Irish | 321 | 0.9% |
| Scottish | 527 | 1.5% |
| Slovak | 34 | 0.1% |
| Slovene | 13 | 0.0% |
| South American | 580 | 1.7% |
| Spaniard | 31 | 0.1% |
| Spanish | 117 | 0.3% |
| Sri Lankan | 31 | 0.1% |
| Subsaharan African | 179 | 0.5% |
| Swedish | 186 | 0.5% |
| Swiss | 358 | 1.1% |
| Syrian | 95 | 0.3% |
| Thai | 981 | 2.9% |
| Turkish | 34 | 0.1% |
| Ukrainian | 74 | 0.2% |
| Ute | 19 | 0.1% |
| Venezuelan | 108 | 0.3% |
| Welsh | 125 | 0.4% |
| Yugoslavian | 16 | 0.1% | View All 84 Rows |
Immigrants in Timberwood Park
The most numerous immigrant groups reported in Timberwood Park came from Asia (2,186 | 6.4%), Latin America (2,167 | 6.3%), Central America (1,848 | 5.4%), Mexico (1,709 | 5.0%), and South Central Asia (1,372 | 4.0%), together accounting for 27.1% of all Timberwood Park residents.
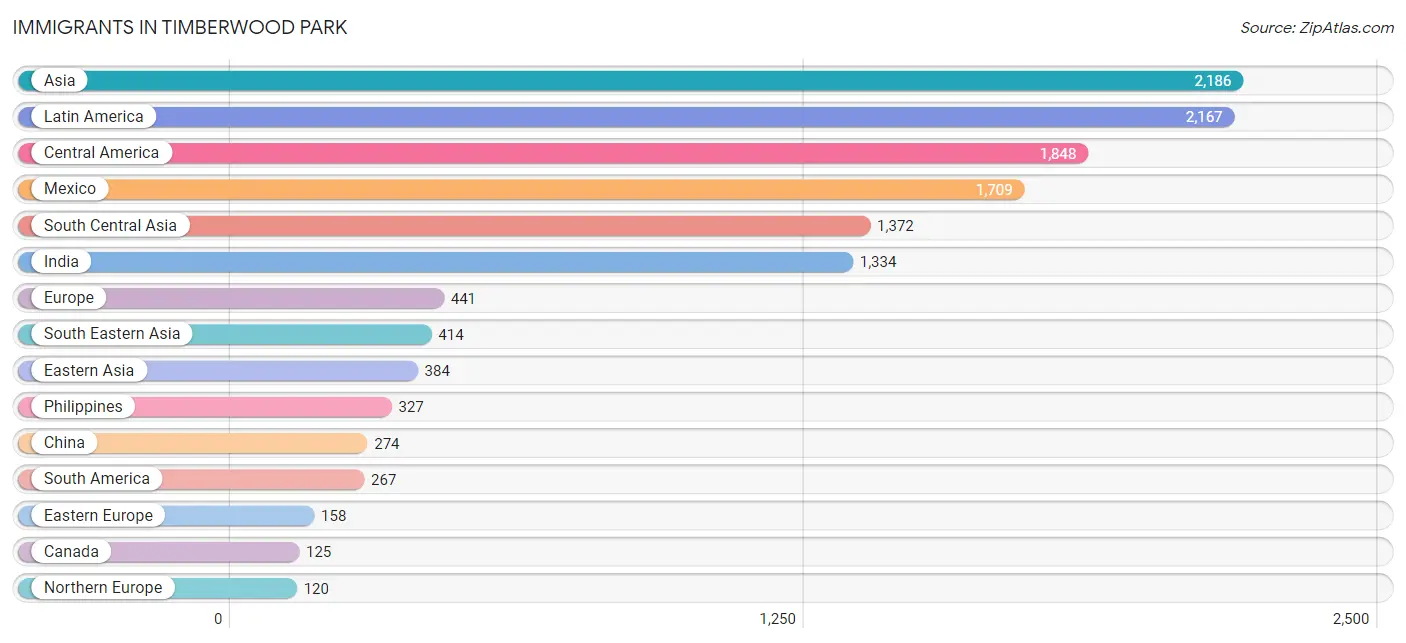
| Immigration Origin | # Population | % Population |
| Africa | 68 | 0.2% |
| Asia | 2,186 | 6.4% |
| Brazil | 31 | 0.1% |
| Canada | 125 | 0.4% |
| Caribbean | 52 | 0.2% |
| Central America | 1,848 | 5.4% |
| Chile | 32 | 0.1% |
| China | 274 | 0.8% |
| Colombia | 96 | 0.3% |
| Costa Rica | 78 | 0.2% |
| Cuba | 14 | 0.0% |
| Dominican Republic | 38 | 0.1% |
| Eastern Africa | 7 | 0.0% |
| Eastern Asia | 384 | 1.1% |
| Eastern Europe | 158 | 0.5% |
| Egypt | 36 | 0.1% |
| El Salvador | 28 | 0.1% |
| Europe | 441 | 1.3% |
| Germany | 102 | 0.3% |
| Greece | 25 | 0.1% |
| Honduras | 12 | 0.0% |
| India | 1,334 | 3.9% |
| Indonesia | 18 | 0.1% |
| Iran | 38 | 0.1% |
| Italy | 36 | 0.1% |
| Japan | 13 | 0.0% |
| Korea | 97 | 0.3% |
| Latin America | 2,167 | 6.3% |
| Mexico | 1,709 | 5.0% |
| Nicaragua | 21 | 0.1% |
| Nigeria | 25 | 0.1% |
| Northern Africa | 36 | 0.1% |
| Northern Europe | 120 | 0.4% |
| Philippines | 327 | 0.9% |
| Poland | 42 | 0.1% |
| Russia | 109 | 0.3% |
| Scotland | 58 | 0.2% |
| South America | 267 | 0.8% |
| South Central Asia | 1,372 | 4.0% |
| South Eastern Asia | 414 | 1.2% |
| Southern Europe | 61 | 0.2% |
| Sweden | 9 | 0.0% |
| Taiwan | 18 | 0.1% |
| Turkey | 16 | 0.1% |
| Venezuela | 108 | 0.3% |
| Vietnam | 45 | 0.1% |
| Western Africa | 25 | 0.1% |
| Western Asia | 16 | 0.1% |
| Western Europe | 102 | 0.3% |
| Zimbabwe | 7 | 0.0% | View All 50 Rows |
Sex and Age in Timberwood Park
Sex and Age in Timberwood Park
The most populous age groups in Timberwood Park are 45 to 49 Years (1,777 | 10.7%) for men and 10 to 14 Years (1,800 | 10.2%) for women.
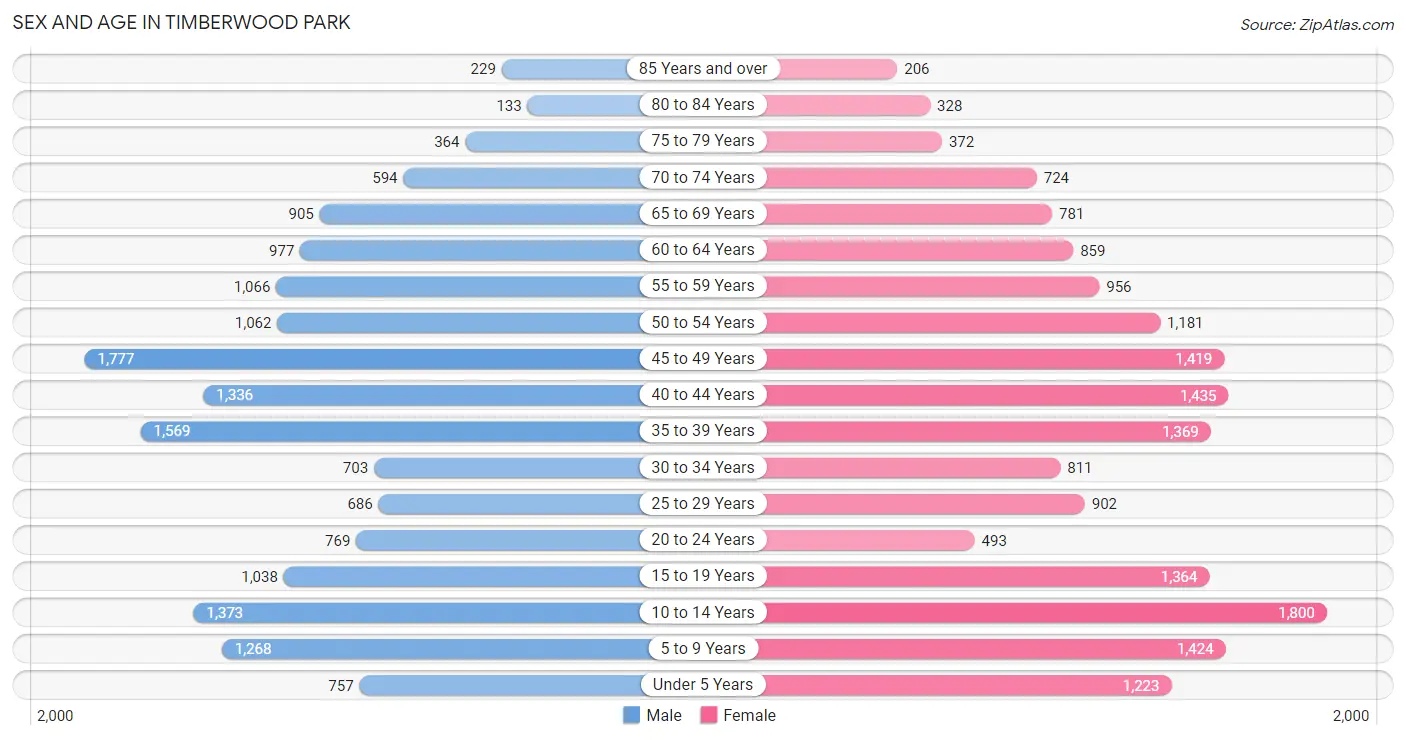
| Age Bracket | Male | Female |
| Under 5 Years | 757 (4.6%) | 1,223 (6.9%) |
| 5 to 9 Years | 1,268 (7.6%) | 1,424 (8.1%) |
| 10 to 14 Years | 1,373 (8.3%) | 1,800 (10.2%) |
| 15 to 19 Years | 1,038 (6.2%) | 1,364 (7.7%) |
| 20 to 24 Years | 769 (4.6%) | 493 (2.8%) |
| 25 to 29 Years | 686 (4.1%) | 902 (5.1%) |
| 30 to 34 Years | 703 (4.2%) | 811 (4.6%) |
| 35 to 39 Years | 1,569 (9.5%) | 1,369 (7.8%) |
| 40 to 44 Years | 1,336 (8.1%) | 1,435 (8.1%) |
| 45 to 49 Years | 1,777 (10.7%) | 1,419 (8.0%) |
| 50 to 54 Years | 1,062 (6.4%) | 1,181 (6.7%) |
| 55 to 59 Years | 1,066 (6.4%) | 956 (5.4%) |
| 60 to 64 Years | 977 (5.9%) | 859 (4.9%) |
| 65 to 69 Years | 905 (5.4%) | 781 (4.4%) |
| 70 to 74 Years | 594 (3.6%) | 724 (4.1%) |
| 75 to 79 Years | 364 (2.2%) | 372 (2.1%) |
| 80 to 84 Years | 133 (0.8%) | 328 (1.9%) |
| 85 Years and over | 229 (1.4%) | 206 (1.2%) |
| Total | 16,606 (100.0%) | 17,647 (100.0%) |
Families and Households in Timberwood Park
Median Family Size in Timberwood Park
The median family size in Timberwood Park is 3.49 persons per family, with single female/mother families (623 | 6.9%) accounting for the largest median family size of 3.72 persons per family. On the other hand, single male/father families (236 | 2.6%) represent the smallest median family size with 2.39 persons per family.
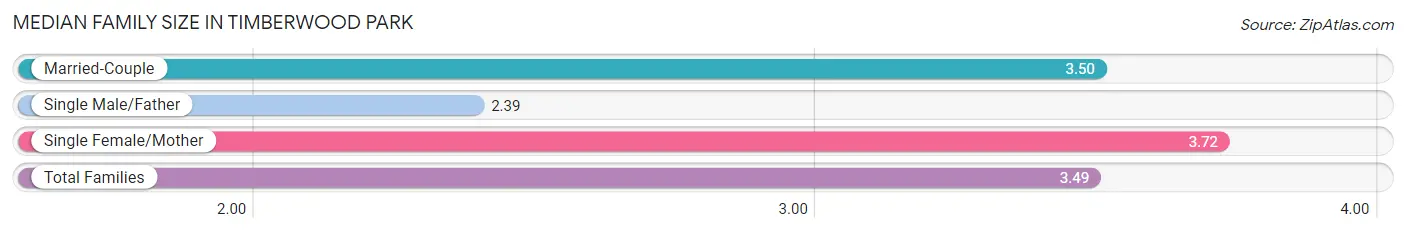
| Family Type | # Families | Family Size |
| Married-Couple | 8,128 (90.4%) | 3.50 |
| Single Male/Father | 236 (2.6%) | 2.39 |
| Single Female/Mother | 623 (6.9%) | 3.72 |
| Total Families | 8,987 (100.0%) | 3.49 |
Median Household Size in Timberwood Park
The median household size in Timberwood Park is 3.01 persons per household, with single female/mother households (623 | 5.5%) accounting for the largest median household size of 3.76 persons per household. non-family households (2,399 | 21.1%) represent the smallest median household size with 1.12 persons per household.
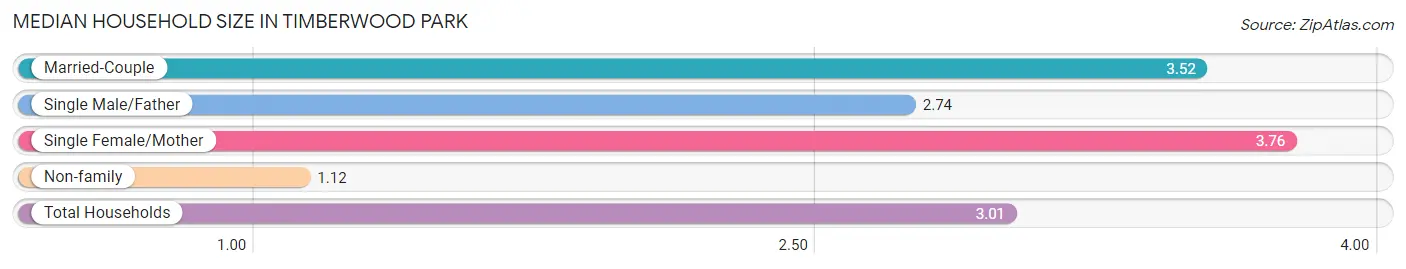
| Household Type | # Households | Household Size |
| Married-Couple | 8,128 (71.4%) | 3.52 |
| Single Male/Father | 236 (2.1%) | 2.74 |
| Single Female/Mother | 623 (5.5%) | 3.76 |
| Non-family | 2,399 (21.1%) | 1.12 |
| Total Households | 11,386 (100.0%) | 3.01 |
Household Size by Marriage Status in Timberwood Park
Out of a total of 11,386 households in Timberwood Park, 8,987 (78.9%) are family households, while 2,399 (21.1%) are nonfamily households. The most numerous type of family households are 2-person households, comprising 3,315, and the most common type of nonfamily households are 1-person households, comprising 2,133.
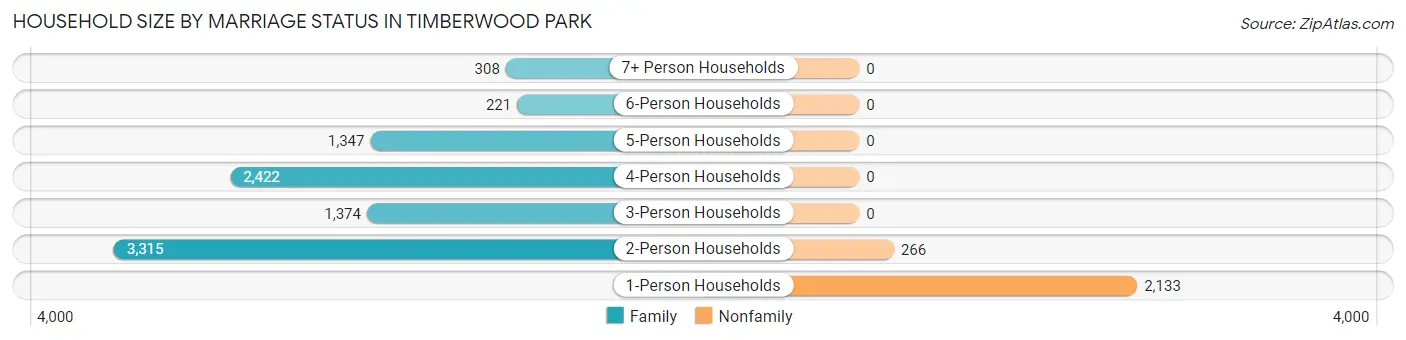
| Household Size | Family Households | Nonfamily Households |
| 1-Person Households | - | 2,133 (18.7%) |
| 2-Person Households | 3,315 (29.1%) | 266 (2.3%) |
| 3-Person Households | 1,374 (12.1%) | 0 (0.0%) |
| 4-Person Households | 2,422 (21.3%) | 0 (0.0%) |
| 5-Person Households | 1,347 (11.8%) | 0 (0.0%) |
| 6-Person Households | 221 (1.9%) | 0 (0.0%) |
| 7+ Person Households | 308 (2.7%) | 0 (0.0%) |
| Total | 8,987 (78.9%) | 2,399 (21.1%) |
Female Fertility in Timberwood Park
Fertility by Age in Timberwood Park
Average fertility rate in Timberwood Park is 25.0 births per 1,000 women. Women in the age bracket of 20 to 34 years have the highest fertility rate with 44.0 births per 1,000 women. Women in the age bracket of 35 to 50 years acount for 50.2% of all women with births.
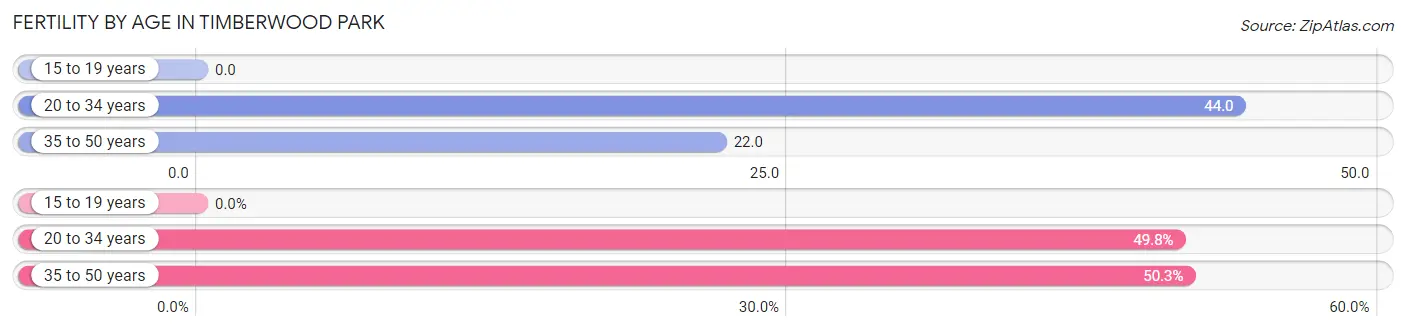
| Age Bracket | Women with Births | Births / 1,000 Women |
| 15 to 19 years | 0 (0.0%) | 0.0 |
| 20 to 34 years | 98 (49.7%) | 44.0 |
| 35 to 50 years | 99 (50.2%) | 22.0 |
| Total | 197 (100.0%) | 25.0 |
Fertility by Age by Marriage Status in Timberwood Park
90.4% of women with births (197) in Timberwood Park are married. The highest percentage of unmarried women with births falls into 35 to 50 years age bracket with 10.1% of them unmarried at the time of birth, while the lowest percentage of unmarried women with births belong to 20 to 34 years age bracket with 9.2% of them unmarried.
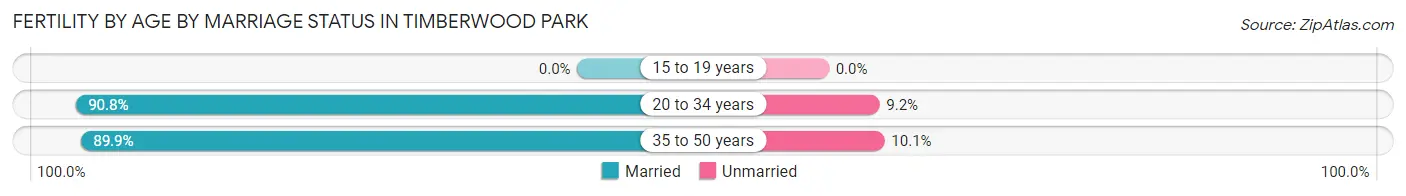
| Age Bracket | Married | Unmarried |
| 15 to 19 years | 0 (0.0%) | 0 (0.0%) |
| 20 to 34 years | 89 (90.8%) | 9 (9.2%) |
| 35 to 50 years | 89 (89.9%) | 10 (10.1%) |
| Total | 178 (90.4%) | 19 (9.6%) |
Fertility by Education in Timberwood Park
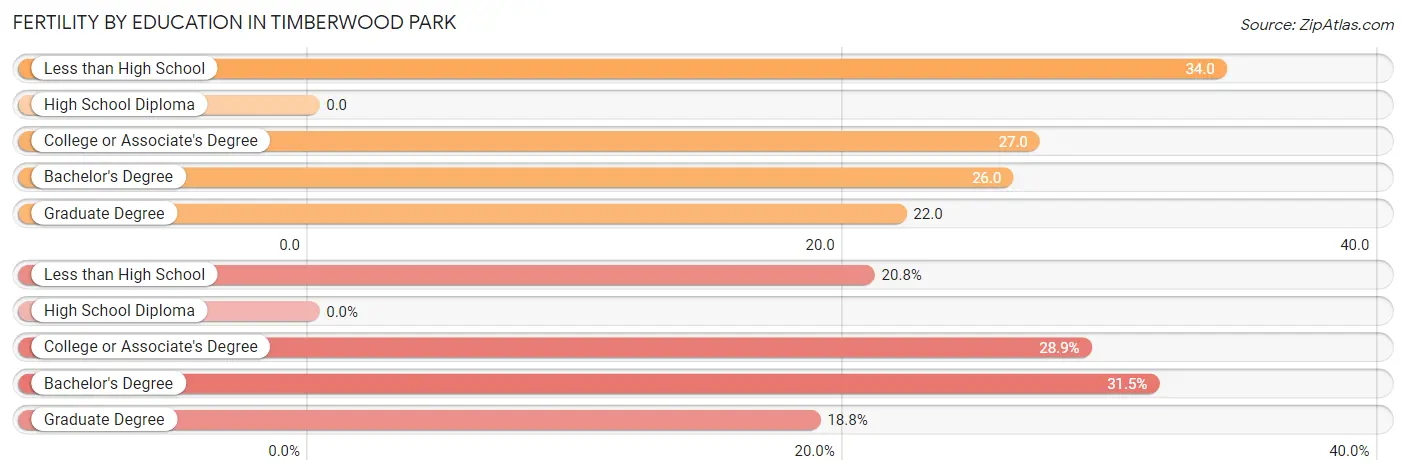
| Educational Attainment | Women with Births | Births / 1,000 Women |
| Less than High School | 41 (20.8%) | 34.0 |
| High School Diploma | 0 (0.0%) | 0.0 |
| College or Associate's Degree | 57 (28.9%) | 27.0 |
| Bachelor's Degree | 62 (31.5%) | 26.0 |
| Graduate Degree | 37 (18.8%) | 22.0 |
| Total | 197 (100.0%) | 25.0 |
Fertility by Education by Marriage Status in Timberwood Park
9.6% of women with births in Timberwood Park are unmarried. Women with the educational attainment of less than high school are most likely to be married with 100.0% of them married at childbirth, while women with the educational attainment of graduate degree are least likely to be married with 24.3% of them unmarried at childbirth.
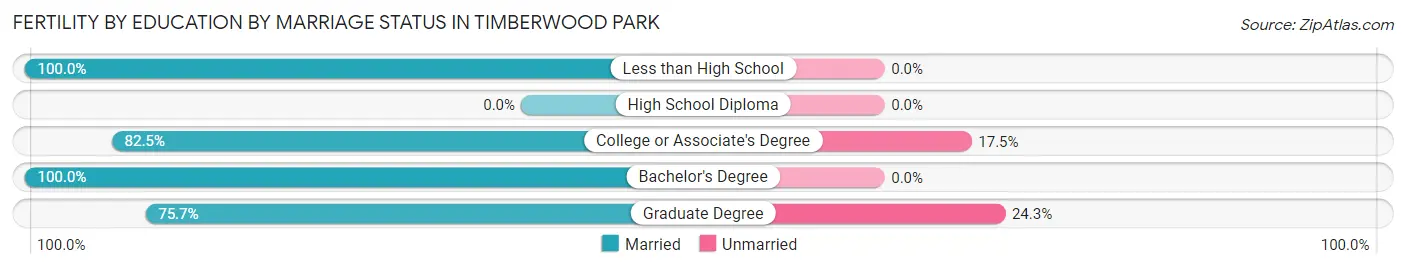
| Educational Attainment | Married | Unmarried |
| Less than High School | 41 (100.0%) | 0 (0.0%) |
| High School Diploma | 0 (0.0%) | 0 (0.0%) |
| College or Associate's Degree | 47 (82.5%) | 10 (17.5%) |
| Bachelor's Degree | 62 (100.0%) | 0 (0.0%) |
| Graduate Degree | 28 (75.7%) | 9 (24.3%) |
| Total | 178 (90.4%) | 19 (9.6%) |
Employment Characteristics in Timberwood Park
Employment by Class of Employer in Timberwood Park
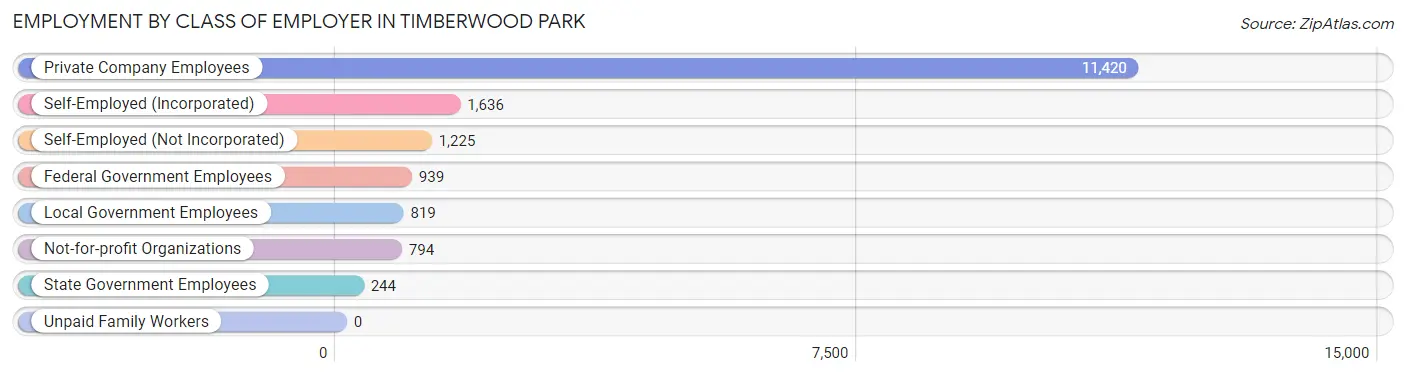
Among the 17,077 employed individuals in Timberwood Park, private company employees (11,420 | 66.9%), self-employed (incorporated) (1,636 | 9.6%), and self-employed (not incorporated) (1,225 | 7.2%) make up the most common classes of employment.
| Employer Class | # Employees | % Employees |
| Private Company Employees | 11,420 | 66.9% |
| Self-Employed (Incorporated) | 1,636 | 9.6% |
| Self-Employed (Not Incorporated) | 1,225 | 7.2% |
| Not-for-profit Organizations | 794 | 4.6% |
| Local Government Employees | 819 | 4.8% |
| State Government Employees | 244 | 1.4% |
| Federal Government Employees | 939 | 5.5% |
| Unpaid Family Workers | 0 | 0.0% |
| Total | 17,077 | 100.0% |
Employment Status by Age in Timberwood Park
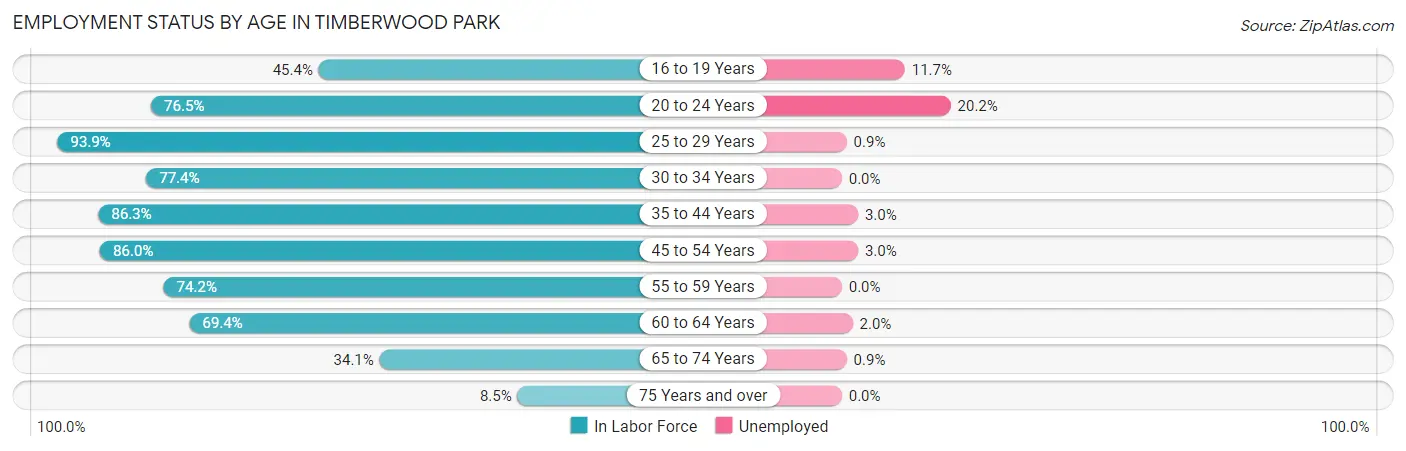
According to the labor force statistics for Timberwood Park, out of the total population over 16 years of age (25,903), 69.6% or 18,028 individuals are in the labor force, with 3.5% or 631 of them unemployed. The age group with the highest labor force participation rate is 25 to 29 years, with 93.9% or 1,491 individuals in the labor force. Within the labor force, the 20 to 24 years age range has the highest percentage of unemployed individuals, with 20.2% or 195 of them being unemployed.
| Age Bracket | In Labor Force | Unemployed |
| 16 to 19 Years | 861 (45.4%) | 101 (11.7%) |
| 20 to 24 Years | 965 (76.5%) | 195 (20.2%) |
| 25 to 29 Years | 1,491 (93.9%) | 13 (0.9%) |
| 30 to 34 Years | 1,172 (77.4%) | 0 (0.0%) |
| 35 to 44 Years | 4,927 (86.3%) | 148 (3.0%) |
| 45 to 54 Years | 4,678 (86.0%) | 140 (3.0%) |
| 55 to 59 Years | 1,500 (74.2%) | 0 (0.0%) |
| 60 to 64 Years | 1,274 (69.4%) | 25 (2.0%) |
| 65 to 74 Years | 1,024 (34.1%) | 9 (0.9%) |
| 75 Years and over | 139 (8.5%) | 0 (0.0%) |
| Total | 18,028 (69.6%) | 631 (3.5%) |
Employment Status by Educational Attainment in Timberwood Park
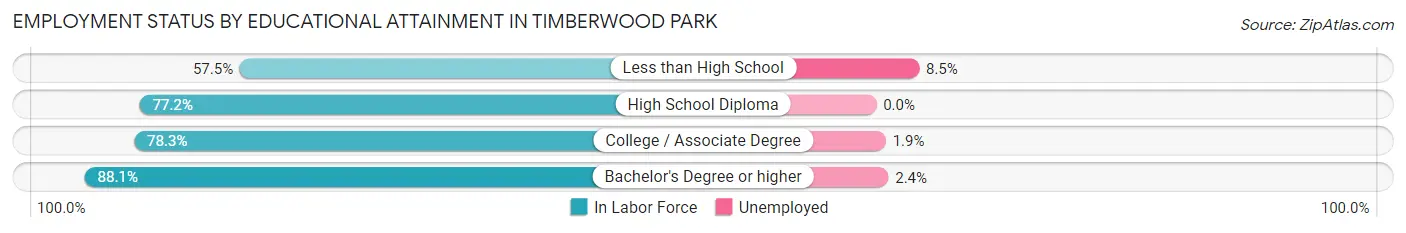
According to labor force statistics for Timberwood Park, 83.1% of individuals (15,048) out of the total population between 25 and 64 years of age (18,108) are in the labor force, with 2.2% or 331 of them being unemployed. The group with the highest labor force participation rate are those with the educational attainment of bachelor's degree or higher, with 88.1% or 9,195 individuals in the labor force. Within the labor force, individuals with less than high school education have the highest percentage of unemployment, with 8.5% or 33 of them being unemployed.
| Educational Attainment | In Labor Force | Unemployed |
| Less than High School | 387 (57.5%) | 57 (8.5%) |
| High School Diploma | 1,453 (77.2%) | 0 (0.0%) |
| College / Associate Degree | 4,006 (78.3%) | 97 (1.9%) |
| Bachelor's Degree or higher | 9,195 (88.1%) | 250 (2.4%) |
| Total | 15,048 (83.1%) | 398 (2.2%) |
Employment Occupations by Sex in Timberwood Park
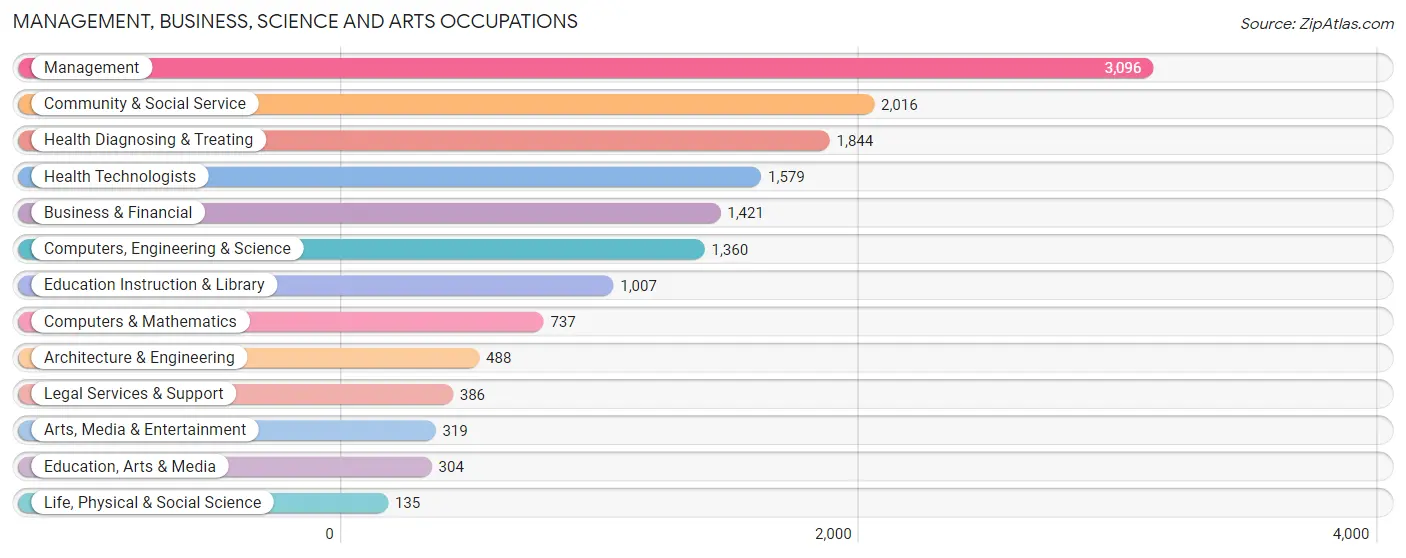
Management, Business, Science and Arts Occupations
The most common Management, Business, Science and Arts occupations in Timberwood Park are Management (3,096 | 17.8%), Community & Social Service (2,016 | 11.6%), Health Diagnosing & Treating (1,844 | 10.6%), Health Technologists (1,579 | 9.1%), and Business & Financial (1,421 | 8.2%).
Management, Business, Science and Arts Occupations by Sex
Within the Management, Business, Science and Arts occupations in Timberwood Park, the most male-oriented occupations are Architecture & Engineering (88.7%), Computers & Mathematics (79.6%), and Computers, Engineering & Science (78.2%), while the most female-oriented occupations are Education Instruction & Library (71.6%), Education, Arts & Media (70.1%), and Life, Physical & Social Science (67.4%).
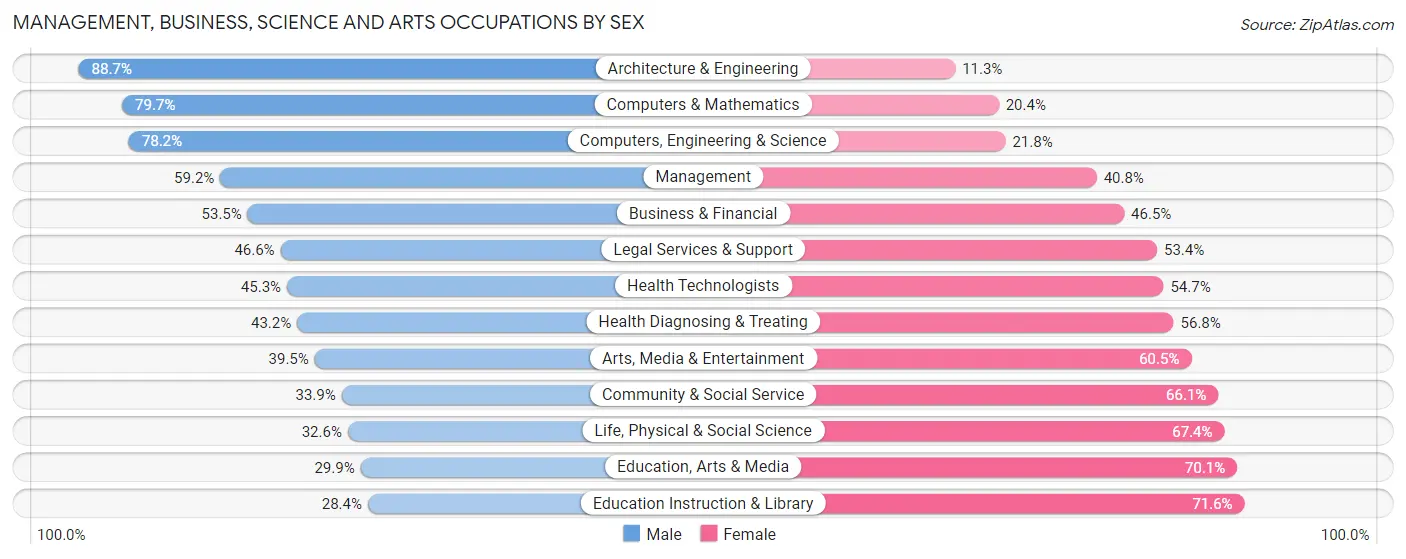
| Occupation | Male | Female |
| Management | 1,833 (59.2%) | 1,263 (40.8%) |
| Business & Financial | 760 (53.5%) | 661 (46.5%) |
| Computers, Engineering & Science | 1,064 (78.2%) | 296 (21.8%) |
| Computers & Mathematics | 587 (79.6%) | 150 (20.3%) |
| Architecture & Engineering | 433 (88.7%) | 55 (11.3%) |
| Life, Physical & Social Science | 44 (32.6%) | 91 (67.4%) |
| Community & Social Service | 683 (33.9%) | 1,333 (66.1%) |
| Education, Arts & Media | 91 (29.9%) | 213 (70.1%) |
| Legal Services & Support | 180 (46.6%) | 206 (53.4%) |
| Education Instruction & Library | 286 (28.4%) | 721 (71.6%) |
| Arts, Media & Entertainment | 126 (39.5%) | 193 (60.5%) |
| Health Diagnosing & Treating | 796 (43.2%) | 1,048 (56.8%) |
| Health Technologists | 715 (45.3%) | 864 (54.7%) |
| Total (Category) | 5,136 (52.7%) | 4,601 (47.2%) |
| Total (Overall) | 9,812 (56.5%) | 7,546 (43.5%) |
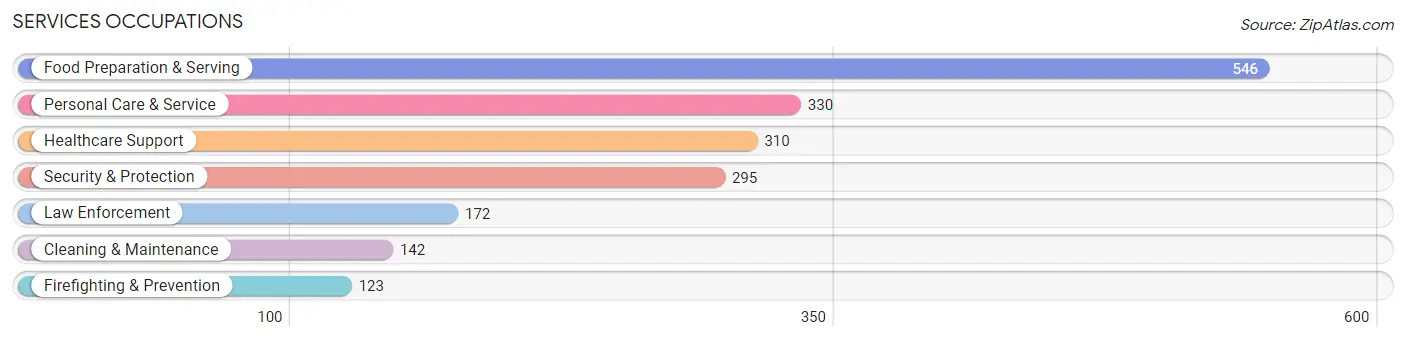
Services Occupations
The most common Services occupations in Timberwood Park are Food Preparation & Serving (546 | 3.2%), Personal Care & Service (330 | 1.9%), Healthcare Support (310 | 1.8%), Security & Protection (295 | 1.7%), and Law Enforcement (172 | 1.0%).
Services Occupations by Sex
Within the Services occupations in Timberwood Park, the most male-oriented occupations are Cleaning & Maintenance (93.0%), Firefighting & Prevention (91.1%), and Security & Protection (83.1%), while the most female-oriented occupations are Personal Care & Service (65.1%), Healthcare Support (61.9%), and Food Preparation & Serving (24.0%).
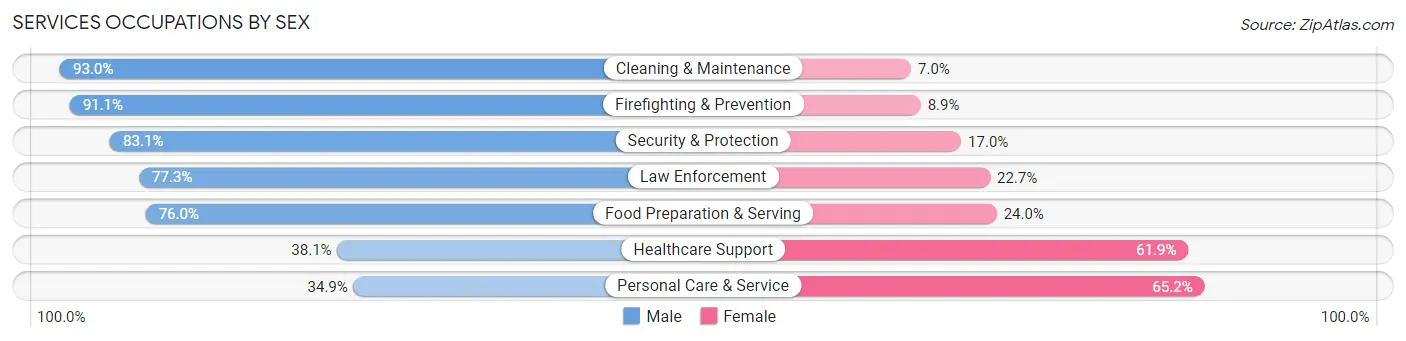
| Occupation | Male | Female |
| Healthcare Support | 118 (38.1%) | 192 (61.9%) |
| Security & Protection | 245 (83.1%) | 50 (17.0%) |
| Firefighting & Prevention | 112 (91.1%) | 11 (8.9%) |
| Law Enforcement | 133 (77.3%) | 39 (22.7%) |
| Food Preparation & Serving | 415 (76.0%) | 131 (24.0%) |
| Cleaning & Maintenance | 132 (93.0%) | 10 (7.0%) |
| Personal Care & Service | 115 (34.8%) | 215 (65.1%) |
| Total (Category) | 1,025 (63.1%) | 598 (36.8%) |
| Total (Overall) | 9,812 (56.5%) | 7,546 (43.5%) |
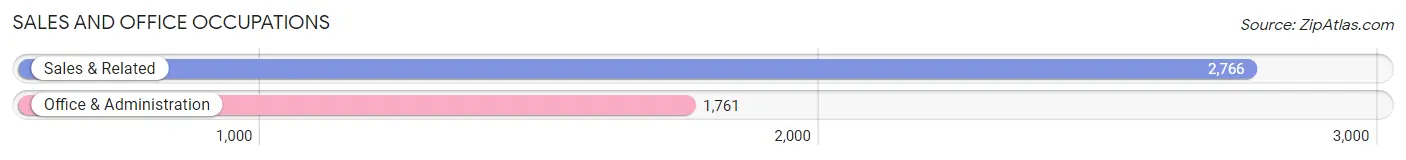
Sales and Office Occupations
The most common Sales and Office occupations in Timberwood Park are Sales & Related (2,766 | 15.9%), and Office & Administration (1,761 | 10.2%).
Sales and Office Occupations by Sex
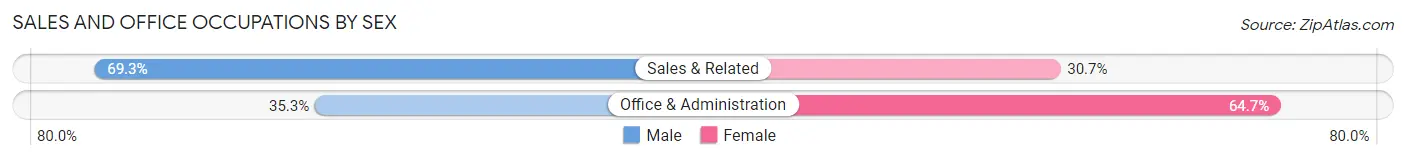
| Occupation | Male | Female |
| Sales & Related | 1,916 (69.3%) | 850 (30.7%) |
| Office & Administration | 622 (35.3%) | 1,139 (64.7%) |
| Total (Category) | 2,538 (56.1%) | 1,989 (43.9%) |
| Total (Overall) | 9,812 (56.5%) | 7,546 (43.5%) |
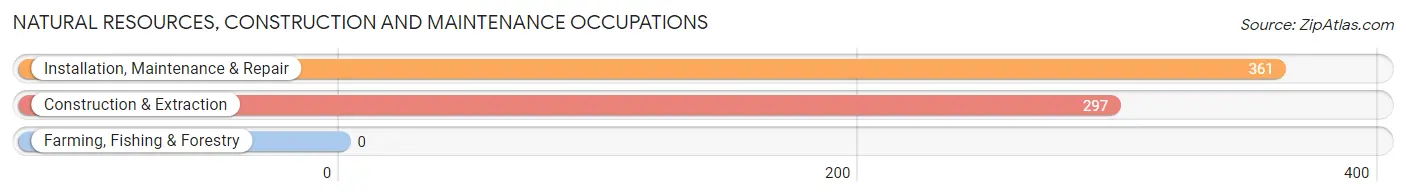
Natural Resources, Construction and Maintenance Occupations
The most common Natural Resources, Construction and Maintenance occupations in Timberwood Park are Installation, Maintenance & Repair (361 | 2.1%), and Construction & Extraction (297 | 1.7%).
Natural Resources, Construction and Maintenance Occupations by Sex
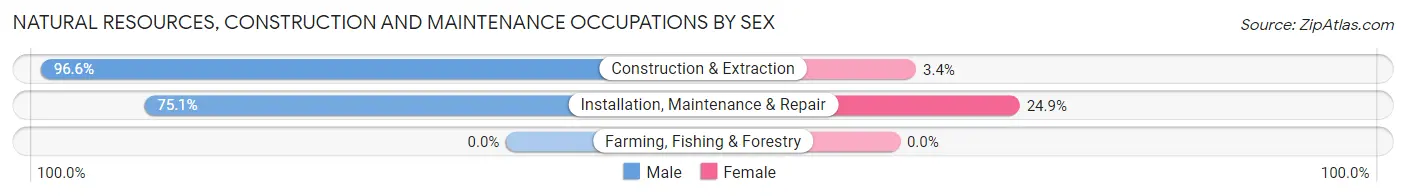
| Occupation | Male | Female |
| Farming, Fishing & Forestry | 0 (0.0%) | 0 (0.0%) |
| Construction & Extraction | 287 (96.6%) | 10 (3.4%) |
| Installation, Maintenance & Repair | 271 (75.1%) | 90 (24.9%) |
| Total (Category) | 558 (84.8%) | 100 (15.2%) |
| Total (Overall) | 9,812 (56.5%) | 7,546 (43.5%) |
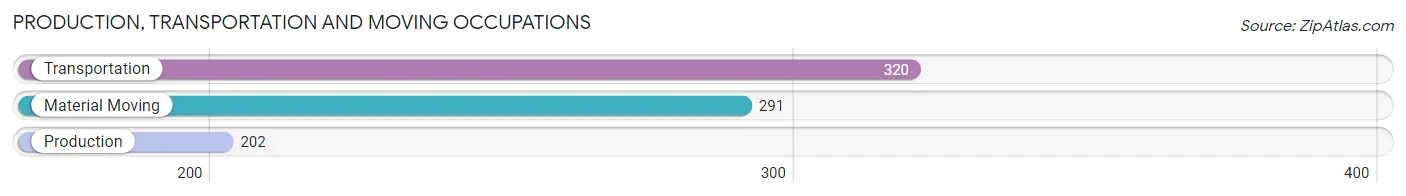
Production, Transportation and Moving Occupations
The most common Production, Transportation and Moving occupations in Timberwood Park are Transportation (320 | 1.8%), Material Moving (291 | 1.7%), and Production (202 | 1.2%).
Production, Transportation and Moving Occupations by Sex
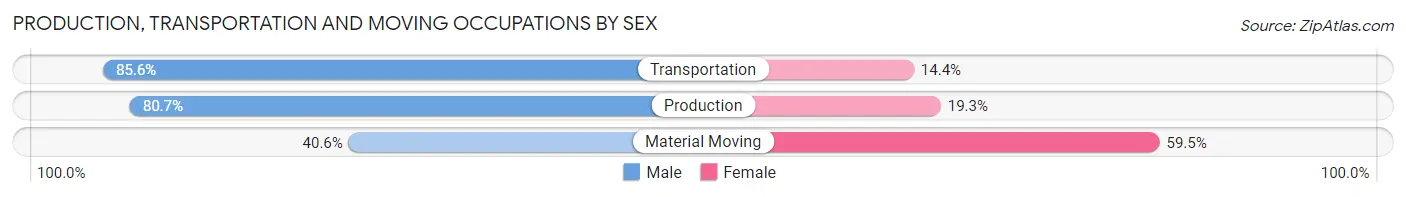
| Occupation | Male | Female |
| Production | 163 (80.7%) | 39 (19.3%) |
| Transportation | 274 (85.6%) | 46 (14.4%) |
| Material Moving | 118 (40.6%) | 173 (59.5%) |
| Total (Category) | 555 (68.3%) | 258 (31.7%) |
| Total (Overall) | 9,812 (56.5%) | 7,546 (43.5%) |
Employment Industries by Sex in Timberwood Park
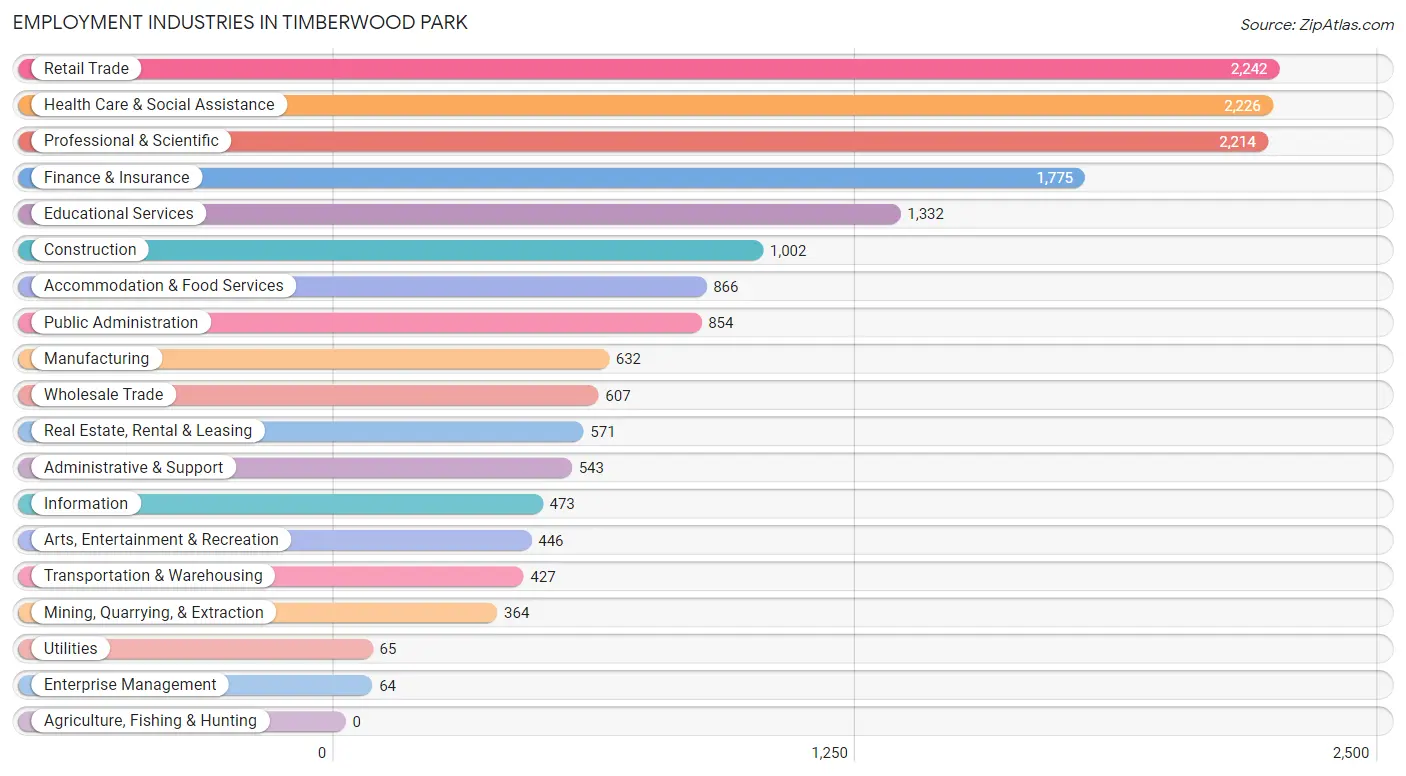
Employment Industries in Timberwood Park
The major employment industries in Timberwood Park include Retail Trade (2,242 | 12.9%), Health Care & Social Assistance (2,226 | 12.8%), Professional & Scientific (2,214 | 12.8%), Finance & Insurance (1,775 | 10.2%), and Educational Services (1,332 | 7.7%).
Employment Industries by Sex in Timberwood Park
The Timberwood Park industries that see more men than women are Wholesale Trade (88.6%), Transportation & Warehousing (81.5%), and Arts, Entertainment & Recreation (80.0%), whereas the industries that tend to have a higher number of women are Educational Services (73.5%), Health Care & Social Assistance (61.0%), and Real Estate, Rental & Leasing (56.7%).
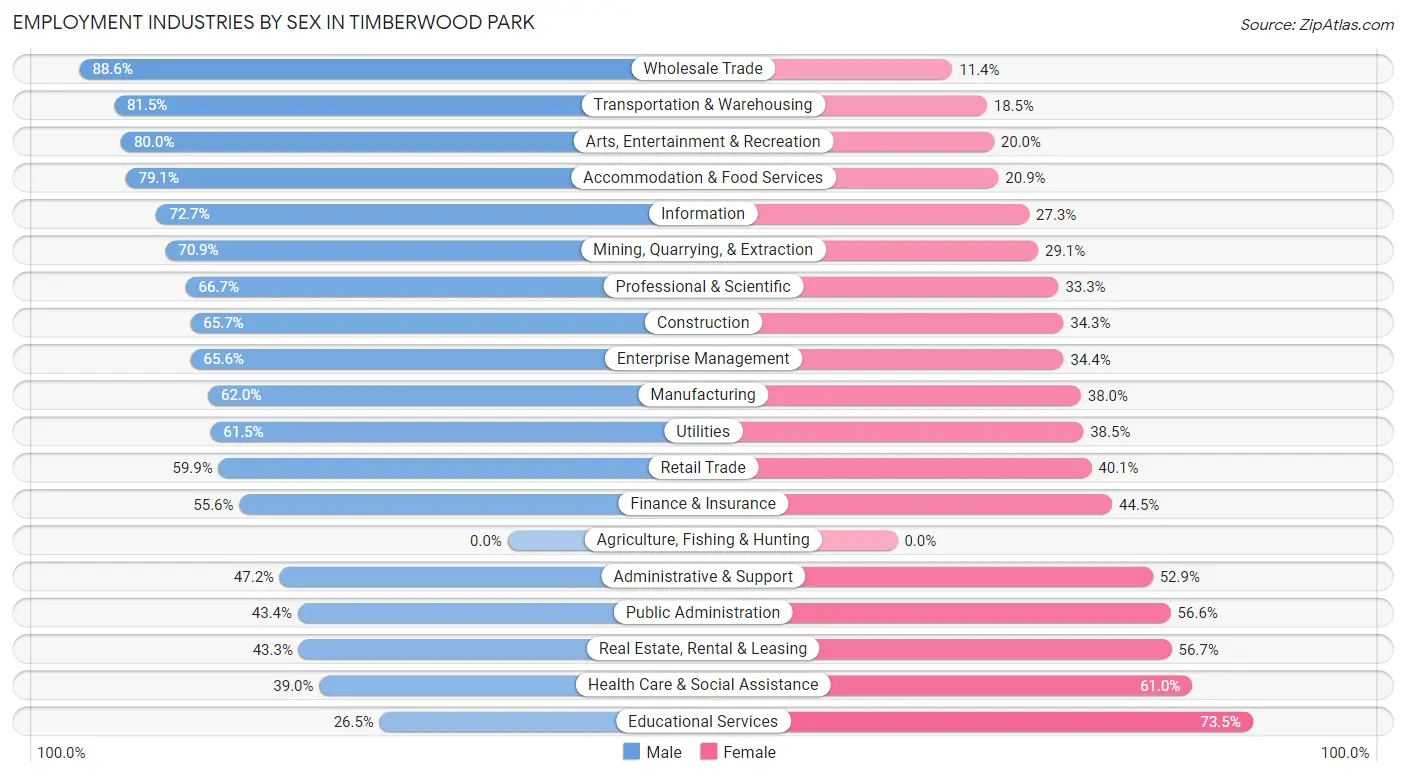
| Industry | Male | Female |
| Agriculture, Fishing & Hunting | 0 (0.0%) | 0 (0.0%) |
| Mining, Quarrying, & Extraction | 258 (70.9%) | 106 (29.1%) |
| Construction | 658 (65.7%) | 344 (34.3%) |
| Manufacturing | 392 (62.0%) | 240 (38.0%) |
| Wholesale Trade | 538 (88.6%) | 69 (11.4%) |
| Retail Trade | 1,342 (59.9%) | 900 (40.1%) |
| Transportation & Warehousing | 348 (81.5%) | 79 (18.5%) |
| Utilities | 40 (61.5%) | 25 (38.5%) |
| Information | 344 (72.7%) | 129 (27.3%) |
| Finance & Insurance | 986 (55.5%) | 789 (44.5%) |
| Real Estate, Rental & Leasing | 247 (43.3%) | 324 (56.7%) |
| Professional & Scientific | 1,476 (66.7%) | 738 (33.3%) |
| Enterprise Management | 42 (65.6%) | 22 (34.4%) |
| Administrative & Support | 256 (47.1%) | 287 (52.8%) |
| Educational Services | 353 (26.5%) | 979 (73.5%) |
| Health Care & Social Assistance | 868 (39.0%) | 1,358 (61.0%) |
| Arts, Entertainment & Recreation | 357 (80.0%) | 89 (20.0%) |
| Accommodation & Food Services | 685 (79.1%) | 181 (20.9%) |
| Public Administration | 371 (43.4%) | 483 (56.6%) |
| Total | 9,812 (56.5%) | 7,546 (43.5%) |
Education in Timberwood Park
School Enrollment in Timberwood Park
The most common levels of schooling among the 10,271 students in Timberwood Park are middle school (2,547 | 24.8%), elementary school (2,059 | 20.1%), and high school (1,990 | 19.4%).
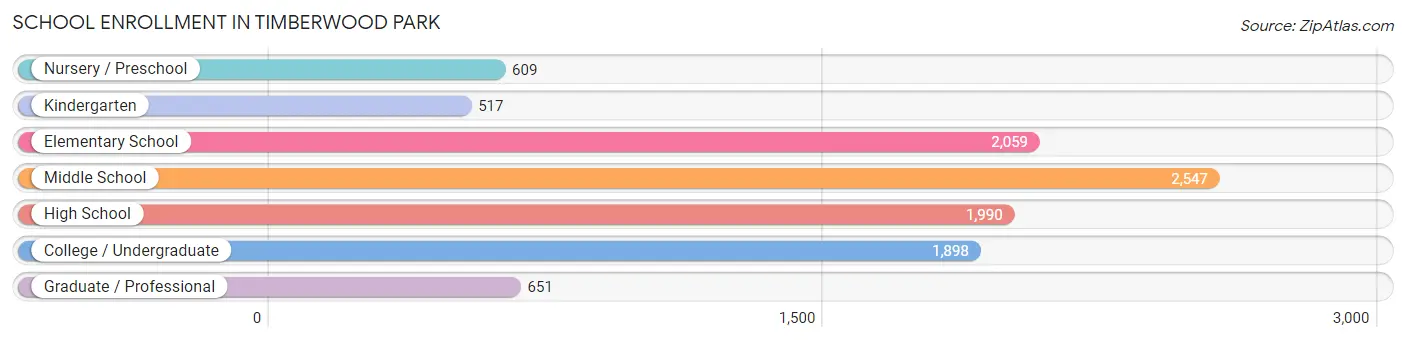
| School Level | # Students | % Students |
| Nursery / Preschool | 609 | 5.9% |
| Kindergarten | 517 | 5.0% |
| Elementary School | 2,059 | 20.1% |
| Middle School | 2,547 | 24.8% |
| High School | 1,990 | 19.4% |
| College / Undergraduate | 1,898 | 18.5% |
| Graduate / Professional | 651 | 6.3% |
| Total | 10,271 | 100.0% |
School Enrollment by Age by Funding Source in Timberwood Park
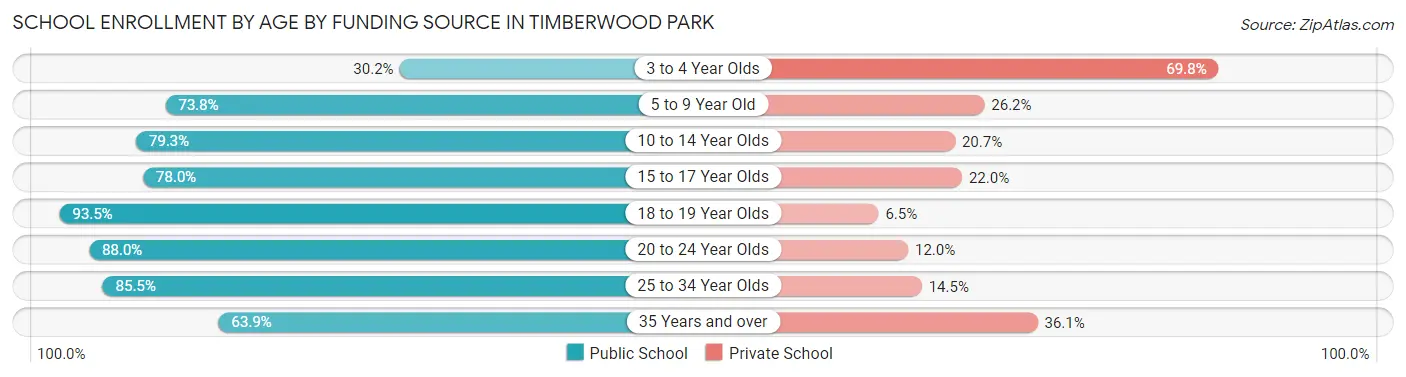
Out of a total of 10,271 students who are enrolled in schools in Timberwood Park, 2,332 (22.7%) attend a private institution, while the remaining 7,939 (77.3%) are enrolled in public schools. The age group of 3 to 4 year olds has the highest likelihood of being enrolled in private schools, with 259 (69.8% in the age bracket) enrolled. Conversely, the age group of 18 to 19 year olds has the lowest likelihood of being enrolled in a private school, with 807 (93.5% in the age bracket) attending a public institution.
| Age Bracket | Public School | Private School |
| 3 to 4 Year Olds | 112 (30.2%) | 259 (69.8%) |
| 5 to 9 Year Old | 1,914 (73.8%) | 680 (26.2%) |
| 10 to 14 Year Olds | 2,443 (79.3%) | 639 (20.7%) |
| 15 to 17 Year Olds | 1,121 (78.0%) | 317 (22.0%) |
| 18 to 19 Year Olds | 807 (93.5%) | 56 (6.5%) |
| 20 to 24 Year Olds | 602 (88.0%) | 82 (12.0%) |
| 25 to 34 Year Olds | 576 (85.5%) | 98 (14.5%) |
| 35 Years and over | 361 (63.9%) | 204 (36.1%) |
| Total | 7,939 (77.3%) | 2,332 (22.7%) |
Educational Attainment by Field of Study in Timberwood Park
Business (3,761 | 26.7%), science & technology (1,777 | 12.6%), engineering (1,280 | 9.1%), bio, nature & agricultural (1,193 | 8.5%), and education (1,125 | 8.0%) are the most common fields of study among 14,101 individuals in Timberwood Park who have obtained a bachelor's degree or higher.
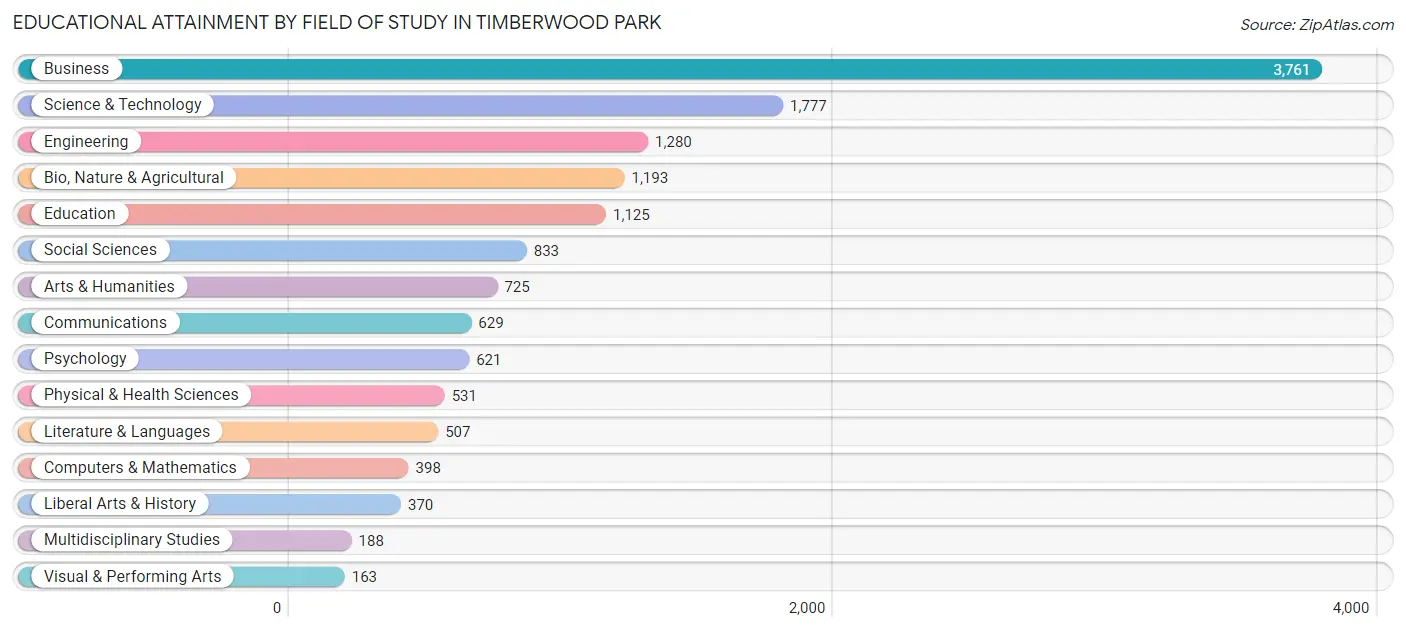
| Field of Study | # Graduates | % Graduates |
| Computers & Mathematics | 398 | 2.8% |
| Bio, Nature & Agricultural | 1,193 | 8.5% |
| Physical & Health Sciences | 531 | 3.8% |
| Psychology | 621 | 4.4% |
| Social Sciences | 833 | 5.9% |
| Engineering | 1,280 | 9.1% |
| Multidisciplinary Studies | 188 | 1.3% |
| Science & Technology | 1,777 | 12.6% |
| Business | 3,761 | 26.7% |
| Education | 1,125 | 8.0% |
| Literature & Languages | 507 | 3.6% |
| Liberal Arts & History | 370 | 2.6% |
| Visual & Performing Arts | 163 | 1.2% |
| Communications | 629 | 4.5% |
| Arts & Humanities | 725 | 5.1% |
| Total | 14,101 | 100.0% |
Transportation & Commute in Timberwood Park
Vehicle Availability by Sex in Timberwood Park
The most prevalent vehicle ownership categories in Timberwood Park are males with 2 vehicles (4,218, accounting for 44.1%) and females with 2 vehicles (3,117, making up 56.2%).
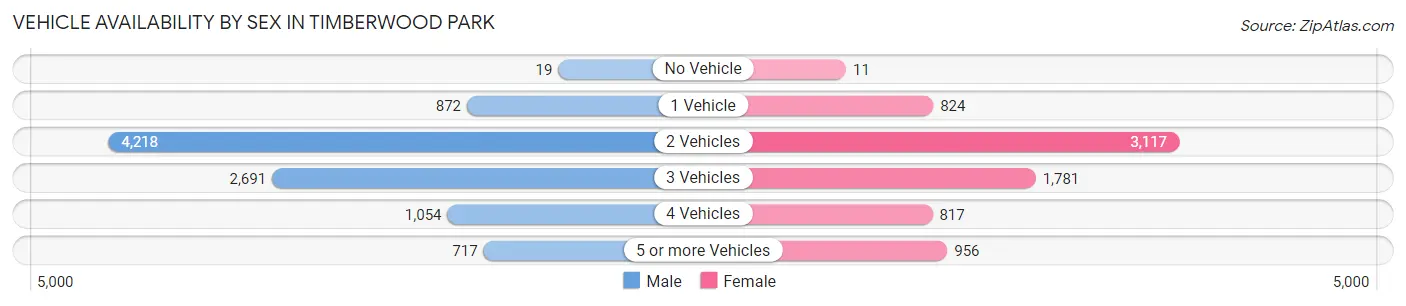
| Vehicles Available | Male | Female |
| No Vehicle | 19 (0.2%) | 11 (0.2%) |
| 1 Vehicle | 872 (9.1%) | 824 (11.0%) |
| 2 Vehicles | 4,218 (44.1%) | 3,117 (41.5%) |
| 3 Vehicles | 2,691 (28.1%) | 1,781 (23.7%) |
| 4 Vehicles | 1,054 (11.0%) | 817 (10.9%) |
| 5 or more Vehicles | 717 (7.5%) | 956 (12.7%) |
| Total | 9,571 (100.0%) | 7,506 (100.0%) |
Commute Time in Timberwood Park
The most frequently occuring commute durations in Timberwood Park are 30 to 34 minutes (2,818 commuters, 20.6%), 45 to 59 minutes (2,463 commuters, 18.0%), and 20 to 24 minutes (1,682 commuters, 12.3%).
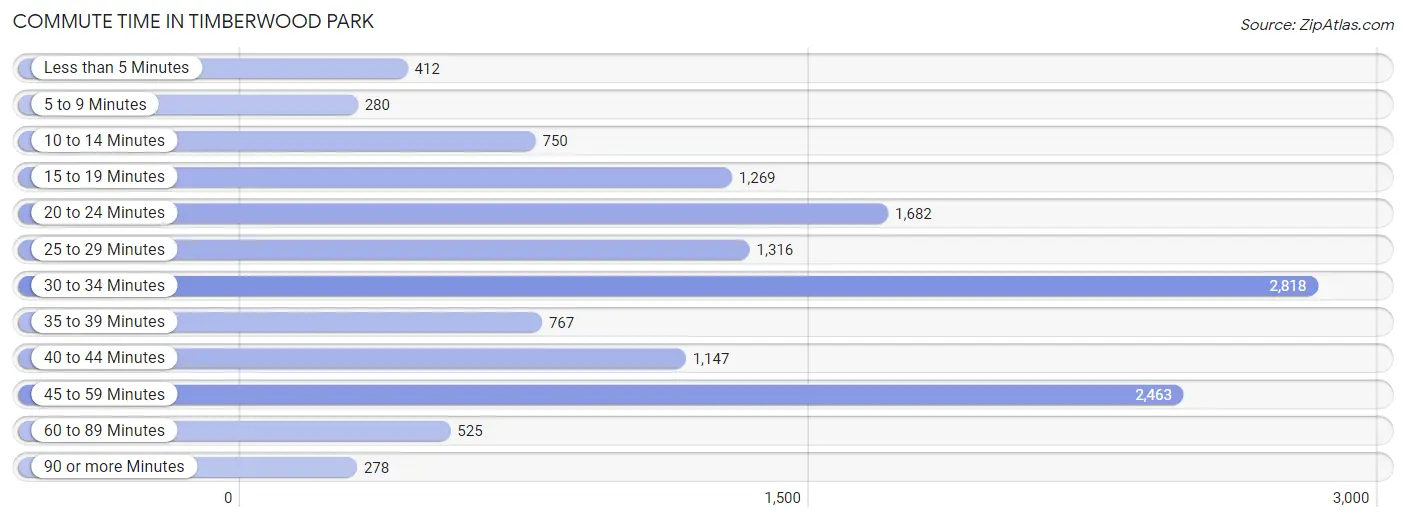
| Commute Time | # Commuters | % Commuters |
| Less than 5 Minutes | 412 | 3.0% |
| 5 to 9 Minutes | 280 | 2.0% |
| 10 to 14 Minutes | 750 | 5.5% |
| 15 to 19 Minutes | 1,269 | 9.3% |
| 20 to 24 Minutes | 1,682 | 12.3% |
| 25 to 29 Minutes | 1,316 | 9.6% |
| 30 to 34 Minutes | 2,818 | 20.6% |
| 35 to 39 Minutes | 767 | 5.6% |
| 40 to 44 Minutes | 1,147 | 8.4% |
| 45 to 59 Minutes | 2,463 | 18.0% |
| 60 to 89 Minutes | 525 | 3.8% |
| 90 or more Minutes | 278 | 2.0% |
Commute Time by Sex in Timberwood Park
The most common commute times in Timberwood Park are 30 to 34 minutes (1,707 commuters, 22.4%) for males and 45 to 59 minutes (1,166 commuters, 19.1%) for females.
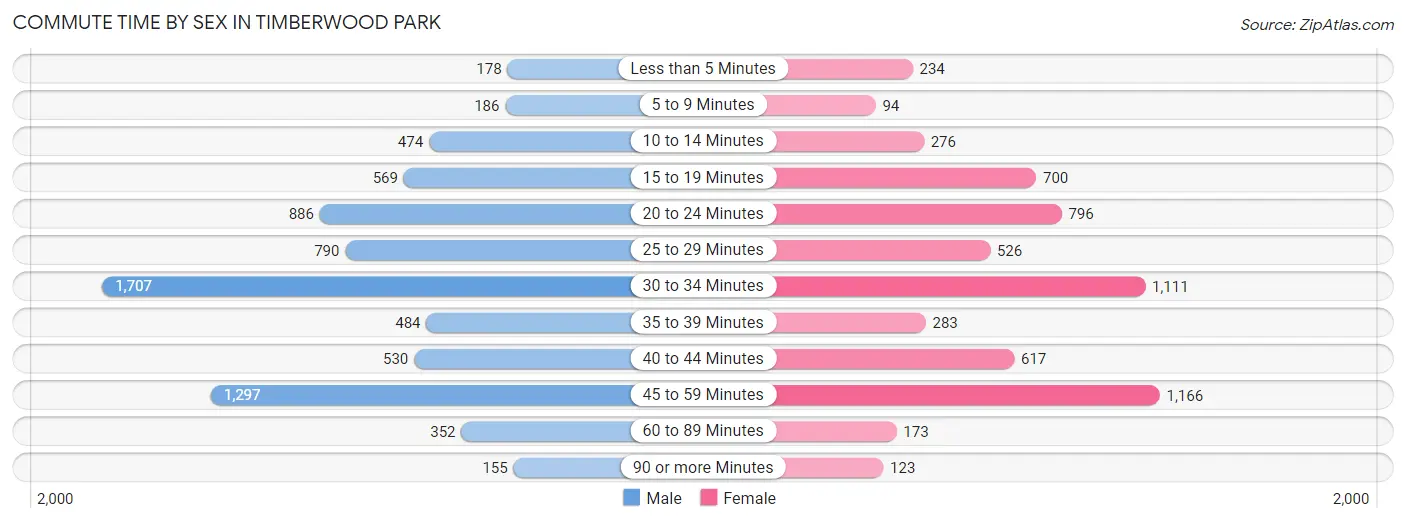
| Commute Time | Male | Female |
| Less than 5 Minutes | 178 (2.3%) | 234 (3.8%) |
| 5 to 9 Minutes | 186 (2.4%) | 94 (1.5%) |
| 10 to 14 Minutes | 474 (6.2%) | 276 (4.5%) |
| 15 to 19 Minutes | 569 (7.5%) | 700 (11.5%) |
| 20 to 24 Minutes | 886 (11.7%) | 796 (13.1%) |
| 25 to 29 Minutes | 790 (10.4%) | 526 (8.6%) |
| 30 to 34 Minutes | 1,707 (22.4%) | 1,111 (18.2%) |
| 35 to 39 Minutes | 484 (6.4%) | 283 (4.6%) |
| 40 to 44 Minutes | 530 (7.0%) | 617 (10.1%) |
| 45 to 59 Minutes | 1,297 (17.1%) | 1,166 (19.1%) |
| 60 to 89 Minutes | 352 (4.6%) | 173 (2.8%) |
| 90 or more Minutes | 155 (2.0%) | 123 (2.0%) |
Time of Departure to Work by Sex in Timberwood Park
The most frequent times of departure to work in Timberwood Park are 7:00 AM to 7:29 AM (1,660, 21.8%) for males and 6:00 AM to 6:29 AM (1,164, 19.1%) for females.
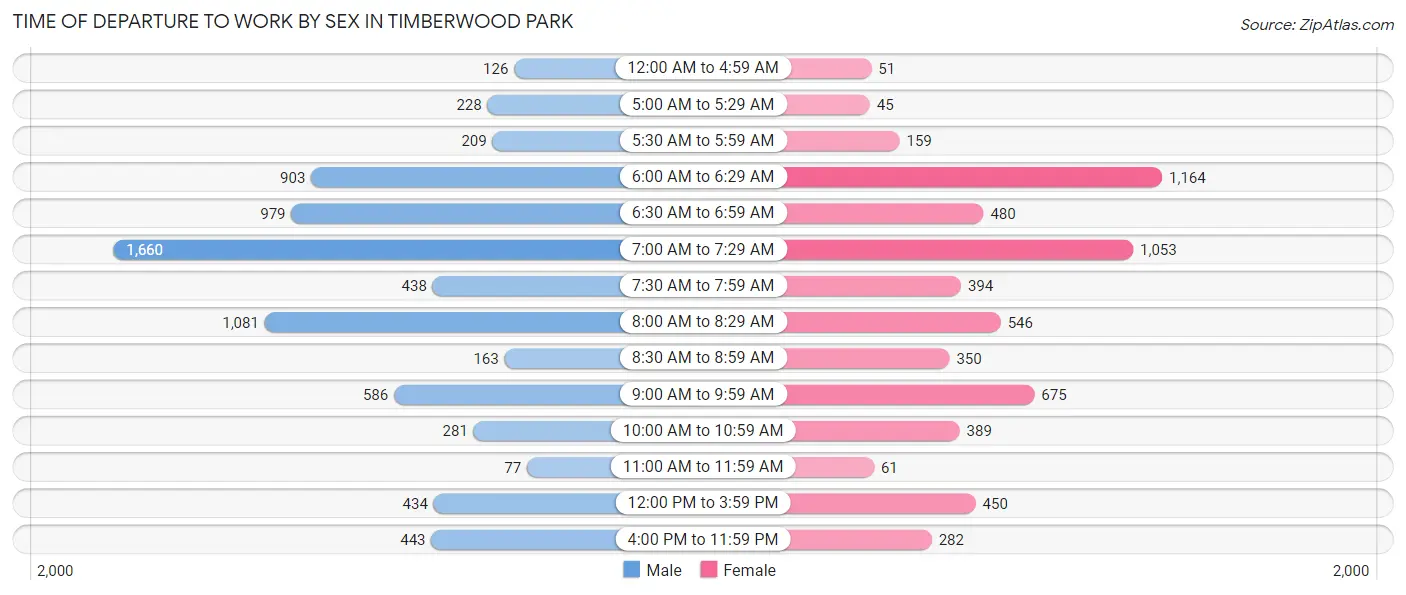
| Time of Departure | Male | Female |
| 12:00 AM to 4:59 AM | 126 (1.7%) | 51 (0.8%) |
| 5:00 AM to 5:29 AM | 228 (3.0%) | 45 (0.7%) |
| 5:30 AM to 5:59 AM | 209 (2.8%) | 159 (2.6%) |
| 6:00 AM to 6:29 AM | 903 (11.9%) | 1,164 (19.1%) |
| 6:30 AM to 6:59 AM | 979 (12.9%) | 480 (7.9%) |
| 7:00 AM to 7:29 AM | 1,660 (21.8%) | 1,053 (17.3%) |
| 7:30 AM to 7:59 AM | 438 (5.8%) | 394 (6.5%) |
| 8:00 AM to 8:29 AM | 1,081 (14.2%) | 546 (8.9%) |
| 8:30 AM to 8:59 AM | 163 (2.1%) | 350 (5.7%) |
| 9:00 AM to 9:59 AM | 586 (7.7%) | 675 (11.1%) |
| 10:00 AM to 10:59 AM | 281 (3.7%) | 389 (6.4%) |
| 11:00 AM to 11:59 AM | 77 (1.0%) | 61 (1.0%) |
| 12:00 PM to 3:59 PM | 434 (5.7%) | 450 (7.4%) |
| 4:00 PM to 11:59 PM | 443 (5.8%) | 282 (4.6%) |
| Total | 7,608 (100.0%) | 6,099 (100.0%) |
Housing Occupancy in Timberwood Park
Occupancy by Ownership in Timberwood Park
Of the total 11,386 dwellings in Timberwood Park, owner-occupied units account for 9,781 (85.9%), while renter-occupied units make up 1,605 (14.1%).
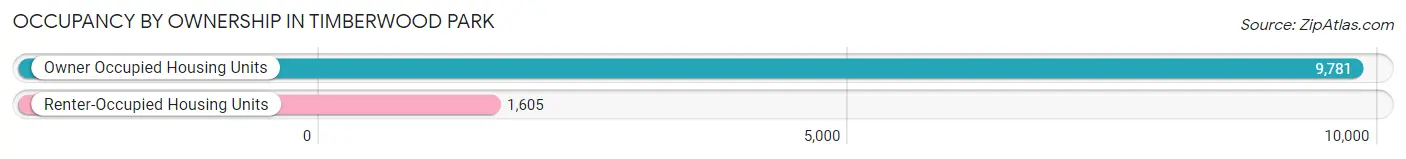
| Occupancy | # Housing Units | % Housing Units |
| Owner Occupied Housing Units | 9,781 | 85.9% |
| Renter-Occupied Housing Units | 1,605 | 14.1% |
| Total Occupied Housing Units | 11,386 | 100.0% |
Occupancy by Household Size in Timberwood Park
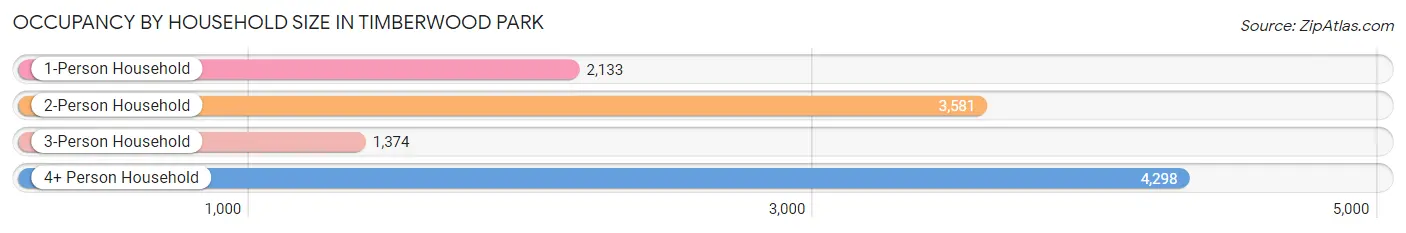
| Household Size | # Housing Units | % Housing Units |
| 1-Person Household | 2,133 | 18.7% |
| 2-Person Household | 3,581 | 31.5% |
| 3-Person Household | 1,374 | 12.1% |
| 4+ Person Household | 4,298 | 37.8% |
| Total Housing Units | 11,386 | 100.0% |
Occupancy by Ownership by Household Size in Timberwood Park
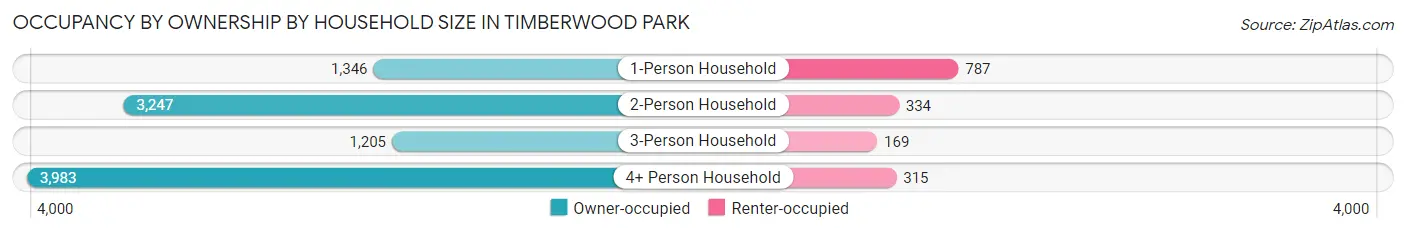
| Household Size | Owner-occupied | Renter-occupied |
| 1-Person Household | 1,346 (63.1%) | 787 (36.9%) |
| 2-Person Household | 3,247 (90.7%) | 334 (9.3%) |
| 3-Person Household | 1,205 (87.7%) | 169 (12.3%) |
| 4+ Person Household | 3,983 (92.7%) | 315 (7.3%) |
| Total Housing Units | 9,781 (85.9%) | 1,605 (14.1%) |
Occupancy by Educational Attainment in Timberwood Park
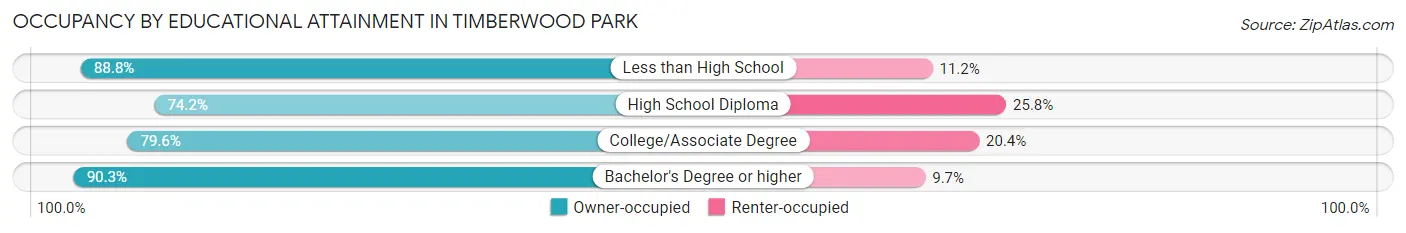
| Household Size | Owner-occupied | Renter-occupied |
| Less than High School | 326 (88.8%) | 41 (11.2%) |
| High School Diploma | 781 (74.2%) | 271 (25.8%) |
| College/Associate Degree | 2,406 (79.6%) | 617 (20.4%) |
| Bachelor's Degree or higher | 6,268 (90.3%) | 676 (9.7%) |
Occupancy by Age of Householder in Timberwood Park
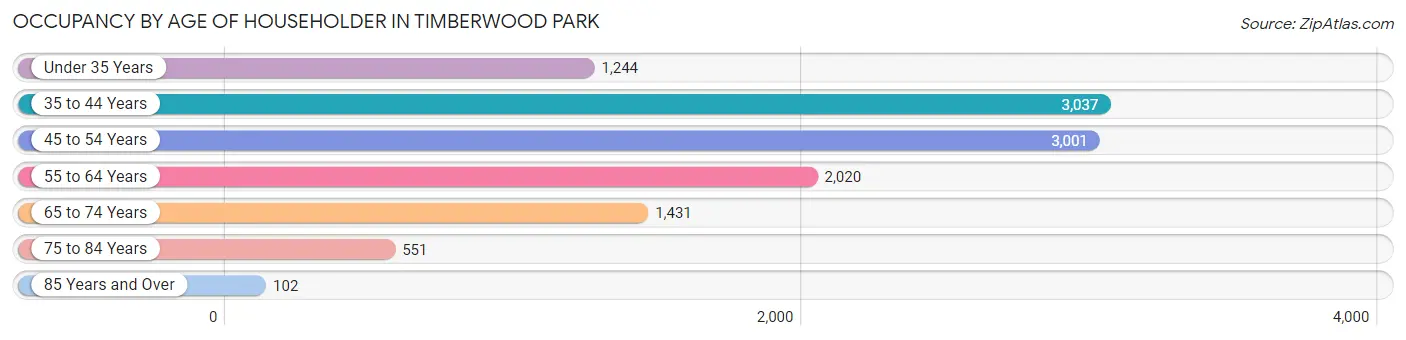
| Age Bracket | # Households | % Households |
| Under 35 Years | 1,244 | 10.9% |
| 35 to 44 Years | 3,037 | 26.7% |
| 45 to 54 Years | 3,001 | 26.4% |
| 55 to 64 Years | 2,020 | 17.7% |
| 65 to 74 Years | 1,431 | 12.6% |
| 75 to 84 Years | 551 | 4.8% |
| 85 Years and Over | 102 | 0.9% |
| Total | 11,386 | 100.0% |
Housing Finances in Timberwood Park
Median Income by Occupancy in Timberwood Park
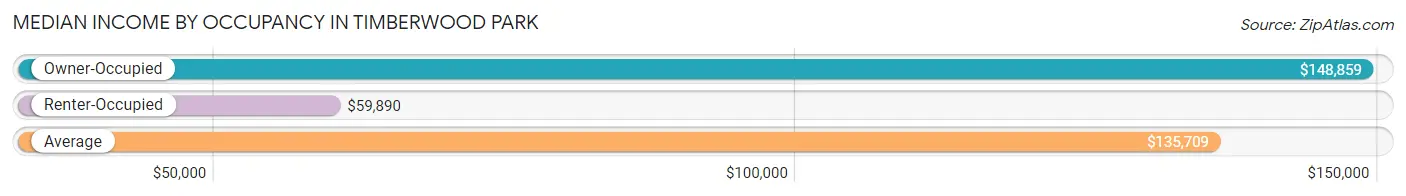
| Occupancy Type | # Households | Median Income |
| Owner-Occupied | 9,781 (85.9%) | $148,859 |
| Renter-Occupied | 1,605 (14.1%) | $59,890 |
| Average | 11,386 (100.0%) | $135,709 |
Occupancy by Householder Income Bracket in Timberwood Park
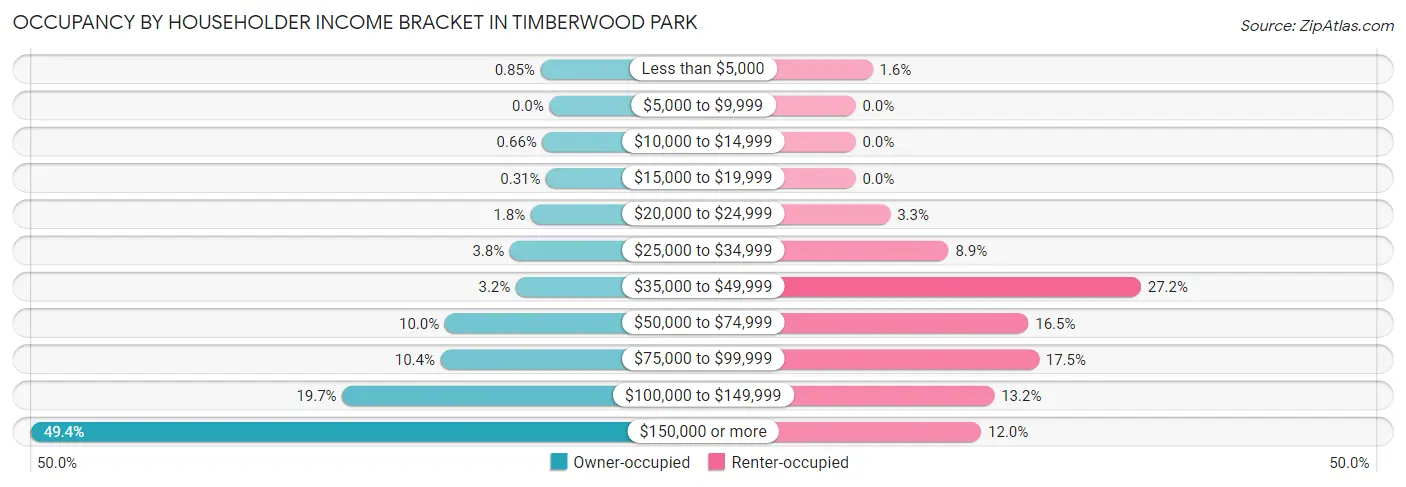
| Income Bracket | Owner-occupied | Renter-occupied |
| Less than $5,000 | 83 (0.9%) | 26 (1.6%) |
| $5,000 to $9,999 | 0 (0.0%) | 0 (0.0%) |
| $10,000 to $14,999 | 65 (0.7%) | 0 (0.0%) |
| $15,000 to $19,999 | 30 (0.3%) | 0 (0.0%) |
| $20,000 to $24,999 | 172 (1.8%) | 53 (3.3%) |
| $25,000 to $34,999 | 369 (3.8%) | 142 (8.8%) |
| $35,000 to $49,999 | 312 (3.2%) | 436 (27.2%) |
| $50,000 to $74,999 | 974 (10.0%) | 264 (16.5%) |
| $75,000 to $99,999 | 1,013 (10.4%) | 280 (17.4%) |
| $100,000 to $149,999 | 1,930 (19.7%) | 212 (13.2%) |
| $150,000 or more | 4,833 (49.4%) | 192 (12.0%) |
| Total | 9,781 (100.0%) | 1,605 (100.0%) |
Monthly Housing Cost Tiers in Timberwood Park
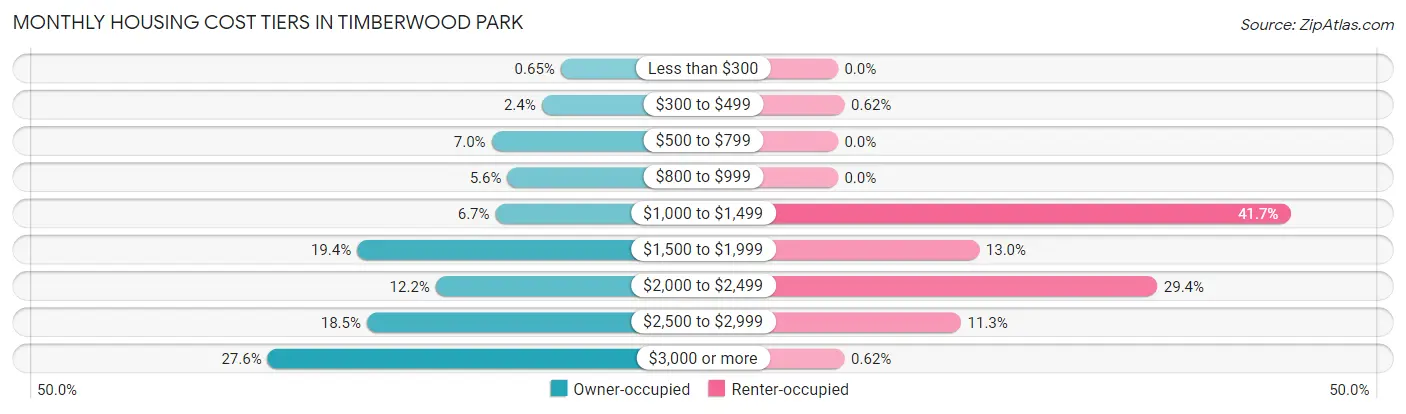
| Monthly Cost | Owner-occupied | Renter-occupied |
| Less than $300 | 64 (0.6%) | 0 (0.0%) |
| $300 to $499 | 236 (2.4%) | 10 (0.6%) |
| $500 to $799 | 687 (7.0%) | 0 (0.0%) |
| $800 to $999 | 544 (5.6%) | 0 (0.0%) |
| $1,000 to $1,499 | 651 (6.7%) | 669 (41.7%) |
| $1,500 to $1,999 | 1,898 (19.4%) | 209 (13.0%) |
| $2,000 to $2,499 | 1,189 (12.2%) | 472 (29.4%) |
| $2,500 to $2,999 | 1,809 (18.5%) | 182 (11.3%) |
| $3,000 or more | 2,703 (27.6%) | 10 (0.6%) |
| Total | 9,781 (100.0%) | 1,605 (100.0%) |
Physical Housing Characteristics in Timberwood Park
Housing Structures in Timberwood Park
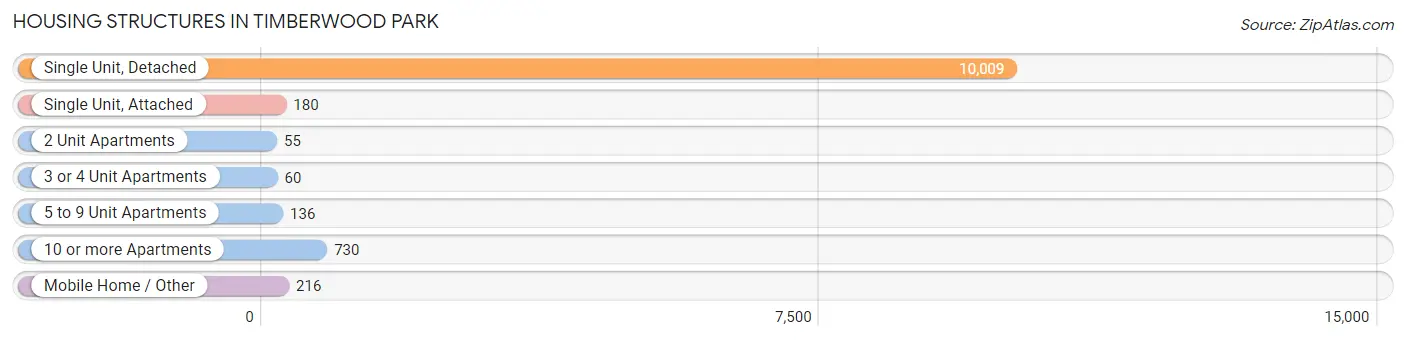
| Structure Type | # Housing Units | % Housing Units |
| Single Unit, Detached | 10,009 | 87.9% |
| Single Unit, Attached | 180 | 1.6% |
| 2 Unit Apartments | 55 | 0.5% |
| 3 or 4 Unit Apartments | 60 | 0.5% |
| 5 to 9 Unit Apartments | 136 | 1.2% |
| 10 or more Apartments | 730 | 6.4% |
| Mobile Home / Other | 216 | 1.9% |
| Total | 11,386 | 100.0% |
Housing Structures by Occupancy in Timberwood Park
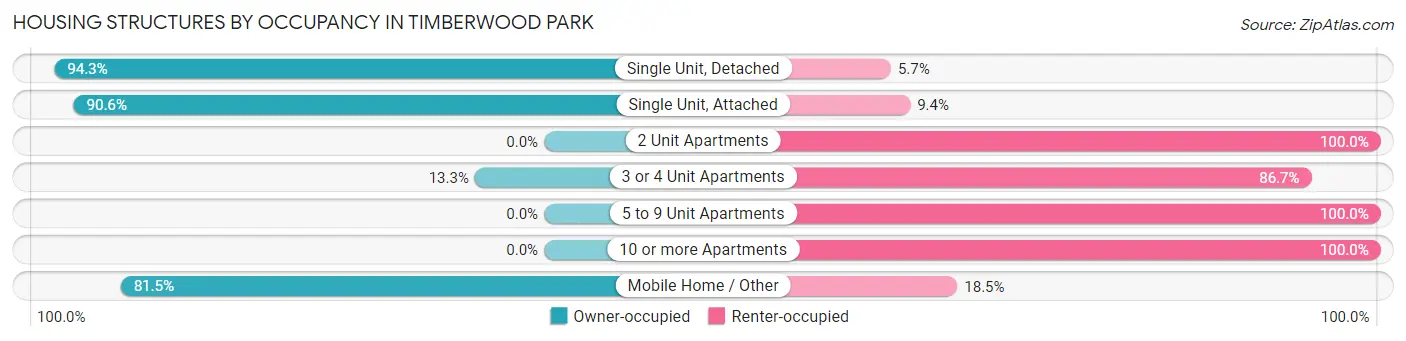
| Structure Type | Owner-occupied | Renter-occupied |
| Single Unit, Detached | 9,434 (94.3%) | 575 (5.7%) |
| Single Unit, Attached | 163 (90.6%) | 17 (9.4%) |
| 2 Unit Apartments | 0 (0.0%) | 55 (100.0%) |
| 3 or 4 Unit Apartments | 8 (13.3%) | 52 (86.7%) |
| 5 to 9 Unit Apartments | 0 (0.0%) | 136 (100.0%) |
| 10 or more Apartments | 0 (0.0%) | 730 (100.0%) |
| Mobile Home / Other | 176 (81.5%) | 40 (18.5%) |
| Total | 9,781 (85.9%) | 1,605 (14.1%) |
Housing Structures by Number of Rooms in Timberwood Park
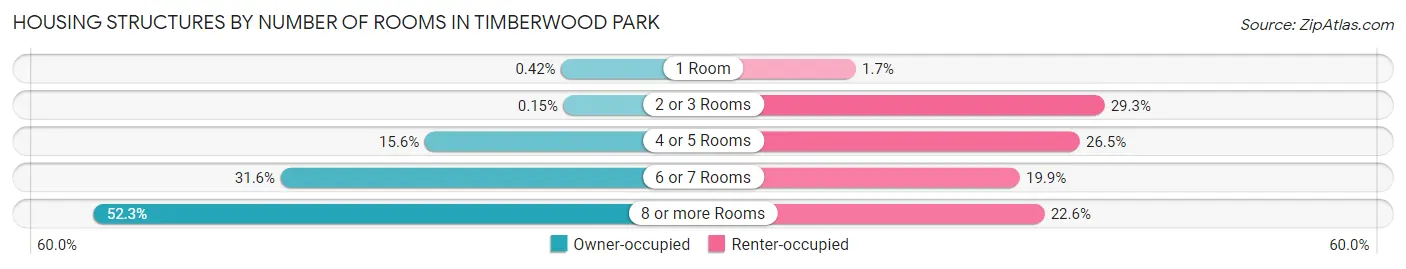
| Number of Rooms | Owner-occupied | Renter-occupied |
| 1 Room | 41 (0.4%) | 27 (1.7%) |
| 2 or 3 Rooms | 15 (0.2%) | 470 (29.3%) |
| 4 or 5 Rooms | 1,521 (15.5%) | 426 (26.5%) |
| 6 or 7 Rooms | 3,087 (31.6%) | 319 (19.9%) |
| 8 or more Rooms | 5,117 (52.3%) | 363 (22.6%) |
| Total | 9,781 (100.0%) | 1,605 (100.0%) |
Housing Structure by Heating Type in Timberwood Park
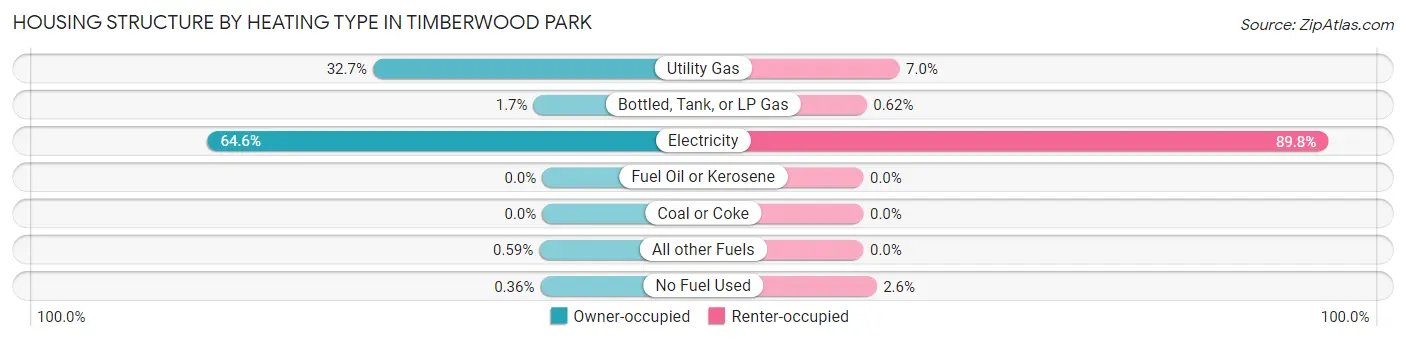
| Heating Type | Owner-occupied | Renter-occupied |
| Utility Gas | 3,201 (32.7%) | 112 (7.0%) |
| Bottled, Tank, or LP Gas | 165 (1.7%) | 10 (0.6%) |
| Electricity | 6,322 (64.6%) | 1,442 (89.8%) |
| Fuel Oil or Kerosene | 0 (0.0%) | 0 (0.0%) |
| Coal or Coke | 0 (0.0%) | 0 (0.0%) |
| All other Fuels | 58 (0.6%) | 0 (0.0%) |
| No Fuel Used | 35 (0.4%) | 41 (2.5%) |
| Total | 9,781 (100.0%) | 1,605 (100.0%) |
Household Vehicle Usage in Timberwood Park
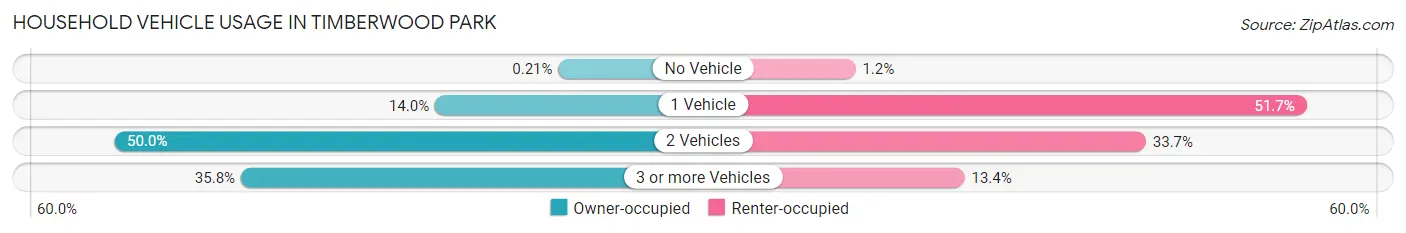
| Vehicles per Household | Owner-occupied | Renter-occupied |
| No Vehicle | 21 (0.2%) | 19 (1.2%) |
| 1 Vehicle | 1,372 (14.0%) | 830 (51.7%) |
| 2 Vehicles | 4,889 (50.0%) | 541 (33.7%) |
| 3 or more Vehicles | 3,499 (35.8%) | 215 (13.4%) |
| Total | 9,781 (100.0%) | 1,605 (100.0%) |
Real Estate & Mortgages in Timberwood Park
Real Estate and Mortgage Overview in Timberwood Park
| Characteristic | Without Mortgage | With Mortgage |
| Housing Units | 2,411 | 7,370 |
| Median Property Value | $427,800 | $436,200 |
| Median Household Income | $101,760 | $3,967 |
| Monthly Housing Costs | $905 | $2,684 |
| Real Estate Taxes | $6,504 | $316 |
Property Value by Mortgage Status in Timberwood Park
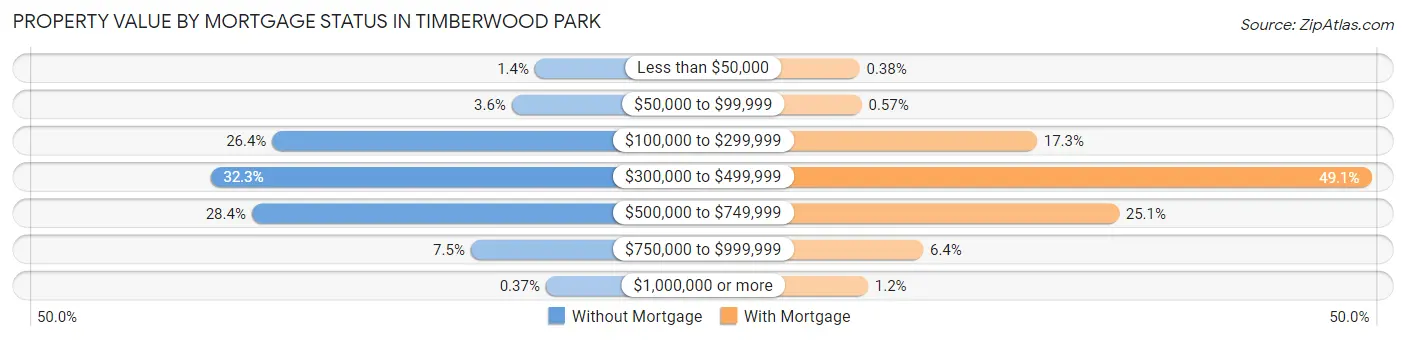
| Property Value | Without Mortgage | With Mortgage |
| Less than $50,000 | 34 (1.4%) | 28 (0.4%) |
| $50,000 to $99,999 | 87 (3.6%) | 42 (0.6%) |
| $100,000 to $299,999 | 637 (26.4%) | 1,272 (17.3%) |
| $300,000 to $499,999 | 779 (32.3%) | 3,620 (49.1%) |
| $500,000 to $749,999 | 684 (28.4%) | 1,848 (25.1%) |
| $750,000 to $999,999 | 181 (7.5%) | 474 (6.4%) |
| $1,000,000 or more | 9 (0.4%) | 86 (1.2%) |
| Total | 2,411 (100.0%) | 7,370 (100.0%) |
Household Income by Mortgage Status in Timberwood Park
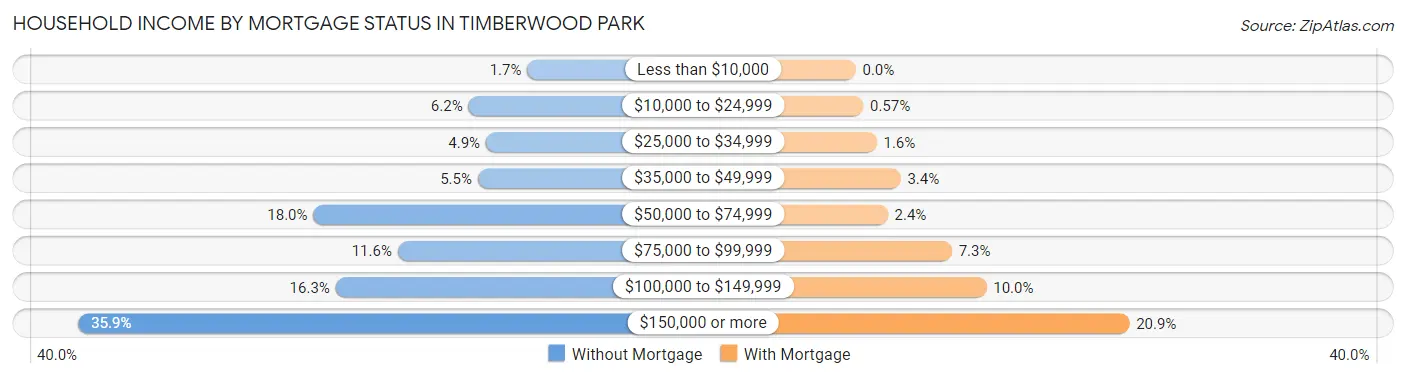
| Household Income | Without Mortgage | With Mortgage |
| Less than $10,000 | 41 (1.7%) | 0 (0.0%) |
| $10,000 to $24,999 | 149 (6.2%) | 42 (0.6%) |
| $25,000 to $34,999 | 117 (4.9%) | 118 (1.6%) |
| $35,000 to $49,999 | 132 (5.5%) | 252 (3.4%) |
| $50,000 to $74,999 | 434 (18.0%) | 180 (2.4%) |
| $75,000 to $99,999 | 279 (11.6%) | 540 (7.3%) |
| $100,000 to $149,999 | 393 (16.3%) | 734 (10.0%) |
| $150,000 or more | 866 (35.9%) | 1,537 (20.8%) |
| Total | 2,411 (100.0%) | 7,370 (100.0%) |
Property Value to Household Income Ratio in Timberwood Park
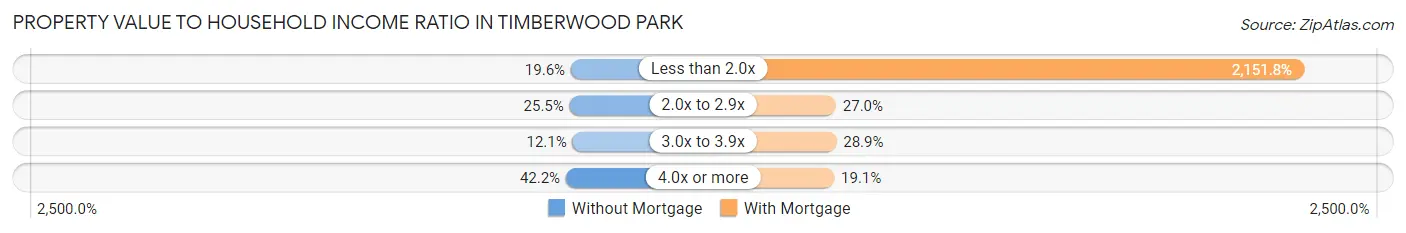
| Value-to-Income Ratio | Without Mortgage | With Mortgage |
| Less than 2.0x | 472 (19.6%) | 158,590 (2,151.8%) |
| 2.0x to 2.9x | 614 (25.5%) | 1,987 (27.0%) |
| 3.0x to 3.9x | 291 (12.1%) | 2,127 (28.9%) |
| 4.0x or more | 1,017 (42.2%) | 1,406 (19.1%) |
| Total | 2,411 (100.0%) | 7,370 (100.0%) |
Real Estate Taxes by Mortgage Status in Timberwood Park
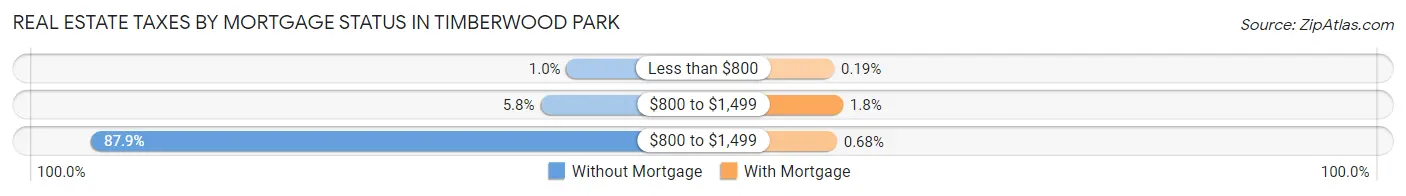
| Property Taxes | Without Mortgage | With Mortgage |
| Less than $800 | 25 (1.0%) | 14 (0.2%) |
| $800 to $1,499 | 140 (5.8%) | 133 (1.8%) |
| $800 to $1,499 | 2,118 (87.8%) | 50 (0.7%) |
| Total | 2,411 (100.0%) | 7,370 (100.0%) |
Health & Disability in Timberwood Park
Health Insurance Coverage by Age in Timberwood Park
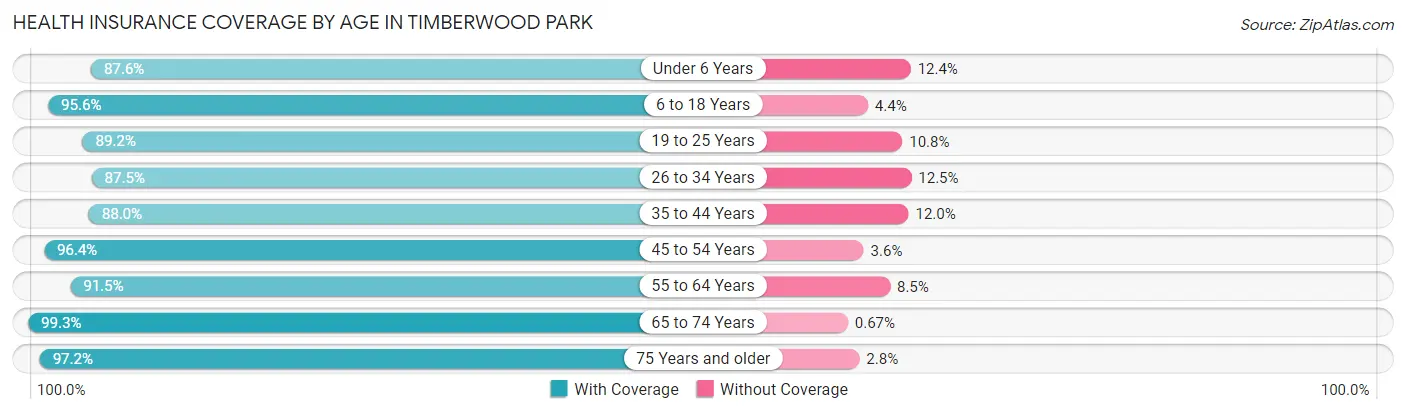
| Age Bracket | With Coverage | Without Coverage |
| Under 6 Years | 2,322 (87.6%) | 328 (12.4%) |
| 6 to 18 Years | 6,848 (95.6%) | 315 (4.4%) |
| 19 to 25 Years | 2,019 (89.2%) | 245 (10.8%) |
| 26 to 34 Years | 2,217 (87.5%) | 317 (12.5%) |
| 35 to 44 Years | 4,998 (88.0%) | 681 (12.0%) |
| 45 to 54 Years | 5,235 (96.4%) | 196 (3.6%) |
| 55 to 64 Years | 3,529 (91.5%) | 329 (8.5%) |
| 65 to 74 Years | 2,984 (99.3%) | 20 (0.7%) |
| 75 Years and older | 1,586 (97.2%) | 46 (2.8%) |
| Total | 31,738 (92.8%) | 2,477 (7.2%) |
Health Insurance Coverage by Citizenship Status in Timberwood Park
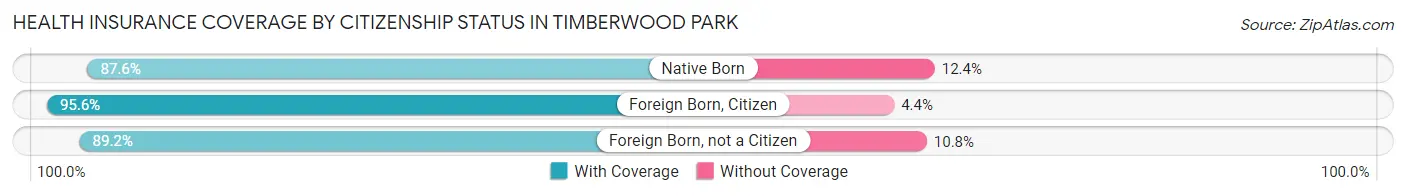
| Citizenship Status | With Coverage | Without Coverage |
| Native Born | 2,322 (87.6%) | 328 (12.4%) |
| Foreign Born, Citizen | 6,848 (95.6%) | 315 (4.4%) |
| Foreign Born, not a Citizen | 2,019 (89.2%) | 245 (10.8%) |
Health Insurance Coverage by Household Income in Timberwood Park
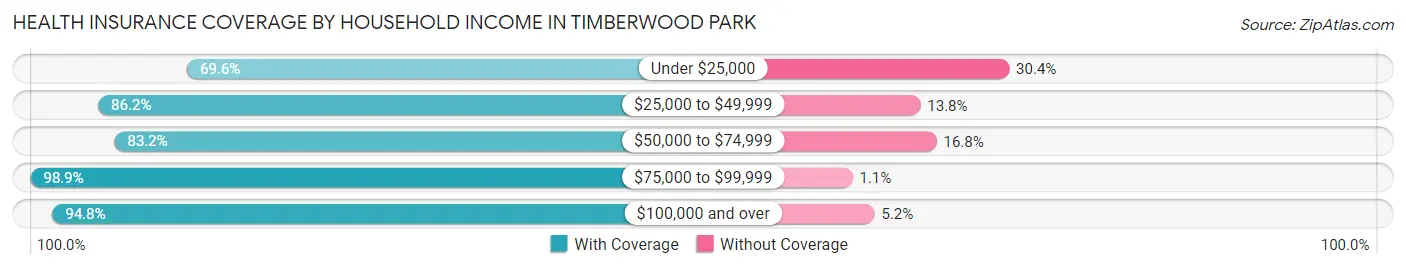
| Household Income | With Coverage | Without Coverage |
| Under $25,000 | 780 (69.6%) | 341 (30.4%) |
| $25,000 to $49,999 | 2,402 (86.2%) | 384 (13.8%) |
| $50,000 to $74,999 | 2,171 (83.2%) | 439 (16.8%) |
| $75,000 to $99,999 | 2,968 (98.9%) | 32 (1.1%) |
| $100,000 and over | 23,417 (94.8%) | 1,281 (5.2%) |
Public vs Private Health Insurance Coverage by Age in Timberwood Park
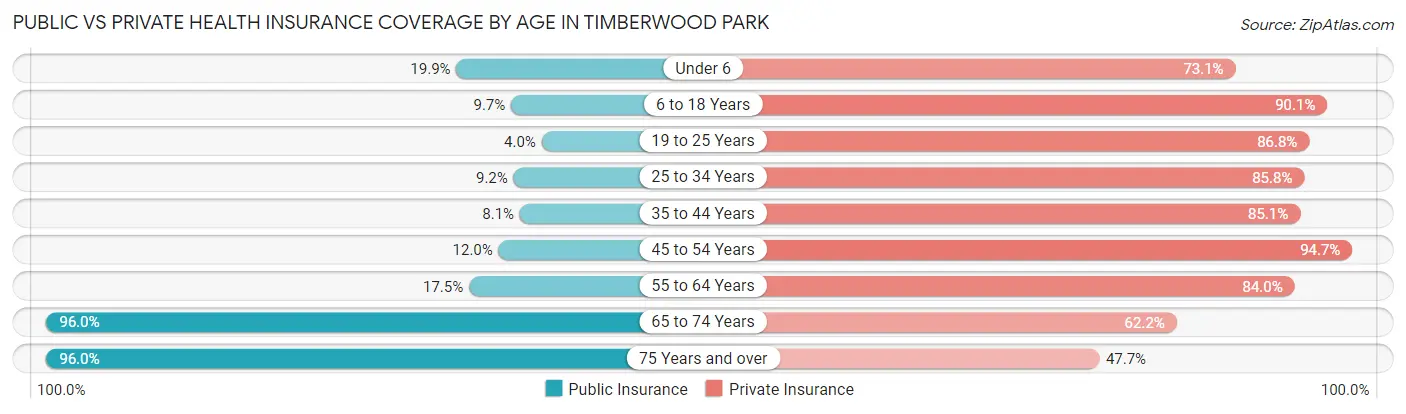
| Age Bracket | Public Insurance | Private Insurance |
| Under 6 | 526 (19.9%) | 1,936 (73.1%) |
| 6 to 18 Years | 695 (9.7%) | 6,454 (90.1%) |
| 19 to 25 Years | 91 (4.0%) | 1,964 (86.8%) |
| 25 to 34 Years | 234 (9.2%) | 2,175 (85.8%) |
| 35 to 44 Years | 458 (8.1%) | 4,830 (85.1%) |
| 45 to 54 Years | 653 (12.0%) | 5,145 (94.7%) |
| 55 to 64 Years | 675 (17.5%) | 3,242 (84.0%) |
| 65 to 74 Years | 2,883 (96.0%) | 1,867 (62.2%) |
| 75 Years and over | 1,566 (96.0%) | 779 (47.7%) |
| Total | 7,781 (22.7%) | 28,392 (83.0%) |
Disability Status by Sex by Age in Timberwood Park
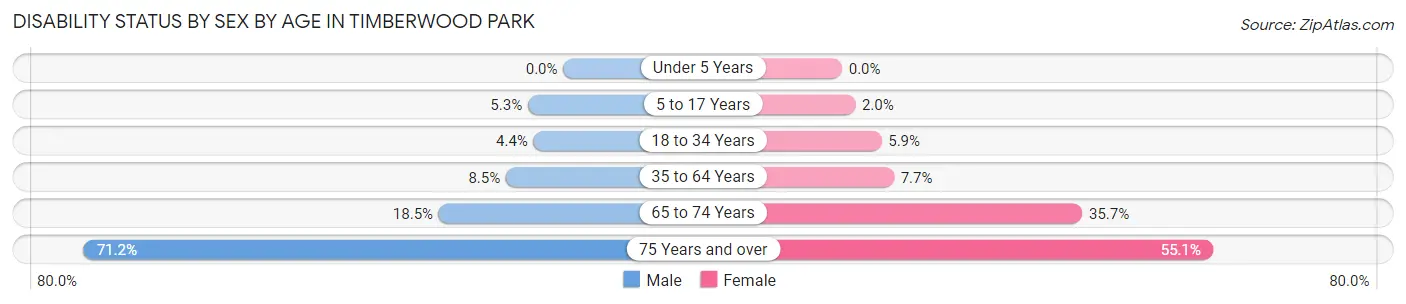
| Age Bracket | Male | Female |
| Under 5 Years | 0 (0.0%) | 0 (0.0%) |
| 5 to 17 Years | 168 (5.2%) | 81 (2.0%) |
| 18 to 34 Years | 116 (4.4%) | 156 (5.9%) |
| 35 to 64 Years | 660 (8.5%) | 556 (7.7%) |
| 65 to 74 Years | 277 (18.5%) | 537 (35.7%) |
| 75 Years and over | 517 (71.2%) | 499 (55.1%) |
Disability Class by Sex by Age in Timberwood Park
Disability Class: Hearing Difficulty
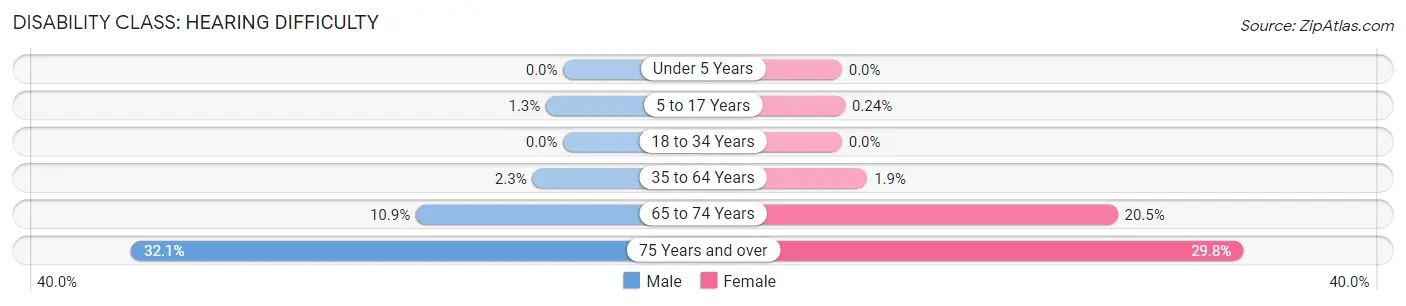
| Age Bracket | Male | Female |
| Under 5 Years | 0 (0.0%) | 0 (0.0%) |
| 5 to 17 Years | 41 (1.3%) | 10 (0.2%) |
| 18 to 34 Years | 0 (0.0%) | 0 (0.0%) |
| 35 to 64 Years | 178 (2.3%) | 136 (1.9%) |
| 65 to 74 Years | 164 (10.9%) | 308 (20.5%) |
| 75 Years and over | 233 (32.1%) | 270 (29.8%) |
Disability Class: Vision Difficulty
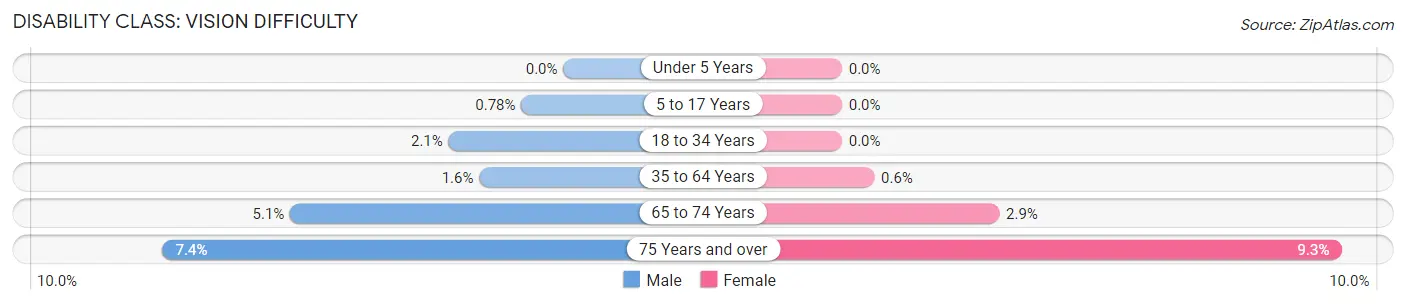
| Age Bracket | Male | Female |
| Under 5 Years | 0 (0.0%) | 0 (0.0%) |
| 5 to 17 Years | 25 (0.8%) | 0 (0.0%) |
| 18 to 34 Years | 56 (2.1%) | 0 (0.0%) |
| 35 to 64 Years | 121 (1.6%) | 43 (0.6%) |
| 65 to 74 Years | 76 (5.1%) | 44 (2.9%) |
| 75 Years and over | 54 (7.4%) | 84 (9.3%) |
Disability Class: Cognitive Difficulty
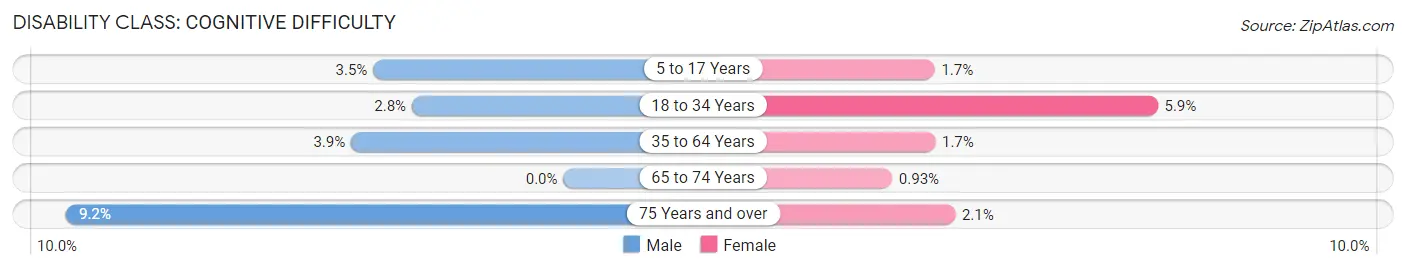
| Age Bracket | Male | Female |
| 5 to 17 Years | 113 (3.5%) | 71 (1.7%) |
| 18 to 34 Years | 74 (2.8%) | 156 (5.9%) |
| 35 to 64 Years | 306 (3.9%) | 125 (1.7%) |
| 65 to 74 Years | 0 (0.0%) | 14 (0.9%) |
| 75 Years and over | 67 (9.2%) | 19 (2.1%) |
Disability Class: Ambulatory Difficulty
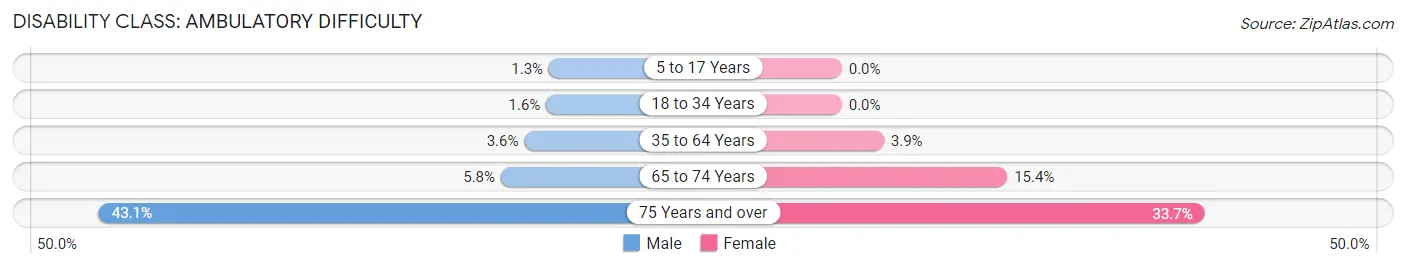
| Age Bracket | Male | Female |
| 5 to 17 Years | 43 (1.3%) | 0 (0.0%) |
| 18 to 34 Years | 42 (1.6%) | 0 (0.0%) |
| 35 to 64 Years | 281 (3.6%) | 281 (3.9%) |
| 65 to 74 Years | 87 (5.8%) | 231 (15.3%) |
| 75 Years and over | 313 (43.1%) | 305 (33.7%) |
Disability Class: Self-Care Difficulty
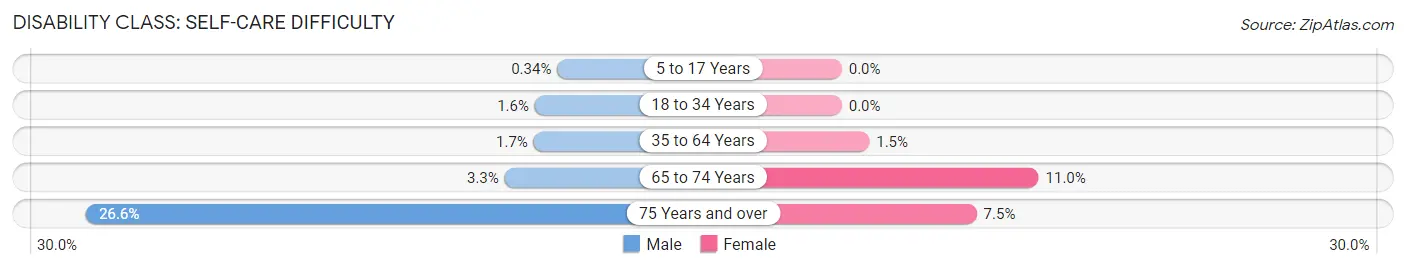
| Age Bracket | Male | Female |
| 5 to 17 Years | 11 (0.3%) | 0 (0.0%) |
| 18 to 34 Years | 42 (1.6%) | 0 (0.0%) |
| 35 to 64 Years | 128 (1.7%) | 110 (1.5%) |
| 65 to 74 Years | 49 (3.3%) | 165 (11.0%) |
| 75 Years and over | 193 (26.6%) | 68 (7.5%) |
Technology Access in Timberwood Park
Computing Device Access in Timberwood Park
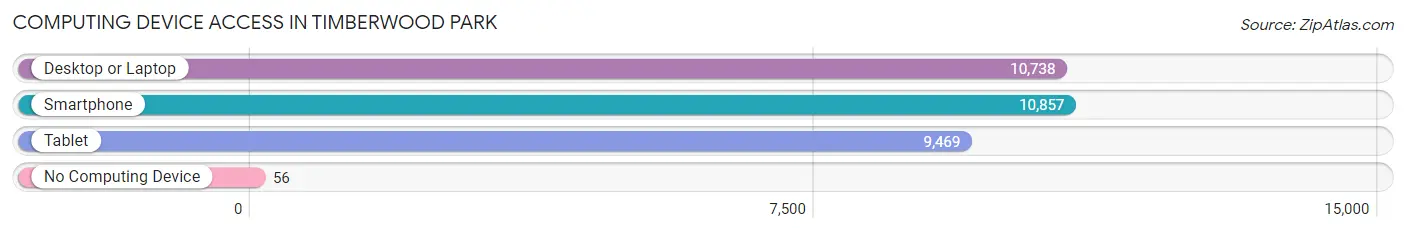
| Device Type | # Households | % Households |
| Desktop or Laptop | 10,738 | 94.3% |
| Smartphone | 10,857 | 95.4% |
| Tablet | 9,469 | 83.2% |
| No Computing Device | 56 | 0.5% |
| Total | 11,386 | 100.0% |
Internet Access in Timberwood Park
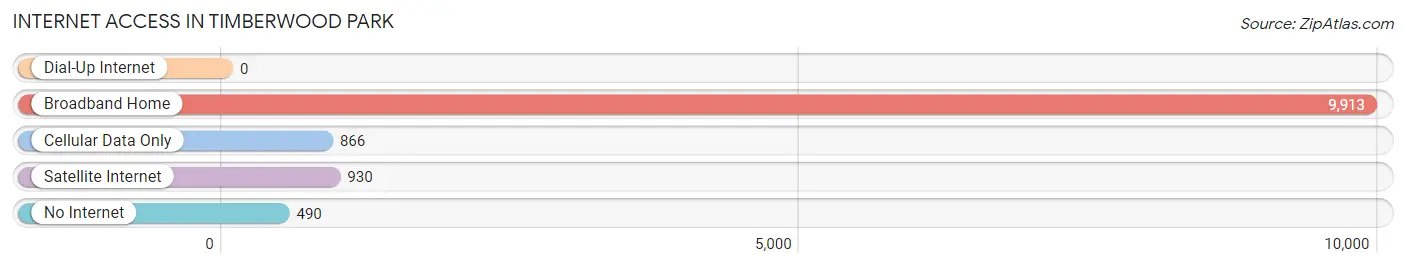
| Internet Type | # Households | % Households |
| Dial-Up Internet | 0 | 0.0% |
| Broadband Home | 9,913 | 87.1% |
| Cellular Data Only | 866 | 7.6% |
| Satellite Internet | 930 | 8.2% |
| No Internet | 490 | 4.3% |
| Total | 11,386 | 100.0% |
Timberwood Park Summary
Timberwood Park is a census-designated place (CDP) located in Bexar County, Texas, United States. It is a suburb of San Antonio and part of the San Antonio–New Braunfels Metropolitan Statistical Area. The population was 8,945 at the 2010 census.
Geography
Timberwood Park is located at 29 41 17 North 98 27 45 West 29 688056 98 4625
According to the United States Census Bureau, the CDP has a total area of 8.3 square miles (21.5 km2), all of it land.
History
Timberwood Park was founded in the late 1970s as a master-planned community. It was developed by the San Antonio-based firm of Hixon Properties, Inc. The community was designed to be a self-contained, family-oriented neighborhood with a variety of amenities.
The community was named after the nearby Timberwood Park Golf Club, which was established in the late 1970s. The golf course was designed by renowned golf course architect Robert Trent Jones, Jr.
Economy
Timberwood Park is home to a variety of businesses, including retail stores, restaurants, and professional services. The community is also home to a number of corporate offices, including those of USAA, Valero Energy Corporation, and Rackspace.
Demographics
As of the census of 2000, there were 8,945 people, 3,093 households, and 2,619 families residing in the CDP. The population density was 1,077.3 people per square mile (415.9/km2). There were 3,223 housing units at an average density of 388.3/sq mi (149.8/km2). The racial makeup of the CDP was 87.45% White, 2.45% African American, 0.37% Native American, 3.45% Asian, 0.02% Pacific Islander, 4.45% from other races, and 1.81% from two or more races. Hispanic or Latino of any race were 16.45% of the population.
There were 3,093 households, out of which 44.2% had children under the age of 18 living with them, 73.2% were married couples living together, 6.2% had a female householder with no husband present, and 18.2% were non-families. 14.7% of all households were made up of individuals, and 3.2% had someone living alone who was 65 years of age or older. The average household size was 2.90 and the average family size was 3.23.
In the CDP, the population was spread out, with 30.2% under the age of 18, 5.2% from 18 to 24, 33.2% from 25 to 44, 24.2% from 45 to 64, and 7.2% who were 65 years of age or older. The median age was 36 years. For every 100 females, there were 97.2 males. For every 100 females age 18 and over, there were 94.2 males.
The median income for a household in the CDP was $86,945, and the median income for a family was $93,945. Males had a median income of $60,945 versus $41,945 for females. The per capita income for the CDP was $32,945. About 1.2% of families and 1.7% of the population were below the poverty line, including 1.7% of those under age 18 and none of those age 65 or over.
Common Questions
What is Per Capita Income in Timberwood Park?
Per Capita income in Timberwood Park is $54,878.
What is the Median Family Income in Timberwood Park?
Median Family Income in Timberwood Park is $155,056.
What is the Median Household income in Timberwood Park?
Median Household Income in Timberwood Park is $135,709.
What is Income or Wage Gap in Timberwood Park?
Income or Wage Gap in Timberwood Park is 46.1%.
Women in Timberwood Park earn 53.9 cents for every dollar earned by a man.
What is Inequality or Gini Index in Timberwood Park?
Inequality or Gini Index in Timberwood Park is 0.41.
What is the Total Population of Timberwood Park?
Total Population of Timberwood Park is 34,253.
What is the Total Male Population of Timberwood Park?
Total Male Population of Timberwood Park is 16,606.
What is the Total Female Population of Timberwood Park?
Total Female Population of Timberwood Park is 17,647.
What is the Ratio of Males per 100 Females in Timberwood Park?
There are 94.10 Males per 100 Females in Timberwood Park.
What is the Ratio of Females per 100 Males in Timberwood Park?
There are 106.27 Females per 100 Males in Timberwood Park.
What is the Median Population Age in Timberwood Park?
Median Population Age in Timberwood Park is 39.1 Years.
What is the Average Family Size in Timberwood Park
Average Family Size in Timberwood Park is 3.5 People.
What is the Average Household Size in Timberwood Park
Average Household Size in Timberwood Park is 3.0 People.
How Large is the Labor Force in Timberwood Park?
There are 18,028 People in the Labor Forcein in Timberwood Park.
What is the Percentage of People in the Labor Force in Timberwood Park?
69.6% of People are in the Labor Force in Timberwood Park.
What is the Unemployment Rate in Timberwood Park?
Unemployment Rate in Timberwood Park is 3.5%.