Atascocita, TX Map & Demographics
Atascocita Map
Atascocita Overview
$43,030
PER CAPITA INCOME
$127,803
AVG FAMILY INCOME
$115,687
AVG HOUSEHOLD INCOME
27.8%
WAGE / INCOME GAP [ % ]
72.2¢/ $1
WAGE / INCOME GAP [ $ ]
0.34
INEQUALITY / GINI INDEX
89,121
TOTAL POPULATION
45,817
MALE POPULATION
43,304
FEMALE POPULATION
105.80
MALES / 100 FEMALES
94.52
FEMALES / 100 MALES
35.7
MEDIAN AGE
3.4
AVG FAMILY SIZE
3.0
AVG HOUSEHOLD SIZE
47,102
LABOR FORCE [ PEOPLE ]
69.8%
PERCENT IN LABOR FORCE
5.0%
UNEMPLOYMENT RATE
Atascocita Area Codes
Income in Atascocita
Income Overview in Atascocita
Per Capita Income in Atascocita is $43,030, while median incomes of families and households are $127,803 and $115,687 respectively.
| Characteristic | Number | Measure |
| Per Capita Income | 89,121 | $43,030 |
| Median Family Income | 22,861 | $127,803 |
| Mean Family Income | 22,861 | $138,608 |
| Median Household Income | 29,089 | $115,687 |
| Mean Household Income | 29,089 | $129,965 |
| Income Deficit | 22,861 | $0 |
| Wage / Income Gap (%) | 89,121 | 27.78% |
| Wage / Income Gap ($) | 89,121 | 72.22¢ per $1 |
| Gini / Inequality Index | 89,121 | 0.34 |
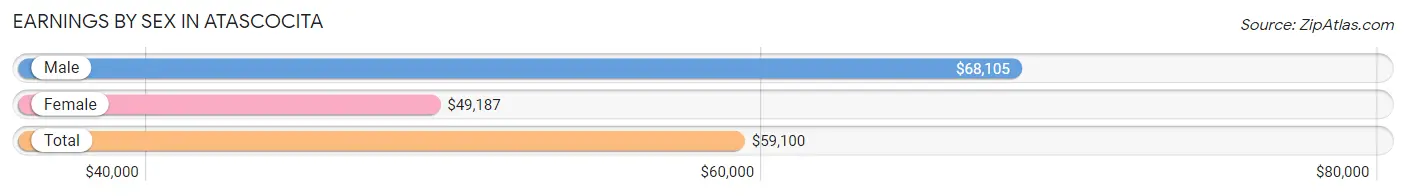
Earnings by Sex in Atascocita
Average Earnings in Atascocita are $59,100, $68,105 for men and $49,187 for women, a difference of 27.8%.
| Sex | Number | Average Earnings |
| Male | 26,512 (54.4%) | $68,105 |
| Female | 22,188 (45.6%) | $49,187 |
| Total | 48,700 (100.0%) | $59,100 |
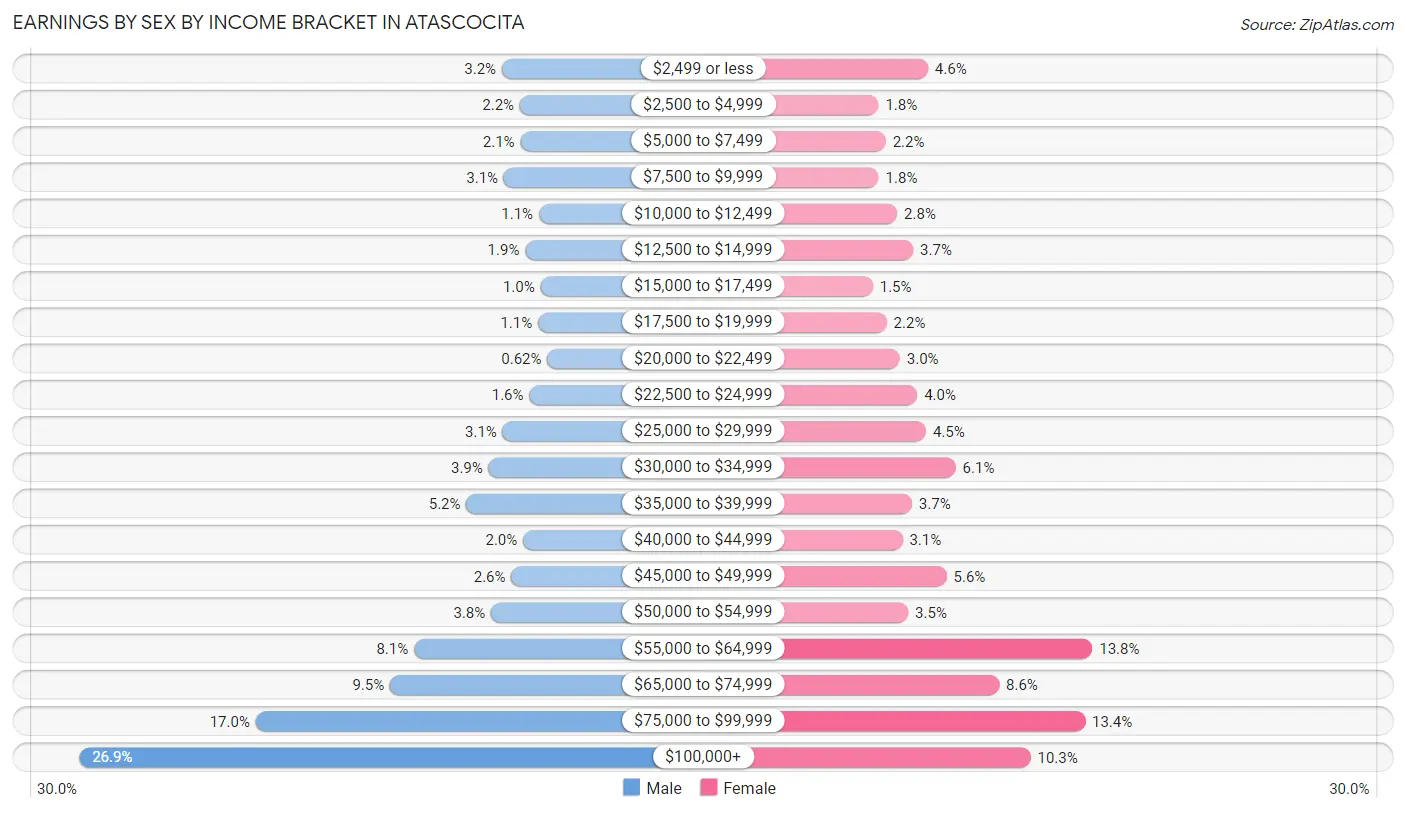
Earnings by Sex by Income Bracket in Atascocita
The most common earnings brackets in Atascocita are $100,000+ for men (7,140 | 26.9%) and $55,000 to $64,999 for women (3,061 | 13.8%).
| Income | Male | Female |
| $2,499 or less | 841 (3.2%) | 1,011 (4.6%) |
| $2,500 to $4,999 | 573 (2.2%) | 395 (1.8%) |
| $5,000 to $7,499 | 564 (2.1%) | 486 (2.2%) |
| $7,500 to $9,999 | 812 (3.1%) | 397 (1.8%) |
| $10,000 to $12,499 | 288 (1.1%) | 628 (2.8%) |
| $12,500 to $14,999 | 492 (1.9%) | 827 (3.7%) |
| $15,000 to $17,499 | 265 (1.0%) | 324 (1.5%) |
| $17,500 to $19,999 | 303 (1.1%) | 496 (2.2%) |
| $20,000 to $22,499 | 165 (0.6%) | 662 (3.0%) |
| $22,500 to $24,999 | 432 (1.6%) | 878 (4.0%) |
| $25,000 to $29,999 | 829 (3.1%) | 988 (4.4%) |
| $30,000 to $34,999 | 1,040 (3.9%) | 1,359 (6.1%) |
| $35,000 to $39,999 | 1,370 (5.2%) | 811 (3.7%) |
| $40,000 to $44,999 | 526 (2.0%) | 694 (3.1%) |
| $45,000 to $49,999 | 700 (2.6%) | 1,244 (5.6%) |
| $50,000 to $54,999 | 1,003 (3.8%) | 766 (3.5%) |
| $55,000 to $64,999 | 2,150 (8.1%) | 3,061 (13.8%) |
| $65,000 to $74,999 | 2,508 (9.5%) | 1,899 (8.6%) |
| $75,000 to $99,999 | 4,511 (17.0%) | 2,970 (13.4%) |
| $100,000+ | 7,140 (26.9%) | 2,292 (10.3%) |
| Total | 26,512 (100.0%) | 22,188 (100.0%) |
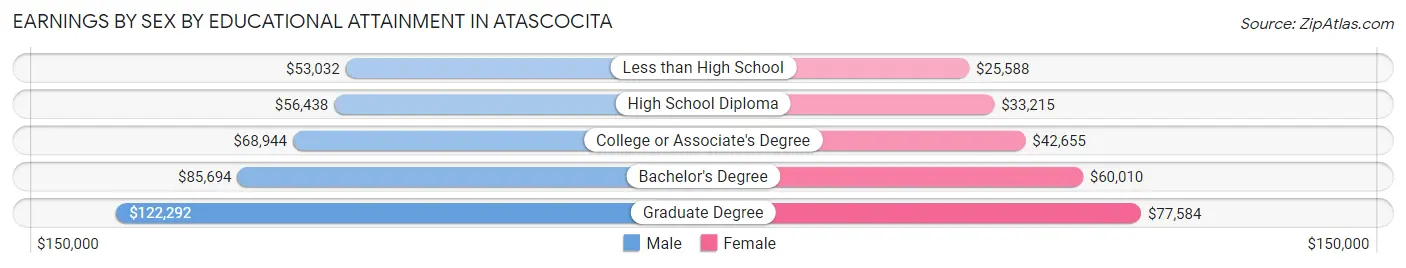
Earnings by Sex by Educational Attainment in Atascocita
Average earnings in Atascocita are $73,132 for men and $55,993 for women, a difference of 23.4%. Men with an educational attainment of graduate degree enjoy the highest average annual earnings of $122,292, while those with less than high school education earn the least with $53,032. Women with an educational attainment of graduate degree earn the most with the average annual earnings of $77,584, while those with less than high school education have the smallest earnings of $25,588.
| Educational Attainment | Male Income | Female Income |
| Less than High School | $53,032 | $25,588 |
| High School Diploma | $56,438 | $33,215 |
| College or Associate's Degree | $68,944 | $42,655 |
| Bachelor's Degree | $85,694 | $60,010 |
| Graduate Degree | $122,292 | $77,584 |
| Total | $73,132 | $55,993 |
Family Income in Atascocita
Family Income Brackets in Atascocita
According to the Atascocita family income data, there are 5,647 families falling into the $100,000 to $149,999 income range, which is the most common income bracket and makes up 24.7% of all families. Conversely, the less than $10,000 income bracket is the least frequent group with only 274 families (1.2%) belonging to this category.
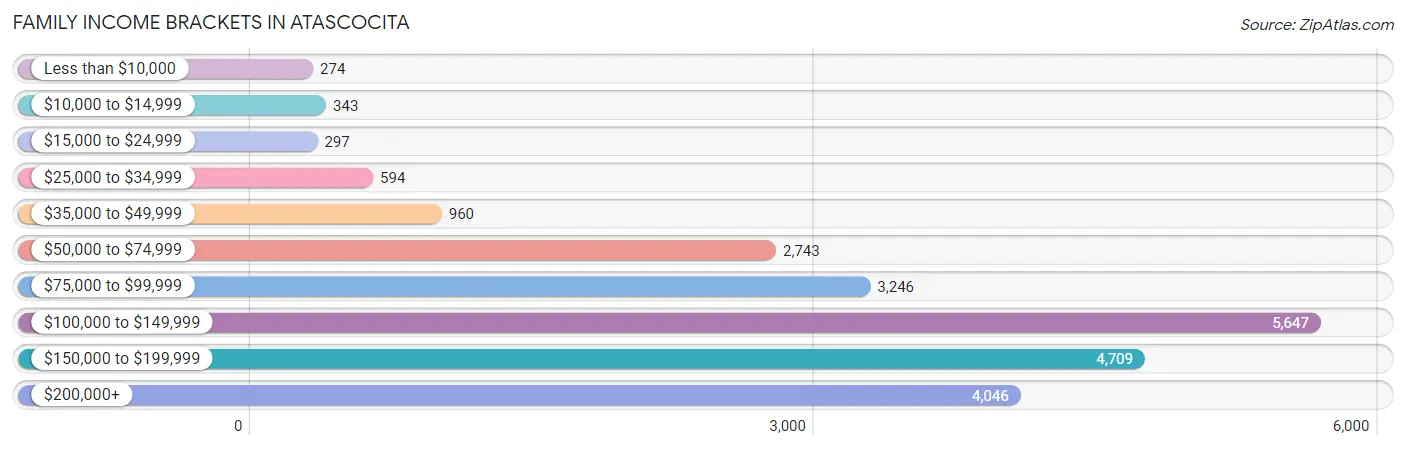
| Income Bracket | # Families | % Families |
| Less than $10,000 | 274 | 1.2% |
| $10,000 to $14,999 | 343 | 1.5% |
| $15,000 to $24,999 | 297 | 1.3% |
| $25,000 to $34,999 | 594 | 2.6% |
| $35,000 to $49,999 | 960 | 4.2% |
| $50,000 to $74,999 | 2,743 | 12.0% |
| $75,000 to $99,999 | 3,246 | 14.2% |
| $100,000 to $149,999 | 5,647 | 24.7% |
| $150,000 to $199,999 | 4,709 | 20.6% |
| $200,000+ | 4,046 | 17.7% |
Family Income by Famaliy Size in Atascocita
7+ person families (360 | 1.6%) account for the highest median family income in Atascocita with $172,548 per family, while 2-person families (8,537 | 37.3%) have the highest median income of $52,628 per family member.
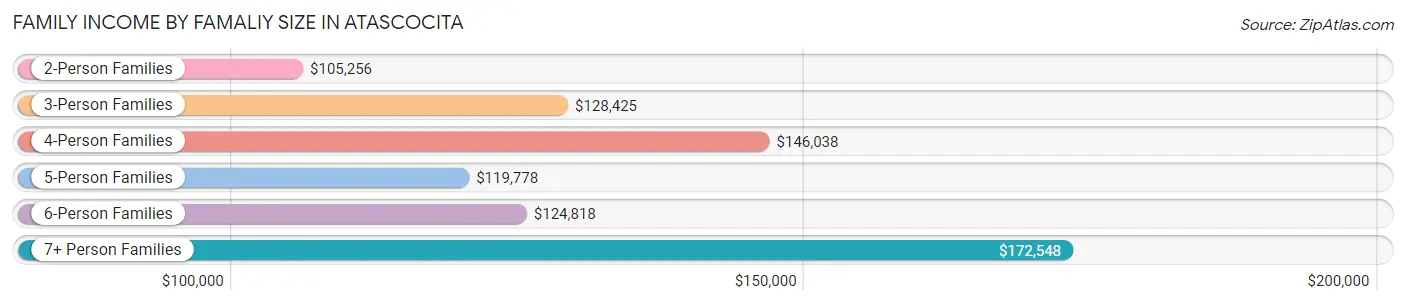
| Income Bracket | # Families | Median Income |
| 2-Person Families | 8,537 (37.3%) | $105,256 |
| 3-Person Families | 5,431 (23.8%) | $128,425 |
| 4-Person Families | 5,472 (23.9%) | $146,038 |
| 5-Person Families | 2,178 (9.5%) | $119,778 |
| 6-Person Families | 883 (3.9%) | $124,818 |
| 7+ Person Families | 360 (1.6%) | $172,548 |
| Total | 22,861 (100.0%) | $127,803 |
Family Income by Number of Earners in Atascocita
The median family income in Atascocita is $127,803, with families comprising 3+ earners (2,855) having the highest median family income of $163,055, while families with no earners (1,797) have the lowest median family income of $55,635, accounting for 12.5% and 7.9% of families, respectively.
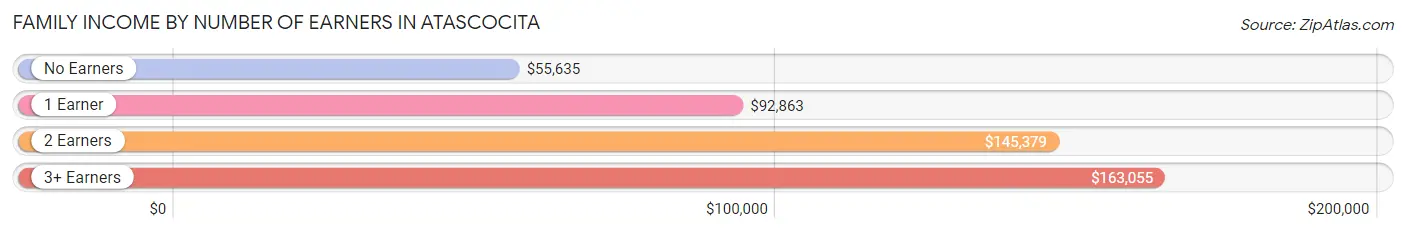
| Number of Earners | # Families | Median Income |
| No Earners | 1,797 (7.9%) | $55,635 |
| 1 Earner | 6,584 (28.8%) | $92,863 |
| 2 Earners | 11,625 (50.8%) | $145,379 |
| 3+ Earners | 2,855 (12.5%) | $163,055 |
| Total | 22,861 (100.0%) | $127,803 |
Household Income in Atascocita
Household Income Brackets in Atascocita
With 6,690 households falling in the category, the $100,000 to $149,999 income range is the most frequent in Atascocita, accounting for 23.0% of all households. In contrast, only 204 households (0.7%) fall into the $10,000 to $14,999 income bracket, making it the least populous group.
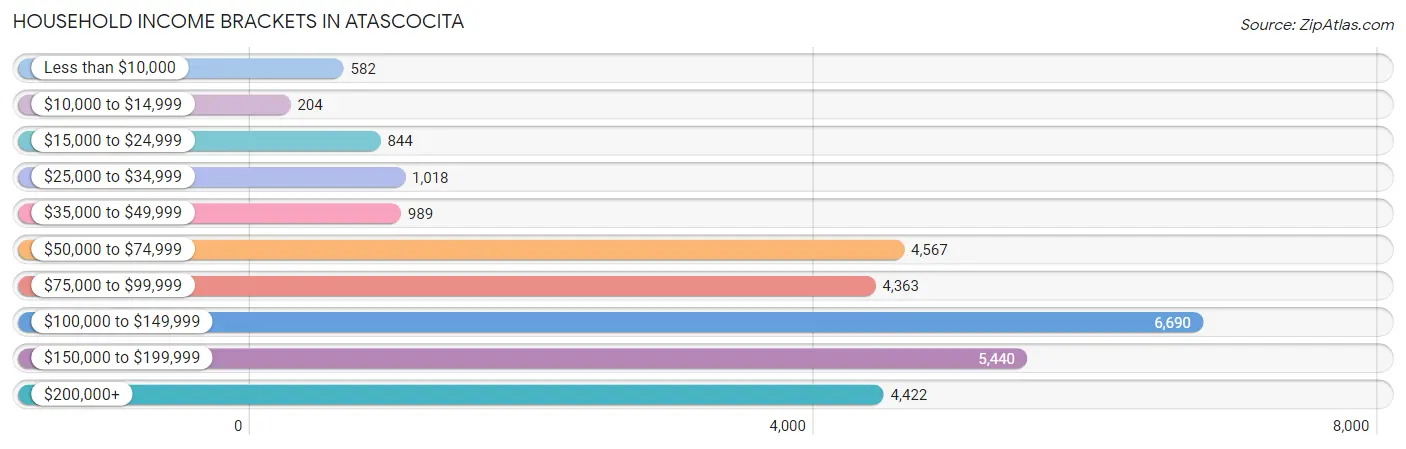
| Income Bracket | # Households | % Households |
| Less than $10,000 | 582 | 2.0% |
| $10,000 to $14,999 | 204 | 0.7% |
| $15,000 to $24,999 | 844 | 2.9% |
| $25,000 to $34,999 | 1,018 | 3.5% |
| $35,000 to $49,999 | 989 | 3.4% |
| $50,000 to $74,999 | 4,567 | 15.7% |
| $75,000 to $99,999 | 4,363 | 15.0% |
| $100,000 to $149,999 | 6,690 | 23.0% |
| $150,000 to $199,999 | 5,440 | 18.7% |
| $200,000+ | 4,422 | 15.2% |
Household Income by Householder Age in Atascocita
The median household income in Atascocita is $115,687, with the highest median household income of $128,050 found in the 45 to 64 years age bracket for the primary householder. A total of 11,126 households (38.3%) fall into this category. Meanwhile, the 15 to 24 years age bracket for the primary householder has the lowest median household income of $76,196, with 354 households (1.2%) in this group.
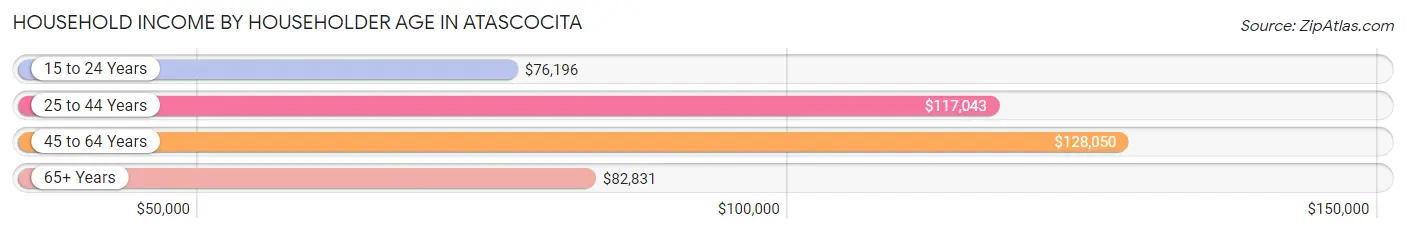
| Income Bracket | # Households | Median Income |
| 15 to 24 Years | 354 (1.2%) | $76,196 |
| 25 to 44 Years | 13,102 (45.0%) | $117,043 |
| 45 to 64 Years | 11,126 (38.3%) | $128,050 |
| 65+ Years | 4,507 (15.5%) | $82,831 |
| Total | 29,089 (100.0%) | $115,687 |
Poverty in Atascocita
Income Below Poverty by Sex and Age in Atascocita
With 4.1% poverty level for males and 6.2% for females among the residents of Atascocita, 16 and 17 year old males and 15 year old females are the most vulnerable to poverty, with 127 males (8.6%) and 85 females (16.5%) in their respective age groups living below the poverty level.
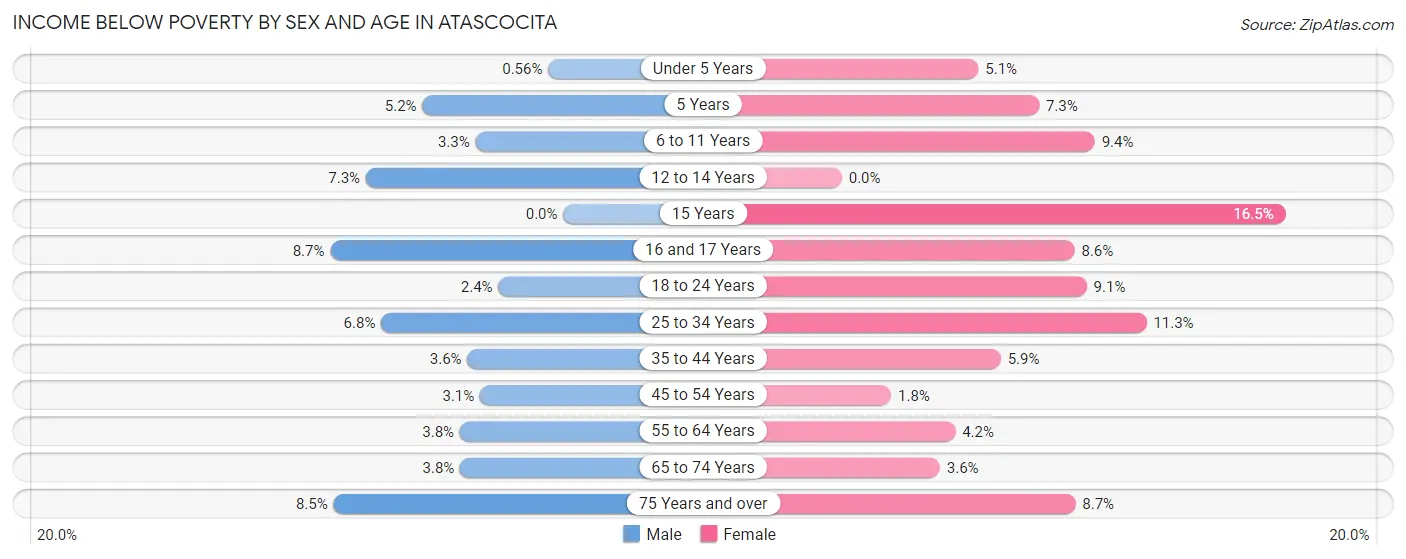
| Age Bracket | Male | Female |
| Under 5 Years | 17 (0.6%) | 152 (5.1%) |
| 5 Years | 33 (5.2%) | 27 (7.3%) |
| 6 to 11 Years | 138 (3.3%) | 405 (9.4%) |
| 12 to 14 Years | 177 (7.3%) | 0 (0.0%) |
| 15 Years | 0 (0.0%) | 85 (16.5%) |
| 16 and 17 Years | 127 (8.6%) | 127 (8.6%) |
| 18 to 24 Years | 82 (2.4%) | 246 (9.1%) |
| 25 to 34 Years | 376 (6.8%) | 666 (11.3%) |
| 35 to 44 Years | 281 (3.6%) | 448 (5.9%) |
| 45 to 54 Years | 176 (3.1%) | 109 (1.8%) |
| 55 to 64 Years | 167 (3.8%) | 182 (4.2%) |
| 65 to 74 Years | 111 (3.8%) | 128 (3.6%) |
| 75 Years and over | 74 (8.5%) | 117 (8.7%) |
| Total | 1,759 (4.1%) | 2,692 (6.2%) |
Income Above Poverty by Sex and Age in Atascocita
According to the poverty statistics in Atascocita, males aged 15 years and females aged 12 to 14 years are the age groups that are most secure financially, with 100.0% of males and 100.0% of females in these age groups living above the poverty line.
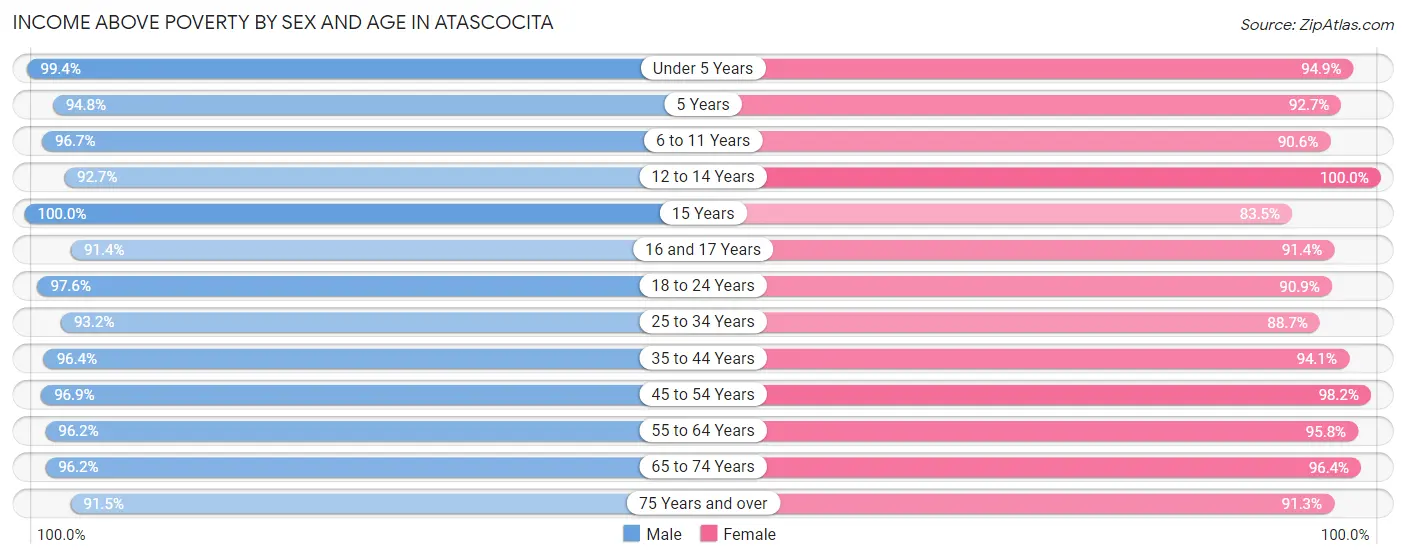
| Age Bracket | Male | Female |
| Under 5 Years | 3,034 (99.4%) | 2,844 (94.9%) |
| 5 Years | 598 (94.8%) | 342 (92.7%) |
| 6 to 11 Years | 4,097 (96.7%) | 3,907 (90.6%) |
| 12 to 14 Years | 2,239 (92.7%) | 2,208 (100.0%) |
| 15 Years | 736 (100.0%) | 431 (83.5%) |
| 16 and 17 Years | 1,341 (91.3%) | 1,343 (91.4%) |
| 18 to 24 Years | 3,325 (97.6%) | 2,459 (90.9%) |
| 25 to 34 Years | 5,188 (93.2%) | 5,224 (88.7%) |
| 35 to 44 Years | 7,604 (96.4%) | 7,143 (94.1%) |
| 45 to 54 Years | 5,513 (96.9%) | 5,861 (98.2%) |
| 55 to 64 Years | 4,184 (96.2%) | 4,146 (95.8%) |
| 65 to 74 Years | 2,785 (96.2%) | 3,392 (96.4%) |
| 75 Years and over | 794 (91.5%) | 1,233 (91.3%) |
| Total | 41,438 (95.9%) | 40,533 (93.8%) |
Income Below Poverty Among Married-Couple Families in Atascocita
The poverty statistics for married-couple families in Atascocita show that 1.8% or 325 of the total 18,237 families live below the poverty line. Families with no children have the highest poverty rate of 2.5%, comprising of 190 families. On the other hand, families with 3 or 4 children have the lowest poverty rate of 0.0%, which includes 0 families.
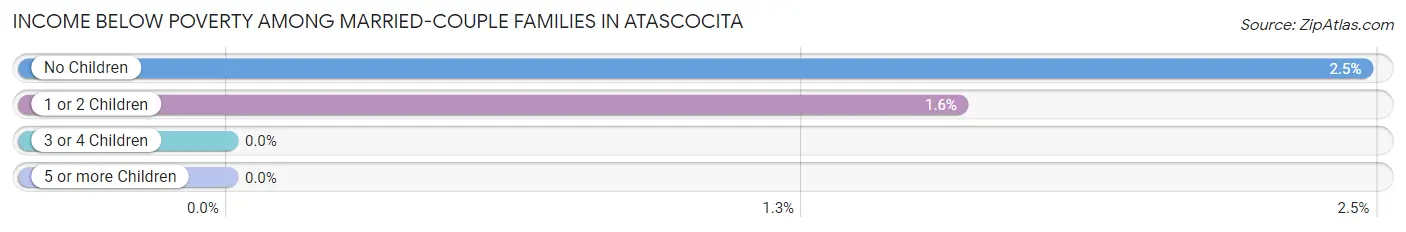
| Children | Above Poverty | Below Poverty |
| No Children | 7,506 (97.5%) | 190 (2.5%) |
| 1 or 2 Children | 8,346 (98.4%) | 135 (1.6%) |
| 3 or 4 Children | 1,983 (100.0%) | 0 (0.0%) |
| 5 or more Children | 77 (100.0%) | 0 (0.0%) |
| Total | 17,912 (98.2%) | 325 (1.8%) |
Income Below Poverty Among Single-Parent Households in Atascocita
According to the poverty data in Atascocita, 1.1% or 16 single-father households and 13.2% or 417 single-mother households are living below the poverty line. Among single-father households, those with 1 or 2 children have the highest poverty rate, with 16 households (2.6%) experiencing poverty. Likewise, among single-mother households, those with 5 or more children have the highest poverty rate, with 82 households (100.0%) falling below the poverty line.
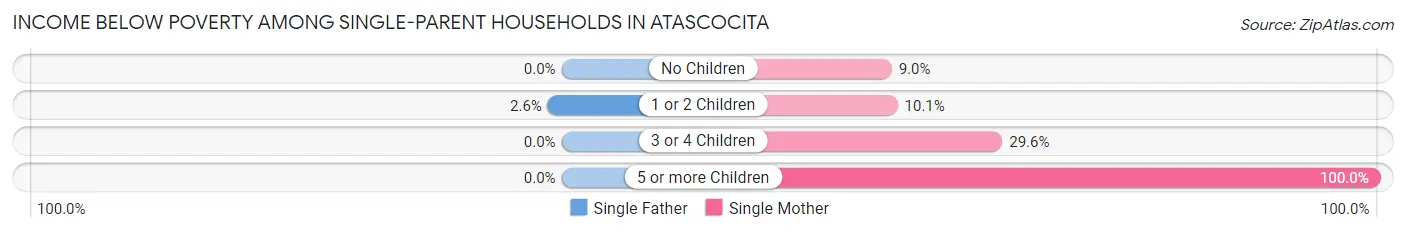
| Children | Single Father | Single Mother |
| No Children | 0 (0.0%) | 140 (8.9%) |
| 1 or 2 Children | 16 (2.6%) | 130 (10.1%) |
| 3 or 4 Children | 0 (0.0%) | 65 (29.5%) |
| 5 or more Children | 0 (0.0%) | 82 (100.0%) |
| Total | 16 (1.1%) | 417 (13.2%) |
Income Below Poverty Among Married-Couple vs Single-Parent Households in Atascocita
The poverty data for Atascocita shows that 325 of the married-couple family households (1.8%) and 433 of the single-parent households (9.4%) are living below the poverty level. Within the married-couple family households, those with no children have the highest poverty rate, with 190 households (2.5%) falling below the poverty line. Among the single-parent households, those with 5 or more children have the highest poverty rate, with 82 household (100.0%) living below poverty.
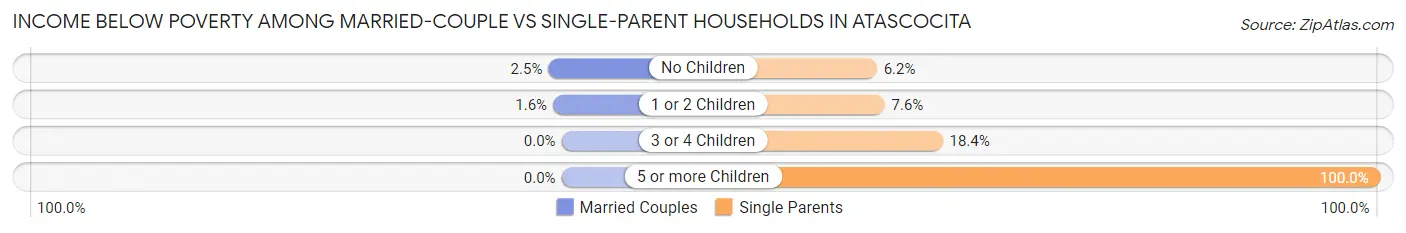
| Children | Married-Couple Families | Single-Parent Households |
| No Children | 190 (2.5%) | 140 (6.2%) |
| 1 or 2 Children | 135 (1.6%) | 146 (7.6%) |
| 3 or 4 Children | 0 (0.0%) | 65 (18.4%) |
| 5 or more Children | 0 (0.0%) | 82 (100.0%) |
| Total | 325 (1.8%) | 433 (9.4%) |
Race in Atascocita
The most populous races in Atascocita are White / Caucasian (47,085 | 52.8%), Hispanic or Latino (27,456 | 30.8%), and Black / African American (20,526 | 23.0%).
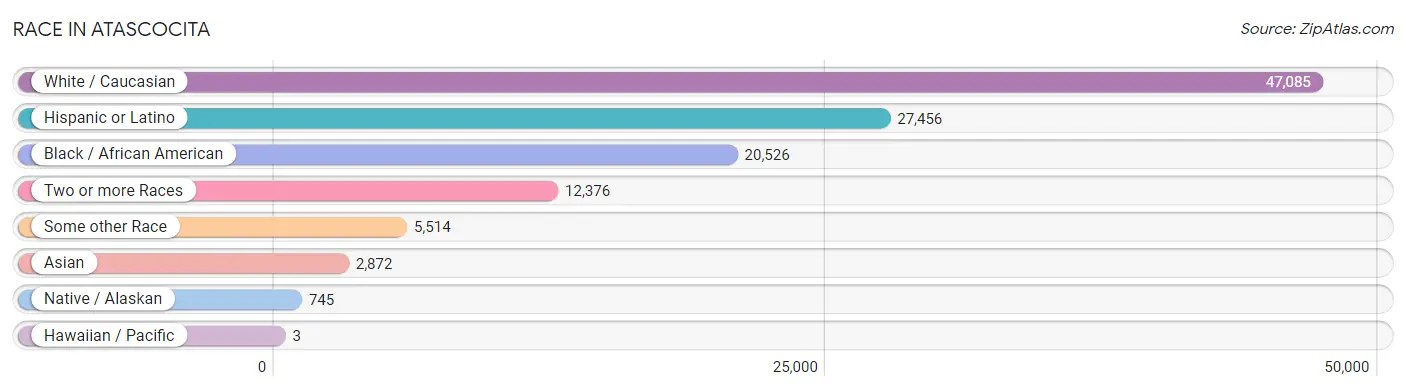
| Race | # Population | % Population |
| Asian | 2,872 | 3.2% |
| Black / African American | 20,526 | 23.0% |
| Hawaiian / Pacific | 3 | 0.0% |
| Hispanic or Latino | 27,456 | 30.8% |
| Native / Alaskan | 745 | 0.8% |
| White / Caucasian | 47,085 | 52.8% |
| Two or more Races | 12,376 | 13.9% |
| Some other Race | 5,514 | 6.2% |
| Total | 89,121 | 100.0% |
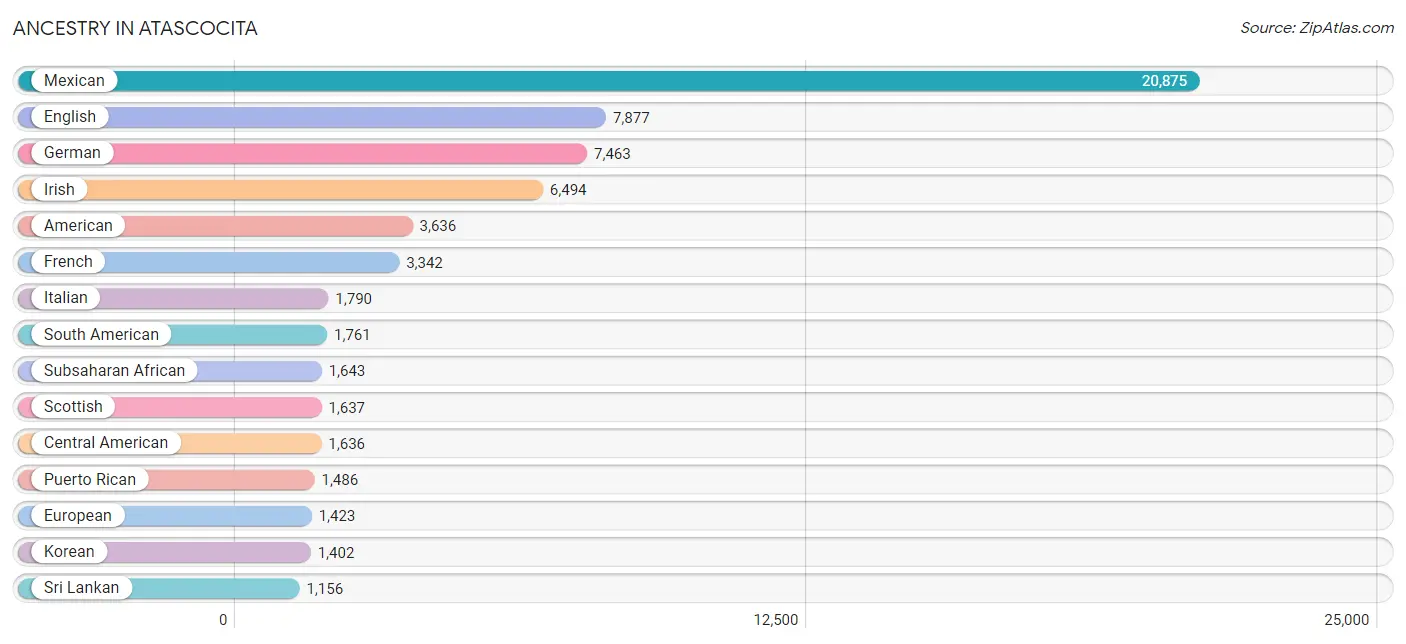
Ancestry in Atascocita
The most populous ancestries reported in Atascocita are Mexican (20,875 | 23.4%), English (7,877 | 8.8%), German (7,463 | 8.4%), Irish (6,494 | 7.3%), and American (3,636 | 4.1%), together accounting for 52.0% of all Atascocita residents.
| Ancestry | # Population | % Population |
| African | 1,069 | 1.2% |
| American | 3,636 | 4.1% |
| Arab | 238 | 0.3% |
| Argentinean | 81 | 0.1% |
| Australian | 9 | 0.0% |
| Austrian | 491 | 0.5% |
| Barbadian | 8 | 0.0% |
| Bhutanese | 562 | 0.6% |
| Brazilian | 111 | 0.1% |
| British | 647 | 0.7% |
| Burmese | 263 | 0.3% |
| Cajun | 68 | 0.1% |
| Canadian | 137 | 0.2% |
| Central American | 1,636 | 1.8% |
| Central American Indian | 92 | 0.1% |
| Cherokee | 335 | 0.4% |
| Chilean | 11 | 0.0% |
| Choctaw | 139 | 0.2% |
| Colombian | 313 | 0.4% |
| Costa Rican | 3 | 0.0% |
| Creek | 13 | 0.0% |
| Croatian | 39 | 0.0% |
| Cuban | 149 | 0.2% |
| Cypriot | 11 | 0.0% |
| Czech | 380 | 0.4% |
| Czechoslovakian | 46 | 0.1% |
| Dominican | 87 | 0.1% |
| Dutch | 728 | 0.8% |
| Dutch West Indian | 9 | 0.0% |
| Eastern European | 37 | 0.0% |
| Egyptian | 5 | 0.0% |
| English | 7,877 | 8.8% |
| European | 1,423 | 1.6% |
| Finnish | 12 | 0.0% |
| French | 3,342 | 3.7% |
| French American Indian | 162 | 0.2% |
| French Canadian | 357 | 0.4% |
| German | 7,463 | 8.4% |
| German Russian | 13 | 0.0% |
| Ghanaian | 42 | 0.1% |
| Greek | 153 | 0.2% |
| Guamanian / Chamorro | 59 | 0.1% |
| Guatemalan | 130 | 0.2% |
| Guyanese | 51 | 0.1% |
| Haitian | 207 | 0.2% |
| Honduran | 304 | 0.3% |
| Hungarian | 98 | 0.1% |
| Indian (Asian) | 539 | 0.6% |
| Iranian | 83 | 0.1% |
| Iraqi | 33 | 0.0% |
| Irish | 6,494 | 7.3% |
| Italian | 1,790 | 2.0% |
| Jamaican | 201 | 0.2% |
| Japanese | 54 | 0.1% |
| Kenyan | 215 | 0.2% |
| Korean | 1,402 | 1.6% |
| Latvian | 38 | 0.0% |
| Lebanese | 68 | 0.1% |
| Lithuanian | 7 | 0.0% |
| Luxembourger | 14 | 0.0% |
| Mexican | 20,875 | 23.4% |
| Mexican American Indian | 54 | 0.1% |
| Moroccan | 38 | 0.0% |
| Native Hawaiian | 142 | 0.2% |
| Nicaraguan | 119 | 0.1% |
| Nigerian | 110 | 0.1% |
| Northern European | 169 | 0.2% |
| Norwegian | 588 | 0.7% |
| Panamanian | 21 | 0.0% |
| Paraguayan | 8 | 0.0% |
| Peruvian | 245 | 0.3% |
| Polish | 1,112 | 1.3% |
| Portuguese | 33 | 0.0% |
| Pueblo | 6 | 0.0% |
| Puerto Rican | 1,486 | 1.7% |
| Romanian | 211 | 0.2% |
| Russian | 333 | 0.4% |
| Salvadoran | 1,059 | 1.2% |
| Scandinavian | 343 | 0.4% |
| Scotch-Irish | 442 | 0.5% |
| Scottish | 1,637 | 1.8% |
| Senegalese | 82 | 0.1% |
| Slavic | 9 | 0.0% |
| Slovak | 71 | 0.1% |
| Slovene | 94 | 0.1% |
| South African | 207 | 0.2% |
| South American | 1,761 | 2.0% |
| Spaniard | 604 | 0.7% |
| Spanish | 226 | 0.3% |
| Sri Lankan | 1,156 | 1.3% |
| Subsaharan African | 1,643 | 1.8% |
| Swedish | 323 | 0.4% |
| Swiss | 111 | 0.1% |
| Syrian | 94 | 0.1% |
| Thai | 301 | 0.3% |
| Ukrainian | 77 | 0.1% |
| Uruguayan | 92 | 0.1% |
| Venezuelan | 1,011 | 1.1% |
| Welsh | 524 | 0.6% |
| West Indian | 32 | 0.0% |
| Yugoslavian | 20 | 0.0% | View All 101 Rows |
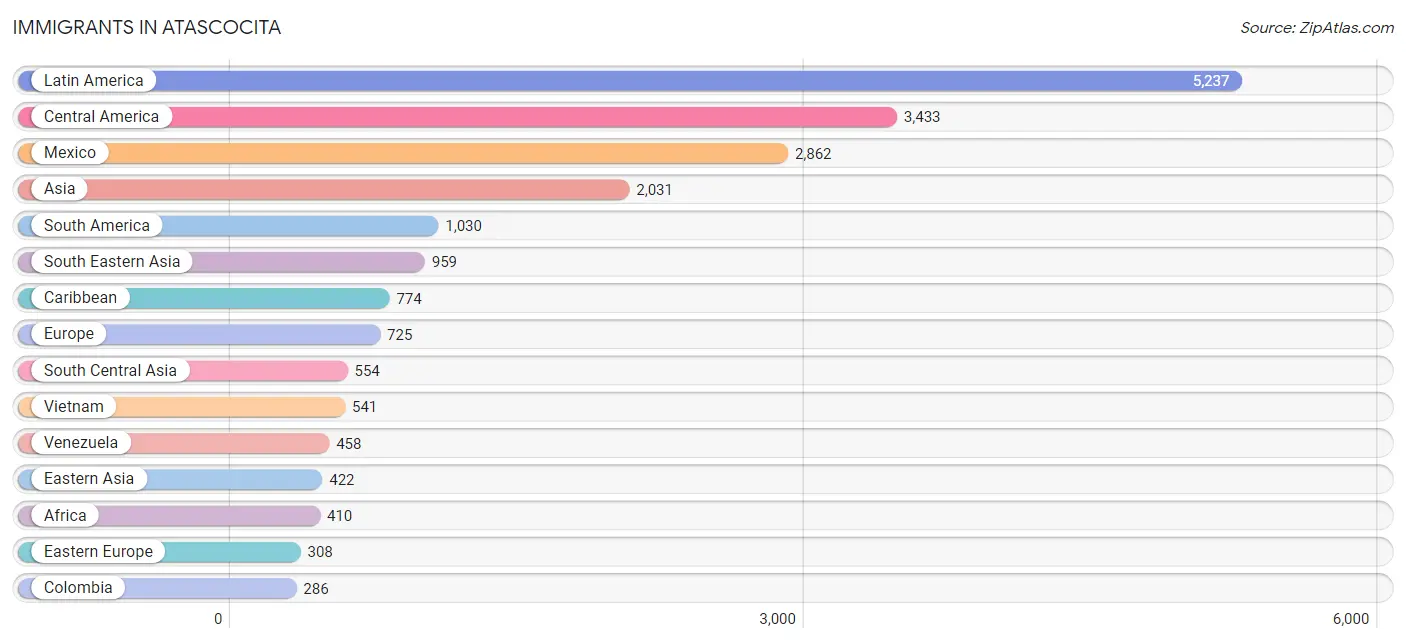
Immigrants in Atascocita
The most numerous immigrant groups reported in Atascocita came from Latin America (5,237 | 5.9%), Central America (3,433 | 3.8%), Mexico (2,862 | 3.2%), Asia (2,031 | 2.3%), and South America (1,030 | 1.2%), together accounting for 16.4% of all Atascocita residents.
| Immigration Origin | # Population | % Population |
| Africa | 410 | 0.5% |
| Argentina | 25 | 0.0% |
| Asia | 2,031 | 2.3% |
| Austria | 32 | 0.0% |
| Barbados | 8 | 0.0% |
| Brazil | 54 | 0.1% |
| Cambodia | 28 | 0.0% |
| Canada | 187 | 0.2% |
| Caribbean | 774 | 0.9% |
| Central America | 3,433 | 3.8% |
| Chile | 22 | 0.0% |
| China | 235 | 0.3% |
| Colombia | 286 | 0.3% |
| Cuba | 97 | 0.1% |
| Dominica | 52 | 0.1% |
| Dominican Republic | 39 | 0.0% |
| Eastern Africa | 272 | 0.3% |
| Eastern Asia | 422 | 0.5% |
| Eastern Europe | 308 | 0.4% |
| El Salvador | 184 | 0.2% |
| England | 16 | 0.0% |
| Ethiopia | 42 | 0.1% |
| Europe | 725 | 0.8% |
| Fiji | 29 | 0.0% |
| France | 18 | 0.0% |
| Germany | 154 | 0.2% |
| Ghana | 42 | 0.1% |
| Guatemala | 109 | 0.1% |
| Guyana | 33 | 0.0% |
| Haiti | 257 | 0.3% |
| Honduras | 180 | 0.2% |
| Hong Kong | 13 | 0.0% |
| India | 157 | 0.2% |
| Indonesia | 54 | 0.1% |
| Iran | 45 | 0.1% |
| Iraq | 33 | 0.0% |
| Ireland | 20 | 0.0% |
| Italy | 40 | 0.0% |
| Jamaica | 141 | 0.2% |
| Japan | 43 | 0.1% |
| Kazakhstan | 19 | 0.0% |
| Kenya | 210 | 0.2% |
| Korea | 144 | 0.2% |
| Latin America | 5,237 | 5.9% |
| Lebanon | 29 | 0.0% |
| Mexico | 2,862 | 3.2% |
| Morocco | 29 | 0.0% |
| Nepal | 74 | 0.1% |
| Netherlands | 58 | 0.1% |
| Nicaragua | 33 | 0.0% |
| Northern Africa | 29 | 0.0% |
| Northern Europe | 92 | 0.1% |
| Oceania | 29 | 0.0% |
| Pakistan | 222 | 0.3% |
| Panama | 65 | 0.1% |
| Peru | 144 | 0.2% |
| Philippines | 275 | 0.3% |
| Poland | 16 | 0.0% |
| Romania | 211 | 0.2% |
| Russia | 68 | 0.1% |
| Scotland | 30 | 0.0% |
| Singapore | 61 | 0.1% |
| South Africa | 67 | 0.1% |
| South America | 1,030 | 1.2% |
| South Central Asia | 554 | 0.6% |
| South Eastern Asia | 959 | 1.1% |
| Southern Europe | 40 | 0.0% |
| Sri Lanka | 37 | 0.0% |
| Switzerland | 23 | 0.0% |
| Taiwan | 80 | 0.1% |
| Trinidad and Tobago | 99 | 0.1% |
| Uganda | 20 | 0.0% |
| Ukraine | 13 | 0.0% |
| Venezuela | 458 | 0.5% |
| Vietnam | 541 | 0.6% |
| Western Africa | 42 | 0.1% |
| Western Asia | 96 | 0.1% |
| Western Europe | 285 | 0.3% | View All 78 Rows |
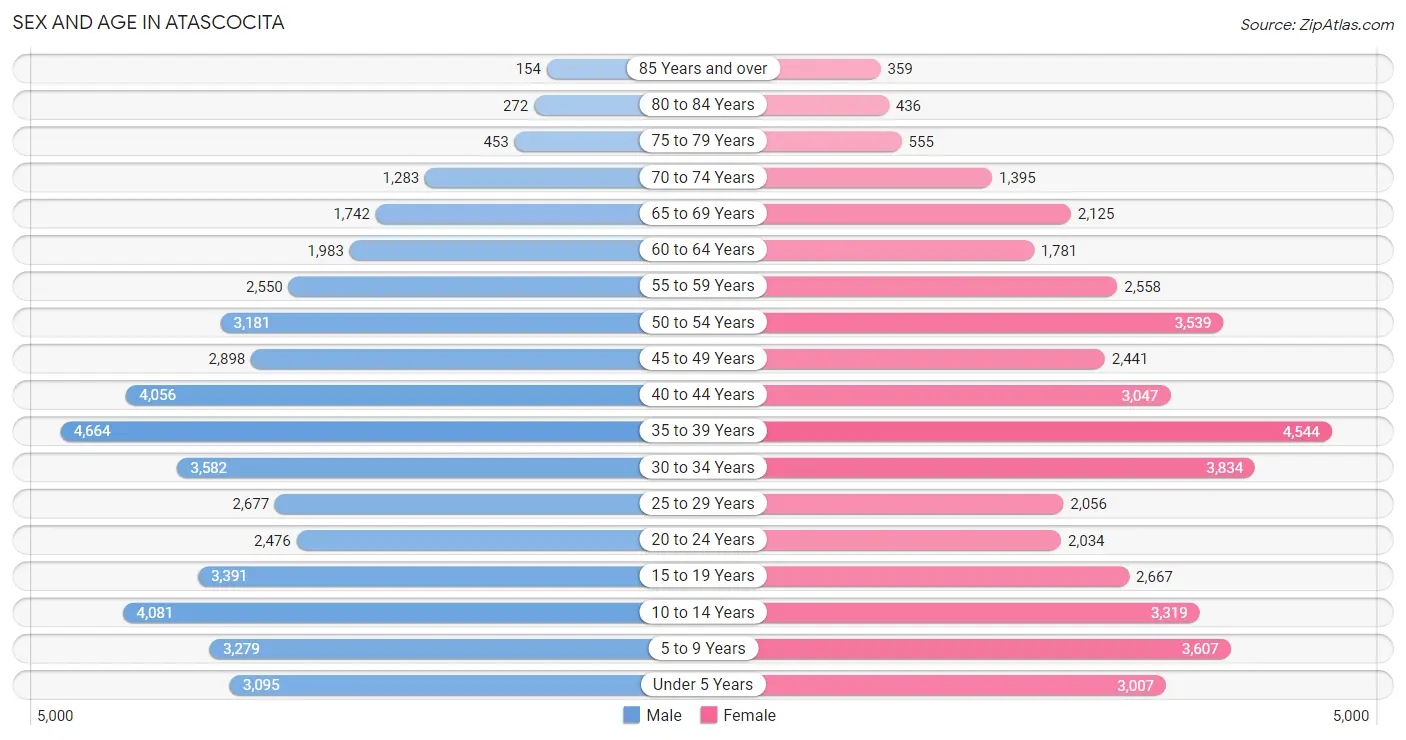
Sex and Age in Atascocita
Sex and Age in Atascocita
The most populous age groups in Atascocita are 35 to 39 Years (4,664 | 10.2%) for men and 35 to 39 Years (4,544 | 10.5%) for women.
| Age Bracket | Male | Female |
| Under 5 Years | 3,095 (6.8%) | 3,007 (6.9%) |
| 5 to 9 Years | 3,279 (7.2%) | 3,607 (8.3%) |
| 10 to 14 Years | 4,081 (8.9%) | 3,319 (7.7%) |
| 15 to 19 Years | 3,391 (7.4%) | 2,667 (6.2%) |
| 20 to 24 Years | 2,476 (5.4%) | 2,034 (4.7%) |
| 25 to 29 Years | 2,677 (5.8%) | 2,056 (4.8%) |
| 30 to 34 Years | 3,582 (7.8%) | 3,834 (8.8%) |
| 35 to 39 Years | 4,664 (10.2%) | 4,544 (10.5%) |
| 40 to 44 Years | 4,056 (8.8%) | 3,047 (7.0%) |
| 45 to 49 Years | 2,898 (6.3%) | 2,441 (5.6%) |
| 50 to 54 Years | 3,181 (6.9%) | 3,539 (8.2%) |
| 55 to 59 Years | 2,550 (5.6%) | 2,558 (5.9%) |
| 60 to 64 Years | 1,983 (4.3%) | 1,781 (4.1%) |
| 65 to 69 Years | 1,742 (3.8%) | 2,125 (4.9%) |
| 70 to 74 Years | 1,283 (2.8%) | 1,395 (3.2%) |
| 75 to 79 Years | 453 (1.0%) | 555 (1.3%) |
| 80 to 84 Years | 272 (0.6%) | 436 (1.0%) |
| 85 Years and over | 154 (0.3%) | 359 (0.8%) |
| Total | 45,817 (100.0%) | 43,304 (100.0%) |
Families and Households in Atascocita
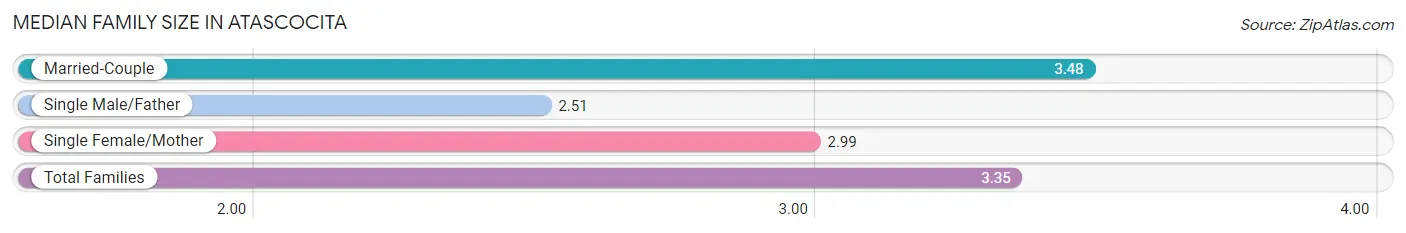
Median Family Size in Atascocita
The median family size in Atascocita is 3.35 persons per family, with married-couple families (18,237 | 79.8%) accounting for the largest median family size of 3.48 persons per family. On the other hand, single male/father families (1,464 | 6.4%) represent the smallest median family size with 2.51 persons per family.
| Family Type | # Families | Family Size |
| Married-Couple | 18,237 (79.8%) | 3.48 |
| Single Male/Father | 1,464 (6.4%) | 2.51 |
| Single Female/Mother | 3,160 (13.8%) | 2.99 |
| Total Families | 22,861 (100.0%) | 3.35 |
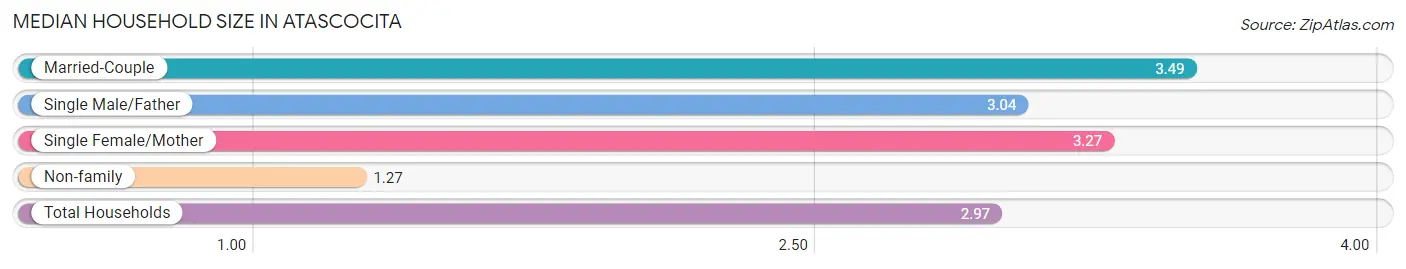
Median Household Size in Atascocita
The median household size in Atascocita is 2.97 persons per household, with married-couple households (18,237 | 62.7%) accounting for the largest median household size of 3.49 persons per household. non-family households (6,228 | 21.4%) represent the smallest median household size with 1.27 persons per household.
| Household Type | # Households | Household Size |
| Married-Couple | 18,237 (62.7%) | 3.49 |
| Single Male/Father | 1,464 (5.0%) | 3.04 |
| Single Female/Mother | 3,160 (10.9%) | 3.27 |
| Non-family | 6,228 (21.4%) | 1.27 |
| Total Households | 29,089 (100.0%) | 2.97 |
Household Size by Marriage Status in Atascocita
Out of a total of 29,089 households in Atascocita, 22,861 (78.6%) are family households, while 6,228 (21.4%) are nonfamily households. The most numerous type of family households are 2-person households, comprising 7,637, and the most common type of nonfamily households are 1-person households, comprising 5,025.
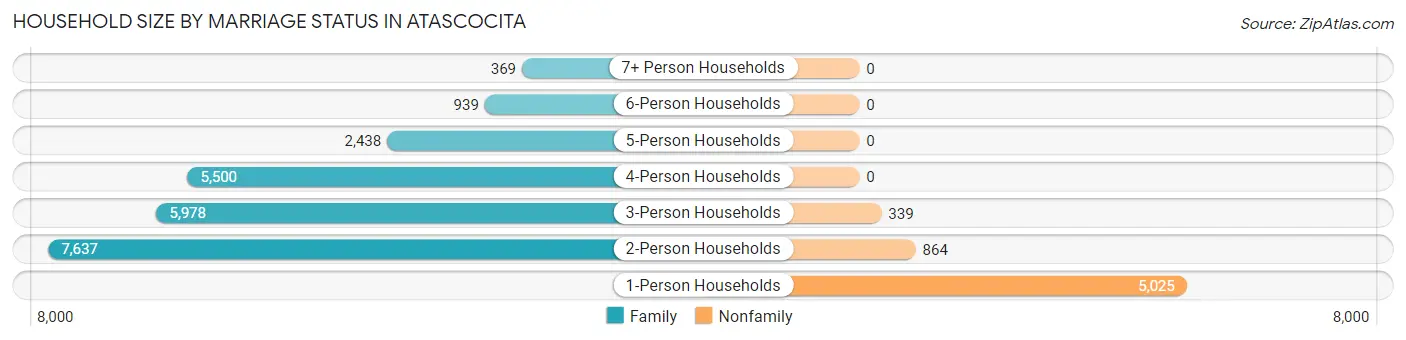
| Household Size | Family Households | Nonfamily Households |
| 1-Person Households | - | 5,025 (17.3%) |
| 2-Person Households | 7,637 (26.3%) | 864 (3.0%) |
| 3-Person Households | 5,978 (20.5%) | 339 (1.2%) |
| 4-Person Households | 5,500 (18.9%) | 0 (0.0%) |
| 5-Person Households | 2,438 (8.4%) | 0 (0.0%) |
| 6-Person Households | 939 (3.2%) | 0 (0.0%) |
| 7+ Person Households | 369 (1.3%) | 0 (0.0%) |
| Total | 22,861 (78.6%) | 6,228 (21.4%) |
Female Fertility in Atascocita
Fertility by Age in Atascocita
Average fertility rate in Atascocita is 47.0 births per 1,000 women. Women in the age bracket of 20 to 34 years have the highest fertility rate with 83.0 births per 1,000 women. Women in the age bracket of 20 to 34 years acount for 64.2% of all women with births.
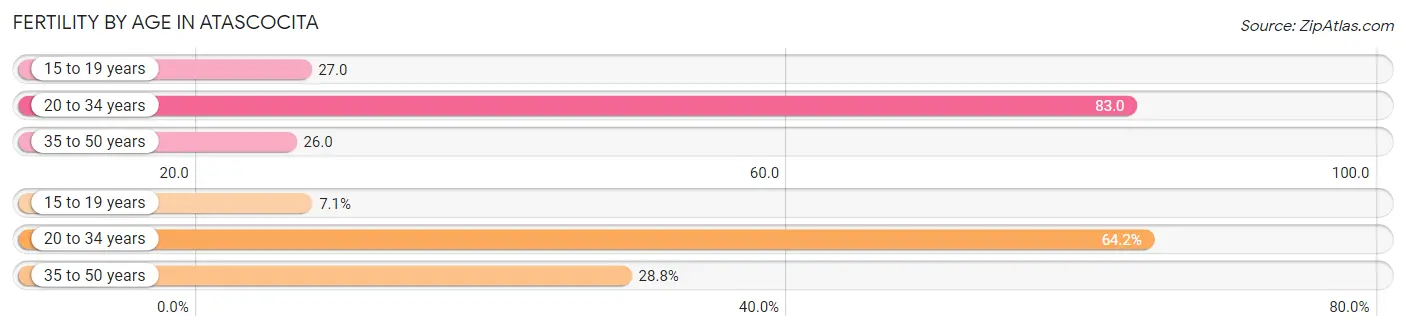
| Age Bracket | Women with Births | Births / 1,000 Women |
| 15 to 19 years | 72 (7.1%) | 27.0 |
| 20 to 34 years | 654 (64.2%) | 83.0 |
| 35 to 50 years | 293 (28.7%) | 26.0 |
| Total | 1,019 (100.0%) | 47.0 |
Fertility by Age by Marriage Status in Atascocita
62.0% of women with births (1,019) in Atascocita are married. The highest percentage of unmarried women with births falls into 15 to 19 years age bracket with 100.0% of them unmarried at the time of birth, while the lowest percentage of unmarried women with births belong to 35 to 50 years age bracket with 28.7% of them unmarried.
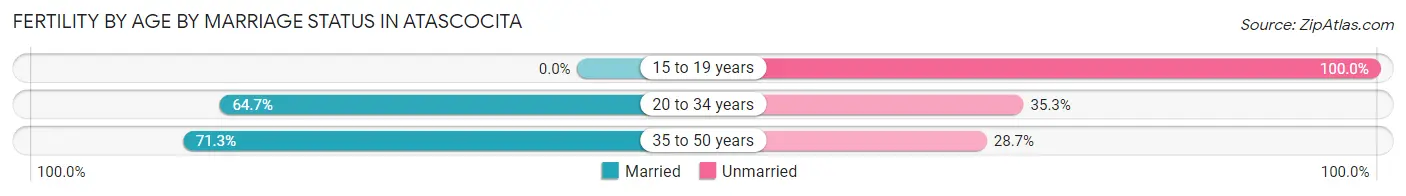
| Age Bracket | Married | Unmarried |
| 15 to 19 years | 0 (0.0%) | 72 (100.0%) |
| 20 to 34 years | 423 (64.7%) | 231 (35.3%) |
| 35 to 50 years | 209 (71.3%) | 84 (28.7%) |
| Total | 632 (62.0%) | 387 (38.0%) |
Fertility by Education in Atascocita
Average fertility rate in Atascocita is 47.0 births per 1,000 women. Women with the education attainment of bachelor's degree have the highest fertility rate of 67.0 births per 1,000 women, while women with the education attainment of less than high school have the lowest fertility at 15.0 births per 1,000 women. Women with the education attainment of bachelor's degree represent 38.4% of all women with births.
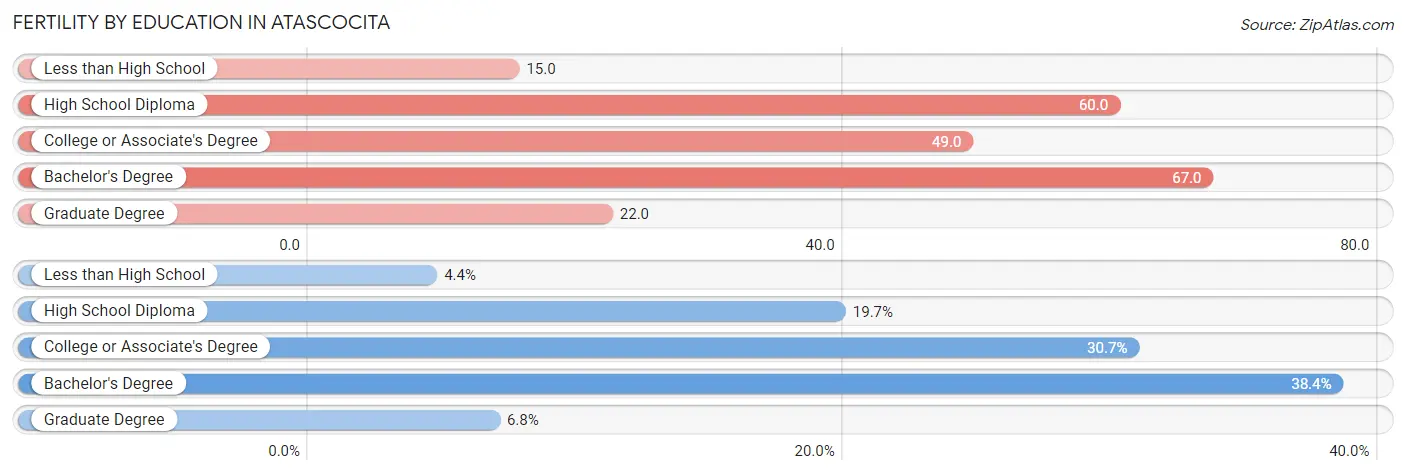
| Educational Attainment | Women with Births | Births / 1,000 Women |
| Less than High School | 45 (4.4%) | 15.0 |
| High School Diploma | 201 (19.7%) | 60.0 |
| College or Associate's Degree | 313 (30.7%) | 49.0 |
| Bachelor's Degree | 391 (38.4%) | 67.0 |
| Graduate Degree | 69 (6.8%) | 22.0 |
| Total | 1,019 (100.0%) | 47.0 |
Fertility by Education by Marriage Status in Atascocita
38.0% of women with births in Atascocita are unmarried. Women with the educational attainment of graduate degree are most likely to be married with 85.5% of them married at childbirth, while women with the educational attainment of high school diploma are least likely to be married with 59.7% of them unmarried at childbirth.
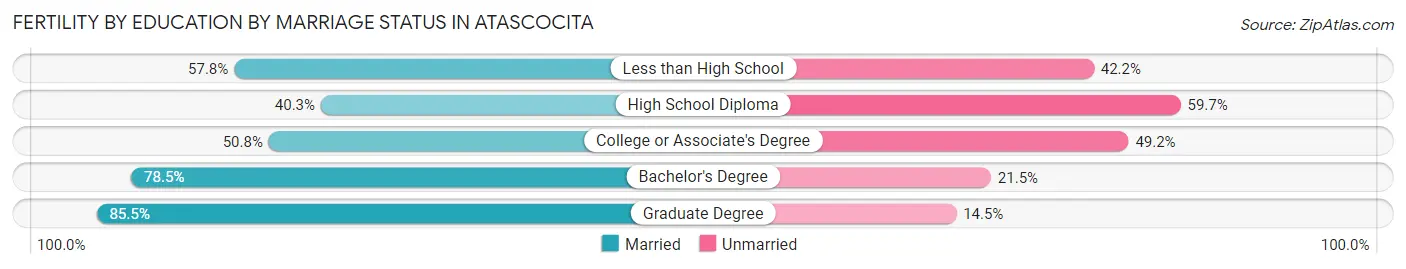
| Educational Attainment | Married | Unmarried |
| Less than High School | 26 (57.8%) | 19 (42.2%) |
| High School Diploma | 81 (40.3%) | 120 (59.7%) |
| College or Associate's Degree | 159 (50.8%) | 154 (49.2%) |
| Bachelor's Degree | 307 (78.5%) | 84 (21.5%) |
| Graduate Degree | 59 (85.5%) | 10 (14.5%) |
| Total | 632 (62.0%) | 387 (38.0%) |
Employment Characteristics in Atascocita
Employment by Class of Employer in Atascocita
Among the 44,111 employed individuals in Atascocita, private company employees (29,547 | 67.0%), local government employees (5,170 | 11.7%), and not-for-profit organizations (3,019 | 6.8%) make up the most common classes of employment.
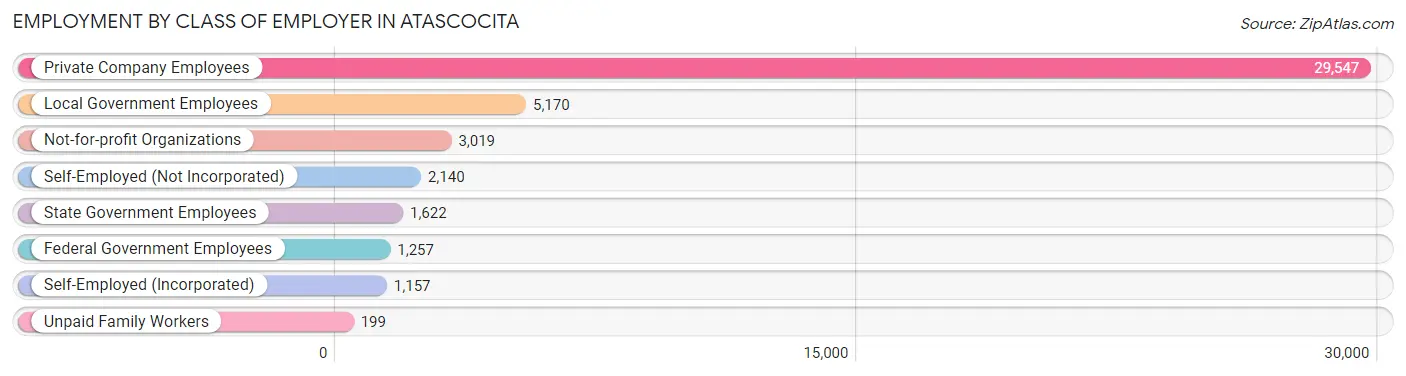
| Employer Class | # Employees | % Employees |
| Private Company Employees | 29,547 | 67.0% |
| Self-Employed (Incorporated) | 1,157 | 2.6% |
| Self-Employed (Not Incorporated) | 2,140 | 4.9% |
| Not-for-profit Organizations | 3,019 | 6.8% |
| Local Government Employees | 5,170 | 11.7% |
| State Government Employees | 1,622 | 3.7% |
| Federal Government Employees | 1,257 | 2.9% |
| Unpaid Family Workers | 199 | 0.4% |
| Total | 44,111 | 100.0% |
Employment Status by Age in Atascocita
According to the labor force statistics for Atascocita, out of the total population over 16 years of age (67,481), 69.8% or 47,102 individuals are in the labor force, with 5.0% or 2,355 of them unemployed. The age group with the highest labor force participation rate is 25 to 29 years, with 84.8% or 4,014 individuals in the labor force. Within the labor force, the 16 to 19 years age range has the highest percentage of unemployed individuals, with 14.0% or 220 of them being unemployed.
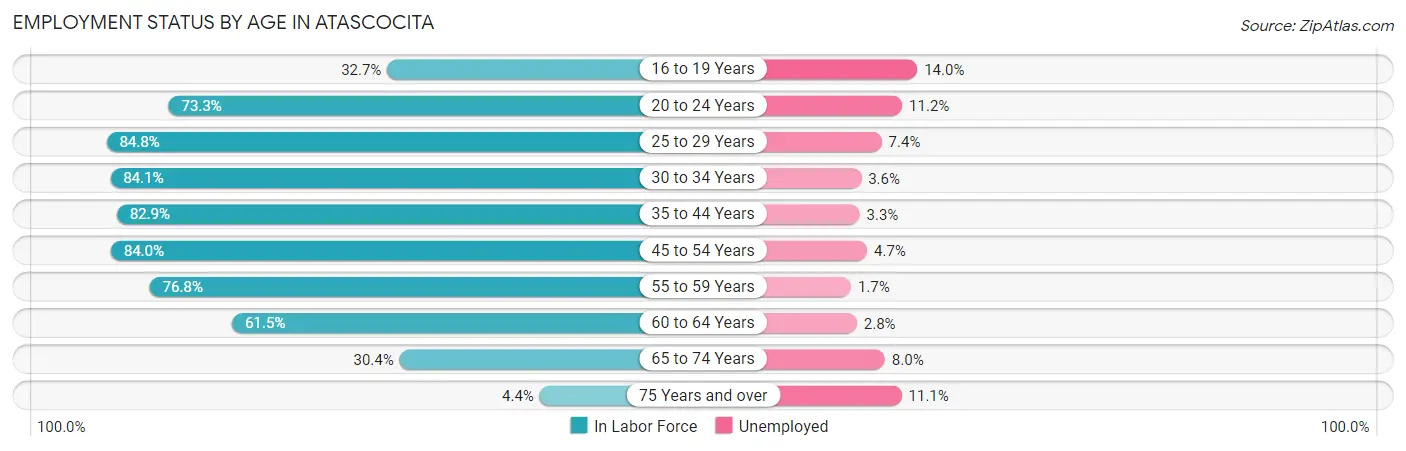
| Age Bracket | In Labor Force | Unemployed |
| 16 to 19 Years | 1,572 (32.7%) | 220 (14.0%) |
| 20 to 24 Years | 3,306 (73.3%) | 370 (11.2%) |
| 25 to 29 Years | 4,014 (84.8%) | 297 (7.4%) |
| 30 to 34 Years | 6,237 (84.1%) | 225 (3.6%) |
| 35 to 44 Years | 13,522 (82.9%) | 446 (3.3%) |
| 45 to 54 Years | 10,130 (84.0%) | 476 (4.7%) |
| 55 to 59 Years | 3,923 (76.8%) | 67 (1.7%) |
| 60 to 64 Years | 2,315 (61.5%) | 65 (2.8%) |
| 65 to 74 Years | 1,990 (30.4%) | 159 (8.0%) |
| 75 Years and over | 98 (4.4%) | 11 (11.1%) |
| Total | 47,102 (69.8%) | 2,355 (5.0%) |
Employment Status by Educational Attainment in Atascocita
According to labor force statistics for Atascocita, 81.3% of individuals (40,155) out of the total population between 25 and 64 years of age (49,391) are in the labor force, with 3.9% or 1,566 of them being unemployed. The group with the highest labor force participation rate are those with the educational attainment of bachelor's degree or higher, with 91.8% or 18,465 individuals in the labor force. Within the labor force, individuals with college / associate degree education have the highest percentage of unemployment, with 6.6% or 846 of them being unemployed.
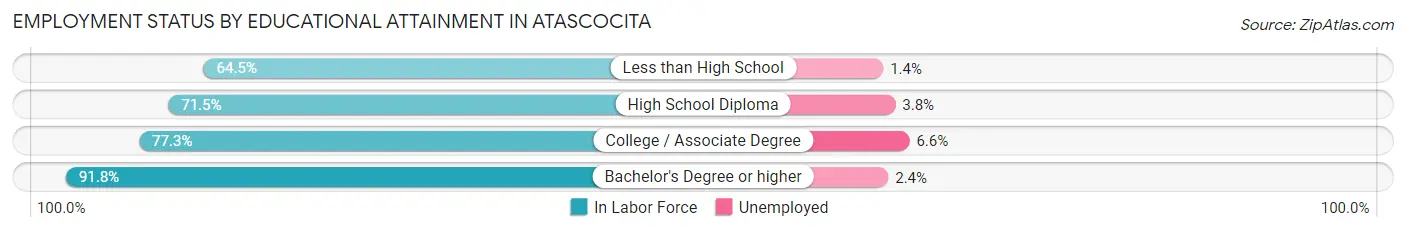
| Educational Attainment | In Labor Force | Unemployed |
| Less than High School | 2,018 (64.5%) | 44 (1.4%) |
| High School Diploma | 6,840 (71.5%) | 364 (3.8%) |
| College / Associate Degree | 12,818 (77.3%) | 1,094 (6.6%) |
| Bachelor's Degree or higher | 18,465 (91.8%) | 483 (2.4%) |
| Total | 40,155 (81.3%) | 1,926 (3.9%) |
Employment Occupations by Sex in Atascocita
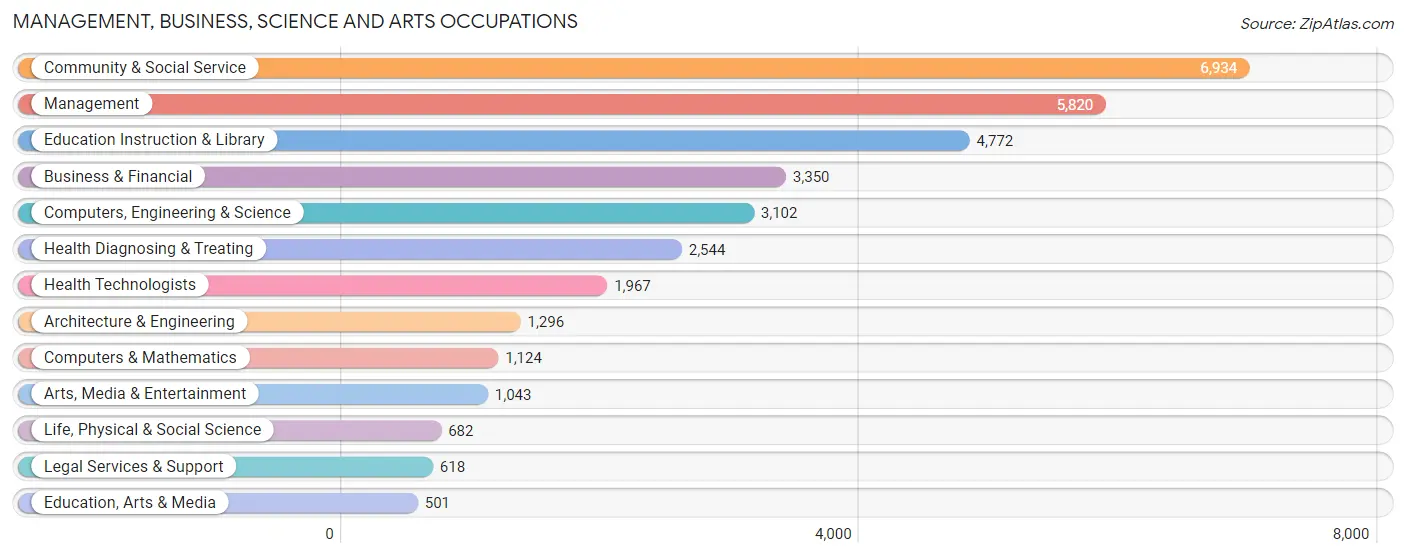
Management, Business, Science and Arts Occupations
The most common Management, Business, Science and Arts occupations in Atascocita are Community & Social Service (6,934 | 15.5%), Management (5,820 | 13.0%), Education Instruction & Library (4,772 | 10.7%), Business & Financial (3,350 | 7.5%), and Computers, Engineering & Science (3,102 | 6.9%).
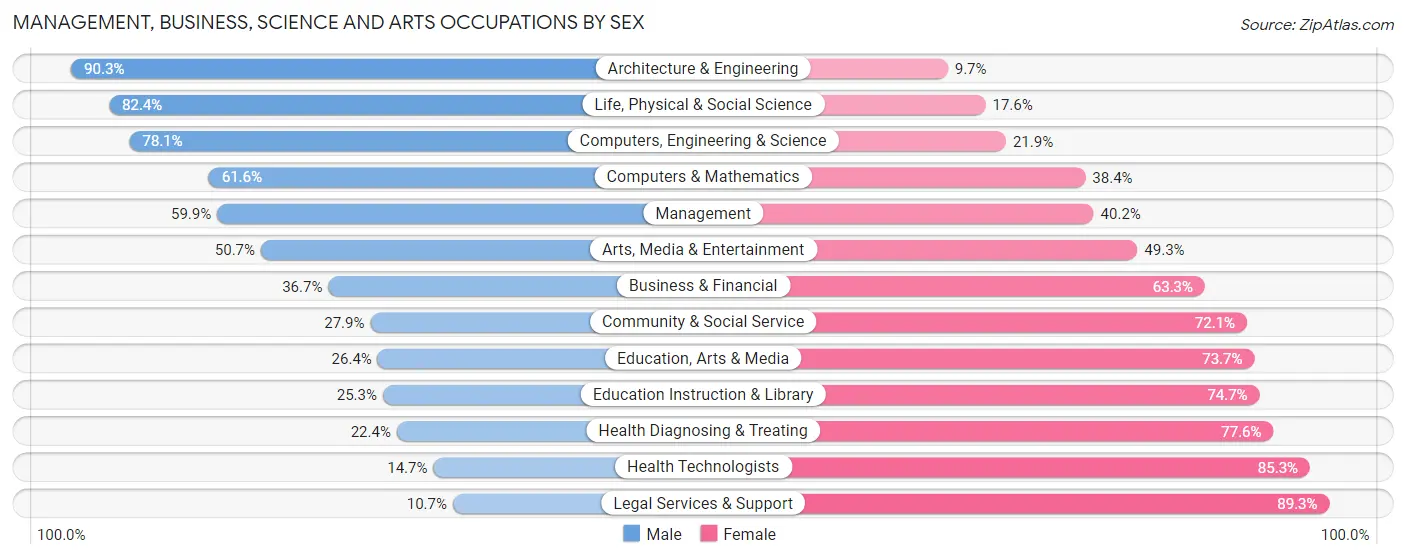
Management, Business, Science and Arts Occupations by Sex
Within the Management, Business, Science and Arts occupations in Atascocita, the most male-oriented occupations are Architecture & Engineering (90.3%), Life, Physical & Social Science (82.4%), and Computers, Engineering & Science (78.1%), while the most female-oriented occupations are Legal Services & Support (89.3%), Health Technologists (85.3%), and Health Diagnosing & Treating (77.6%).
| Occupation | Male | Female |
| Management | 3,483 (59.9%) | 2,337 (40.2%) |
| Business & Financial | 1,228 (36.7%) | 2,122 (63.3%) |
| Computers, Engineering & Science | 2,424 (78.1%) | 678 (21.9%) |
| Computers & Mathematics | 692 (61.6%) | 432 (38.4%) |
| Architecture & Engineering | 1,170 (90.3%) | 126 (9.7%) |
| Life, Physical & Social Science | 562 (82.4%) | 120 (17.6%) |
| Community & Social Service | 1,933 (27.9%) | 5,001 (72.1%) |
| Education, Arts & Media | 132 (26.4%) | 369 (73.7%) |
| Legal Services & Support | 66 (10.7%) | 552 (89.3%) |
| Education Instruction & Library | 1,206 (25.3%) | 3,566 (74.7%) |
| Arts, Media & Entertainment | 529 (50.7%) | 514 (49.3%) |
| Health Diagnosing & Treating | 569 (22.4%) | 1,975 (77.6%) |
| Health Technologists | 290 (14.7%) | 1,677 (85.3%) |
| Total (Category) | 9,637 (44.3%) | 12,113 (55.7%) |
| Total (Overall) | 24,243 (54.2%) | 20,488 (45.8%) |
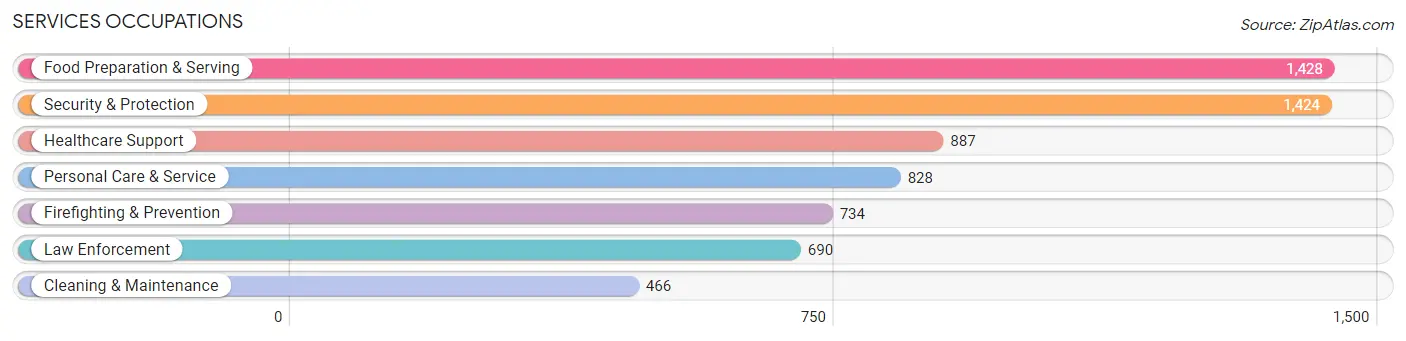
Services Occupations
The most common Services occupations in Atascocita are Food Preparation & Serving (1,428 | 3.2%), Security & Protection (1,424 | 3.2%), Healthcare Support (887 | 2.0%), Personal Care & Service (828 | 1.8%), and Firefighting & Prevention (734 | 1.6%).
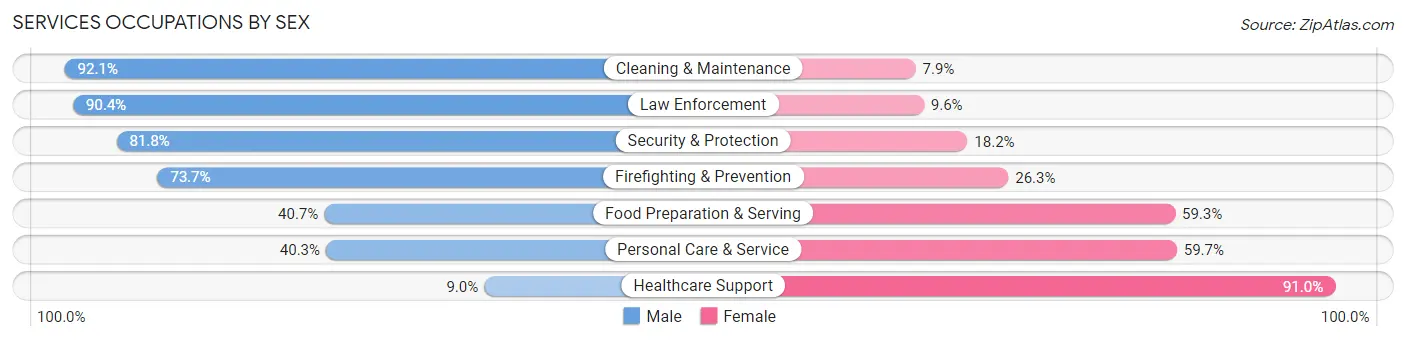
Services Occupations by Sex
Within the Services occupations in Atascocita, the most male-oriented occupations are Cleaning & Maintenance (92.1%), Law Enforcement (90.4%), and Security & Protection (81.8%), while the most female-oriented occupations are Healthcare Support (91.0%), Personal Care & Service (59.7%), and Food Preparation & Serving (59.3%).
| Occupation | Male | Female |
| Healthcare Support | 80 (9.0%) | 807 (91.0%) |
| Security & Protection | 1,165 (81.8%) | 259 (18.2%) |
| Firefighting & Prevention | 541 (73.7%) | 193 (26.3%) |
| Law Enforcement | 624 (90.4%) | 66 (9.6%) |
| Food Preparation & Serving | 581 (40.7%) | 847 (59.3%) |
| Cleaning & Maintenance | 429 (92.1%) | 37 (7.9%) |
| Personal Care & Service | 334 (40.3%) | 494 (59.7%) |
| Total (Category) | 2,589 (51.4%) | 2,444 (48.6%) |
| Total (Overall) | 24,243 (54.2%) | 20,488 (45.8%) |
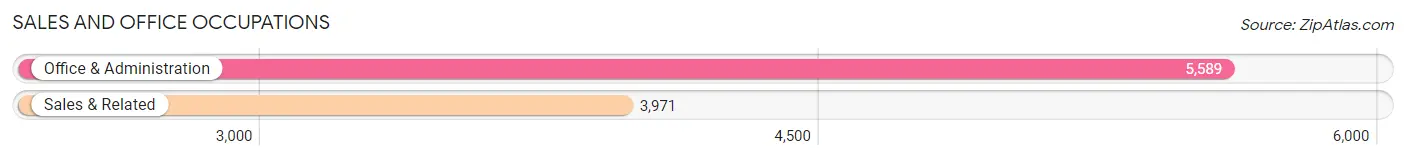
Sales and Office Occupations
The most common Sales and Office occupations in Atascocita are Office & Administration (5,589 | 12.5%), and Sales & Related (3,971 | 8.9%).
Sales and Office Occupations by Sex
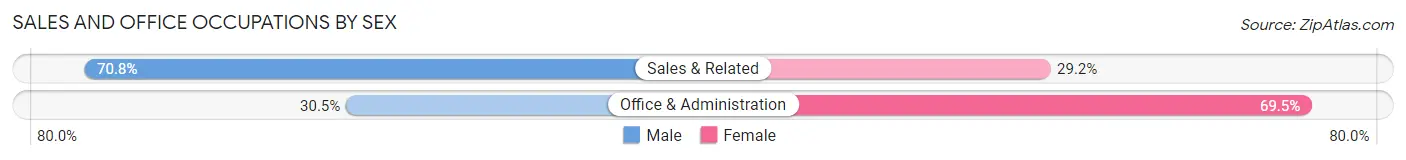
| Occupation | Male | Female |
| Sales & Related | 2,813 (70.8%) | 1,158 (29.2%) |
| Office & Administration | 1,707 (30.5%) | 3,882 (69.5%) |
| Total (Category) | 4,520 (47.3%) | 5,040 (52.7%) |
| Total (Overall) | 24,243 (54.2%) | 20,488 (45.8%) |
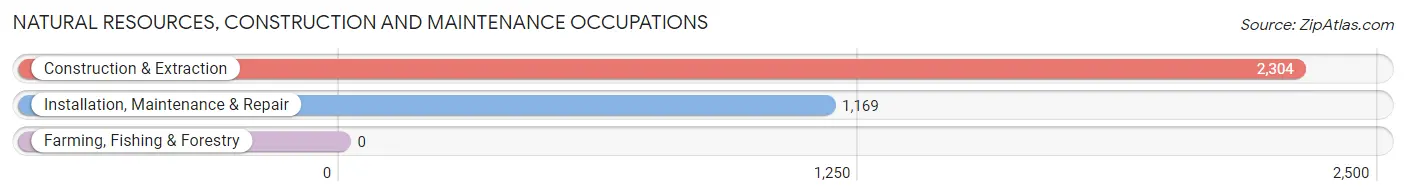
Natural Resources, Construction and Maintenance Occupations
The most common Natural Resources, Construction and Maintenance occupations in Atascocita are Construction & Extraction (2,304 | 5.1%), and Installation, Maintenance & Repair (1,169 | 2.6%).
Natural Resources, Construction and Maintenance Occupations by Sex
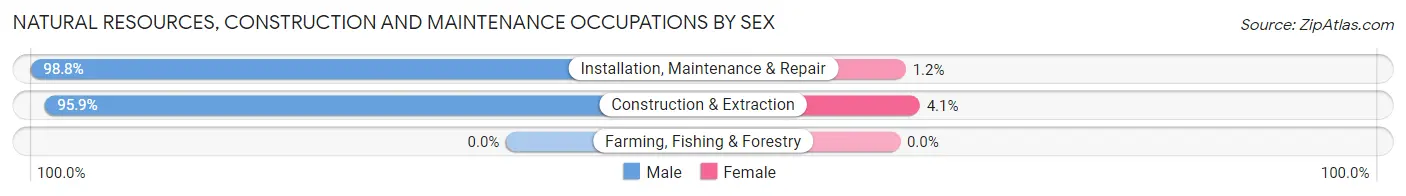
| Occupation | Male | Female |
| Farming, Fishing & Forestry | 0 (0.0%) | 0 (0.0%) |
| Construction & Extraction | 2,209 (95.9%) | 95 (4.1%) |
| Installation, Maintenance & Repair | 1,155 (98.8%) | 14 (1.2%) |
| Total (Category) | 3,364 (96.9%) | 109 (3.1%) |
| Total (Overall) | 24,243 (54.2%) | 20,488 (45.8%) |
Production, Transportation and Moving Occupations
The most common Production, Transportation and Moving occupations in Atascocita are Transportation (2,189 | 4.9%), Production (1,744 | 3.9%), and Material Moving (982 | 2.2%).
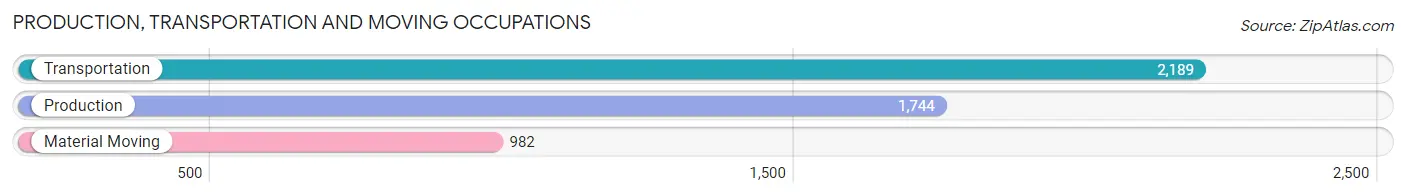
Production, Transportation and Moving Occupations by Sex
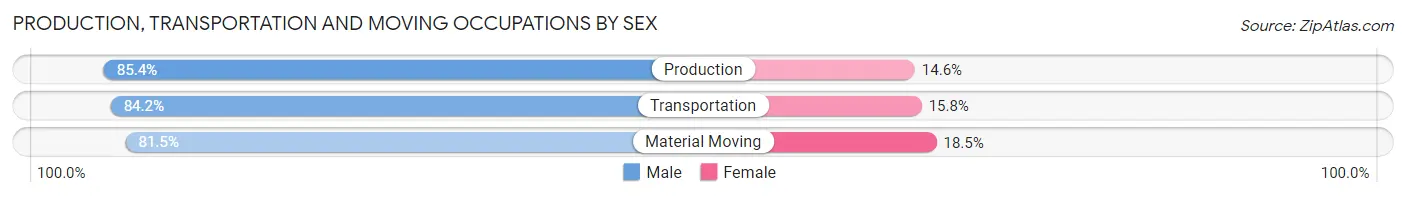
| Occupation | Male | Female |
| Production | 1,490 (85.4%) | 254 (14.6%) |
| Transportation | 1,843 (84.2%) | 346 (15.8%) |
| Material Moving | 800 (81.5%) | 182 (18.5%) |
| Total (Category) | 4,133 (84.1%) | 782 (15.9%) |
| Total (Overall) | 24,243 (54.2%) | 20,488 (45.8%) |
Employment Industries by Sex in Atascocita
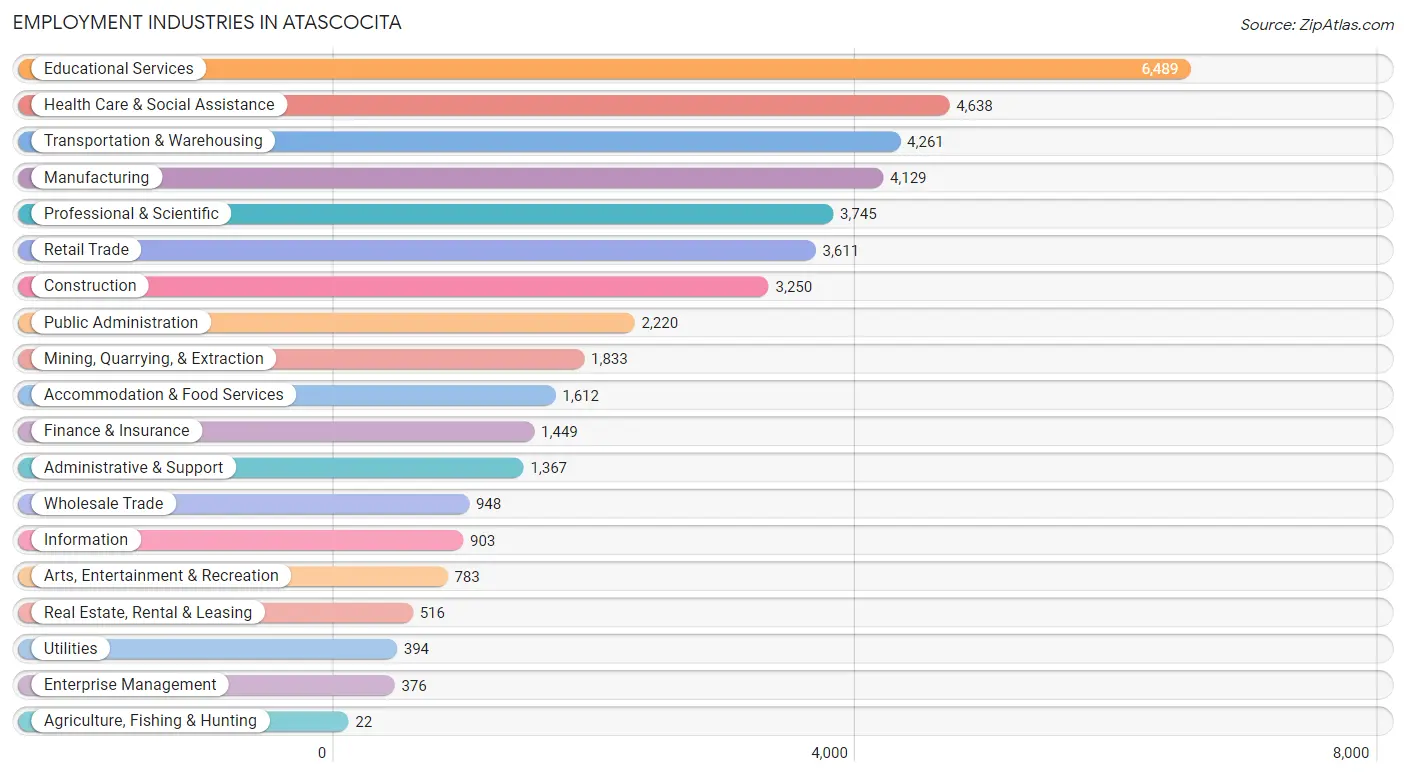
Employment Industries in Atascocita
The major employment industries in Atascocita include Educational Services (6,489 | 14.5%), Health Care & Social Assistance (4,638 | 10.4%), Transportation & Warehousing (4,261 | 9.5%), Manufacturing (4,129 | 9.2%), and Professional & Scientific (3,745 | 8.4%).
Employment Industries by Sex in Atascocita
The Atascocita industries that see more men than women are Agriculture, Fishing & Hunting (100.0%), Utilities (90.4%), and Construction (88.9%), whereas the industries that tend to have a higher number of women are Health Care & Social Assistance (78.3%), Educational Services (77.1%), and Finance & Insurance (72.5%).
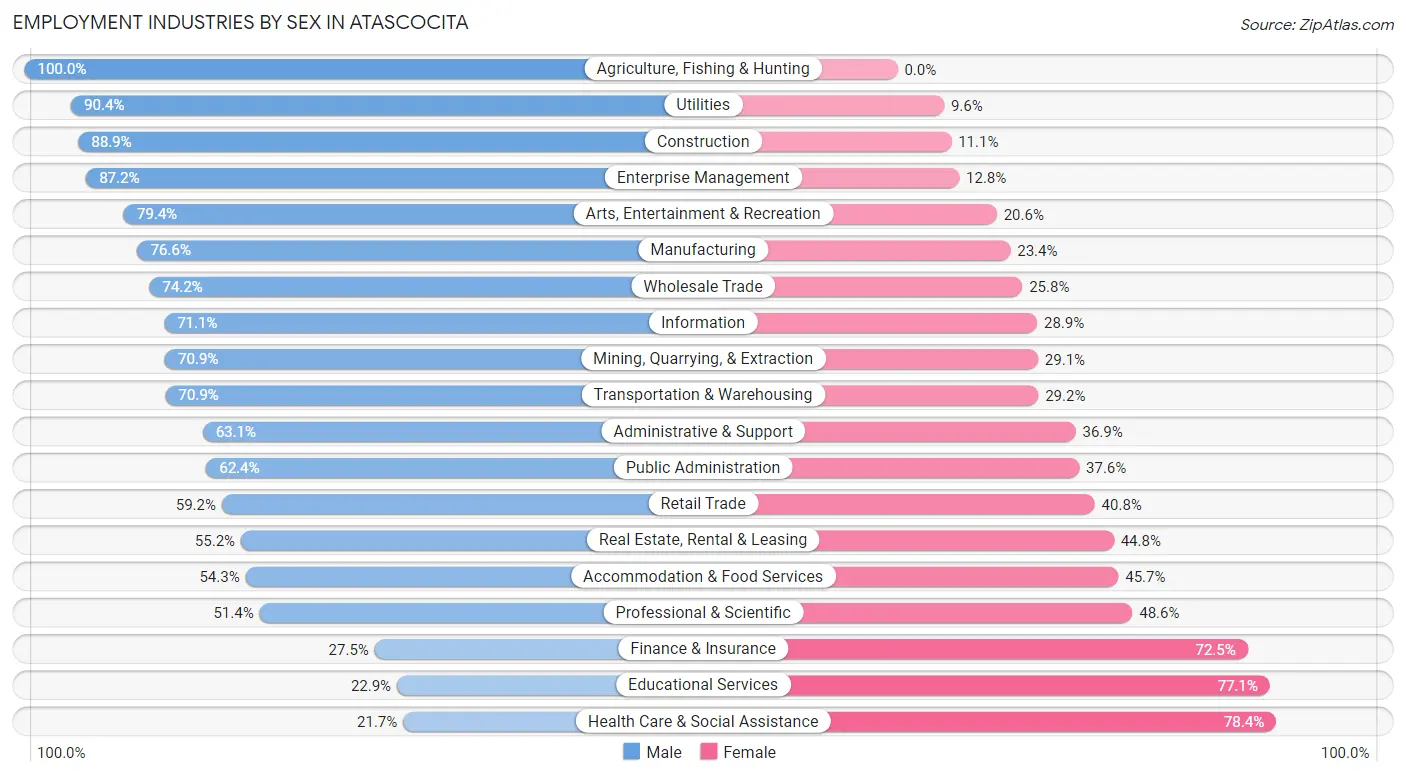
| Industry | Male | Female |
| Agriculture, Fishing & Hunting | 22 (100.0%) | 0 (0.0%) |
| Mining, Quarrying, & Extraction | 1,300 (70.9%) | 533 (29.1%) |
| Construction | 2,888 (88.9%) | 362 (11.1%) |
| Manufacturing | 3,164 (76.6%) | 965 (23.4%) |
| Wholesale Trade | 703 (74.2%) | 245 (25.8%) |
| Retail Trade | 2,137 (59.2%) | 1,474 (40.8%) |
| Transportation & Warehousing | 3,019 (70.9%) | 1,242 (29.1%) |
| Utilities | 356 (90.4%) | 38 (9.6%) |
| Information | 642 (71.1%) | 261 (28.9%) |
| Finance & Insurance | 399 (27.5%) | 1,050 (72.5%) |
| Real Estate, Rental & Leasing | 285 (55.2%) | 231 (44.8%) |
| Professional & Scientific | 1,924 (51.4%) | 1,821 (48.6%) |
| Enterprise Management | 328 (87.2%) | 48 (12.8%) |
| Administrative & Support | 863 (63.1%) | 504 (36.9%) |
| Educational Services | 1,488 (22.9%) | 5,001 (77.1%) |
| Health Care & Social Assistance | 1,004 (21.6%) | 3,634 (78.3%) |
| Arts, Entertainment & Recreation | 622 (79.4%) | 161 (20.6%) |
| Accommodation & Food Services | 875 (54.3%) | 737 (45.7%) |
| Public Administration | 1,385 (62.4%) | 835 (37.6%) |
| Total | 24,243 (54.2%) | 20,488 (45.8%) |
Education in Atascocita
School Enrollment in Atascocita
The most common levels of schooling among the 25,747 students in Atascocita are middle school (6,293 | 24.4%), high school (5,848 | 22.7%), and elementary school (5,739 | 22.3%).
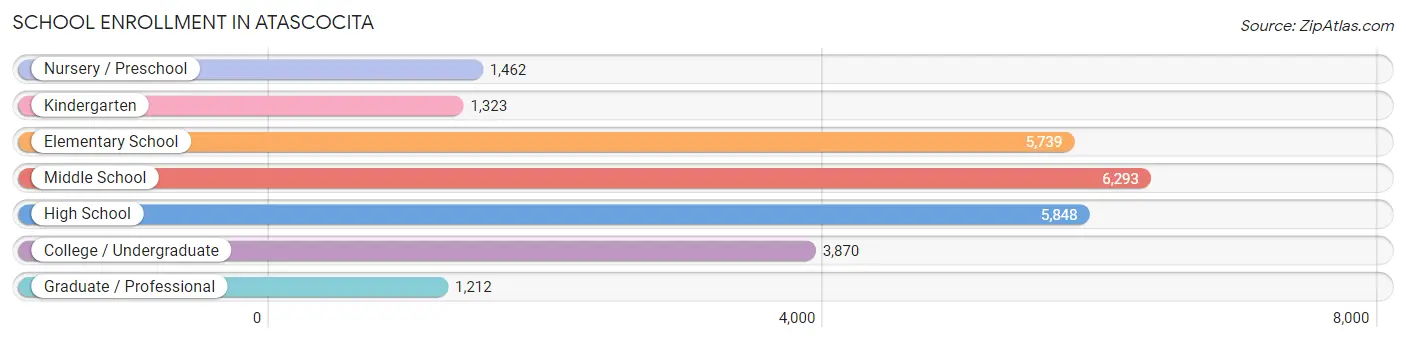
| School Level | # Students | % Students |
| Nursery / Preschool | 1,462 | 5.7% |
| Kindergarten | 1,323 | 5.1% |
| Elementary School | 5,739 | 22.3% |
| Middle School | 6,293 | 24.4% |
| High School | 5,848 | 22.7% |
| College / Undergraduate | 3,870 | 15.0% |
| Graduate / Professional | 1,212 | 4.7% |
| Total | 25,747 | 100.0% |
School Enrollment by Age by Funding Source in Atascocita
Out of a total of 25,747 students who are enrolled in schools in Atascocita, 2,678 (10.4%) attend a private institution, while the remaining 23,069 (89.6%) are enrolled in public schools. The age group of 3 to 4 year olds has the highest likelihood of being enrolled in private schools, with 639 (43.6% in the age bracket) enrolled. Conversely, the age group of 15 to 17 year olds has the lowest likelihood of being enrolled in a private school, with 4,123 (98.4% in the age bracket) attending a public institution.
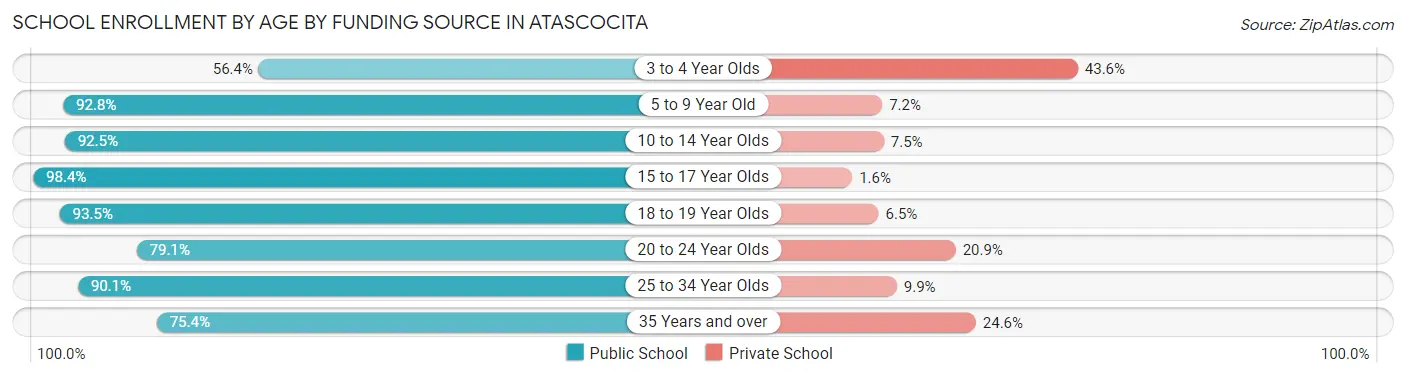
| Age Bracket | Public School | Private School |
| 3 to 4 Year Olds | 826 (56.4%) | 639 (43.6%) |
| 5 to 9 Year Old | 6,080 (92.8%) | 470 (7.2%) |
| 10 to 14 Year Olds | 6,836 (92.5%) | 553 (7.5%) |
| 15 to 17 Year Olds | 4,123 (98.4%) | 67 (1.6%) |
| 18 to 19 Year Olds | 1,349 (93.5%) | 94 (6.5%) |
| 20 to 24 Year Olds | 1,335 (79.1%) | 352 (20.9%) |
| 25 to 34 Year Olds | 1,472 (90.1%) | 162 (9.9%) |
| 35 Years and over | 1,047 (75.4%) | 342 (24.6%) |
| Total | 23,069 (89.6%) | 2,678 (10.4%) |
Educational Attainment by Field of Study in Atascocita
Business (6,921 | 28.5%), education (2,415 | 10.0%), engineering (2,325 | 9.6%), arts & humanities (2,039 | 8.4%), and science & technology (1,728 | 7.1%) are the most common fields of study among 24,268 individuals in Atascocita who have obtained a bachelor's degree or higher.
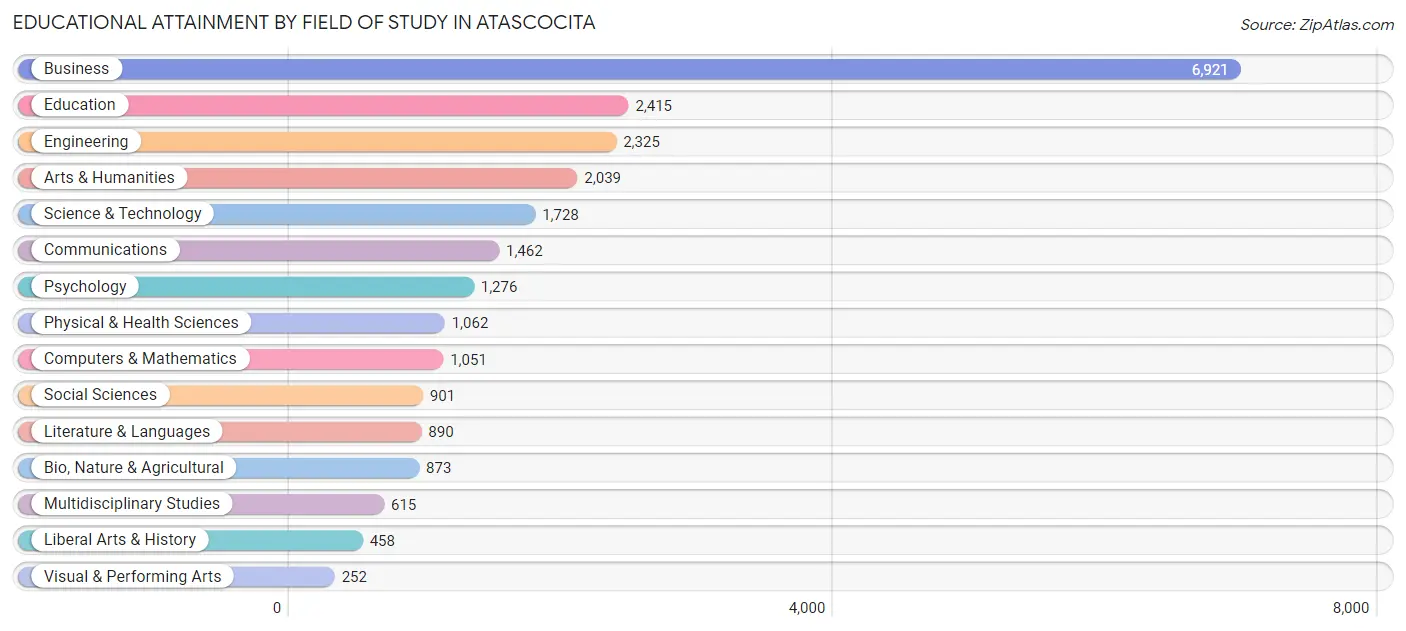
| Field of Study | # Graduates | % Graduates |
| Computers & Mathematics | 1,051 | 4.3% |
| Bio, Nature & Agricultural | 873 | 3.6% |
| Physical & Health Sciences | 1,062 | 4.4% |
| Psychology | 1,276 | 5.3% |
| Social Sciences | 901 | 3.7% |
| Engineering | 2,325 | 9.6% |
| Multidisciplinary Studies | 615 | 2.5% |
| Science & Technology | 1,728 | 7.1% |
| Business | 6,921 | 28.5% |
| Education | 2,415 | 10.0% |
| Literature & Languages | 890 | 3.7% |
| Liberal Arts & History | 458 | 1.9% |
| Visual & Performing Arts | 252 | 1.0% |
| Communications | 1,462 | 6.0% |
| Arts & Humanities | 2,039 | 8.4% |
| Total | 24,268 | 100.0% |
Transportation & Commute in Atascocita
Vehicle Availability by Sex in Atascocita
The most prevalent vehicle ownership categories in Atascocita are males with 2 vehicles (12,002, accounting for 50.0%) and females with 2 vehicles (9,604, making up 59.8%).
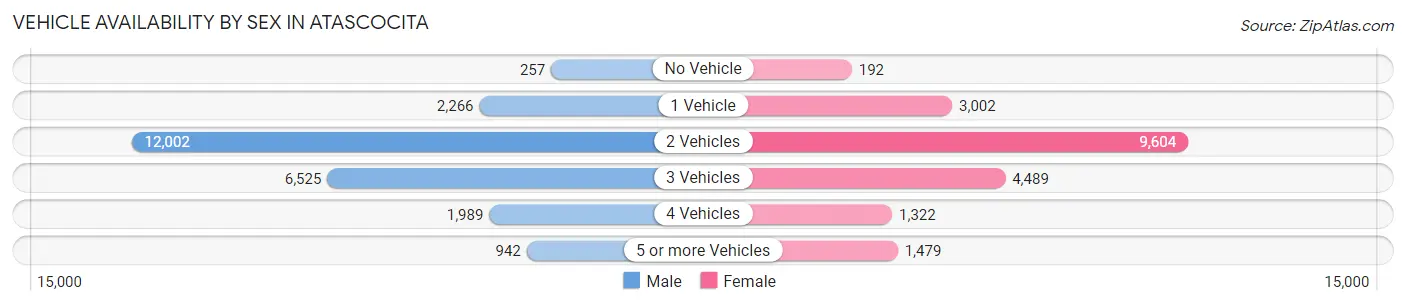
| Vehicles Available | Male | Female |
| No Vehicle | 257 (1.1%) | 192 (1.0%) |
| 1 Vehicle | 2,266 (9.5%) | 3,002 (14.9%) |
| 2 Vehicles | 12,002 (50.0%) | 9,604 (47.8%) |
| 3 Vehicles | 6,525 (27.2%) | 4,489 (22.4%) |
| 4 Vehicles | 1,989 (8.3%) | 1,322 (6.6%) |
| 5 or more Vehicles | 942 (3.9%) | 1,479 (7.4%) |
| Total | 23,981 (100.0%) | 20,088 (100.0%) |
Commute Time in Atascocita
The most frequently occuring commute durations in Atascocita are 45 to 59 minutes (8,050 commuters, 20.3%), 30 to 34 minutes (5,261 commuters, 13.3%), and 60 to 89 minutes (4,411 commuters, 11.2%).
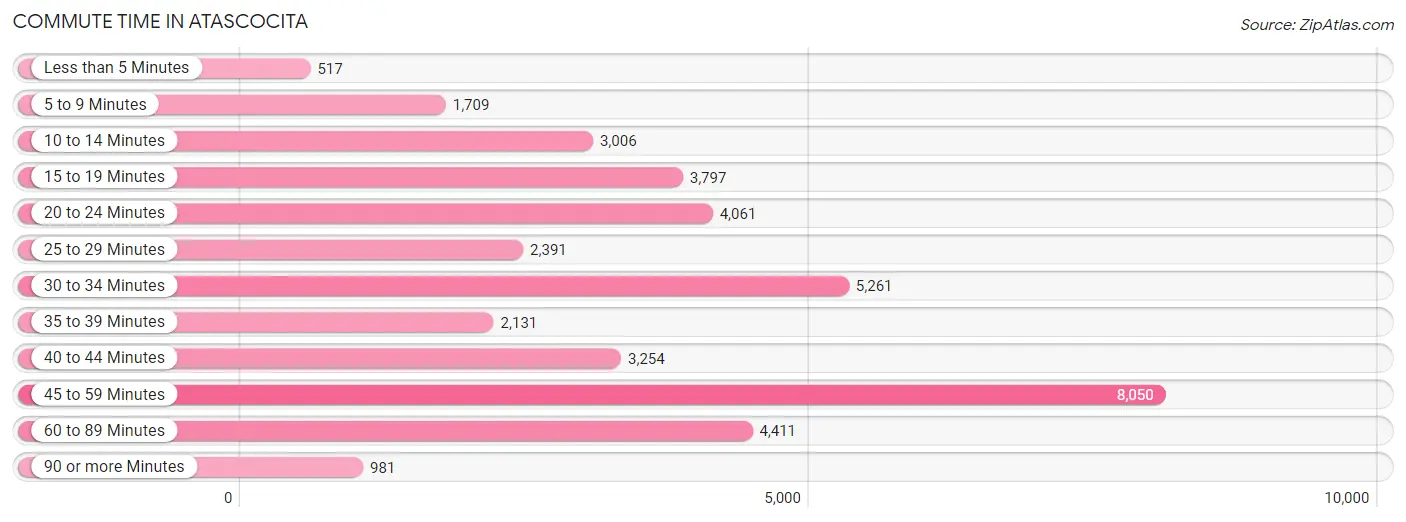
| Commute Time | # Commuters | % Commuters |
| Less than 5 Minutes | 517 | 1.3% |
| 5 to 9 Minutes | 1,709 | 4.3% |
| 10 to 14 Minutes | 3,006 | 7.6% |
| 15 to 19 Minutes | 3,797 | 9.6% |
| 20 to 24 Minutes | 4,061 | 10.3% |
| 25 to 29 Minutes | 2,391 | 6.0% |
| 30 to 34 Minutes | 5,261 | 13.3% |
| 35 to 39 Minutes | 2,131 | 5.4% |
| 40 to 44 Minutes | 3,254 | 8.2% |
| 45 to 59 Minutes | 8,050 | 20.3% |
| 60 to 89 Minutes | 4,411 | 11.2% |
| 90 or more Minutes | 981 | 2.5% |
Commute Time by Sex in Atascocita
The most common commute times in Atascocita are 45 to 59 minutes (4,475 commuters, 20.0%) for males and 45 to 59 minutes (3,575 commuters, 20.8%) for females.
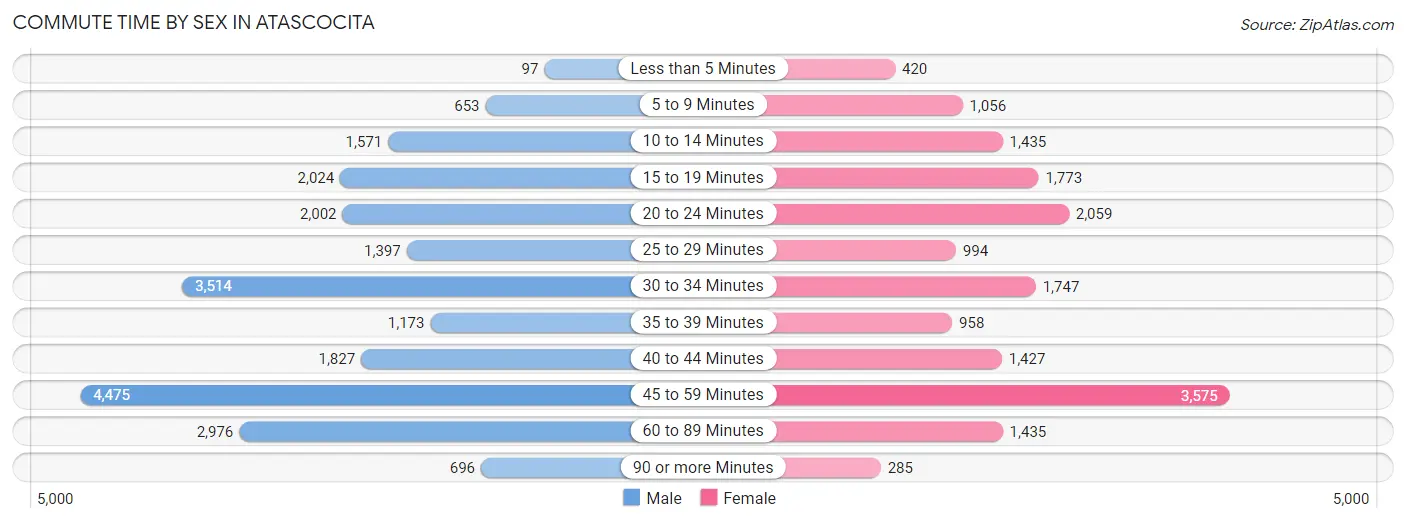
| Commute Time | Male | Female |
| Less than 5 Minutes | 97 (0.4%) | 420 (2.5%) |
| 5 to 9 Minutes | 653 (2.9%) | 1,056 (6.1%) |
| 10 to 14 Minutes | 1,571 (7.0%) | 1,435 (8.4%) |
| 15 to 19 Minutes | 2,024 (9.0%) | 1,773 (10.3%) |
| 20 to 24 Minutes | 2,002 (8.9%) | 2,059 (12.0%) |
| 25 to 29 Minutes | 1,397 (6.2%) | 994 (5.8%) |
| 30 to 34 Minutes | 3,514 (15.7%) | 1,747 (10.2%) |
| 35 to 39 Minutes | 1,173 (5.2%) | 958 (5.6%) |
| 40 to 44 Minutes | 1,827 (8.2%) | 1,427 (8.3%) |
| 45 to 59 Minutes | 4,475 (20.0%) | 3,575 (20.8%) |
| 60 to 89 Minutes | 2,976 (13.3%) | 1,435 (8.4%) |
| 90 or more Minutes | 696 (3.1%) | 285 (1.7%) |
Time of Departure to Work by Sex in Atascocita
The most frequent times of departure to work in Atascocita are 6:00 AM to 6:29 AM (3,042, 13.6%) for males and 7:00 AM to 7:29 AM (4,066, 23.7%) for females.
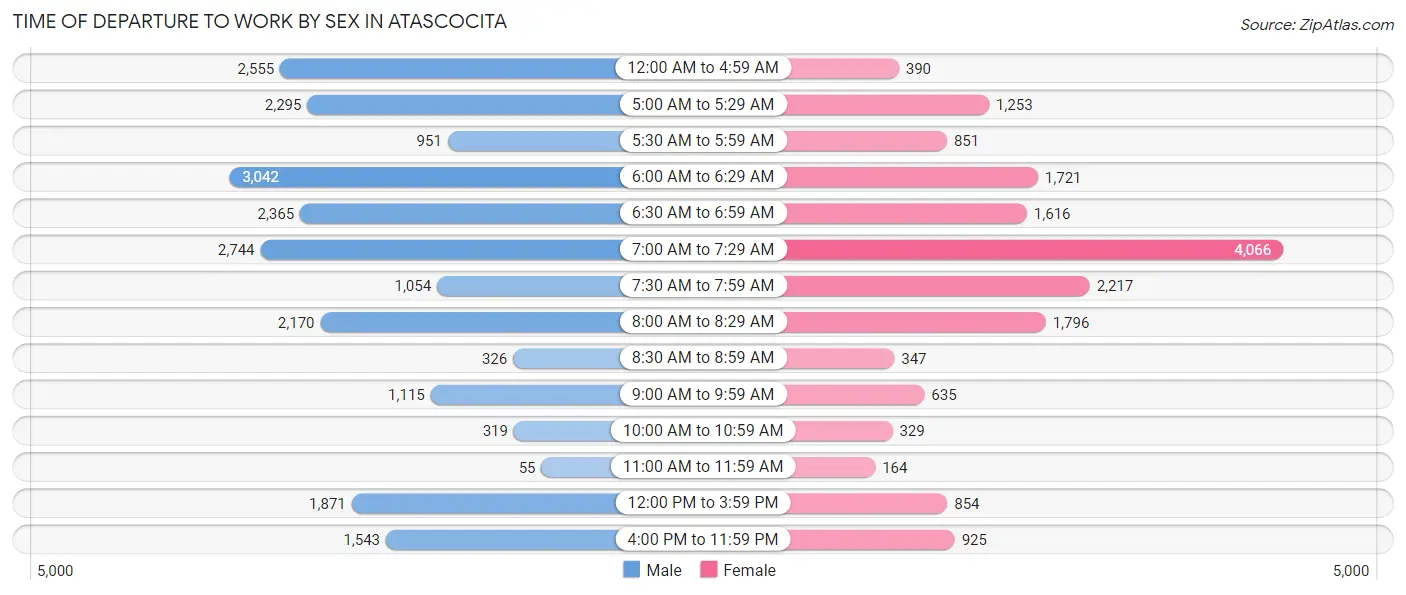
| Time of Departure | Male | Female |
| 12:00 AM to 4:59 AM | 2,555 (11.4%) | 390 (2.3%) |
| 5:00 AM to 5:29 AM | 2,295 (10.2%) | 1,253 (7.3%) |
| 5:30 AM to 5:59 AM | 951 (4.2%) | 851 (5.0%) |
| 6:00 AM to 6:29 AM | 3,042 (13.6%) | 1,721 (10.0%) |
| 6:30 AM to 6:59 AM | 2,365 (10.6%) | 1,616 (9.4%) |
| 7:00 AM to 7:29 AM | 2,744 (12.2%) | 4,066 (23.7%) |
| 7:30 AM to 7:59 AM | 1,054 (4.7%) | 2,217 (12.9%) |
| 8:00 AM to 8:29 AM | 2,170 (9.7%) | 1,796 (10.5%) |
| 8:30 AM to 8:59 AM | 326 (1.5%) | 347 (2.0%) |
| 9:00 AM to 9:59 AM | 1,115 (5.0%) | 635 (3.7%) |
| 10:00 AM to 10:59 AM | 319 (1.4%) | 329 (1.9%) |
| 11:00 AM to 11:59 AM | 55 (0.3%) | 164 (1.0%) |
| 12:00 PM to 3:59 PM | 1,871 (8.4%) | 854 (5.0%) |
| 4:00 PM to 11:59 PM | 1,543 (6.9%) | 925 (5.4%) |
| Total | 22,405 (100.0%) | 17,164 (100.0%) |
Housing Occupancy in Atascocita
Occupancy by Ownership in Atascocita
Of the total 29,089 dwellings in Atascocita, owner-occupied units account for 23,907 (82.2%), while renter-occupied units make up 5,182 (17.8%).
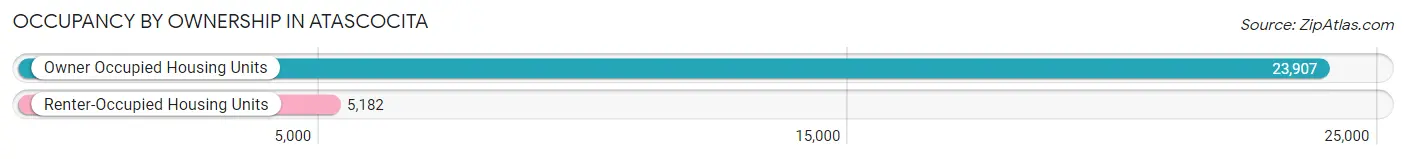
| Occupancy | # Housing Units | % Housing Units |
| Owner Occupied Housing Units | 23,907 | 82.2% |
| Renter-Occupied Housing Units | 5,182 | 17.8% |
| Total Occupied Housing Units | 29,089 | 100.0% |
Occupancy by Household Size in Atascocita
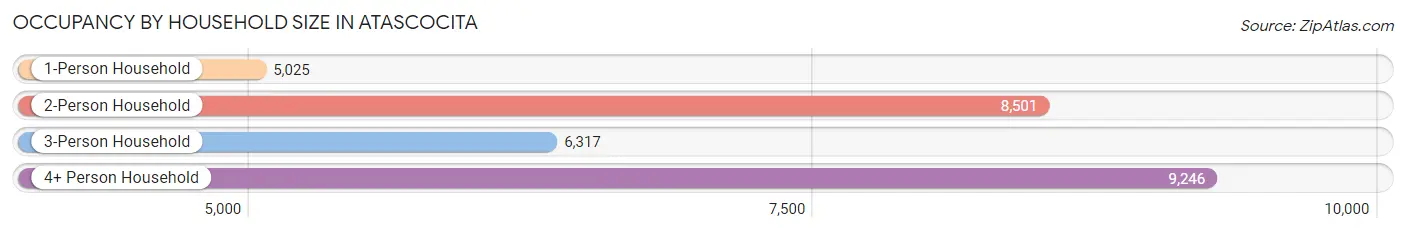
| Household Size | # Housing Units | % Housing Units |
| 1-Person Household | 5,025 | 17.3% |
| 2-Person Household | 8,501 | 29.2% |
| 3-Person Household | 6,317 | 21.7% |
| 4+ Person Household | 9,246 | 31.8% |
| Total Housing Units | 29,089 | 100.0% |
Occupancy by Ownership by Household Size in Atascocita
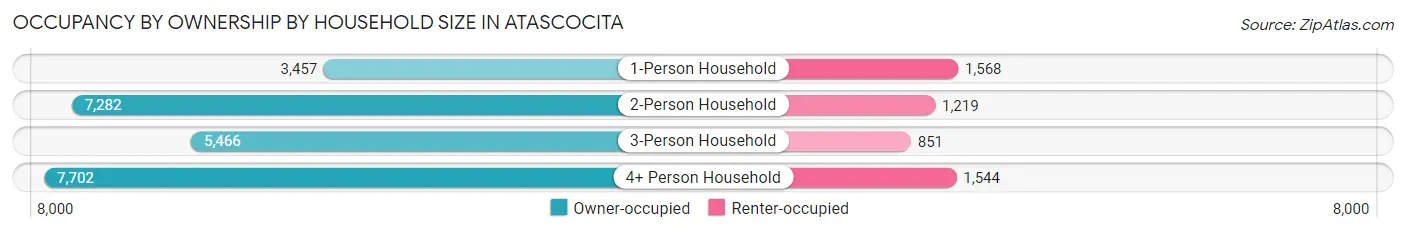
| Household Size | Owner-occupied | Renter-occupied |
| 1-Person Household | 3,457 (68.8%) | 1,568 (31.2%) |
| 2-Person Household | 7,282 (85.7%) | 1,219 (14.3%) |
| 3-Person Household | 5,466 (86.5%) | 851 (13.5%) |
| 4+ Person Household | 7,702 (83.3%) | 1,544 (16.7%) |
| Total Housing Units | 23,907 (82.2%) | 5,182 (17.8%) |
Occupancy by Educational Attainment in Atascocita
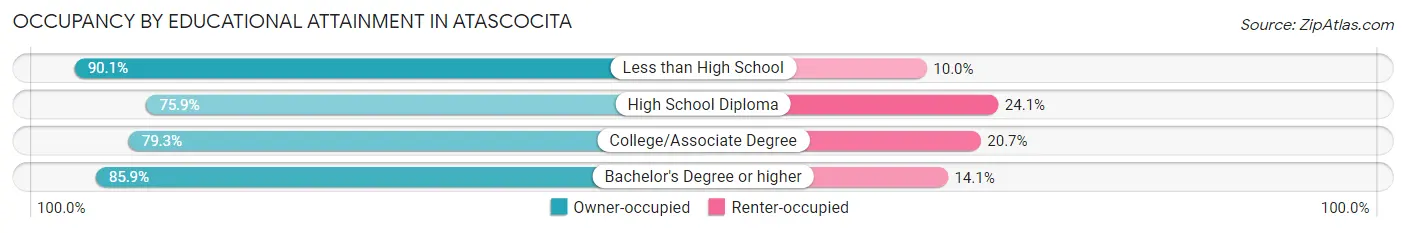
| Household Size | Owner-occupied | Renter-occupied |
| Less than High School | 1,050 (90.0%) | 116 (10.0%) |
| High School Diploma | 3,560 (75.9%) | 1,133 (24.1%) |
| College/Associate Degree | 7,880 (79.3%) | 2,052 (20.7%) |
| Bachelor's Degree or higher | 11,417 (85.9%) | 1,881 (14.1%) |
Occupancy by Age of Householder in Atascocita
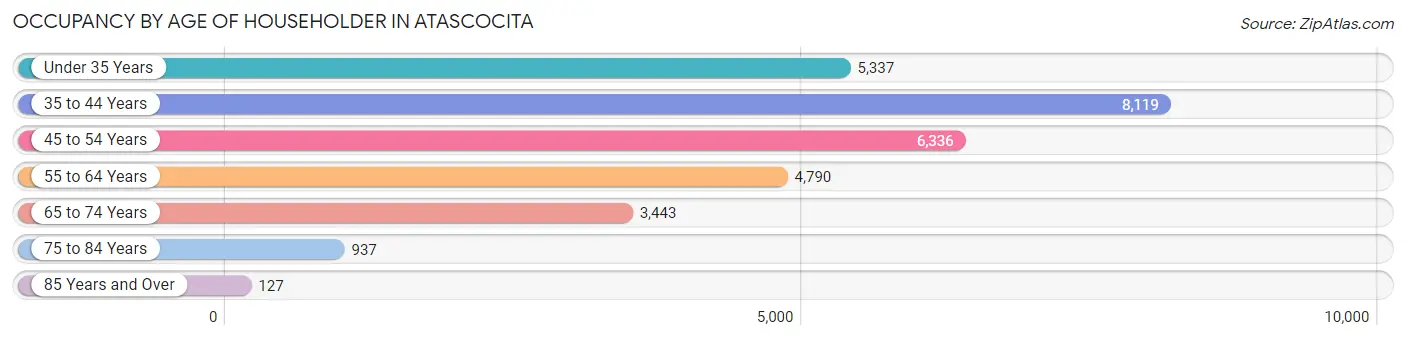
| Age Bracket | # Households | % Households |
| Under 35 Years | 5,337 | 18.3% |
| 35 to 44 Years | 8,119 | 27.9% |
| 45 to 54 Years | 6,336 | 21.8% |
| 55 to 64 Years | 4,790 | 16.5% |
| 65 to 74 Years | 3,443 | 11.8% |
| 75 to 84 Years | 937 | 3.2% |
| 85 Years and Over | 127 | 0.4% |
| Total | 29,089 | 100.0% |
Housing Finances in Atascocita
Median Income by Occupancy in Atascocita
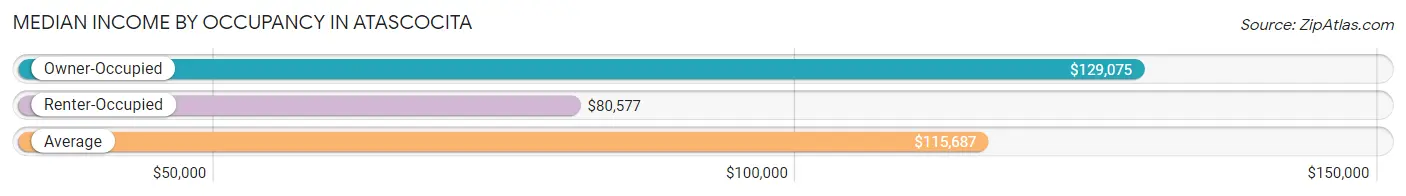
| Occupancy Type | # Households | Median Income |
| Owner-Occupied | 23,907 (82.2%) | $129,075 |
| Renter-Occupied | 5,182 (17.8%) | $80,577 |
| Average | 29,089 (100.0%) | $115,687 |
Occupancy by Householder Income Bracket in Atascocita
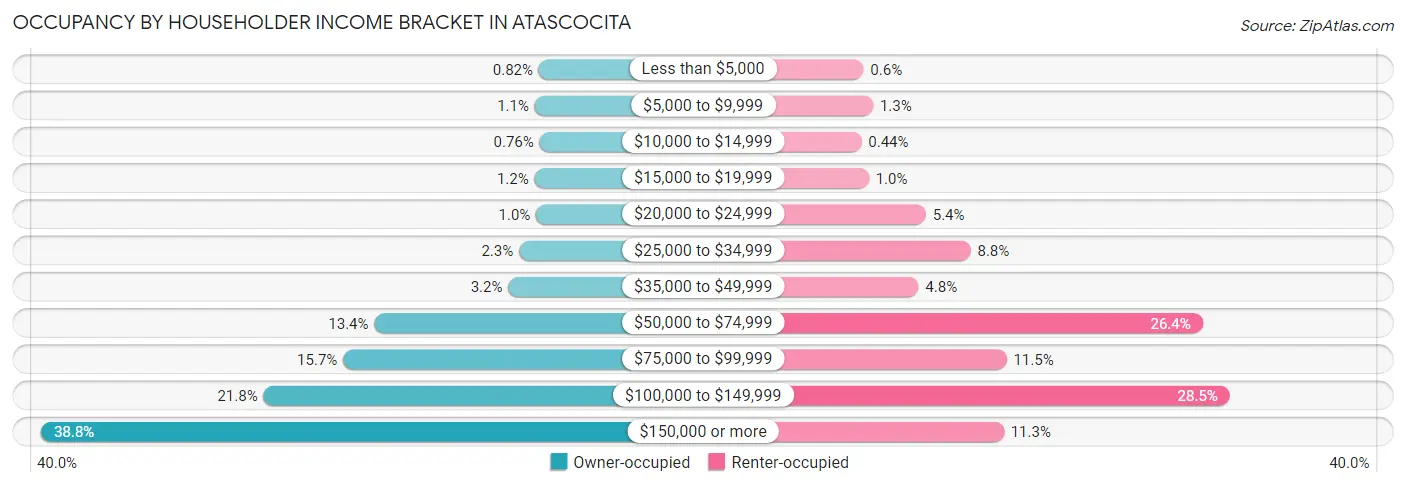
| Income Bracket | Owner-occupied | Renter-occupied |
| Less than $5,000 | 197 (0.8%) | 31 (0.6%) |
| $5,000 to $9,999 | 271 (1.1%) | 69 (1.3%) |
| $10,000 to $14,999 | 181 (0.8%) | 23 (0.4%) |
| $15,000 to $19,999 | 276 (1.1%) | 52 (1.0%) |
| $20,000 to $24,999 | 245 (1.0%) | 277 (5.3%) |
| $25,000 to $34,999 | 556 (2.3%) | 454 (8.8%) |
| $35,000 to $49,999 | 752 (3.2%) | 248 (4.8%) |
| $50,000 to $74,999 | 3,192 (13.4%) | 1,370 (26.4%) |
| $75,000 to $99,999 | 3,761 (15.7%) | 596 (11.5%) |
| $100,000 to $149,999 | 5,211 (21.8%) | 1,477 (28.5%) |
| $150,000 or more | 9,265 (38.8%) | 585 (11.3%) |
| Total | 23,907 (100.0%) | 5,182 (100.0%) |
Monthly Housing Cost Tiers in Atascocita
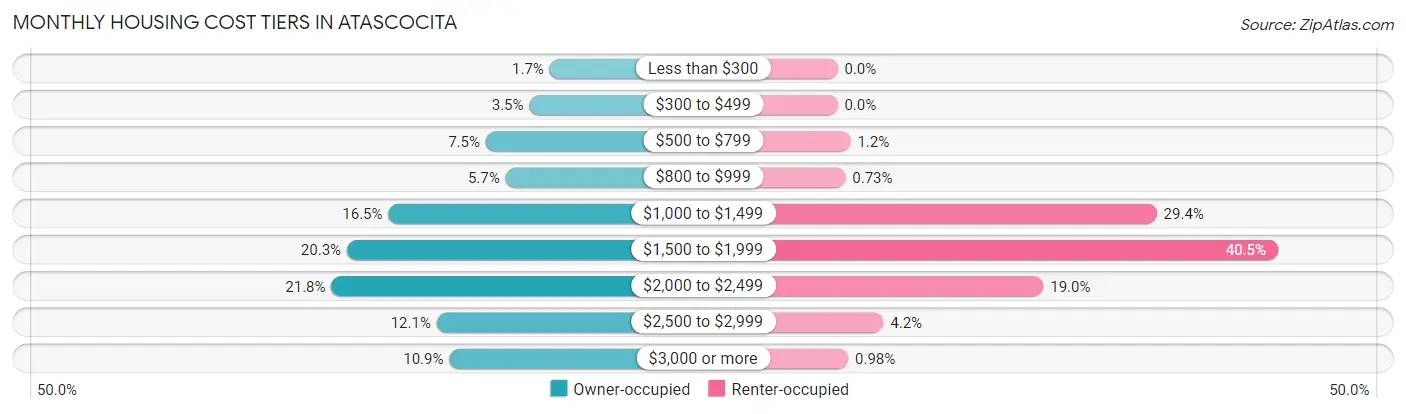
| Monthly Cost | Owner-occupied | Renter-occupied |
| Less than $300 | 396 (1.7%) | 0 (0.0%) |
| $300 to $499 | 843 (3.5%) | 0 (0.0%) |
| $500 to $799 | 1,802 (7.5%) | 62 (1.2%) |
| $800 to $999 | 1,367 (5.7%) | 38 (0.7%) |
| $1,000 to $1,499 | 3,946 (16.5%) | 1,523 (29.4%) |
| $1,500 to $1,999 | 4,861 (20.3%) | 2,101 (40.5%) |
| $2,000 to $2,499 | 5,202 (21.8%) | 982 (19.0%) |
| $2,500 to $2,999 | 2,884 (12.1%) | 219 (4.2%) |
| $3,000 or more | 2,606 (10.9%) | 51 (1.0%) |
| Total | 23,907 (100.0%) | 5,182 (100.0%) |
Physical Housing Characteristics in Atascocita
Housing Structures in Atascocita
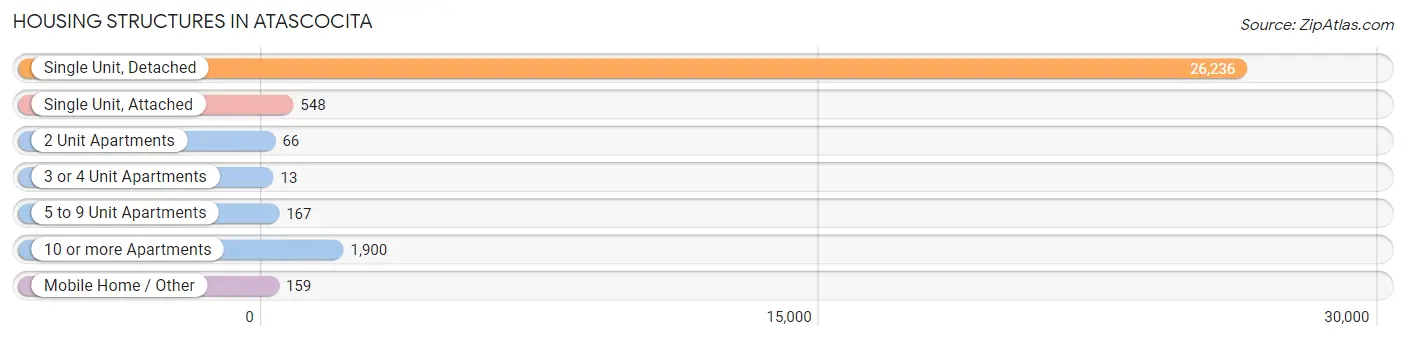
| Structure Type | # Housing Units | % Housing Units |
| Single Unit, Detached | 26,236 | 90.2% |
| Single Unit, Attached | 548 | 1.9% |
| 2 Unit Apartments | 66 | 0.2% |
| 3 or 4 Unit Apartments | 13 | 0.0% |
| 5 to 9 Unit Apartments | 167 | 0.6% |
| 10 or more Apartments | 1,900 | 6.5% |
| Mobile Home / Other | 159 | 0.5% |
| Total | 29,089 | 100.0% |
Housing Structures by Occupancy in Atascocita
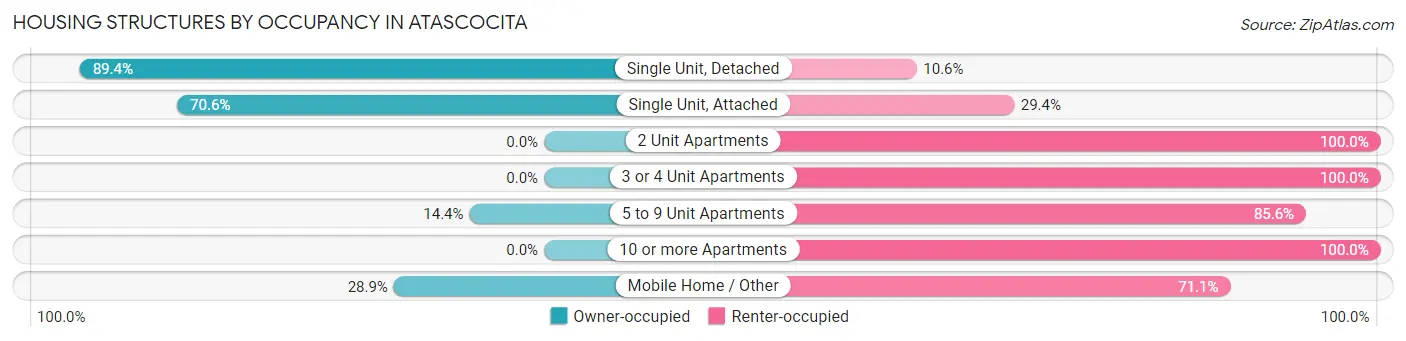
| Structure Type | Owner-occupied | Renter-occupied |
| Single Unit, Detached | 23,450 (89.4%) | 2,786 (10.6%) |
| Single Unit, Attached | 387 (70.6%) | 161 (29.4%) |
| 2 Unit Apartments | 0 (0.0%) | 66 (100.0%) |
| 3 or 4 Unit Apartments | 0 (0.0%) | 13 (100.0%) |
| 5 to 9 Unit Apartments | 24 (14.4%) | 143 (85.6%) |
| 10 or more Apartments | 0 (0.0%) | 1,900 (100.0%) |
| Mobile Home / Other | 46 (28.9%) | 113 (71.1%) |
| Total | 23,907 (82.2%) | 5,182 (17.8%) |
Housing Structures by Number of Rooms in Atascocita
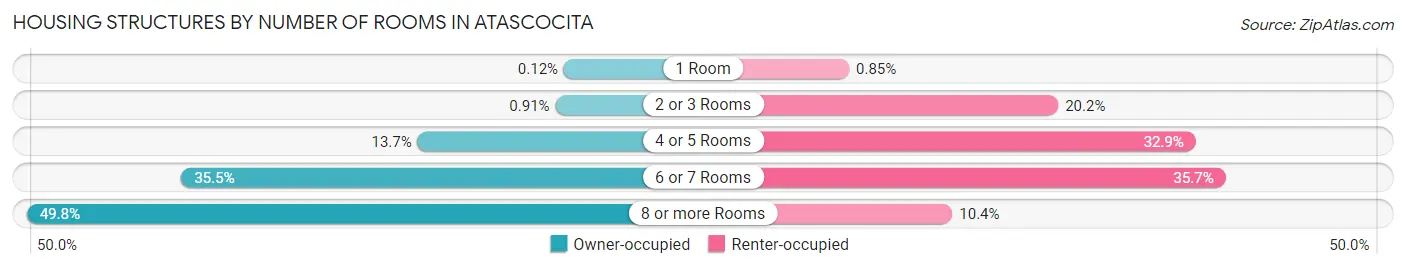
| Number of Rooms | Owner-occupied | Renter-occupied |
| 1 Room | 29 (0.1%) | 44 (0.9%) |
| 2 or 3 Rooms | 218 (0.9%) | 1,046 (20.2%) |
| 4 or 5 Rooms | 3,265 (13.7%) | 1,705 (32.9%) |
| 6 or 7 Rooms | 8,490 (35.5%) | 1,848 (35.7%) |
| 8 or more Rooms | 11,905 (49.8%) | 539 (10.4%) |
| Total | 23,907 (100.0%) | 5,182 (100.0%) |
Housing Structure by Heating Type in Atascocita
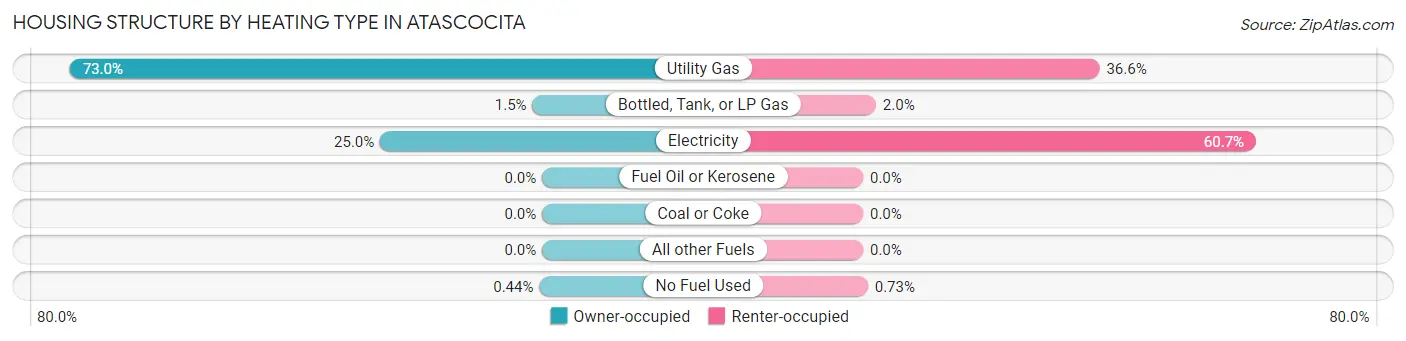
| Heating Type | Owner-occupied | Renter-occupied |
| Utility Gas | 17,457 (73.0%) | 1,894 (36.5%) |
| Bottled, Tank, or LP Gas | 357 (1.5%) | 103 (2.0%) |
| Electricity | 5,987 (25.0%) | 3,147 (60.7%) |
| Fuel Oil or Kerosene | 0 (0.0%) | 0 (0.0%) |
| Coal or Coke | 0 (0.0%) | 0 (0.0%) |
| All other Fuels | 0 (0.0%) | 0 (0.0%) |
| No Fuel Used | 106 (0.4%) | 38 (0.7%) |
| Total | 23,907 (100.0%) | 5,182 (100.0%) |
Household Vehicle Usage in Atascocita
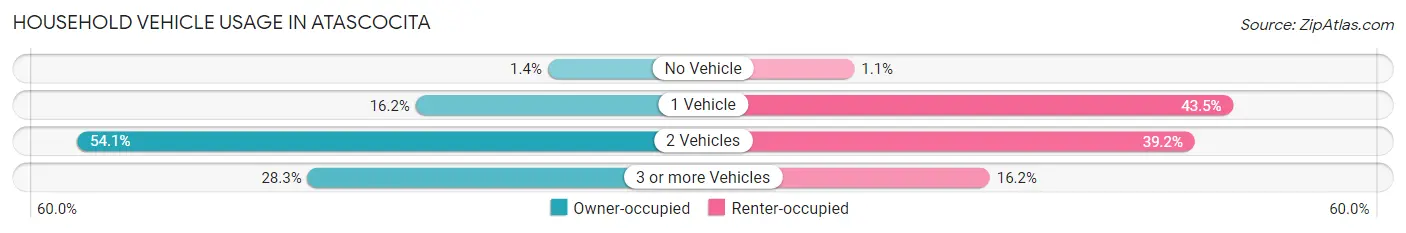
| Vehicles per Household | Owner-occupied | Renter-occupied |
| No Vehicle | 334 (1.4%) | 55 (1.1%) |
| 1 Vehicle | 3,870 (16.2%) | 2,255 (43.5%) |
| 2 Vehicles | 12,935 (54.1%) | 2,031 (39.2%) |
| 3 or more Vehicles | 6,768 (28.3%) | 841 (16.2%) |
| Total | 23,907 (100.0%) | 5,182 (100.0%) |
Real Estate & Mortgages in Atascocita
Real Estate and Mortgage Overview in Atascocita
| Characteristic | Without Mortgage | With Mortgage |
| Housing Units | 5,717 | 18,190 |
| Median Property Value | $236,900 | $264,100 |
| Median Household Income | $93,285 | $7,645 |
| Monthly Housing Costs | $810 | $2,606 |
| Real Estate Taxes | $4,453 | $681 |
Property Value by Mortgage Status in Atascocita
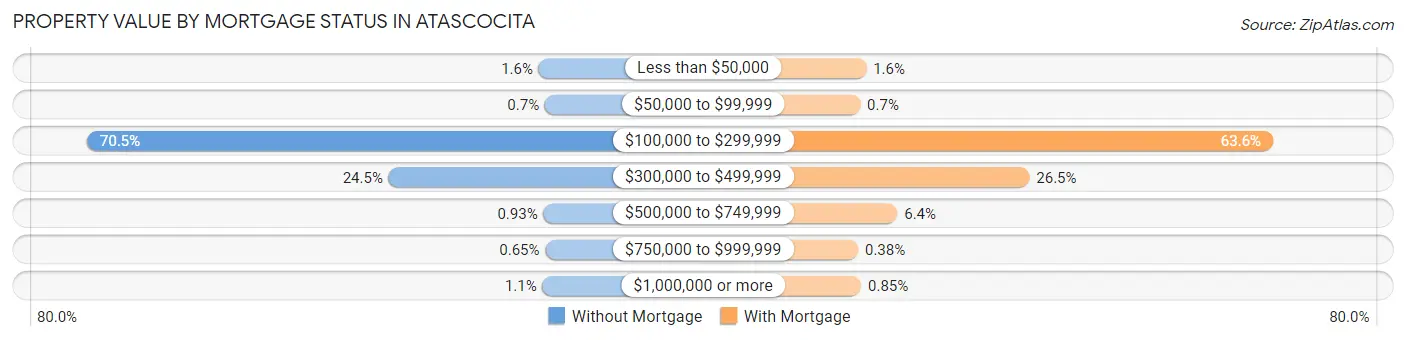
| Property Value | Without Mortgage | With Mortgage |
| Less than $50,000 | 94 (1.6%) | 295 (1.6%) |
| $50,000 to $99,999 | 40 (0.7%) | 128 (0.7%) |
| $100,000 to $299,999 | 4,031 (70.5%) | 11,567 (63.6%) |
| $300,000 to $499,999 | 1,401 (24.5%) | 4,819 (26.5%) |
| $500,000 to $749,999 | 53 (0.9%) | 1,157 (6.4%) |
| $750,000 to $999,999 | 37 (0.6%) | 69 (0.4%) |
| $1,000,000 or more | 61 (1.1%) | 155 (0.9%) |
| Total | 5,717 (100.0%) | 18,190 (100.0%) |
Household Income by Mortgage Status in Atascocita
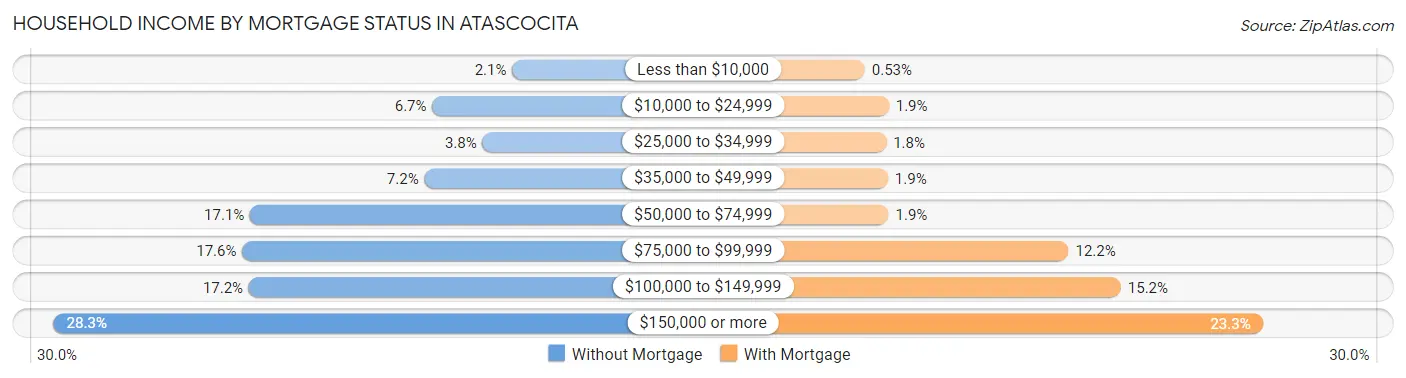
| Household Income | Without Mortgage | With Mortgage |
| Less than $10,000 | 122 (2.1%) | 96 (0.5%) |
| $10,000 to $24,999 | 383 (6.7%) | 346 (1.9%) |
| $25,000 to $34,999 | 219 (3.8%) | 319 (1.8%) |
| $35,000 to $49,999 | 409 (7.1%) | 337 (1.8%) |
| $50,000 to $74,999 | 978 (17.1%) | 343 (1.9%) |
| $75,000 to $99,999 | 1,004 (17.6%) | 2,214 (12.2%) |
| $100,000 to $149,999 | 982 (17.2%) | 2,757 (15.2%) |
| $150,000 or more | 1,620 (28.3%) | 4,229 (23.3%) |
| Total | 5,717 (100.0%) | 18,190 (100.0%) |
Property Value to Household Income Ratio in Atascocita
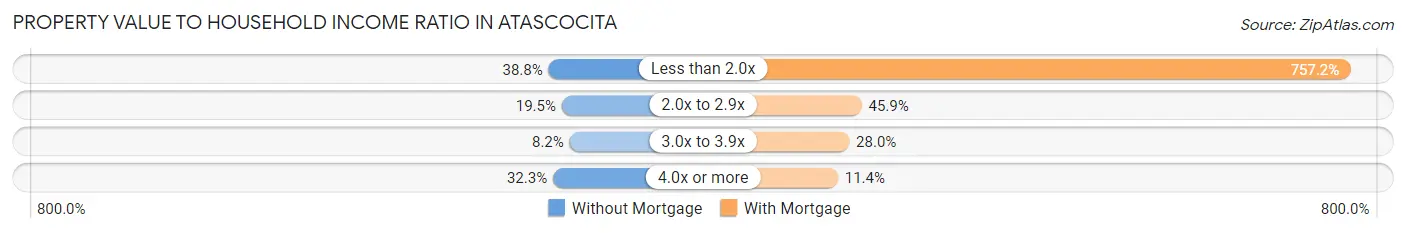
| Value-to-Income Ratio | Without Mortgage | With Mortgage |
| Less than 2.0x | 2,218 (38.8%) | 137,727 (757.2%) |
| 2.0x to 2.9x | 1,117 (19.5%) | 8,355 (45.9%) |
| 3.0x to 3.9x | 468 (8.2%) | 5,085 (28.0%) |
| 4.0x or more | 1,848 (32.3%) | 2,071 (11.4%) |
| Total | 5,717 (100.0%) | 18,190 (100.0%) |
Real Estate Taxes by Mortgage Status in Atascocita
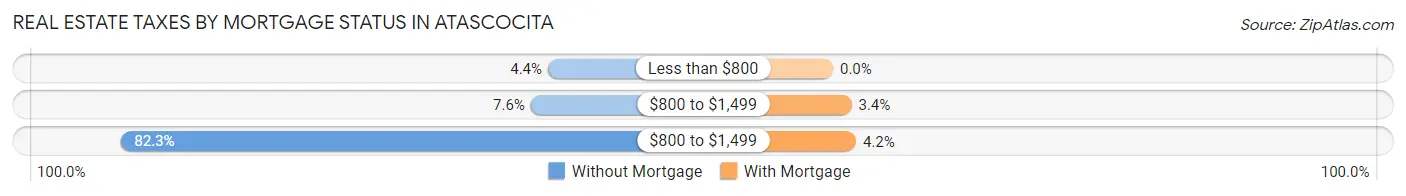
| Property Taxes | Without Mortgage | With Mortgage |
| Less than $800 | 253 (4.4%) | 0 (0.0%) |
| $800 to $1,499 | 432 (7.6%) | 615 (3.4%) |
| $800 to $1,499 | 4,706 (82.3%) | 763 (4.2%) |
| Total | 5,717 (100.0%) | 18,190 (100.0%) |
Health & Disability in Atascocita
Health Insurance Coverage by Age in Atascocita
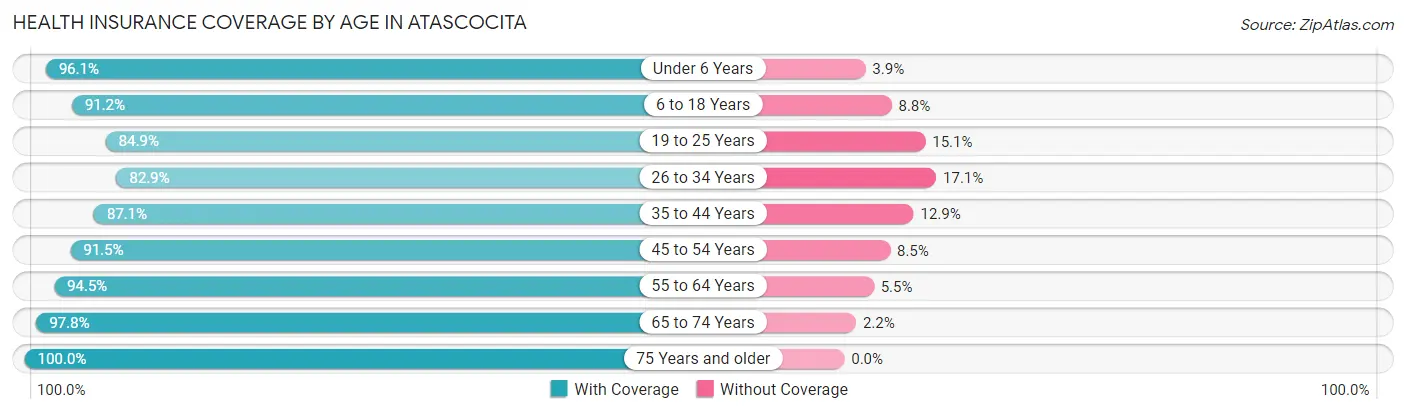
| Age Bracket | With Coverage | Without Coverage |
| Under 6 Years | 6,832 (96.1%) | 280 (3.9%) |
| 6 to 18 Years | 16,874 (91.2%) | 1,631 (8.8%) |
| 19 to 25 Years | 5,096 (84.9%) | 907 (15.1%) |
| 26 to 34 Years | 8,722 (82.9%) | 1,802 (17.1%) |
| 35 to 44 Years | 13,453 (87.1%) | 1,995 (12.9%) |
| 45 to 54 Years | 10,665 (91.5%) | 994 (8.5%) |
| 55 to 64 Years | 8,203 (94.5%) | 476 (5.5%) |
| 65 to 74 Years | 6,276 (97.8%) | 140 (2.2%) |
| 75 Years and older | 2,218 (100.0%) | 0 (0.0%) |
| Total | 78,339 (90.5%) | 8,225 (9.5%) |
Health Insurance Coverage by Citizenship Status in Atascocita
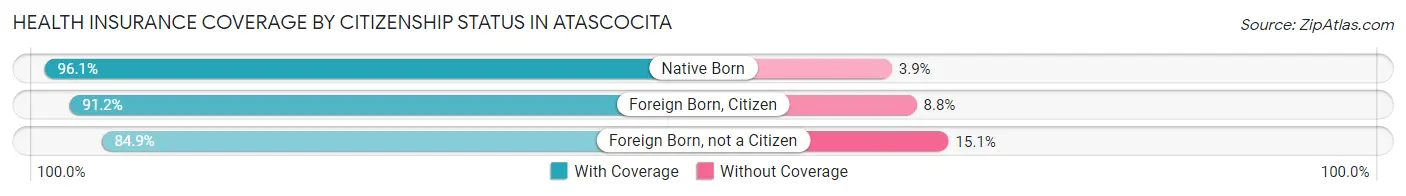
| Citizenship Status | With Coverage | Without Coverage |
| Native Born | 6,832 (96.1%) | 280 (3.9%) |
| Foreign Born, Citizen | 16,874 (91.2%) | 1,631 (8.8%) |
| Foreign Born, not a Citizen | 5,096 (84.9%) | 907 (15.1%) |
Health Insurance Coverage by Household Income in Atascocita
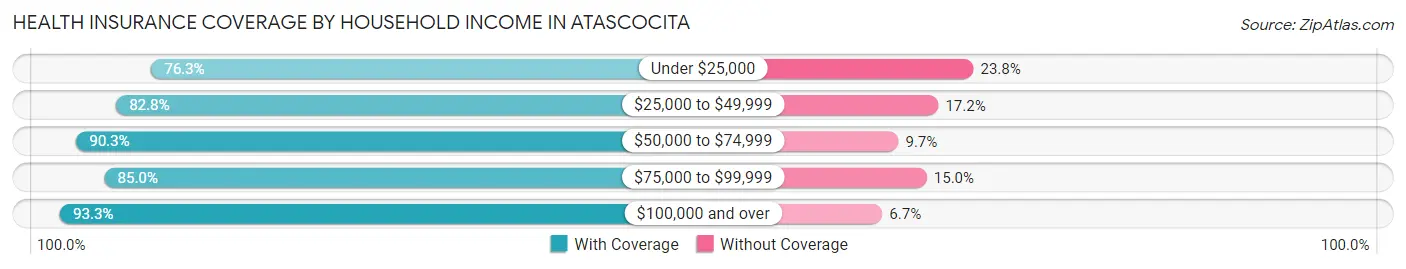
| Household Income | With Coverage | Without Coverage |
| Under $25,000 | 2,523 (76.2%) | 786 (23.7%) |
| $25,000 to $49,999 | 3,496 (82.8%) | 725 (17.2%) |
| $50,000 to $74,999 | 10,088 (90.3%) | 1,082 (9.7%) |
| $75,000 to $99,999 | 10,802 (85.0%) | 1,906 (15.0%) |
| $100,000 and over | 51,272 (93.3%) | 3,662 (6.7%) |
Public vs Private Health Insurance Coverage by Age in Atascocita
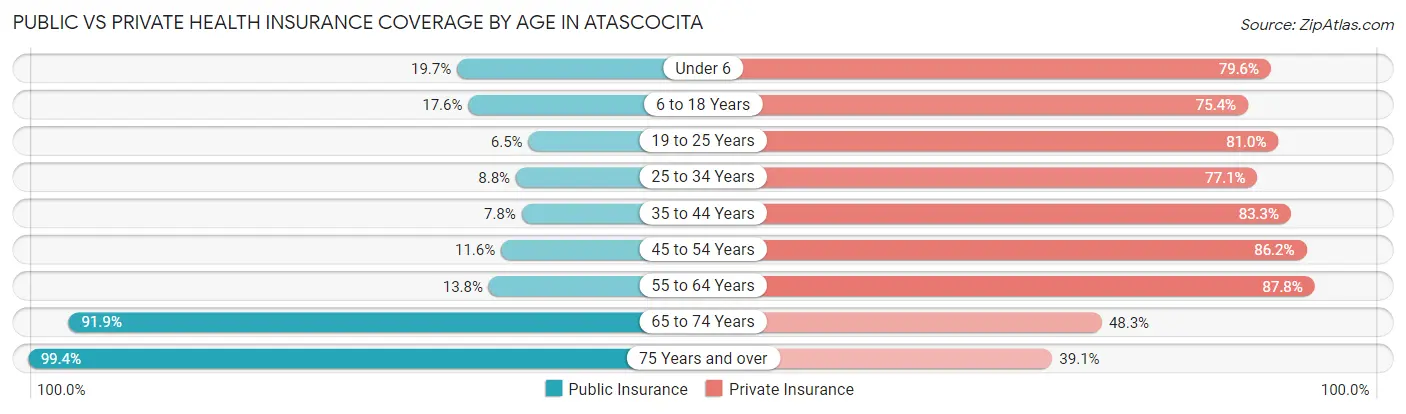
| Age Bracket | Public Insurance | Private Insurance |
| Under 6 | 1,403 (19.7%) | 5,663 (79.6%) |
| 6 to 18 Years | 3,264 (17.6%) | 13,947 (75.4%) |
| 19 to 25 Years | 389 (6.5%) | 4,863 (81.0%) |
| 25 to 34 Years | 926 (8.8%) | 8,118 (77.1%) |
| 35 to 44 Years | 1,197 (7.7%) | 12,874 (83.3%) |
| 45 to 54 Years | 1,349 (11.6%) | 10,052 (86.2%) |
| 55 to 64 Years | 1,201 (13.8%) | 7,617 (87.8%) |
| 65 to 74 Years | 5,893 (91.8%) | 3,098 (48.3%) |
| 75 Years and over | 2,205 (99.4%) | 867 (39.1%) |
| Total | 17,827 (20.6%) | 67,099 (77.5%) |
Disability Status by Sex by Age in Atascocita
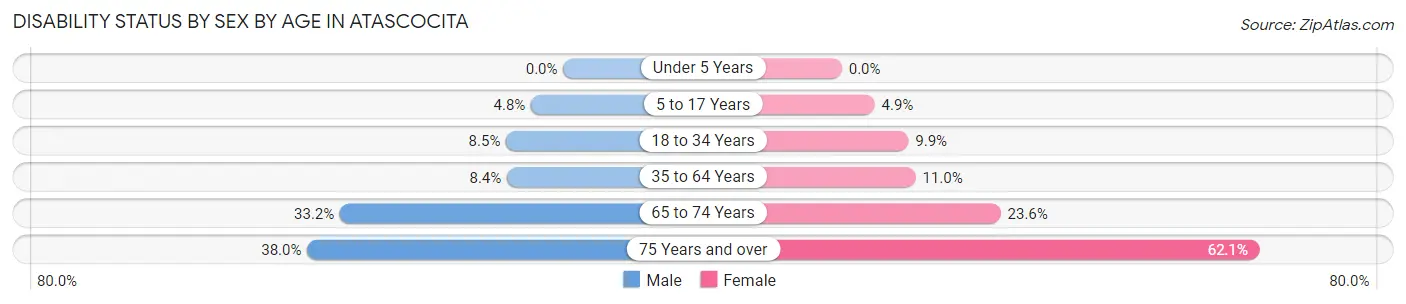
| Age Bracket | Male | Female |
| Under 5 Years | 0 (0.0%) | 0 (0.0%) |
| 5 to 17 Years | 457 (4.8%) | 434 (4.9%) |
| 18 to 34 Years | 761 (8.5%) | 849 (9.9%) |
| 35 to 64 Years | 1,494 (8.4%) | 1,958 (11.0%) |
| 65 to 74 Years | 960 (33.2%) | 830 (23.6%) |
| 75 Years and over | 330 (38.0%) | 838 (62.1%) |
Disability Class by Sex by Age in Atascocita
Disability Class: Hearing Difficulty
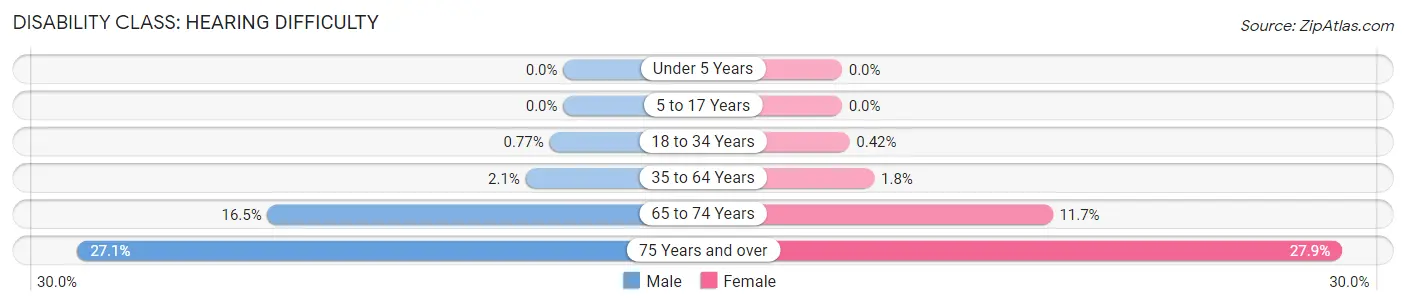
| Age Bracket | Male | Female |
| Under 5 Years | 0 (0.0%) | 0 (0.0%) |
| 5 to 17 Years | 0 (0.0%) | 0 (0.0%) |
| 18 to 34 Years | 69 (0.8%) | 36 (0.4%) |
| 35 to 64 Years | 376 (2.1%) | 322 (1.8%) |
| 65 to 74 Years | 477 (16.5%) | 413 (11.7%) |
| 75 Years and over | 235 (27.1%) | 376 (27.9%) |
Disability Class: Vision Difficulty
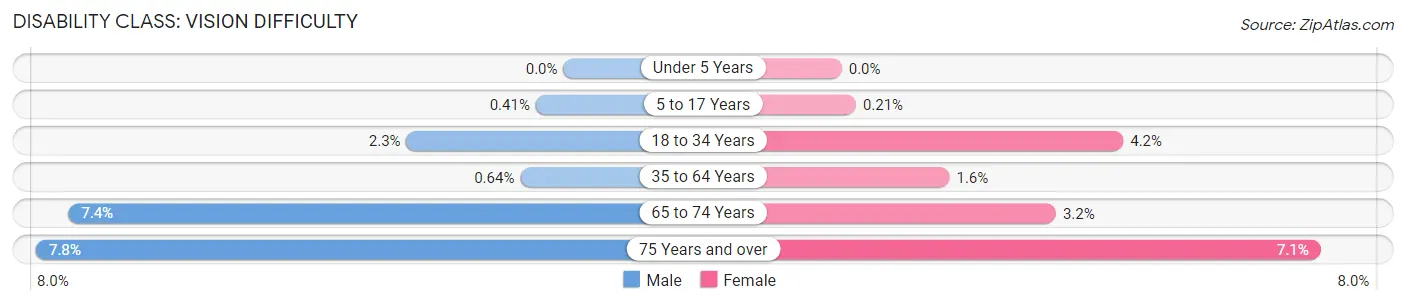
| Age Bracket | Male | Female |
| Under 5 Years | 0 (0.0%) | 0 (0.0%) |
| 5 to 17 Years | 39 (0.4%) | 19 (0.2%) |
| 18 to 34 Years | 209 (2.3%) | 359 (4.2%) |
| 35 to 64 Years | 114 (0.6%) | 286 (1.6%) |
| 65 to 74 Years | 213 (7.3%) | 112 (3.2%) |
| 75 Years and over | 68 (7.8%) | 96 (7.1%) |
Disability Class: Cognitive Difficulty
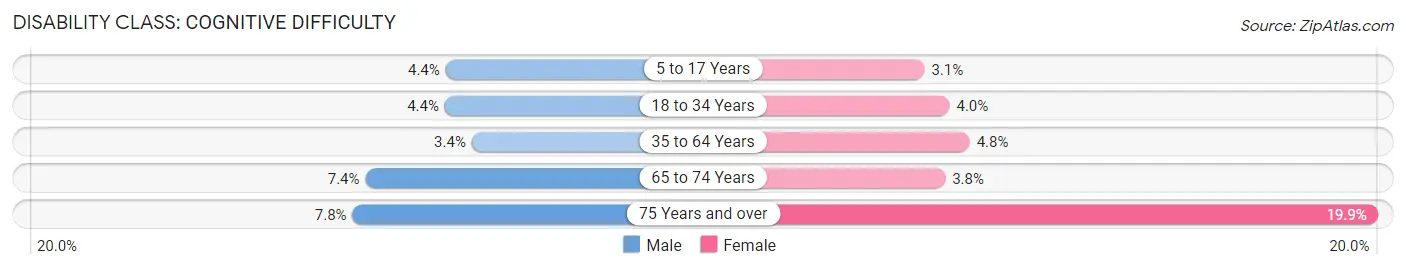
| Age Bracket | Male | Female |
| 5 to 17 Years | 418 (4.4%) | 274 (3.1%) |
| 18 to 34 Years | 395 (4.4%) | 344 (4.0%) |
| 35 to 64 Years | 608 (3.4%) | 849 (4.8%) |
| 65 to 74 Years | 213 (7.3%) | 135 (3.8%) |
| 75 Years and over | 68 (7.8%) | 269 (19.9%) |
Disability Class: Ambulatory Difficulty
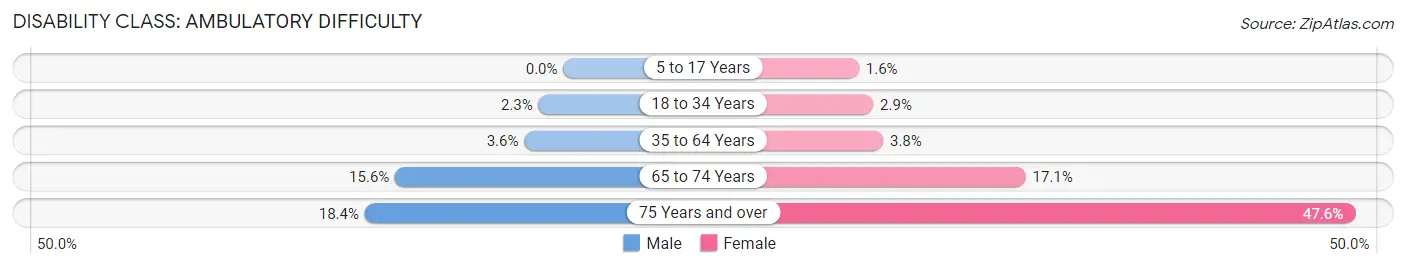
| Age Bracket | Male | Female |
| 5 to 17 Years | 0 (0.0%) | 141 (1.6%) |
| 18 to 34 Years | 206 (2.3%) | 250 (2.9%) |
| 35 to 64 Years | 647 (3.6%) | 686 (3.8%) |
| 65 to 74 Years | 452 (15.6%) | 600 (17.1%) |
| 75 Years and over | 160 (18.4%) | 643 (47.6%) |
Disability Class: Self-Care Difficulty
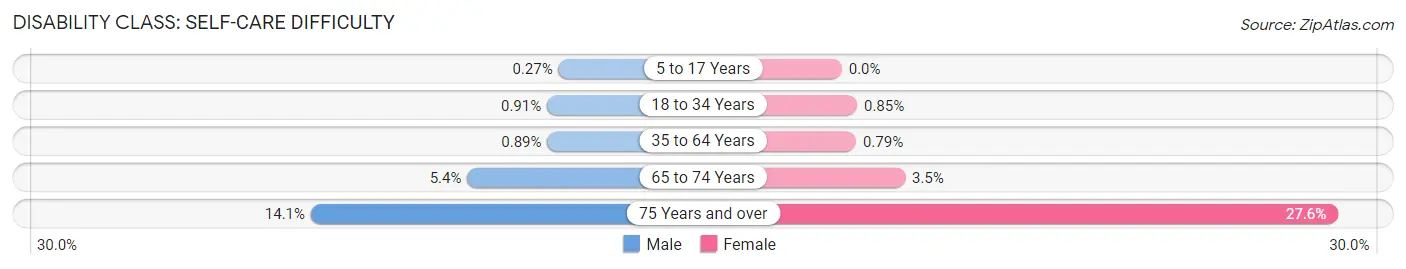
| Age Bracket | Male | Female |
| 5 to 17 Years | 26 (0.3%) | 0 (0.0%) |
| 18 to 34 Years | 82 (0.9%) | 73 (0.9%) |
| 35 to 64 Years | 159 (0.9%) | 141 (0.8%) |
| 65 to 74 Years | 155 (5.3%) | 124 (3.5%) |
| 75 Years and over | 122 (14.1%) | 373 (27.6%) |
Technology Access in Atascocita
Computing Device Access in Atascocita
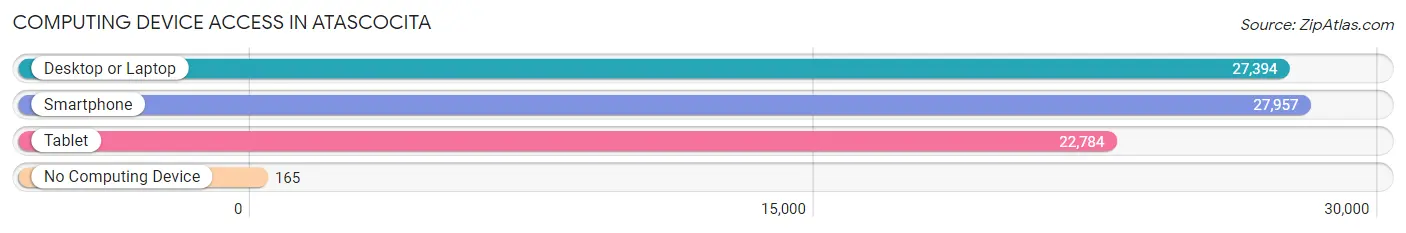
| Device Type | # Households | % Households |
| Desktop or Laptop | 27,394 | 94.2% |
| Smartphone | 27,957 | 96.1% |
| Tablet | 22,784 | 78.3% |
| No Computing Device | 165 | 0.6% |
| Total | 29,089 | 100.0% |
Internet Access in Atascocita
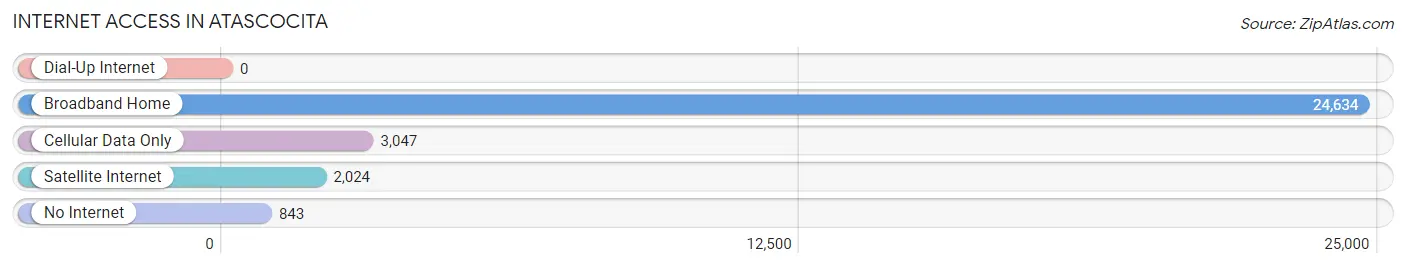
| Internet Type | # Households | % Households |
| Dial-Up Internet | 0 | 0.0% |
| Broadband Home | 24,634 | 84.7% |
| Cellular Data Only | 3,047 | 10.5% |
| Satellite Internet | 2,024 | 7.0% |
| No Internet | 843 | 2.9% |
| Total | 29,089 | 100.0% |
Atascocita Summary
Atascocita is a census-designated place (CDP) located in Harris County, Texas, United States. It is an unincorporated community located in the northeastern part of the county, approximately 25 miles northeast of downtown Houston. As of the 2010 census, the population of Atascocita was 65,844.
History
Atascocita was originally inhabited by the Atakapan Indians, who were part of the larger Karankawa tribe. The area was first settled by Europeans in the early 19th century, when Stephen F. Austin granted land to settlers in the area. The first settlers in the area were the families of John and William Humble, who arrived in 1824. The Humble family built a log cabin on the banks of Lake Houston, which is now part of the Atascocita community.
The area was originally known as Humble, after the Humble family, but the name was changed to Atascocita in the late 19th century. The name is derived from the Spanish phrase “atascosa de la cita”, which means “place of the springs”.
Geography
Atascocita is located in northeastern Harris County, Texas, approximately 25 miles northeast of downtown Houston. It is bordered by Lake Houston to the north, Humble to the west, Kingwood to the south, and Huffman to the east. The total area of the CDP is 33.3 square miles, of which 33.2 square miles is land and 0.1 square miles is water.
Atascocita is located in the humid subtropical climate zone, with hot, humid summers and mild winters. The average annual temperature is 68°F, with an average high of 90°F in the summer and an average low of 46°F in the winter. The average annual precipitation is 48.3 inches, with an average of 5.9 inches of snow per year.
Economy
Atascocita is a rapidly growing suburban community, with a strong economy and a diverse range of businesses. The largest employers in the area are Walmart, H-E-B, Kroger, and Atascocita High School. Other major employers include Atascocita Middle School, Atascocita Elementary School, Atascocita Country Club, and Atascocita Golf Course.
The median household income in Atascocita is $77,845, and the median home value is $182,400. The unemployment rate is 3.7%, which is lower than the national average of 4.1%.
Demographics
As of the 2010 census, there were 65,844 people, 22,945 households, and 18,845 families residing in the CDP. The population density was 1,976.3 people per square mile. The racial makeup of the CDP was 77.2% White, 11.3% African American, 0.5% Native American, 4.2% Asian, 0.1% Pacific Islander, 4.3% from other races, and 2.4% from two or more races. Hispanic or Latino of any race were 18.2% of the population.
The median age in Atascocita was 36.2 years. 22.2% of residents were under the age of 18; 8.2% were between the ages of 18 and 24; 28.2% were from 25 to 44; 28.2% were from 45 to 64; and 13.2% were 65 years of age or older. The gender makeup of the CDP was 48.7% male and 51.3% female.
Conclusion
Atascocita is a rapidly growing suburban community located in northeastern Harris County, Texas. It is an unincorporated community with a population of 65,844 as of the 2010 census. The area was originally inhabited by the Atakapan Indians, and was first settled by Europeans in the early 19th century. Atascocita has a strong economy and a diverse range of businesses, and the median household income is $77,845. The racial makeup of the CDP is 77.2% White, 11.3% African American, 0.5% Native American, 4.2% Asian, 0.1% Pacific Islander, 4.3% from other races, and 2.4% from two or more races. Hispanic or Latino of any race were 18.2% of the population.
Common Questions
What is Per Capita Income in Atascocita?
Per Capita income in Atascocita is $43,030.
What is the Median Family Income in Atascocita?
Median Family Income in Atascocita is $127,803.
What is the Median Household income in Atascocita?
Median Household Income in Atascocita is $115,687.
What is Income or Wage Gap in Atascocita?
Income or Wage Gap in Atascocita is 27.8%.
Women in Atascocita earn 72.2 cents for every dollar earned by a man.
What is Inequality or Gini Index in Atascocita?
Inequality or Gini Index in Atascocita is 0.34.
What is the Total Population of Atascocita?
Total Population of Atascocita is 89,121.
What is the Total Male Population of Atascocita?
Total Male Population of Atascocita is 45,817.
What is the Total Female Population of Atascocita?
Total Female Population of Atascocita is 43,304.
What is the Ratio of Males per 100 Females in Atascocita?
There are 105.80 Males per 100 Females in Atascocita.
What is the Ratio of Females per 100 Males in Atascocita?
There are 94.52 Females per 100 Males in Atascocita.
What is the Median Population Age in Atascocita?
Median Population Age in Atascocita is 35.7 Years.
What is the Average Family Size in Atascocita
Average Family Size in Atascocita is 3.4 People.
What is the Average Household Size in Atascocita
Average Household Size in Atascocita is 3.0 People.
How Large is the Labor Force in Atascocita?
There are 47,102 People in the Labor Forcein in Atascocita.
What is the Percentage of People in the Labor Force in Atascocita?
69.8% of People are in the Labor Force in Atascocita.
What is the Unemployment Rate in Atascocita?
Unemployment Rate in Atascocita is 5.0%.