Eastland, TX Map & Demographics
Eastland Map
Eastland Overview
$33,667
PER CAPITA INCOME
$87,323
AVG FAMILY INCOME
$55,802
AVG HOUSEHOLD INCOME
16.0%
WAGE / INCOME GAP [ % ]
84.0¢/ $1
WAGE / INCOME GAP [ $ ]
0.50
INEQUALITY / GINI INDEX
3,627
TOTAL POPULATION
1,517
MALE POPULATION
2,110
FEMALE POPULATION
71.90
MALES / 100 FEMALES
139.09
FEMALES / 100 MALES
44.7
MEDIAN AGE
2.8
AVG FAMILY SIZE
2.3
AVG HOUSEHOLD SIZE
1,705
LABOR FORCE [ PEOPLE ]
56.7%
PERCENT IN LABOR FORCE
4.0%
UNEMPLOYMENT RATE
Eastland Zip Codes
Eastland Area Codes
Income in Eastland
Income Overview in Eastland
Per Capita Income in Eastland is $33,667, while median incomes of families and households are $87,323 and $55,802 respectively.
| Characteristic | Number | Measure |
| Per Capita Income | 3,627 | $33,667 |
| Median Family Income | 979 | $87,323 |
| Mean Family Income | 979 | $99,828 |
| Median Household Income | 1,530 | $55,802 |
| Mean Household Income | 1,530 | $77,255 |
| Income Deficit | 979 | $0 |
| Wage / Income Gap (%) | 3,627 | 15.95% |
| Wage / Income Gap ($) | 3,627 | 84.05¢ per $1 |
| Gini / Inequality Index | 3,627 | 0.50 |
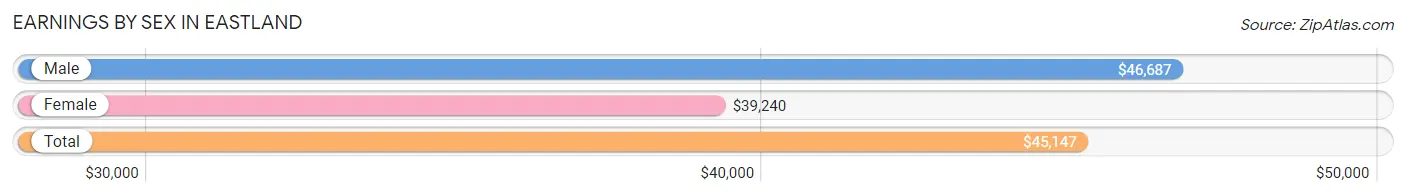
Earnings by Sex in Eastland
Average Earnings in Eastland are $45,147, $46,687 for men and $39,240 for women, a difference of 16.0%.
| Sex | Number | Average Earnings |
| Male | 1,012 (52.6%) | $46,687 |
| Female | 911 (47.4%) | $39,240 |
| Total | 1,923 (100.0%) | $45,147 |
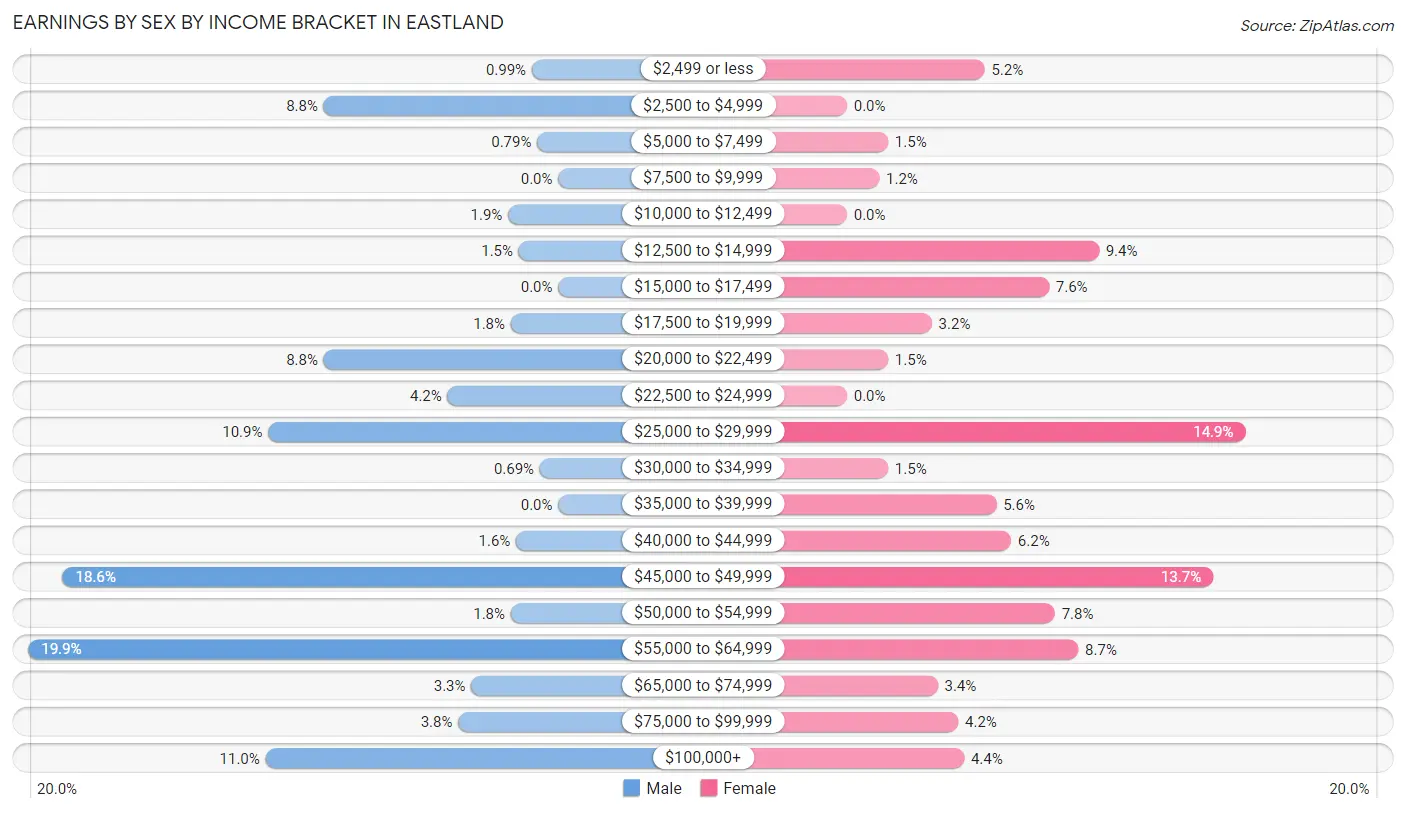
Earnings by Sex by Income Bracket in Eastland
The most common earnings brackets in Eastland are $55,000 to $64,999 for men (201 | 19.9%) and $25,000 to $29,999 for women (136 | 14.9%).
| Income | Male | Female |
| $2,499 or less | 10 (1.0%) | 47 (5.2%) |
| $2,500 to $4,999 | 89 (8.8%) | 0 (0.0%) |
| $5,000 to $7,499 | 8 (0.8%) | 14 (1.5%) |
| $7,500 to $9,999 | 0 (0.0%) | 11 (1.2%) |
| $10,000 to $12,499 | 19 (1.9%) | 0 (0.0%) |
| $12,500 to $14,999 | 15 (1.5%) | 86 (9.4%) |
| $15,000 to $17,499 | 0 (0.0%) | 69 (7.6%) |
| $17,500 to $19,999 | 18 (1.8%) | 29 (3.2%) |
| $20,000 to $22,499 | 89 (8.8%) | 14 (1.5%) |
| $22,500 to $24,999 | 42 (4.2%) | 0 (0.0%) |
| $25,000 to $29,999 | 110 (10.9%) | 136 (14.9%) |
| $30,000 to $34,999 | 7 (0.7%) | 14 (1.5%) |
| $35,000 to $39,999 | 0 (0.0%) | 51 (5.6%) |
| $40,000 to $44,999 | 16 (1.6%) | 56 (6.1%) |
| $45,000 to $49,999 | 188 (18.6%) | 125 (13.7%) |
| $50,000 to $54,999 | 18 (1.8%) | 71 (7.8%) |
| $55,000 to $64,999 | 201 (19.9%) | 79 (8.7%) |
| $65,000 to $74,999 | 33 (3.3%) | 31 (3.4%) |
| $75,000 to $99,999 | 38 (3.7%) | 38 (4.2%) |
| $100,000+ | 111 (11.0%) | 40 (4.4%) |
| Total | 1,012 (100.0%) | 911 (100.0%) |
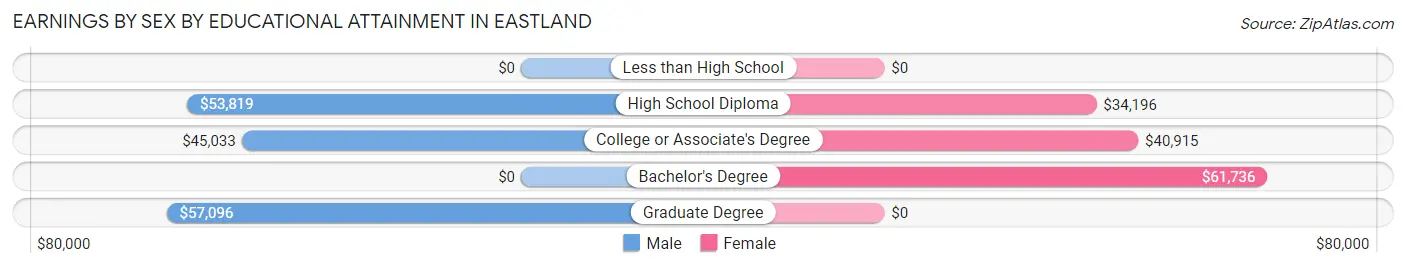
Earnings by Sex by Educational Attainment in Eastland
Average earnings in Eastland are $47,378 for men and $39,559 for women, a difference of 16.5%. Men with an educational attainment of graduate degree enjoy the highest average annual earnings of $57,096, while those with college or associate's degree education earn the least with $45,033. Women with an educational attainment of bachelor's degree earn the most with the average annual earnings of $61,736, while those with high school diploma education have the smallest earnings of $34,196.
| Educational Attainment | Male Income | Female Income |
| Less than High School | - | - |
| High School Diploma | $53,819 | $34,196 |
| College or Associate's Degree | $45,033 | $40,915 |
| Bachelor's Degree | - | - |
| Graduate Degree | $57,096 | $0 |
| Total | $47,378 | $39,559 |
Family Income in Eastland
Family Income Brackets in Eastland
According to the Eastland family income data, there are 267 families falling into the $100,000 to $149,999 income range, which is the most common income bracket and makes up 27.3% of all families.
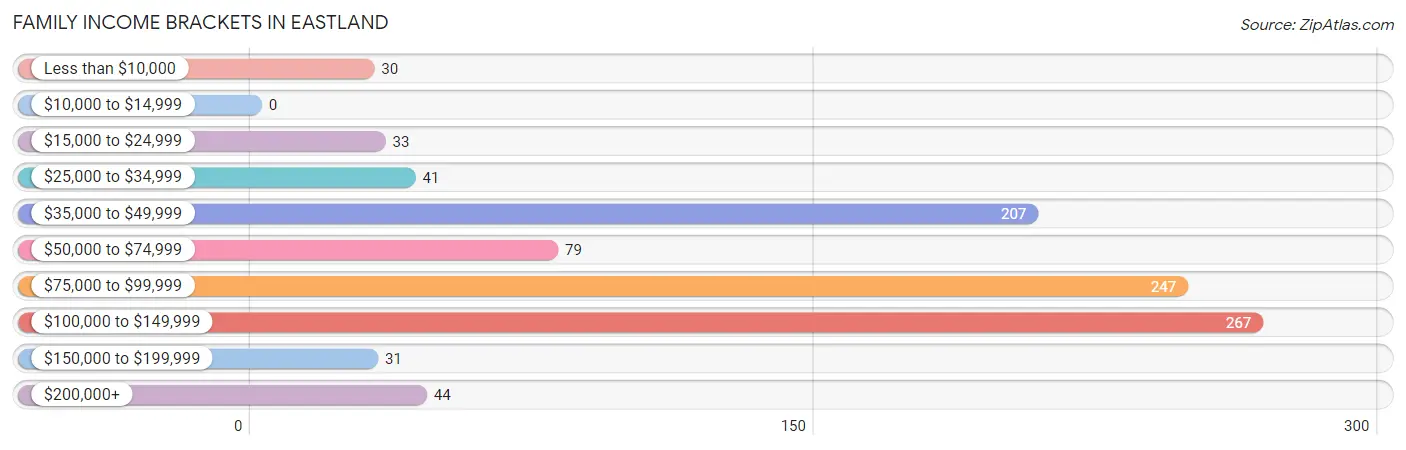
| Income Bracket | # Families | % Families |
| Less than $10,000 | 30 | 3.1% |
| $10,000 to $14,999 | 0 | 0.0% |
| $15,000 to $24,999 | 33 | 3.4% |
| $25,000 to $34,999 | 41 | 4.2% |
| $35,000 to $49,999 | 207 | 21.1% |
| $50,000 to $74,999 | 79 | 8.1% |
| $75,000 to $99,999 | 247 | 25.2% |
| $100,000 to $149,999 | 267 | 27.3% |
| $150,000 to $199,999 | 31 | 3.2% |
| $200,000+ | 44 | 4.5% |
Family Income by Famaliy Size in Eastland
3-person families (163 | 16.7%) account for the highest median family income in Eastland with $110,521 per family, while 2-person families (566 | 57.8%) have the highest median income of $42,582 per family member.
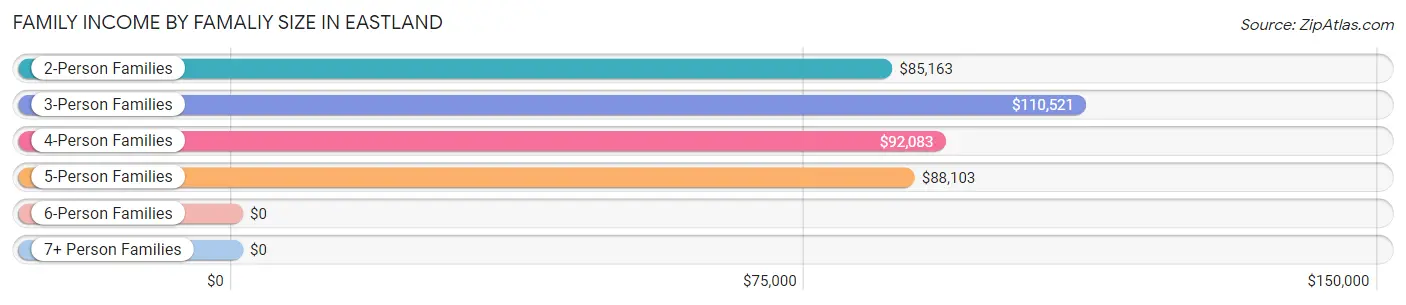
| Income Bracket | # Families | Median Income |
| 2-Person Families | 566 (57.8%) | $85,163 |
| 3-Person Families | 163 (16.7%) | $110,521 |
| 4-Person Families | 140 (14.3%) | $92,083 |
| 5-Person Families | 110 (11.2%) | $88,103 |
| 6-Person Families | 0 (0.0%) | $0 |
| 7+ Person Families | 0 (0.0%) | $0 |
| Total | 979 (100.0%) | $87,323 |
Family Income by Number of Earners in Eastland
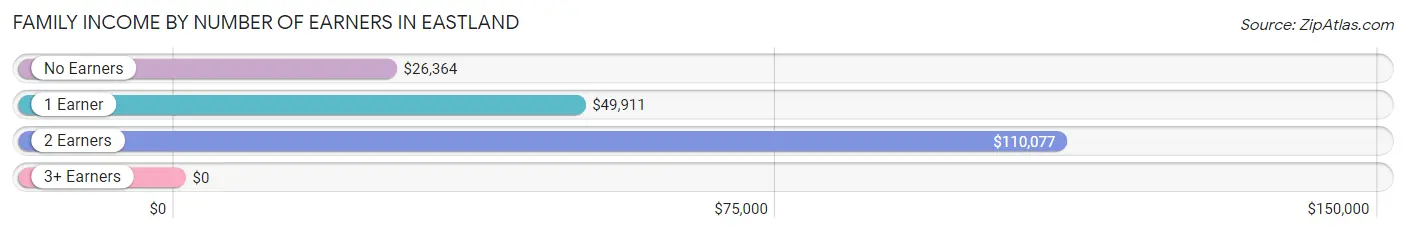
| Number of Earners | # Families | Median Income |
| No Earners | 68 (7.0%) | $26,364 |
| 1 Earner | 311 (31.8%) | $49,911 |
| 2 Earners | 594 (60.7%) | $110,077 |
| 3+ Earners | 6 (0.6%) | $0 |
| Total | 979 (100.0%) | $87,323 |
Household Income in Eastland
Household Income Brackets in Eastland
With 268 households falling in the category, the $100,000 to $149,999 income range is the most frequent in Eastland, accounting for 17.5% of all households. In contrast, only 31 households (2.0%) fall into the $150,000 to $199,999 income bracket, making it the least populous group.
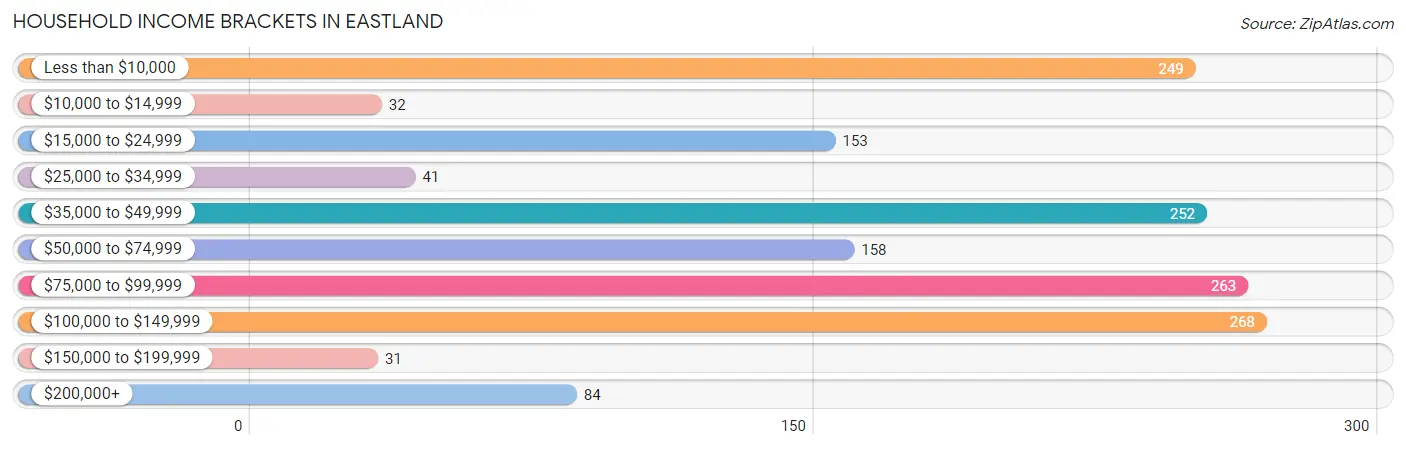
| Income Bracket | # Households | % Households |
| Less than $10,000 | 249 | 16.3% |
| $10,000 to $14,999 | 32 | 2.1% |
| $15,000 to $24,999 | 153 | 10.0% |
| $25,000 to $34,999 | 41 | 2.7% |
| $35,000 to $49,999 | 252 | 16.5% |
| $50,000 to $74,999 | 158 | 10.3% |
| $75,000 to $99,999 | 263 | 17.2% |
| $100,000 to $149,999 | 268 | 17.5% |
| $150,000 to $199,999 | 31 | 2.0% |
| $200,000+ | 84 | 5.5% |
Household Income by Householder Age in Eastland
The median household income in Eastland is $55,802, with the highest median household income of $86,373 found in the 45 to 64 years age bracket for the primary householder. A total of 453 households (29.6%) fall into this category. Meanwhile, the 15 to 24 years age bracket for the primary householder has the lowest median household income of $0, with 16 households (1.1%) in this group.
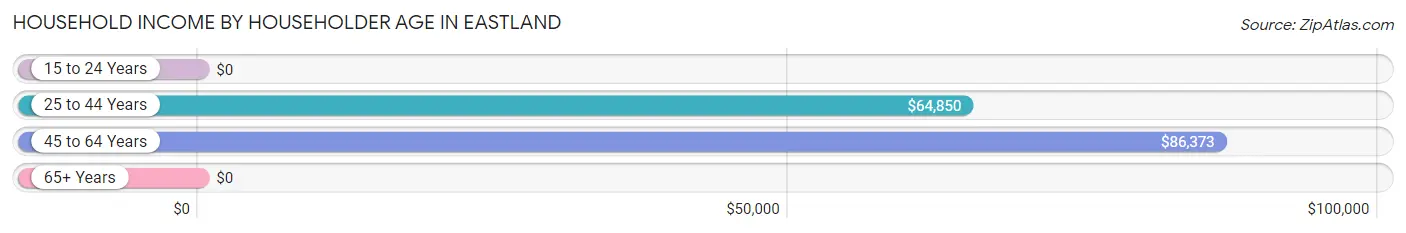
| Income Bracket | # Households | Median Income |
| 15 to 24 Years | 16 (1.1%) | $0 |
| 25 to 44 Years | 468 (30.6%) | $64,850 |
| 45 to 64 Years | 453 (29.6%) | $86,373 |
| 65+ Years | 593 (38.8%) | $0 |
| Total | 1,530 (100.0%) | $55,802 |
Poverty in Eastland
Income Below Poverty by Sex and Age in Eastland
With 16.0% poverty level for males and 16.2% for females among the residents of Eastland, 16 and 17 year old males and 65 to 74 year old females are the most vulnerable to poverty, with 19 males (100.0%) and 179 females (51.3%) in their respective age groups living below the poverty level.
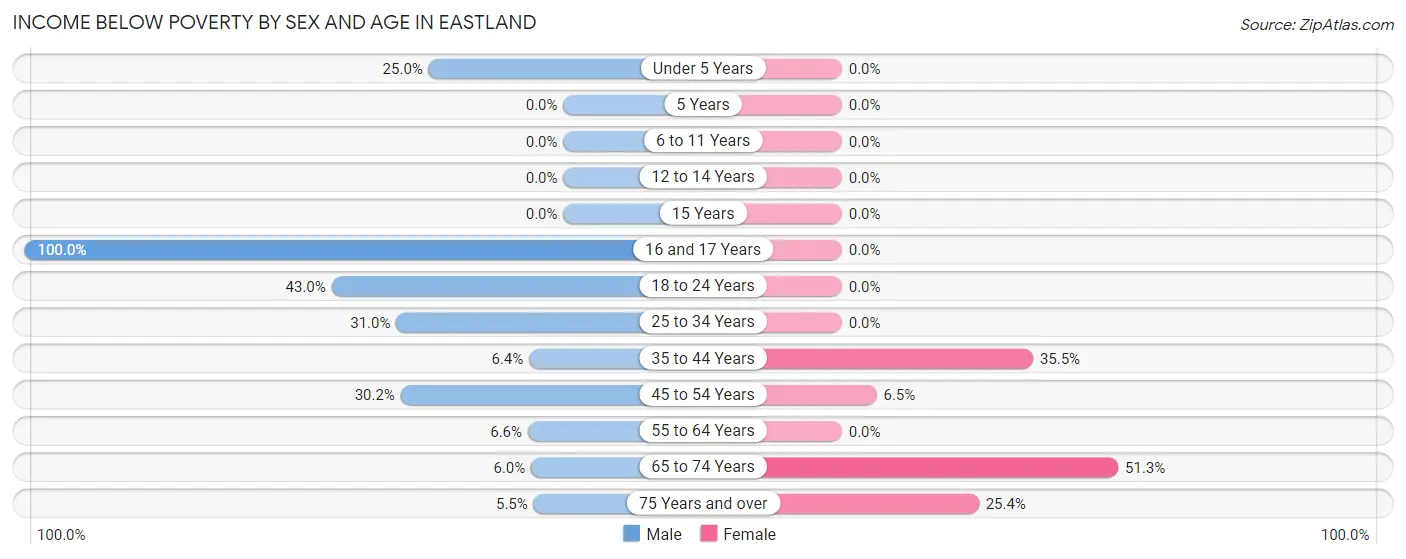
| Age Bracket | Male | Female |
| Under 5 Years | 13 (25.0%) | 0 (0.0%) |
| 5 Years | 0 (0.0%) | 0 (0.0%) |
| 6 to 11 Years | 0 (0.0%) | 0 (0.0%) |
| 12 to 14 Years | 0 (0.0%) | 0 (0.0%) |
| 15 Years | 0 (0.0%) | 0 (0.0%) |
| 16 and 17 Years | 19 (100.0%) | 0 (0.0%) |
| 18 to 24 Years | 37 (43.0%) | 0 (0.0%) |
| 25 to 34 Years | 62 (31.0%) | 0 (0.0%) |
| 35 to 44 Years | 16 (6.4%) | 99 (35.5%) |
| 45 to 54 Years | 48 (30.2%) | 10 (6.5%) |
| 55 to 64 Years | 18 (6.6%) | 0 (0.0%) |
| 65 to 74 Years | 14 (6.0%) | 179 (51.3%) |
| 75 Years and over | 8 (5.5%) | 46 (25.4%) |
| Total | 235 (16.0%) | 334 (16.2%) |
Income Above Poverty by Sex and Age in Eastland
According to the poverty statistics in Eastland, males aged 6 to 11 years and females aged under 5 years are the age groups that are most secure financially, with 100.0% of males and 100.0% of females in these age groups living above the poverty line.
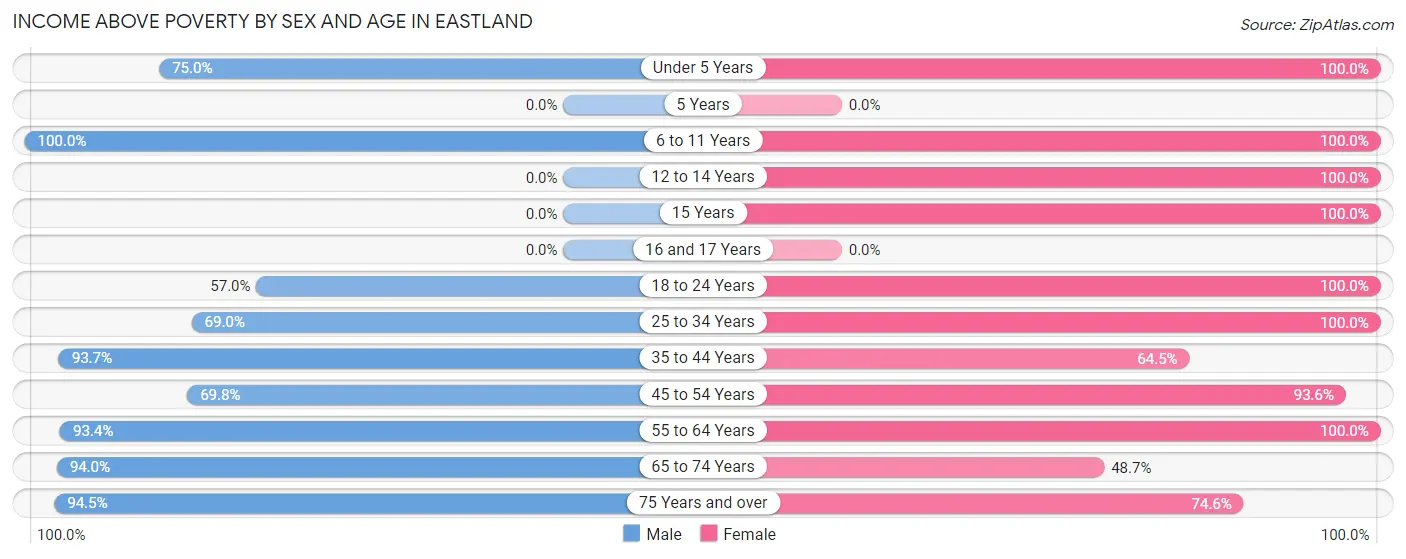
| Age Bracket | Male | Female |
| Under 5 Years | 39 (75.0%) | 196 (100.0%) |
| 5 Years | 0 (0.0%) | 0 (0.0%) |
| 6 to 11 Years | 46 (100.0%) | 129 (100.0%) |
| 12 to 14 Years | 0 (0.0%) | 84 (100.0%) |
| 15 Years | 0 (0.0%) | 112 (100.0%) |
| 16 and 17 Years | 0 (0.0%) | 0 (0.0%) |
| 18 to 24 Years | 49 (57.0%) | 45 (100.0%) |
| 25 to 34 Years | 138 (69.0%) | 284 (100.0%) |
| 35 to 44 Years | 236 (93.6%) | 180 (64.5%) |
| 45 to 54 Years | 111 (69.8%) | 145 (93.5%) |
| 55 to 64 Years | 255 (93.4%) | 247 (100.0%) |
| 65 to 74 Years | 220 (94.0%) | 170 (48.7%) |
| 75 Years and over | 137 (94.5%) | 135 (74.6%) |
| Total | 1,231 (84.0%) | 1,727 (83.8%) |
Income Below Poverty Among Married-Couple Families in Eastland
The poverty statistics for married-couple families in Eastland show that 2.0% or 14 of the total 691 families live below the poverty line. Families with no children have the highest poverty rate of 3.2%, comprising of 14 families. On the other hand, families with 1 or 2 children have the lowest poverty rate of 0.0%, which includes 0 families.
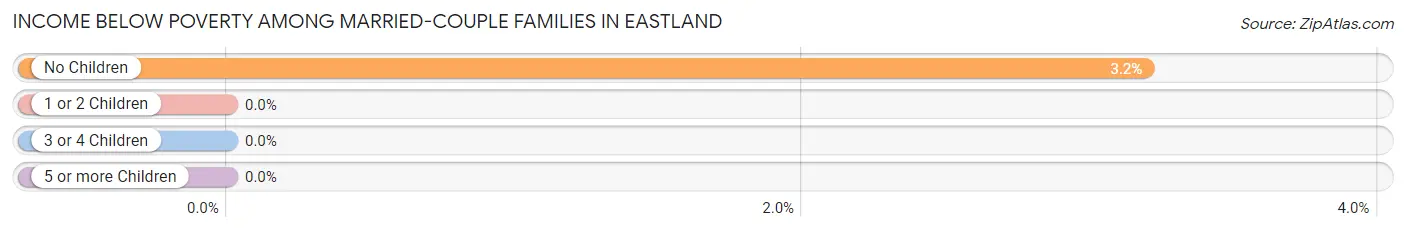
| Children | Above Poverty | Below Poverty |
| No Children | 425 (96.8%) | 14 (3.2%) |
| 1 or 2 Children | 160 (100.0%) | 0 (0.0%) |
| 3 or 4 Children | 92 (100.0%) | 0 (0.0%) |
| 5 or more Children | 0 (0.0%) | 0 (0.0%) |
| Total | 677 (98.0%) | 14 (2.0%) |
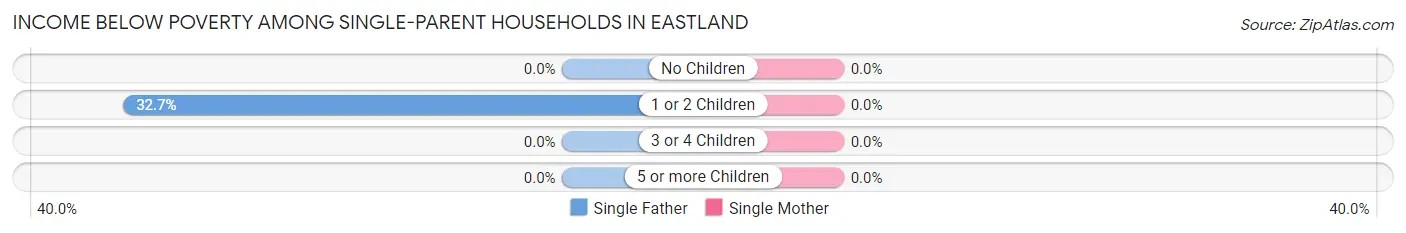
Income Below Poverty Among Single-Parent Households in Eastland
| Children | Single Father | Single Mother |
| No Children | 0 (0.0%) | 0 (0.0%) |
| 1 or 2 Children | 16 (32.7%) | 0 (0.0%) |
| 3 or 4 Children | 0 (0.0%) | 0 (0.0%) |
| 5 or more Children | 0 (0.0%) | 0 (0.0%) |
| Total | 16 (14.0%) | 0 (0.0%) |
Income Below Poverty Among Married-Couple vs Single-Parent Households in Eastland
The poverty data for Eastland shows that 14 of the married-couple family households (2.0%) and 16 of the single-parent households (5.6%) are living below the poverty level. Within the married-couple family households, those with no children have the highest poverty rate, with 14 households (3.2%) falling below the poverty line. Among the single-parent households, those with 1 or 2 children have the highest poverty rate, with 16 household (11.4%) living below poverty.
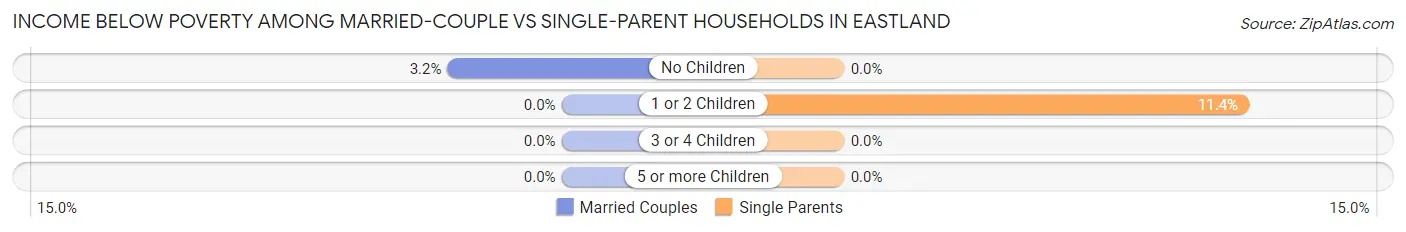
| Children | Married-Couple Families | Single-Parent Households |
| No Children | 14 (3.2%) | 0 (0.0%) |
| 1 or 2 Children | 0 (0.0%) | 16 (11.4%) |
| 3 or 4 Children | 0 (0.0%) | 0 (0.0%) |
| 5 or more Children | 0 (0.0%) | 0 (0.0%) |
| Total | 14 (2.0%) | 16 (5.6%) |
Race in Eastland
The most populous races in Eastland are White / Caucasian (3,134 | 86.4%), Hispanic or Latino (469 | 12.9%), and Two or more Races (312 | 8.6%).
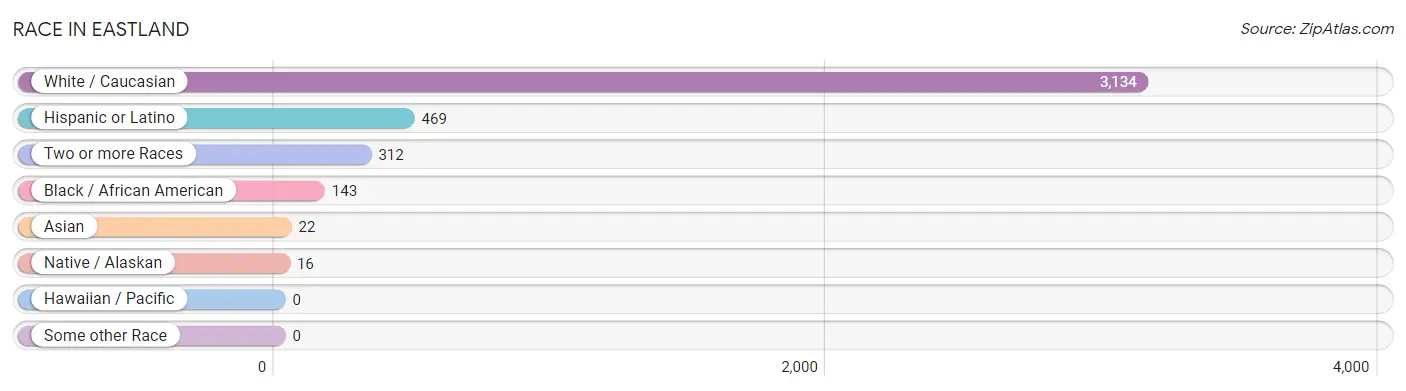
| Race | # Population | % Population |
| Asian | 22 | 0.6% |
| Black / African American | 143 | 3.9% |
| Hawaiian / Pacific | 0 | 0.0% |
| Hispanic or Latino | 469 | 12.9% |
| Native / Alaskan | 16 | 0.4% |
| White / Caucasian | 3,134 | 86.4% |
| Two or more Races | 312 | 8.6% |
| Some other Race | 0 | 0.0% |
| Total | 3,627 | 100.0% |
Ancestry in Eastland
The most populous ancestries reported in Eastland are European (642 | 17.7%), English (570 | 15.7%), German (401 | 11.1%), Mexican (360 | 9.9%), and Irish (302 | 8.3%), together accounting for 62.7% of all Eastland residents.
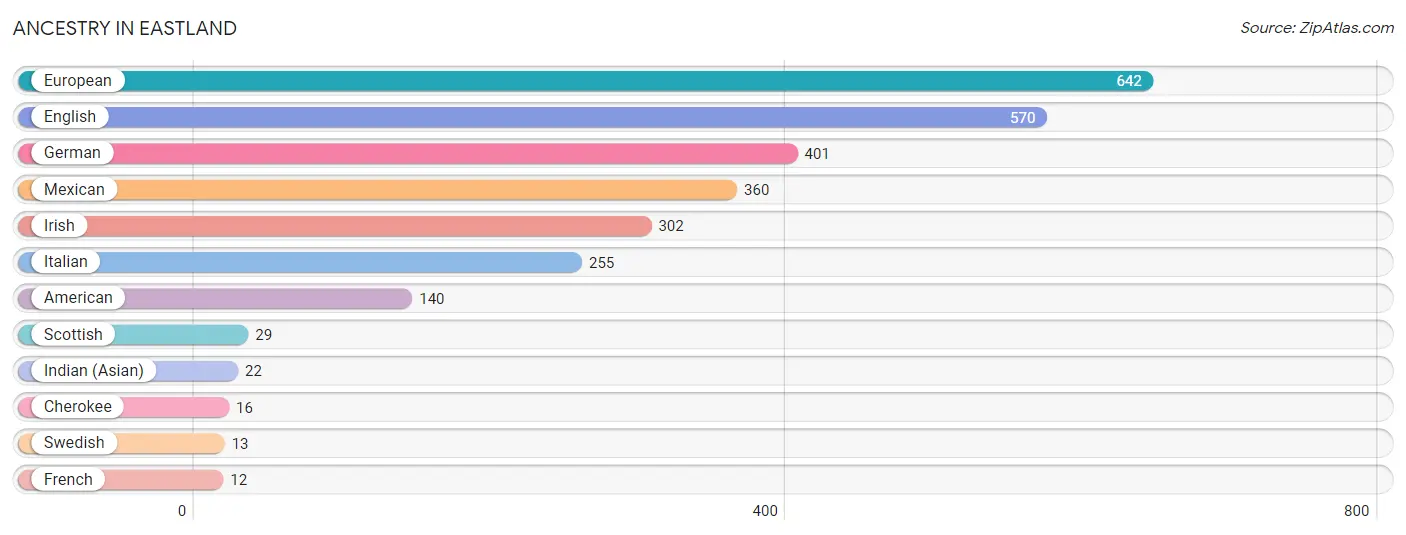
| Ancestry | # Population | % Population |
| American | 140 | 3.9% |
| Cherokee | 16 | 0.4% |
| English | 570 | 15.7% |
| European | 642 | 17.7% |
| French | 12 | 0.3% |
| German | 401 | 11.1% |
| Indian (Asian) | 22 | 0.6% |
| Irish | 302 | 8.3% |
| Italian | 255 | 7.0% |
| Mexican | 360 | 9.9% |
| Scottish | 29 | 0.8% |
| Swedish | 13 | 0.4% | View All 12 Rows |
Immigrants in Eastland
The most numerous immigrant groups reported in Eastland came from Central America (31 | 0.9%), Latin America (31 | 0.9%), Mexico (31 | 0.9%), Asia (22 | 0.6%), and China (22 | 0.6%), together accounting for 3.8% of all Eastland residents.
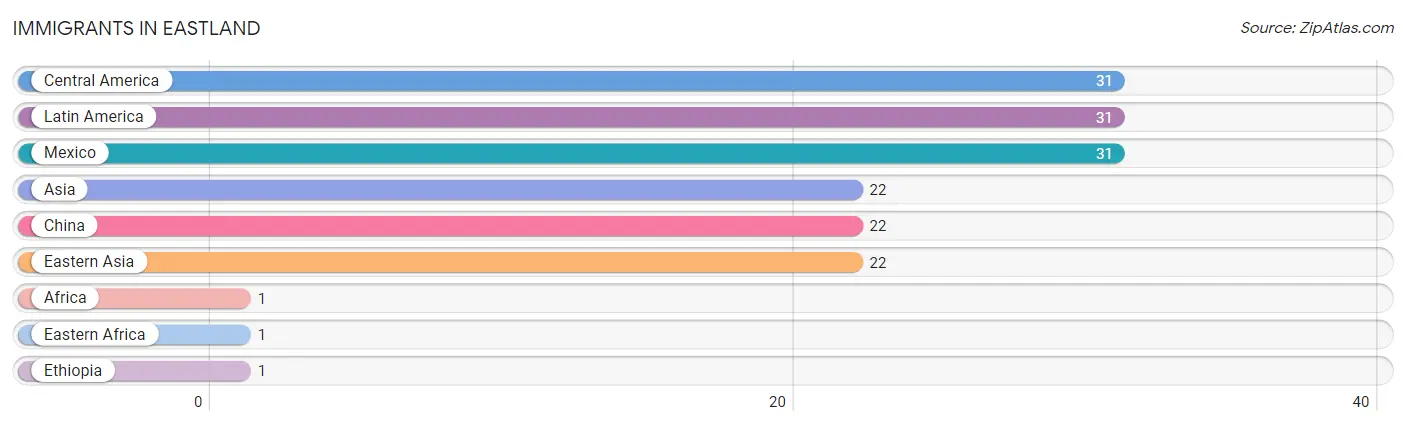
| Immigration Origin | # Population | % Population |
| Africa | 1 | 0.0% |
| Asia | 22 | 0.6% |
| Central America | 31 | 0.9% |
| China | 22 | 0.6% |
| Eastern Africa | 1 | 0.0% |
| Eastern Asia | 22 | 0.6% |
| Ethiopia | 1 | 0.0% |
| Latin America | 31 | 0.9% |
| Mexico | 31 | 0.9% | View All 9 Rows |
Sex and Age in Eastland
Sex and Age in Eastland
The most populous age groups in Eastland are 60 to 64 Years (264 | 17.4%) for men and 70 to 74 Years (263 | 12.5%) for women.
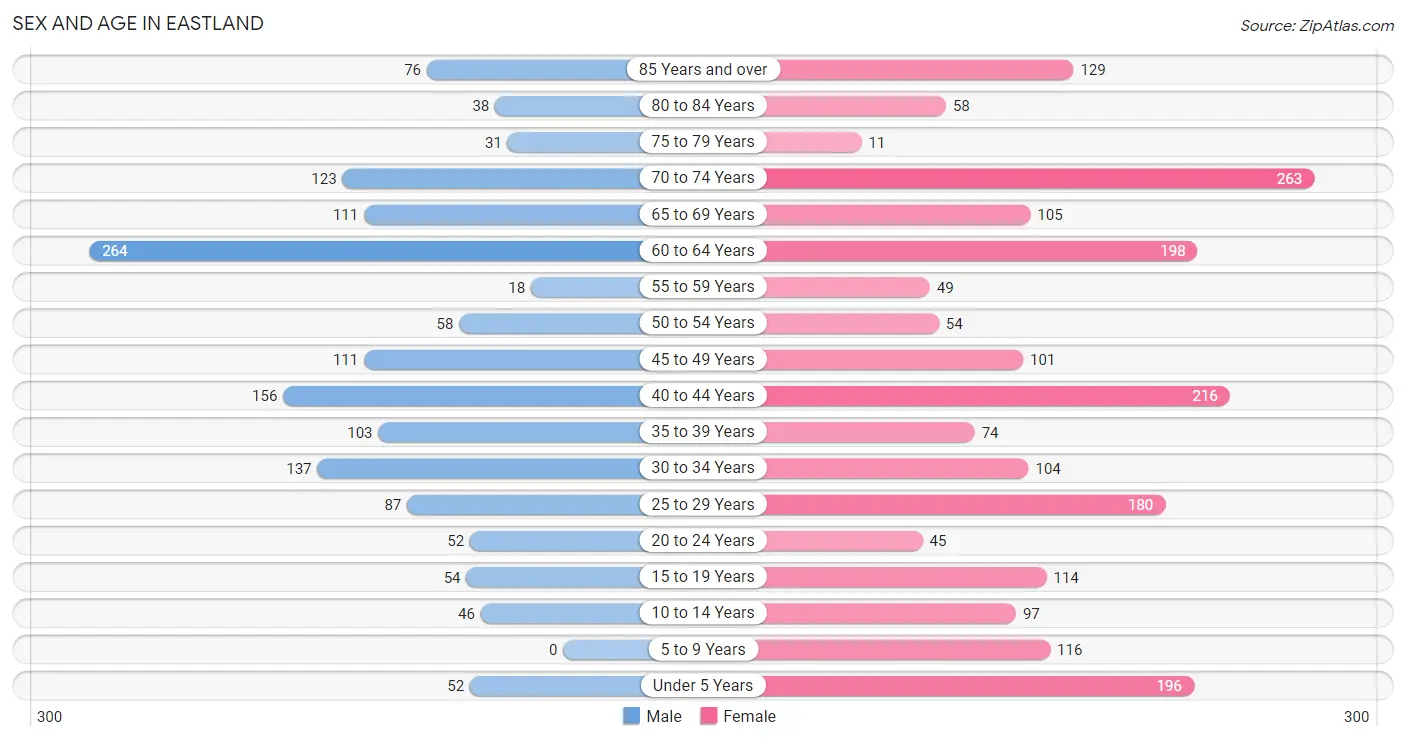
| Age Bracket | Male | Female |
| Under 5 Years | 52 (3.4%) | 196 (9.3%) |
| 5 to 9 Years | 0 (0.0%) | 116 (5.5%) |
| 10 to 14 Years | 46 (3.0%) | 97 (4.6%) |
| 15 to 19 Years | 54 (3.6%) | 114 (5.4%) |
| 20 to 24 Years | 52 (3.4%) | 45 (2.1%) |
| 25 to 29 Years | 87 (5.7%) | 180 (8.5%) |
| 30 to 34 Years | 137 (9.0%) | 104 (4.9%) |
| 35 to 39 Years | 103 (6.8%) | 74 (3.5%) |
| 40 to 44 Years | 156 (10.3%) | 216 (10.2%) |
| 45 to 49 Years | 111 (7.3%) | 101 (4.8%) |
| 50 to 54 Years | 58 (3.8%) | 54 (2.6%) |
| 55 to 59 Years | 18 (1.2%) | 49 (2.3%) |
| 60 to 64 Years | 264 (17.4%) | 198 (9.4%) |
| 65 to 69 Years | 111 (7.3%) | 105 (5.0%) |
| 70 to 74 Years | 123 (8.1%) | 263 (12.5%) |
| 75 to 79 Years | 31 (2.0%) | 11 (0.5%) |
| 80 to 84 Years | 38 (2.5%) | 58 (2.8%) |
| 85 Years and over | 76 (5.0%) | 129 (6.1%) |
| Total | 1,517 (100.0%) | 2,110 (100.0%) |
Families and Households in Eastland
Median Family Size in Eastland
The median family size in Eastland is 2.79 persons per family, with married-couple families (691 | 70.6%) accounting for the largest median family size of 2.91 persons per family. On the other hand, single male/father families (114 | 11.6%) represent the smallest median family size with 2.34 persons per family.
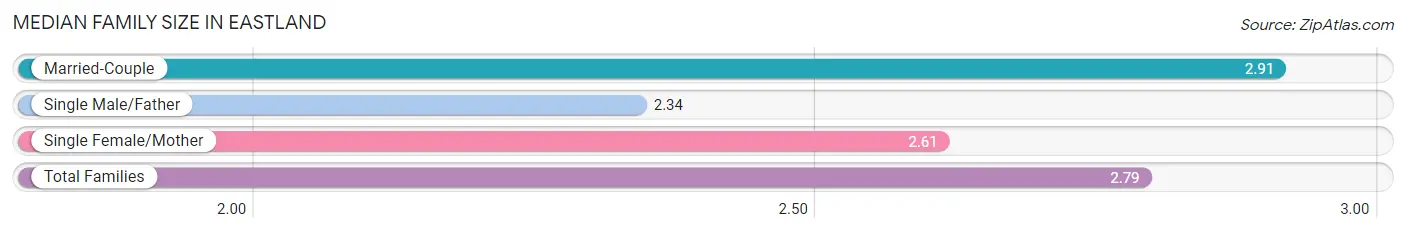
| Family Type | # Families | Family Size |
| Married-Couple | 691 (70.6%) | 2.91 |
| Single Male/Father | 114 (11.6%) | 2.34 |
| Single Female/Mother | 174 (17.8%) | 2.61 |
| Total Families | 979 (100.0%) | 2.79 |
Median Household Size in Eastland
The median household size in Eastland is 2.27 persons per household, with married-couple households (691 | 45.2%) accounting for the largest median household size of 2.91 persons per household. non-family households (551 | 36.0%) represent the smallest median household size with 1.29 persons per household.
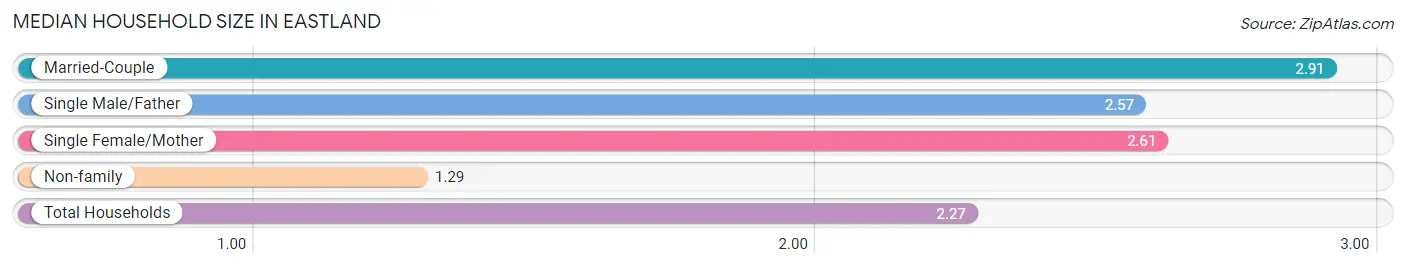
| Household Type | # Households | Household Size |
| Married-Couple | 691 (45.2%) | 2.91 |
| Single Male/Father | 114 (7.4%) | 2.57 |
| Single Female/Mother | 174 (11.4%) | 2.61 |
| Non-family | 551 (36.0%) | 1.29 |
| Total Households | 1,530 (100.0%) | 2.27 |
Household Size by Marriage Status in Eastland
Out of a total of 1,530 households in Eastland, 979 (64.0%) are family households, while 551 (36.0%) are nonfamily households. The most numerous type of family households are 2-person households, comprising 533, and the most common type of nonfamily households are 1-person households, comprising 449.
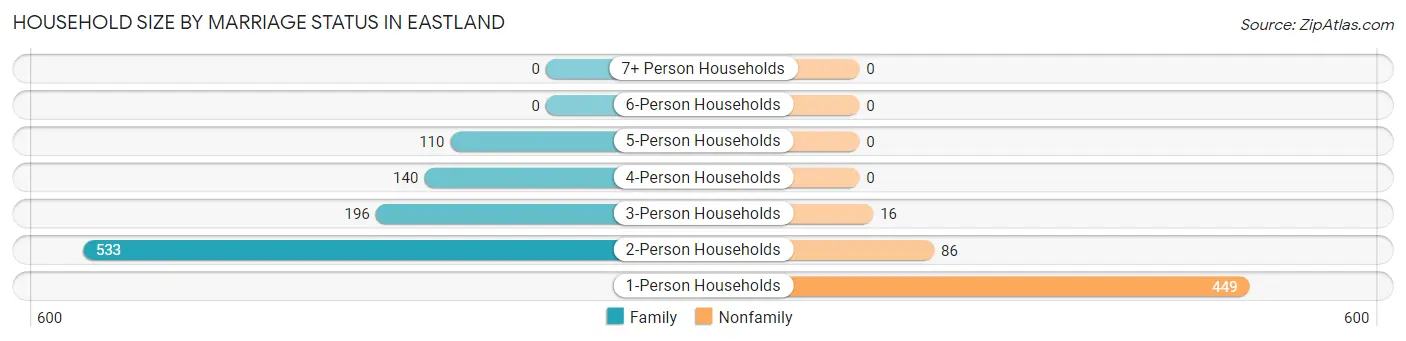
| Household Size | Family Households | Nonfamily Households |
| 1-Person Households | - | 449 (29.3%) |
| 2-Person Households | 533 (34.8%) | 86 (5.6%) |
| 3-Person Households | 196 (12.8%) | 16 (1.1%) |
| 4-Person Households | 140 (9.1%) | 0 (0.0%) |
| 5-Person Households | 110 (7.2%) | 0 (0.0%) |
| 6-Person Households | 0 (0.0%) | 0 (0.0%) |
| 7+ Person Households | 0 (0.0%) | 0 (0.0%) |
| Total | 979 (64.0%) | 551 (36.0%) |
Female Fertility in Eastland
Fertility by Age in Eastland
Average fertility rate in Eastland is 110.0 births per 1,000 women. Women in the age bracket of 20 to 34 years have the highest fertility rate with 249.0 births per 1,000 women. Women in the age bracket of 20 to 34 years acount for 88.2% of all women with births.
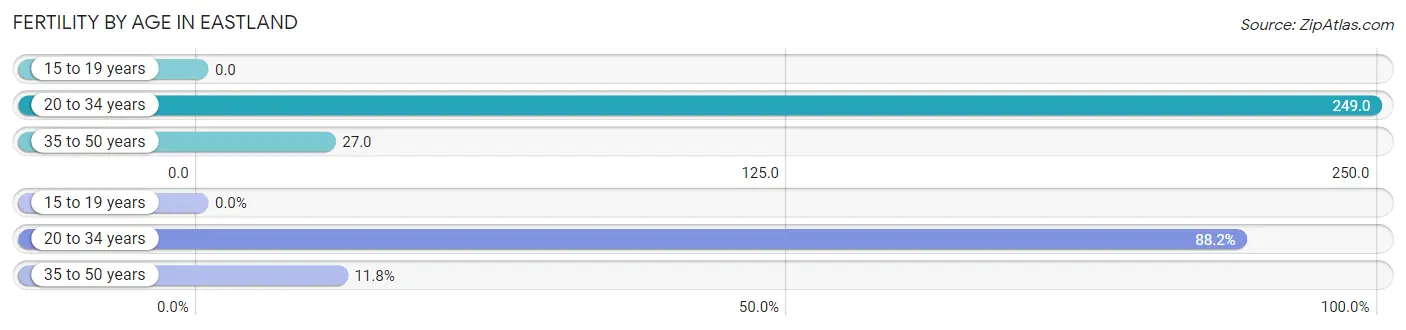
| Age Bracket | Women with Births | Births / 1,000 Women |
| 15 to 19 years | 0 (0.0%) | 0.0 |
| 20 to 34 years | 82 (88.2%) | 249.0 |
| 35 to 50 years | 11 (11.8%) | 27.0 |
| Total | 93 (100.0%) | 110.0 |
Fertility by Age by Marriage Status in Eastland
46.2% of women with births (93) in Eastland are married. The highest percentage of unmarried women with births falls into 20 to 34 years age bracket with 61.0% of them unmarried at the time of birth, while the lowest percentage of unmarried women with births belong to 35 to 50 years age bracket with 0.0% of them unmarried.
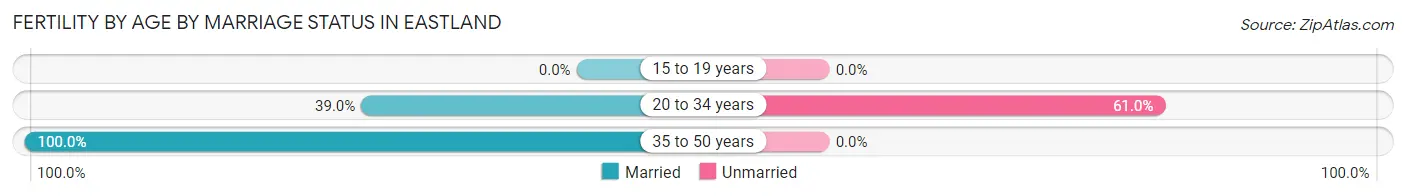
| Age Bracket | Married | Unmarried |
| 15 to 19 years | 0 (0.0%) | 0 (0.0%) |
| 20 to 34 years | 32 (39.0%) | 50 (61.0%) |
| 35 to 50 years | 11 (100.0%) | 0 (0.0%) |
| Total | 43 (46.2%) | 50 (53.8%) |
Fertility by Education in Eastland
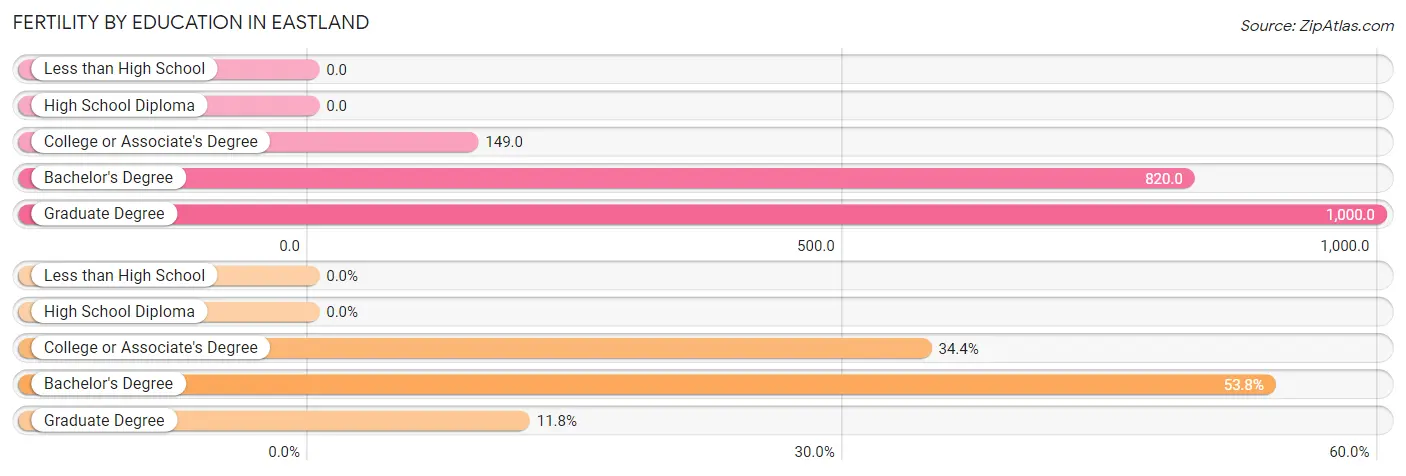
| Educational Attainment | Women with Births | Births / 1,000 Women |
| Less than High School | 0 (0.0%) | 0.0 |
| High School Diploma | 0 (0.0%) | 0.0 |
| College or Associate's Degree | 32 (34.4%) | 149.0 |
| Bachelor's Degree | 50 (53.8%) | 820.0 |
| Graduate Degree | 11 (11.8%) | 1,000.0 |
| Total | 93 (100.0%) | 110.0 |
Fertility by Education by Marriage Status in Eastland
53.8% of women with births in Eastland are unmarried. Women with the educational attainment of college or associate's degree are most likely to be married with 100.0% of them married at childbirth, while women with the educational attainment of bachelor's degree are least likely to be married with 100.0% of them unmarried at childbirth.
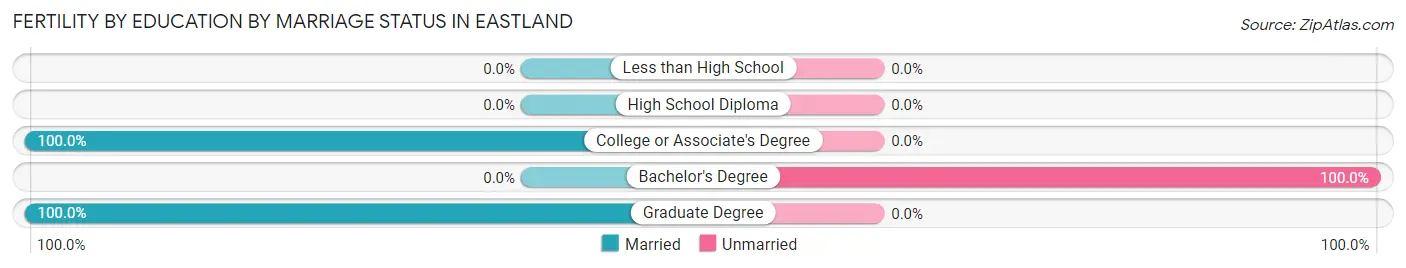
| Educational Attainment | Married | Unmarried |
| Less than High School | 0 (0.0%) | 0 (0.0%) |
| High School Diploma | 0 (0.0%) | 0 (0.0%) |
| College or Associate's Degree | 32 (100.0%) | 0 (0.0%) |
| Bachelor's Degree | 0 (0.0%) | 50 (100.0%) |
| Graduate Degree | 11 (100.0%) | 0 (0.0%) |
| Total | 43 (46.2%) | 50 (53.8%) |
Employment Characteristics in Eastland
Employment by Class of Employer in Eastland
Among the 1,637 employed individuals in Eastland, private company employees (972 | 59.4%), not-for-profit organizations (175 | 10.7%), and local government employees (137 | 8.4%) make up the most common classes of employment.
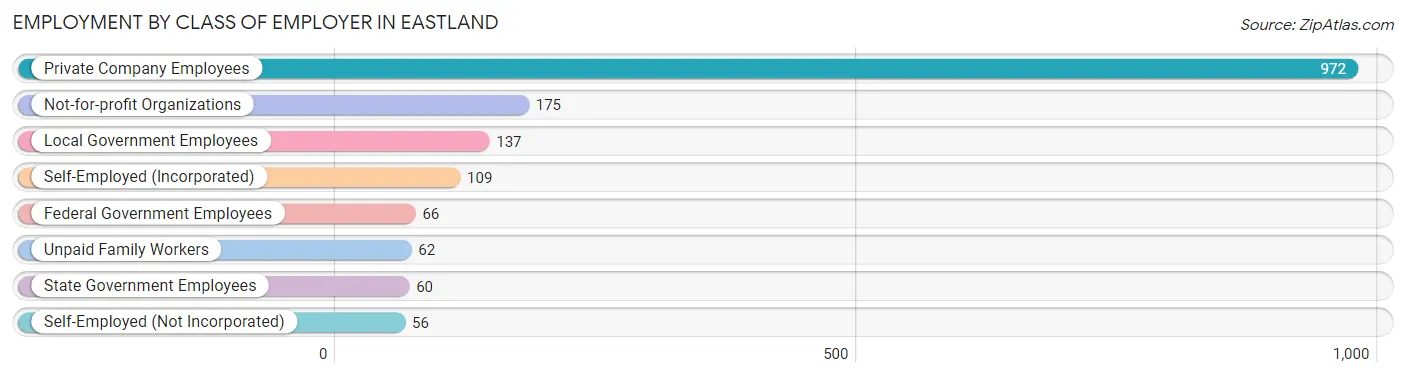
| Employer Class | # Employees | % Employees |
| Private Company Employees | 972 | 59.4% |
| Self-Employed (Incorporated) | 109 | 6.7% |
| Self-Employed (Not Incorporated) | 56 | 3.4% |
| Not-for-profit Organizations | 175 | 10.7% |
| Local Government Employees | 137 | 8.4% |
| State Government Employees | 60 | 3.7% |
| Federal Government Employees | 66 | 4.0% |
| Unpaid Family Workers | 62 | 3.8% |
| Total | 1,637 | 100.0% |
Employment Status by Age in Eastland
According to the labor force statistics for Eastland, out of the total population over 16 years of age (3,007), 56.7% or 1,705 individuals are in the labor force, with 4.0% or 68 of them unemployed. The age group with the highest labor force participation rate is 25 to 29 years, with 91.0% or 243 individuals in the labor force. Within the labor force, the 20 to 24 years age range has the highest percentage of unemployed individuals, with 41.0% or 32 of them being unemployed.
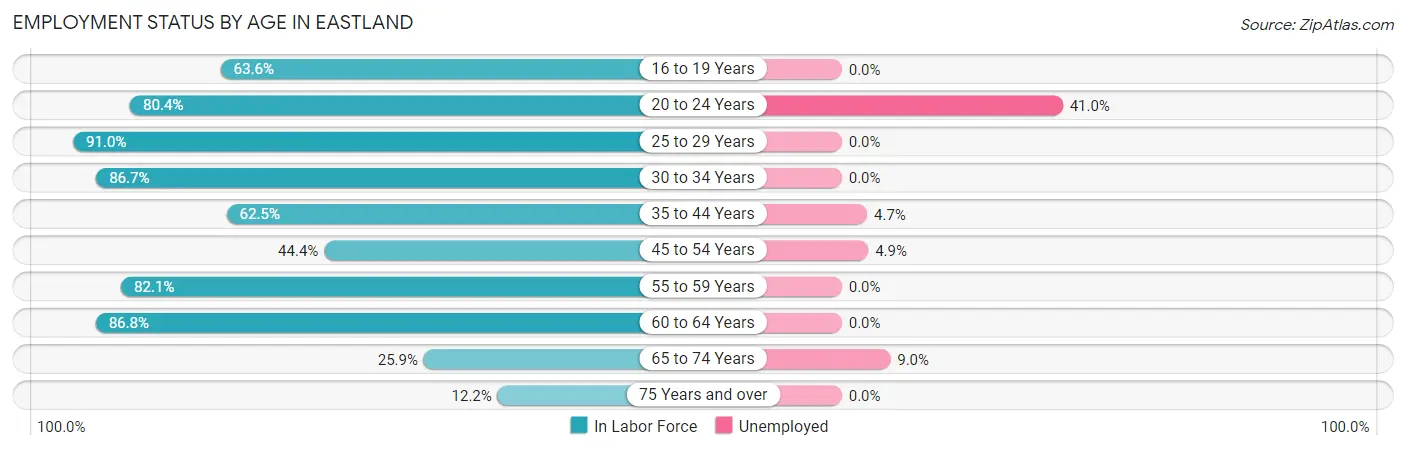
| Age Bracket | In Labor Force | Unemployed |
| 16 to 19 Years | 35 (63.6%) | 0 (0.0%) |
| 20 to 24 Years | 78 (80.4%) | 32 (41.0%) |
| 25 to 29 Years | 243 (91.0%) | 0 (0.0%) |
| 30 to 34 Years | 209 (86.7%) | 0 (0.0%) |
| 35 to 44 Years | 343 (62.5%) | 16 (4.7%) |
| 45 to 54 Years | 144 (44.4%) | 7 (4.9%) |
| 55 to 59 Years | 55 (82.1%) | 0 (0.0%) |
| 60 to 64 Years | 401 (86.8%) | 0 (0.0%) |
| 65 to 74 Years | 156 (25.9%) | 14 (9.0%) |
| 75 Years and over | 42 (12.2%) | 0 (0.0%) |
| Total | 1,705 (56.7%) | 68 (4.0%) |
Employment Status by Educational Attainment in Eastland
According to labor force statistics for Eastland, 73.0% of individuals (1,394) out of the total population between 25 and 64 years of age (1,910) are in the labor force, with 1.6% or 22 of them being unemployed. The group with the highest labor force participation rate are those with the educational attainment of bachelor's degree or higher, with 86.1% or 377 individuals in the labor force. Within the labor force, individuals with less than high school education have the highest percentage of unemployment, with 27.7% or 23 of them being unemployed.
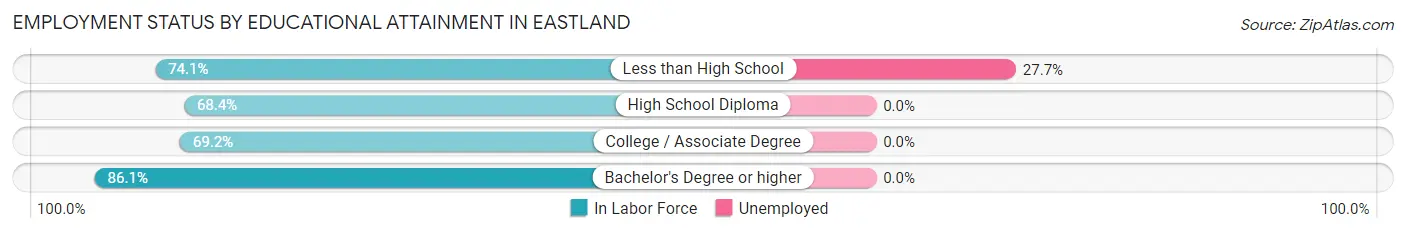
| Educational Attainment | In Labor Force | Unemployed |
| Less than High School | 83 (74.1%) | 31 (27.7%) |
| High School Diploma | 538 (68.4%) | 0 (0.0%) |
| College / Associate Degree | 397 (69.2%) | 0 (0.0%) |
| Bachelor's Degree or higher | 377 (86.1%) | 0 (0.0%) |
| Total | 1,394 (73.0%) | 31 (1.6%) |
Employment Occupations by Sex in Eastland
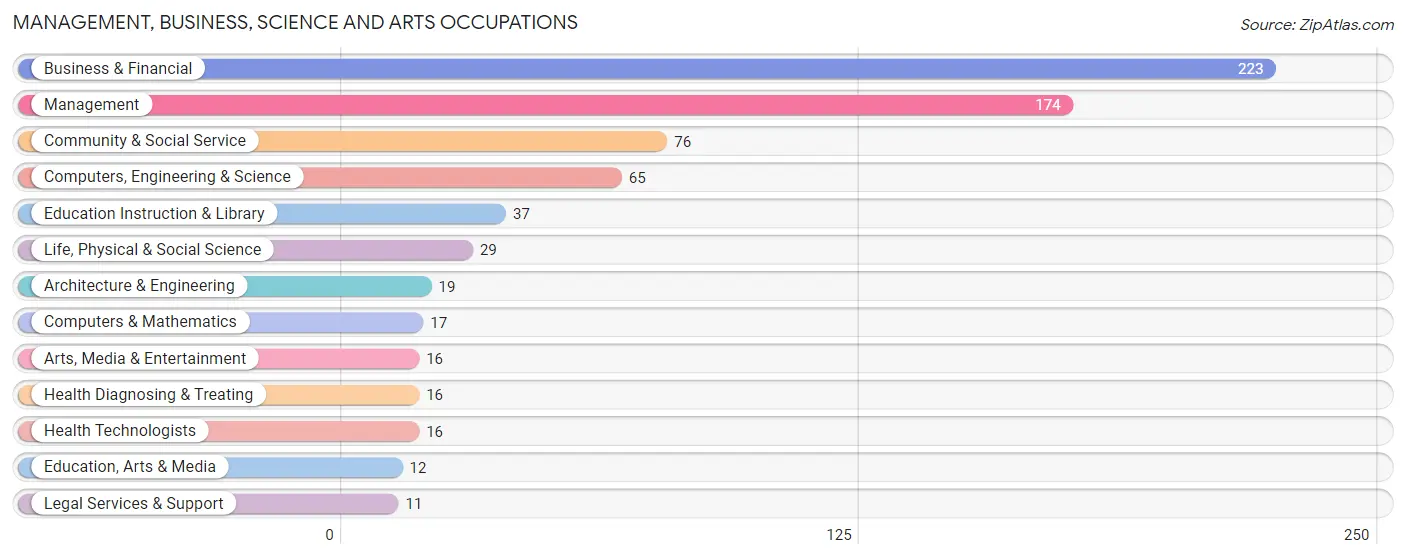
Management, Business, Science and Arts Occupations
The most common Management, Business, Science and Arts occupations in Eastland are Business & Financial (223 | 13.6%), Management (174 | 10.6%), Community & Social Service (76 | 4.6%), Computers, Engineering & Science (65 | 4.0%), and Education Instruction & Library (37 | 2.3%).
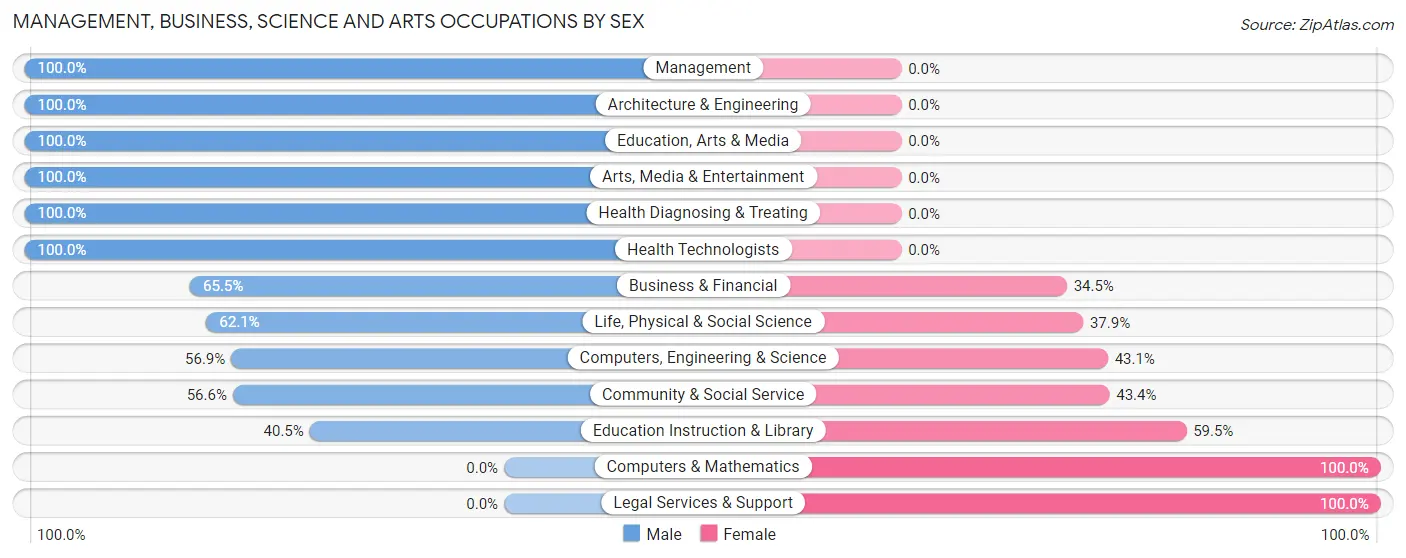
Management, Business, Science and Arts Occupations by Sex
Within the Management, Business, Science and Arts occupations in Eastland, the most male-oriented occupations are Management (100.0%), Architecture & Engineering (100.0%), and Education, Arts & Media (100.0%), while the most female-oriented occupations are Computers & Mathematics (100.0%), Legal Services & Support (100.0%), and Education Instruction & Library (59.5%).
| Occupation | Male | Female |
| Management | 174 (100.0%) | 0 (0.0%) |
| Business & Financial | 146 (65.5%) | 77 (34.5%) |
| Computers, Engineering & Science | 37 (56.9%) | 28 (43.1%) |
| Computers & Mathematics | 0 (0.0%) | 17 (100.0%) |
| Architecture & Engineering | 19 (100.0%) | 0 (0.0%) |
| Life, Physical & Social Science | 18 (62.1%) | 11 (37.9%) |
| Community & Social Service | 43 (56.6%) | 33 (43.4%) |
| Education, Arts & Media | 12 (100.0%) | 0 (0.0%) |
| Legal Services & Support | 0 (0.0%) | 11 (100.0%) |
| Education Instruction & Library | 15 (40.5%) | 22 (59.5%) |
| Arts, Media & Entertainment | 16 (100.0%) | 0 (0.0%) |
| Health Diagnosing & Treating | 16 (100.0%) | 0 (0.0%) |
| Health Technologists | 16 (100.0%) | 0 (0.0%) |
| Total (Category) | 416 (75.1%) | 138 (24.9%) |
| Total (Overall) | 883 (53.9%) | 754 (46.1%) |
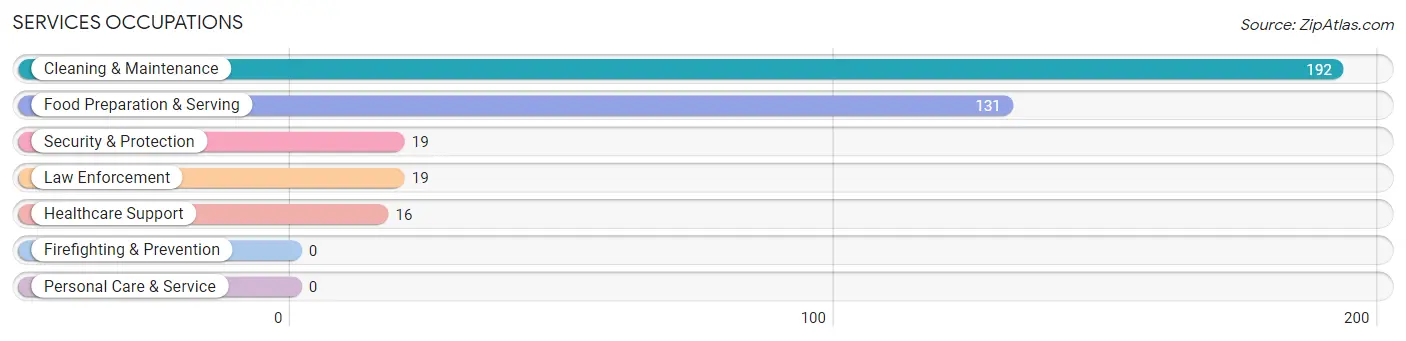
Services Occupations
The most common Services occupations in Eastland are Cleaning & Maintenance (192 | 11.7%), Food Preparation & Serving (131 | 8.0%), Security & Protection (19 | 1.2%), Law Enforcement (19 | 1.2%), and Healthcare Support (16 | 1.0%).
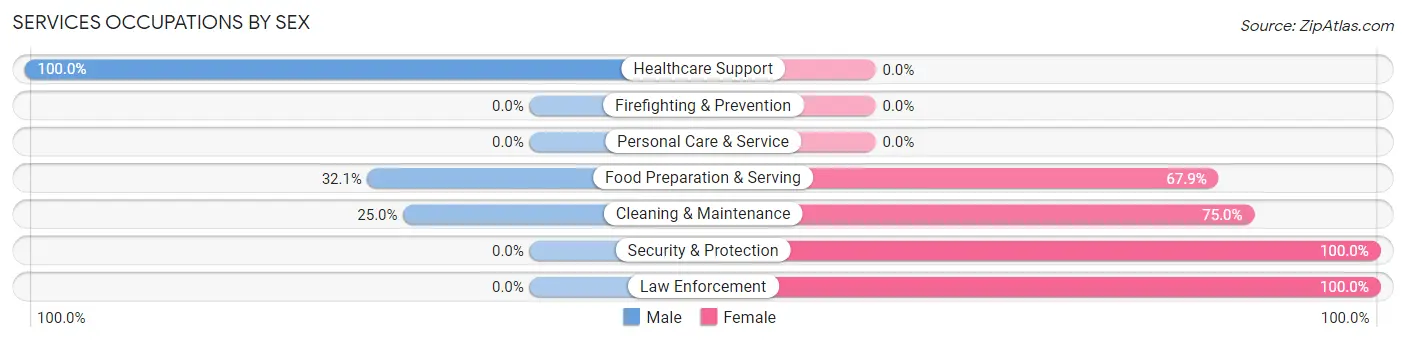
Services Occupations by Sex
Within the Services occupations in Eastland, the most male-oriented occupations are Healthcare Support (100.0%), Food Preparation & Serving (32.1%), and Cleaning & Maintenance (25.0%), while the most female-oriented occupations are Security & Protection (100.0%), Law Enforcement (100.0%), and Cleaning & Maintenance (75.0%).
| Occupation | Male | Female |
| Healthcare Support | 16 (100.0%) | 0 (0.0%) |
| Security & Protection | 0 (0.0%) | 19 (100.0%) |
| Firefighting & Prevention | 0 (0.0%) | 0 (0.0%) |
| Law Enforcement | 0 (0.0%) | 19 (100.0%) |
| Food Preparation & Serving | 42 (32.1%) | 89 (67.9%) |
| Cleaning & Maintenance | 48 (25.0%) | 144 (75.0%) |
| Personal Care & Service | 0 (0.0%) | 0 (0.0%) |
| Total (Category) | 106 (29.6%) | 252 (70.4%) |
| Total (Overall) | 883 (53.9%) | 754 (46.1%) |
Sales and Office Occupations
The most common Sales and Office occupations in Eastland are Office & Administration (258 | 15.8%), and Sales & Related (168 | 10.3%).
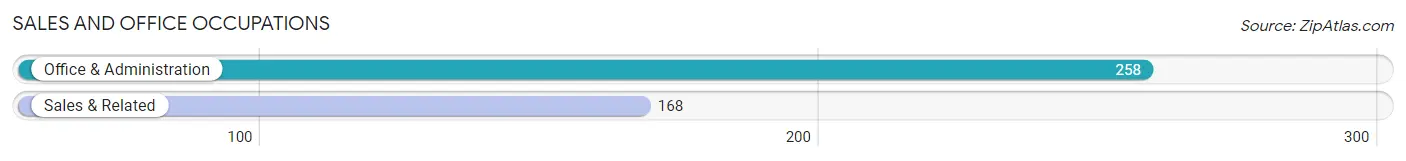
Sales and Office Occupations by Sex

| Occupation | Male | Female |
| Sales & Related | 117 (69.6%) | 51 (30.4%) |
| Office & Administration | 0 (0.0%) | 258 (100.0%) |
| Total (Category) | 117 (27.5%) | 309 (72.5%) |
| Total (Overall) | 883 (53.9%) | 754 (46.1%) |
Natural Resources, Construction and Maintenance Occupations
The most common Natural Resources, Construction and Maintenance occupations in Eastland are Construction & Extraction (49 | 3.0%), and Installation, Maintenance & Repair (9 | 0.5%).
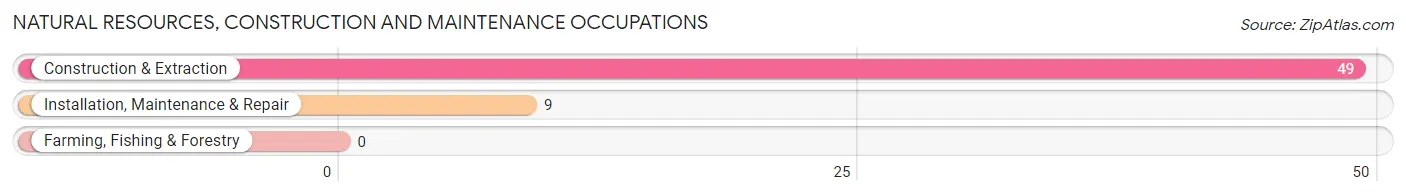
Natural Resources, Construction and Maintenance Occupations by Sex
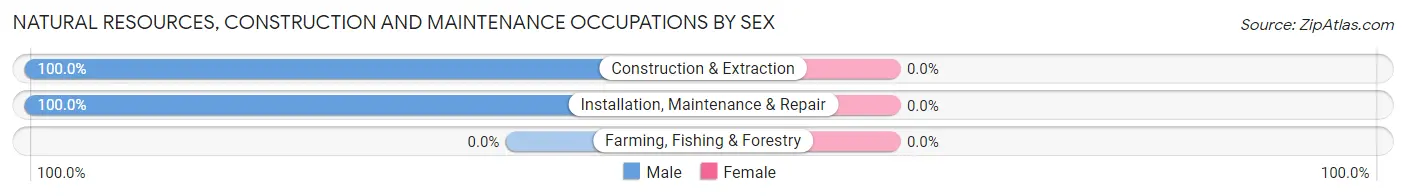
| Occupation | Male | Female |
| Farming, Fishing & Forestry | 0 (0.0%) | 0 (0.0%) |
| Construction & Extraction | 49 (100.0%) | 0 (0.0%) |
| Installation, Maintenance & Repair | 9 (100.0%) | 0 (0.0%) |
| Total (Category) | 58 (100.0%) | 0 (0.0%) |
| Total (Overall) | 883 (53.9%) | 754 (46.1%) |
Production, Transportation and Moving Occupations
The most common Production, Transportation and Moving occupations in Eastland are Production (149 | 9.1%), Transportation (79 | 4.8%), and Material Moving (13 | 0.8%).
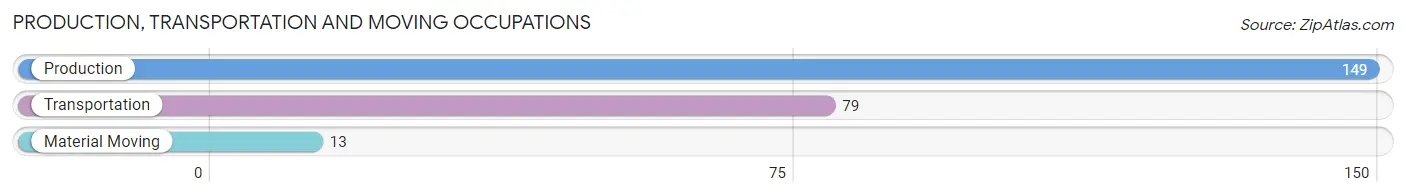
Production, Transportation and Moving Occupations by Sex
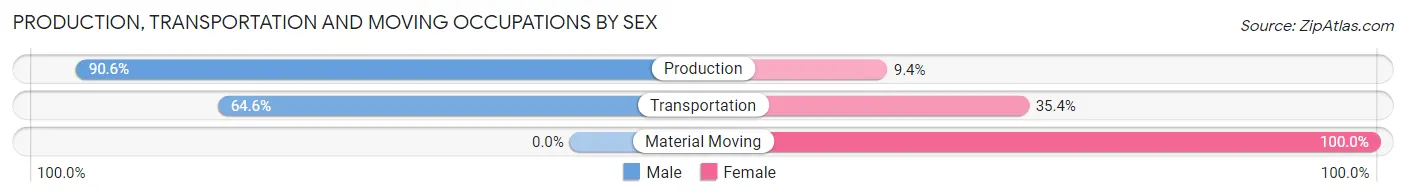
| Occupation | Male | Female |
| Production | 135 (90.6%) | 14 (9.4%) |
| Transportation | 51 (64.6%) | 28 (35.4%) |
| Material Moving | 0 (0.0%) | 13 (100.0%) |
| Total (Category) | 186 (77.2%) | 55 (22.8%) |
| Total (Overall) | 883 (53.9%) | 754 (46.1%) |
Employment Industries by Sex in Eastland
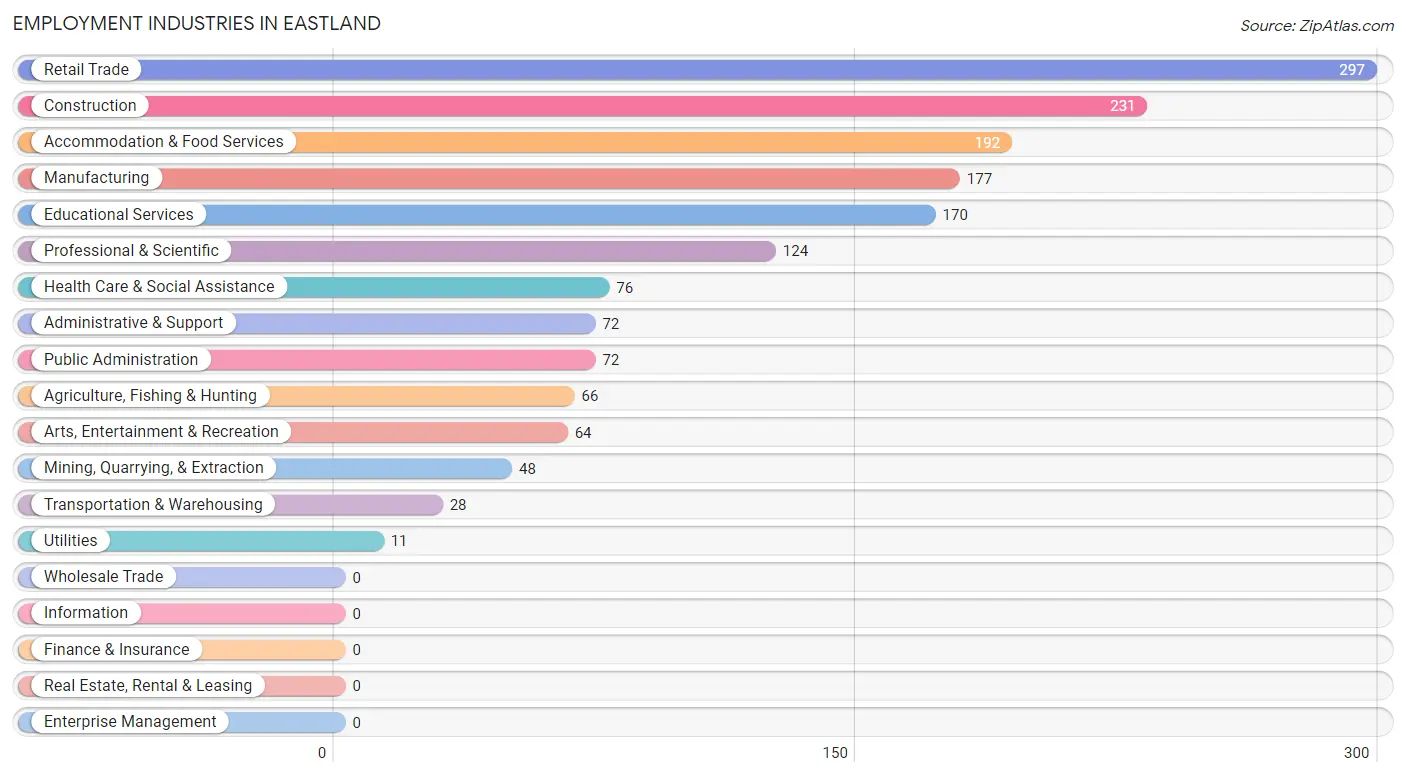
Employment Industries in Eastland
The major employment industries in Eastland include Retail Trade (297 | 18.1%), Construction (231 | 14.1%), Accommodation & Food Services (192 | 11.7%), Manufacturing (177 | 10.8%), and Educational Services (170 | 10.4%).
Employment Industries by Sex in Eastland
The Eastland industries that see more men than women are Agriculture, Fishing & Hunting (100.0%), Mining, Quarrying, & Extraction (100.0%), and Arts, Entertainment & Recreation (100.0%), whereas the industries that tend to have a higher number of women are Transportation & Warehousing (100.0%), Utilities (100.0%), and Administrative & Support (100.0%).
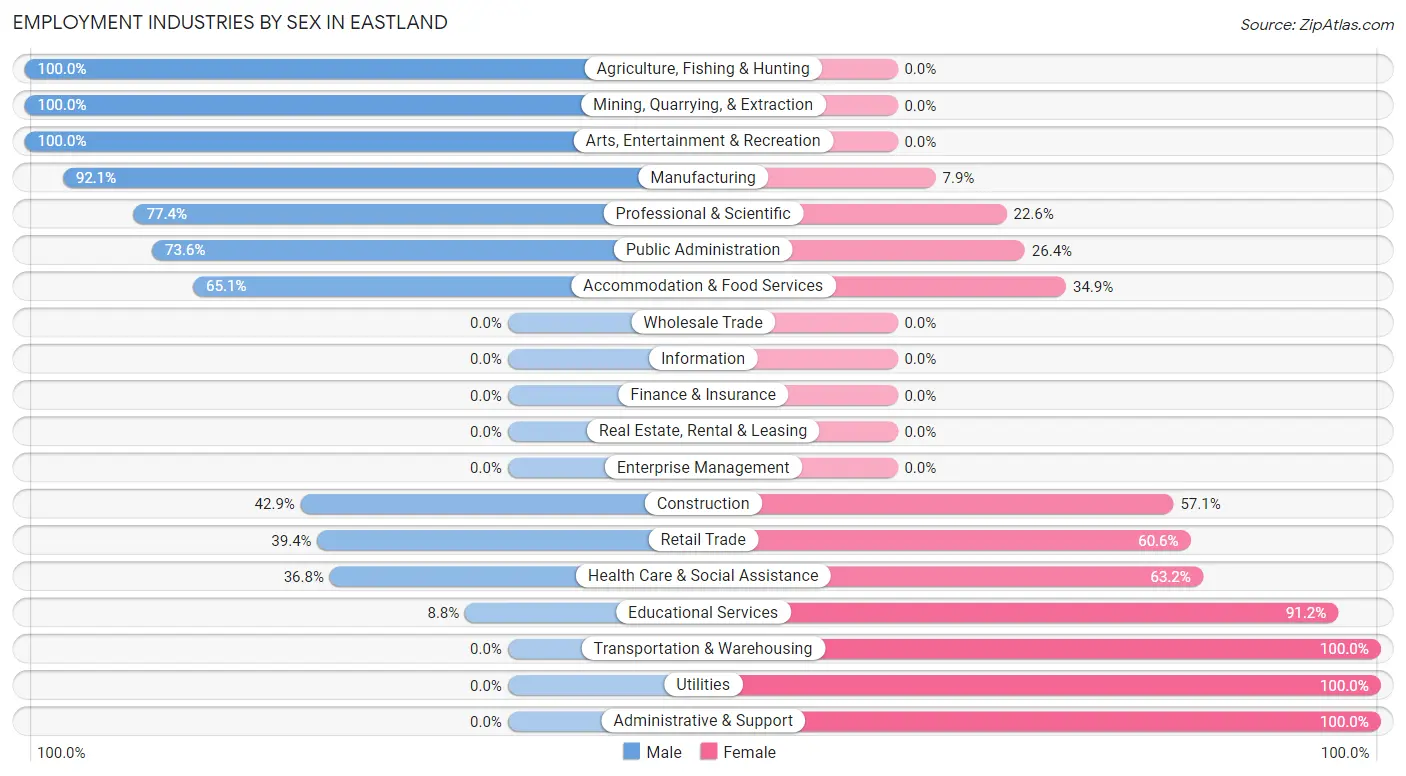
| Industry | Male | Female |
| Agriculture, Fishing & Hunting | 66 (100.0%) | 0 (0.0%) |
| Mining, Quarrying, & Extraction | 48 (100.0%) | 0 (0.0%) |
| Construction | 99 (42.9%) | 132 (57.1%) |
| Manufacturing | 163 (92.1%) | 14 (7.9%) |
| Wholesale Trade | 0 (0.0%) | 0 (0.0%) |
| Retail Trade | 117 (39.4%) | 180 (60.6%) |
| Transportation & Warehousing | 0 (0.0%) | 28 (100.0%) |
| Utilities | 0 (0.0%) | 11 (100.0%) |
| Information | 0 (0.0%) | 0 (0.0%) |
| Finance & Insurance | 0 (0.0%) | 0 (0.0%) |
| Real Estate, Rental & Leasing | 0 (0.0%) | 0 (0.0%) |
| Professional & Scientific | 96 (77.4%) | 28 (22.6%) |
| Enterprise Management | 0 (0.0%) | 0 (0.0%) |
| Administrative & Support | 0 (0.0%) | 72 (100.0%) |
| Educational Services | 15 (8.8%) | 155 (91.2%) |
| Health Care & Social Assistance | 28 (36.8%) | 48 (63.2%) |
| Arts, Entertainment & Recreation | 64 (100.0%) | 0 (0.0%) |
| Accommodation & Food Services | 125 (65.1%) | 67 (34.9%) |
| Public Administration | 53 (73.6%) | 19 (26.4%) |
| Total | 883 (53.9%) | 754 (46.1%) |
Education in Eastland
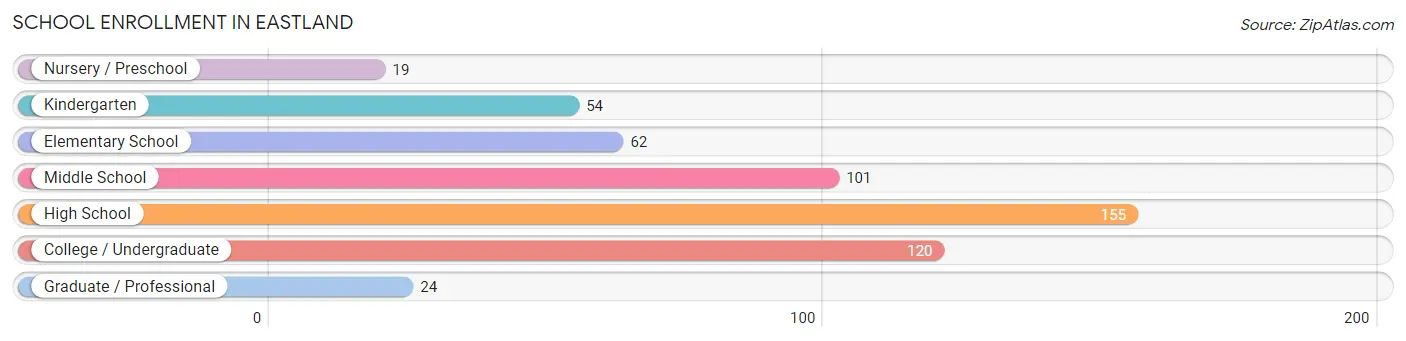
School Enrollment in Eastland
The most common levels of schooling among the 535 students in Eastland are high school (155 | 29.0%), college / undergraduate (120 | 22.4%), and middle school (101 | 18.9%).
| School Level | # Students | % Students |
| Nursery / Preschool | 19 | 3.5% |
| Kindergarten | 54 | 10.1% |
| Elementary School | 62 | 11.6% |
| Middle School | 101 | 18.9% |
| High School | 155 | 29.0% |
| College / Undergraduate | 120 | 22.4% |
| Graduate / Professional | 24 | 4.5% |
| Total | 535 | 100.0% |
School Enrollment by Age by Funding Source in Eastland
Out of a total of 535 students who are enrolled in schools in Eastland, 9 (1.7%) attend a private institution, while the remaining 526 (98.3%) are enrolled in public schools. The age group of 35 years and over has the highest likelihood of being enrolled in private schools, with 9 (40.9% in the age bracket) enrolled. Conversely, the age group of 3 to 4 year olds has the lowest likelihood of being enrolled in a private school, with 19 (100.0% in the age bracket) attending a public institution.
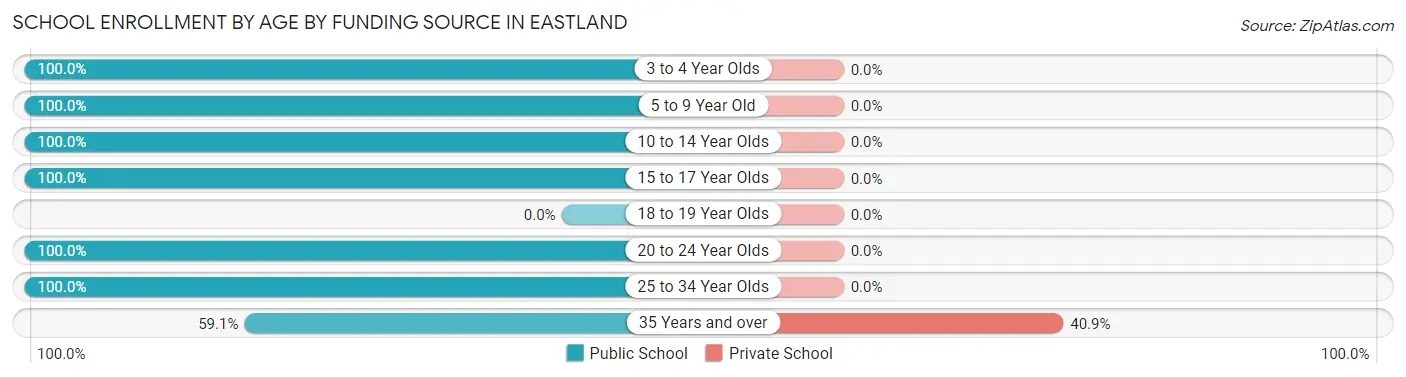
| Age Bracket | Public School | Private School |
| 3 to 4 Year Olds | 19 (100.0%) | 0 (0.0%) |
| 5 to 9 Year Old | 116 (100.0%) | 0 (0.0%) |
| 10 to 14 Year Olds | 143 (100.0%) | 0 (0.0%) |
| 15 to 17 Year Olds | 113 (100.0%) | 0 (0.0%) |
| 18 to 19 Year Olds | 0 (0.0%) | 0 (0.0%) |
| 20 to 24 Year Olds | 33 (100.0%) | 0 (0.0%) |
| 25 to 34 Year Olds | 89 (100.0%) | 0 (0.0%) |
| 35 Years and over | 13 (59.1%) | 9 (40.9%) |
| Total | 526 (98.3%) | 9 (1.7%) |
Educational Attainment by Field of Study in Eastland
Education (185 | 21.7%), science & technology (165 | 19.3%), engineering (138 | 16.2%), business (133 | 15.6%), and bio, nature & agricultural (66 | 7.7%) are the most common fields of study among 853 individuals in Eastland who have obtained a bachelor's degree or higher.
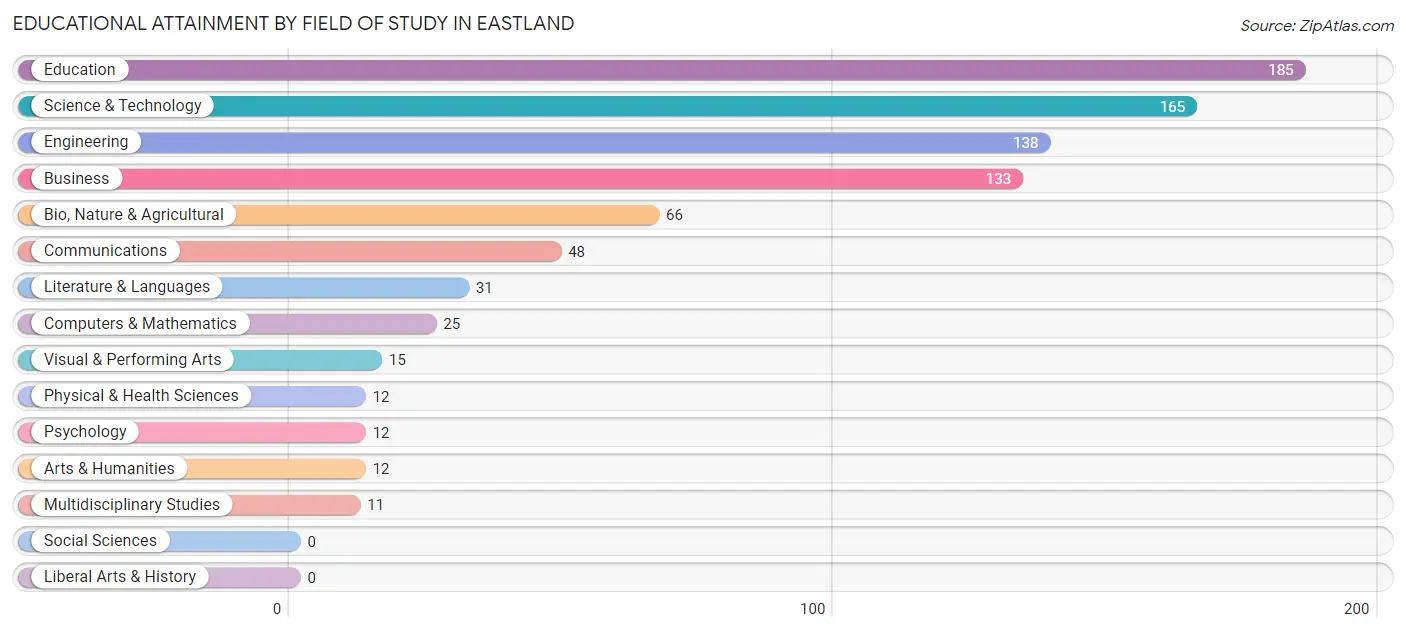
| Field of Study | # Graduates | % Graduates |
| Computers & Mathematics | 25 | 2.9% |
| Bio, Nature & Agricultural | 66 | 7.7% |
| Physical & Health Sciences | 12 | 1.4% |
| Psychology | 12 | 1.4% |
| Social Sciences | 0 | 0.0% |
| Engineering | 138 | 16.2% |
| Multidisciplinary Studies | 11 | 1.3% |
| Science & Technology | 165 | 19.3% |
| Business | 133 | 15.6% |
| Education | 185 | 21.7% |
| Literature & Languages | 31 | 3.6% |
| Liberal Arts & History | 0 | 0.0% |
| Visual & Performing Arts | 15 | 1.8% |
| Communications | 48 | 5.6% |
| Arts & Humanities | 12 | 1.4% |
| Total | 853 | 100.0% |
Transportation & Commute in Eastland
Vehicle Availability by Sex in Eastland
The most prevalent vehicle ownership categories in Eastland are males with 2 vehicles (579, accounting for 65.6%) and females with 2 vehicles (532, making up 78.2%).
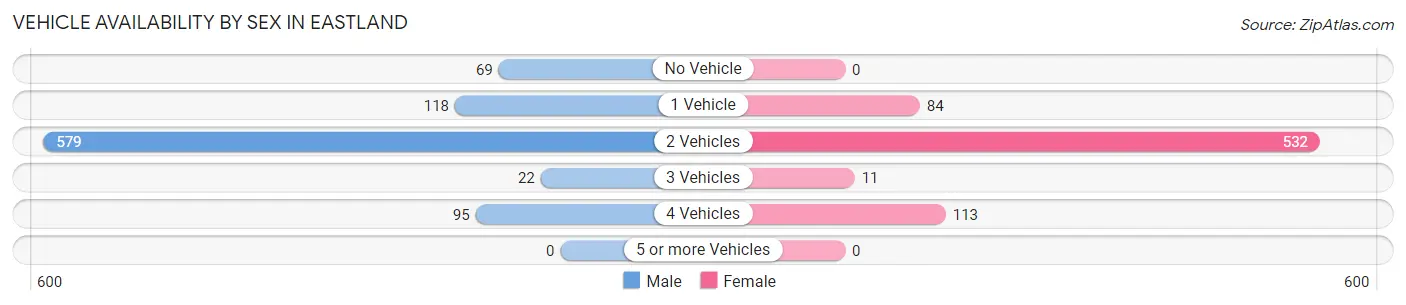
| Vehicles Available | Male | Female |
| No Vehicle | 69 (7.8%) | 0 (0.0%) |
| 1 Vehicle | 118 (13.4%) | 84 (11.4%) |
| 2 Vehicles | 579 (65.6%) | 532 (71.9%) |
| 3 Vehicles | 22 (2.5%) | 11 (1.5%) |
| 4 Vehicles | 95 (10.8%) | 113 (15.3%) |
| 5 or more Vehicles | 0 (0.0%) | 0 (0.0%) |
| Total | 883 (100.0%) | 740 (100.0%) |
Commute Time in Eastland
The most frequently occuring commute durations in Eastland are 5 to 9 minutes (400 commuters, 24.8%), less than 5 minutes (362 commuters, 22.4%), and 60 to 89 minutes (289 commuters, 17.9%).
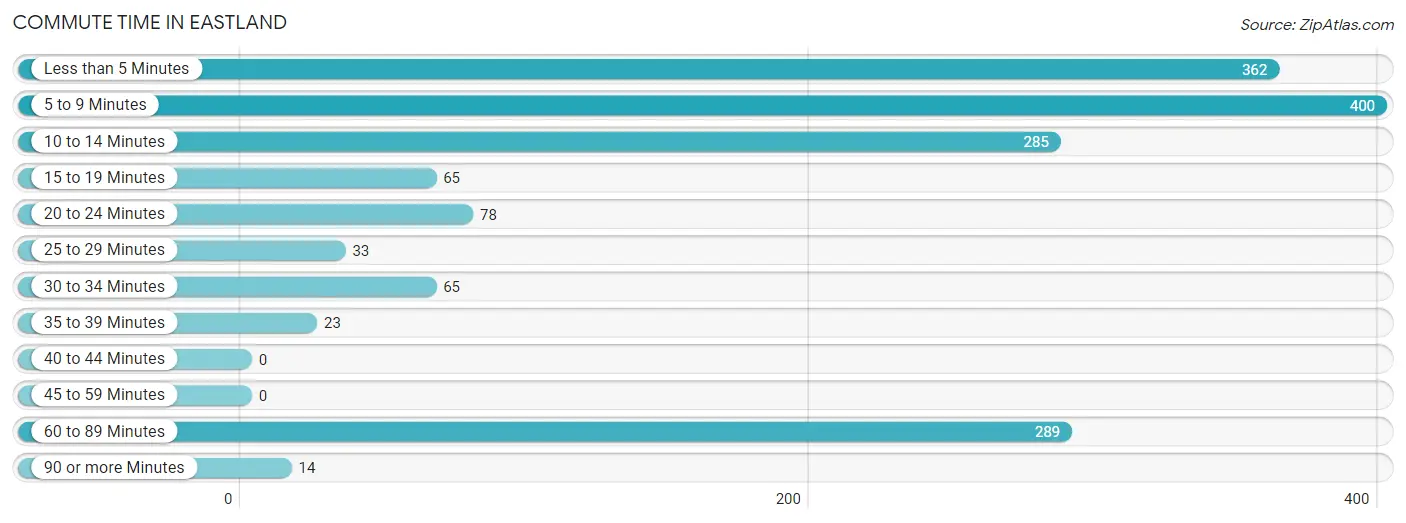
| Commute Time | # Commuters | % Commuters |
| Less than 5 Minutes | 362 | 22.4% |
| 5 to 9 Minutes | 400 | 24.8% |
| 10 to 14 Minutes | 285 | 17.7% |
| 15 to 19 Minutes | 65 | 4.0% |
| 20 to 24 Minutes | 78 | 4.8% |
| 25 to 29 Minutes | 33 | 2.0% |
| 30 to 34 Minutes | 65 | 4.0% |
| 35 to 39 Minutes | 23 | 1.4% |
| 40 to 44 Minutes | 0 | 0.0% |
| 45 to 59 Minutes | 0 | 0.0% |
| 60 to 89 Minutes | 289 | 17.9% |
| 90 or more Minutes | 14 | 0.9% |
Commute Time by Sex in Eastland
The most common commute times in Eastland are 60 to 89 minutes (217 commuters, 24.9%) for males and less than 5 minutes (214 commuters, 28.8%) for females.
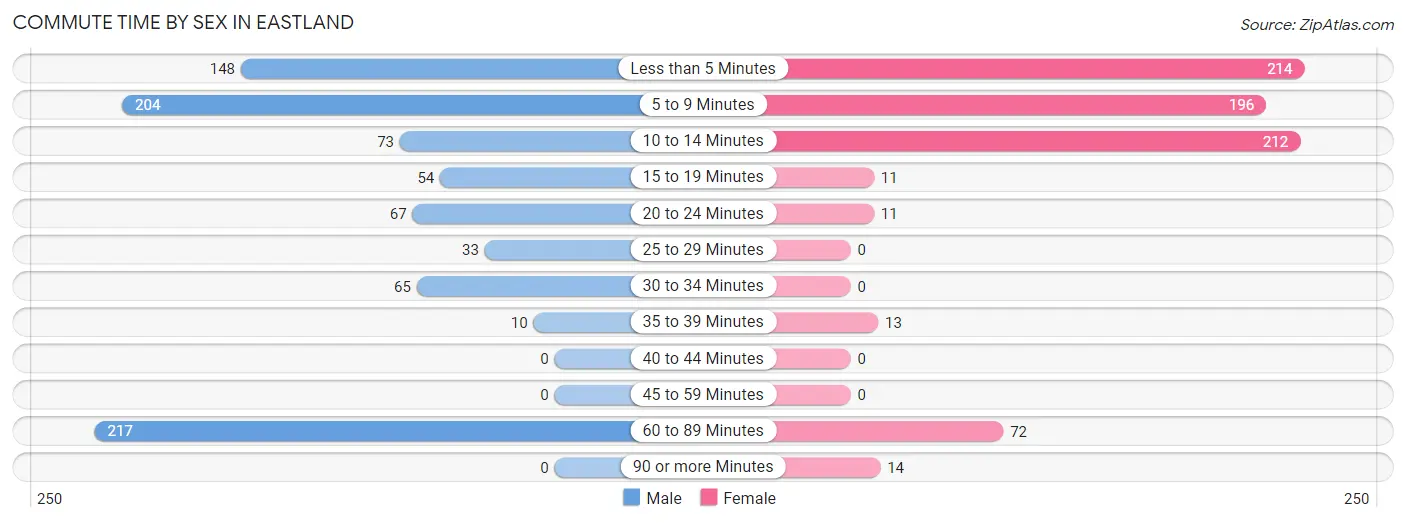
| Commute Time | Male | Female |
| Less than 5 Minutes | 148 (17.0%) | 214 (28.8%) |
| 5 to 9 Minutes | 204 (23.4%) | 196 (26.4%) |
| 10 to 14 Minutes | 73 (8.4%) | 212 (28.5%) |
| 15 to 19 Minutes | 54 (6.2%) | 11 (1.5%) |
| 20 to 24 Minutes | 67 (7.7%) | 11 (1.5%) |
| 25 to 29 Minutes | 33 (3.8%) | 0 (0.0%) |
| 30 to 34 Minutes | 65 (7.5%) | 0 (0.0%) |
| 35 to 39 Minutes | 10 (1.1%) | 13 (1.8%) |
| 40 to 44 Minutes | 0 (0.0%) | 0 (0.0%) |
| 45 to 59 Minutes | 0 (0.0%) | 0 (0.0%) |
| 60 to 89 Minutes | 217 (24.9%) | 72 (9.7%) |
| 90 or more Minutes | 0 (0.0%) | 14 (1.9%) |
Time of Departure to Work by Sex in Eastland
The most frequent times of departure to work in Eastland are 7:00 AM to 7:29 AM (253, 29.0%) for males and 5:30 AM to 5:59 AM (165, 22.2%) for females.
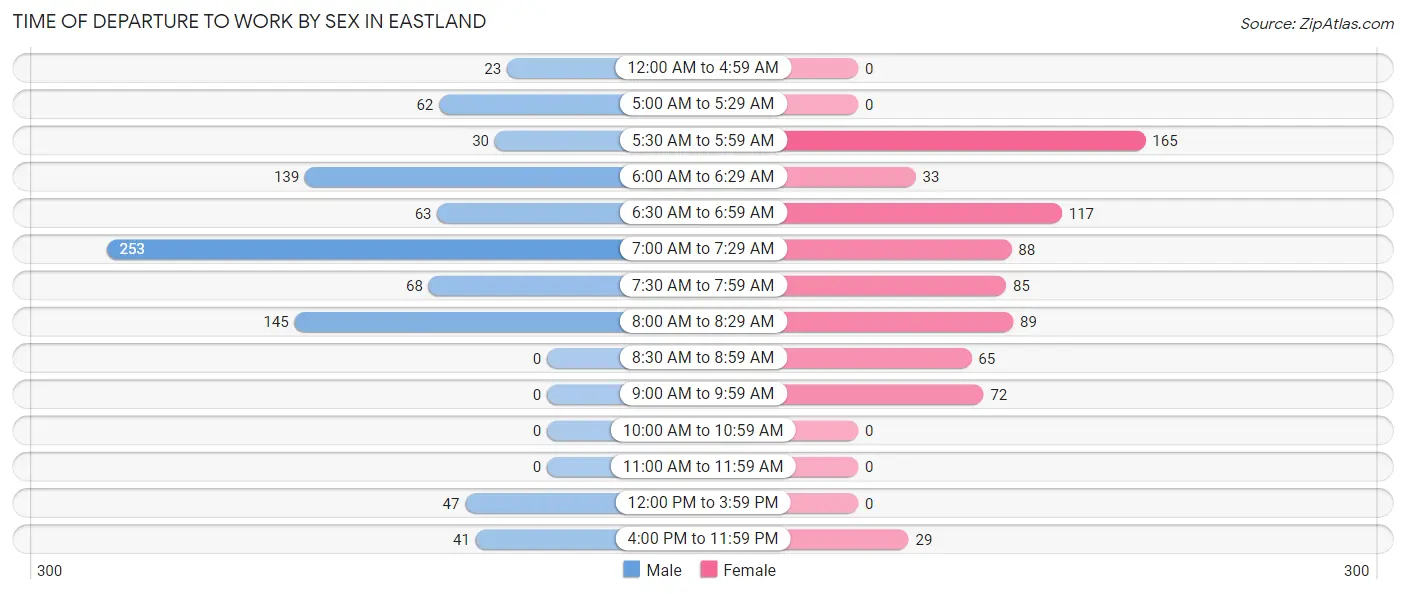
| Time of Departure | Male | Female |
| 12:00 AM to 4:59 AM | 23 (2.6%) | 0 (0.0%) |
| 5:00 AM to 5:29 AM | 62 (7.1%) | 0 (0.0%) |
| 5:30 AM to 5:59 AM | 30 (3.4%) | 165 (22.2%) |
| 6:00 AM to 6:29 AM | 139 (16.0%) | 33 (4.4%) |
| 6:30 AM to 6:59 AM | 63 (7.2%) | 117 (15.8%) |
| 7:00 AM to 7:29 AM | 253 (29.0%) | 88 (11.8%) |
| 7:30 AM to 7:59 AM | 68 (7.8%) | 85 (11.4%) |
| 8:00 AM to 8:29 AM | 145 (16.7%) | 89 (12.0%) |
| 8:30 AM to 8:59 AM | 0 (0.0%) | 65 (8.7%) |
| 9:00 AM to 9:59 AM | 0 (0.0%) | 72 (9.7%) |
| 10:00 AM to 10:59 AM | 0 (0.0%) | 0 (0.0%) |
| 11:00 AM to 11:59 AM | 0 (0.0%) | 0 (0.0%) |
| 12:00 PM to 3:59 PM | 47 (5.4%) | 0 (0.0%) |
| 4:00 PM to 11:59 PM | 41 (4.7%) | 29 (3.9%) |
| Total | 871 (100.0%) | 743 (100.0%) |
Housing Occupancy in Eastland
Occupancy by Ownership in Eastland
Of the total 1,530 dwellings in Eastland, owner-occupied units account for 946 (61.8%), while renter-occupied units make up 584 (38.2%).
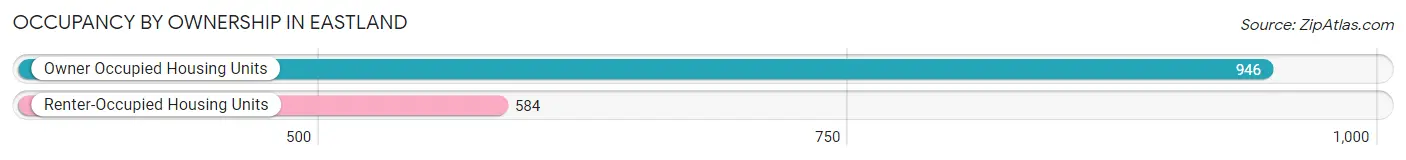
| Occupancy | # Housing Units | % Housing Units |
| Owner Occupied Housing Units | 946 | 61.8% |
| Renter-Occupied Housing Units | 584 | 38.2% |
| Total Occupied Housing Units | 1,530 | 100.0% |
Occupancy by Household Size in Eastland
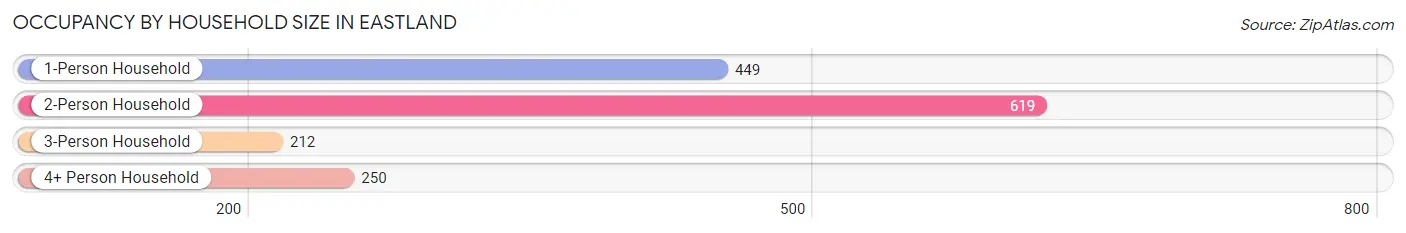
| Household Size | # Housing Units | % Housing Units |
| 1-Person Household | 449 | 29.3% |
| 2-Person Household | 619 | 40.5% |
| 3-Person Household | 212 | 13.9% |
| 4+ Person Household | 250 | 16.3% |
| Total Housing Units | 1,530 | 100.0% |
Occupancy by Ownership by Household Size in Eastland
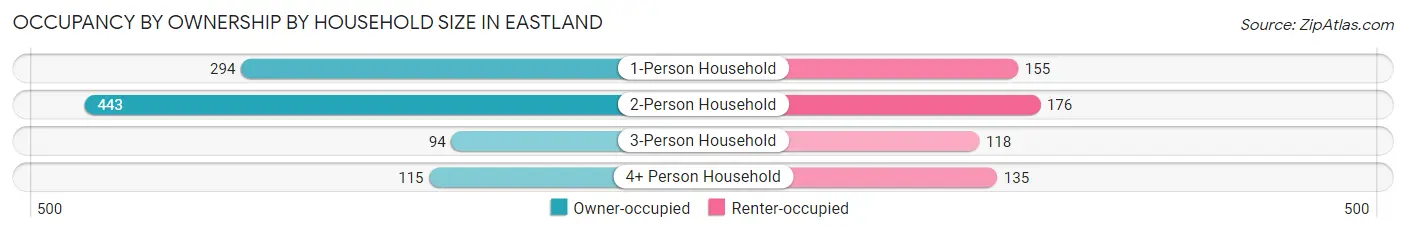
| Household Size | Owner-occupied | Renter-occupied |
| 1-Person Household | 294 (65.5%) | 155 (34.5%) |
| 2-Person Household | 443 (71.6%) | 176 (28.4%) |
| 3-Person Household | 94 (44.3%) | 118 (55.7%) |
| 4+ Person Household | 115 (46.0%) | 135 (54.0%) |
| Total Housing Units | 946 (61.8%) | 584 (38.2%) |
Occupancy by Educational Attainment in Eastland
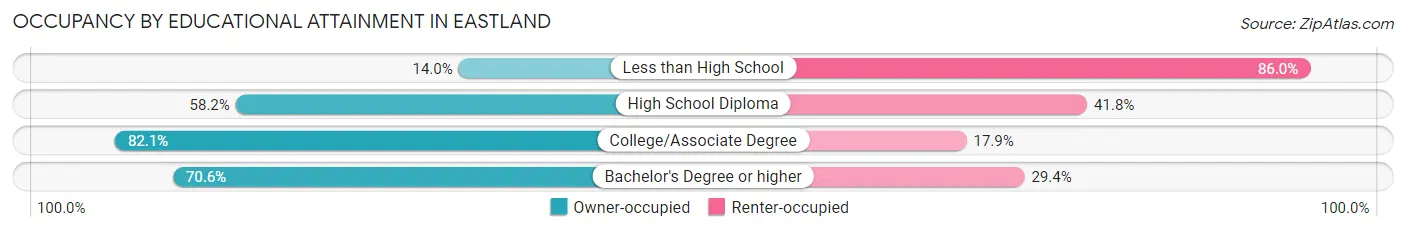
| Household Size | Owner-occupied | Renter-occupied |
| Less than High School | 25 (14.0%) | 154 (86.0%) |
| High School Diploma | 324 (58.2%) | 233 (41.8%) |
| College/Associate Degree | 261 (82.1%) | 57 (17.9%) |
| Bachelor's Degree or higher | 336 (70.6%) | 140 (29.4%) |
Occupancy by Age of Householder in Eastland
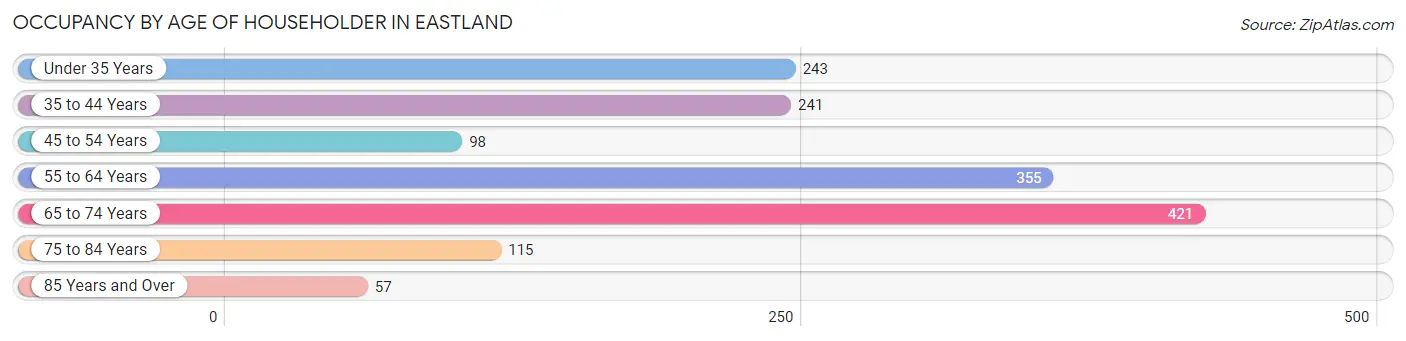
| Age Bracket | # Households | % Households |
| Under 35 Years | 243 | 15.9% |
| 35 to 44 Years | 241 | 15.8% |
| 45 to 54 Years | 98 | 6.4% |
| 55 to 64 Years | 355 | 23.2% |
| 65 to 74 Years | 421 | 27.5% |
| 75 to 84 Years | 115 | 7.5% |
| 85 Years and Over | 57 | 3.7% |
| Total | 1,530 | 100.0% |
Housing Finances in Eastland
Median Income by Occupancy in Eastland
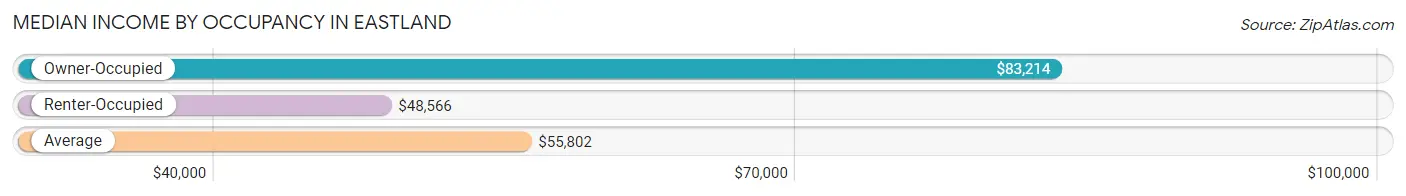
| Occupancy Type | # Households | Median Income |
| Owner-Occupied | 946 (61.8%) | $83,214 |
| Renter-Occupied | 584 (38.2%) | $48,566 |
| Average | 1,530 (100.0%) | $55,802 |
Occupancy by Householder Income Bracket in Eastland
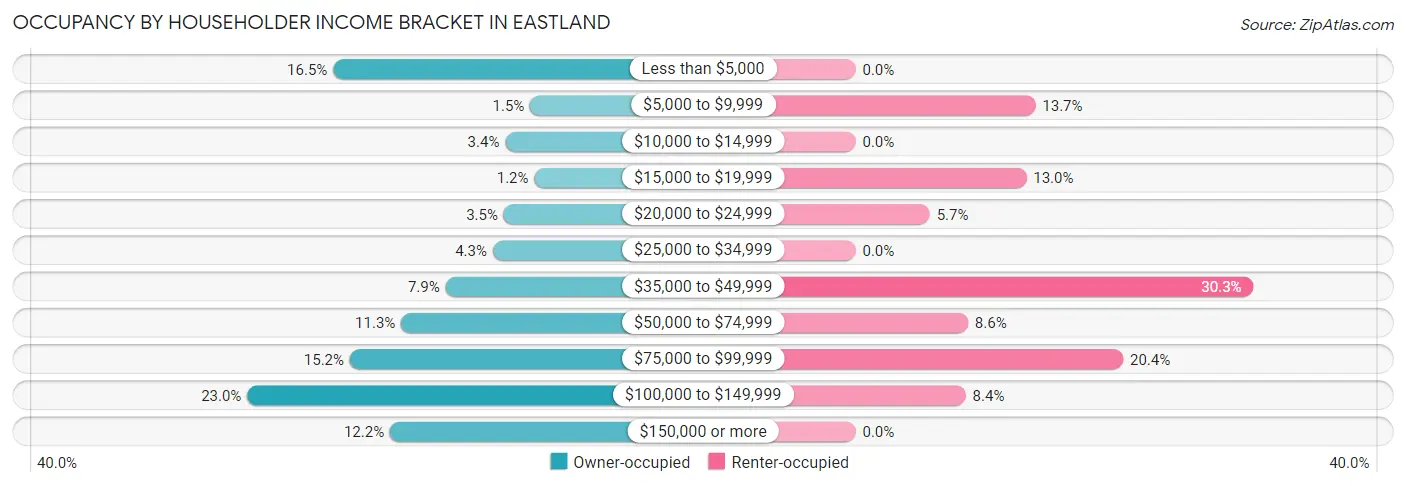
| Income Bracket | Owner-occupied | Renter-occupied |
| Less than $5,000 | 156 (16.5%) | 0 (0.0%) |
| $5,000 to $9,999 | 14 (1.5%) | 80 (13.7%) |
| $10,000 to $14,999 | 32 (3.4%) | 0 (0.0%) |
| $15,000 to $19,999 | 11 (1.2%) | 76 (13.0%) |
| $20,000 to $24,999 | 33 (3.5%) | 33 (5.7%) |
| $25,000 to $34,999 | 41 (4.3%) | 0 (0.0%) |
| $35,000 to $49,999 | 75 (7.9%) | 177 (30.3%) |
| $50,000 to $74,999 | 107 (11.3%) | 50 (8.6%) |
| $75,000 to $99,999 | 144 (15.2%) | 119 (20.4%) |
| $100,000 to $149,999 | 218 (23.0%) | 49 (8.4%) |
| $150,000 or more | 115 (12.2%) | 0 (0.0%) |
| Total | 946 (100.0%) | 584 (100.0%) |
Monthly Housing Cost Tiers in Eastland
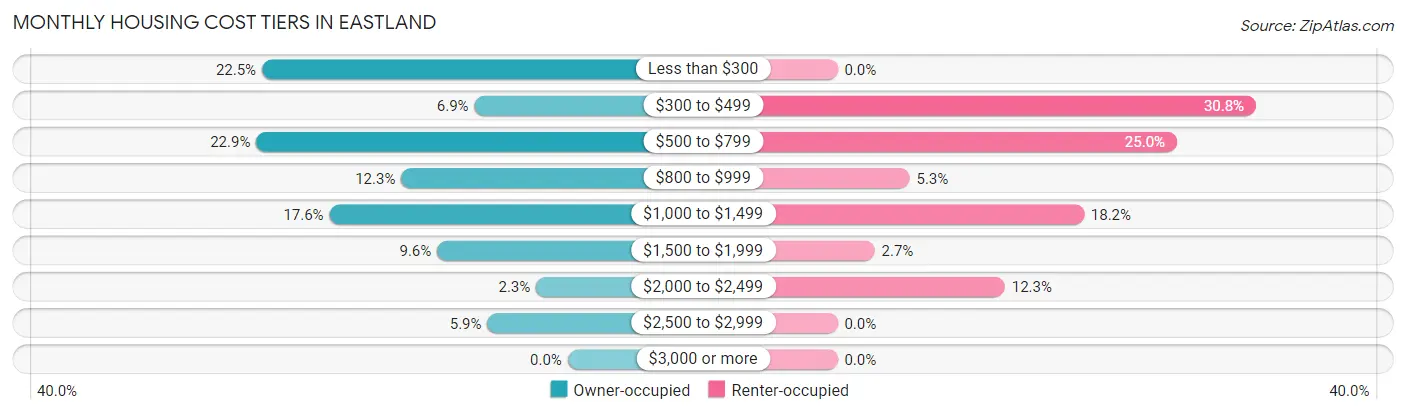
| Monthly Cost | Owner-occupied | Renter-occupied |
| Less than $300 | 213 (22.5%) | 0 (0.0%) |
| $300 to $499 | 65 (6.9%) | 180 (30.8%) |
| $500 to $799 | 217 (22.9%) | 146 (25.0%) |
| $800 to $999 | 116 (12.3%) | 31 (5.3%) |
| $1,000 to $1,499 | 166 (17.5%) | 106 (18.1%) |
| $1,500 to $1,999 | 91 (9.6%) | 16 (2.7%) |
| $2,000 to $2,499 | 22 (2.3%) | 72 (12.3%) |
| $2,500 to $2,999 | 56 (5.9%) | 0 (0.0%) |
| $3,000 or more | 0 (0.0%) | 0 (0.0%) |
| Total | 946 (100.0%) | 584 (100.0%) |
Physical Housing Characteristics in Eastland
Housing Structures in Eastland
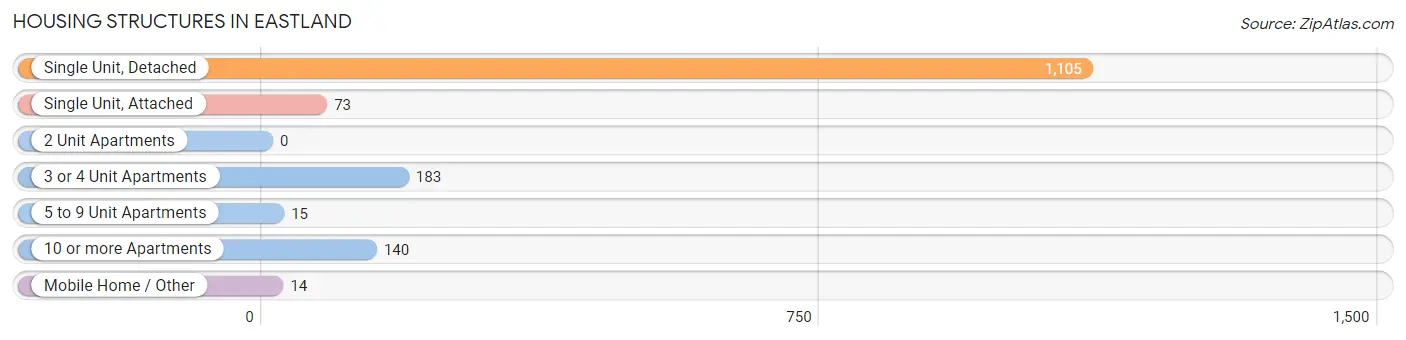
| Structure Type | # Housing Units | % Housing Units |
| Single Unit, Detached | 1,105 | 72.2% |
| Single Unit, Attached | 73 | 4.8% |
| 2 Unit Apartments | 0 | 0.0% |
| 3 or 4 Unit Apartments | 183 | 12.0% |
| 5 to 9 Unit Apartments | 15 | 1.0% |
| 10 or more Apartments | 140 | 9.1% |
| Mobile Home / Other | 14 | 0.9% |
| Total | 1,530 | 100.0% |
Housing Structures by Occupancy in Eastland
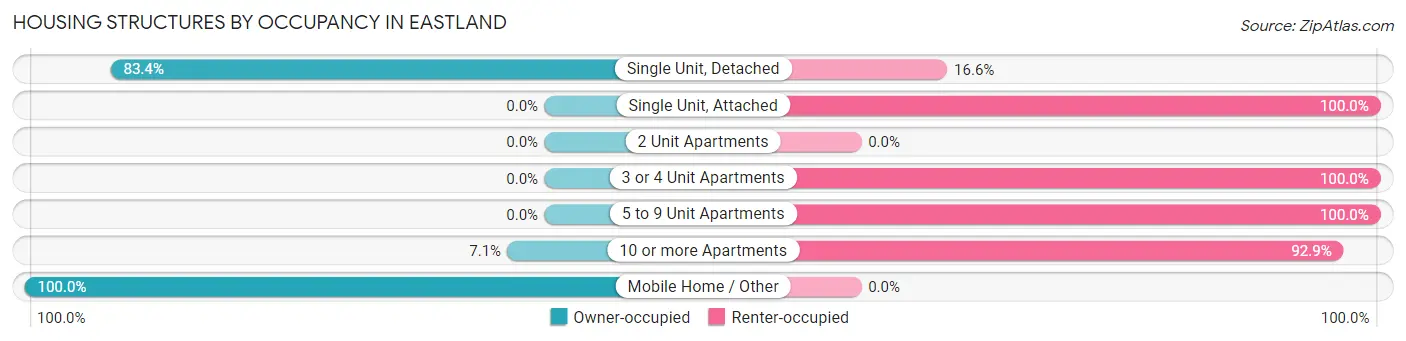
| Structure Type | Owner-occupied | Renter-occupied |
| Single Unit, Detached | 922 (83.4%) | 183 (16.6%) |
| Single Unit, Attached | 0 (0.0%) | 73 (100.0%) |
| 2 Unit Apartments | 0 (0.0%) | 0 (0.0%) |
| 3 or 4 Unit Apartments | 0 (0.0%) | 183 (100.0%) |
| 5 to 9 Unit Apartments | 0 (0.0%) | 15 (100.0%) |
| 10 or more Apartments | 10 (7.1%) | 130 (92.9%) |
| Mobile Home / Other | 14 (100.0%) | 0 (0.0%) |
| Total | 946 (61.8%) | 584 (38.2%) |
Housing Structures by Number of Rooms in Eastland
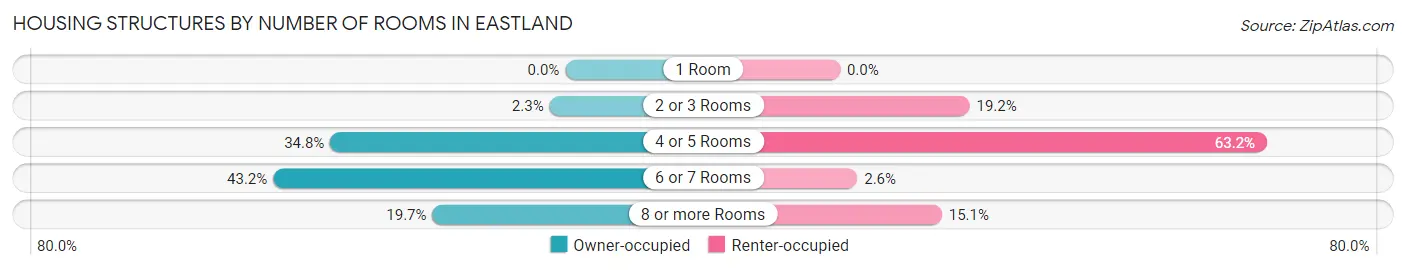
| Number of Rooms | Owner-occupied | Renter-occupied |
| 1 Room | 0 (0.0%) | 0 (0.0%) |
| 2 or 3 Rooms | 22 (2.3%) | 112 (19.2%) |
| 4 or 5 Rooms | 329 (34.8%) | 369 (63.2%) |
| 6 or 7 Rooms | 409 (43.2%) | 15 (2.6%) |
| 8 or more Rooms | 186 (19.7%) | 88 (15.1%) |
| Total | 946 (100.0%) | 584 (100.0%) |
Housing Structure by Heating Type in Eastland
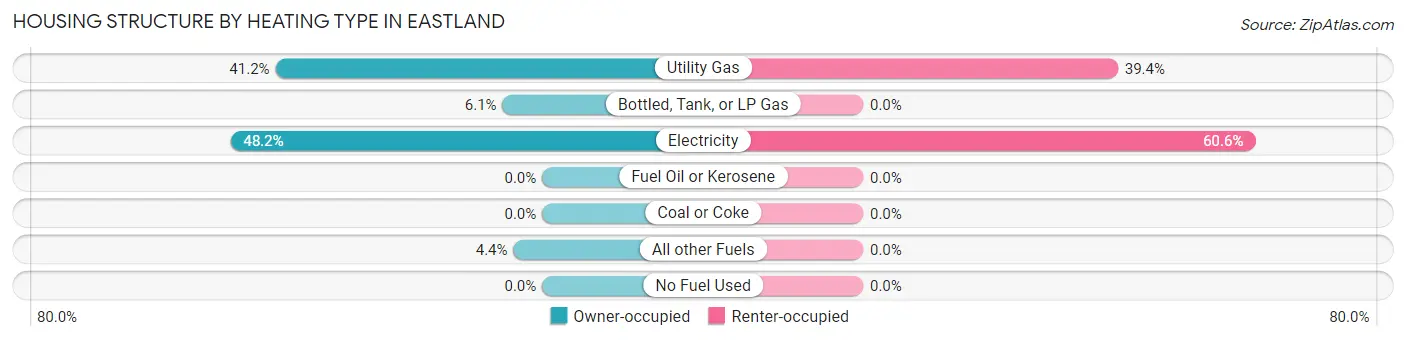
| Heating Type | Owner-occupied | Renter-occupied |
| Utility Gas | 390 (41.2%) | 230 (39.4%) |
| Bottled, Tank, or LP Gas | 58 (6.1%) | 0 (0.0%) |
| Electricity | 456 (48.2%) | 354 (60.6%) |
| Fuel Oil or Kerosene | 0 (0.0%) | 0 (0.0%) |
| Coal or Coke | 0 (0.0%) | 0 (0.0%) |
| All other Fuels | 42 (4.4%) | 0 (0.0%) |
| No Fuel Used | 0 (0.0%) | 0 (0.0%) |
| Total | 946 (100.0%) | 584 (100.0%) |
Household Vehicle Usage in Eastland
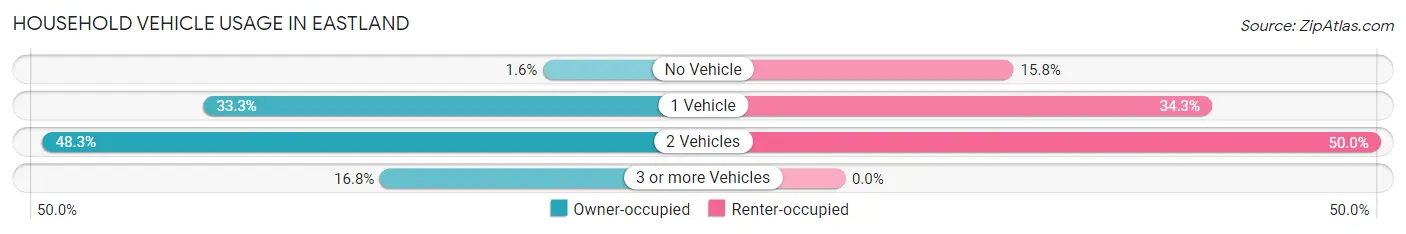
| Vehicles per Household | Owner-occupied | Renter-occupied |
| No Vehicle | 15 (1.6%) | 92 (15.8%) |
| 1 Vehicle | 315 (33.3%) | 200 (34.3%) |
| 2 Vehicles | 457 (48.3%) | 292 (50.0%) |
| 3 or more Vehicles | 159 (16.8%) | 0 (0.0%) |
| Total | 946 (100.0%) | 584 (100.0%) |
Real Estate & Mortgages in Eastland
Real Estate and Mortgage Overview in Eastland
| Characteristic | Without Mortgage | With Mortgage |
| Housing Units | 496 | 450 |
| Median Property Value | $187,300 | $157,300 |
| Median Household Income | $39,318 | $87 |
| Monthly Housing Costs | $379 | $0 |
| Real Estate Taxes | $1,887 | $0 |
Property Value by Mortgage Status in Eastland
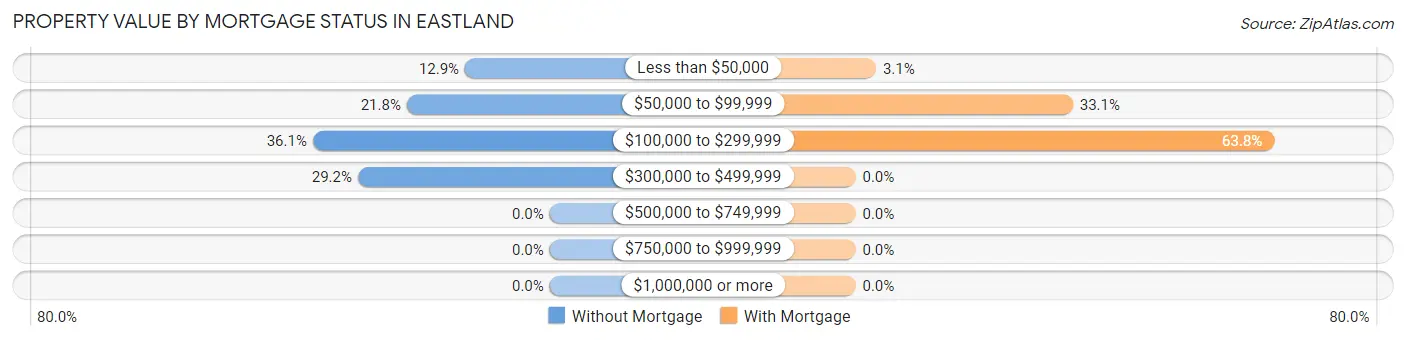
| Property Value | Without Mortgage | With Mortgage |
| Less than $50,000 | 64 (12.9%) | 14 (3.1%) |
| $50,000 to $99,999 | 108 (21.8%) | 149 (33.1%) |
| $100,000 to $299,999 | 179 (36.1%) | 287 (63.8%) |
| $300,000 to $499,999 | 145 (29.2%) | 0 (0.0%) |
| $500,000 to $749,999 | 0 (0.0%) | 0 (0.0%) |
| $750,000 to $999,999 | 0 (0.0%) | 0 (0.0%) |
| $1,000,000 or more | 0 (0.0%) | 0 (0.0%) |
| Total | 496 (100.0%) | 450 (100.0%) |
Household Income by Mortgage Status in Eastland
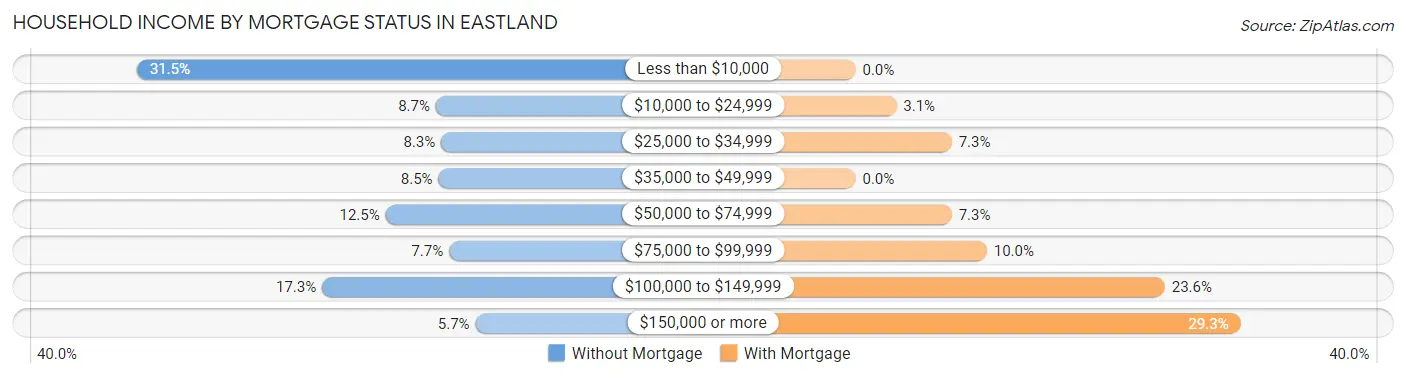
| Household Income | Without Mortgage | With Mortgage |
| Less than $10,000 | 156 (31.5%) | 0 (0.0%) |
| $10,000 to $24,999 | 43 (8.7%) | 14 (3.1%) |
| $25,000 to $34,999 | 41 (8.3%) | 33 (7.3%) |
| $35,000 to $49,999 | 42 (8.5%) | 0 (0.0%) |
| $50,000 to $74,999 | 62 (12.5%) | 33 (7.3%) |
| $75,000 to $99,999 | 38 (7.7%) | 45 (10.0%) |
| $100,000 to $149,999 | 86 (17.3%) | 106 (23.6%) |
| $150,000 or more | 28 (5.7%) | 132 (29.3%) |
| Total | 496 (100.0%) | 450 (100.0%) |
Property Value to Household Income Ratio in Eastland
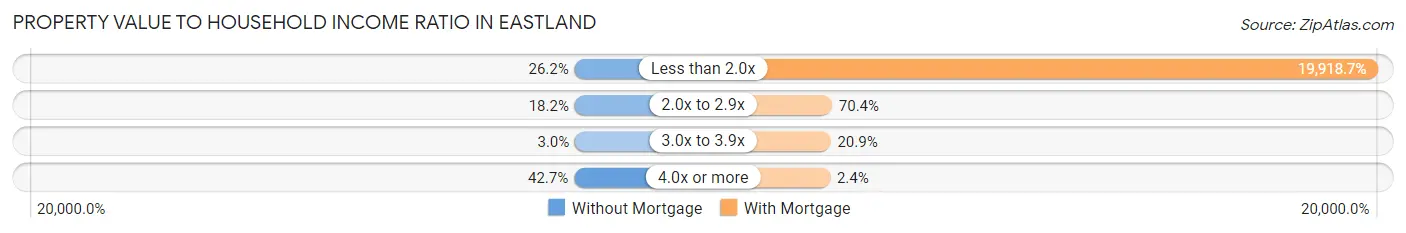
| Value-to-Income Ratio | Without Mortgage | With Mortgage |
| Less than 2.0x | 130 (26.2%) | 89,634 (19,918.7%) |
| 2.0x to 2.9x | 90 (18.1%) | 317 (70.4%) |
| 3.0x to 3.9x | 15 (3.0%) | 94 (20.9%) |
| 4.0x or more | 212 (42.7%) | 11 (2.4%) |
| Total | 496 (100.0%) | 450 (100.0%) |
Real Estate Taxes by Mortgage Status in Eastland
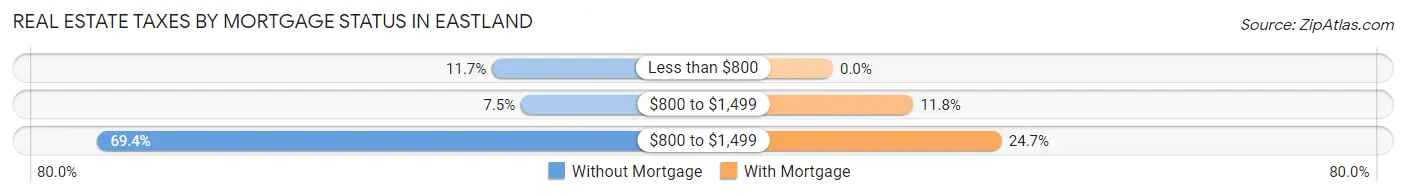
| Property Taxes | Without Mortgage | With Mortgage |
| Less than $800 | 58 (11.7%) | 0 (0.0%) |
| $800 to $1,499 | 37 (7.5%) | 53 (11.8%) |
| $800 to $1,499 | 344 (69.4%) | 111 (24.7%) |
| Total | 496 (100.0%) | 450 (100.0%) |
Health & Disability in Eastland
Health Insurance Coverage by Age in Eastland
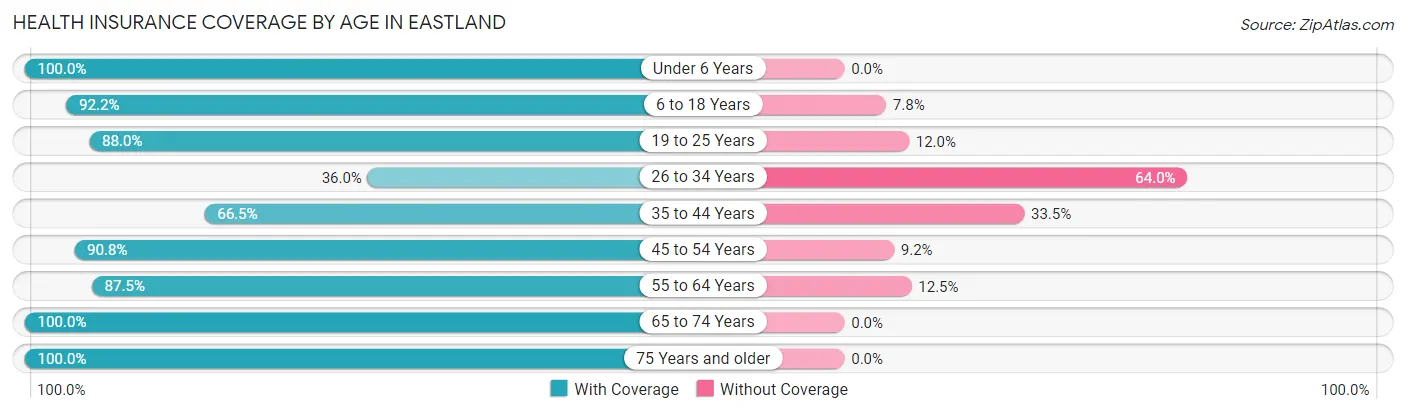
| Age Bracket | With Coverage | Without Coverage |
| Under 6 Years | 248 (100.0%) | 0 (0.0%) |
| 6 to 18 Years | 392 (92.2%) | 33 (7.8%) |
| 19 to 25 Years | 139 (88.0%) | 19 (12.0%) |
| 26 to 34 Years | 152 (36.0%) | 270 (64.0%) |
| 35 to 44 Years | 353 (66.5%) | 178 (33.5%) |
| 45 to 54 Years | 285 (90.8%) | 29 (9.2%) |
| 55 to 64 Years | 455 (87.5%) | 65 (12.5%) |
| 65 to 74 Years | 583 (100.0%) | 0 (0.0%) |
| 75 Years and older | 326 (100.0%) | 0 (0.0%) |
| Total | 2,933 (83.2%) | 594 (16.8%) |
Health Insurance Coverage by Citizenship Status in Eastland
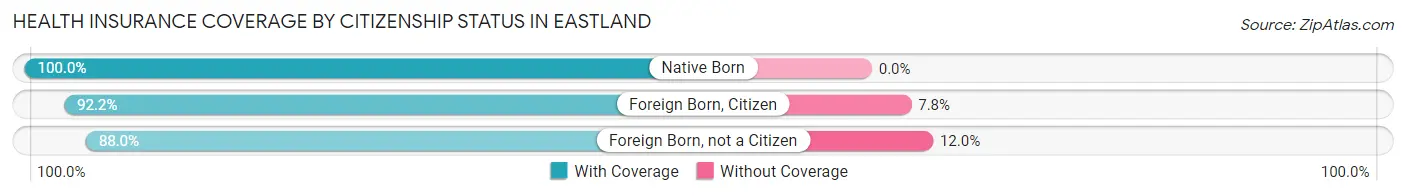
| Citizenship Status | With Coverage | Without Coverage |
| Native Born | 248 (100.0%) | 0 (0.0%) |
| Foreign Born, Citizen | 392 (92.2%) | 33 (7.8%) |
| Foreign Born, not a Citizen | 139 (88.0%) | 19 (12.0%) |
Health Insurance Coverage by Household Income in Eastland
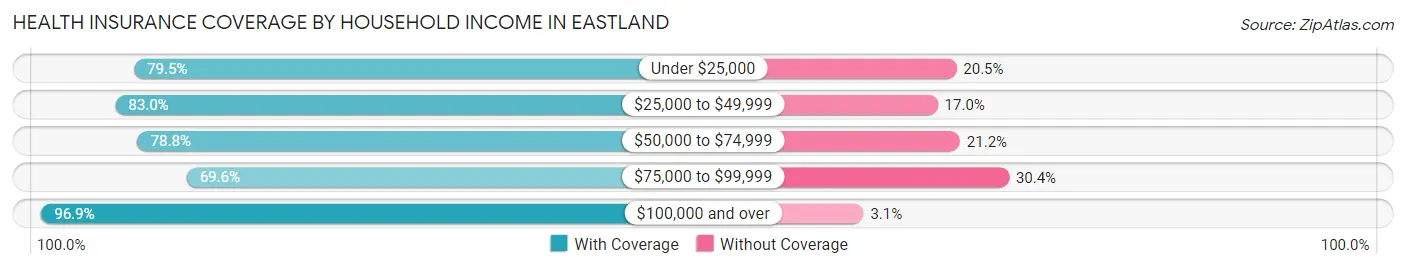
| Household Income | With Coverage | Without Coverage |
| Under $25,000 | 476 (79.5%) | 123 (20.5%) |
| $25,000 to $49,999 | 590 (83.0%) | 121 (17.0%) |
| $50,000 to $74,999 | 238 (78.8%) | 64 (21.2%) |
| $75,000 to $99,999 | 582 (69.6%) | 254 (30.4%) |
| $100,000 and over | 991 (96.9%) | 32 (3.1%) |
Public vs Private Health Insurance Coverage by Age in Eastland
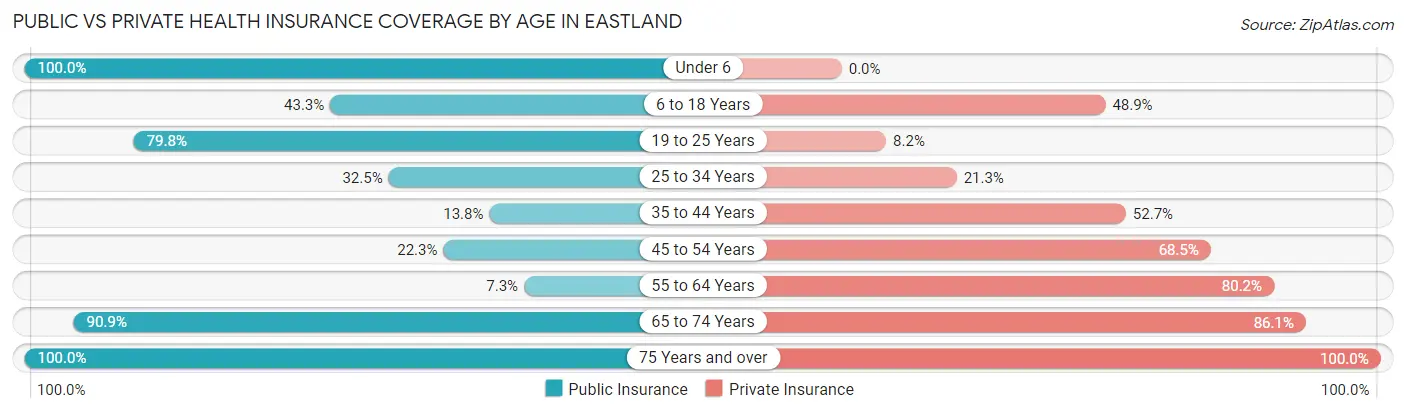
| Age Bracket | Public Insurance | Private Insurance |
| Under 6 | 248 (100.0%) | 0 (0.0%) |
| 6 to 18 Years | 184 (43.3%) | 208 (48.9%) |
| 19 to 25 Years | 126 (79.7%) | 13 (8.2%) |
| 25 to 34 Years | 137 (32.5%) | 90 (21.3%) |
| 35 to 44 Years | 73 (13.8%) | 280 (52.7%) |
| 45 to 54 Years | 70 (22.3%) | 215 (68.5%) |
| 55 to 64 Years | 38 (7.3%) | 417 (80.2%) |
| 65 to 74 Years | 530 (90.9%) | 502 (86.1%) |
| 75 Years and over | 326 (100.0%) | 326 (100.0%) |
| Total | 1,732 (49.1%) | 2,051 (58.2%) |
Disability Status by Sex by Age in Eastland
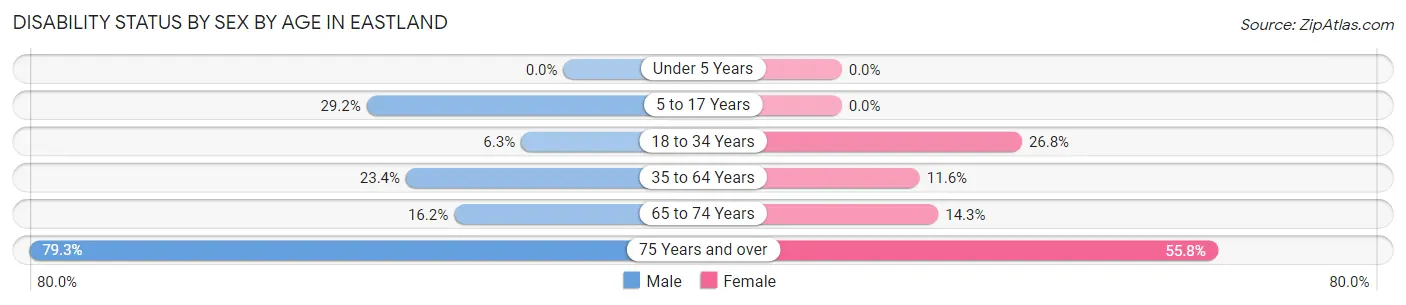
| Age Bracket | Male | Female |
| Under 5 Years | 0 (0.0%) | 0 (0.0%) |
| 5 to 17 Years | 19 (29.2%) | 0 (0.0%) |
| 18 to 34 Years | 18 (6.3%) | 88 (26.8%) |
| 35 to 64 Years | 160 (23.4%) | 79 (11.6%) |
| 65 to 74 Years | 38 (16.2%) | 50 (14.3%) |
| 75 Years and over | 115 (79.3%) | 101 (55.8%) |
Disability Class by Sex by Age in Eastland
Disability Class: Hearing Difficulty
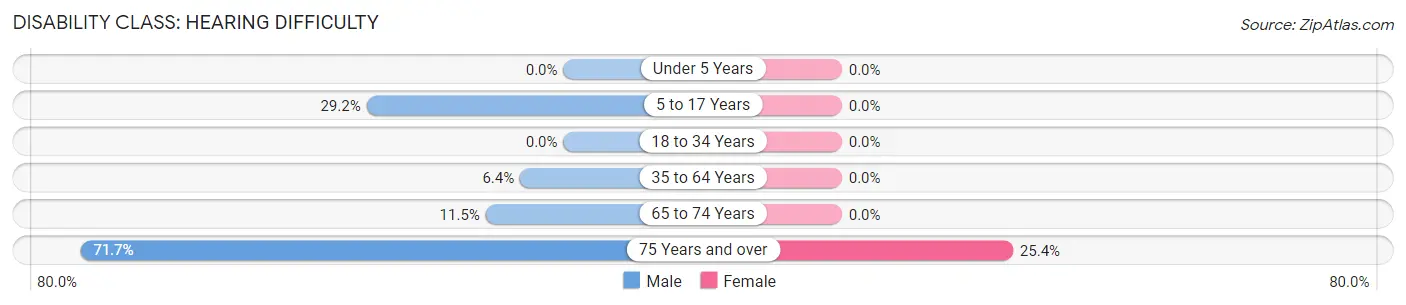
| Age Bracket | Male | Female |
| Under 5 Years | 0 (0.0%) | 0 (0.0%) |
| 5 to 17 Years | 19 (29.2%) | 0 (0.0%) |
| 18 to 34 Years | 0 (0.0%) | 0 (0.0%) |
| 35 to 64 Years | 44 (6.4%) | 0 (0.0%) |
| 65 to 74 Years | 27 (11.5%) | 0 (0.0%) |
| 75 Years and over | 104 (71.7%) | 46 (25.4%) |
Disability Class: Vision Difficulty
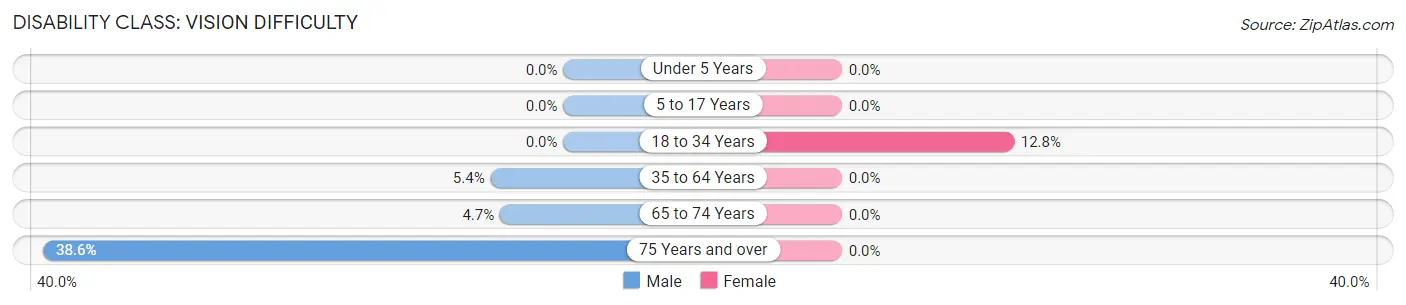
| Age Bracket | Male | Female |
| Under 5 Years | 0 (0.0%) | 0 (0.0%) |
| 5 to 17 Years | 0 (0.0%) | 0 (0.0%) |
| 18 to 34 Years | 0 (0.0%) | 42 (12.8%) |
| 35 to 64 Years | 37 (5.4%) | 0 (0.0%) |
| 65 to 74 Years | 11 (4.7%) | 0 (0.0%) |
| 75 Years and over | 56 (38.6%) | 0 (0.0%) |
Disability Class: Cognitive Difficulty
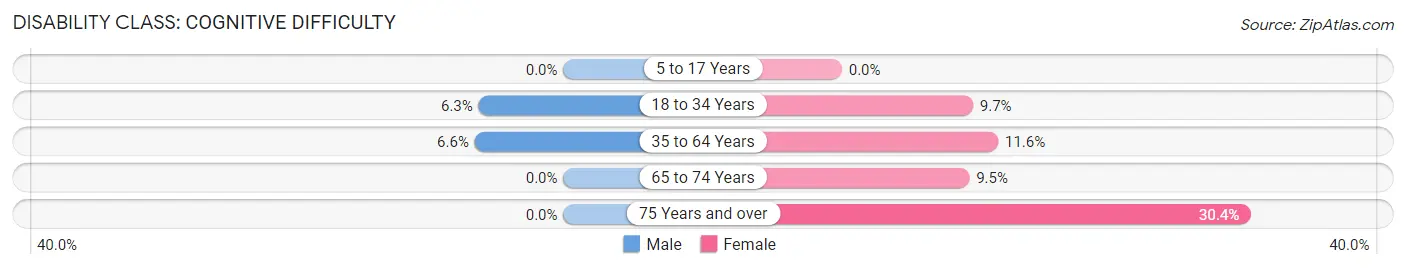
| Age Bracket | Male | Female |
| 5 to 17 Years | 0 (0.0%) | 0 (0.0%) |
| 18 to 34 Years | 18 (6.3%) | 32 (9.7%) |
| 35 to 64 Years | 45 (6.6%) | 79 (11.6%) |
| 65 to 74 Years | 0 (0.0%) | 33 (9.5%) |
| 75 Years and over | 0 (0.0%) | 55 (30.4%) |
Disability Class: Ambulatory Difficulty
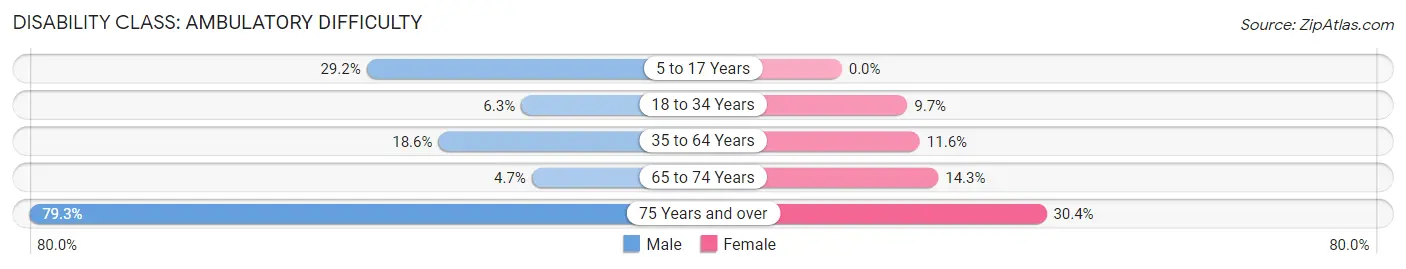
| Age Bracket | Male | Female |
| 5 to 17 Years | 19 (29.2%) | 0 (0.0%) |
| 18 to 34 Years | 18 (6.3%) | 32 (9.7%) |
| 35 to 64 Years | 127 (18.6%) | 79 (11.6%) |
| 65 to 74 Years | 11 (4.7%) | 50 (14.3%) |
| 75 Years and over | 115 (79.3%) | 55 (30.4%) |
Disability Class: Self-Care Difficulty
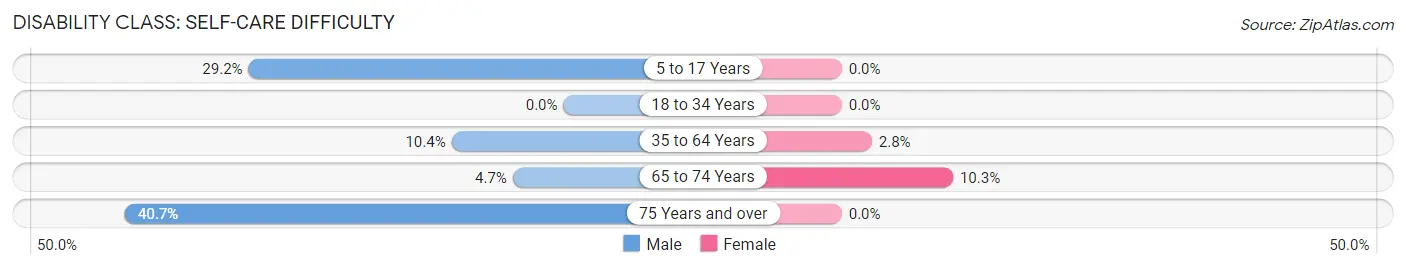
| Age Bracket | Male | Female |
| 5 to 17 Years | 19 (29.2%) | 0 (0.0%) |
| 18 to 34 Years | 0 (0.0%) | 0 (0.0%) |
| 35 to 64 Years | 71 (10.4%) | 19 (2.8%) |
| 65 to 74 Years | 11 (4.7%) | 36 (10.3%) |
| 75 Years and over | 59 (40.7%) | 0 (0.0%) |
Technology Access in Eastland
Computing Device Access in Eastland
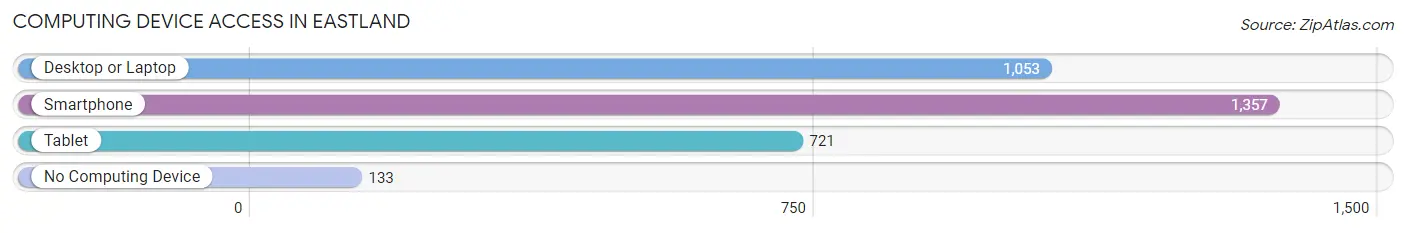
| Device Type | # Households | % Households |
| Desktop or Laptop | 1,053 | 68.8% |
| Smartphone | 1,357 | 88.7% |
| Tablet | 721 | 47.1% |
| No Computing Device | 133 | 8.7% |
| Total | 1,530 | 100.0% |
Internet Access in Eastland
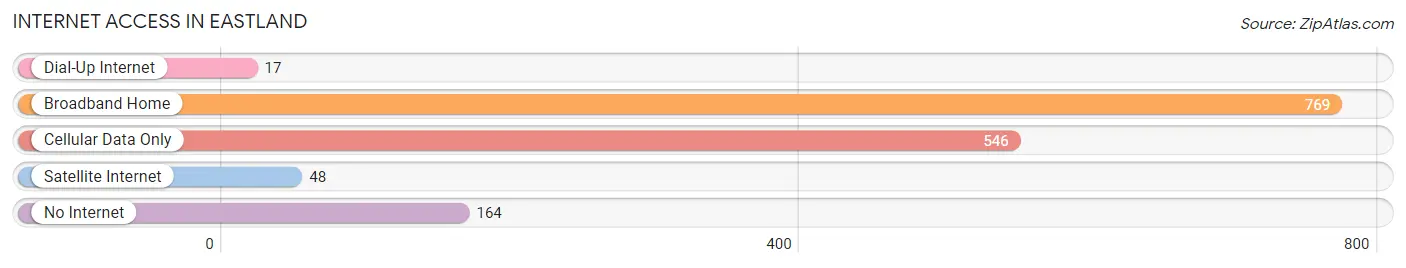
| Internet Type | # Households | % Households |
| Dial-Up Internet | 17 | 1.1% |
| Broadband Home | 769 | 50.3% |
| Cellular Data Only | 546 | 35.7% |
| Satellite Internet | 48 | 3.1% |
| No Internet | 164 | 10.7% |
| Total | 1,530 | 100.0% |
Eastland Summary
Eastland, Texas is a small town located in Eastland County, Texas. It is situated in the western part of the state, about 100 miles west of Fort Worth. The town was founded in 1873 and has a population of about 3,000 people.
History
Eastland was founded in 1873 by a group of settlers from Illinois. The town was named after Eastland County, which was created in 1858. The first settlers were attracted to the area due to its fertile soil and abundant water supply. The town quickly grew and by 1876, it had a population of over 500 people.
In 1877, the Texas and Pacific Railway was built through Eastland, connecting it to other towns in the area. This allowed for the growth of the town and the development of businesses. In 1881, the first school was built in Eastland and the town was incorporated in 1882.
In the early 1900s, Eastland experienced a period of growth and prosperity. The town was home to several businesses, including a cotton gin, a flour mill, and a brick factory. The town also had a newspaper, a bank, and a hotel.
In the 1920s, Eastland experienced a period of decline due to the Great Depression. Many businesses closed and the population decreased. However, the town was able to recover in the 1940s and 1950s due to the oil boom in the area.
Geography
Eastland is located in the western part of Texas, about 100 miles west of Fort Worth. The town is situated in Eastland County, which is part of the Edwards Plateau region. The town is located at the intersection of U.S. Highway 80 and State Highway 6.
The terrain around Eastland is mostly flat with some rolling hills. The town is located in a semi-arid climate, with hot summers and mild winters. The average annual temperature is around 70 degrees Fahrenheit.
Economy
The economy of Eastland is largely based on agriculture and oil production. The town is home to several farms, which produce cotton, wheat, and other crops. The town is also home to several oil and gas companies, which produce oil and natural gas from the surrounding area.
In addition to agriculture and oil production, Eastland is home to several businesses, including restaurants, retail stores, and service providers. The town is also home to several manufacturing companies, which produce a variety of products, including furniture, clothing, and electronics.
Demographics
As of the 2010 census, the population of Eastland was 3,068. The town is predominantly white, with about 85% of the population being white. The remaining 15% of the population is made up of African Americans, Hispanics, and other races.
The median household income in Eastland is $37,000, which is slightly lower than the national average. The town has a poverty rate of about 17%, which is slightly higher than the national average.
Conclusion
Eastland, Texas is a small town located in Eastland County, Texas. It was founded in 1873 and has a population of about 3,000 people. The town is largely based on agriculture and oil production, and is home to several businesses, including restaurants, retail stores, and service providers. The town is predominantly white, with about 85% of the population being white. The median household income in Eastland is $37,000, which is slightly lower than the national average.
Common Questions
What is Per Capita Income in Eastland?
Per Capita income in Eastland is $33,667.
What is the Median Family Income in Eastland?
Median Family Income in Eastland is $87,323.
What is the Median Household income in Eastland?
Median Household Income in Eastland is $55,802.
What is Income or Wage Gap in Eastland?
Income or Wage Gap in Eastland is 16.0%.
Women in Eastland earn 84.0 cents for every dollar earned by a man.
What is Inequality or Gini Index in Eastland?
Inequality or Gini Index in Eastland is 0.50.
What is the Total Population of Eastland?
Total Population of Eastland is 3,627.
What is the Total Male Population of Eastland?
Total Male Population of Eastland is 1,517.
What is the Total Female Population of Eastland?
Total Female Population of Eastland is 2,110.
What is the Ratio of Males per 100 Females in Eastland?
There are 71.90 Males per 100 Females in Eastland.
What is the Ratio of Females per 100 Males in Eastland?
There are 139.09 Females per 100 Males in Eastland.
What is the Median Population Age in Eastland?
Median Population Age in Eastland is 44.7 Years.
What is the Average Family Size in Eastland
Average Family Size in Eastland is 2.8 People.
What is the Average Household Size in Eastland
Average Household Size in Eastland is 2.3 People.
How Large is the Labor Force in Eastland?
There are 1,705 People in the Labor Forcein in Eastland.
What is the Percentage of People in the Labor Force in Eastland?
56.7% of People are in the Labor Force in Eastland.
What is the Unemployment Rate in Eastland?
Unemployment Rate in Eastland is 4.0%.