Riverside, TX Map & Demographics
Riverside Map
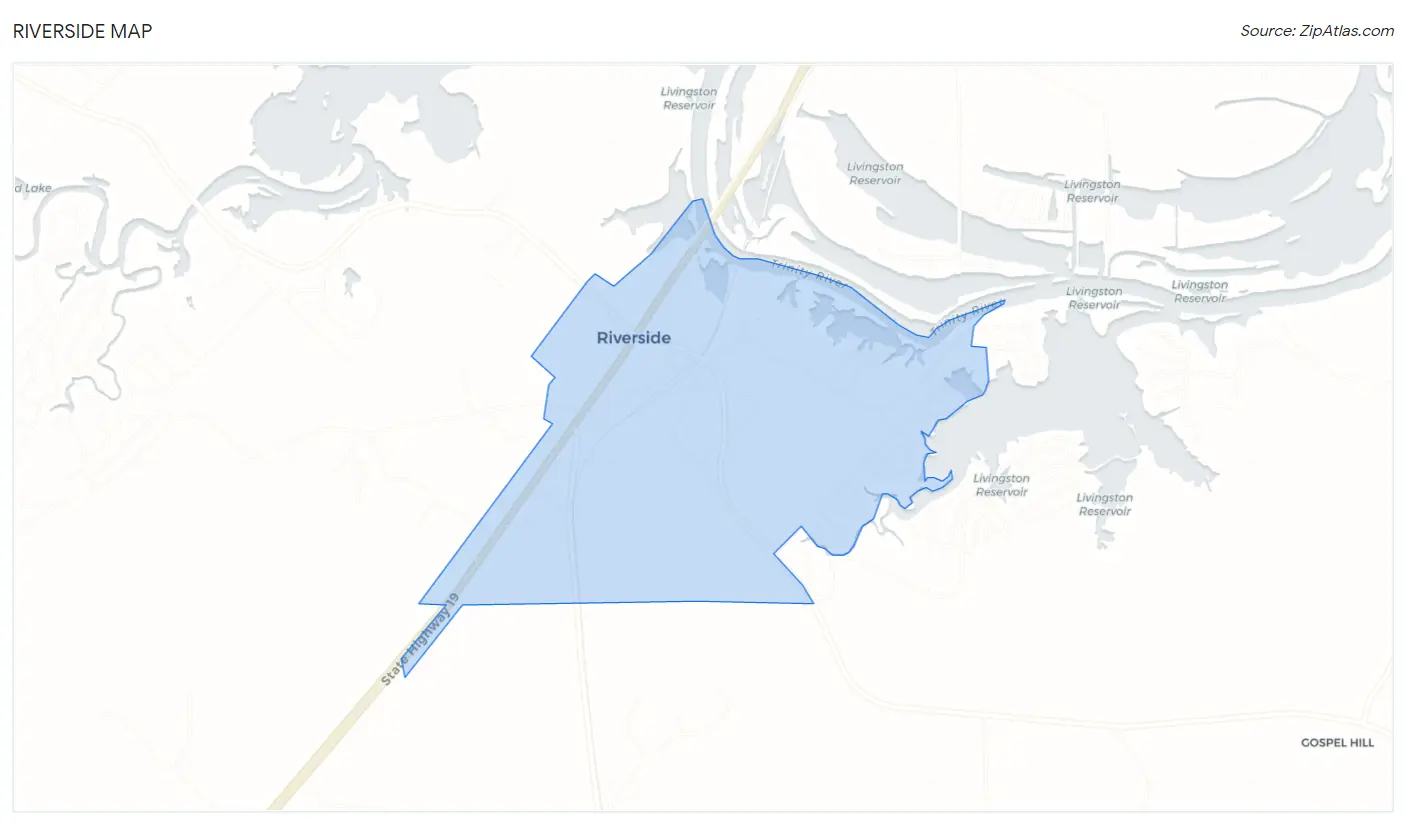
Riverside Overview
$34,867
PER CAPITA INCOME
$70,659
AVG FAMILY INCOME
$66,607
AVG HOUSEHOLD INCOME
39.6%
WAGE / INCOME GAP [ % ]
60.4¢/ $1
WAGE / INCOME GAP [ $ ]
0.42
INEQUALITY / GINI INDEX
659
TOTAL POPULATION
363
MALE POPULATION
296
FEMALE POPULATION
122.64
MALES / 100 FEMALES
81.54
FEMALES / 100 MALES
49.6
MEDIAN AGE
2.6
AVG FAMILY SIZE
2.1
AVG HOUSEHOLD SIZE
258
LABOR FORCE [ PEOPLE ]
47.6%
PERCENT IN LABOR FORCE
0.4%
UNEMPLOYMENT RATE
Riverside Zip Codes
Riverside Area Codes
Income in Riverside
Income Overview in Riverside
Per Capita Income in Riverside is $34,867, while median incomes of families and households are $70,659 and $66,607 respectively.
| Characteristic | Number | Measure |
| Per Capita Income | 659 | $34,867 |
| Median Family Income | 207 | $70,659 |
| Mean Family Income | 207 | $85,212 |
| Median Household Income | 319 | $66,607 |
| Mean Household Income | 319 | $71,108 |
| Income Deficit | 207 | $0 |
| Wage / Income Gap (%) | 659 | 39.55% |
| Wage / Income Gap ($) | 659 | 60.45¢ per $1 |
| Gini / Inequality Index | 659 | 0.42 |
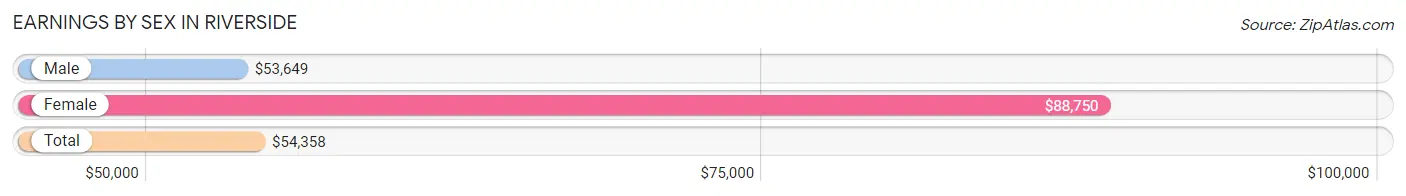
Earnings by Sex in Riverside
Average Earnings in Riverside are $54,358, $53,649 for men and $88,750 for women, a difference of 39.6%.
| Sex | Number | Average Earnings |
| Male | 184 (71.3%) | $53,649 |
| Female | 74 (28.7%) | $88,750 |
| Total | 258 (100.0%) | $54,358 |
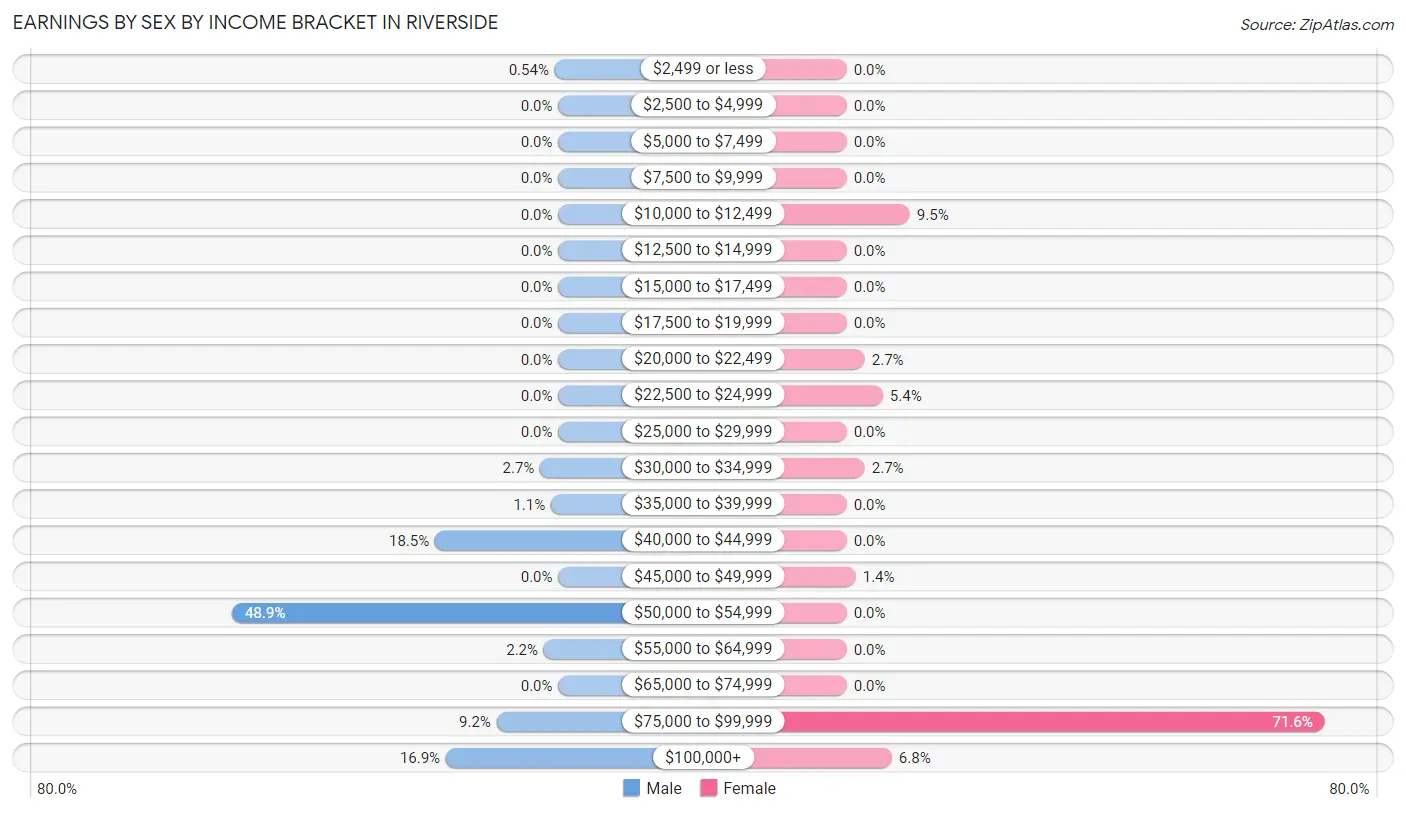
Earnings by Sex by Income Bracket in Riverside
The most common earnings brackets in Riverside are $50,000 to $54,999 for men (90 | 48.9%) and $75,000 to $99,999 for women (53 | 71.6%).
| Income | Male | Female |
| $2,499 or less | 1 (0.5%) | 0 (0.0%) |
| $2,500 to $4,999 | 0 (0.0%) | 0 (0.0%) |
| $5,000 to $7,499 | 0 (0.0%) | 0 (0.0%) |
| $7,500 to $9,999 | 0 (0.0%) | 0 (0.0%) |
| $10,000 to $12,499 | 0 (0.0%) | 7 (9.5%) |
| $12,500 to $14,999 | 0 (0.0%) | 0 (0.0%) |
| $15,000 to $17,499 | 0 (0.0%) | 0 (0.0%) |
| $17,500 to $19,999 | 0 (0.0%) | 0 (0.0%) |
| $20,000 to $22,499 | 0 (0.0%) | 2 (2.7%) |
| $22,500 to $24,999 | 0 (0.0%) | 4 (5.4%) |
| $25,000 to $29,999 | 0 (0.0%) | 0 (0.0%) |
| $30,000 to $34,999 | 5 (2.7%) | 2 (2.7%) |
| $35,000 to $39,999 | 2 (1.1%) | 0 (0.0%) |
| $40,000 to $44,999 | 34 (18.5%) | 0 (0.0%) |
| $45,000 to $49,999 | 0 (0.0%) | 1 (1.3%) |
| $50,000 to $54,999 | 90 (48.9%) | 0 (0.0%) |
| $55,000 to $64,999 | 4 (2.2%) | 0 (0.0%) |
| $65,000 to $74,999 | 0 (0.0%) | 0 (0.0%) |
| $75,000 to $99,999 | 17 (9.2%) | 53 (71.6%) |
| $100,000+ | 31 (16.9%) | 5 (6.8%) |
| Total | 184 (100.0%) | 74 (100.0%) |
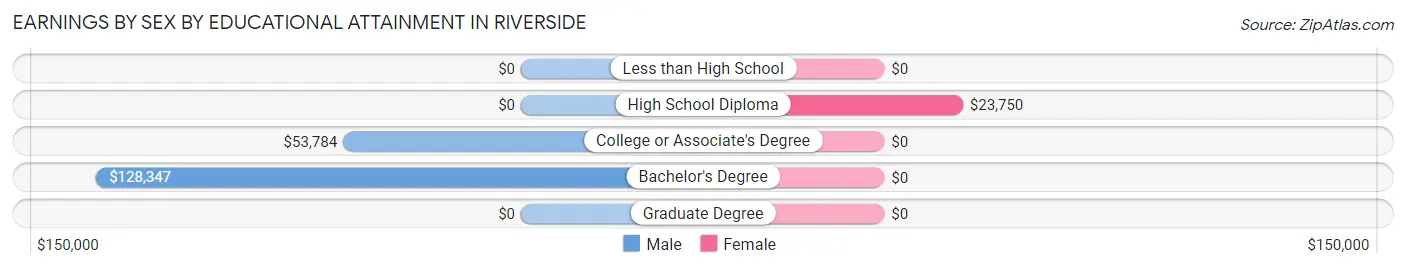
Earnings by Sex by Educational Attainment in Riverside
Average earnings in Riverside are $53,767 for men and $88,750 for women, a difference of 39.4%. Men with an educational attainment of bachelor's degree enjoy the highest average annual earnings of $128,347, while those with college or associate's degree education earn the least with $53,784. Women with an educational attainment of high school diploma earn the most with the average annual earnings of $23,750, while those with high school diploma education have the smallest earnings of $23,750.
| Educational Attainment | Male Income | Female Income |
| Less than High School | - | - |
| High School Diploma | - | - |
| College or Associate's Degree | $53,784 | $0 |
| Bachelor's Degree | $128,347 | $0 |
| Graduate Degree | - | - |
| Total | $53,767 | $88,750 |
Family Income in Riverside
Family Income Brackets in Riverside
According to the Riverside family income data, there are 130 families falling into the $50,000 to $74,999 income range, which is the most common income bracket and makes up 62.8% of all families.
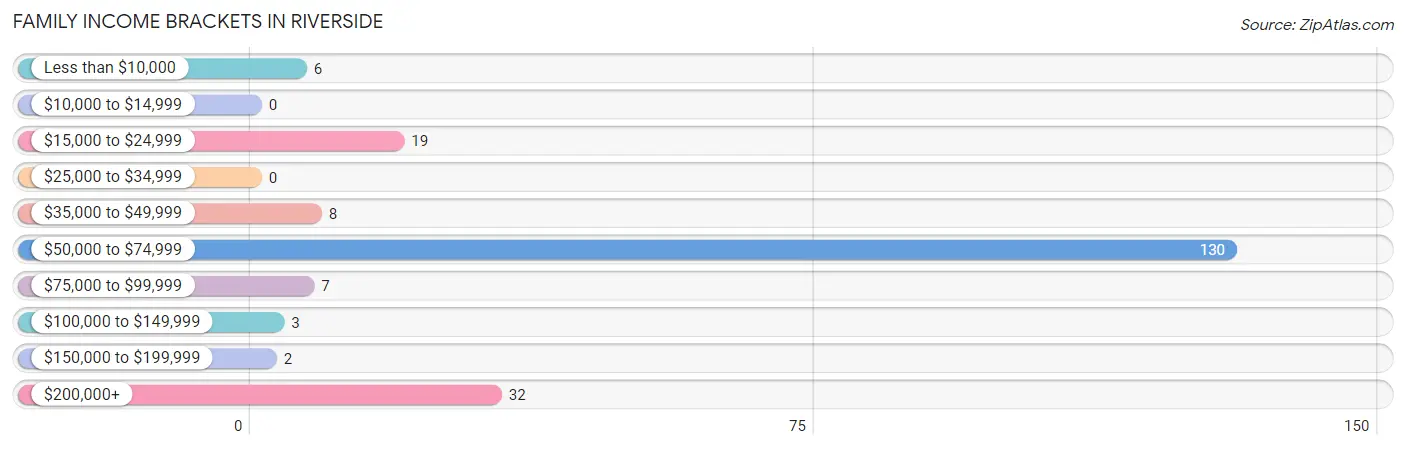
| Income Bracket | # Families | % Families |
| Less than $10,000 | 6 | 2.9% |
| $10,000 to $14,999 | 0 | 0.0% |
| $15,000 to $24,999 | 19 | 9.2% |
| $25,000 to $34,999 | 0 | 0.0% |
| $35,000 to $49,999 | 8 | 3.9% |
| $50,000 to $74,999 | 130 | 62.8% |
| $75,000 to $99,999 | 7 | 3.4% |
| $100,000 to $149,999 | 3 | 1.4% |
| $150,000 to $199,999 | 2 | 1.0% |
| $200,000+ | 32 | 15.5% |
Family Income by Famaliy Size in Riverside
4-person families (38 | 18.4%) account for the highest median family income in Riverside with $213,468 per family, while 4-person families (38 | 18.4%) have the highest median income of $53,367 per family member.
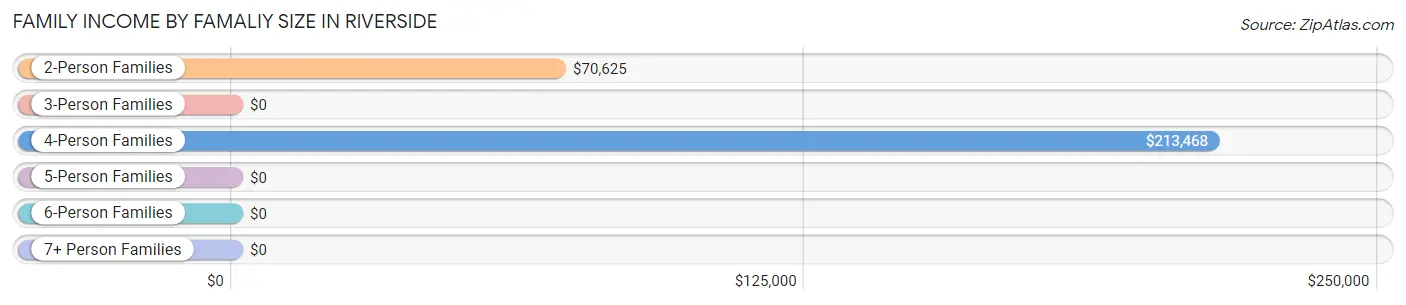
| Income Bracket | # Families | Median Income |
| 2-Person Families | 133 (64.2%) | $70,625 |
| 3-Person Families | 7 (3.4%) | $0 |
| 4-Person Families | 38 (18.4%) | $213,468 |
| 5-Person Families | 15 (7.2%) | $0 |
| 6-Person Families | 14 (6.8%) | $0 |
| 7+ Person Families | 0 (0.0%) | $0 |
| Total | 207 (100.0%) | $70,659 |
Family Income by Number of Earners in Riverside
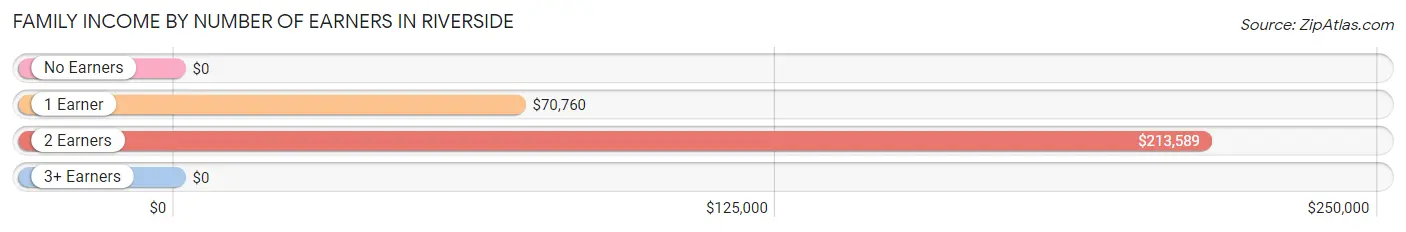
| Number of Earners | # Families | Median Income |
| No Earners | 49 (23.7%) | $0 |
| 1 Earner | 121 (58.5%) | $70,760 |
| 2 Earners | 37 (17.9%) | $213,589 |
| 3+ Earners | 0 (0.0%) | $0 |
| Total | 207 (100.0%) | $70,659 |
Household Income in Riverside
Household Income Brackets in Riverside
With 136 households falling in the category, the $50,000 to $74,999 income range is the most frequent in Riverside, accounting for 42.6% of all households.
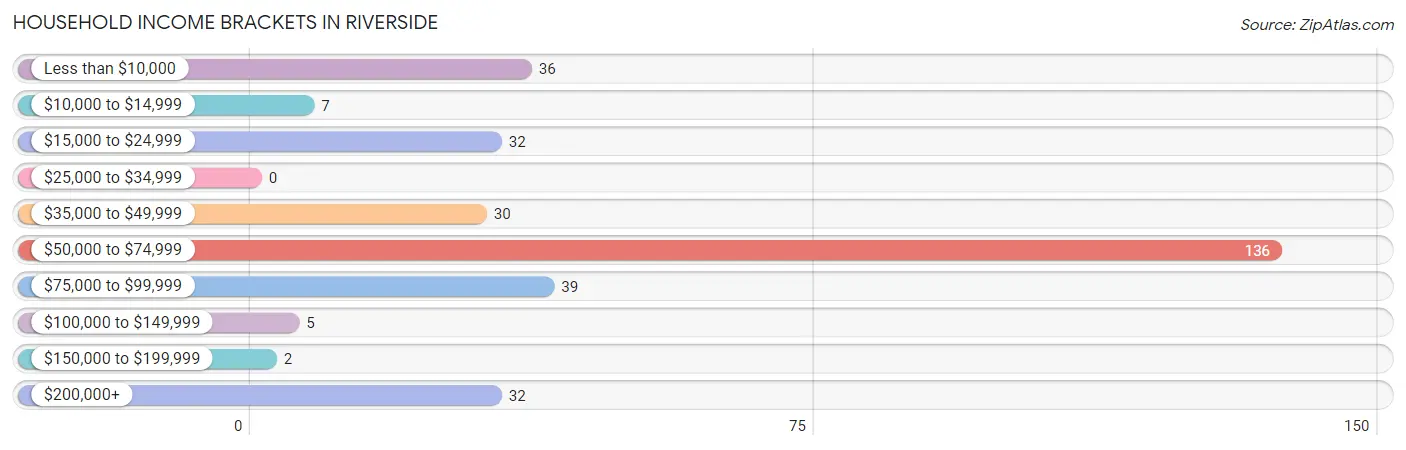
| Income Bracket | # Households | % Households |
| Less than $10,000 | 36 | 11.3% |
| $10,000 to $14,999 | 7 | 2.2% |
| $15,000 to $24,999 | 32 | 10.0% |
| $25,000 to $34,999 | 0 | 0.0% |
| $35,000 to $49,999 | 30 | 9.4% |
| $50,000 to $74,999 | 136 | 42.6% |
| $75,000 to $99,999 | 39 | 12.2% |
| $100,000 to $149,999 | 5 | 1.6% |
| $150,000 to $199,999 | 2 | 0.6% |
| $200,000+ | 32 | 10.0% |
Household Income by Householder Age in Riverside
The median household income in Riverside is $66,607, with the highest median household income of $71,098 found in the 45 to 64 years age bracket for the primary householder. A total of 157 households (49.2%) fall into this category. Meanwhile, the 15 to 24 years age bracket for the primary householder has the lowest median household income of $0, with 7 households (2.2%) in this group.
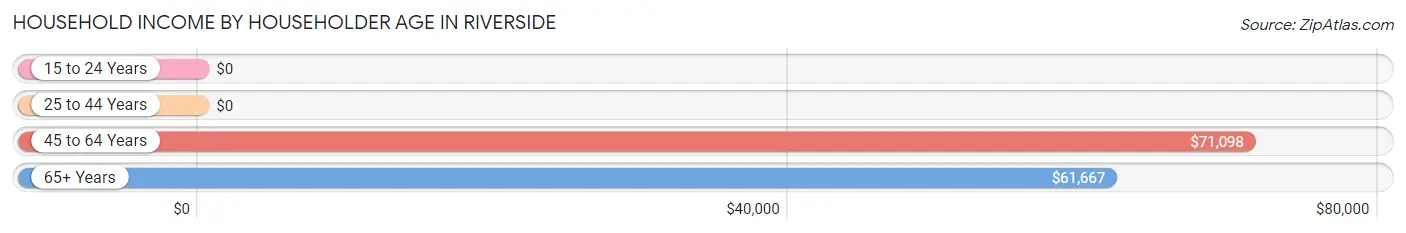
| Income Bracket | # Households | Median Income |
| 15 to 24 Years | 7 (2.2%) | $0 |
| 25 to 44 Years | 111 (34.8%) | $0 |
| 45 to 64 Years | 157 (49.2%) | $71,098 |
| 65+ Years | 44 (13.8%) | $61,667 |
| Total | 319 (100.0%) | $66,607 |
Poverty in Riverside
Income Below Poverty by Sex and Age in Riverside
With 11.8% poverty level for males and 12.5% for females among the residents of Riverside, 25 to 34 year old males and 55 to 64 year old females are the most vulnerable to poverty, with 30 males (49.2%) and 19 females (32.8%) in their respective age groups living below the poverty level.
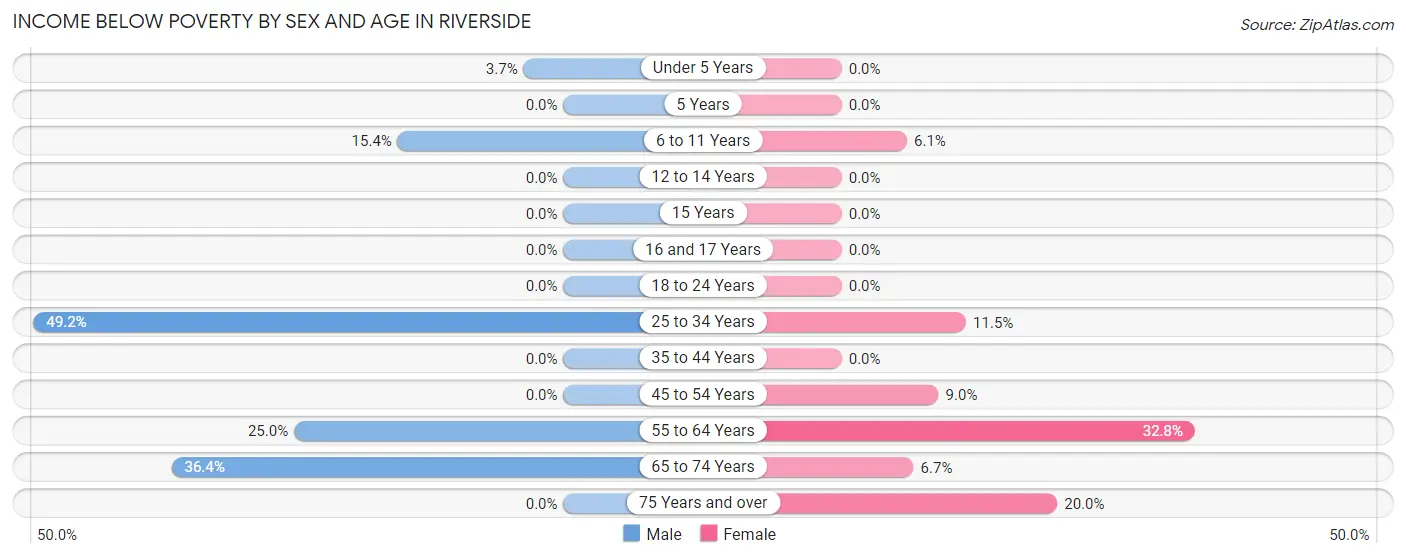
| Age Bracket | Male | Female |
| Under 5 Years | 2 (3.7%) | 0 (0.0%) |
| 5 Years | 0 (0.0%) | 0 (0.0%) |
| 6 to 11 Years | 2 (15.4%) | 2 (6.1%) |
| 12 to 14 Years | 0 (0.0%) | 0 (0.0%) |
| 15 Years | 0 (0.0%) | 0 (0.0%) |
| 16 and 17 Years | 0 (0.0%) | 0 (0.0%) |
| 18 to 24 Years | 0 (0.0%) | 0 (0.0%) |
| 25 to 34 Years | 30 (49.2%) | 3 (11.5%) |
| 35 to 44 Years | 0 (0.0%) | 0 (0.0%) |
| 45 to 54 Years | 0 (0.0%) | 8 (9.0%) |
| 55 to 64 Years | 1 (25.0%) | 19 (32.8%) |
| 65 to 74 Years | 8 (36.4%) | 2 (6.7%) |
| 75 Years and over | 0 (0.0%) | 3 (20.0%) |
| Total | 43 (11.8%) | 37 (12.5%) |
Income Above Poverty by Sex and Age in Riverside
According to the poverty statistics in Riverside, males aged 5 years and females aged under 5 years are the age groups that are most secure financially, with 100.0% of males and 100.0% of females in these age groups living above the poverty line.
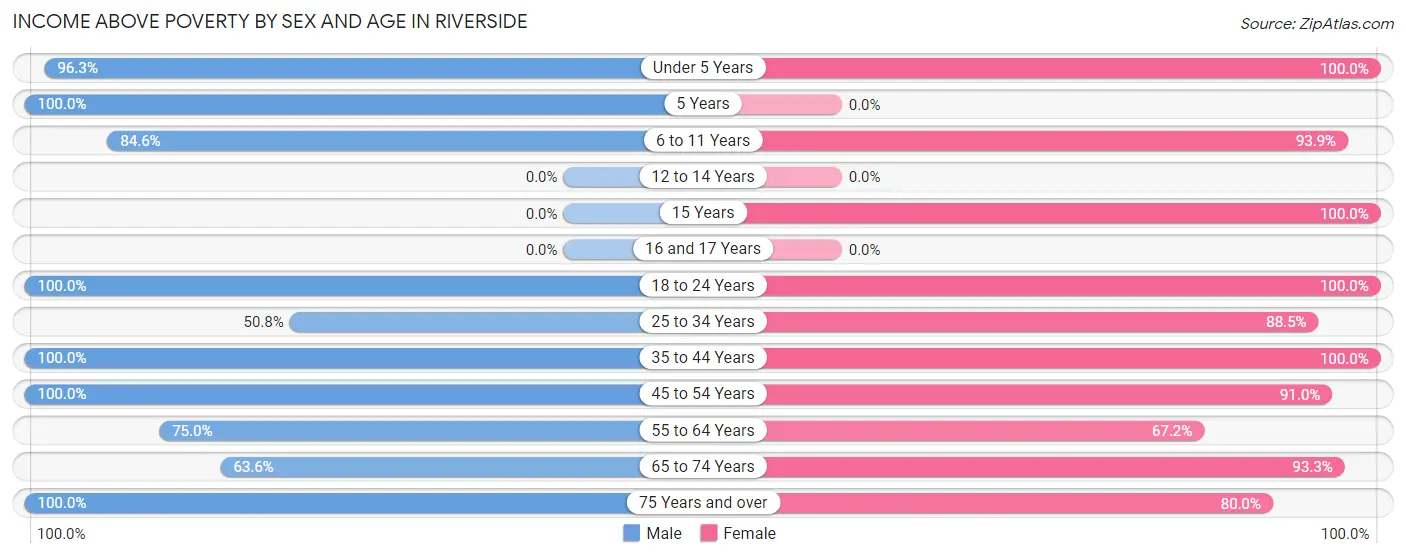
| Age Bracket | Male | Female |
| Under 5 Years | 52 (96.3%) | 5 (100.0%) |
| 5 Years | 10 (100.0%) | 0 (0.0%) |
| 6 to 11 Years | 11 (84.6%) | 31 (93.9%) |
| 12 to 14 Years | 0 (0.0%) | 0 (0.0%) |
| 15 Years | 0 (0.0%) | 2 (100.0%) |
| 16 and 17 Years | 0 (0.0%) | 0 (0.0%) |
| 18 to 24 Years | 7 (100.0%) | 6 (100.0%) |
| 25 to 34 Years | 31 (50.8%) | 23 (88.5%) |
| 35 to 44 Years | 55 (100.0%) | 32 (100.0%) |
| 45 to 54 Years | 111 (100.0%) | 81 (91.0%) |
| 55 to 64 Years | 3 (75.0%) | 39 (67.2%) |
| 65 to 74 Years | 14 (63.6%) | 28 (93.3%) |
| 75 Years and over | 26 (100.0%) | 12 (80.0%) |
| Total | 320 (88.1%) | 259 (87.5%) |
Income Below Poverty Among Married-Couple Families in Riverside
The poverty statistics for married-couple families in Riverside show that 11.3% or 22 of the total 194 families live below the poverty line. Families with no children have the highest poverty rate of 17.1%, comprising of 22 families. On the other hand, families with 1 or 2 children have the lowest poverty rate of 0.0%, which includes 0 families.
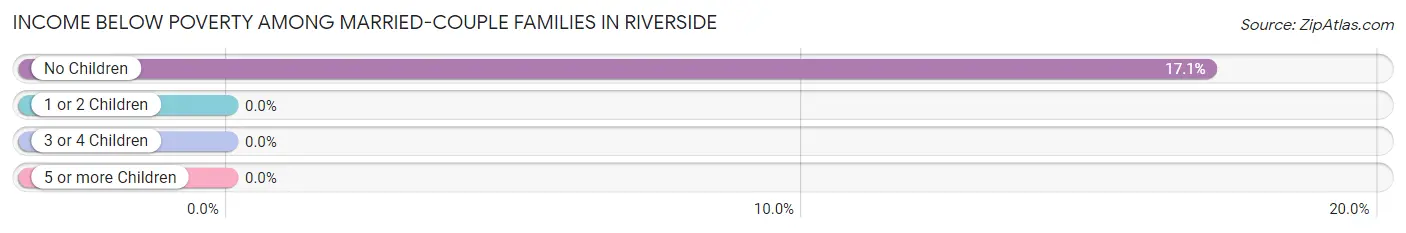
| Children | Above Poverty | Below Poverty |
| No Children | 107 (83.0%) | 22 (17.1%) |
| 1 or 2 Children | 51 (100.0%) | 0 (0.0%) |
| 3 or 4 Children | 14 (100.0%) | 0 (0.0%) |
| 5 or more Children | 0 (0.0%) | 0 (0.0%) |
| Total | 172 (88.7%) | 22 (11.3%) |
Income Below Poverty Among Single-Parent Households in Riverside
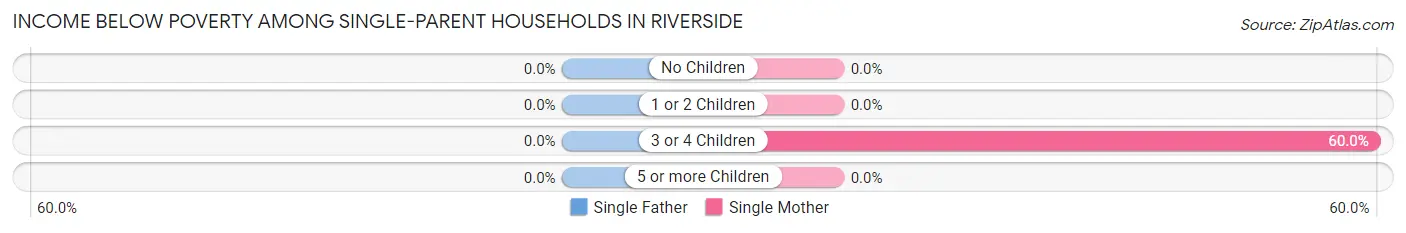
| Children | Single Father | Single Mother |
| No Children | 0 (0.0%) | 0 (0.0%) |
| 1 or 2 Children | 0 (0.0%) | 0 (0.0%) |
| 3 or 4 Children | 0 (0.0%) | 3 (60.0%) |
| 5 or more Children | 0 (0.0%) | 0 (0.0%) |
| Total | 0 (0.0%) | 3 (60.0%) |
Income Below Poverty Among Married-Couple vs Single-Parent Households in Riverside
The poverty data for Riverside shows that 22 of the married-couple family households (11.3%) and 3 of the single-parent households (23.1%) are living below the poverty level. Within the married-couple family households, those with no children have the highest poverty rate, with 22 households (17.1%) falling below the poverty line. Among the single-parent households, those with 3 or 4 children have the highest poverty rate, with 3 household (60.0%) living below poverty.
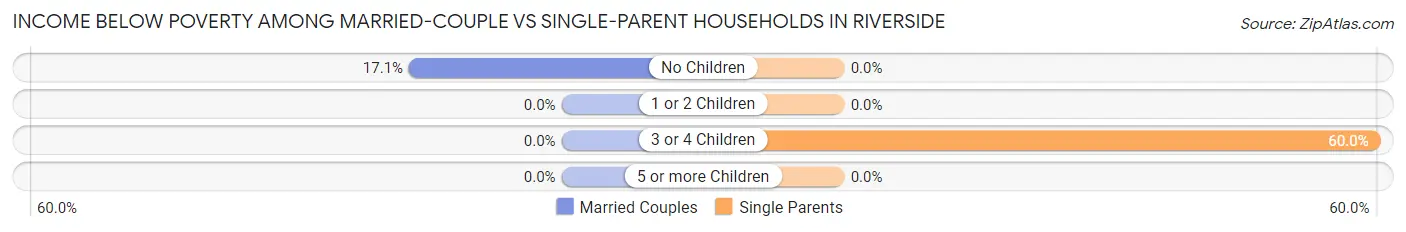
| Children | Married-Couple Families | Single-Parent Households |
| No Children | 22 (17.1%) | 0 (0.0%) |
| 1 or 2 Children | 0 (0.0%) | 0 (0.0%) |
| 3 or 4 Children | 0 (0.0%) | 3 (60.0%) |
| 5 or more Children | 0 (0.0%) | 0 (0.0%) |
| Total | 22 (11.3%) | 3 (23.1%) |
Race in Riverside
The most populous races in Riverside are White / Caucasian (631 | 95.8%), Black / African American (23 | 3.5%), and Hispanic or Latino (6 | 0.9%).
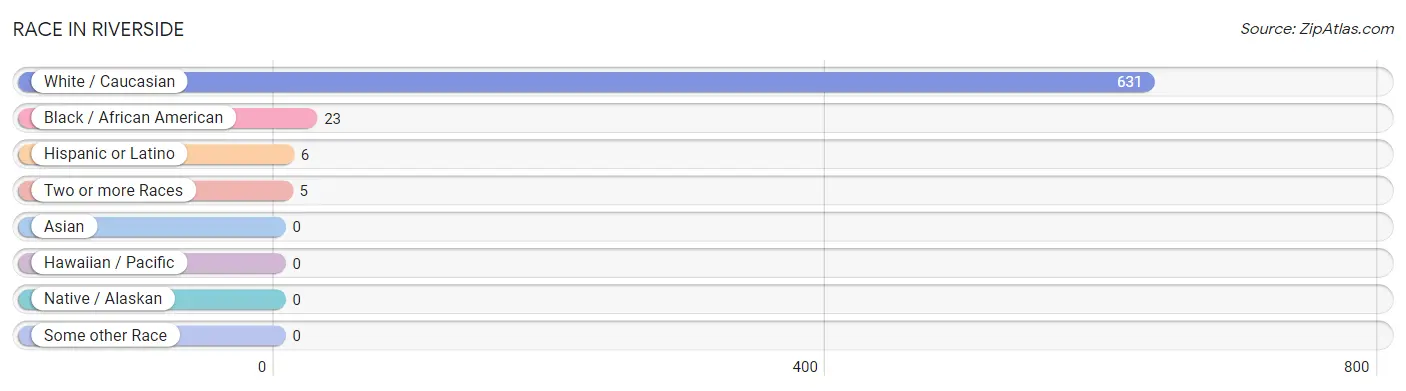
| Race | # Population | % Population |
| Asian | 0 | 0.0% |
| Black / African American | 23 | 3.5% |
| Hawaiian / Pacific | 0 | 0.0% |
| Hispanic or Latino | 6 | 0.9% |
| Native / Alaskan | 0 | 0.0% |
| White / Caucasian | 631 | 95.8% |
| Two or more Races | 5 | 0.8% |
| Some other Race | 0 | 0.0% |
| Total | 659 | 100.0% |
Ancestry in Riverside
The most populous ancestries reported in Riverside are English (140 | 21.2%), French (126 | 19.1%), American (118 | 17.9%), Italian (78 | 11.8%), and European (74 | 11.2%), together accounting for 81.3% of all Riverside residents.
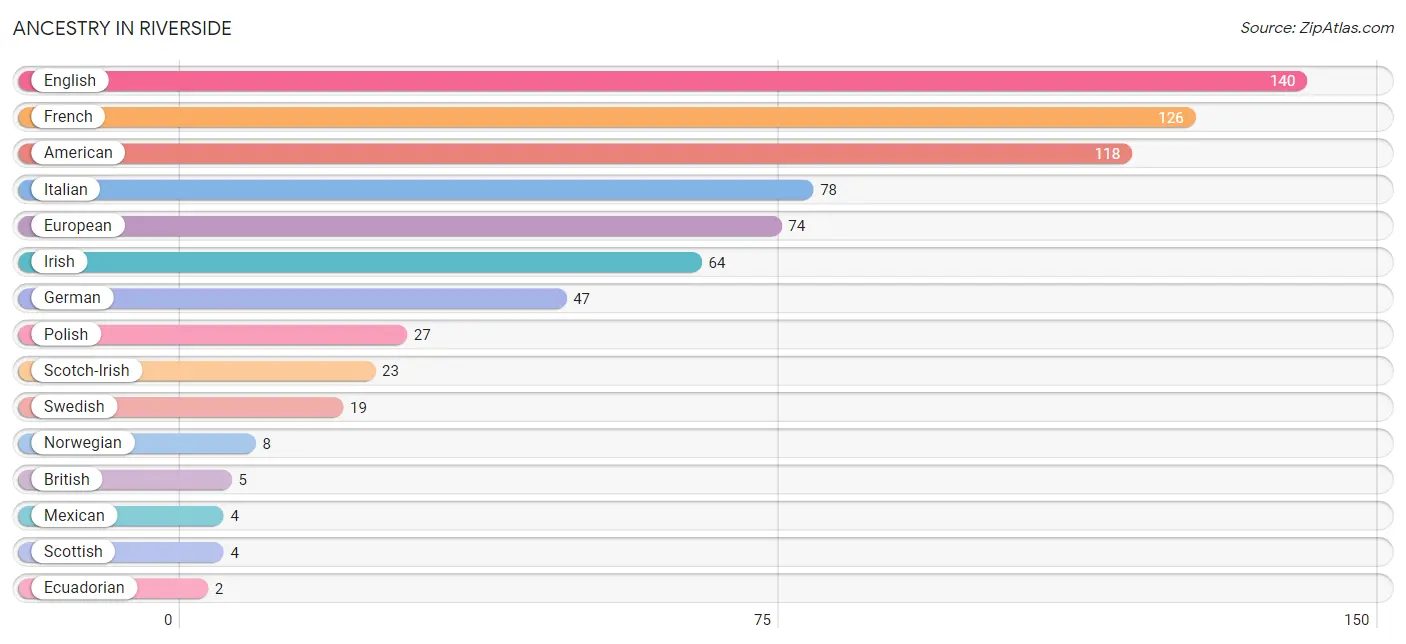
| Ancestry | # Population | % Population |
| American | 118 | 17.9% |
| British | 5 | 0.8% |
| Ecuadorian | 2 | 0.3% |
| English | 140 | 21.2% |
| European | 74 | 11.2% |
| French | 126 | 19.1% |
| German | 47 | 7.1% |
| Irish | 64 | 9.7% |
| Italian | 78 | 11.8% |
| Mexican | 4 | 0.6% |
| Norwegian | 8 | 1.2% |
| Polish | 27 | 4.1% |
| Scotch-Irish | 23 | 3.5% |
| Scottish | 4 | 0.6% |
| Seminole | 2 | 0.3% |
| South American | 2 | 0.3% |
| Swedish | 19 | 2.9% | View All 17 Rows |
Immigrants in Riverside

| Immigration Origin | # Population | % Population | View All 0 Rows |
Sex and Age in Riverside
Sex and Age in Riverside
The most populous age groups in Riverside are 50 to 54 Years (79 | 21.8%) for men and 50 to 54 Years (88 | 29.7%) for women.
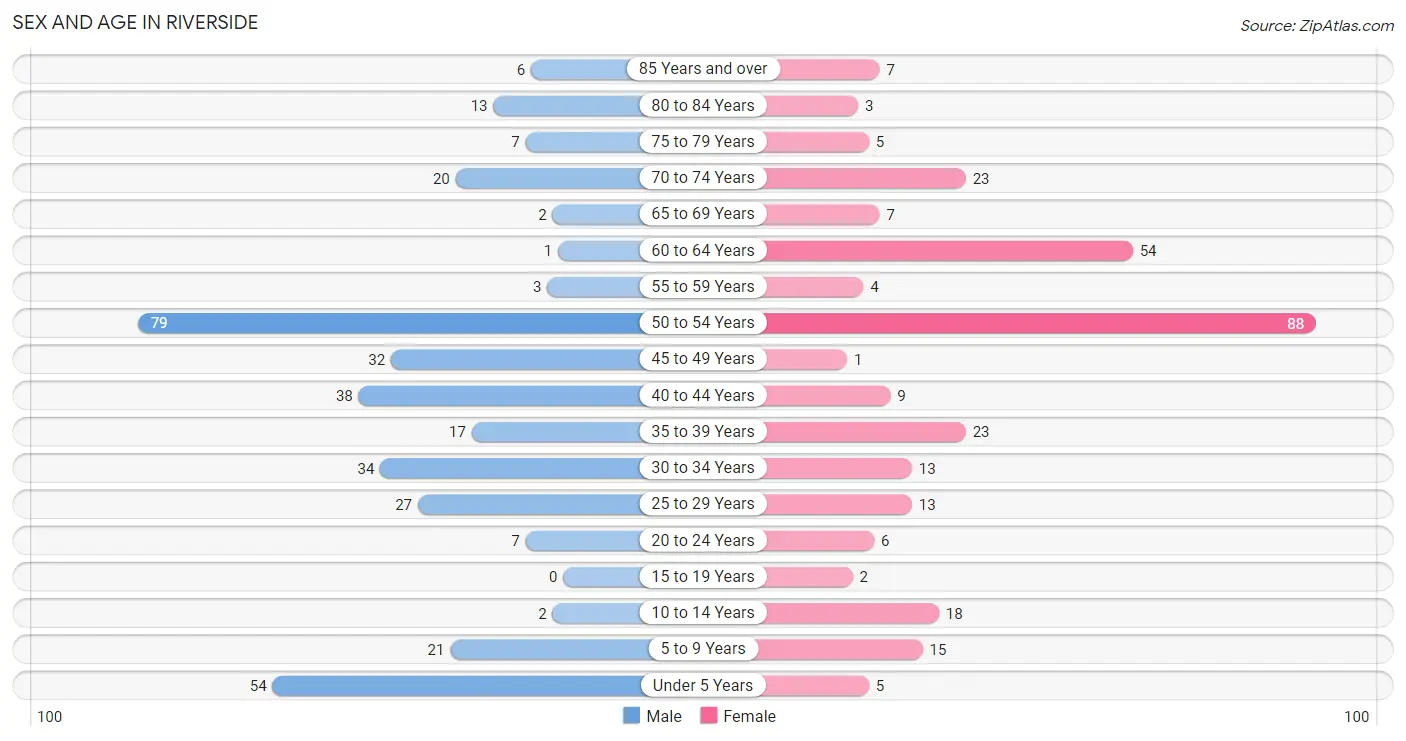
| Age Bracket | Male | Female |
| Under 5 Years | 54 (14.9%) | 5 (1.7%) |
| 5 to 9 Years | 21 (5.8%) | 15 (5.1%) |
| 10 to 14 Years | 2 (0.5%) | 18 (6.1%) |
| 15 to 19 Years | 0 (0.0%) | 2 (0.7%) |
| 20 to 24 Years | 7 (1.9%) | 6 (2.0%) |
| 25 to 29 Years | 27 (7.4%) | 13 (4.4%) |
| 30 to 34 Years | 34 (9.4%) | 13 (4.4%) |
| 35 to 39 Years | 17 (4.7%) | 23 (7.8%) |
| 40 to 44 Years | 38 (10.5%) | 9 (3.0%) |
| 45 to 49 Years | 32 (8.8%) | 1 (0.3%) |
| 50 to 54 Years | 79 (21.8%) | 88 (29.7%) |
| 55 to 59 Years | 3 (0.8%) | 4 (1.3%) |
| 60 to 64 Years | 1 (0.3%) | 54 (18.2%) |
| 65 to 69 Years | 2 (0.5%) | 7 (2.4%) |
| 70 to 74 Years | 20 (5.5%) | 23 (7.8%) |
| 75 to 79 Years | 7 (1.9%) | 5 (1.7%) |
| 80 to 84 Years | 13 (3.6%) | 3 (1.0%) |
| 85 Years and over | 6 (1.7%) | 7 (2.4%) |
| Total | 363 (100.0%) | 296 (100.0%) |
Families and Households in Riverside
Median Family Size in Riverside
The median family size in Riverside is 2.61 persons per family, with single female/mother families (5 | 2.4%) accounting for the largest median family size of 5 persons per family. On the other hand, single male/father families (8 | 3.9%) represent the smallest median family size with 2.50 persons per family.
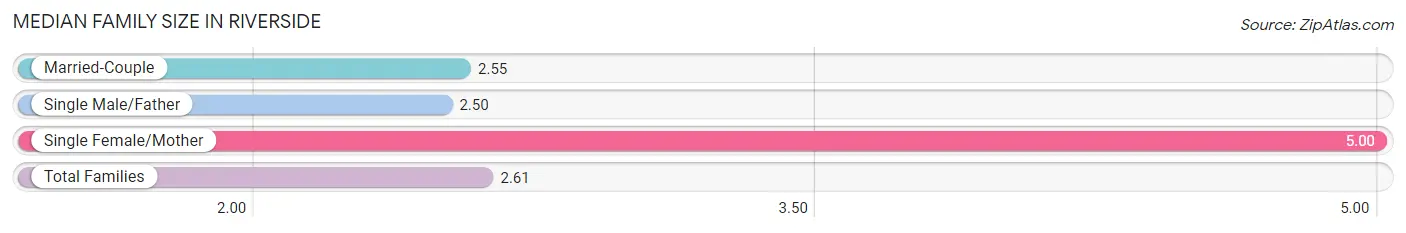
| Family Type | # Families | Family Size |
| Married-Couple | 194 (93.7%) | 2.55 |
| Single Male/Father | 8 (3.9%) | 2.50 |
| Single Female/Mother | 5 (2.4%) | 5.00 |
| Total Families | 207 (100.0%) | 2.61 |
Median Household Size in Riverside
The median household size in Riverside is 2.07 persons per household, with single female/mother households (5 | 1.6%) accounting for the largest median household size of 5 persons per household. non-family households (112 | 35.1%) represent the smallest median household size with 1.06 persons per household.
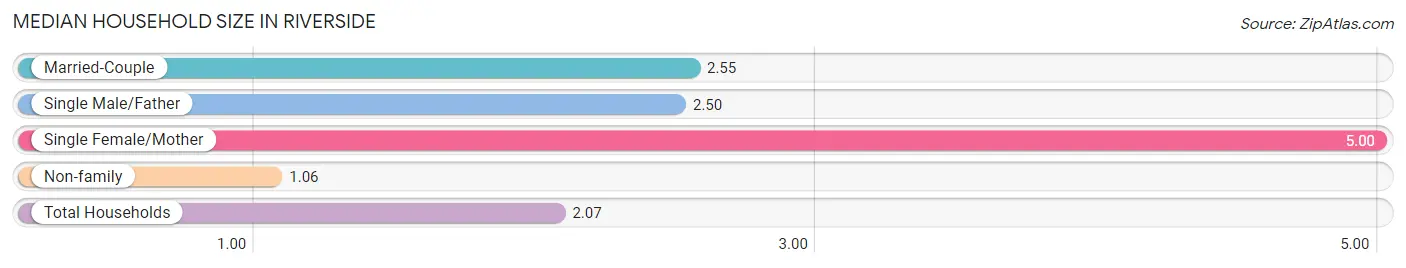
| Household Type | # Households | Household Size |
| Married-Couple | 194 (60.8%) | 2.55 |
| Single Male/Father | 8 (2.5%) | 2.50 |
| Single Female/Mother | 5 (1.6%) | 5.00 |
| Non-family | 112 (35.1%) | 1.06 |
| Total Households | 319 (100.0%) | 2.07 |
Household Size by Marriage Status in Riverside
Out of a total of 319 households in Riverside, 207 (64.9%) are family households, while 112 (35.1%) are nonfamily households. The most numerous type of family households are 2-person households, comprising 133, and the most common type of nonfamily households are 1-person households, comprising 110.
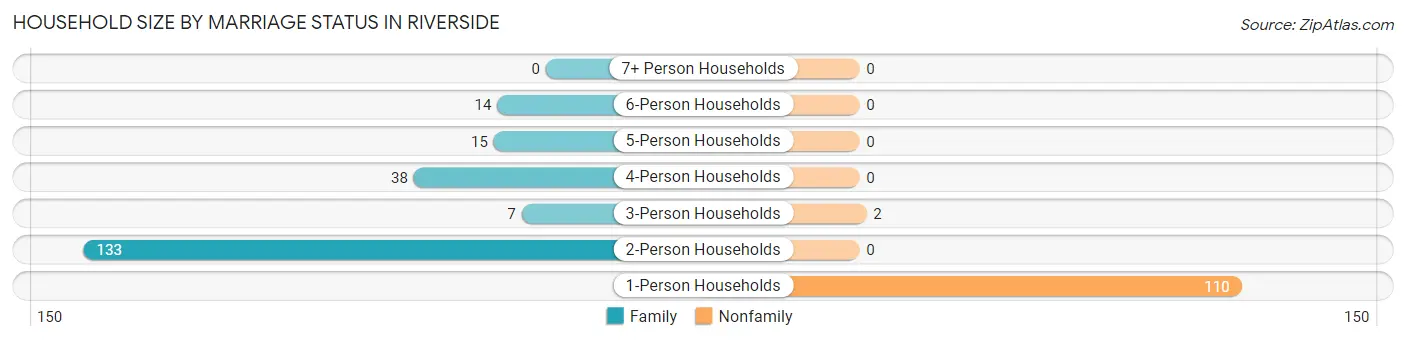
| Household Size | Family Households | Nonfamily Households |
| 1-Person Households | - | 110 (34.5%) |
| 2-Person Households | 133 (41.7%) | 0 (0.0%) |
| 3-Person Households | 7 (2.2%) | 2 (0.6%) |
| 4-Person Households | 38 (11.9%) | 0 (0.0%) |
| 5-Person Households | 15 (4.7%) | 0 (0.0%) |
| 6-Person Households | 14 (4.4%) | 0 (0.0%) |
| 7+ Person Households | 0 (0.0%) | 0 (0.0%) |
| Total | 207 (64.9%) | 112 (35.1%) |
Female Fertility in Riverside
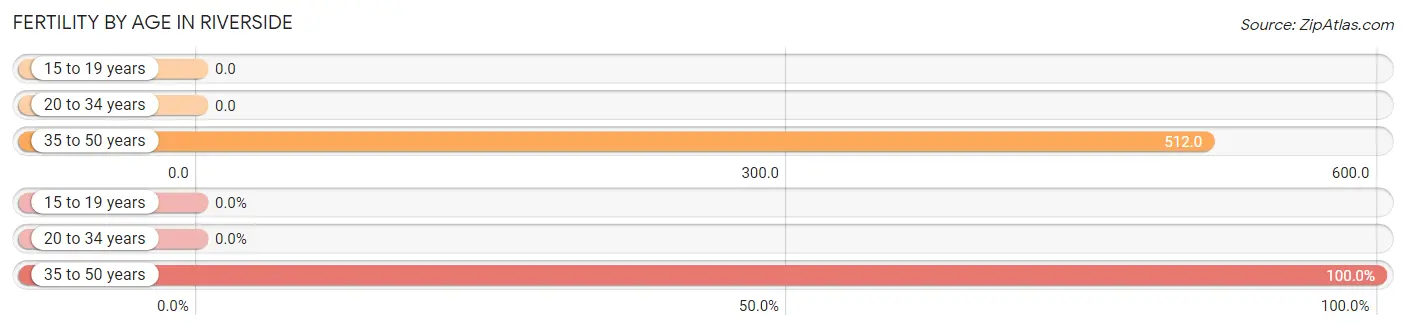
Fertility by Age in Riverside
Average fertility rate in Riverside is 280.0 births per 1,000 women. Women in the age bracket of 35 to 50 years have the highest fertility rate with 512.0 births per 1,000 women. Women in the age bracket of 35 to 50 years acount for 100.0% of all women with births.
| Age Bracket | Women with Births | Births / 1,000 Women |
| 15 to 19 years | 0 (0.0%) | 0.0 |
| 20 to 34 years | 0 (0.0%) | 0.0 |
| 35 to 50 years | 21 (100.0%) | 512.0 |
| Total | 21 (100.0%) | 280.0 |
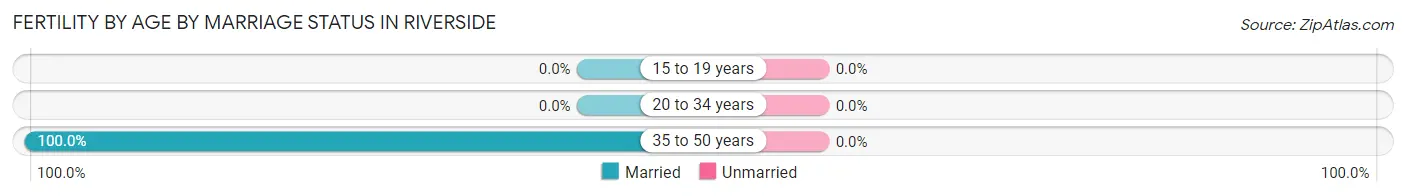
Fertility by Age by Marriage Status in Riverside
| Age Bracket | Married | Unmarried |
| 15 to 19 years | 0 (0.0%) | 0 (0.0%) |
| 20 to 34 years | 0 (0.0%) | 0 (0.0%) |
| 35 to 50 years | 21 (100.0%) | 0 (0.0%) |
| Total | 21 (100.0%) | 0 (0.0%) |
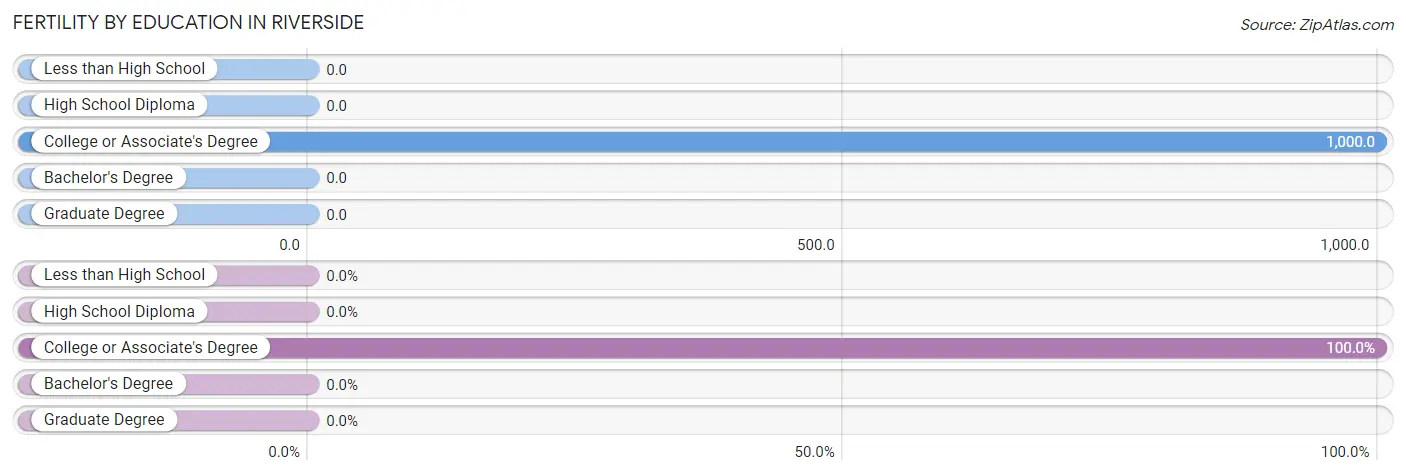
Fertility by Education in Riverside
| Educational Attainment | Women with Births | Births / 1,000 Women |
| Less than High School | 0 (0.0%) | 0.0 |
| High School Diploma | 0 (0.0%) | 0.0 |
| College or Associate's Degree | 21 (100.0%) | 1,000.0 |
| Bachelor's Degree | 0 (0.0%) | 0.0 |
| Graduate Degree | 0 (0.0%) | 0.0 |
| Total | 21 (100.0%) | 280.0 |
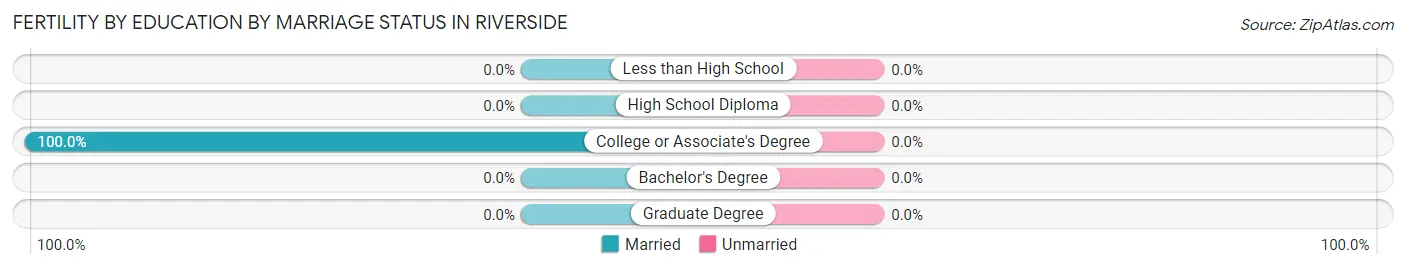
Fertility by Education by Marriage Status in Riverside
| Educational Attainment | Married | Unmarried |
| Less than High School | 0 (0.0%) | 0 (0.0%) |
| High School Diploma | 0 (0.0%) | 0 (0.0%) |
| College or Associate's Degree | 21 (100.0%) | 0 (0.0%) |
| Bachelor's Degree | 0 (0.0%) | 0 (0.0%) |
| Graduate Degree | 0 (0.0%) | 0 (0.0%) |
| Total | 21 (100.0%) | 0 (0.0%) |
Employment Characteristics in Riverside
Employment by Class of Employer in Riverside
Among the 257 employed individuals in Riverside, state government employees (150 | 58.4%), private company employees (56 | 21.8%), and not-for-profit organizations (34 | 13.2%) make up the most common classes of employment.
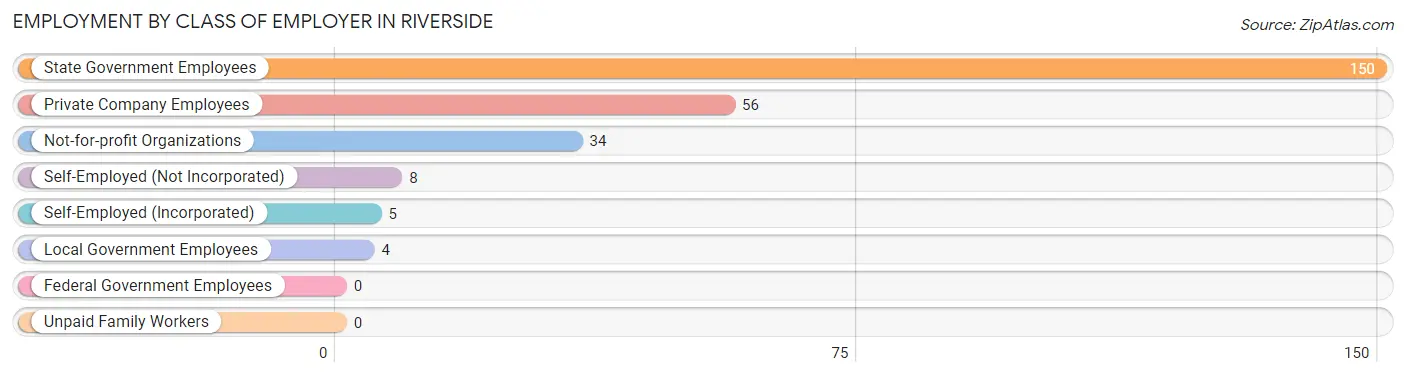
| Employer Class | # Employees | % Employees |
| Private Company Employees | 56 | 21.8% |
| Self-Employed (Incorporated) | 5 | 1.9% |
| Self-Employed (Not Incorporated) | 8 | 3.1% |
| Not-for-profit Organizations | 34 | 13.2% |
| Local Government Employees | 4 | 1.6% |
| State Government Employees | 150 | 58.4% |
| Federal Government Employees | 0 | 0.0% |
| Unpaid Family Workers | 0 | 0.0% |
| Total | 257 | 100.0% |
Employment Status by Age in Riverside
According to the labor force statistics for Riverside, out of the total population over 16 years of age (542), 47.6% or 258 individuals are in the labor force, with 0.4% or 1 of them unemployed. The age group with the highest labor force participation rate is 55 to 59 years, with 100.0% or 7 individuals in the labor force. Within the labor force, the 55 to 59 years age range has the highest percentage of unemployed individuals, with 14.3% or 1 of them being unemployed.
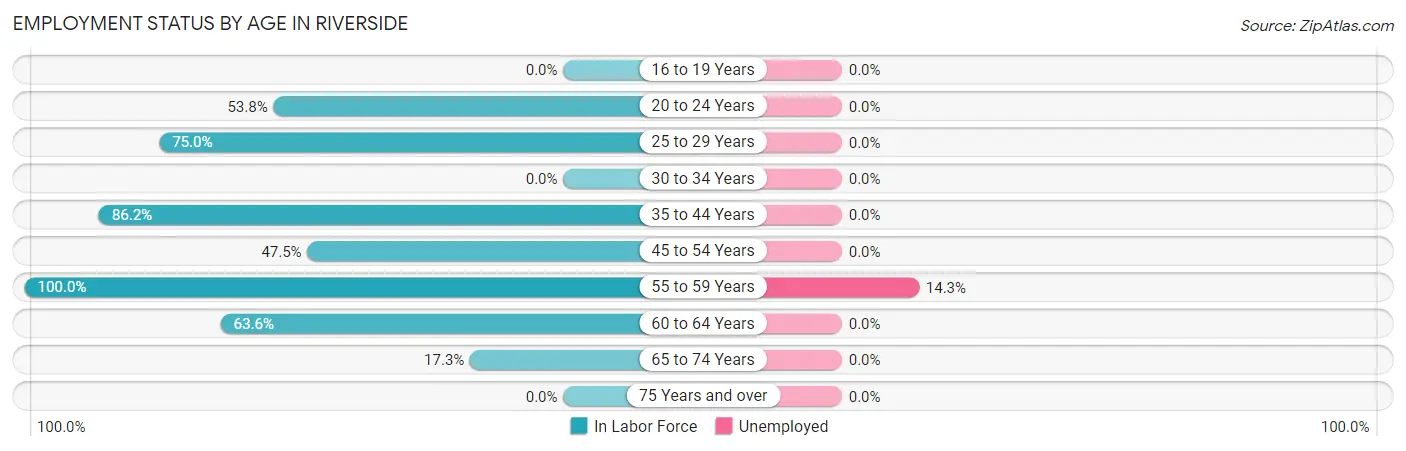
| Age Bracket | In Labor Force | Unemployed |
| 16 to 19 Years | 0 (0.0%) | 0 (0.0%) |
| 20 to 24 Years | 7 (53.8%) | 0 (0.0%) |
| 25 to 29 Years | 30 (75.0%) | 0 (0.0%) |
| 30 to 34 Years | 0 (0.0%) | 0 (0.0%) |
| 35 to 44 Years | 75 (86.2%) | 0 (0.0%) |
| 45 to 54 Years | 95 (47.5%) | 0 (0.0%) |
| 55 to 59 Years | 7 (100.0%) | 1 (14.3%) |
| 60 to 64 Years | 35 (63.6%) | 0 (0.0%) |
| 65 to 74 Years | 9 (17.3%) | 0 (0.0%) |
| 75 Years and over | 0 (0.0%) | 0 (0.0%) |
| Total | 258 (47.6%) | 1 (0.4%) |
Employment Status by Educational Attainment in Riverside
According to labor force statistics for Riverside, 55.5% of individuals (242) out of the total population between 25 and 64 years of age (436) are in the labor force, with 0.4% or 1 of them being unemployed. The group with the highest labor force participation rate are those with the educational attainment of bachelor's degree or higher, with 79.6% or 78 individuals in the labor force. Within the labor force, individuals with high school diploma education have the highest percentage of unemployment, with 3.1% or 1 of them being unemployed.
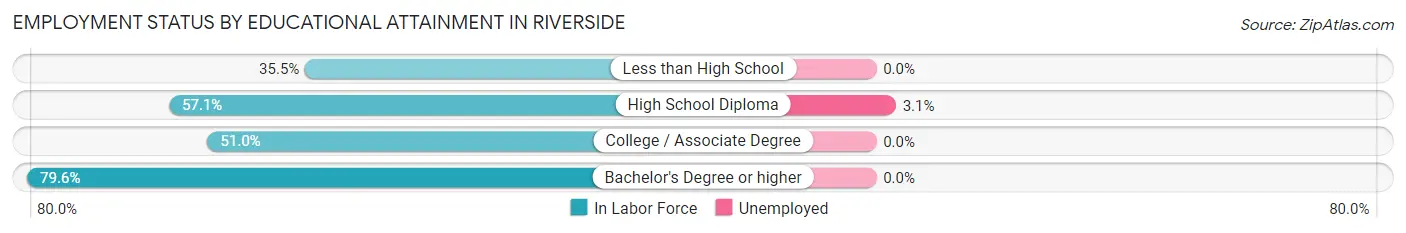
| Educational Attainment | In Labor Force | Unemployed |
| Less than High School | 27 (35.5%) | 0 (0.0%) |
| High School Diploma | 32 (57.1%) | 2 (3.1%) |
| College / Associate Degree | 105 (51.0%) | 0 (0.0%) |
| Bachelor's Degree or higher | 78 (79.6%) | 0 (0.0%) |
| Total | 242 (55.5%) | 2 (0.4%) |
Employment Occupations by Sex in Riverside
Management, Business, Science and Arts Occupations
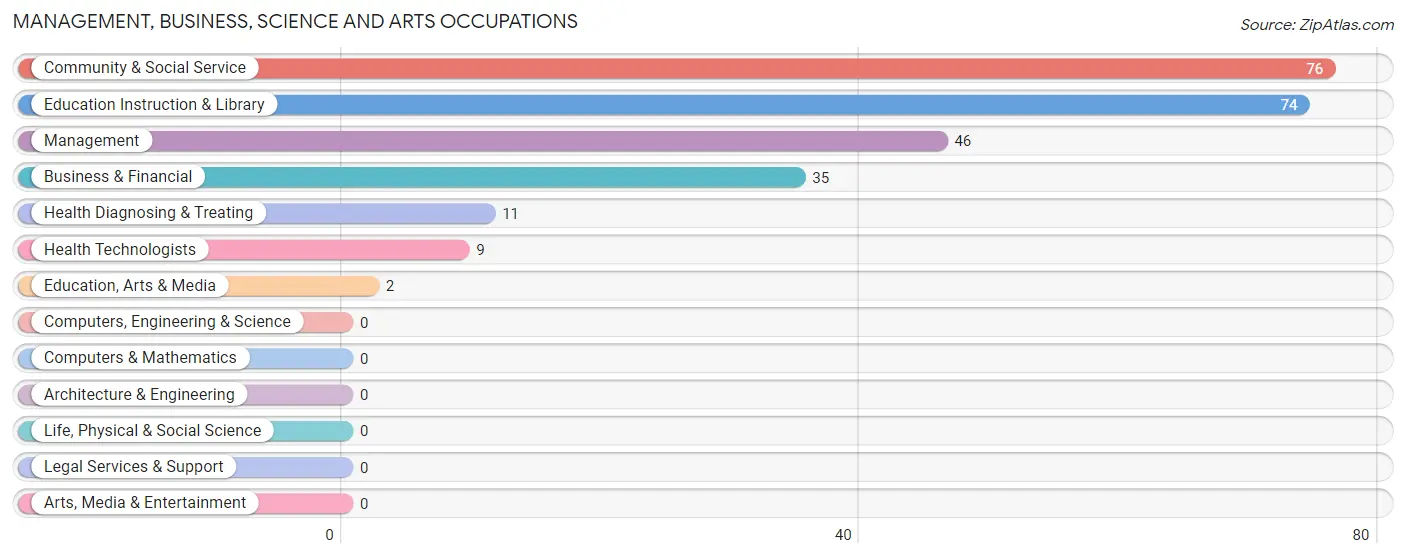
The most common Management, Business, Science and Arts occupations in Riverside are Community & Social Service (76 | 29.6%), Education Instruction & Library (74 | 28.8%), Management (46 | 17.9%), Business & Financial (35 | 13.6%), and Health Diagnosing & Treating (11 | 4.3%).
Management, Business, Science and Arts Occupations by Sex
Within the Management, Business, Science and Arts occupations in Riverside, the most male-oriented occupations are Community & Social Service (100.0%), Education, Arts & Media (100.0%), and Education Instruction & Library (100.0%), while the most female-oriented occupations are Health Diagnosing & Treating (100.0%), Health Technologists (100.0%), and Management (71.7%).
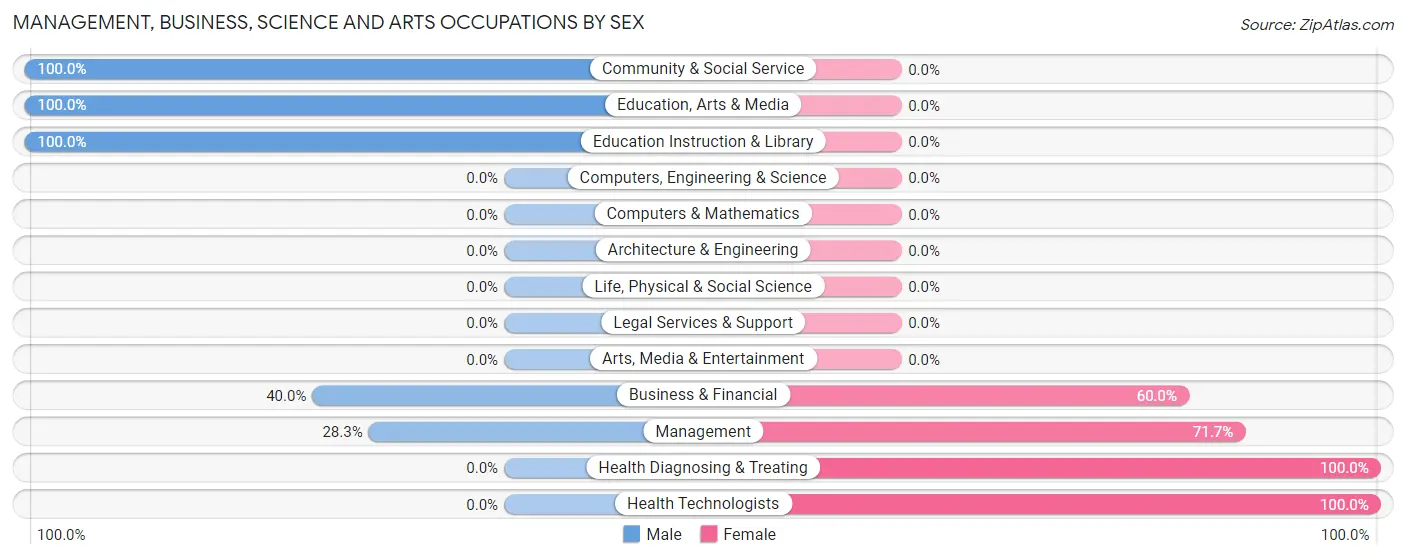
| Occupation | Male | Female |
| Management | 13 (28.3%) | 33 (71.7%) |
| Business & Financial | 14 (40.0%) | 21 (60.0%) |
| Computers, Engineering & Science | 0 (0.0%) | 0 (0.0%) |
| Computers & Mathematics | 0 (0.0%) | 0 (0.0%) |
| Architecture & Engineering | 0 (0.0%) | 0 (0.0%) |
| Life, Physical & Social Science | 0 (0.0%) | 0 (0.0%) |
| Community & Social Service | 76 (100.0%) | 0 (0.0%) |
| Education, Arts & Media | 2 (100.0%) | 0 (0.0%) |
| Legal Services & Support | 0 (0.0%) | 0 (0.0%) |
| Education Instruction & Library | 74 (100.0%) | 0 (0.0%) |
| Arts, Media & Entertainment | 0 (0.0%) | 0 (0.0%) |
| Health Diagnosing & Treating | 0 (0.0%) | 11 (100.0%) |
| Health Technologists | 0 (0.0%) | 9 (100.0%) |
| Total (Category) | 103 (61.3%) | 65 (38.7%) |
| Total (Overall) | 183 (71.2%) | 74 (28.8%) |
Services Occupations
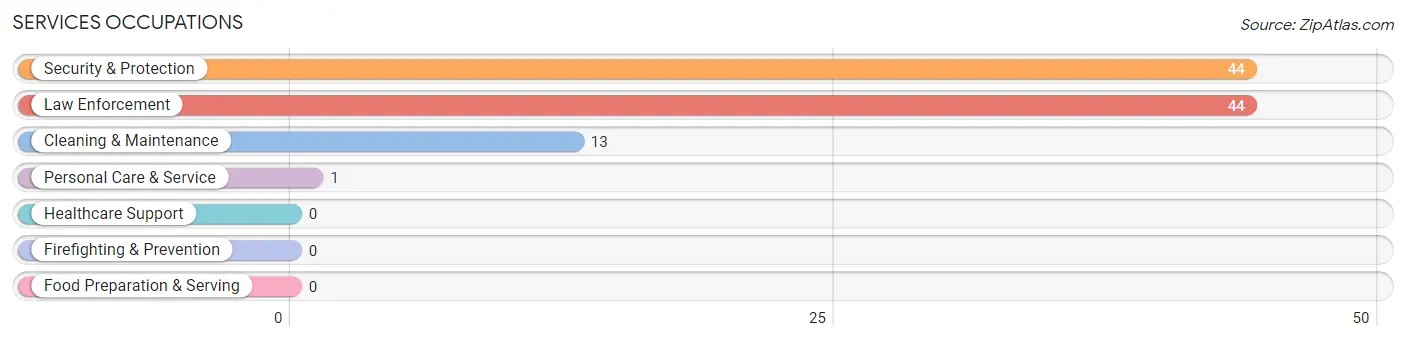
The most common Services occupations in Riverside are Security & Protection (44 | 17.1%), Law Enforcement (44 | 17.1%), Cleaning & Maintenance (13 | 5.1%), and Personal Care & Service (1 | 0.4%).
Services Occupations by Sex
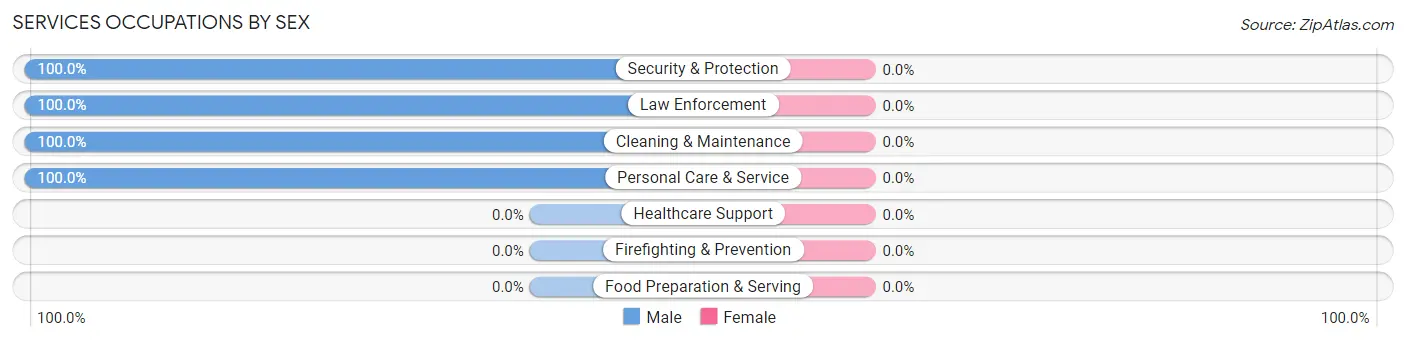
| Occupation | Male | Female |
| Healthcare Support | 0 (0.0%) | 0 (0.0%) |
| Security & Protection | 44 (100.0%) | 0 (0.0%) |
| Firefighting & Prevention | 0 (0.0%) | 0 (0.0%) |
| Law Enforcement | 44 (100.0%) | 0 (0.0%) |
| Food Preparation & Serving | 0 (0.0%) | 0 (0.0%) |
| Cleaning & Maintenance | 13 (100.0%) | 0 (0.0%) |
| Personal Care & Service | 1 (100.0%) | 0 (0.0%) |
| Total (Category) | 58 (100.0%) | 0 (0.0%) |
| Total (Overall) | 183 (71.2%) | 74 (28.8%) |
Sales and Office Occupations
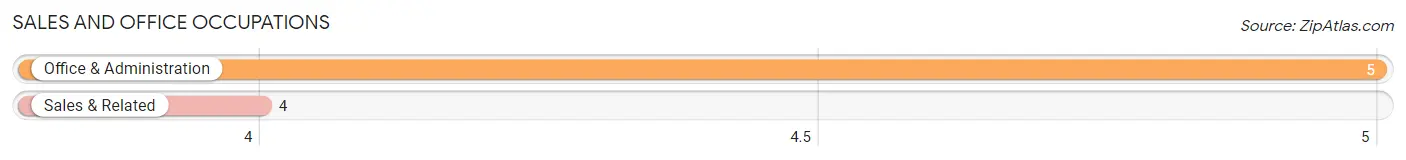
The most common Sales and Office occupations in Riverside are Office & Administration (5 | 1.9%), and Sales & Related (4 | 1.6%).
Sales and Office Occupations by Sex
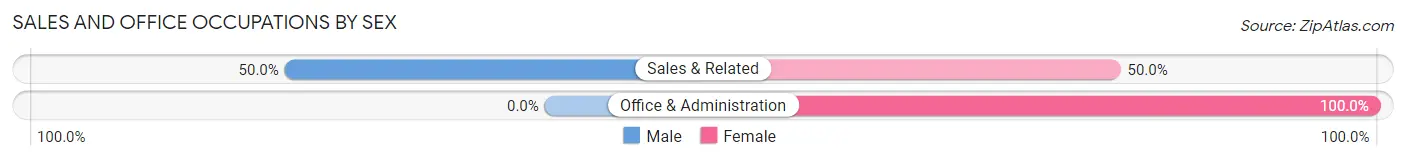
| Occupation | Male | Female |
| Sales & Related | 2 (50.0%) | 2 (50.0%) |
| Office & Administration | 0 (0.0%) | 5 (100.0%) |
| Total (Category) | 2 (22.2%) | 7 (77.8%) |
| Total (Overall) | 183 (71.2%) | 74 (28.8%) |
Natural Resources, Construction and Maintenance Occupations
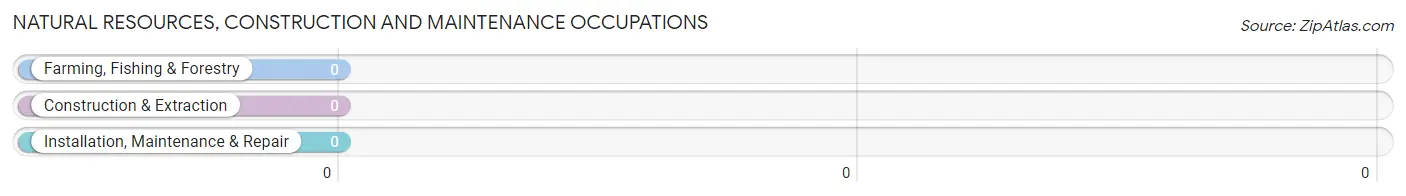
Natural Resources, Construction and Maintenance Occupations by Sex
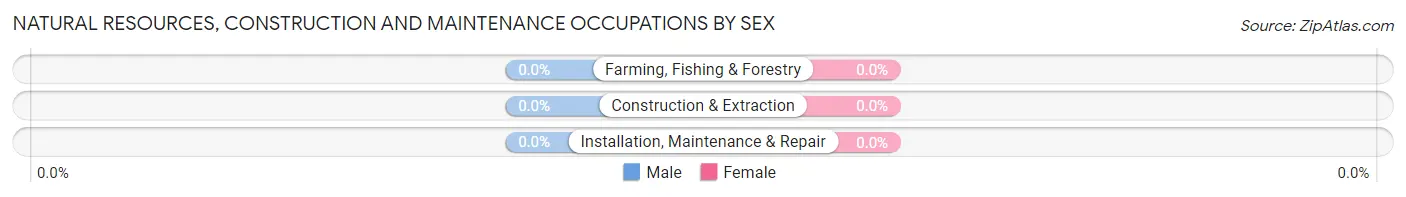
| Occupation | Male | Female |
| Farming, Fishing & Forestry | 0 (0.0%) | 0 (0.0%) |
| Construction & Extraction | 0 (0.0%) | 0 (0.0%) |
| Installation, Maintenance & Repair | 0 (0.0%) | 0 (0.0%) |
| Total (Category) | 0 (0.0%) | 0 (0.0%) |
| Total (Overall) | 183 (71.2%) | 74 (28.8%) |
Production, Transportation and Moving Occupations
The most common Production, Transportation and Moving occupations in Riverside are Production (15 | 5.8%), Material Moving (5 | 1.9%), and Transportation (2 | 0.8%).
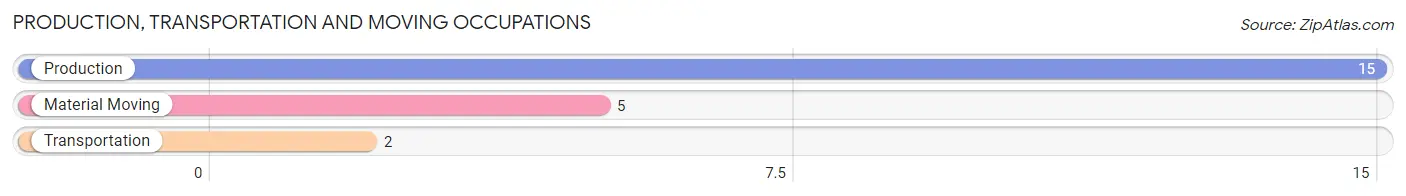
Production, Transportation and Moving Occupations by Sex
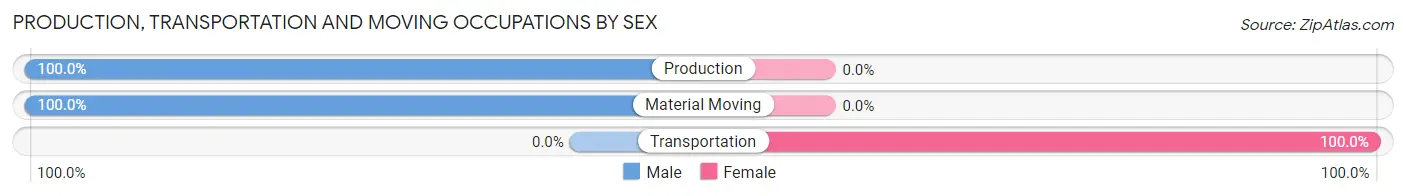
| Occupation | Male | Female |
| Production | 15 (100.0%) | 0 (0.0%) |
| Transportation | 0 (0.0%) | 2 (100.0%) |
| Material Moving | 5 (100.0%) | 0 (0.0%) |
| Total (Category) | 20 (90.9%) | 2 (9.1%) |
| Total (Overall) | 183 (71.2%) | 74 (28.8%) |
Employment Industries by Sex in Riverside
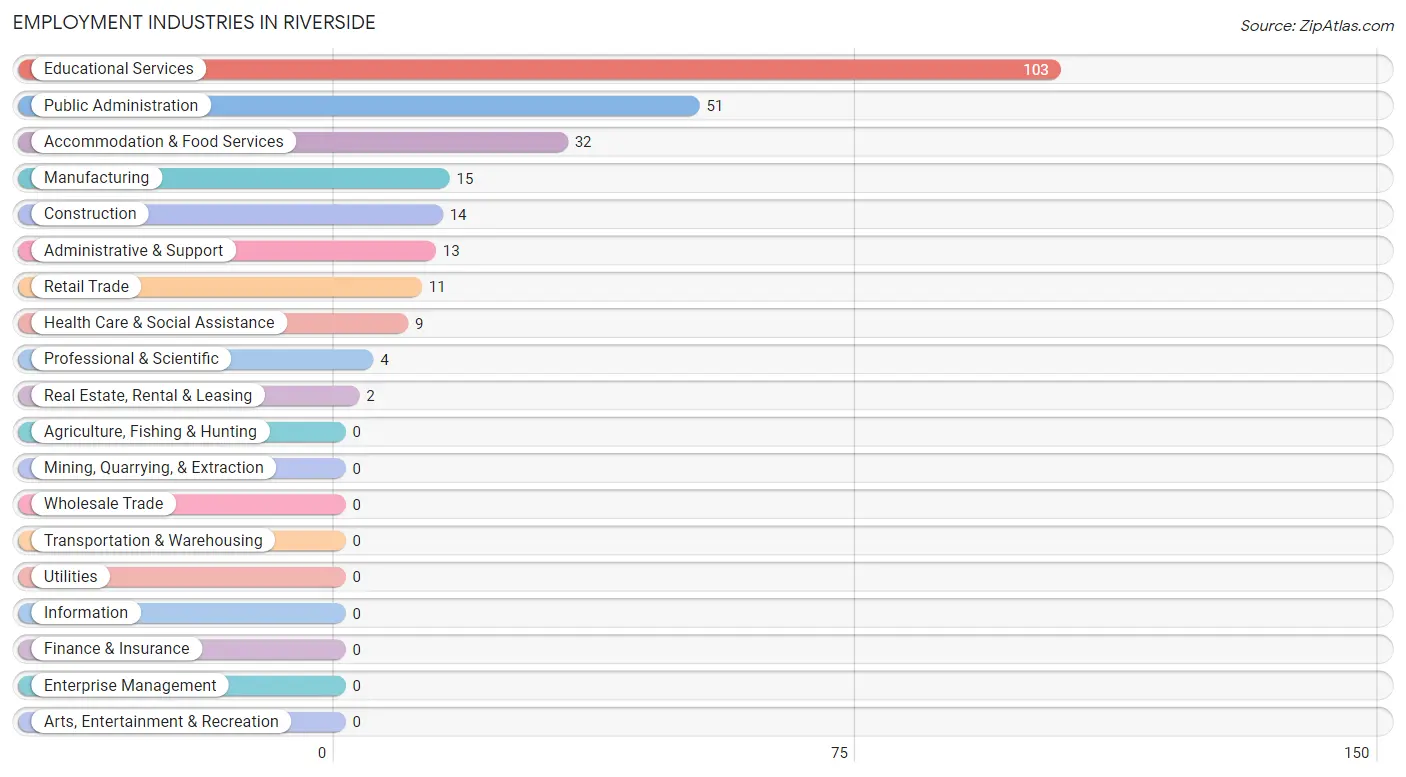
Employment Industries in Riverside
The major employment industries in Riverside include Educational Services (103 | 40.1%), Public Administration (51 | 19.8%), Accommodation & Food Services (32 | 12.4%), Manufacturing (15 | 5.8%), and Construction (14 | 5.4%).
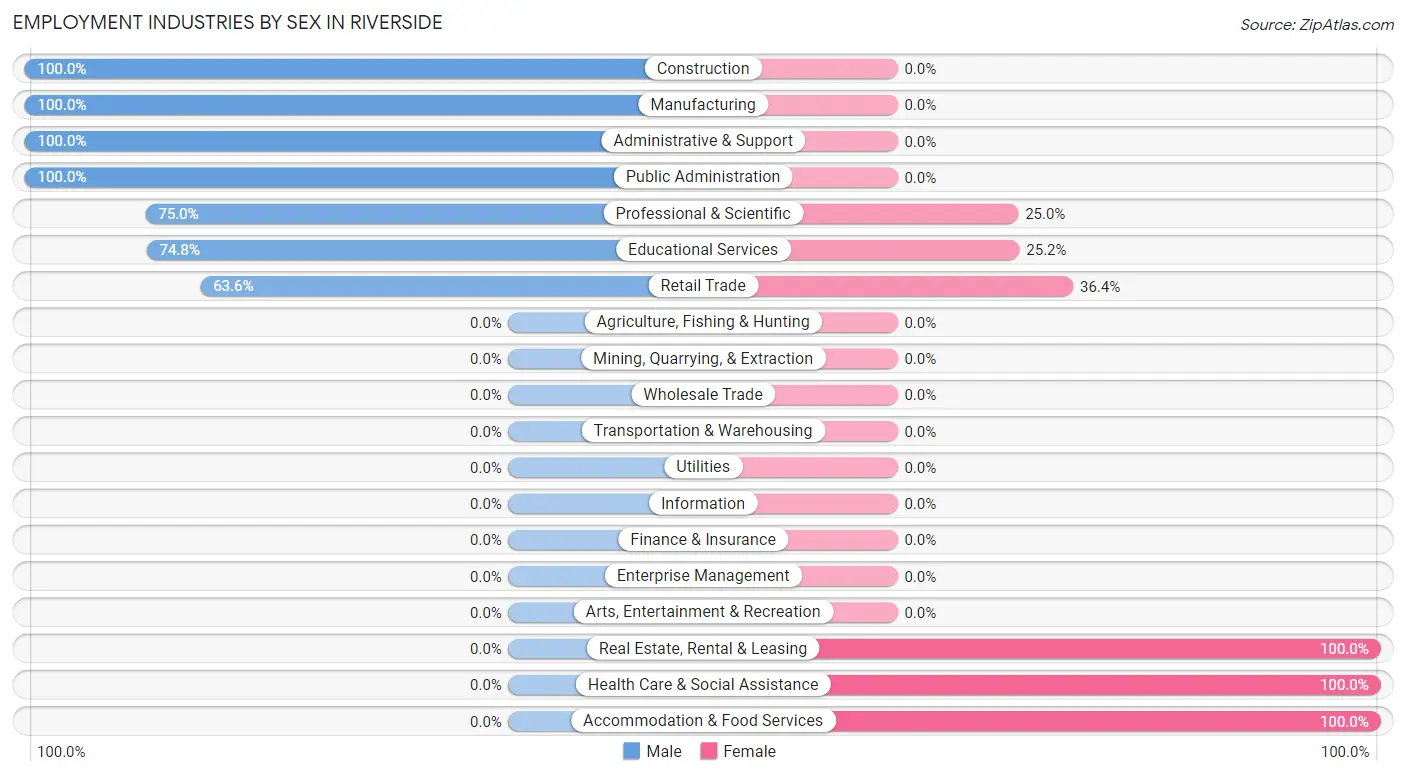
Employment Industries by Sex in Riverside
The Riverside industries that see more men than women are Construction (100.0%), Manufacturing (100.0%), and Administrative & Support (100.0%), whereas the industries that tend to have a higher number of women are Real Estate, Rental & Leasing (100.0%), Health Care & Social Assistance (100.0%), and Accommodation & Food Services (100.0%).
| Industry | Male | Female |
| Agriculture, Fishing & Hunting | 0 (0.0%) | 0 (0.0%) |
| Mining, Quarrying, & Extraction | 0 (0.0%) | 0 (0.0%) |
| Construction | 14 (100.0%) | 0 (0.0%) |
| Manufacturing | 15 (100.0%) | 0 (0.0%) |
| Wholesale Trade | 0 (0.0%) | 0 (0.0%) |
| Retail Trade | 7 (63.6%) | 4 (36.4%) |
| Transportation & Warehousing | 0 (0.0%) | 0 (0.0%) |
| Utilities | 0 (0.0%) | 0 (0.0%) |
| Information | 0 (0.0%) | 0 (0.0%) |
| Finance & Insurance | 0 (0.0%) | 0 (0.0%) |
| Real Estate, Rental & Leasing | 0 (0.0%) | 2 (100.0%) |
| Professional & Scientific | 3 (75.0%) | 1 (25.0%) |
| Enterprise Management | 0 (0.0%) | 0 (0.0%) |
| Administrative & Support | 13 (100.0%) | 0 (0.0%) |
| Educational Services | 77 (74.8%) | 26 (25.2%) |
| Health Care & Social Assistance | 0 (0.0%) | 9 (100.0%) |
| Arts, Entertainment & Recreation | 0 (0.0%) | 0 (0.0%) |
| Accommodation & Food Services | 0 (0.0%) | 32 (100.0%) |
| Public Administration | 51 (100.0%) | 0 (0.0%) |
| Total | 183 (71.2%) | 74 (28.8%) |
Education in Riverside
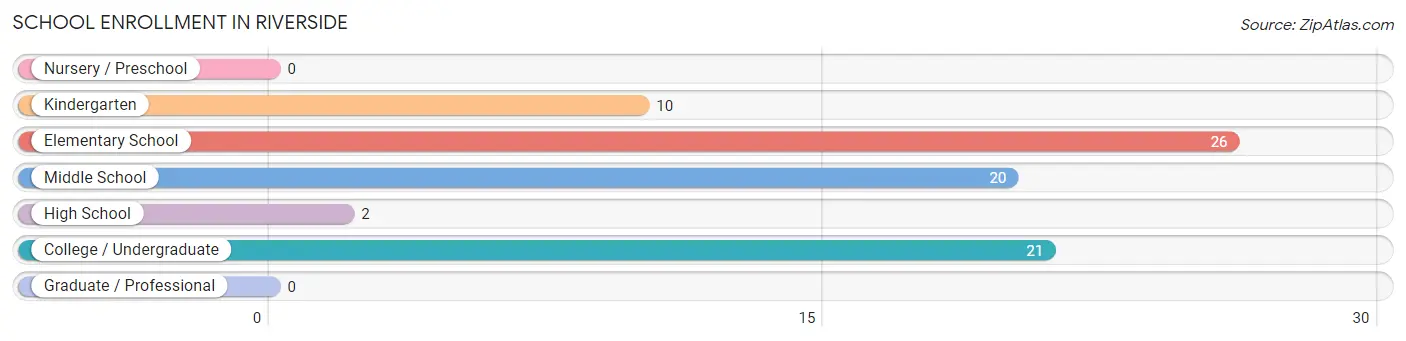
School Enrollment in Riverside
The most common levels of schooling among the 79 students in Riverside are elementary school (26 | 32.9%), college / undergraduate (21 | 26.6%), and middle school (20 | 25.3%).
| School Level | # Students | % Students |
| Nursery / Preschool | 0 | 0.0% |
| Kindergarten | 10 | 12.7% |
| Elementary School | 26 | 32.9% |
| Middle School | 20 | 25.3% |
| High School | 2 | 2.5% |
| College / Undergraduate | 21 | 26.6% |
| Graduate / Professional | 0 | 0.0% |
| Total | 79 | 100.0% |
School Enrollment by Age by Funding Source in Riverside
Out of a total of 79 students who are enrolled in schools in Riverside, 38 (48.1%) attend a private institution, while the remaining 41 (51.9%) are enrolled in public schools. The age group of 10 to 14 year olds has the highest likelihood of being enrolled in private schools, with 15 (75.0% in the age bracket) enrolled. Conversely, the age group of 15 to 17 year olds has the lowest likelihood of being enrolled in a private school, with 2 (100.0% in the age bracket) attending a public institution.
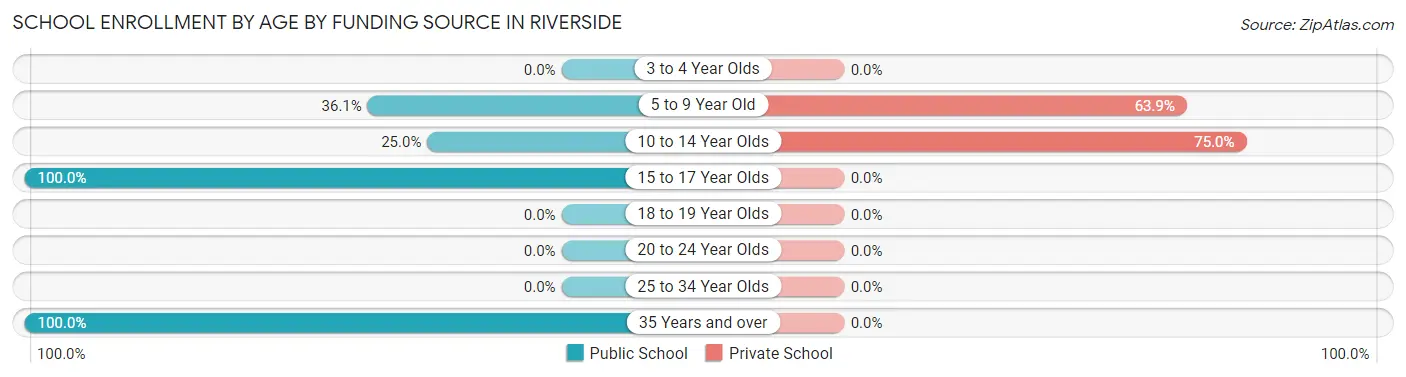
| Age Bracket | Public School | Private School |
| 3 to 4 Year Olds | 0 (0.0%) | 0 (0.0%) |
| 5 to 9 Year Old | 13 (36.1%) | 23 (63.9%) |
| 10 to 14 Year Olds | 5 (25.0%) | 15 (75.0%) |
| 15 to 17 Year Olds | 2 (100.0%) | 0 (0.0%) |
| 18 to 19 Year Olds | 0 (0.0%) | 0 (0.0%) |
| 20 to 24 Year Olds | 0 (0.0%) | 0 (0.0%) |
| 25 to 34 Year Olds | 0 (0.0%) | 0 (0.0%) |
| 35 Years and over | 21 (100.0%) | 0 (0.0%) |
| Total | 41 (51.9%) | 38 (48.1%) |
Educational Attainment by Field of Study in Riverside
Psychology (32 | 26.0%), arts & humanities (32 | 26.0%), education (27 | 22.0%), science & technology (9 | 7.3%), and business (8 | 6.5%) are the most common fields of study among 123 individuals in Riverside who have obtained a bachelor's degree or higher.
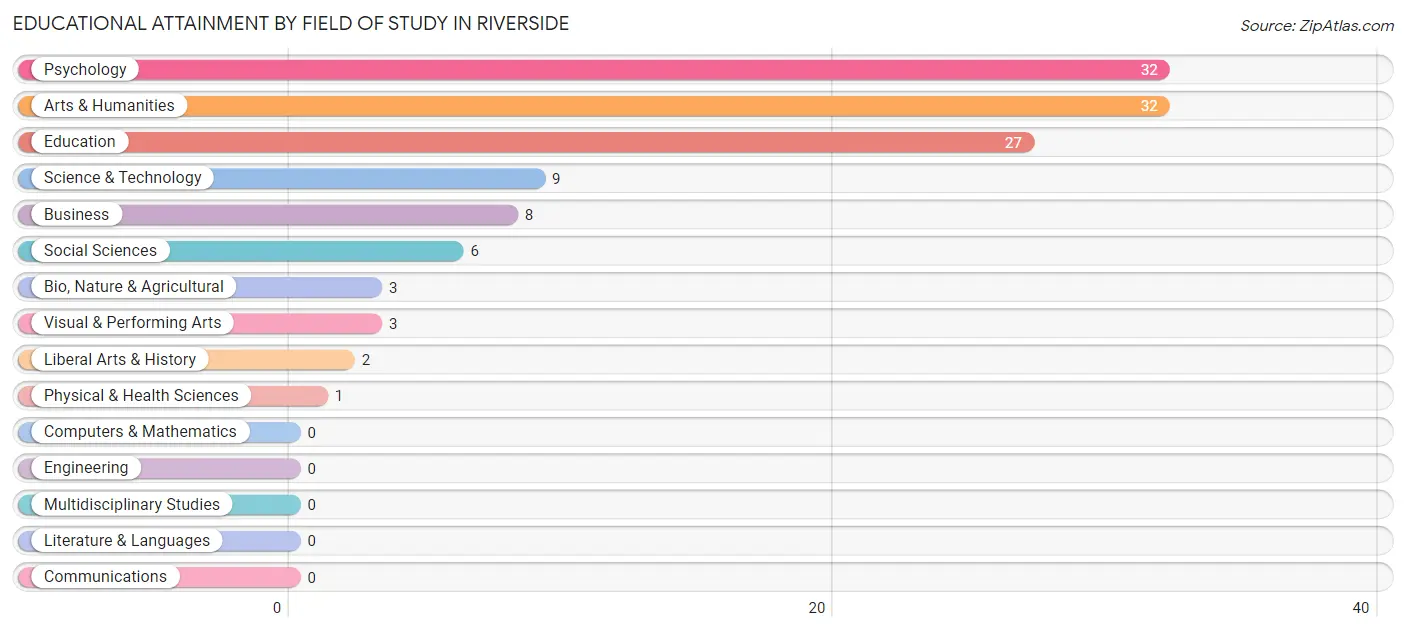
| Field of Study | # Graduates | % Graduates |
| Computers & Mathematics | 0 | 0.0% |
| Bio, Nature & Agricultural | 3 | 2.4% |
| Physical & Health Sciences | 1 | 0.8% |
| Psychology | 32 | 26.0% |
| Social Sciences | 6 | 4.9% |
| Engineering | 0 | 0.0% |
| Multidisciplinary Studies | 0 | 0.0% |
| Science & Technology | 9 | 7.3% |
| Business | 8 | 6.5% |
| Education | 27 | 22.0% |
| Literature & Languages | 0 | 0.0% |
| Liberal Arts & History | 2 | 1.6% |
| Visual & Performing Arts | 3 | 2.4% |
| Communications | 0 | 0.0% |
| Arts & Humanities | 32 | 26.0% |
| Total | 123 | 100.0% |
Transportation & Commute in Riverside
Vehicle Availability by Sex in Riverside
The most prevalent vehicle ownership categories in Riverside are males with 2 vehicles (122, accounting for 66.7%) and females with 2 vehicles (14, making up 164.9%).
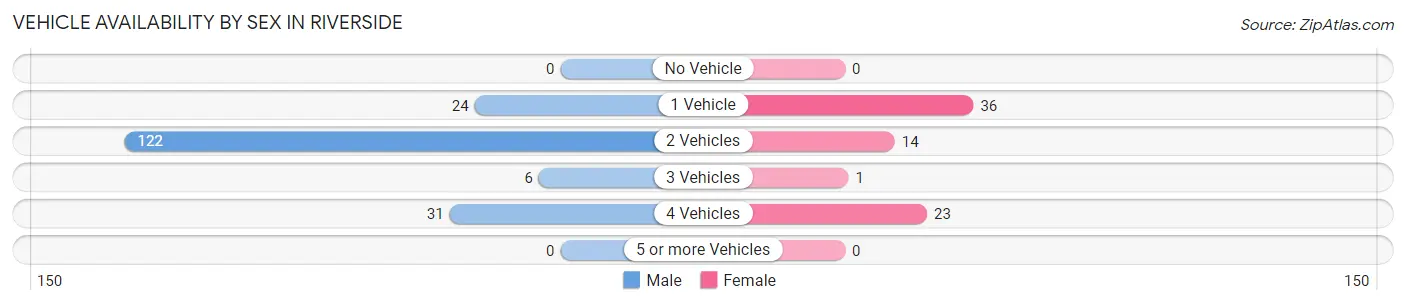
| Vehicles Available | Male | Female |
| No Vehicle | 0 (0.0%) | 0 (0.0%) |
| 1 Vehicle | 24 (13.1%) | 36 (48.6%) |
| 2 Vehicles | 122 (66.7%) | 14 (18.9%) |
| 3 Vehicles | 6 (3.3%) | 1 (1.3%) |
| 4 Vehicles | 31 (16.9%) | 23 (31.1%) |
| 5 or more Vehicles | 0 (0.0%) | 0 (0.0%) |
| Total | 183 (100.0%) | 74 (100.0%) |
Commute Time in Riverside
The most frequently occuring commute durations in Riverside are 15 to 19 minutes (95 commuters, 37.0%), 20 to 24 minutes (82 commuters, 31.9%), and 90 or more minutes (38 commuters, 14.8%).
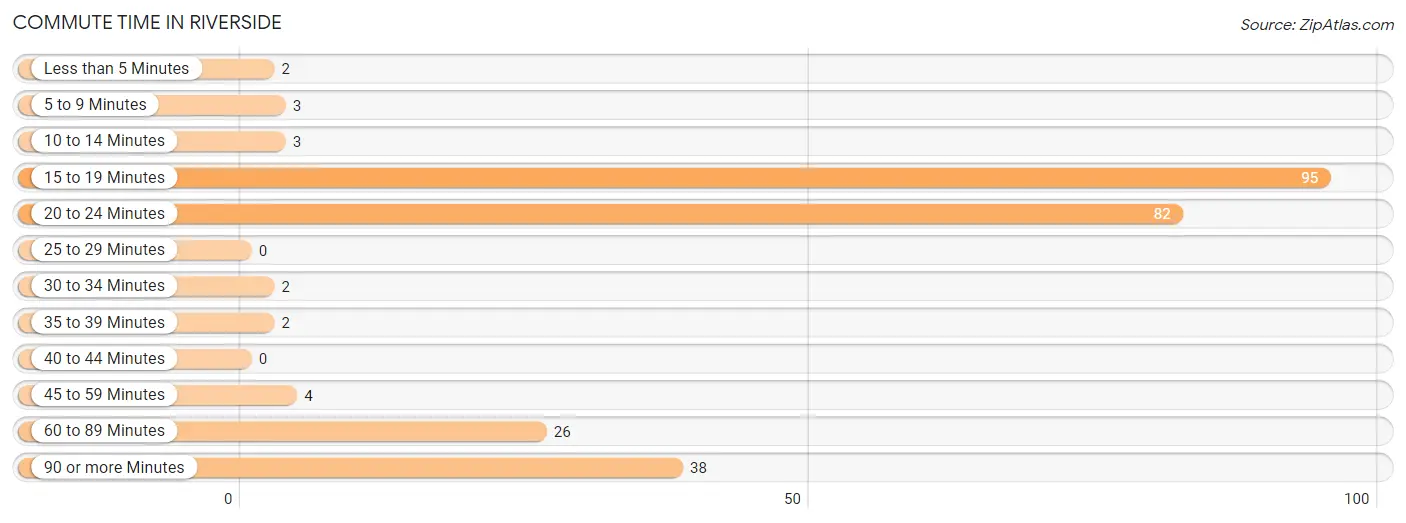
| Commute Time | # Commuters | % Commuters |
| Less than 5 Minutes | 2 | 0.8% |
| 5 to 9 Minutes | 3 | 1.2% |
| 10 to 14 Minutes | 3 | 1.2% |
| 15 to 19 Minutes | 95 | 37.0% |
| 20 to 24 Minutes | 82 | 31.9% |
| 25 to 29 Minutes | 0 | 0.0% |
| 30 to 34 Minutes | 2 | 0.8% |
| 35 to 39 Minutes | 2 | 0.8% |
| 40 to 44 Minutes | 0 | 0.0% |
| 45 to 59 Minutes | 4 | 1.6% |
| 60 to 89 Minutes | 26 | 10.1% |
| 90 or more Minutes | 38 | 14.8% |
Commute Time by Sex in Riverside
The most common commute times in Riverside are 15 to 19 minutes (86 commuters, 47.0%) for males and 20 to 24 minutes (35 commuters, 47.3%) for females.
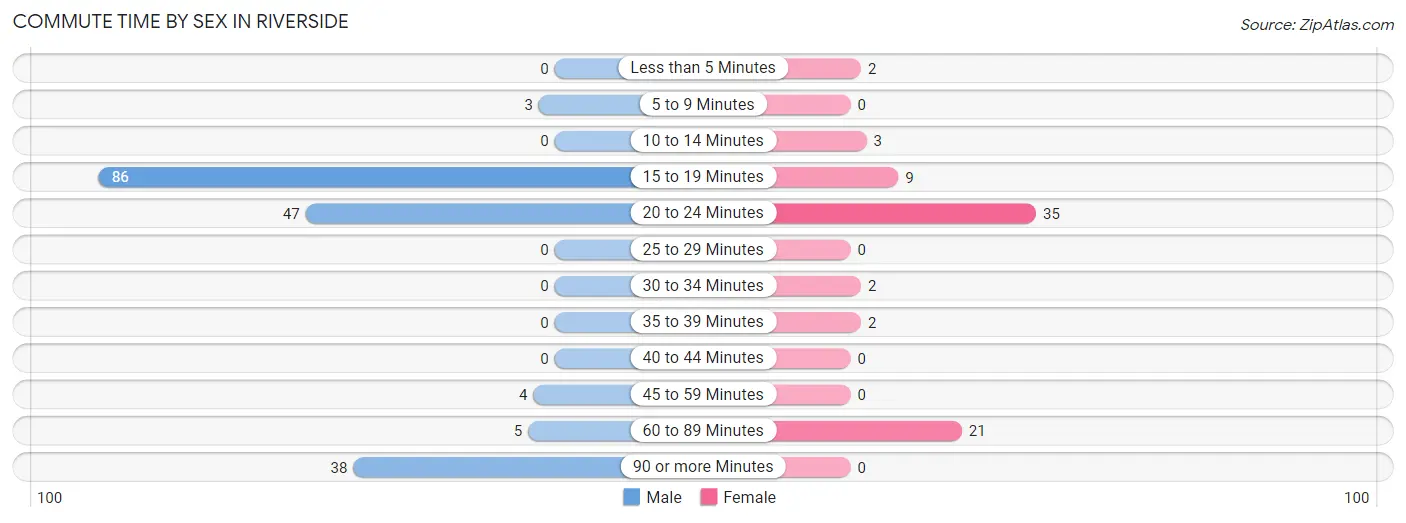
| Commute Time | Male | Female |
| Less than 5 Minutes | 0 (0.0%) | 2 (2.7%) |
| 5 to 9 Minutes | 3 (1.6%) | 0 (0.0%) |
| 10 to 14 Minutes | 0 (0.0%) | 3 (4.1%) |
| 15 to 19 Minutes | 86 (47.0%) | 9 (12.2%) |
| 20 to 24 Minutes | 47 (25.7%) | 35 (47.3%) |
| 25 to 29 Minutes | 0 (0.0%) | 0 (0.0%) |
| 30 to 34 Minutes | 0 (0.0%) | 2 (2.7%) |
| 35 to 39 Minutes | 0 (0.0%) | 2 (2.7%) |
| 40 to 44 Minutes | 0 (0.0%) | 0 (0.0%) |
| 45 to 59 Minutes | 4 (2.2%) | 0 (0.0%) |
| 60 to 89 Minutes | 5 (2.7%) | 21 (28.4%) |
| 90 or more Minutes | 38 (20.8%) | 0 (0.0%) |
Time of Departure to Work by Sex in Riverside
The most frequent times of departure to work in Riverside are 12:00 AM to 4:59 AM (89, 48.6%) for males and 6:30 AM to 6:59 AM (55, 74.3%) for females.
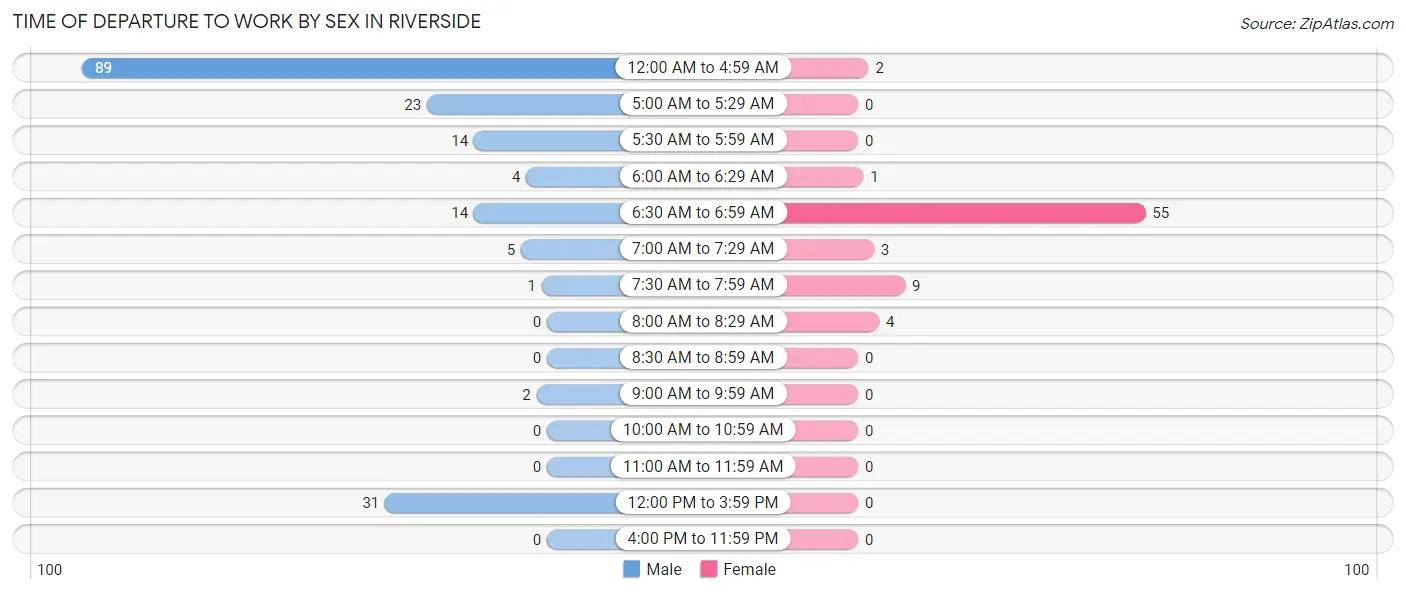
| Time of Departure | Male | Female |
| 12:00 AM to 4:59 AM | 89 (48.6%) | 2 (2.7%) |
| 5:00 AM to 5:29 AM | 23 (12.6%) | 0 (0.0%) |
| 5:30 AM to 5:59 AM | 14 (7.6%) | 0 (0.0%) |
| 6:00 AM to 6:29 AM | 4 (2.2%) | 1 (1.3%) |
| 6:30 AM to 6:59 AM | 14 (7.6%) | 55 (74.3%) |
| 7:00 AM to 7:29 AM | 5 (2.7%) | 3 (4.1%) |
| 7:30 AM to 7:59 AM | 1 (0.5%) | 9 (12.2%) |
| 8:00 AM to 8:29 AM | 0 (0.0%) | 4 (5.4%) |
| 8:30 AM to 8:59 AM | 0 (0.0%) | 0 (0.0%) |
| 9:00 AM to 9:59 AM | 2 (1.1%) | 0 (0.0%) |
| 10:00 AM to 10:59 AM | 0 (0.0%) | 0 (0.0%) |
| 11:00 AM to 11:59 AM | 0 (0.0%) | 0 (0.0%) |
| 12:00 PM to 3:59 PM | 31 (16.9%) | 0 (0.0%) |
| 4:00 PM to 11:59 PM | 0 (0.0%) | 0 (0.0%) |
| Total | 183 (100.0%) | 74 (100.0%) |
Housing Occupancy in Riverside
Occupancy by Ownership in Riverside
Of the total 319 dwellings in Riverside, owner-occupied units account for 154 (48.3%), while renter-occupied units make up 165 (51.7%).
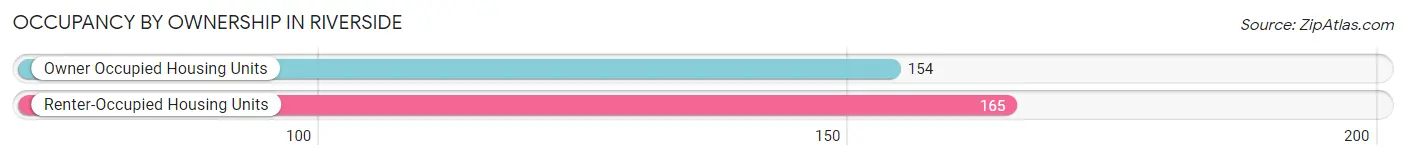
| Occupancy | # Housing Units | % Housing Units |
| Owner Occupied Housing Units | 154 | 48.3% |
| Renter-Occupied Housing Units | 165 | 51.7% |
| Total Occupied Housing Units | 319 | 100.0% |
Occupancy by Household Size in Riverside
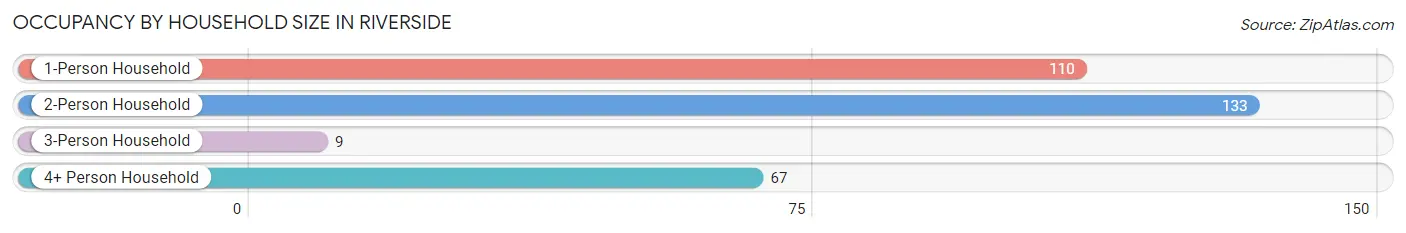
| Household Size | # Housing Units | % Housing Units |
| 1-Person Household | 110 | 34.5% |
| 2-Person Household | 133 | 41.7% |
| 3-Person Household | 9 | 2.8% |
| 4+ Person Household | 67 | 21.0% |
| Total Housing Units | 319 | 100.0% |
Occupancy by Ownership by Household Size in Riverside
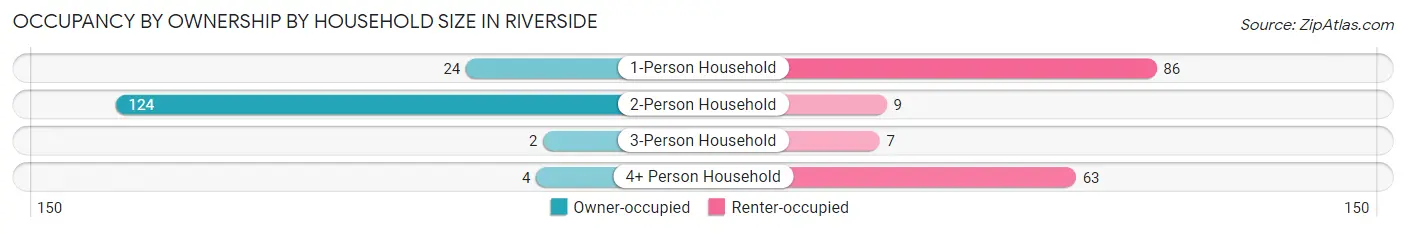
| Household Size | Owner-occupied | Renter-occupied |
| 1-Person Household | 24 (21.8%) | 86 (78.2%) |
| 2-Person Household | 124 (93.2%) | 9 (6.8%) |
| 3-Person Household | 2 (22.2%) | 7 (77.8%) |
| 4+ Person Household | 4 (6.0%) | 63 (94.0%) |
| Total Housing Units | 154 (48.3%) | 165 (51.7%) |
Occupancy by Educational Attainment in Riverside
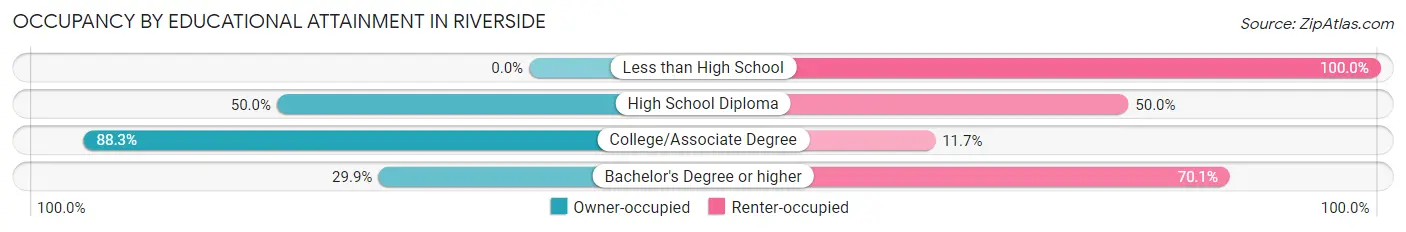
| Household Size | Owner-occupied | Renter-occupied |
| Less than High School | 0 (0.0%) | 57 (100.0%) |
| High School Diploma | 27 (50.0%) | 27 (50.0%) |
| College/Associate Degree | 98 (88.3%) | 13 (11.7%) |
| Bachelor's Degree or higher | 29 (29.9%) | 68 (70.1%) |
Occupancy by Age of Householder in Riverside
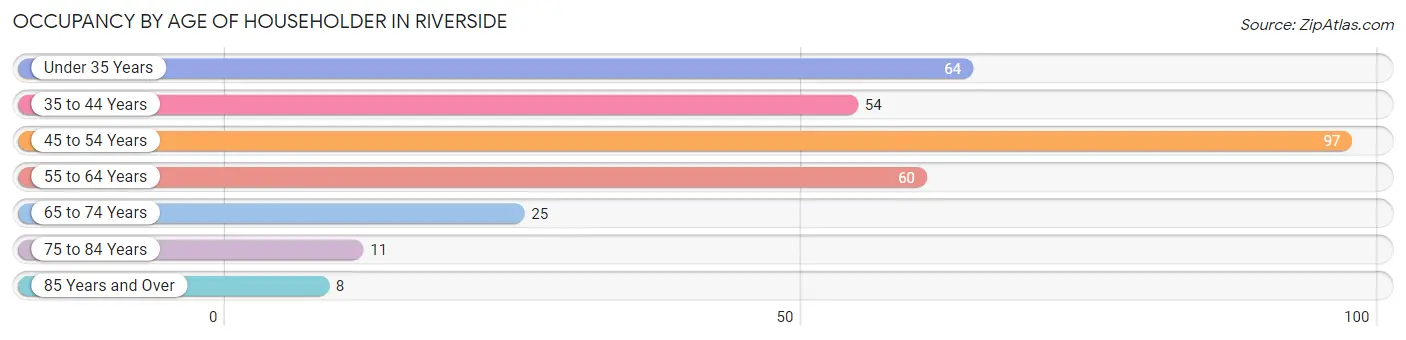
| Age Bracket | # Households | % Households |
| Under 35 Years | 64 | 20.1% |
| 35 to 44 Years | 54 | 16.9% |
| 45 to 54 Years | 97 | 30.4% |
| 55 to 64 Years | 60 | 18.8% |
| 65 to 74 Years | 25 | 7.8% |
| 75 to 84 Years | 11 | 3.5% |
| 85 Years and Over | 8 | 2.5% |
| Total | 319 | 100.0% |
Housing Finances in Riverside
Median Income by Occupancy in Riverside
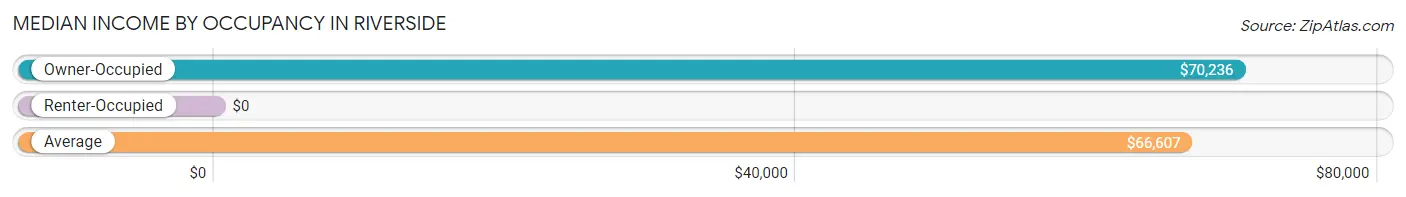
| Occupancy Type | # Households | Median Income |
| Owner-Occupied | 154 (48.3%) | $70,236 |
| Renter-Occupied | 165 (51.7%) | $0 |
| Average | 319 (100.0%) | $66,607 |
Occupancy by Householder Income Bracket in Riverside
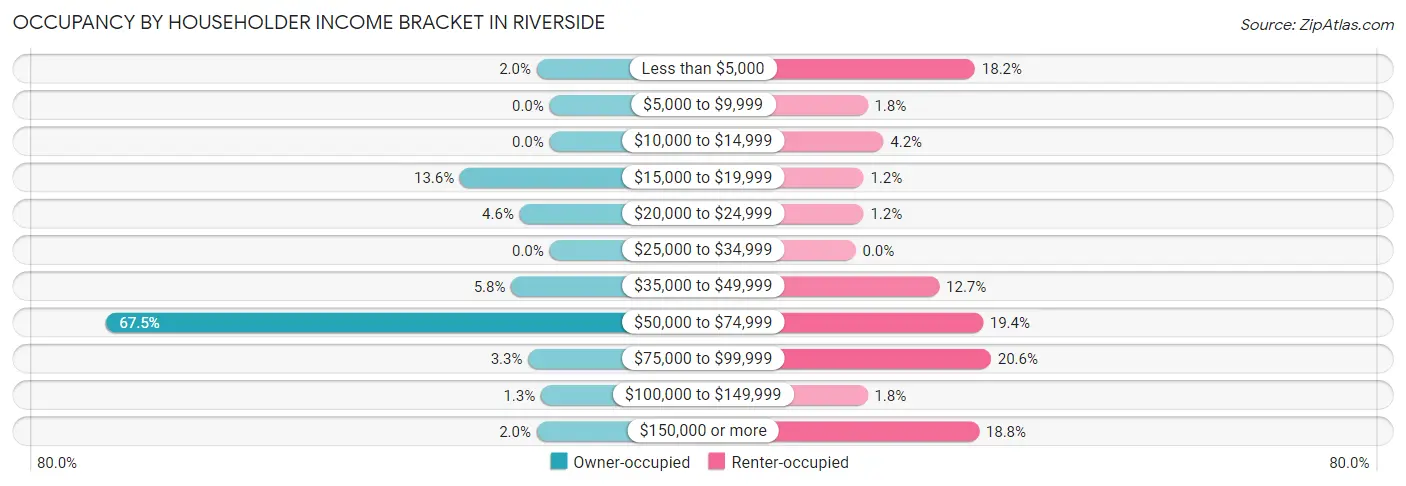
| Income Bracket | Owner-occupied | Renter-occupied |
| Less than $5,000 | 3 (1.9%) | 30 (18.2%) |
| $5,000 to $9,999 | 0 (0.0%) | 3 (1.8%) |
| $10,000 to $14,999 | 0 (0.0%) | 7 (4.2%) |
| $15,000 to $19,999 | 21 (13.6%) | 2 (1.2%) |
| $20,000 to $24,999 | 7 (4.5%) | 2 (1.2%) |
| $25,000 to $34,999 | 0 (0.0%) | 0 (0.0%) |
| $35,000 to $49,999 | 9 (5.8%) | 21 (12.7%) |
| $50,000 to $74,999 | 104 (67.5%) | 32 (19.4%) |
| $75,000 to $99,999 | 5 (3.3%) | 34 (20.6%) |
| $100,000 to $149,999 | 2 (1.3%) | 3 (1.8%) |
| $150,000 or more | 3 (1.9%) | 31 (18.8%) |
| Total | 154 (100.0%) | 165 (100.0%) |
Monthly Housing Cost Tiers in Riverside
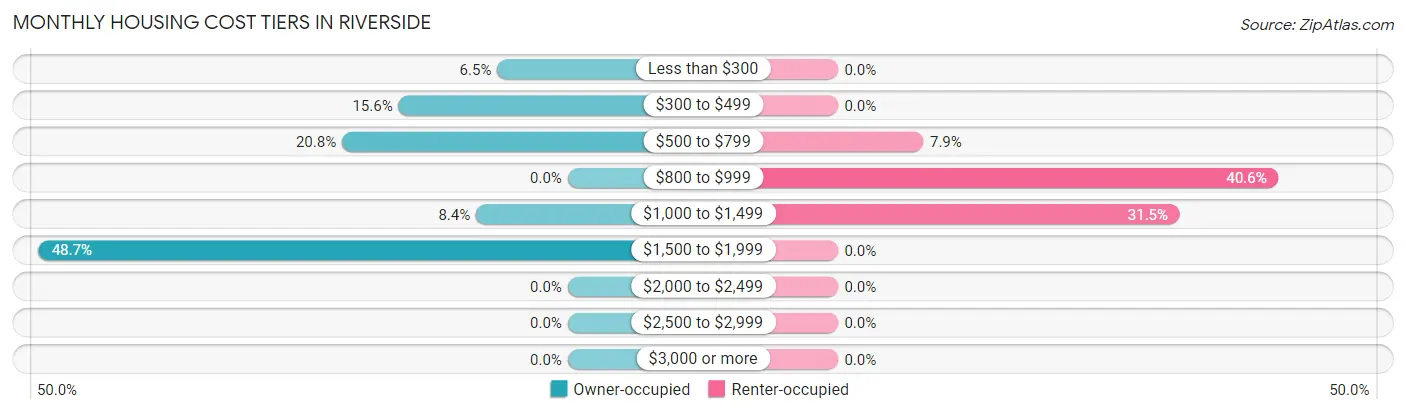
| Monthly Cost | Owner-occupied | Renter-occupied |
| Less than $300 | 10 (6.5%) | 0 (0.0%) |
| $300 to $499 | 24 (15.6%) | 0 (0.0%) |
| $500 to $799 | 32 (20.8%) | 13 (7.9%) |
| $800 to $999 | 0 (0.0%) | 67 (40.6%) |
| $1,000 to $1,499 | 13 (8.4%) | 52 (31.5%) |
| $1,500 to $1,999 | 75 (48.7%) | 0 (0.0%) |
| $2,000 to $2,499 | 0 (0.0%) | 0 (0.0%) |
| $2,500 to $2,999 | 0 (0.0%) | 0 (0.0%) |
| $3,000 or more | 0 (0.0%) | 0 (0.0%) |
| Total | 154 (100.0%) | 165 (100.0%) |
Physical Housing Characteristics in Riverside
Housing Structures in Riverside
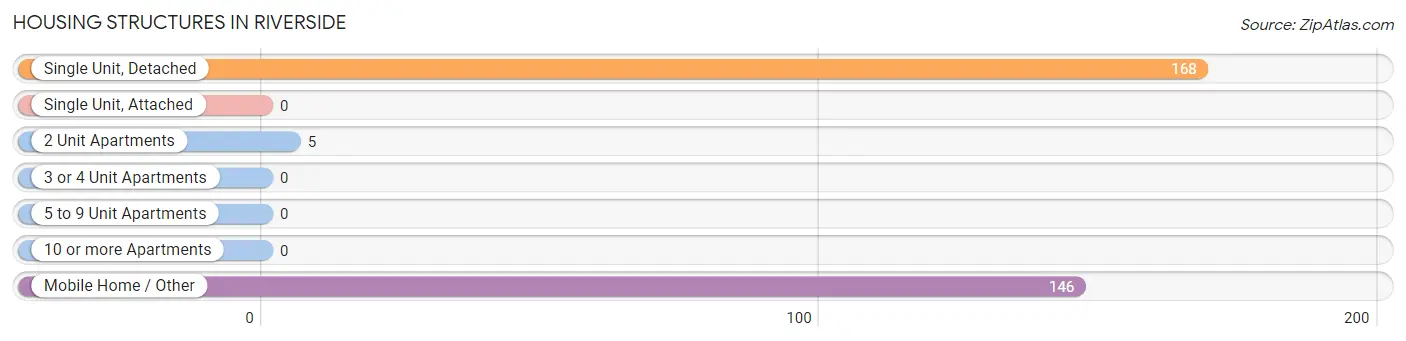
| Structure Type | # Housing Units | % Housing Units |
| Single Unit, Detached | 168 | 52.7% |
| Single Unit, Attached | 0 | 0.0% |
| 2 Unit Apartments | 5 | 1.6% |
| 3 or 4 Unit Apartments | 0 | 0.0% |
| 5 to 9 Unit Apartments | 0 | 0.0% |
| 10 or more Apartments | 0 | 0.0% |
| Mobile Home / Other | 146 | 45.8% |
| Total | 319 | 100.0% |
Housing Structures by Occupancy in Riverside
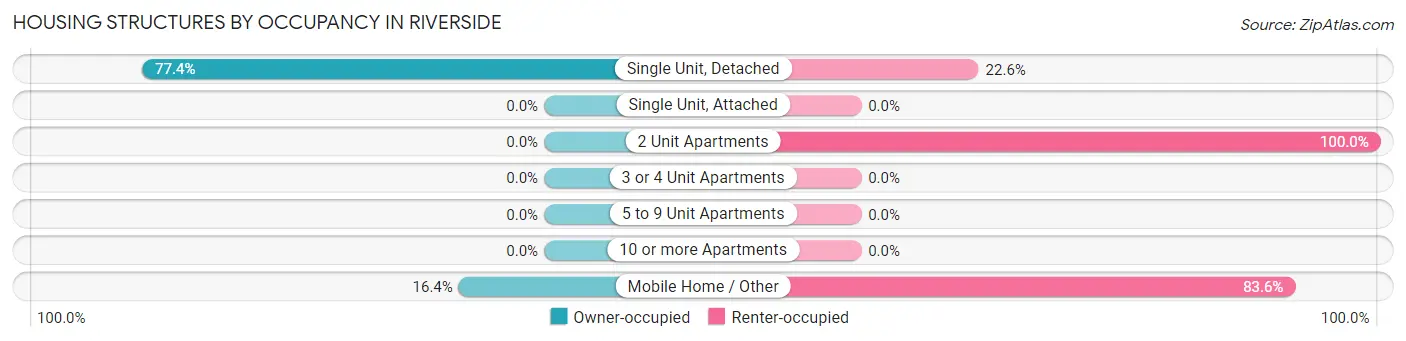
| Structure Type | Owner-occupied | Renter-occupied |
| Single Unit, Detached | 130 (77.4%) | 38 (22.6%) |
| Single Unit, Attached | 0 (0.0%) | 0 (0.0%) |
| 2 Unit Apartments | 0 (0.0%) | 5 (100.0%) |
| 3 or 4 Unit Apartments | 0 (0.0%) | 0 (0.0%) |
| 5 to 9 Unit Apartments | 0 (0.0%) | 0 (0.0%) |
| 10 or more Apartments | 0 (0.0%) | 0 (0.0%) |
| Mobile Home / Other | 24 (16.4%) | 122 (83.6%) |
| Total | 154 (48.3%) | 165 (51.7%) |
Housing Structures by Number of Rooms in Riverside
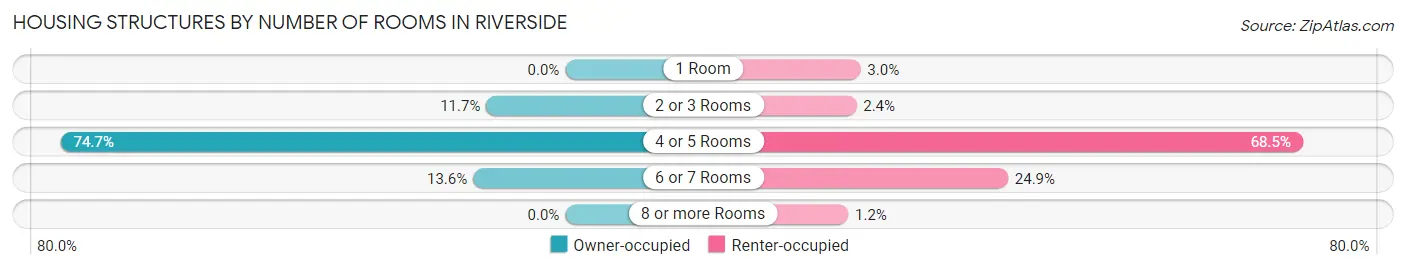
| Number of Rooms | Owner-occupied | Renter-occupied |
| 1 Room | 0 (0.0%) | 5 (3.0%) |
| 2 or 3 Rooms | 18 (11.7%) | 4 (2.4%) |
| 4 or 5 Rooms | 115 (74.7%) | 113 (68.5%) |
| 6 or 7 Rooms | 21 (13.6%) | 41 (24.8%) |
| 8 or more Rooms | 0 (0.0%) | 2 (1.2%) |
| Total | 154 (100.0%) | 165 (100.0%) |
Housing Structure by Heating Type in Riverside
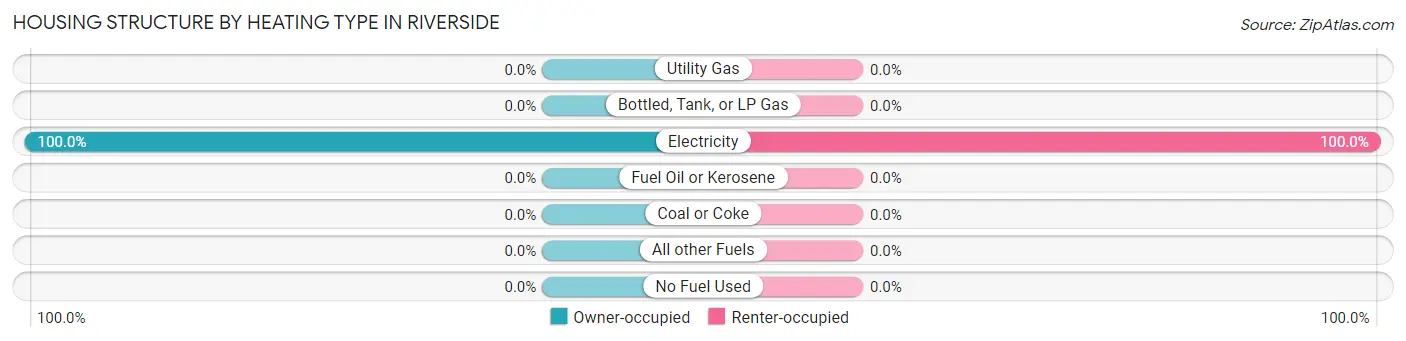
| Heating Type | Owner-occupied | Renter-occupied |
| Utility Gas | 0 (0.0%) | 0 (0.0%) |
| Bottled, Tank, or LP Gas | 0 (0.0%) | 0 (0.0%) |
| Electricity | 154 (100.0%) | 165 (100.0%) |
| Fuel Oil or Kerosene | 0 (0.0%) | 0 (0.0%) |
| Coal or Coke | 0 (0.0%) | 0 (0.0%) |
| All other Fuels | 0 (0.0%) | 0 (0.0%) |
| No Fuel Used | 0 (0.0%) | 0 (0.0%) |
| Total | 154 (100.0%) | 165 (100.0%) |
Household Vehicle Usage in Riverside
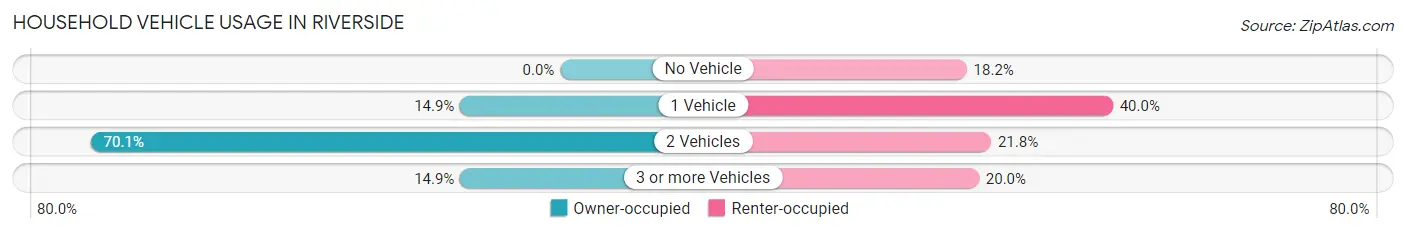
| Vehicles per Household | Owner-occupied | Renter-occupied |
| No Vehicle | 0 (0.0%) | 30 (18.2%) |
| 1 Vehicle | 23 (14.9%) | 66 (40.0%) |
| 2 Vehicles | 108 (70.1%) | 36 (21.8%) |
| 3 or more Vehicles | 23 (14.9%) | 33 (20.0%) |
| Total | 154 (100.0%) | 165 (100.0%) |
Real Estate & Mortgages in Riverside
Real Estate and Mortgage Overview in Riverside
| Characteristic | Without Mortgage | With Mortgage |
| Housing Units | 56 | 98 |
| Median Property Value | - | - |
| Median Household Income | - | - |
| Monthly Housing Costs | $343 | $0 |
| Real Estate Taxes | $1,365 | $0 |
Property Value by Mortgage Status in Riverside
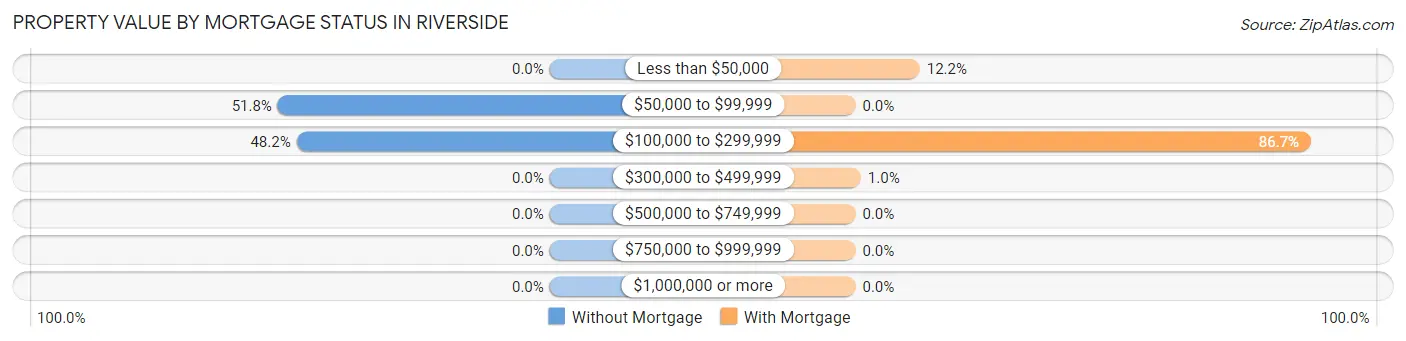
| Property Value | Without Mortgage | With Mortgage |
| Less than $50,000 | 0 (0.0%) | 12 (12.2%) |
| $50,000 to $99,999 | 29 (51.8%) | 0 (0.0%) |
| $100,000 to $299,999 | 27 (48.2%) | 85 (86.7%) |
| $300,000 to $499,999 | 0 (0.0%) | 1 (1.0%) |
| $500,000 to $749,999 | 0 (0.0%) | 0 (0.0%) |
| $750,000 to $999,999 | 0 (0.0%) | 0 (0.0%) |
| $1,000,000 or more | 0 (0.0%) | 0 (0.0%) |
| Total | 56 (100.0%) | 98 (100.0%) |
Household Income by Mortgage Status in Riverside
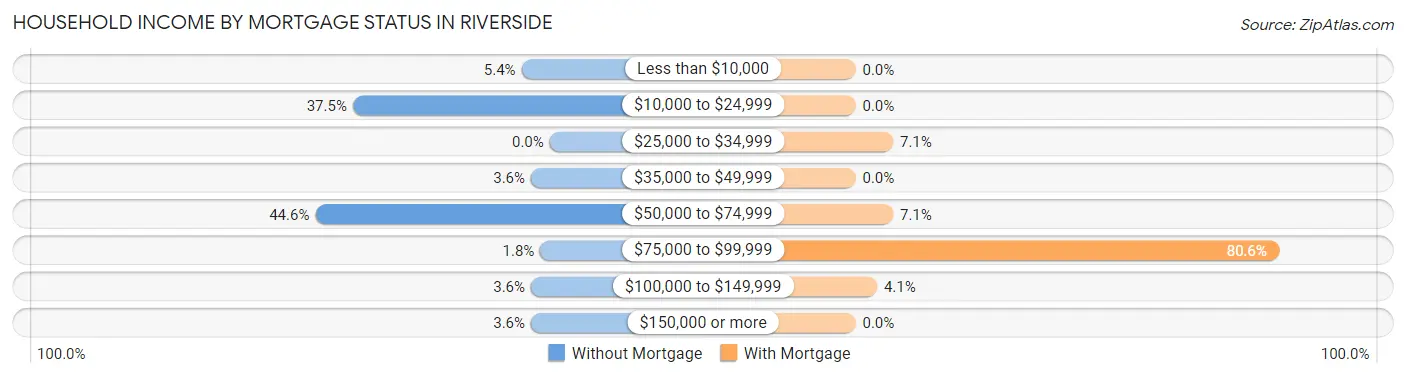
| Household Income | Without Mortgage | With Mortgage |
| Less than $10,000 | 3 (5.4%) | 0 (0.0%) |
| $10,000 to $24,999 | 21 (37.5%) | 0 (0.0%) |
| $25,000 to $34,999 | 0 (0.0%) | 7 (7.1%) |
| $35,000 to $49,999 | 2 (3.6%) | 0 (0.0%) |
| $50,000 to $74,999 | 25 (44.6%) | 7 (7.1%) |
| $75,000 to $99,999 | 1 (1.8%) | 79 (80.6%) |
| $100,000 to $149,999 | 2 (3.6%) | 4 (4.1%) |
| $150,000 or more | 2 (3.6%) | 0 (0.0%) |
| Total | 56 (100.0%) | 98 (100.0%) |
Property Value to Household Income Ratio in Riverside
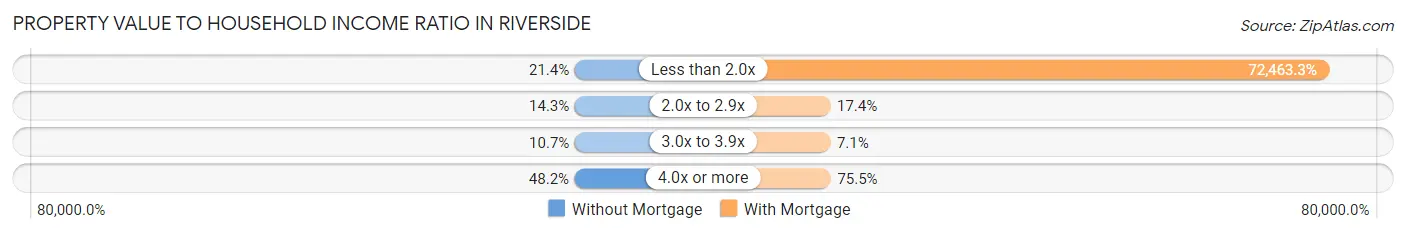
| Value-to-Income Ratio | Without Mortgage | With Mortgage |
| Less than 2.0x | 12 (21.4%) | 71,014 (72,463.3%) |
| 2.0x to 2.9x | 8 (14.3%) | 17 (17.3%) |
| 3.0x to 3.9x | 6 (10.7%) | 7 (7.1%) |
| 4.0x or more | 27 (48.2%) | 74 (75.5%) |
| Total | 56 (100.0%) | 98 (100.0%) |
Real Estate Taxes by Mortgage Status in Riverside
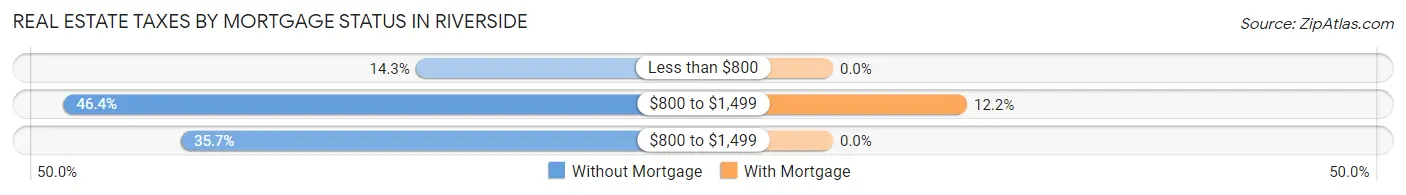
| Property Taxes | Without Mortgage | With Mortgage |
| Less than $800 | 8 (14.3%) | 0 (0.0%) |
| $800 to $1,499 | 26 (46.4%) | 12 (12.2%) |
| $800 to $1,499 | 20 (35.7%) | 0 (0.0%) |
| Total | 56 (100.0%) | 98 (100.0%) |
Health & Disability in Riverside
Health Insurance Coverage by Age in Riverside
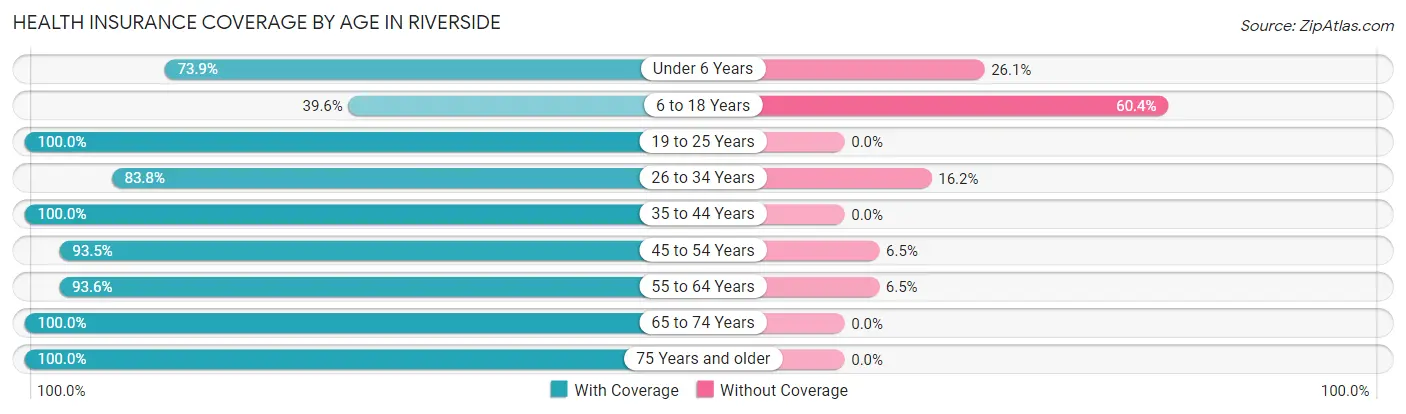
| Age Bracket | With Coverage | Without Coverage |
| Under 6 Years | 51 (73.9%) | 18 (26.1%) |
| 6 to 18 Years | 19 (39.6%) | 29 (60.4%) |
| 19 to 25 Years | 26 (100.0%) | 0 (0.0%) |
| 26 to 34 Years | 62 (83.8%) | 12 (16.2%) |
| 35 to 44 Years | 87 (100.0%) | 0 (0.0%) |
| 45 to 54 Years | 187 (93.5%) | 13 (6.5%) |
| 55 to 64 Years | 58 (93.5%) | 4 (6.5%) |
| 65 to 74 Years | 52 (100.0%) | 0 (0.0%) |
| 75 Years and older | 41 (100.0%) | 0 (0.0%) |
| Total | 583 (88.5%) | 76 (11.5%) |
Health Insurance Coverage by Citizenship Status in Riverside
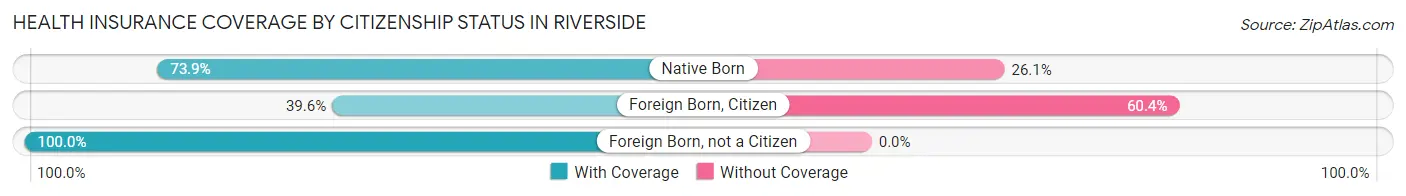
| Citizenship Status | With Coverage | Without Coverage |
| Native Born | 51 (73.9%) | 18 (26.1%) |
| Foreign Born, Citizen | 19 (39.6%) | 29 (60.4%) |
| Foreign Born, not a Citizen | 26 (100.0%) | 0 (0.0%) |
Health Insurance Coverage by Household Income in Riverside
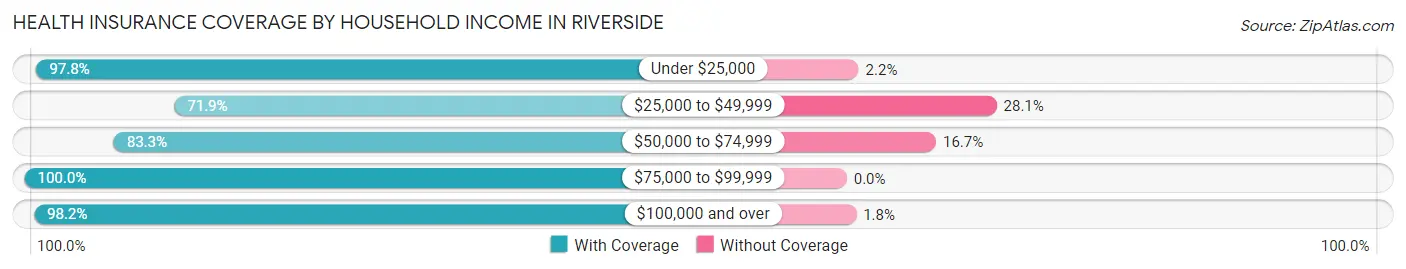
| Household Income | With Coverage | Without Coverage |
| Under $25,000 | 88 (97.8%) | 2 (2.2%) |
| $25,000 to $49,999 | 41 (71.9%) | 16 (28.1%) |
| $50,000 to $74,999 | 279 (83.3%) | 56 (16.7%) |
| $75,000 to $99,999 | 64 (100.0%) | 0 (0.0%) |
| $100,000 and over | 111 (98.2%) | 2 (1.8%) |
Public vs Private Health Insurance Coverage by Age in Riverside
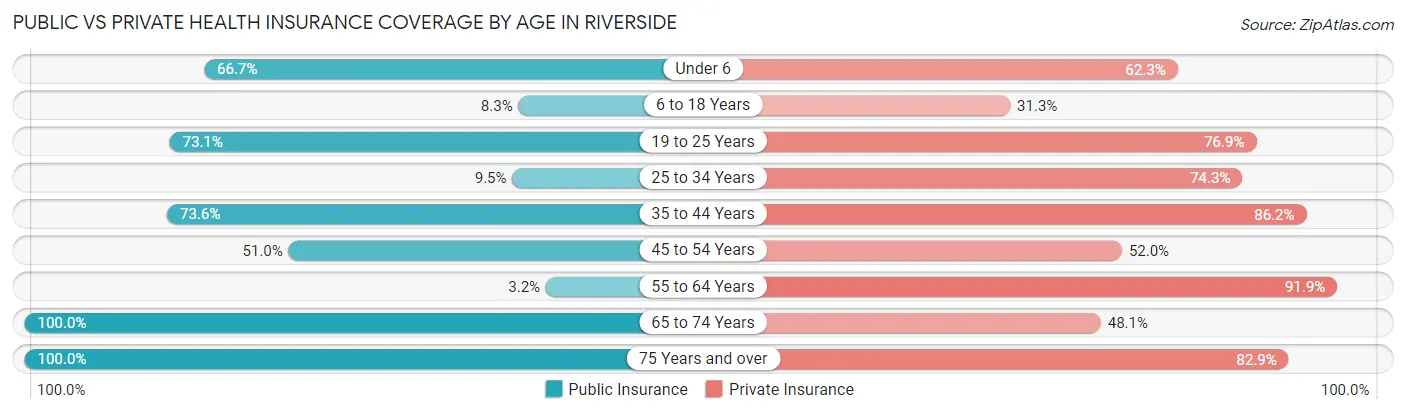
| Age Bracket | Public Insurance | Private Insurance |
| Under 6 | 46 (66.7%) | 43 (62.3%) |
| 6 to 18 Years | 4 (8.3%) | 15 (31.2%) |
| 19 to 25 Years | 19 (73.1%) | 20 (76.9%) |
| 25 to 34 Years | 7 (9.5%) | 55 (74.3%) |
| 35 to 44 Years | 64 (73.6%) | 75 (86.2%) |
| 45 to 54 Years | 102 (51.0%) | 104 (52.0%) |
| 55 to 64 Years | 2 (3.2%) | 57 (91.9%) |
| 65 to 74 Years | 52 (100.0%) | 25 (48.1%) |
| 75 Years and over | 41 (100.0%) | 34 (82.9%) |
| Total | 337 (51.1%) | 428 (64.9%) |
Disability Status by Sex by Age in Riverside
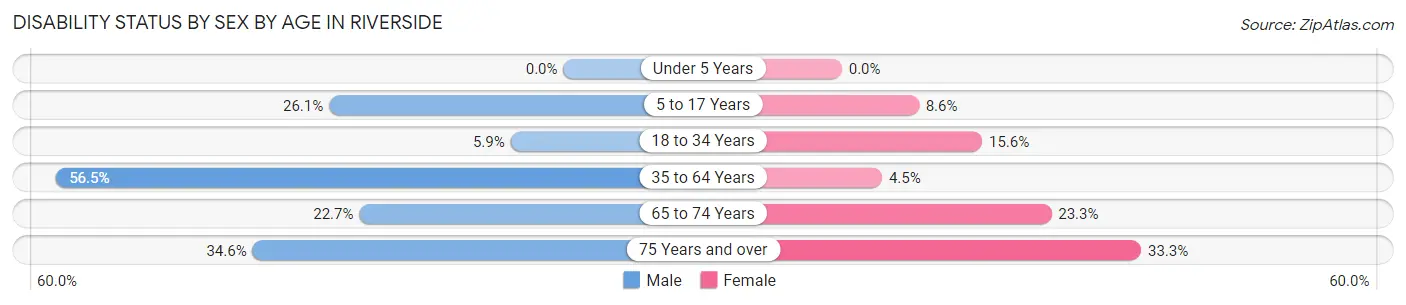
| Age Bracket | Male | Female |
| Under 5 Years | 0 (0.0%) | 0 (0.0%) |
| 5 to 17 Years | 6 (26.1%) | 3 (8.6%) |
| 18 to 34 Years | 4 (5.9%) | 5 (15.6%) |
| 35 to 64 Years | 96 (56.5%) | 8 (4.5%) |
| 65 to 74 Years | 5 (22.7%) | 7 (23.3%) |
| 75 Years and over | 9 (34.6%) | 5 (33.3%) |
Disability Class by Sex by Age in Riverside
Disability Class: Hearing Difficulty
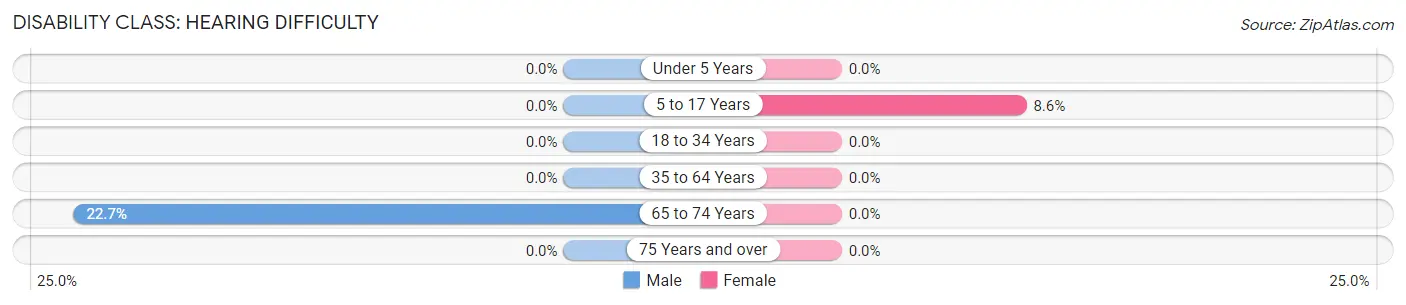
| Age Bracket | Male | Female |
| Under 5 Years | 0 (0.0%) | 0 (0.0%) |
| 5 to 17 Years | 0 (0.0%) | 3 (8.6%) |
| 18 to 34 Years | 0 (0.0%) | 0 (0.0%) |
| 35 to 64 Years | 0 (0.0%) | 0 (0.0%) |
| 65 to 74 Years | 5 (22.7%) | 0 (0.0%) |
| 75 Years and over | 0 (0.0%) | 0 (0.0%) |
Disability Class: Vision Difficulty
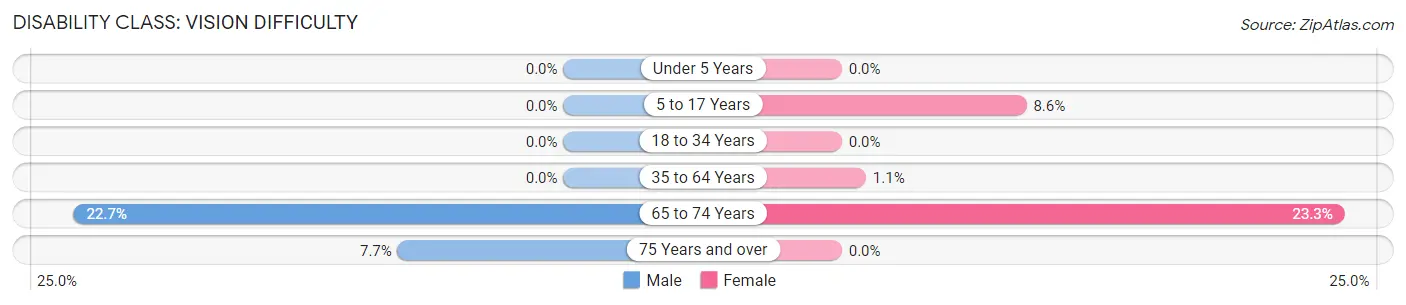
| Age Bracket | Male | Female |
| Under 5 Years | 0 (0.0%) | 0 (0.0%) |
| 5 to 17 Years | 0 (0.0%) | 3 (8.6%) |
| 18 to 34 Years | 0 (0.0%) | 0 (0.0%) |
| 35 to 64 Years | 0 (0.0%) | 2 (1.1%) |
| 65 to 74 Years | 5 (22.7%) | 7 (23.3%) |
| 75 Years and over | 2 (7.7%) | 0 (0.0%) |
Disability Class: Cognitive Difficulty
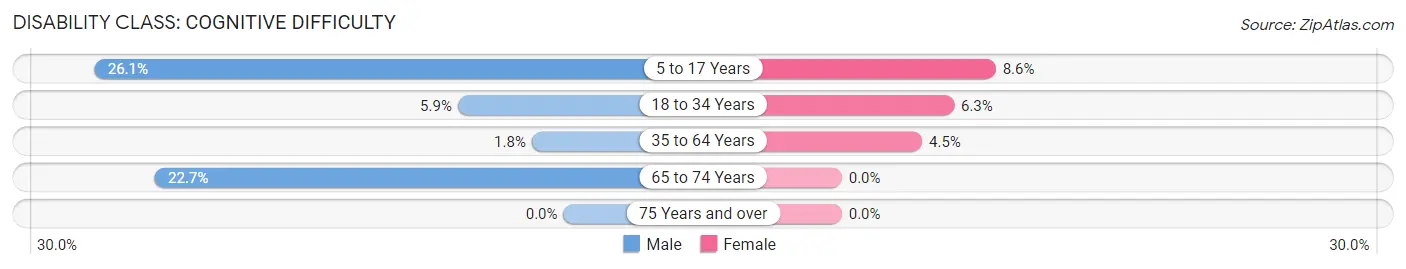
| Age Bracket | Male | Female |
| 5 to 17 Years | 6 (26.1%) | 3 (8.6%) |
| 18 to 34 Years | 4 (5.9%) | 2 (6.2%) |
| 35 to 64 Years | 3 (1.8%) | 8 (4.5%) |
| 65 to 74 Years | 5 (22.7%) | 0 (0.0%) |
| 75 Years and over | 0 (0.0%) | 0 (0.0%) |
Disability Class: Ambulatory Difficulty
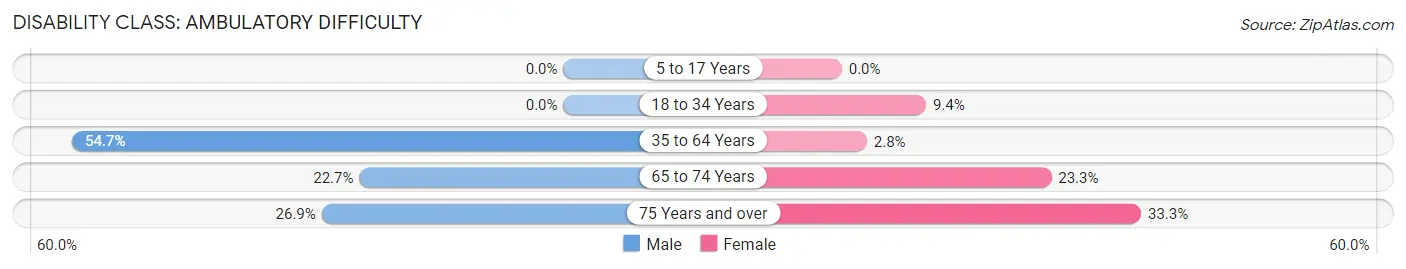
| Age Bracket | Male | Female |
| 5 to 17 Years | 0 (0.0%) | 0 (0.0%) |
| 18 to 34 Years | 0 (0.0%) | 3 (9.4%) |
| 35 to 64 Years | 93 (54.7%) | 5 (2.8%) |
| 65 to 74 Years | 5 (22.7%) | 7 (23.3%) |
| 75 Years and over | 7 (26.9%) | 5 (33.3%) |
Disability Class: Self-Care Difficulty
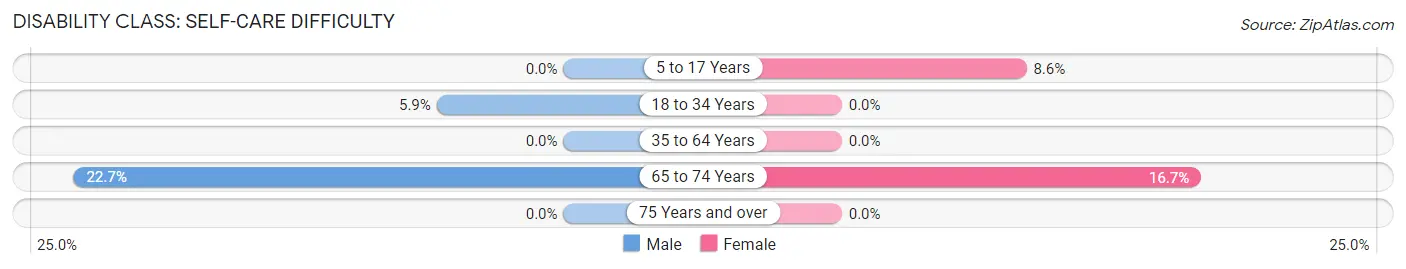
| Age Bracket | Male | Female |
| 5 to 17 Years | 0 (0.0%) | 3 (8.6%) |
| 18 to 34 Years | 4 (5.9%) | 0 (0.0%) |
| 35 to 64 Years | 0 (0.0%) | 0 (0.0%) |
| 65 to 74 Years | 5 (22.7%) | 5 (16.7%) |
| 75 Years and over | 0 (0.0%) | 0 (0.0%) |
Technology Access in Riverside
Computing Device Access in Riverside
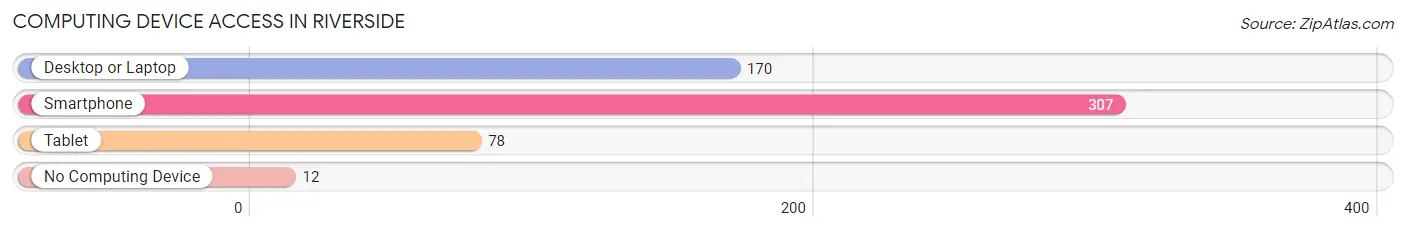
| Device Type | # Households | % Households |
| Desktop or Laptop | 170 | 53.3% |
| Smartphone | 307 | 96.2% |
| Tablet | 78 | 24.4% |
| No Computing Device | 12 | 3.8% |
| Total | 319 | 100.0% |
Internet Access in Riverside
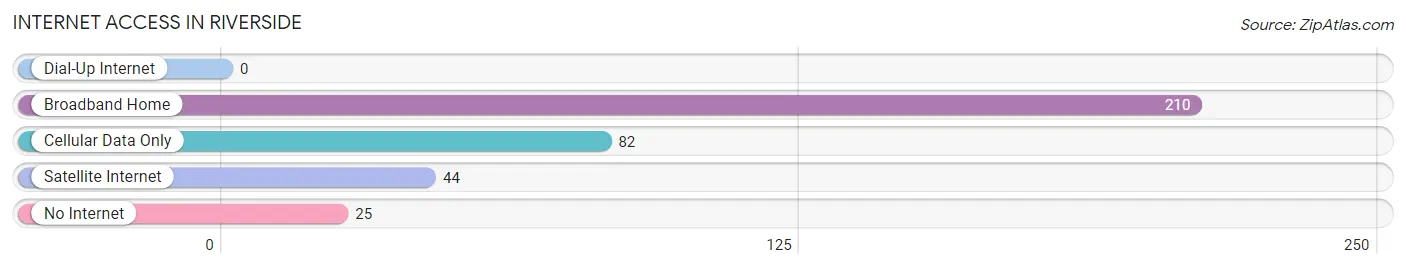
| Internet Type | # Households | % Households |
| Dial-Up Internet | 0 | 0.0% |
| Broadband Home | 210 | 65.8% |
| Cellular Data Only | 82 | 25.7% |
| Satellite Internet | 44 | 13.8% |
| No Internet | 25 | 7.8% |
| Total | 319 | 100.0% |
Riverside Summary
Riverside is a small town located in the state of Texas, United States. It is situated in the eastern part of the state, in the county of Tarrant. The town has a population of around 1,500 people, according to the 2010 census.
History
Riverside was founded in 1876 by a group of settlers from the nearby town of Fort Worth. The town was named after the nearby Trinity River, which was known as the “Riverside” by the settlers. The town was originally a farming community, and the settlers grew cotton, corn, and other crops.
In the early 1900s, Riverside began to grow and develop. The town was incorporated in 1912, and the first mayor was elected in 1913. The town was also home to a number of businesses, including a cotton gin, a blacksmith shop, and a general store.
In the 1920s, Riverside began to experience a period of growth and development. The town was home to a number of businesses, including a bank, a hotel, and a movie theater. The town also had a number of churches, including the First Baptist Church, which was founded in 1921.
In the 1950s, Riverside experienced a period of decline. The town’s population decreased, and many of the businesses closed. However, in the late 1970s, the town began to experience a period of revitalization. The town was home to a number of new businesses, including a grocery store, a hardware store, and a restaurant.
Geography
Riverside is located in the eastern part of the state of Texas, in the county of Tarrant. The town is situated on the banks of the Trinity River, and is surrounded by rolling hills and wooded areas. The town is located approximately 25 miles east of Fort Worth, and is about an hour’s drive from Dallas.
The climate in Riverside is generally mild, with temperatures ranging from the mid-50s in the winter to the mid-80s in the summer. The town receives an average of 37 inches of rain per year, and the area is known for its mild winters and hot summers.
Economy
Riverside’s economy is largely based on agriculture and tourism. The town is home to a number of farms, which produce a variety of crops, including cotton, corn, and hay. The town is also home to a number of tourist attractions, including the Trinity River, which is popular for fishing and boating.
The town is also home to a number of businesses, including a grocery store, a hardware store, and a restaurant. The town is also home to a number of churches, including the First Baptist Church, which was founded in 1921.
Demographics
According to the 2010 census, Riverside has a population of around 1,500 people. The town is predominantly white, with around 85% of the population being white. The town also has a small Hispanic population, with around 10% of the population being Hispanic. The town also has a small African American population, with around 5% of the population being African American. The median household income in Riverside is around $35,000, and the median home value is around $90,000.
Common Questions
What is Per Capita Income in Riverside?
Per Capita income in Riverside is $34,867.
What is the Median Family Income in Riverside?
Median Family Income in Riverside is $70,659.
What is the Median Household income in Riverside?
Median Household Income in Riverside is $66,607.
What is Income or Wage Gap in Riverside?
Income or Wage Gap in Riverside is 39.6%.
Women in Riverside earn 60.4 cents for every dollar earned by a man.
What is Inequality or Gini Index in Riverside?
Inequality or Gini Index in Riverside is 0.42.
What is the Total Population of Riverside?
Total Population of Riverside is 659.
What is the Total Male Population of Riverside?
Total Male Population of Riverside is 363.
What is the Total Female Population of Riverside?
Total Female Population of Riverside is 296.
What is the Ratio of Males per 100 Females in Riverside?
There are 122.64 Males per 100 Females in Riverside.
What is the Ratio of Females per 100 Males in Riverside?
There are 81.54 Females per 100 Males in Riverside.
What is the Median Population Age in Riverside?
Median Population Age in Riverside is 49.6 Years.
What is the Average Family Size in Riverside
Average Family Size in Riverside is 2.6 People.
What is the Average Household Size in Riverside
Average Household Size in Riverside is 2.1 People.
How Large is the Labor Force in Riverside?
There are 258 People in the Labor Forcein in Riverside.
What is the Percentage of People in the Labor Force in Riverside?
47.6% of People are in the Labor Force in Riverside.
What is the Unemployment Rate in Riverside?
Unemployment Rate in Riverside is 0.4%.