Watauga, TX Map & Demographics
Watauga Map
Watauga Overview
$32,279
PER CAPITA INCOME
$91,419
AVG FAMILY INCOME
$88,775
AVG HOUSEHOLD INCOME
14.3%
WAGE / INCOME GAP [ % ]
85.7¢/ $1
WAGE / INCOME GAP [ $ ]
$8,481
FAMILY INCOME DEFICIT
0.34
INEQUALITY / GINI INDEX
23,509
TOTAL POPULATION
12,239
MALE POPULATION
11,270
FEMALE POPULATION
108.60
MALES / 100 FEMALES
92.08
FEMALES / 100 MALES
35.8
MEDIAN AGE
3.3
AVG FAMILY SIZE
3.0
AVG HOUSEHOLD SIZE
13,613
LABOR FORCE [ PEOPLE ]
72.9%
PERCENT IN LABOR FORCE
5.2%
UNEMPLOYMENT RATE
Income in Watauga
Income Overview in Watauga
Per Capita Income in Watauga is $32,279, while median incomes of families and households are $91,419 and $88,775 respectively.
| Characteristic | Number | Measure |
| Per Capita Income | 23,509 | $32,279 |
| Median Family Income | 6,000 | $91,419 |
| Mean Family Income | 6,000 | $99,701 |
| Median Household Income | 7,825 | $88,775 |
| Mean Household Income | 7,825 | $94,250 |
| Income Deficit | 6,000 | $8,481 |
| Wage / Income Gap (%) | 23,509 | 14.34% |
| Wage / Income Gap ($) | 23,509 | 85.66¢ per $1 |
| Gini / Inequality Index | 23,509 | 0.34 |
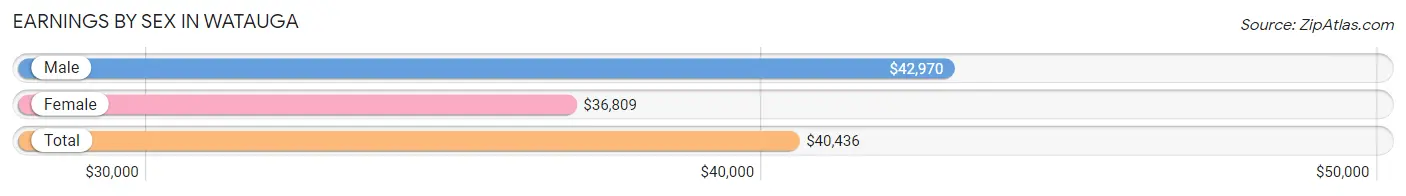
Earnings by Sex in Watauga
Average Earnings in Watauga are $40,436, $42,970 for men and $36,809 for women, a difference of 14.3%.
| Sex | Number | Average Earnings |
| Male | 8,005 (57.6%) | $42,970 |
| Female | 5,888 (42.4%) | $36,809 |
| Total | 13,893 (100.0%) | $40,436 |
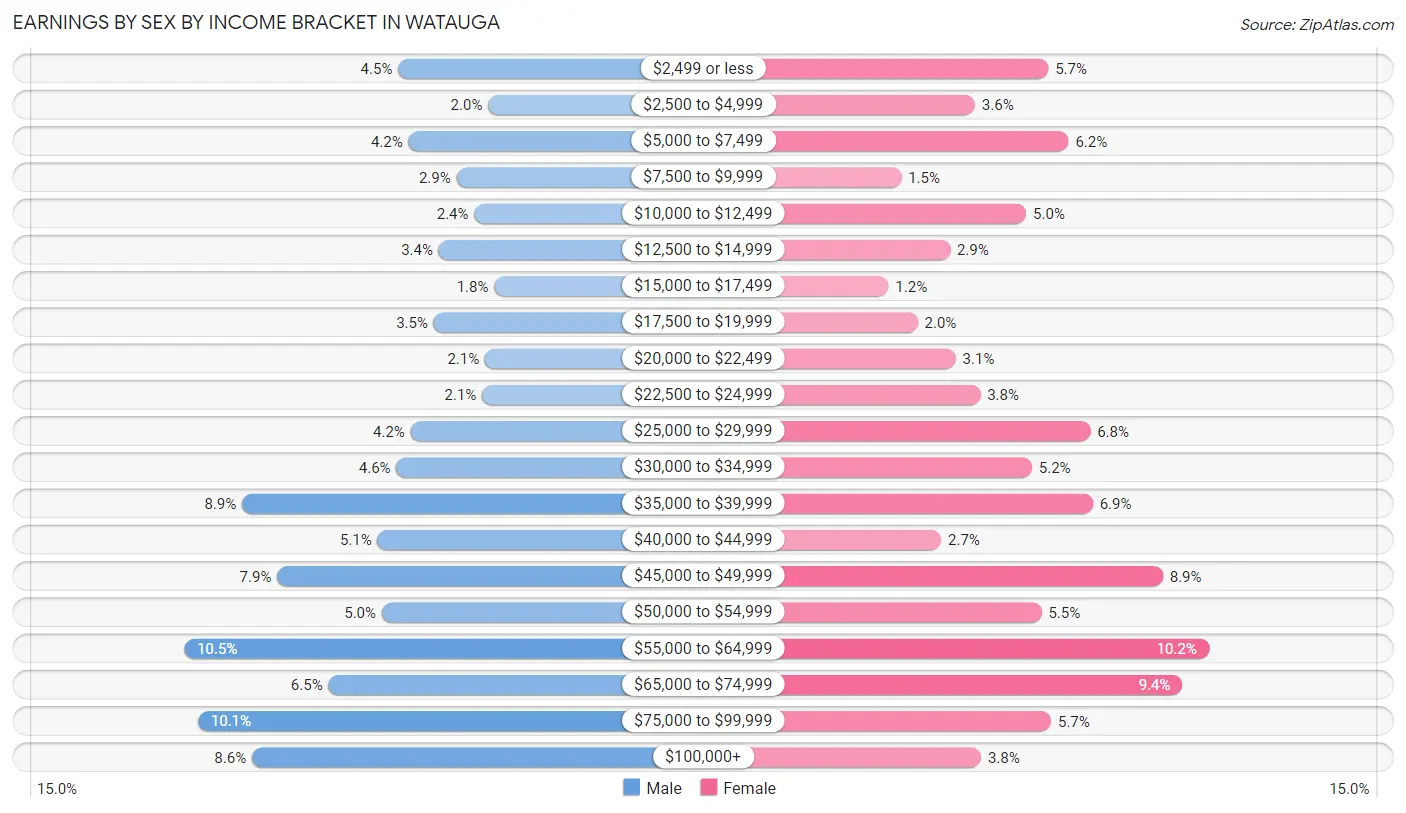
Earnings by Sex by Income Bracket in Watauga
The most common earnings brackets in Watauga are $55,000 to $64,999 for men (842 | 10.5%) and $55,000 to $64,999 for women (599 | 10.2%).
| Income | Male | Female |
| $2,499 or less | 360 (4.5%) | 333 (5.7%) |
| $2,500 to $4,999 | 158 (2.0%) | 212 (3.6%) |
| $5,000 to $7,499 | 337 (4.2%) | 367 (6.2%) |
| $7,500 to $9,999 | 229 (2.9%) | 90 (1.5%) |
| $10,000 to $12,499 | 189 (2.4%) | 297 (5.0%) |
| $12,500 to $14,999 | 269 (3.4%) | 171 (2.9%) |
| $15,000 to $17,499 | 144 (1.8%) | 69 (1.2%) |
| $17,500 to $19,999 | 280 (3.5%) | 117 (2.0%) |
| $20,000 to $22,499 | 165 (2.1%) | 180 (3.1%) |
| $22,500 to $24,999 | 171 (2.1%) | 221 (3.7%) |
| $25,000 to $29,999 | 332 (4.2%) | 403 (6.8%) |
| $30,000 to $34,999 | 364 (4.5%) | 306 (5.2%) |
| $35,000 to $39,999 | 712 (8.9%) | 407 (6.9%) |
| $40,000 to $44,999 | 407 (5.1%) | 156 (2.6%) |
| $45,000 to $49,999 | 632 (7.9%) | 523 (8.9%) |
| $50,000 to $54,999 | 397 (5.0%) | 322 (5.5%) |
| $55,000 to $64,999 | 842 (10.5%) | 599 (10.2%) |
| $65,000 to $74,999 | 517 (6.5%) | 555 (9.4%) |
| $75,000 to $99,999 | 811 (10.1%) | 338 (5.7%) |
| $100,000+ | 689 (8.6%) | 222 (3.8%) |
| Total | 8,005 (100.0%) | 5,888 (100.0%) |
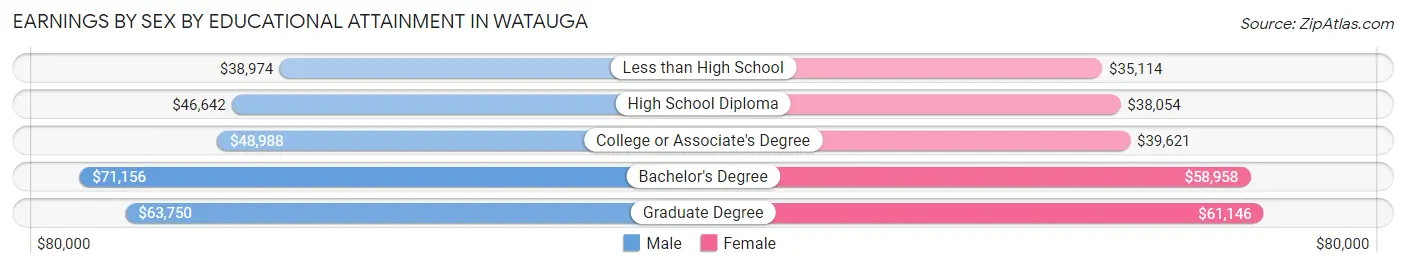
Earnings by Sex by Educational Attainment in Watauga
Average earnings in Watauga are $49,525 for men and $45,018 for women, a difference of 9.1%. Men with an educational attainment of bachelor's degree enjoy the highest average annual earnings of $71,156, while those with less than high school education earn the least with $38,974. Women with an educational attainment of graduate degree earn the most with the average annual earnings of $61,146, while those with less than high school education have the smallest earnings of $35,114.
| Educational Attainment | Male Income | Female Income |
| Less than High School | $38,974 | $35,114 |
| High School Diploma | $46,642 | $38,054 |
| College or Associate's Degree | $48,988 | $39,621 |
| Bachelor's Degree | $71,156 | $58,958 |
| Graduate Degree | $63,750 | $61,146 |
| Total | $49,525 | $45,018 |
Family Income in Watauga
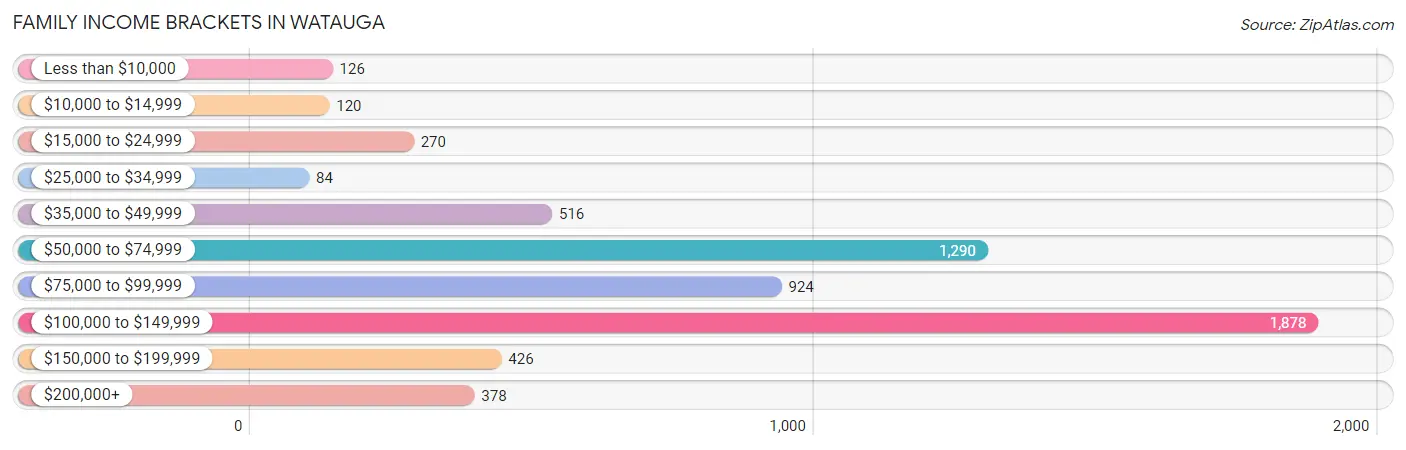
Family Income Brackets in Watauga
According to the Watauga family income data, there are 1,878 families falling into the $100,000 to $149,999 income range, which is the most common income bracket and makes up 31.3% of all families. Conversely, the $25,000 to $34,999 income bracket is the least frequent group with only 84 families (1.4%) belonging to this category.
| Income Bracket | # Families | % Families |
| Less than $10,000 | 126 | 2.1% |
| $10,000 to $14,999 | 120 | 2.0% |
| $15,000 to $24,999 | 270 | 4.5% |
| $25,000 to $34,999 | 84 | 1.4% |
| $35,000 to $49,999 | 516 | 8.6% |
| $50,000 to $74,999 | 1,290 | 21.5% |
| $75,000 to $99,999 | 924 | 15.4% |
| $100,000 to $149,999 | 1,878 | 31.3% |
| $150,000 to $199,999 | 426 | 7.1% |
| $200,000+ | 378 | 6.3% |
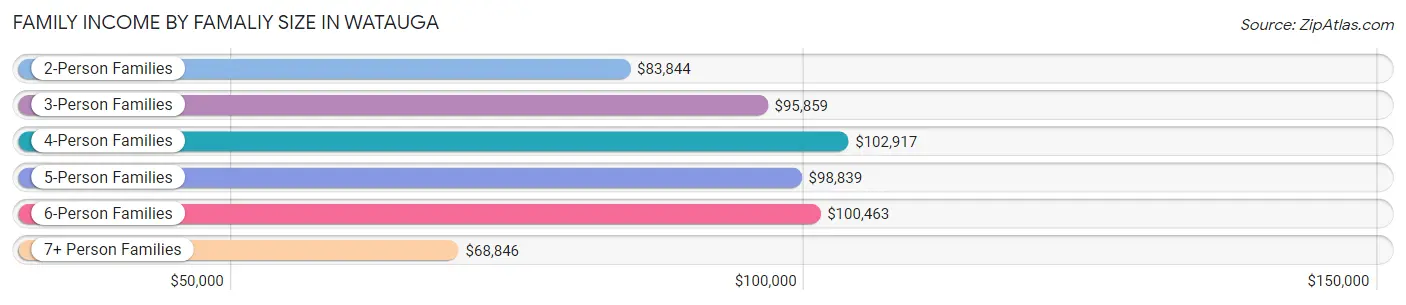
Family Income by Famaliy Size in Watauga
4-person families (1,010 | 16.8%) account for the highest median family income in Watauga with $102,917 per family, while 2-person families (2,675 | 44.6%) have the highest median income of $41,922 per family member.
| Income Bracket | # Families | Median Income |
| 2-Person Families | 2,675 (44.6%) | $83,844 |
| 3-Person Families | 1,338 (22.3%) | $95,859 |
| 4-Person Families | 1,010 (16.8%) | $102,917 |
| 5-Person Families | 597 (10.0%) | $98,839 |
| 6-Person Families | 160 (2.7%) | $100,463 |
| 7+ Person Families | 220 (3.7%) | $68,846 |
| Total | 6,000 (100.0%) | $91,419 |
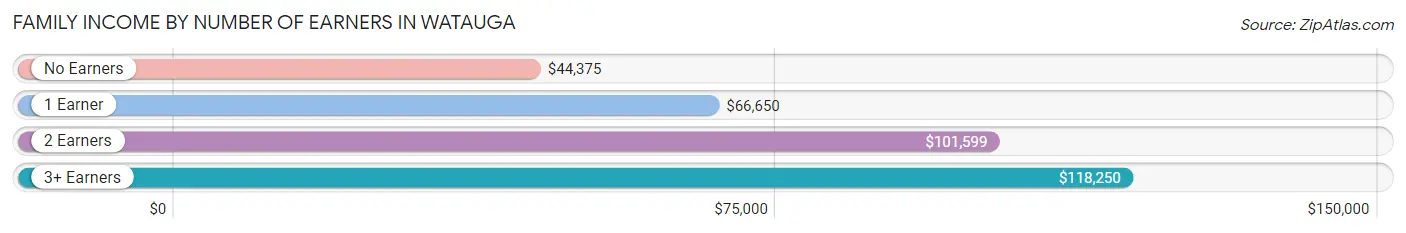
Family Income by Number of Earners in Watauga
The median family income in Watauga is $91,419, with families comprising 3+ earners (1,155) having the highest median family income of $118,250, while families with no earners (547) have the lowest median family income of $44,375, accounting for 19.3% and 9.1% of families, respectively.
| Number of Earners | # Families | Median Income |
| No Earners | 547 (9.1%) | $44,375 |
| 1 Earner | 1,664 (27.7%) | $66,650 |
| 2 Earners | 2,634 (43.9%) | $101,599 |
| 3+ Earners | 1,155 (19.3%) | $118,250 |
| Total | 6,000 (100.0%) | $91,419 |
Household Income in Watauga
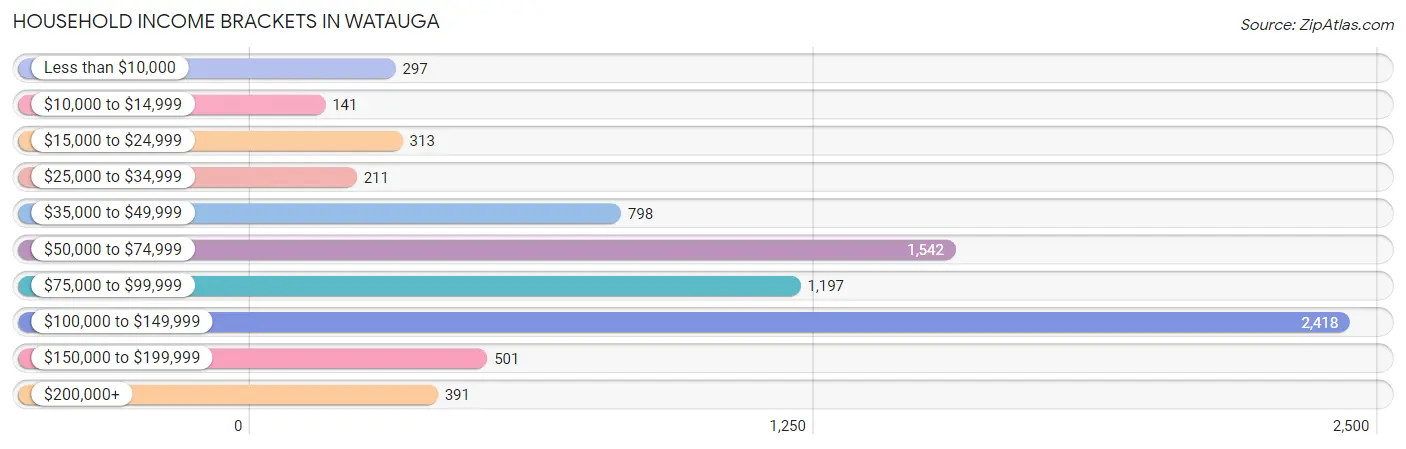
Household Income Brackets in Watauga
With 2,418 households falling in the category, the $100,000 to $149,999 income range is the most frequent in Watauga, accounting for 30.9% of all households. In contrast, only 141 households (1.8%) fall into the $10,000 to $14,999 income bracket, making it the least populous group.
| Income Bracket | # Households | % Households |
| Less than $10,000 | 297 | 3.8% |
| $10,000 to $14,999 | 141 | 1.8% |
| $15,000 to $24,999 | 313 | 4.0% |
| $25,000 to $34,999 | 211 | 2.7% |
| $35,000 to $49,999 | 798 | 10.2% |
| $50,000 to $74,999 | 1,542 | 19.7% |
| $75,000 to $99,999 | 1,197 | 15.3% |
| $100,000 to $149,999 | 2,418 | 30.9% |
| $150,000 to $199,999 | 501 | 6.4% |
| $200,000+ | 391 | 5.0% |
Household Income by Householder Age in Watauga
The median household income in Watauga is $88,775, with the highest median household income of $97,581 found in the 45 to 64 years age bracket for the primary householder. A total of 3,230 households (41.3%) fall into this category. Meanwhile, the 65+ years age bracket for the primary householder has the lowest median household income of $63,011, with 1,547 households (19.8%) in this group.
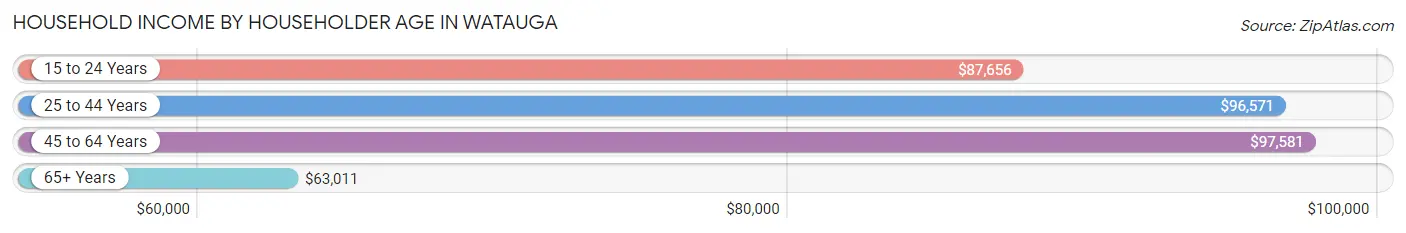
| Income Bracket | # Households | Median Income |
| 15 to 24 Years | 172 (2.2%) | $87,656 |
| 25 to 44 Years | 2,876 (36.7%) | $96,571 |
| 45 to 64 Years | 3,230 (41.3%) | $97,581 |
| 65+ Years | 1,547 (19.8%) | $63,011 |
| Total | 7,825 (100.0%) | $88,775 |
Poverty in Watauga
Income Below Poverty by Sex and Age in Watauga
With 9.0% poverty level for males and 10.0% for females among the residents of Watauga, 65 to 74 year old males and 6 to 11 year old females are the most vulnerable to poverty, with 135 males (15.6%) and 187 females (19.2%) in their respective age groups living below the poverty level.

| Age Bracket | Male | Female |
| Under 5 Years | 30 (3.7%) | 47 (7.4%) |
| 5 Years | 0 (0.0%) | 0 (0.0%) |
| 6 to 11 Years | 107 (10.1%) | 187 (19.2%) |
| 12 to 14 Years | 29 (8.3%) | 23 (5.5%) |
| 15 Years | 21 (12.7%) | 0 (0.0%) |
| 16 and 17 Years | 42 (14.5%) | 0 (0.0%) |
| 18 to 24 Years | 215 (14.2%) | 78 (9.6%) |
| 25 to 34 Years | 267 (14.5%) | 164 (10.1%) |
| 35 to 44 Years | 106 (6.4%) | 130 (9.3%) |
| 45 to 54 Years | 63 (4.2%) | 46 (3.3%) |
| 55 to 64 Years | 60 (3.8%) | 242 (14.2%) |
| 65 to 74 Years | 135 (15.6%) | 195 (17.5%) |
| 75 Years and over | 23 (6.5%) | 12 (2.6%) |
| Total | 1,098 (9.0%) | 1,124 (10.0%) |
Income Above Poverty by Sex and Age in Watauga
According to the poverty statistics in Watauga, males aged 5 years and females aged 5 years are the age groups that are most secure financially, with 100.0% of males and 100.0% of females in these age groups living above the poverty line.
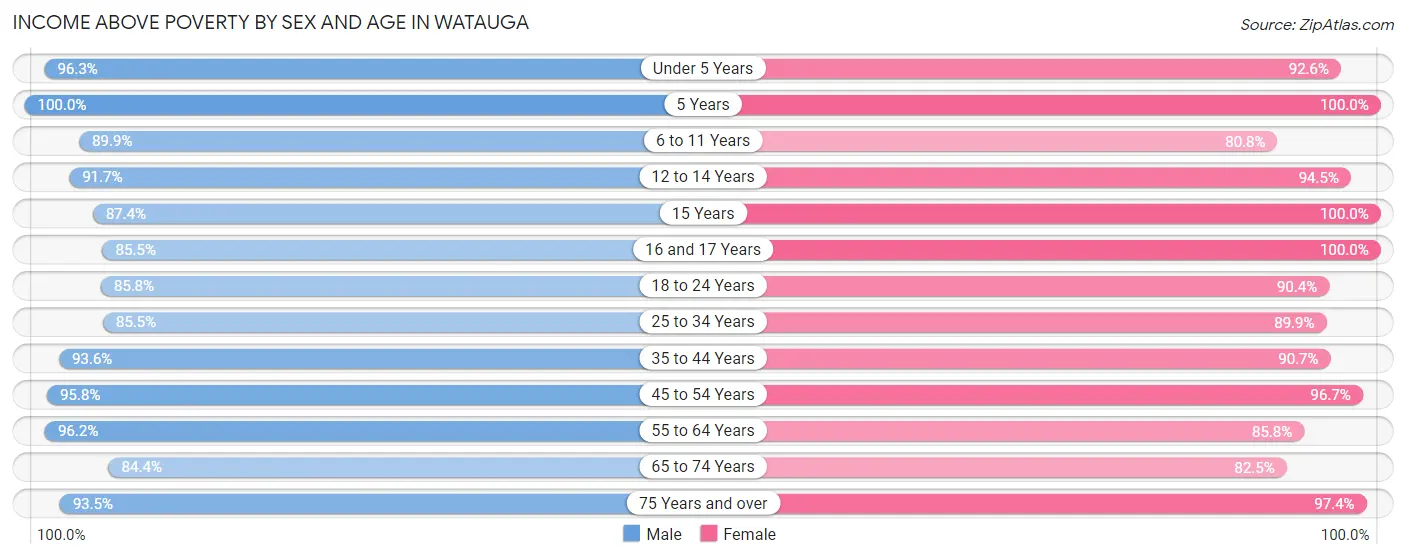
| Age Bracket | Male | Female |
| Under 5 Years | 784 (96.3%) | 589 (92.6%) |
| 5 Years | 151 (100.0%) | 68 (100.0%) |
| 6 to 11 Years | 952 (89.9%) | 789 (80.8%) |
| 12 to 14 Years | 321 (91.7%) | 392 (94.5%) |
| 15 Years | 145 (87.4%) | 146 (100.0%) |
| 16 and 17 Years | 248 (85.5%) | 456 (100.0%) |
| 18 to 24 Years | 1,303 (85.8%) | 737 (90.4%) |
| 25 to 34 Years | 1,571 (85.5%) | 1,465 (89.9%) |
| 35 to 44 Years | 1,555 (93.6%) | 1,265 (90.7%) |
| 45 to 54 Years | 1,453 (95.8%) | 1,334 (96.7%) |
| 55 to 64 Years | 1,522 (96.2%) | 1,461 (85.8%) |
| 65 to 74 Years | 730 (84.4%) | 922 (82.5%) |
| 75 Years and over | 330 (93.5%) | 444 (97.4%) |
| Total | 11,065 (91.0%) | 10,068 (90.0%) |
Income Below Poverty Among Married-Couple Families in Watauga
The poverty statistics for married-couple families in Watauga show that 4.6% or 214 of the total 4,660 families live below the poverty line. Families with 3 or 4 children have the highest poverty rate of 19.6%, comprising of 66 families. On the other hand, families with 5 or more children have the lowest poverty rate of 0.0%, which includes 0 families.
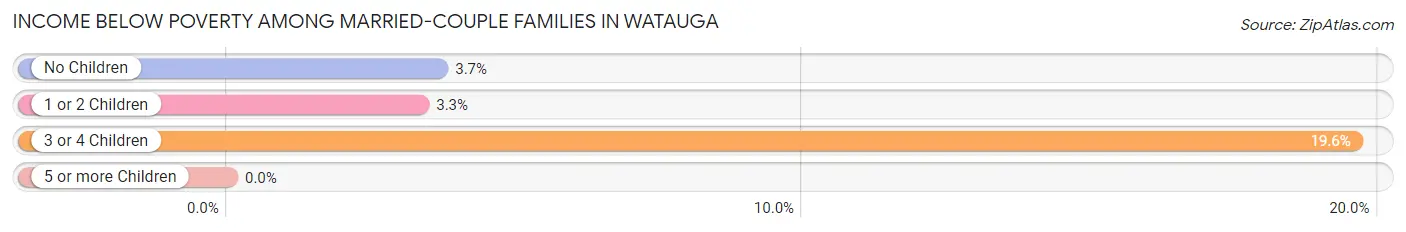
| Children | Above Poverty | Below Poverty |
| No Children | 2,661 (96.3%) | 101 (3.7%) |
| 1 or 2 Children | 1,366 (96.7%) | 47 (3.3%) |
| 3 or 4 Children | 271 (80.4%) | 66 (19.6%) |
| 5 or more Children | 148 (100.0%) | 0 (0.0%) |
| Total | 4,446 (95.4%) | 214 (4.6%) |
Income Below Poverty Among Single-Parent Households in Watauga
According to the poverty data in Watauga, 19.0% or 103 single-father households and 19.6% or 156 single-mother households are living below the poverty line. Among single-father households, those with 3 or 4 children have the highest poverty rate, with 20 households (33.3%) experiencing poverty. Likewise, among single-mother households, those with no children have the highest poverty rate, with 78 households (21.7%) falling below the poverty line.
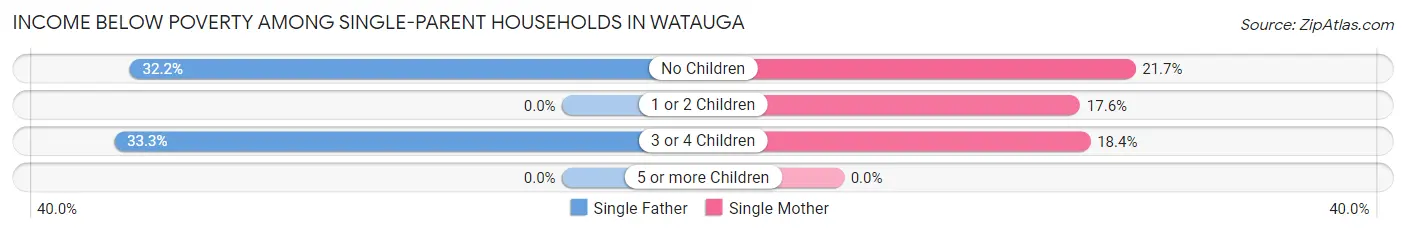
| Children | Single Father | Single Mother |
| No Children | 83 (32.2%) | 78 (21.7%) |
| 1 or 2 Children | 0 (0.0%) | 60 (17.6%) |
| 3 or 4 Children | 20 (33.3%) | 18 (18.4%) |
| 5 or more Children | 0 (0.0%) | 0 (0.0%) |
| Total | 103 (19.0%) | 156 (19.6%) |
Income Below Poverty Among Married-Couple vs Single-Parent Households in Watauga
The poverty data for Watauga shows that 214 of the married-couple family households (4.6%) and 259 of the single-parent households (19.3%) are living below the poverty level. Within the married-couple family households, those with 3 or 4 children have the highest poverty rate, with 66 households (19.6%) falling below the poverty line. Among the single-parent households, those with no children have the highest poverty rate, with 161 household (26.1%) living below poverty.
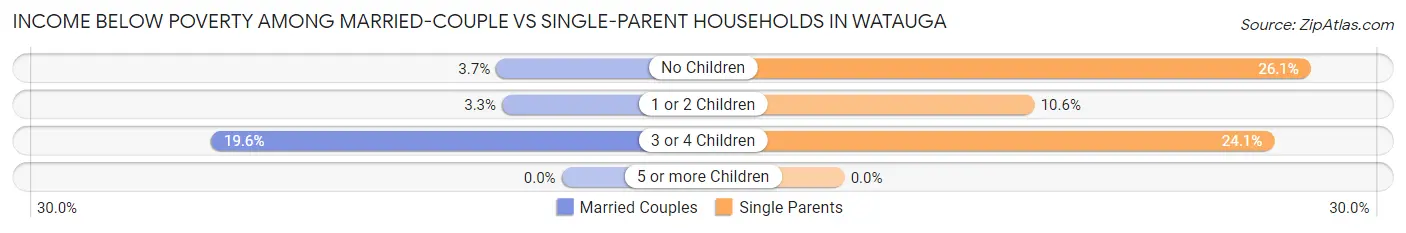
| Children | Married-Couple Families | Single-Parent Households |
| No Children | 101 (3.7%) | 161 (26.1%) |
| 1 or 2 Children | 47 (3.3%) | 60 (10.6%) |
| 3 or 4 Children | 66 (19.6%) | 38 (24.0%) |
| 5 or more Children | 0 (0.0%) | 0 (0.0%) |
| Total | 214 (4.6%) | 259 (19.3%) |
Race in Watauga
The most populous races in Watauga are White / Caucasian (16,197 | 68.9%), Hispanic or Latino (6,362 | 27.1%), and Two or more Races (2,743 | 11.7%).
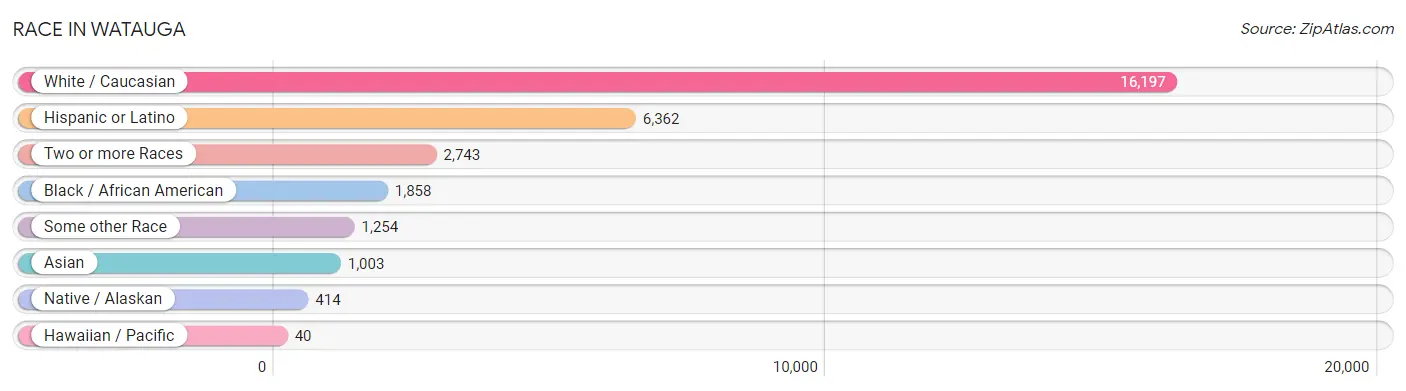
| Race | # Population | % Population |
| Asian | 1,003 | 4.3% |
| Black / African American | 1,858 | 7.9% |
| Hawaiian / Pacific | 40 | 0.2% |
| Hispanic or Latino | 6,362 | 27.1% |
| Native / Alaskan | 414 | 1.8% |
| White / Caucasian | 16,197 | 68.9% |
| Two or more Races | 2,743 | 11.7% |
| Some other Race | 1,254 | 5.3% |
| Total | 23,509 | 100.0% |
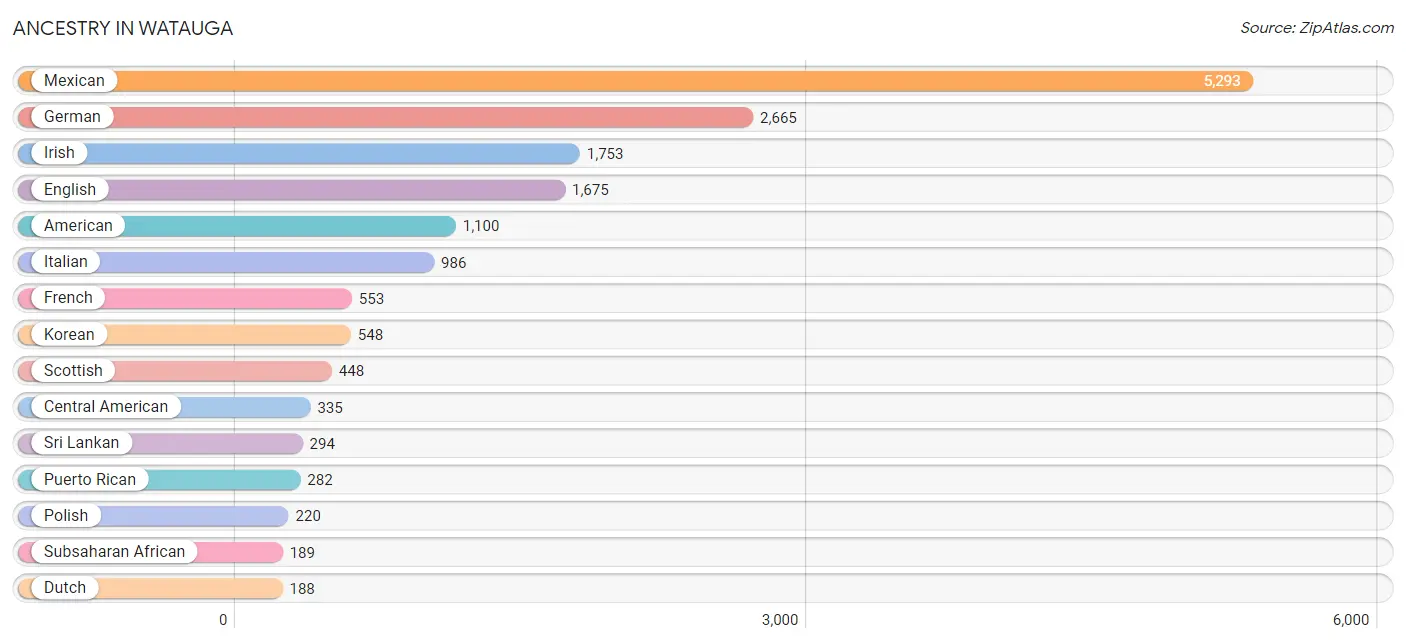
Ancestry in Watauga
The most populous ancestries reported in Watauga are Mexican (5,293 | 22.5%), German (2,665 | 11.3%), Irish (1,753 | 7.5%), English (1,675 | 7.1%), and American (1,100 | 4.7%), together accounting for 53.1% of all Watauga residents.
| Ancestry | # Population | % Population |
| African | 109 | 0.5% |
| American | 1,100 | 4.7% |
| Apache | 26 | 0.1% |
| Arab | 21 | 0.1% |
| Austrian | 10 | 0.0% |
| Blackfeet | 22 | 0.1% |
| Bolivian | 11 | 0.1% |
| Brazilian | 31 | 0.1% |
| British | 78 | 0.3% |
| Burmese | 31 | 0.1% |
| Canadian | 54 | 0.2% |
| Central American | 335 | 1.4% |
| Central American Indian | 30 | 0.1% |
| Cherokee | 119 | 0.5% |
| Chickasaw | 6 | 0.0% |
| Choctaw | 78 | 0.3% |
| Colombian | 71 | 0.3% |
| Cuban | 11 | 0.1% |
| Czech | 91 | 0.4% |
| Danish | 9 | 0.0% |
| Dominican | 21 | 0.1% |
| Dutch | 188 | 0.8% |
| Dutch West Indian | 11 | 0.1% |
| English | 1,675 | 7.1% |
| European | 131 | 0.6% |
| French | 553 | 2.4% |
| French Canadian | 24 | 0.1% |
| German | 2,665 | 11.3% |
| German Russian | 5 | 0.0% |
| Greek | 33 | 0.1% |
| Guamanian / Chamorro | 40 | 0.2% |
| Guatemalan | 86 | 0.4% |
| Honduran | 67 | 0.3% |
| Hungarian | 52 | 0.2% |
| Indian (Asian) | 106 | 0.4% |
| Iranian | 12 | 0.1% |
| Irish | 1,753 | 7.5% |
| Italian | 986 | 4.2% |
| Japanese | 10 | 0.0% |
| Korean | 548 | 2.3% |
| Lebanese | 6 | 0.0% |
| Liberian | 67 | 0.3% |
| Malaysian | 65 | 0.3% |
| Maltese | 28 | 0.1% |
| Mexican | 5,293 | 22.5% |
| Mexican American Indian | 15 | 0.1% |
| Mongolian | 8 | 0.0% |
| Native Hawaiian | 40 | 0.2% |
| Navajo | 122 | 0.5% |
| Northern European | 91 | 0.4% |
| Norwegian | 173 | 0.7% |
| Ottawa | 16 | 0.1% |
| Peruvian | 29 | 0.1% |
| Polish | 220 | 0.9% |
| Pueblo | 17 | 0.1% |
| Puerto Rican | 282 | 1.2% |
| Romanian | 12 | 0.1% |
| Russian | 82 | 0.4% |
| Salvadoran | 182 | 0.8% |
| Scandinavian | 59 | 0.3% |
| Scotch-Irish | 182 | 0.8% |
| Scottish | 448 | 1.9% |
| Serbian | 18 | 0.1% |
| Sioux | 30 | 0.1% |
| Slovak | 8 | 0.0% |
| South American | 141 | 0.6% |
| Spaniard | 182 | 0.8% |
| Spanish | 7 | 0.0% |
| Spanish American | 13 | 0.1% |
| Sri Lankan | 294 | 1.3% |
| Subsaharan African | 189 | 0.8% |
| Swedish | 77 | 0.3% |
| Thai | 84 | 0.4% |
| Ugandan | 13 | 0.1% |
| Venezuelan | 30 | 0.1% |
| Welsh | 26 | 0.1% | View All 76 Rows |
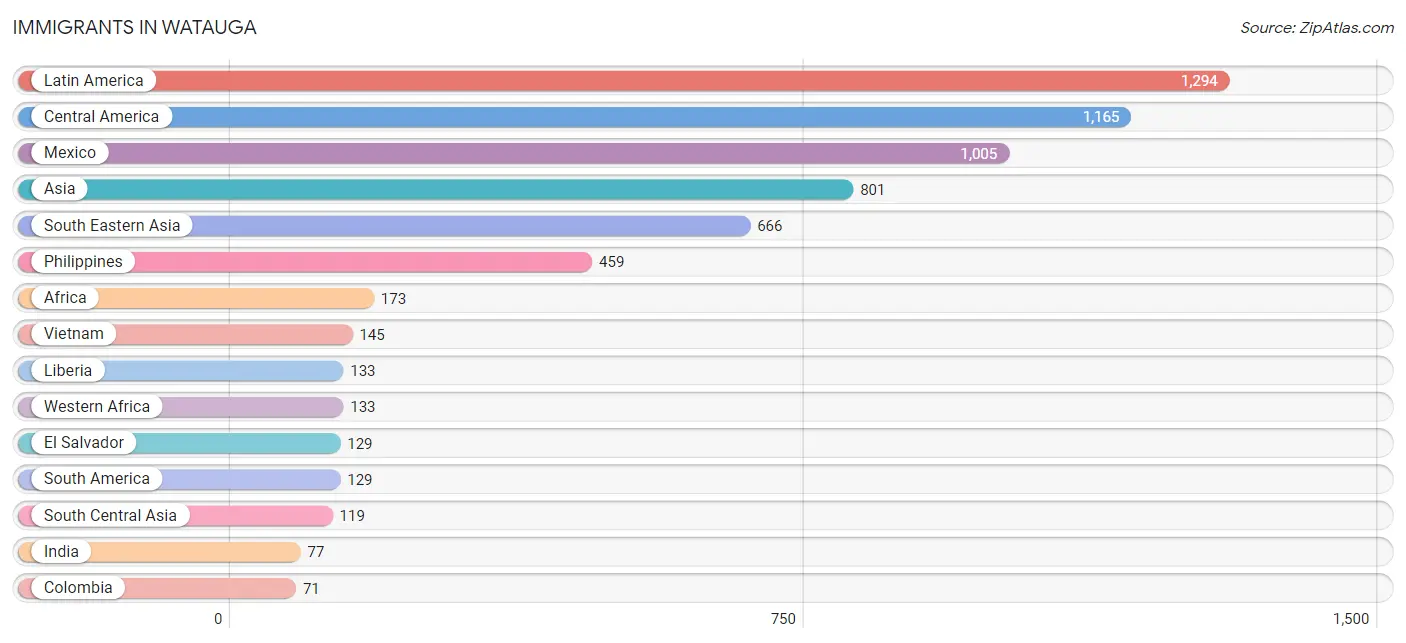
Immigrants in Watauga
The most numerous immigrant groups reported in Watauga came from Latin America (1,294 | 5.5%), Central America (1,165 | 5.0%), Mexico (1,005 | 4.3%), Asia (801 | 3.4%), and South Eastern Asia (666 | 2.8%), together accounting for 21.0% of all Watauga residents.
| Immigration Origin | # Population | % Population |
| Africa | 173 | 0.7% |
| Asia | 801 | 3.4% |
| Bolivia | 11 | 0.1% |
| Brazil | 11 | 0.1% |
| Cambodia | 10 | 0.0% |
| Canada | 22 | 0.1% |
| Central America | 1,165 | 5.0% |
| Colombia | 71 | 0.3% |
| Eastern Africa | 40 | 0.2% |
| Eastern Asia | 16 | 0.1% |
| Eastern Europe | 13 | 0.1% |
| El Salvador | 129 | 0.5% |
| Europe | 59 | 0.3% |
| Germany | 38 | 0.2% |
| Guatemala | 18 | 0.1% |
| Honduras | 13 | 0.1% |
| India | 77 | 0.3% |
| Iran | 12 | 0.1% |
| Korea | 16 | 0.1% |
| Laos | 44 | 0.2% |
| Latin America | 1,294 | 5.5% |
| Liberia | 133 | 0.6% |
| Malaysia | 8 | 0.0% |
| Mexico | 1,005 | 4.3% |
| Nepal | 22 | 0.1% |
| Northern Europe | 8 | 0.0% |
| Oceania | 7 | 0.0% |
| Pakistan | 8 | 0.0% |
| Peru | 6 | 0.0% |
| Philippines | 459 | 1.9% |
| Poland | 13 | 0.1% |
| Scotland | 8 | 0.0% |
| South America | 129 | 0.5% |
| South Central Asia | 119 | 0.5% |
| South Eastern Asia | 666 | 2.8% |
| Uganda | 13 | 0.1% |
| Venezuela | 30 | 0.1% |
| Vietnam | 145 | 0.6% |
| Western Africa | 133 | 0.6% |
| Western Europe | 38 | 0.2% | View All 40 Rows |
Sex and Age in Watauga
Sex and Age in Watauga
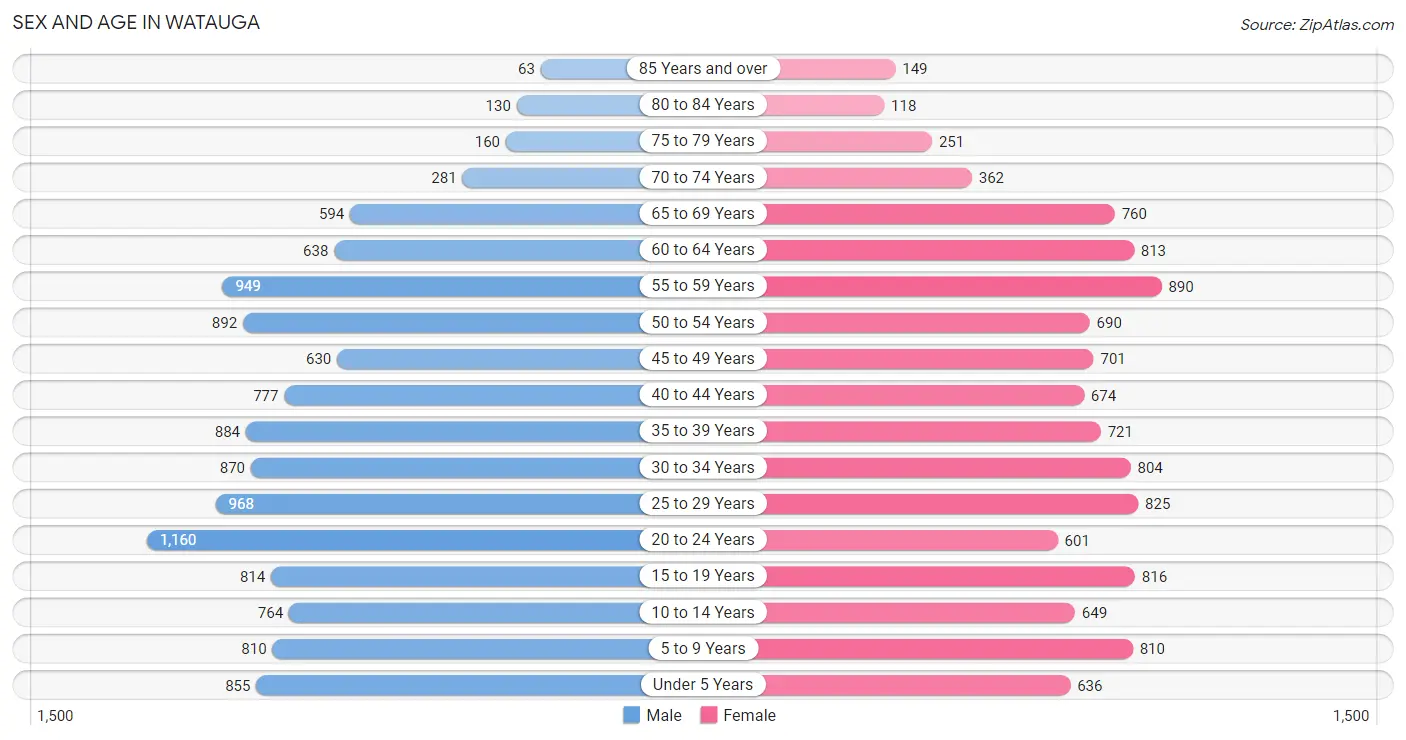
The most populous age groups in Watauga are 20 to 24 Years (1,160 | 9.5%) for men and 55 to 59 Years (890 | 7.9%) for women.
| Age Bracket | Male | Female |
| Under 5 Years | 855 (7.0%) | 636 (5.6%) |
| 5 to 9 Years | 810 (6.6%) | 810 (7.2%) |
| 10 to 14 Years | 764 (6.2%) | 649 (5.8%) |
| 15 to 19 Years | 814 (6.7%) | 816 (7.2%) |
| 20 to 24 Years | 1,160 (9.5%) | 601 (5.3%) |
| 25 to 29 Years | 968 (7.9%) | 825 (7.3%) |
| 30 to 34 Years | 870 (7.1%) | 804 (7.1%) |
| 35 to 39 Years | 884 (7.2%) | 721 (6.4%) |
| 40 to 44 Years | 777 (6.4%) | 674 (6.0%) |
| 45 to 49 Years | 630 (5.1%) | 701 (6.2%) |
| 50 to 54 Years | 892 (7.3%) | 690 (6.1%) |
| 55 to 59 Years | 949 (7.7%) | 890 (7.9%) |
| 60 to 64 Years | 638 (5.2%) | 813 (7.2%) |
| 65 to 69 Years | 594 (4.9%) | 760 (6.7%) |
| 70 to 74 Years | 281 (2.3%) | 362 (3.2%) |
| 75 to 79 Years | 160 (1.3%) | 251 (2.2%) |
| 80 to 84 Years | 130 (1.1%) | 118 (1.1%) |
| 85 Years and over | 63 (0.5%) | 149 (1.3%) |
| Total | 12,239 (100.0%) | 11,270 (100.0%) |
Families and Households in Watauga
Median Family Size in Watauga
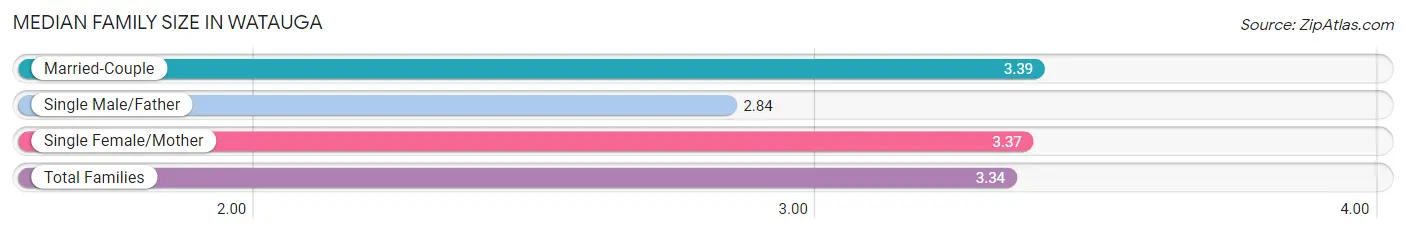
The median family size in Watauga is 3.34 persons per family, with married-couple families (4,660 | 77.7%) accounting for the largest median family size of 3.39 persons per family. On the other hand, single male/father families (542 | 9.0%) represent the smallest median family size with 2.84 persons per family.
| Family Type | # Families | Family Size |
| Married-Couple | 4,660 (77.7%) | 3.39 |
| Single Male/Father | 542 (9.0%) | 2.84 |
| Single Female/Mother | 798 (13.3%) | 3.37 |
| Total Families | 6,000 (100.0%) | 3.34 |
Median Household Size in Watauga
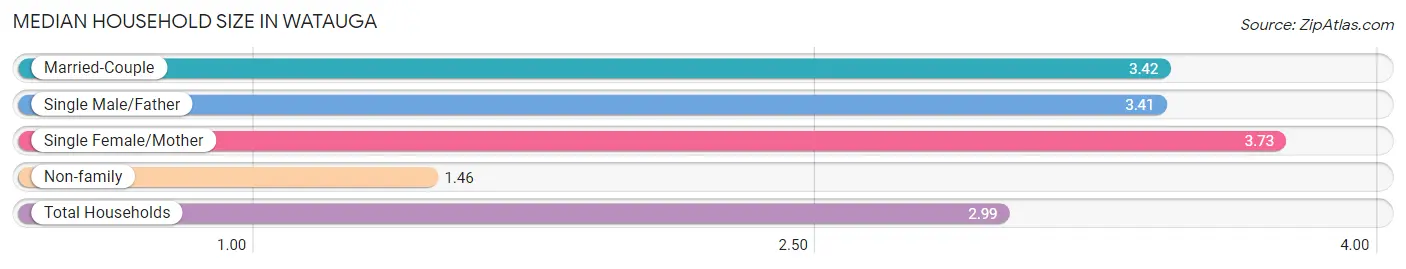
The median household size in Watauga is 2.99 persons per household, with single female/mother households (798 | 10.2%) accounting for the largest median household size of 3.73 persons per household. non-family households (1,825 | 23.3%) represent the smallest median household size with 1.46 persons per household.
| Household Type | # Households | Household Size |
| Married-Couple | 4,660 (59.6%) | 3.42 |
| Single Male/Father | 542 (6.9%) | 3.41 |
| Single Female/Mother | 798 (10.2%) | 3.73 |
| Non-family | 1,825 (23.3%) | 1.46 |
| Total Households | 7,825 (100.0%) | 2.99 |
Household Size by Marriage Status in Watauga
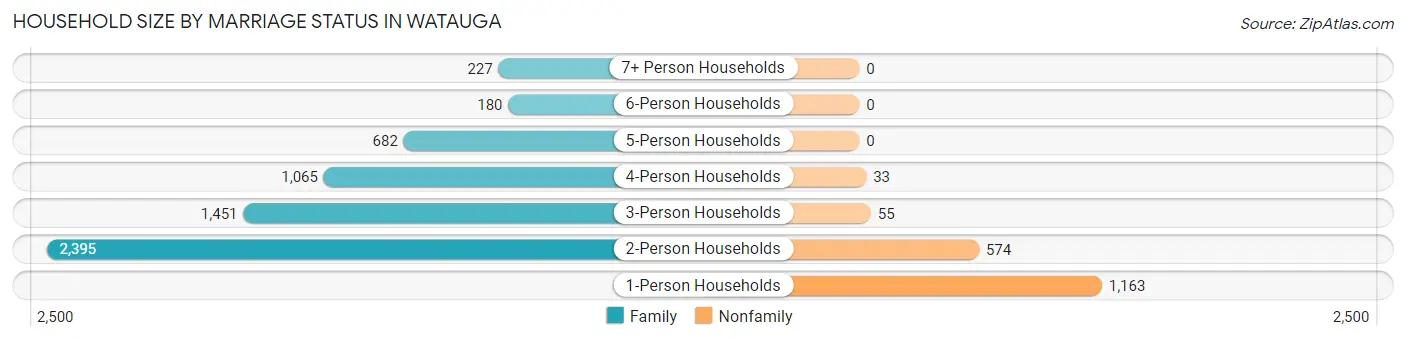
Out of a total of 7,825 households in Watauga, 6,000 (76.7%) are family households, while 1,825 (23.3%) are nonfamily households. The most numerous type of family households are 2-person households, comprising 2,395, and the most common type of nonfamily households are 1-person households, comprising 1,163.
| Household Size | Family Households | Nonfamily Households |
| 1-Person Households | - | 1,163 (14.9%) |
| 2-Person Households | 2,395 (30.6%) | 574 (7.3%) |
| 3-Person Households | 1,451 (18.5%) | 55 (0.7%) |
| 4-Person Households | 1,065 (13.6%) | 33 (0.4%) |
| 5-Person Households | 682 (8.7%) | 0 (0.0%) |
| 6-Person Households | 180 (2.3%) | 0 (0.0%) |
| 7+ Person Households | 227 (2.9%) | 0 (0.0%) |
| Total | 6,000 (76.7%) | 1,825 (23.3%) |
Female Fertility in Watauga
Fertility by Age in Watauga
Average fertility rate in Watauga is 40.0 births per 1,000 women. Women in the age bracket of 20 to 34 years have the highest fertility rate with 57.0 births per 1,000 women. Women in the age bracket of 20 to 34 years acount for 61.8% of all women with births.
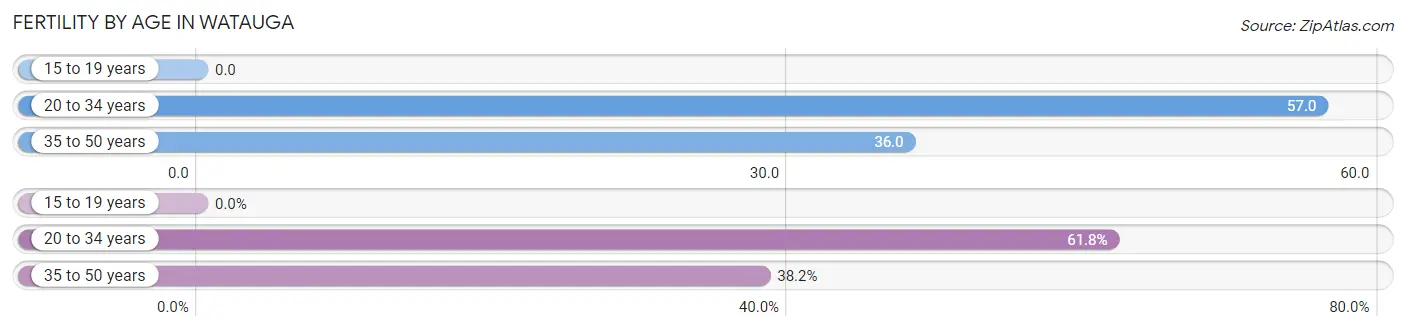
| Age Bracket | Women with Births | Births / 1,000 Women |
| 15 to 19 years | 0 (0.0%) | 0.0 |
| 20 to 34 years | 128 (61.8%) | 57.0 |
| 35 to 50 years | 79 (38.2%) | 36.0 |
| Total | 207 (100.0%) | 40.0 |
Fertility by Age by Marriage Status in Watauga
81.2% of women with births (207) in Watauga are married. The highest percentage of unmarried women with births falls into 20 to 34 years age bracket with 30.5% of them unmarried at the time of birth, while the lowest percentage of unmarried women with births belong to 35 to 50 years age bracket with 0.0% of them unmarried.
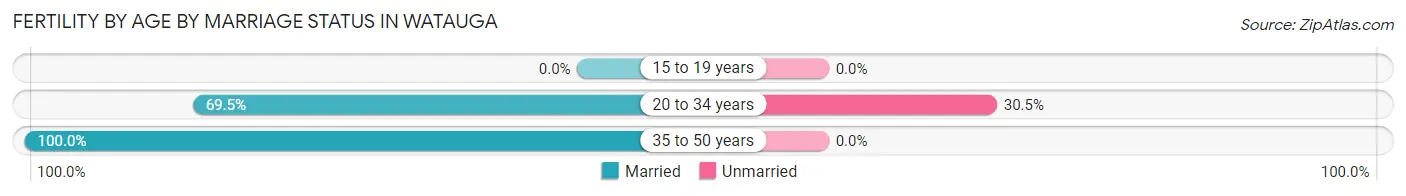
| Age Bracket | Married | Unmarried |
| 15 to 19 years | 0 (0.0%) | 0 (0.0%) |
| 20 to 34 years | 89 (69.5%) | 39 (30.5%) |
| 35 to 50 years | 79 (100.0%) | 0 (0.0%) |
| Total | 168 (81.2%) | 39 (18.8%) |
Fertility by Education in Watauga
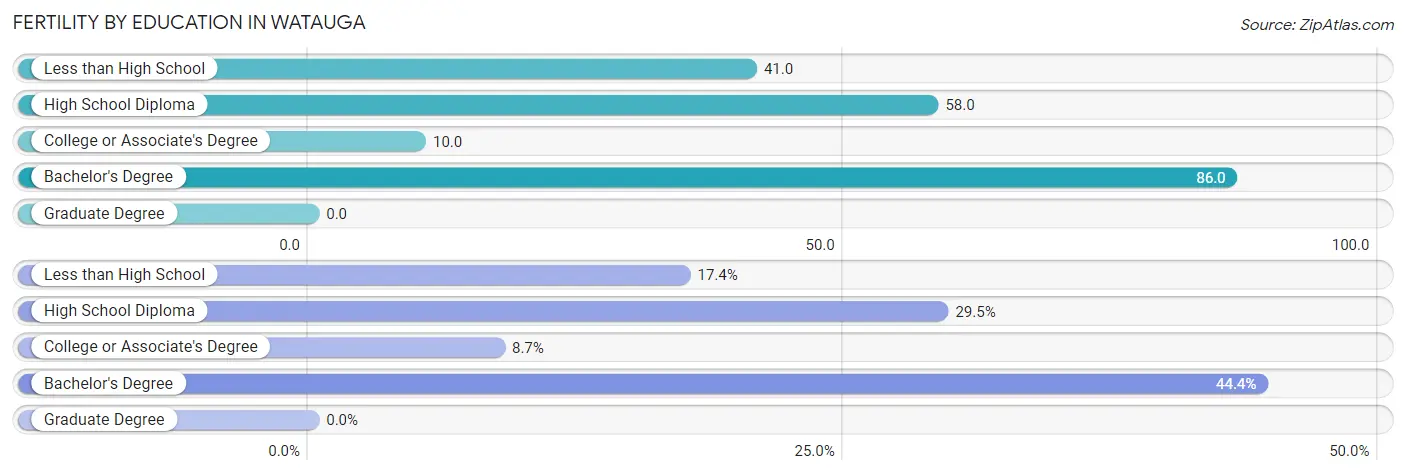
| Educational Attainment | Women with Births | Births / 1,000 Women |
| Less than High School | 36 (17.4%) | 41.0 |
| High School Diploma | 61 (29.5%) | 58.0 |
| College or Associate's Degree | 18 (8.7%) | 10.0 |
| Bachelor's Degree | 92 (44.4%) | 86.0 |
| Graduate Degree | 0 (0.0%) | 0.0 |
| Total | 207 (100.0%) | 40.0 |
Fertility by Education by Marriage Status in Watauga
18.8% of women with births in Watauga are unmarried. Women with the educational attainment of less than high school are most likely to be married with 100.0% of them married at childbirth, while women with the educational attainment of bachelor's degree are least likely to be married with 42.4% of them unmarried at childbirth.
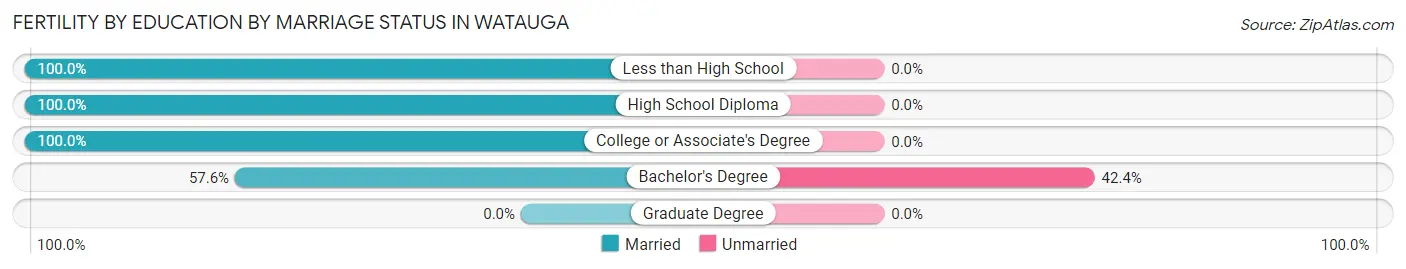
| Educational Attainment | Married | Unmarried |
| Less than High School | 36 (100.0%) | 0 (0.0%) |
| High School Diploma | 61 (100.0%) | 0 (0.0%) |
| College or Associate's Degree | 18 (100.0%) | 0 (0.0%) |
| Bachelor's Degree | 53 (57.6%) | 39 (42.4%) |
| Graduate Degree | 0 (0.0%) | 0 (0.0%) |
| Total | 168 (81.2%) | 39 (18.8%) |
Employment Characteristics in Watauga
Employment by Class of Employer in Watauga
Among the 12,745 employed individuals in Watauga, private company employees (9,543 | 74.9%), self-employed (not incorporated) (1,007 | 7.9%), and local government employees (833 | 6.5%) make up the most common classes of employment.
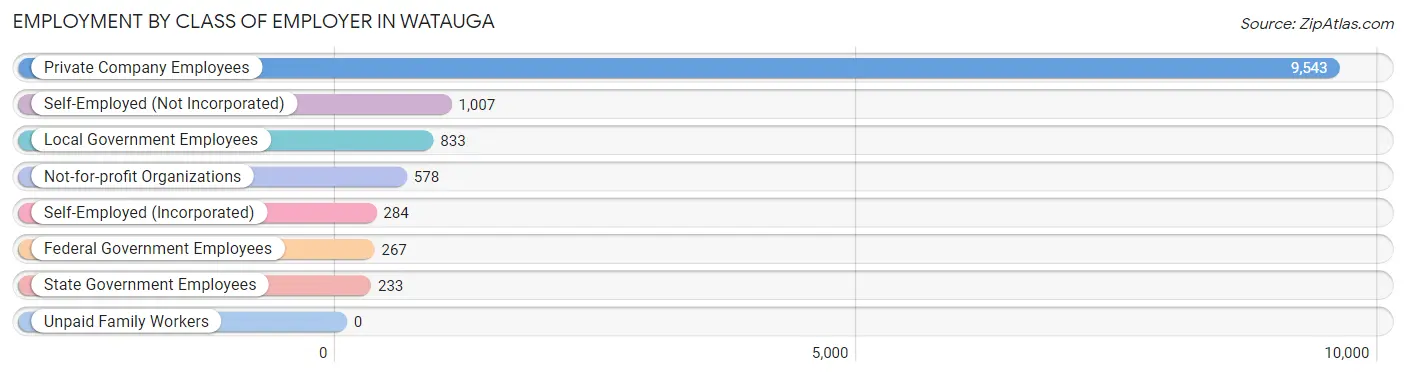
| Employer Class | # Employees | % Employees |
| Private Company Employees | 9,543 | 74.9% |
| Self-Employed (Incorporated) | 284 | 2.2% |
| Self-Employed (Not Incorporated) | 1,007 | 7.9% |
| Not-for-profit Organizations | 578 | 4.5% |
| Local Government Employees | 833 | 6.5% |
| State Government Employees | 233 | 1.8% |
| Federal Government Employees | 267 | 2.1% |
| Unpaid Family Workers | 0 | 0.0% |
| Total | 12,745 | 100.0% |
Employment Status by Age in Watauga
According to the labor force statistics for Watauga, out of the total population over 16 years of age (18,673), 72.9% or 13,613 individuals are in the labor force, with 5.2% or 708 of them unemployed. The age group with the highest labor force participation rate is 25 to 29 years, with 92.9% or 1,666 individuals in the labor force. Within the labor force, the 20 to 24 years age range has the highest percentage of unemployed individuals, with 13.9% or 223 of them being unemployed.
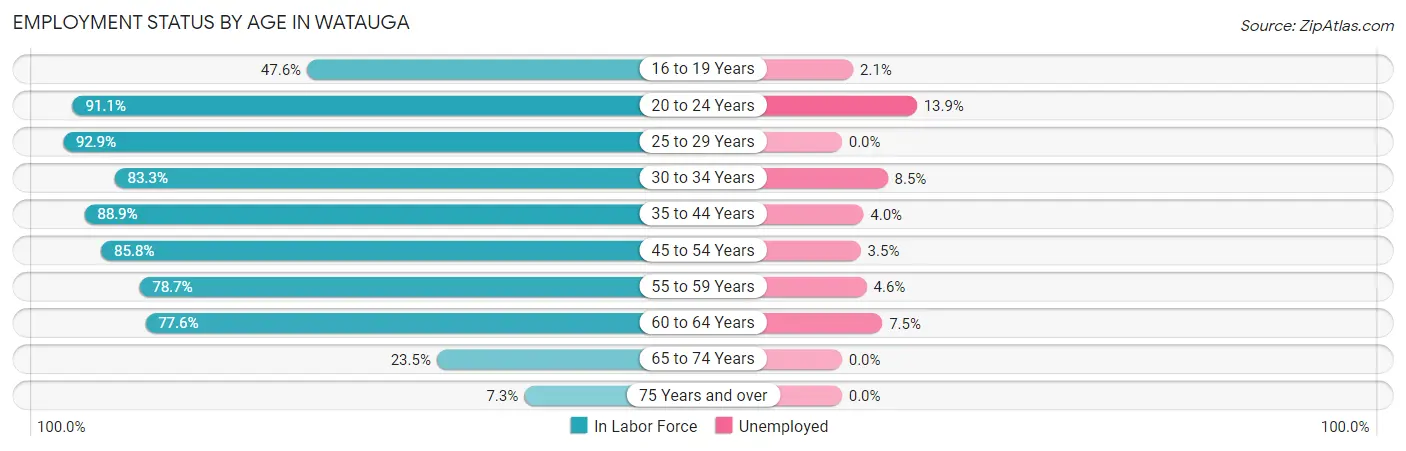
| Age Bracket | In Labor Force | Unemployed |
| 16 to 19 Years | 627 (47.6%) | 13 (2.1%) |
| 20 to 24 Years | 1,604 (91.1%) | 223 (13.9%) |
| 25 to 29 Years | 1,666 (92.9%) | 0 (0.0%) |
| 30 to 34 Years | 1,394 (83.3%) | 118 (8.5%) |
| 35 to 44 Years | 2,717 (88.9%) | 109 (4.0%) |
| 45 to 54 Years | 2,499 (85.8%) | 87 (3.5%) |
| 55 to 59 Years | 1,447 (78.7%) | 67 (4.6%) |
| 60 to 64 Years | 1,126 (77.6%) | 84 (7.5%) |
| 65 to 74 Years | 469 (23.5%) | 0 (0.0%) |
| 75 Years and over | 64 (7.3%) | 0 (0.0%) |
| Total | 13,613 (72.9%) | 708 (5.2%) |
Employment Status by Educational Attainment in Watauga
According to labor force statistics for Watauga, 85.3% of individuals (10,855) out of the total population between 25 and 64 years of age (12,726) are in the labor force, with 4.3% or 467 of them being unemployed. The group with the highest labor force participation rate are those with the educational attainment of bachelor's degree or higher, with 90.4% or 3,025 individuals in the labor force. Within the labor force, individuals with bachelor's degree or higher education have the highest percentage of unemployment, with 8.4% or 254 of them being unemployed.
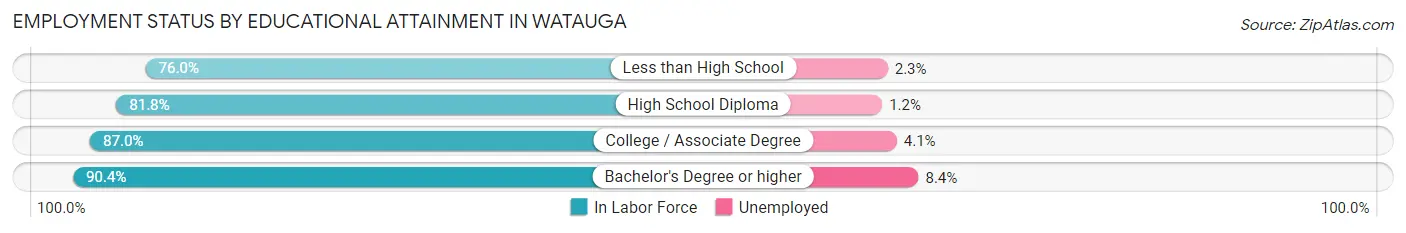
| Educational Attainment | In Labor Force | Unemployed |
| Less than High School | 939 (76.0%) | 28 (2.3%) |
| High School Diploma | 3,107 (81.8%) | 46 (1.2%) |
| College / Associate Degree | 3,781 (87.0%) | 178 (4.1%) |
| Bachelor's Degree or higher | 3,025 (90.4%) | 281 (8.4%) |
| Total | 10,855 (85.3%) | 547 (4.3%) |
Employment Occupations by Sex in Watauga
Management, Business, Science and Arts Occupations
The most common Management, Business, Science and Arts occupations in Watauga are Management (1,214 | 9.4%), Community & Social Service (1,131 | 8.8%), Business & Financial (1,001 | 7.8%), Education Instruction & Library (847 | 6.6%), and Computers, Engineering & Science (719 | 5.6%).
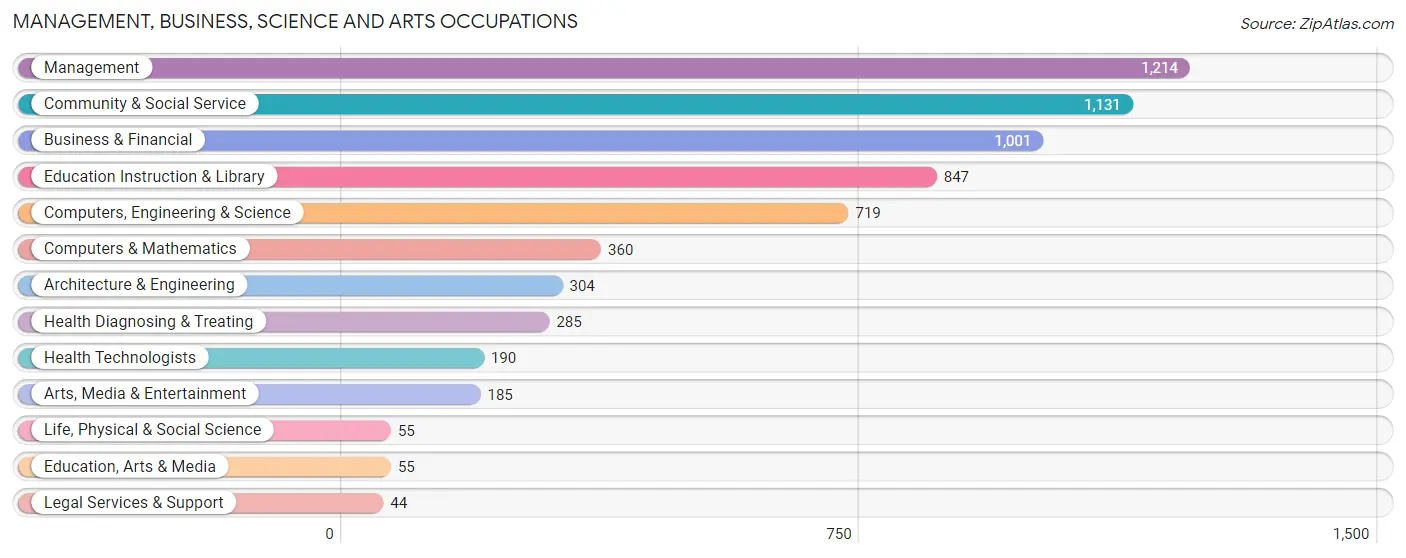
Management, Business, Science and Arts Occupations by Sex
Within the Management, Business, Science and Arts occupations in Watauga, the most male-oriented occupations are Life, Physical & Social Science (100.0%), Architecture & Engineering (81.6%), and Computers, Engineering & Science (78.6%), while the most female-oriented occupations are Legal Services & Support (100.0%), Education, Arts & Media (83.6%), and Education Instruction & Library (80.4%).
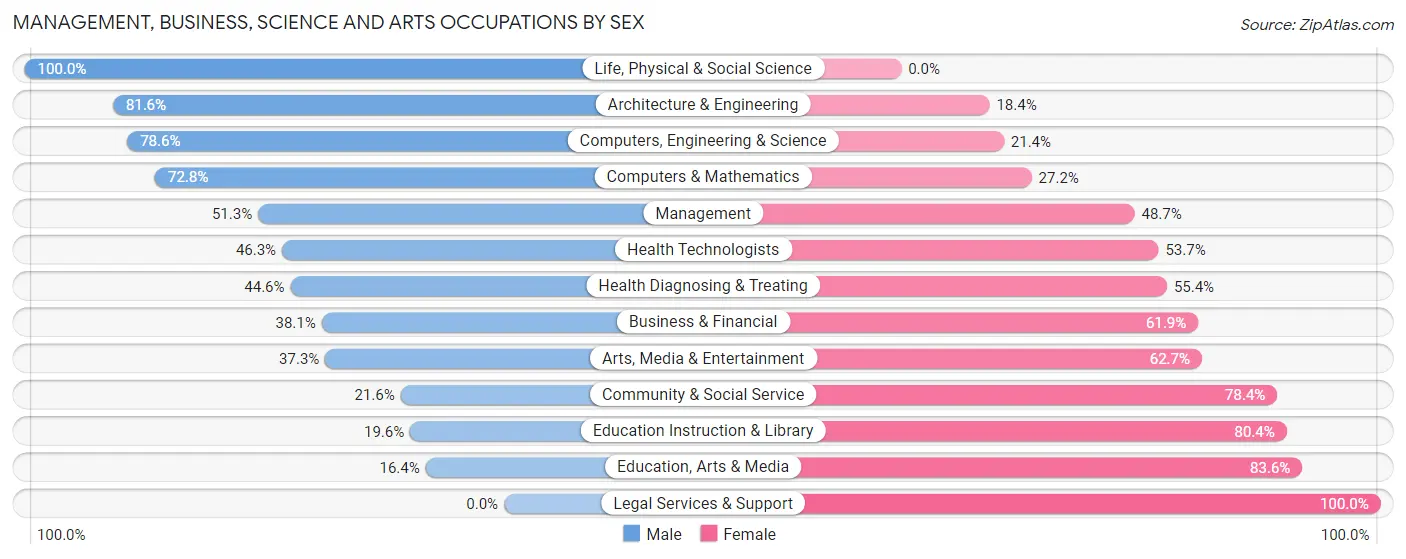
| Occupation | Male | Female |
| Management | 623 (51.3%) | 591 (48.7%) |
| Business & Financial | 381 (38.1%) | 620 (61.9%) |
| Computers, Engineering & Science | 565 (78.6%) | 154 (21.4%) |
| Computers & Mathematics | 262 (72.8%) | 98 (27.2%) |
| Architecture & Engineering | 248 (81.6%) | 56 (18.4%) |
| Life, Physical & Social Science | 55 (100.0%) | 0 (0.0%) |
| Community & Social Service | 244 (21.6%) | 887 (78.4%) |
| Education, Arts & Media | 9 (16.4%) | 46 (83.6%) |
| Legal Services & Support | 0 (0.0%) | 44 (100.0%) |
| Education Instruction & Library | 166 (19.6%) | 681 (80.4%) |
| Arts, Media & Entertainment | 69 (37.3%) | 116 (62.7%) |
| Health Diagnosing & Treating | 127 (44.6%) | 158 (55.4%) |
| Health Technologists | 88 (46.3%) | 102 (53.7%) |
| Total (Category) | 1,940 (44.6%) | 2,410 (55.4%) |
| Total (Overall) | 7,561 (58.6%) | 5,338 (41.4%) |
Services Occupations
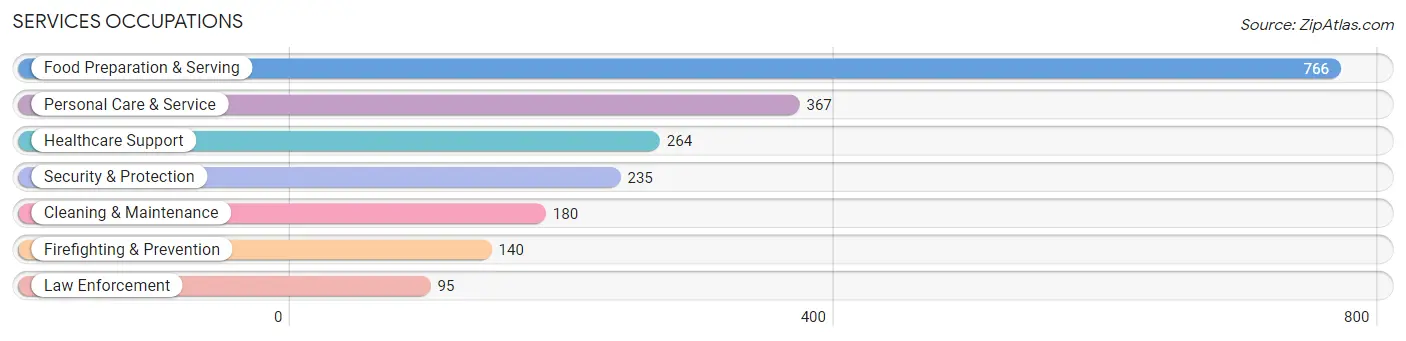
The most common Services occupations in Watauga are Food Preparation & Serving (766 | 5.9%), Personal Care & Service (367 | 2.9%), Healthcare Support (264 | 2.1%), Security & Protection (235 | 1.8%), and Cleaning & Maintenance (180 | 1.4%).
Services Occupations by Sex
Within the Services occupations in Watauga, the most male-oriented occupations are Law Enforcement (100.0%), Food Preparation & Serving (73.2%), and Security & Protection (66.4%), while the most female-oriented occupations are Healthcare Support (85.2%), Cleaning & Maintenance (61.7%), and Firefighting & Prevention (56.4%).
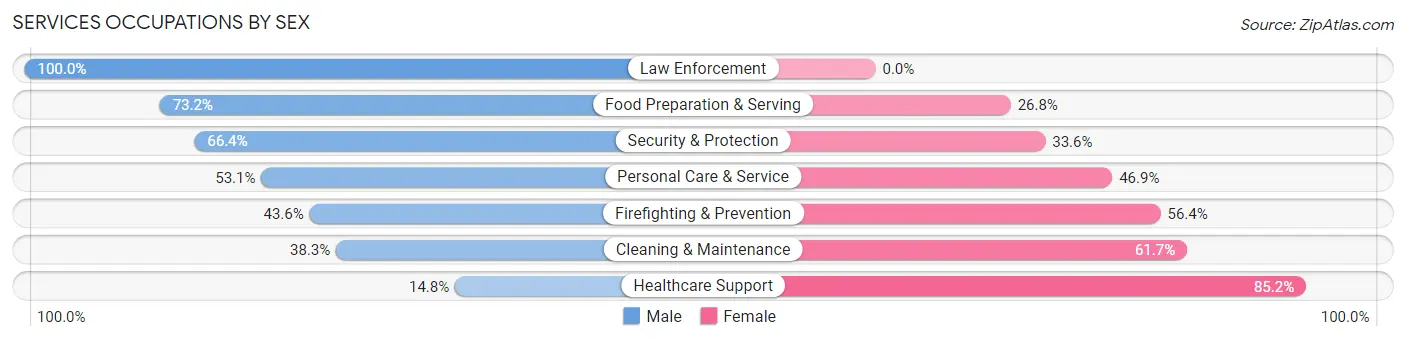
| Occupation | Male | Female |
| Healthcare Support | 39 (14.8%) | 225 (85.2%) |
| Security & Protection | 156 (66.4%) | 79 (33.6%) |
| Firefighting & Prevention | 61 (43.6%) | 79 (56.4%) |
| Law Enforcement | 95 (100.0%) | 0 (0.0%) |
| Food Preparation & Serving | 561 (73.2%) | 205 (26.8%) |
| Cleaning & Maintenance | 69 (38.3%) | 111 (61.7%) |
| Personal Care & Service | 195 (53.1%) | 172 (46.9%) |
| Total (Category) | 1,020 (56.3%) | 792 (43.7%) |
| Total (Overall) | 7,561 (58.6%) | 5,338 (41.4%) |
Sales and Office Occupations
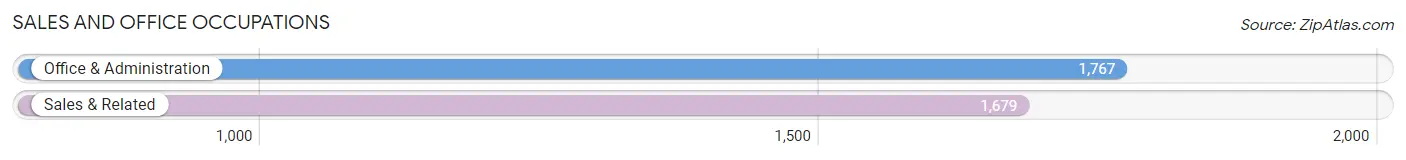
The most common Sales and Office occupations in Watauga are Office & Administration (1,767 | 13.7%), and Sales & Related (1,679 | 13.0%).
Sales and Office Occupations by Sex
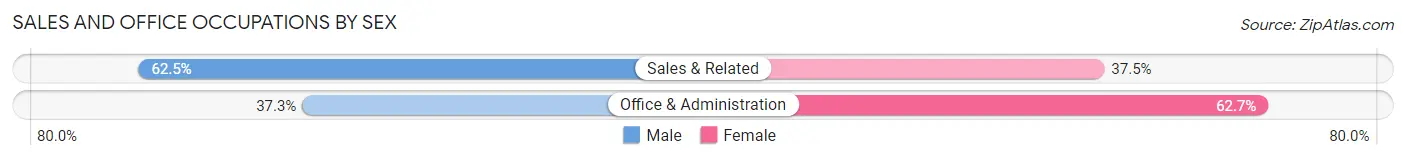
| Occupation | Male | Female |
| Sales & Related | 1,049 (62.5%) | 630 (37.5%) |
| Office & Administration | 659 (37.3%) | 1,108 (62.7%) |
| Total (Category) | 1,708 (49.6%) | 1,738 (50.4%) |
| Total (Overall) | 7,561 (58.6%) | 5,338 (41.4%) |
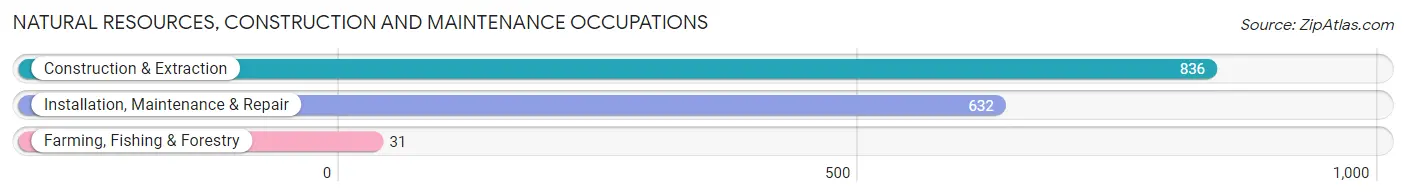
Natural Resources, Construction and Maintenance Occupations
The most common Natural Resources, Construction and Maintenance occupations in Watauga are Construction & Extraction (836 | 6.5%), Installation, Maintenance & Repair (632 | 4.9%), and Farming, Fishing & Forestry (31 | 0.2%).
Natural Resources, Construction and Maintenance Occupations by Sex
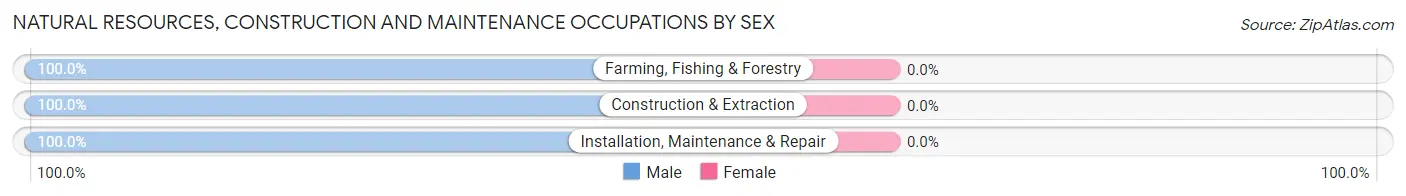
| Occupation | Male | Female |
| Farming, Fishing & Forestry | 31 (100.0%) | 0 (0.0%) |
| Construction & Extraction | 836 (100.0%) | 0 (0.0%) |
| Installation, Maintenance & Repair | 632 (100.0%) | 0 (0.0%) |
| Total (Category) | 1,499 (100.0%) | 0 (0.0%) |
| Total (Overall) | 7,561 (58.6%) | 5,338 (41.4%) |
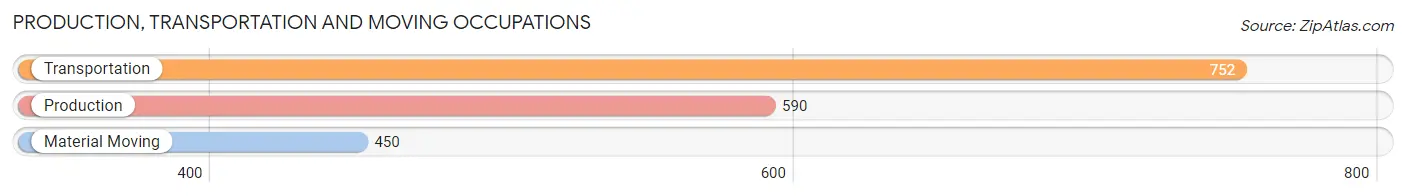
Production, Transportation and Moving Occupations
The most common Production, Transportation and Moving occupations in Watauga are Transportation (752 | 5.8%), Production (590 | 4.6%), and Material Moving (450 | 3.5%).
Production, Transportation and Moving Occupations by Sex
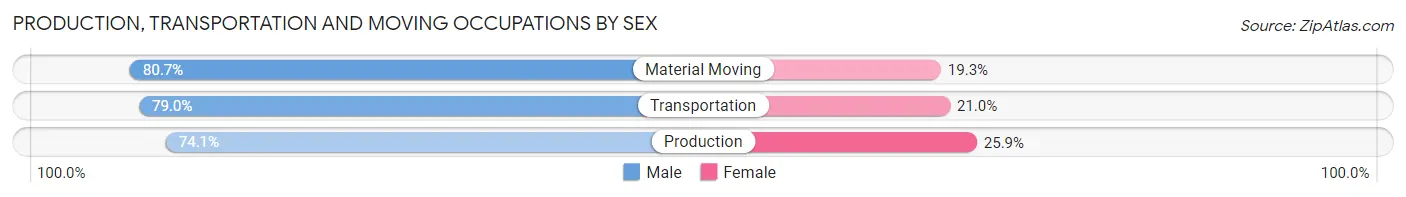
| Occupation | Male | Female |
| Production | 437 (74.1%) | 153 (25.9%) |
| Transportation | 594 (79.0%) | 158 (21.0%) |
| Material Moving | 363 (80.7%) | 87 (19.3%) |
| Total (Category) | 1,394 (77.8%) | 398 (22.2%) |
| Total (Overall) | 7,561 (58.6%) | 5,338 (41.4%) |
Employment Industries by Sex in Watauga
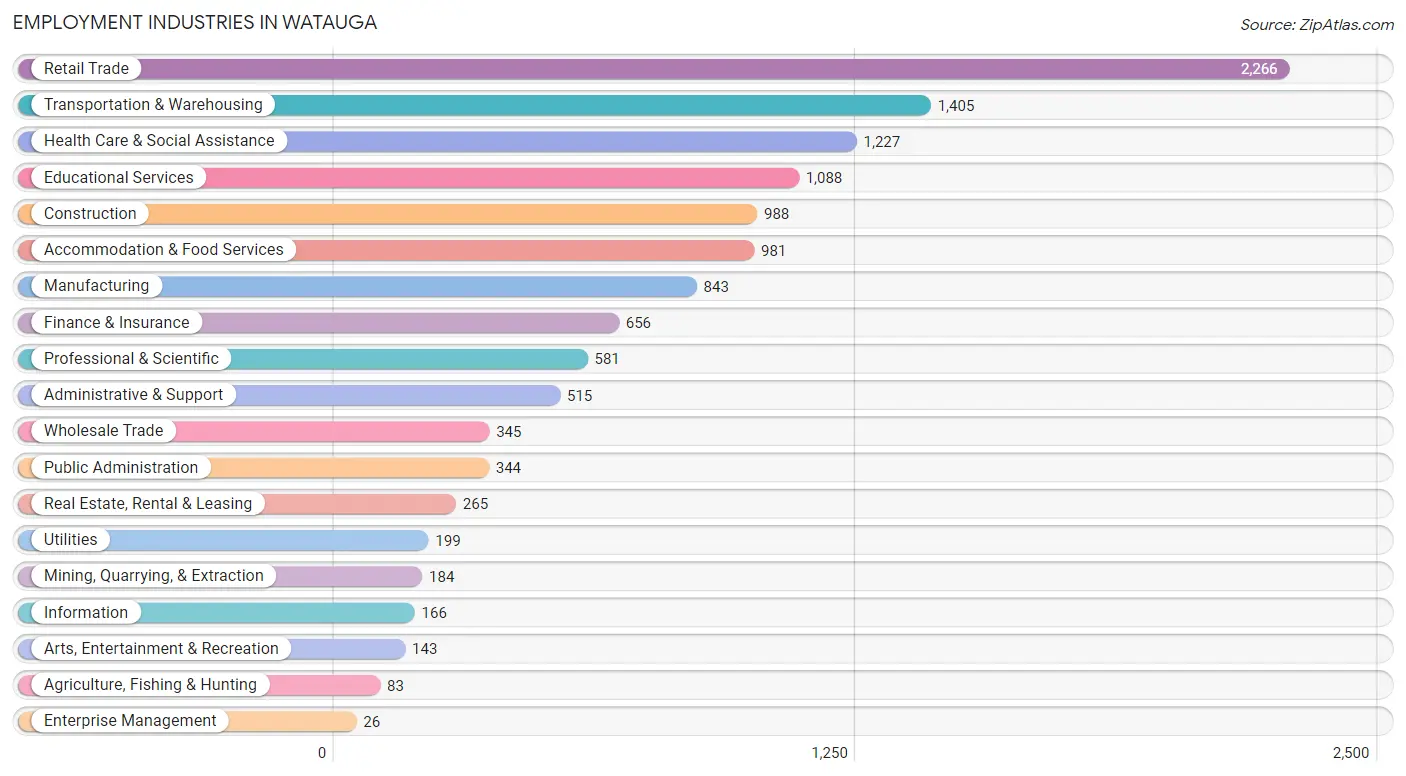
Employment Industries in Watauga
The major employment industries in Watauga include Retail Trade (2,266 | 17.6%), Transportation & Warehousing (1,405 | 10.9%), Health Care & Social Assistance (1,227 | 9.5%), Educational Services (1,088 | 8.4%), and Construction (988 | 7.7%).
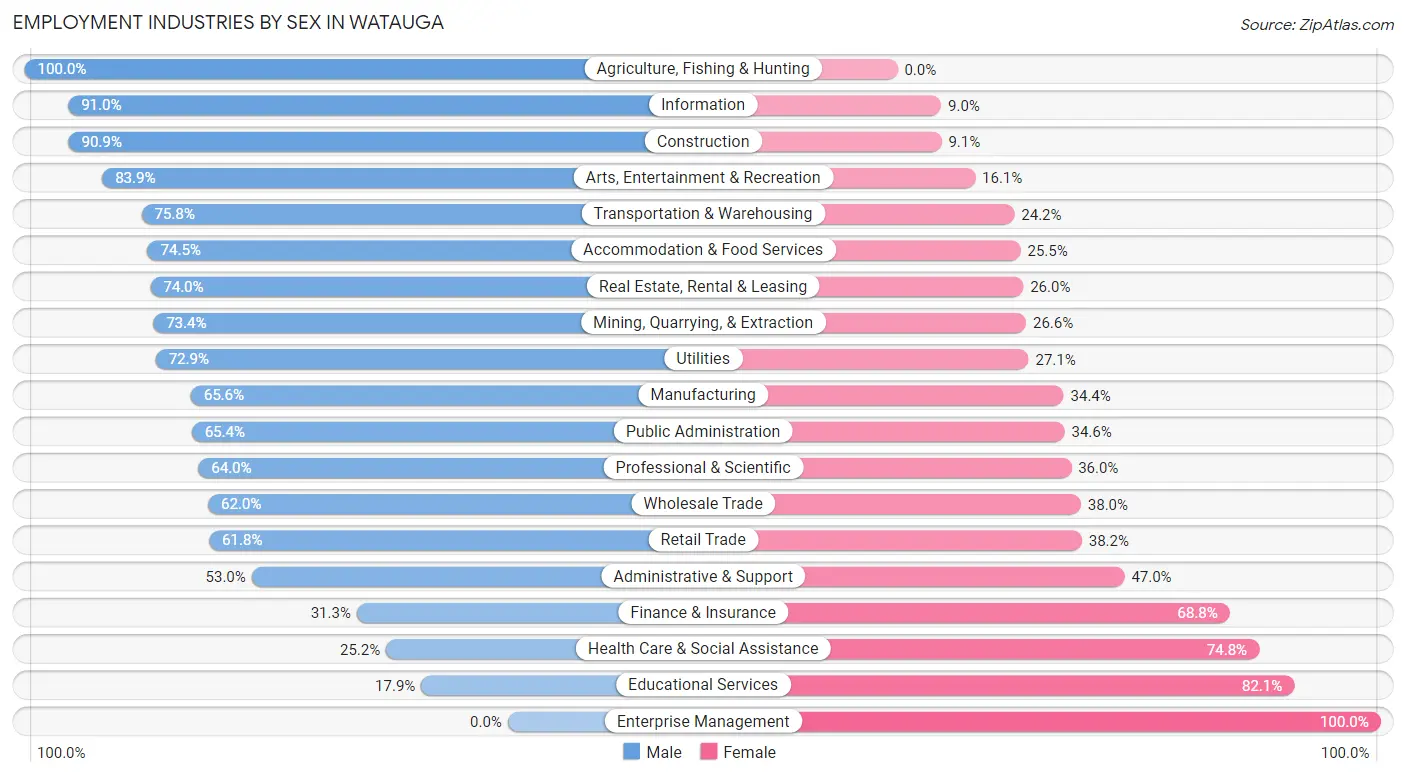
Employment Industries by Sex in Watauga
The Watauga industries that see more men than women are Agriculture, Fishing & Hunting (100.0%), Information (91.0%), and Construction (90.9%), whereas the industries that tend to have a higher number of women are Enterprise Management (100.0%), Educational Services (82.1%), and Health Care & Social Assistance (74.8%).
| Industry | Male | Female |
| Agriculture, Fishing & Hunting | 83 (100.0%) | 0 (0.0%) |
| Mining, Quarrying, & Extraction | 135 (73.4%) | 49 (26.6%) |
| Construction | 898 (90.9%) | 90 (9.1%) |
| Manufacturing | 553 (65.6%) | 290 (34.4%) |
| Wholesale Trade | 214 (62.0%) | 131 (38.0%) |
| Retail Trade | 1,401 (61.8%) | 865 (38.2%) |
| Transportation & Warehousing | 1,065 (75.8%) | 340 (24.2%) |
| Utilities | 145 (72.9%) | 54 (27.1%) |
| Information | 151 (91.0%) | 15 (9.0%) |
| Finance & Insurance | 205 (31.2%) | 451 (68.8%) |
| Real Estate, Rental & Leasing | 196 (74.0%) | 69 (26.0%) |
| Professional & Scientific | 372 (64.0%) | 209 (36.0%) |
| Enterprise Management | 0 (0.0%) | 26 (100.0%) |
| Administrative & Support | 273 (53.0%) | 242 (47.0%) |
| Educational Services | 195 (17.9%) | 893 (82.1%) |
| Health Care & Social Assistance | 309 (25.2%) | 918 (74.8%) |
| Arts, Entertainment & Recreation | 120 (83.9%) | 23 (16.1%) |
| Accommodation & Food Services | 731 (74.5%) | 250 (25.5%) |
| Public Administration | 225 (65.4%) | 119 (34.6%) |
| Total | 7,561 (58.6%) | 5,338 (41.4%) |
Education in Watauga
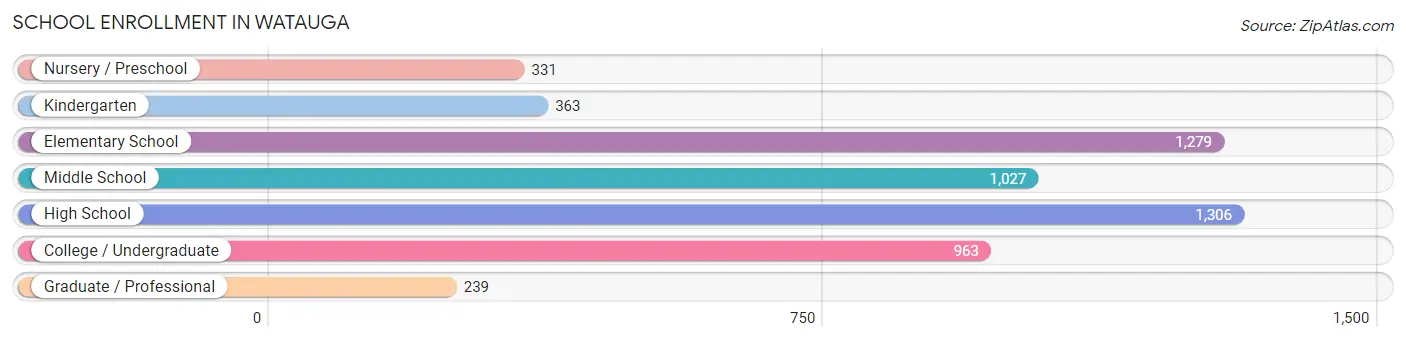
School Enrollment in Watauga
The most common levels of schooling among the 5,508 students in Watauga are high school (1,306 | 23.7%), elementary school (1,279 | 23.2%), and middle school (1,027 | 18.6%).
| School Level | # Students | % Students |
| Nursery / Preschool | 331 | 6.0% |
| Kindergarten | 363 | 6.6% |
| Elementary School | 1,279 | 23.2% |
| Middle School | 1,027 | 18.6% |
| High School | 1,306 | 23.7% |
| College / Undergraduate | 963 | 17.5% |
| Graduate / Professional | 239 | 4.3% |
| Total | 5,508 | 100.0% |
School Enrollment by Age by Funding Source in Watauga
Out of a total of 5,508 students who are enrolled in schools in Watauga, 688 (12.5%) attend a private institution, while the remaining 4,820 (87.5%) are enrolled in public schools. The age group of 3 to 4 year olds has the highest likelihood of being enrolled in private schools, with 92 (39.2% in the age bracket) enrolled. Conversely, the age group of 5 to 9 year old has the lowest likelihood of being enrolled in a private school, with 1,481 (93.7% in the age bracket) attending a public institution.
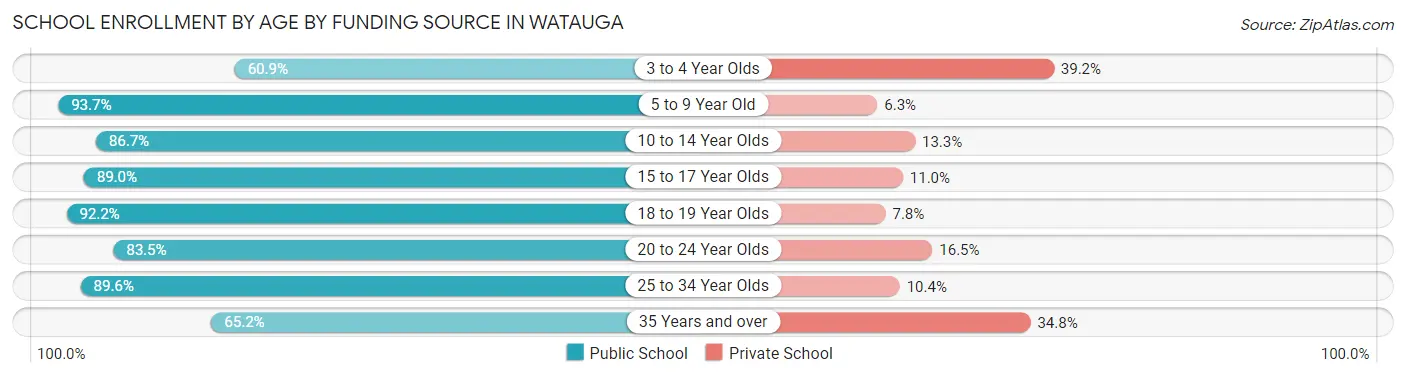
| Age Bracket | Public School | Private School |
| 3 to 4 Year Olds | 143 (60.9%) | 92 (39.2%) |
| 5 to 9 Year Old | 1,481 (93.7%) | 99 (6.3%) |
| 10 to 14 Year Olds | 1,148 (86.7%) | 176 (13.3%) |
| 15 to 17 Year Olds | 879 (89.0%) | 109 (11.0%) |
| 18 to 19 Year Olds | 331 (92.2%) | 28 (7.8%) |
| 20 to 24 Year Olds | 379 (83.5%) | 75 (16.5%) |
| 25 to 34 Year Olds | 326 (89.6%) | 38 (10.4%) |
| 35 Years and over | 133 (65.2%) | 71 (34.8%) |
| Total | 4,820 (87.5%) | 688 (12.5%) |
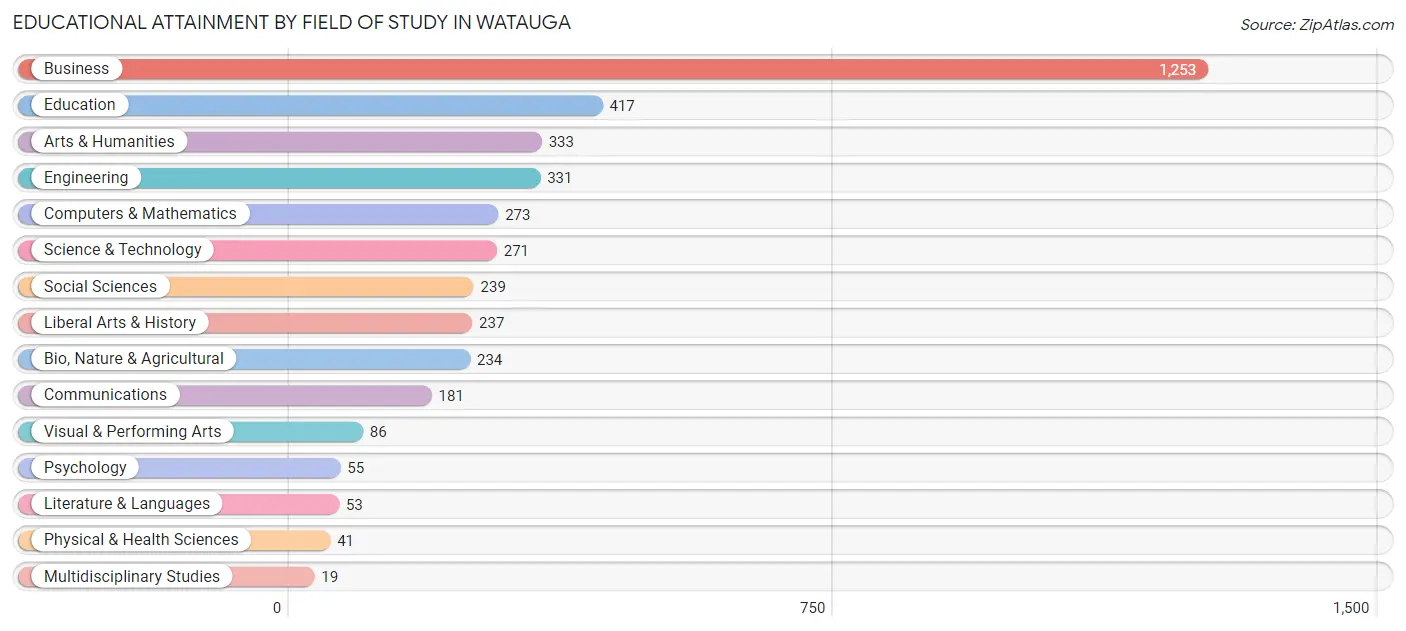
Educational Attainment by Field of Study in Watauga
Business (1,253 | 31.1%), education (417 | 10.4%), arts & humanities (333 | 8.3%), engineering (331 | 8.2%), and computers & mathematics (273 | 6.8%) are the most common fields of study among 4,023 individuals in Watauga who have obtained a bachelor's degree or higher.
| Field of Study | # Graduates | % Graduates |
| Computers & Mathematics | 273 | 6.8% |
| Bio, Nature & Agricultural | 234 | 5.8% |
| Physical & Health Sciences | 41 | 1.0% |
| Psychology | 55 | 1.4% |
| Social Sciences | 239 | 5.9% |
| Engineering | 331 | 8.2% |
| Multidisciplinary Studies | 19 | 0.5% |
| Science & Technology | 271 | 6.7% |
| Business | 1,253 | 31.1% |
| Education | 417 | 10.4% |
| Literature & Languages | 53 | 1.3% |
| Liberal Arts & History | 237 | 5.9% |
| Visual & Performing Arts | 86 | 2.1% |
| Communications | 181 | 4.5% |
| Arts & Humanities | 333 | 8.3% |
| Total | 4,023 | 100.0% |
Transportation & Commute in Watauga
Vehicle Availability by Sex in Watauga
The most prevalent vehicle ownership categories in Watauga are males with 2 vehicles (3,721, accounting for 49.7%) and females with 2 vehicles (2,471, making up 70.8%).
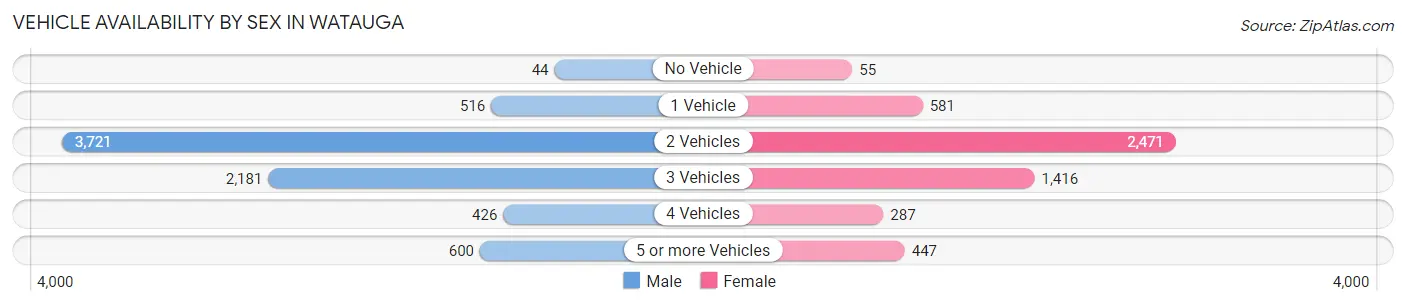
| Vehicles Available | Male | Female |
| No Vehicle | 44 (0.6%) | 55 (1.1%) |
| 1 Vehicle | 516 (6.9%) | 581 (11.1%) |
| 2 Vehicles | 3,721 (49.7%) | 2,471 (47.0%) |
| 3 Vehicles | 2,181 (29.1%) | 1,416 (26.9%) |
| 4 Vehicles | 426 (5.7%) | 287 (5.5%) |
| 5 or more Vehicles | 600 (8.0%) | 447 (8.5%) |
| Total | 7,488 (100.0%) | 5,257 (100.0%) |
Commute Time in Watauga
The most frequently occuring commute durations in Watauga are 30 to 34 minutes (2,105 commuters, 18.7%), 15 to 19 minutes (1,819 commuters, 16.1%), and 20 to 24 minutes (1,783 commuters, 15.8%).
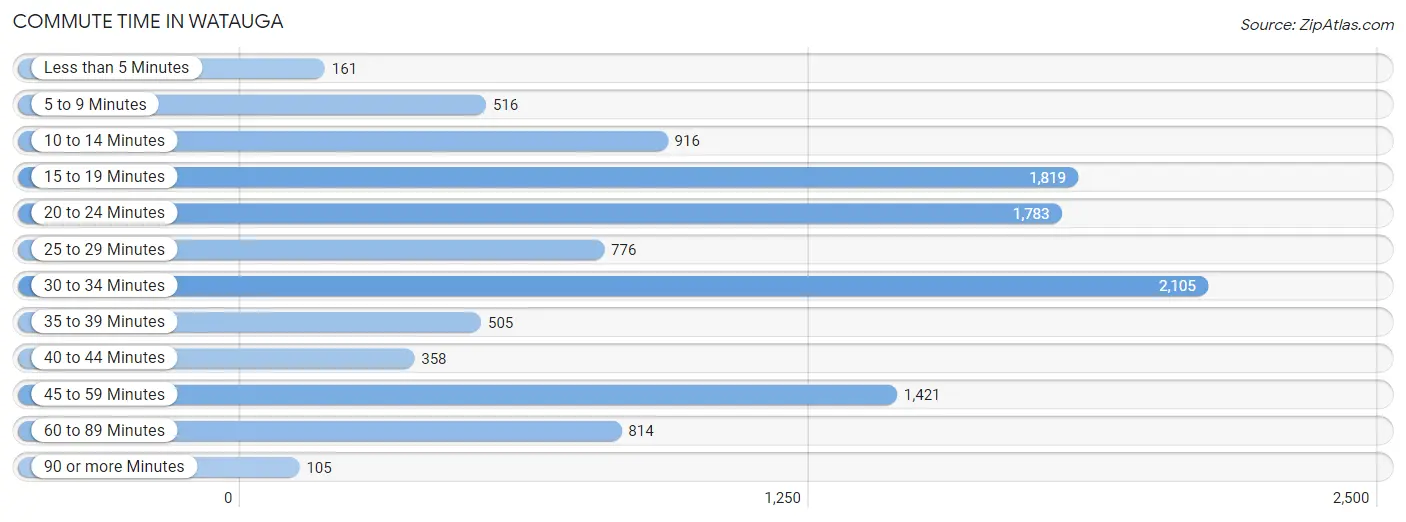
| Commute Time | # Commuters | % Commuters |
| Less than 5 Minutes | 161 | 1.4% |
| 5 to 9 Minutes | 516 | 4.6% |
| 10 to 14 Minutes | 916 | 8.1% |
| 15 to 19 Minutes | 1,819 | 16.1% |
| 20 to 24 Minutes | 1,783 | 15.8% |
| 25 to 29 Minutes | 776 | 6.9% |
| 30 to 34 Minutes | 2,105 | 18.7% |
| 35 to 39 Minutes | 505 | 4.5% |
| 40 to 44 Minutes | 358 | 3.2% |
| 45 to 59 Minutes | 1,421 | 12.6% |
| 60 to 89 Minutes | 814 | 7.2% |
| 90 or more Minutes | 105 | 0.9% |
Commute Time by Sex in Watauga
The most common commute times in Watauga are 30 to 34 minutes (1,299 commuters, 19.2%) for males and 15 to 19 minutes (840 commuters, 18.6%) for females.
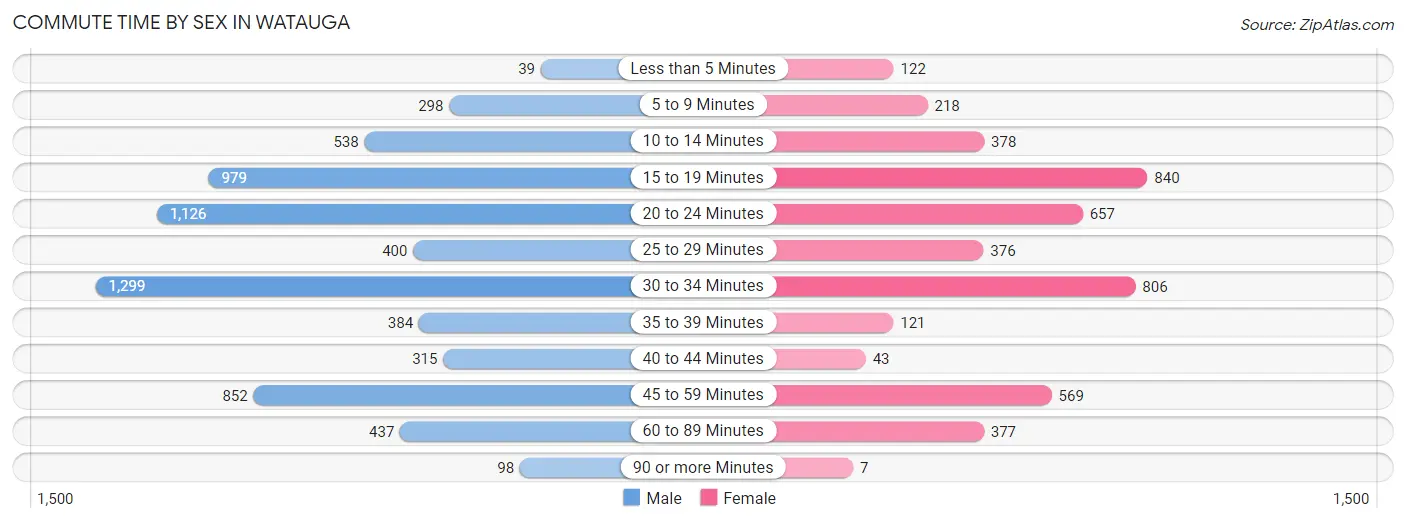
| Commute Time | Male | Female |
| Less than 5 Minutes | 39 (0.6%) | 122 (2.7%) |
| 5 to 9 Minutes | 298 (4.4%) | 218 (4.8%) |
| 10 to 14 Minutes | 538 (8.0%) | 378 (8.4%) |
| 15 to 19 Minutes | 979 (14.5%) | 840 (18.6%) |
| 20 to 24 Minutes | 1,126 (16.6%) | 657 (14.5%) |
| 25 to 29 Minutes | 400 (5.9%) | 376 (8.3%) |
| 30 to 34 Minutes | 1,299 (19.2%) | 806 (17.9%) |
| 35 to 39 Minutes | 384 (5.7%) | 121 (2.7%) |
| 40 to 44 Minutes | 315 (4.7%) | 43 (0.9%) |
| 45 to 59 Minutes | 852 (12.6%) | 569 (12.6%) |
| 60 to 89 Minutes | 437 (6.5%) | 377 (8.4%) |
| 90 or more Minutes | 98 (1.5%) | 7 (0.2%) |
Time of Departure to Work by Sex in Watauga
The most frequent times of departure to work in Watauga are 7:00 AM to 7:29 AM (1,087, 16.1%) for males and 7:00 AM to 7:29 AM (802, 17.8%) for females.
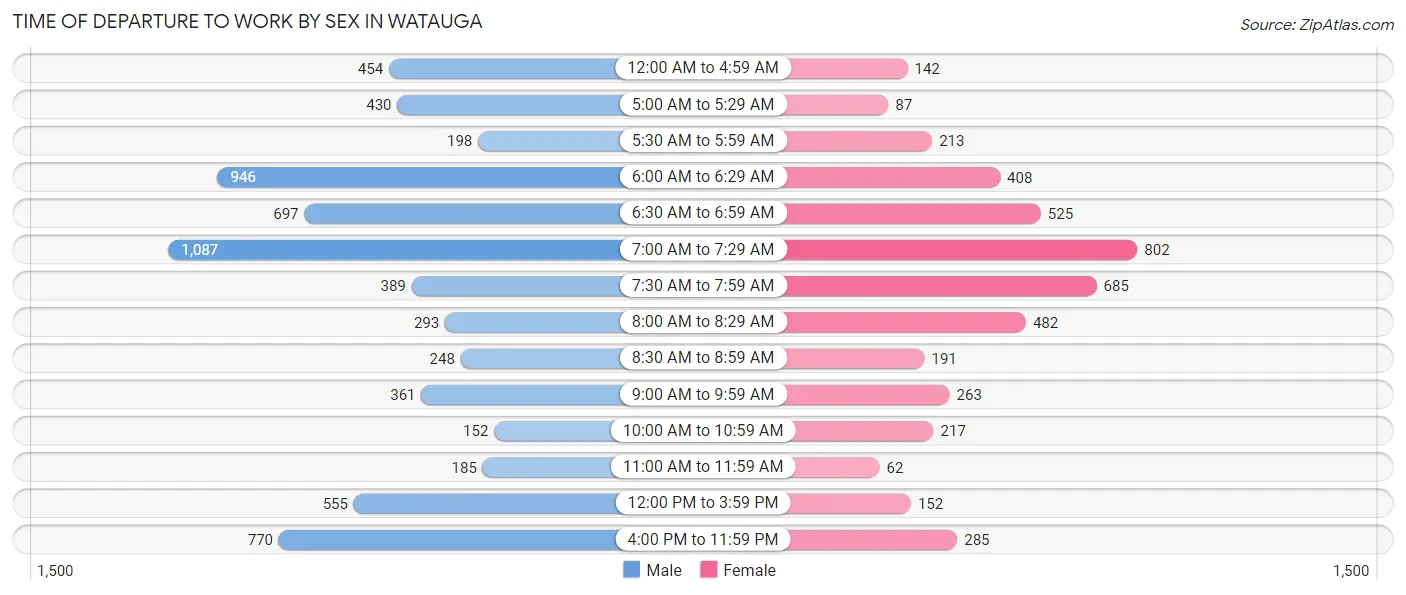
| Time of Departure | Male | Female |
| 12:00 AM to 4:59 AM | 454 (6.7%) | 142 (3.2%) |
| 5:00 AM to 5:29 AM | 430 (6.4%) | 87 (1.9%) |
| 5:30 AM to 5:59 AM | 198 (2.9%) | 213 (4.7%) |
| 6:00 AM to 6:29 AM | 946 (14.0%) | 408 (9.0%) |
| 6:30 AM to 6:59 AM | 697 (10.3%) | 525 (11.6%) |
| 7:00 AM to 7:29 AM | 1,087 (16.1%) | 802 (17.8%) |
| 7:30 AM to 7:59 AM | 389 (5.8%) | 685 (15.2%) |
| 8:00 AM to 8:29 AM | 293 (4.3%) | 482 (10.7%) |
| 8:30 AM to 8:59 AM | 248 (3.7%) | 191 (4.2%) |
| 9:00 AM to 9:59 AM | 361 (5.3%) | 263 (5.8%) |
| 10:00 AM to 10:59 AM | 152 (2.2%) | 217 (4.8%) |
| 11:00 AM to 11:59 AM | 185 (2.7%) | 62 (1.4%) |
| 12:00 PM to 3:59 PM | 555 (8.2%) | 152 (3.4%) |
| 4:00 PM to 11:59 PM | 770 (11.4%) | 285 (6.3%) |
| Total | 6,765 (100.0%) | 4,514 (100.0%) |
Housing Occupancy in Watauga
Occupancy by Ownership in Watauga
Of the total 7,825 dwellings in Watauga, owner-occupied units account for 6,037 (77.1%), while renter-occupied units make up 1,788 (22.9%).
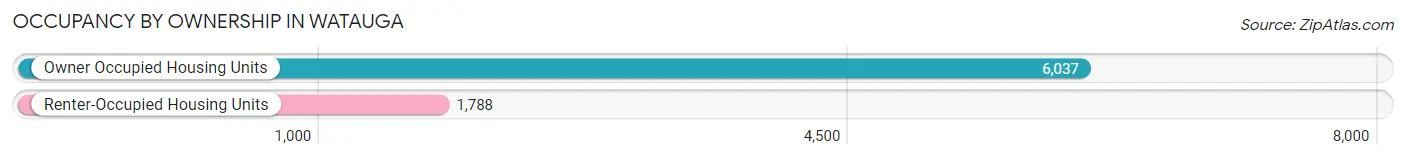
| Occupancy | # Housing Units | % Housing Units |
| Owner Occupied Housing Units | 6,037 | 77.1% |
| Renter-Occupied Housing Units | 1,788 | 22.9% |
| Total Occupied Housing Units | 7,825 | 100.0% |
Occupancy by Household Size in Watauga
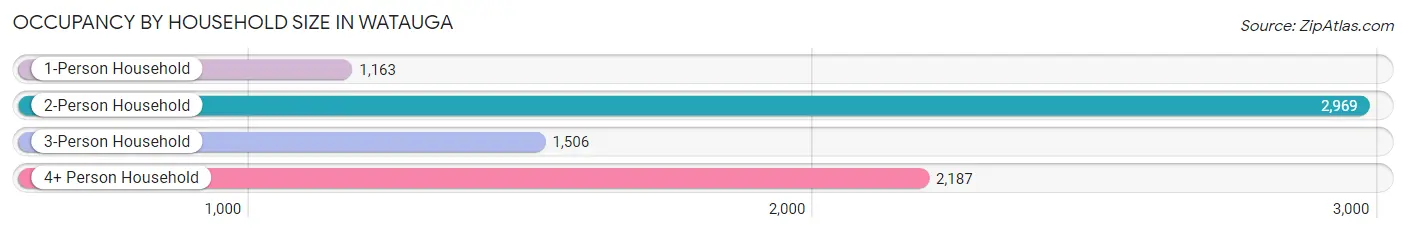
| Household Size | # Housing Units | % Housing Units |
| 1-Person Household | 1,163 | 14.9% |
| 2-Person Household | 2,969 | 37.9% |
| 3-Person Household | 1,506 | 19.3% |
| 4+ Person Household | 2,187 | 28.0% |
| Total Housing Units | 7,825 | 100.0% |
Occupancy by Ownership by Household Size in Watauga
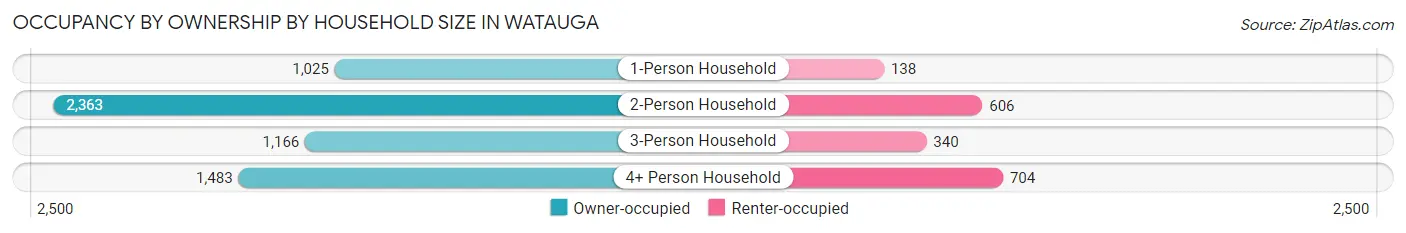
| Household Size | Owner-occupied | Renter-occupied |
| 1-Person Household | 1,025 (88.1%) | 138 (11.9%) |
| 2-Person Household | 2,363 (79.6%) | 606 (20.4%) |
| 3-Person Household | 1,166 (77.4%) | 340 (22.6%) |
| 4+ Person Household | 1,483 (67.8%) | 704 (32.2%) |
| Total Housing Units | 6,037 (77.1%) | 1,788 (22.9%) |
Occupancy by Educational Attainment in Watauga
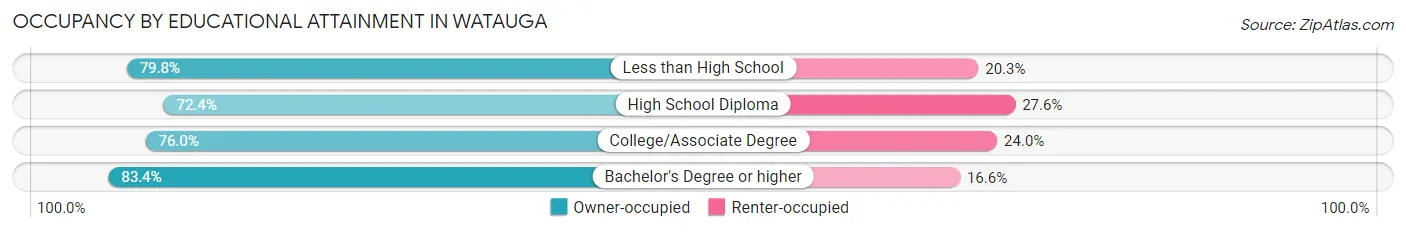
| Household Size | Owner-occupied | Renter-occupied |
| Less than High School | 579 (79.7%) | 147 (20.3%) |
| High School Diploma | 1,672 (72.4%) | 636 (27.6%) |
| College/Associate Degree | 2,155 (76.0%) | 680 (24.0%) |
| Bachelor's Degree or higher | 1,631 (83.4%) | 325 (16.6%) |
Occupancy by Age of Householder in Watauga
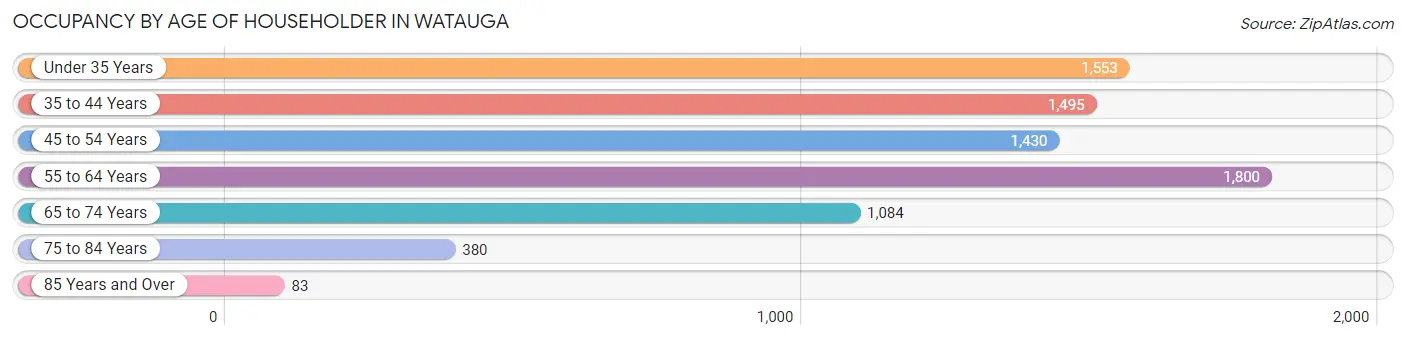
| Age Bracket | # Households | % Households |
| Under 35 Years | 1,553 | 19.9% |
| 35 to 44 Years | 1,495 | 19.1% |
| 45 to 54 Years | 1,430 | 18.3% |
| 55 to 64 Years | 1,800 | 23.0% |
| 65 to 74 Years | 1,084 | 13.9% |
| 75 to 84 Years | 380 | 4.9% |
| 85 Years and Over | 83 | 1.1% |
| Total | 7,825 | 100.0% |
Housing Finances in Watauga
Median Income by Occupancy in Watauga
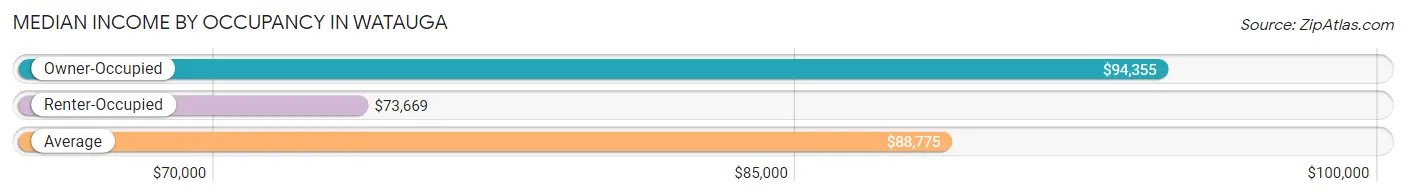
| Occupancy Type | # Households | Median Income |
| Owner-Occupied | 6,037 (77.1%) | $94,355 |
| Renter-Occupied | 1,788 (22.9%) | $73,669 |
| Average | 7,825 (100.0%) | $88,775 |
Occupancy by Householder Income Bracket in Watauga
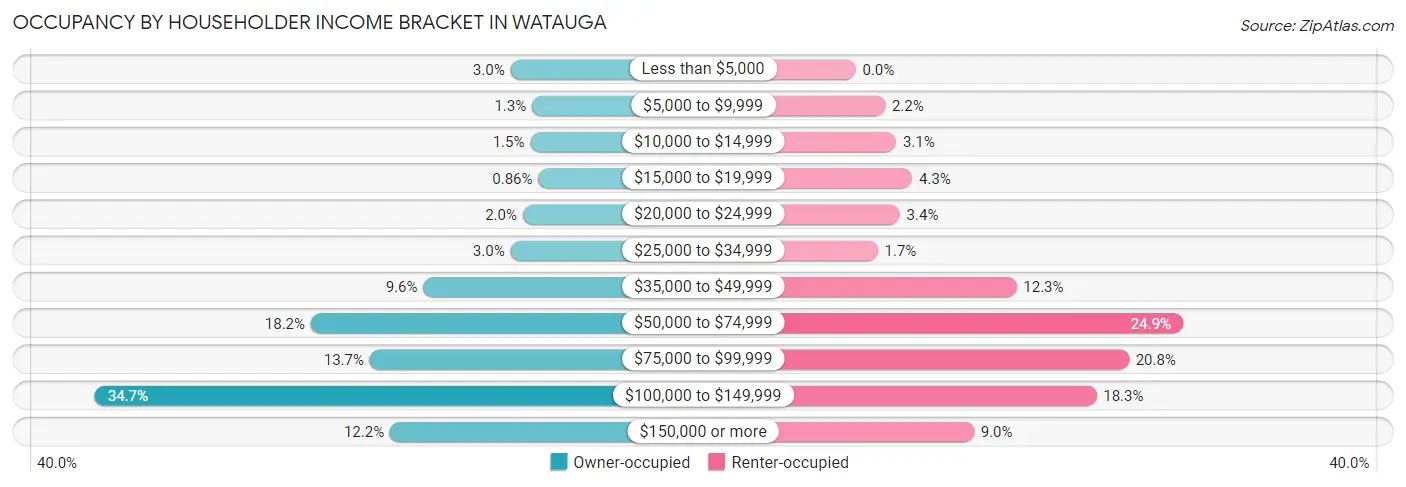
| Income Bracket | Owner-occupied | Renter-occupied |
| Less than $5,000 | 180 (3.0%) | 0 (0.0%) |
| $5,000 to $9,999 | 81 (1.3%) | 40 (2.2%) |
| $10,000 to $14,999 | 89 (1.5%) | 55 (3.1%) |
| $15,000 to $19,999 | 52 (0.9%) | 77 (4.3%) |
| $20,000 to $24,999 | 123 (2.0%) | 60 (3.4%) |
| $25,000 to $34,999 | 180 (3.0%) | 30 (1.7%) |
| $35,000 to $49,999 | 581 (9.6%) | 219 (12.2%) |
| $50,000 to $74,999 | 1,098 (18.2%) | 446 (24.9%) |
| $75,000 to $99,999 | 827 (13.7%) | 372 (20.8%) |
| $100,000 to $149,999 | 2,092 (34.6%) | 328 (18.3%) |
| $150,000 or more | 734 (12.2%) | 161 (9.0%) |
| Total | 6,037 (100.0%) | 1,788 (100.0%) |
Monthly Housing Cost Tiers in Watauga
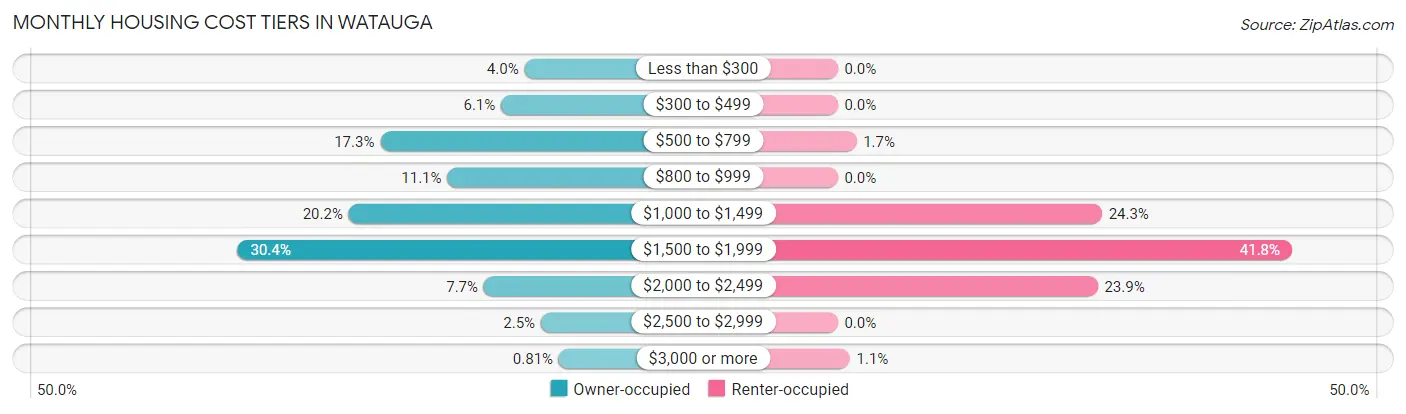
| Monthly Cost | Owner-occupied | Renter-occupied |
| Less than $300 | 240 (4.0%) | 0 (0.0%) |
| $300 to $499 | 370 (6.1%) | 0 (0.0%) |
| $500 to $799 | 1,042 (17.3%) | 31 (1.7%) |
| $800 to $999 | 669 (11.1%) | 0 (0.0%) |
| $1,000 to $1,499 | 1,217 (20.2%) | 435 (24.3%) |
| $1,500 to $1,999 | 1,835 (30.4%) | 748 (41.8%) |
| $2,000 to $2,499 | 466 (7.7%) | 428 (23.9%) |
| $2,500 to $2,999 | 149 (2.5%) | 0 (0.0%) |
| $3,000 or more | 49 (0.8%) | 20 (1.1%) |
| Total | 6,037 (100.0%) | 1,788 (100.0%) |
Physical Housing Characteristics in Watauga
Housing Structures in Watauga
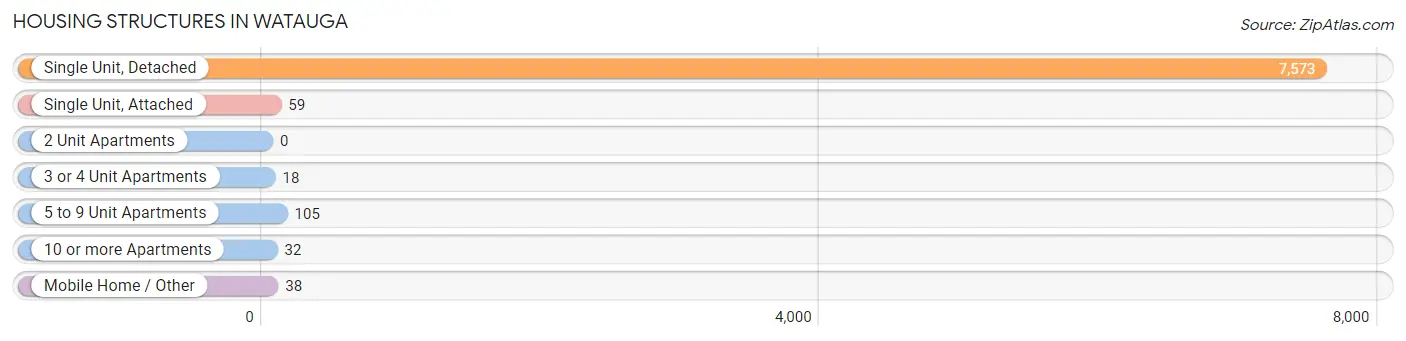
| Structure Type | # Housing Units | % Housing Units |
| Single Unit, Detached | 7,573 | 96.8% |
| Single Unit, Attached | 59 | 0.7% |
| 2 Unit Apartments | 0 | 0.0% |
| 3 or 4 Unit Apartments | 18 | 0.2% |
| 5 to 9 Unit Apartments | 105 | 1.3% |
| 10 or more Apartments | 32 | 0.4% |
| Mobile Home / Other | 38 | 0.5% |
| Total | 7,825 | 100.0% |
Housing Structures by Occupancy in Watauga
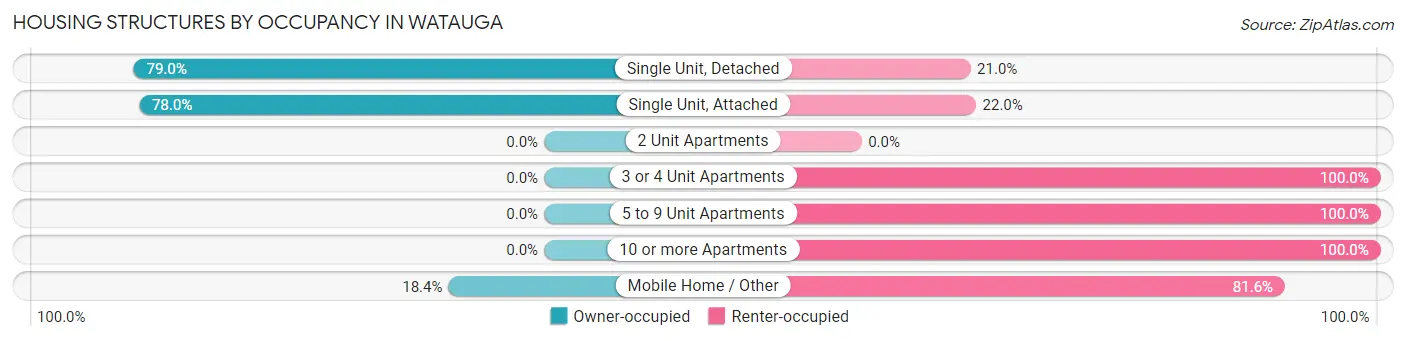
| Structure Type | Owner-occupied | Renter-occupied |
| Single Unit, Detached | 5,984 (79.0%) | 1,589 (21.0%) |
| Single Unit, Attached | 46 (78.0%) | 13 (22.0%) |
| 2 Unit Apartments | 0 (0.0%) | 0 (0.0%) |
| 3 or 4 Unit Apartments | 0 (0.0%) | 18 (100.0%) |
| 5 to 9 Unit Apartments | 0 (0.0%) | 105 (100.0%) |
| 10 or more Apartments | 0 (0.0%) | 32 (100.0%) |
| Mobile Home / Other | 7 (18.4%) | 31 (81.6%) |
| Total | 6,037 (77.1%) | 1,788 (22.9%) |
Housing Structures by Number of Rooms in Watauga
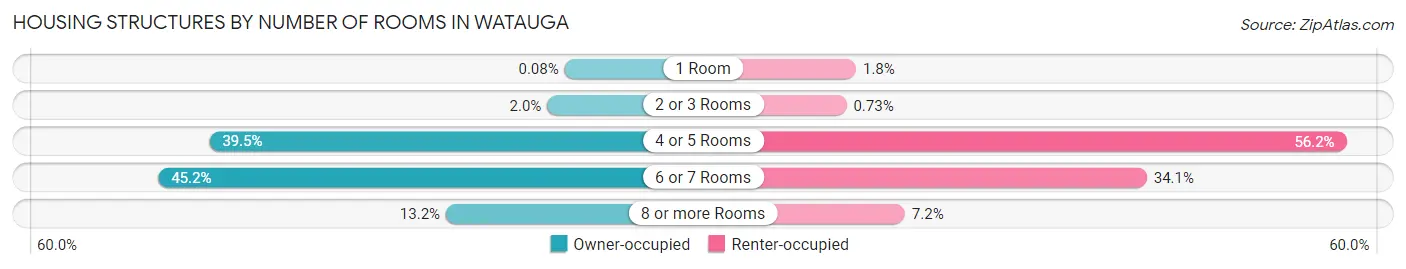
| Number of Rooms | Owner-occupied | Renter-occupied |
| 1 Room | 5 (0.1%) | 32 (1.8%) |
| 2 or 3 Rooms | 121 (2.0%) | 13 (0.7%) |
| 4 or 5 Rooms | 2,385 (39.5%) | 1,005 (56.2%) |
| 6 or 7 Rooms | 2,727 (45.2%) | 609 (34.1%) |
| 8 or more Rooms | 799 (13.2%) | 129 (7.2%) |
| Total | 6,037 (100.0%) | 1,788 (100.0%) |
Housing Structure by Heating Type in Watauga
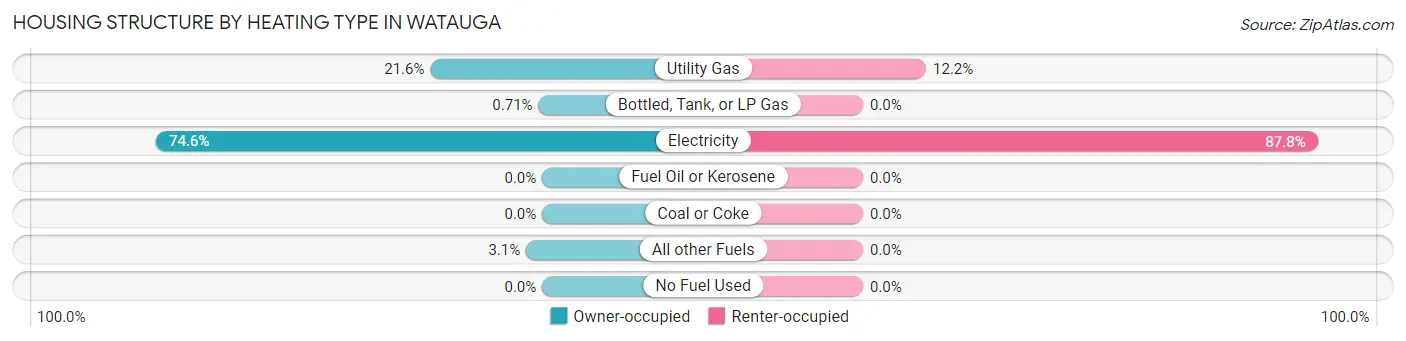
| Heating Type | Owner-occupied | Renter-occupied |
| Utility Gas | 1,304 (21.6%) | 218 (12.2%) |
| Bottled, Tank, or LP Gas | 43 (0.7%) | 0 (0.0%) |
| Electricity | 4,503 (74.6%) | 1,570 (87.8%) |
| Fuel Oil or Kerosene | 0 (0.0%) | 0 (0.0%) |
| Coal or Coke | 0 (0.0%) | 0 (0.0%) |
| All other Fuels | 187 (3.1%) | 0 (0.0%) |
| No Fuel Used | 0 (0.0%) | 0 (0.0%) |
| Total | 6,037 (100.0%) | 1,788 (100.0%) |
Household Vehicle Usage in Watauga
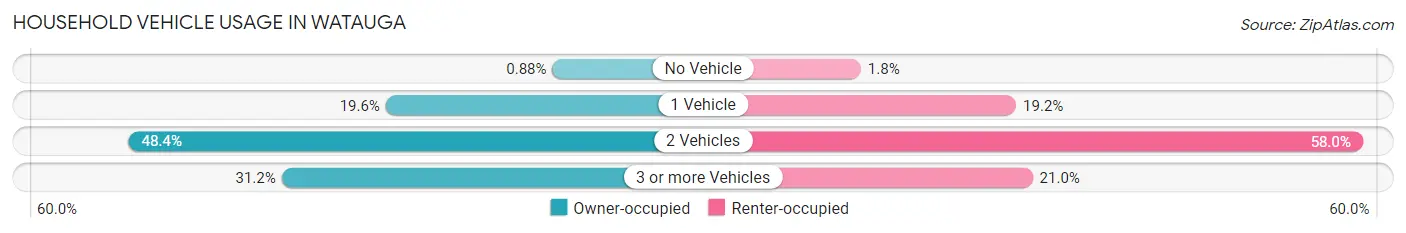
| Vehicles per Household | Owner-occupied | Renter-occupied |
| No Vehicle | 53 (0.9%) | 32 (1.8%) |
| 1 Vehicle | 1,180 (19.6%) | 343 (19.2%) |
| 2 Vehicles | 2,919 (48.3%) | 1,037 (58.0%) |
| 3 or more Vehicles | 1,885 (31.2%) | 376 (21.0%) |
| Total | 6,037 (100.0%) | 1,788 (100.0%) |
Real Estate & Mortgages in Watauga
Real Estate and Mortgage Overview in Watauga
| Characteristic | Without Mortgage | With Mortgage |
| Housing Units | 2,123 | 3,914 |
| Median Property Value | $192,900 | $218,000 |
| Median Household Income | $73,355 | $508 |
| Monthly Housing Costs | $655 | $49 |
| Real Estate Taxes | $2,913 | $128 |
Property Value by Mortgage Status in Watauga
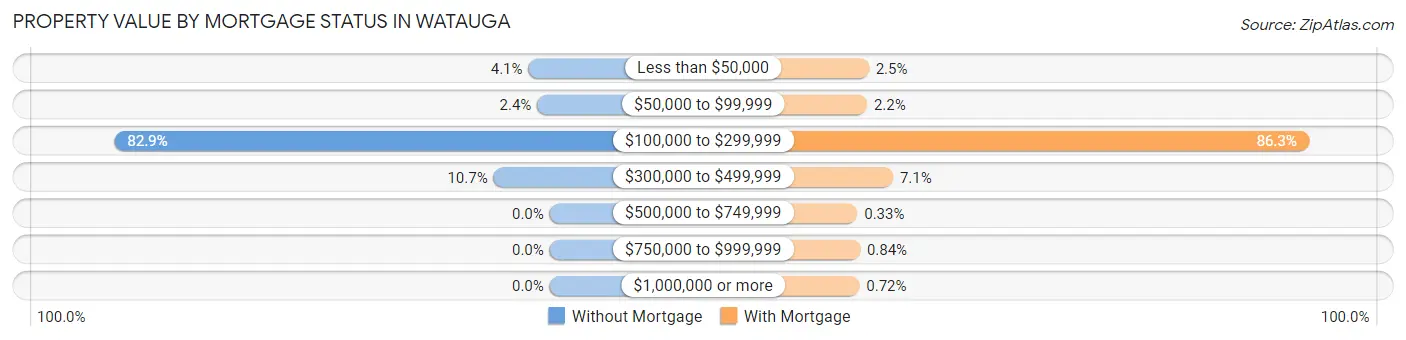
| Property Value | Without Mortgage | With Mortgage |
| Less than $50,000 | 86 (4.1%) | 98 (2.5%) |
| $50,000 to $99,999 | 50 (2.4%) | 85 (2.2%) |
| $100,000 to $299,999 | 1,760 (82.9%) | 3,378 (86.3%) |
| $300,000 to $499,999 | 227 (10.7%) | 279 (7.1%) |
| $500,000 to $749,999 | 0 (0.0%) | 13 (0.3%) |
| $750,000 to $999,999 | 0 (0.0%) | 33 (0.8%) |
| $1,000,000 or more | 0 (0.0%) | 28 (0.7%) |
| Total | 2,123 (100.0%) | 3,914 (100.0%) |
Household Income by Mortgage Status in Watauga
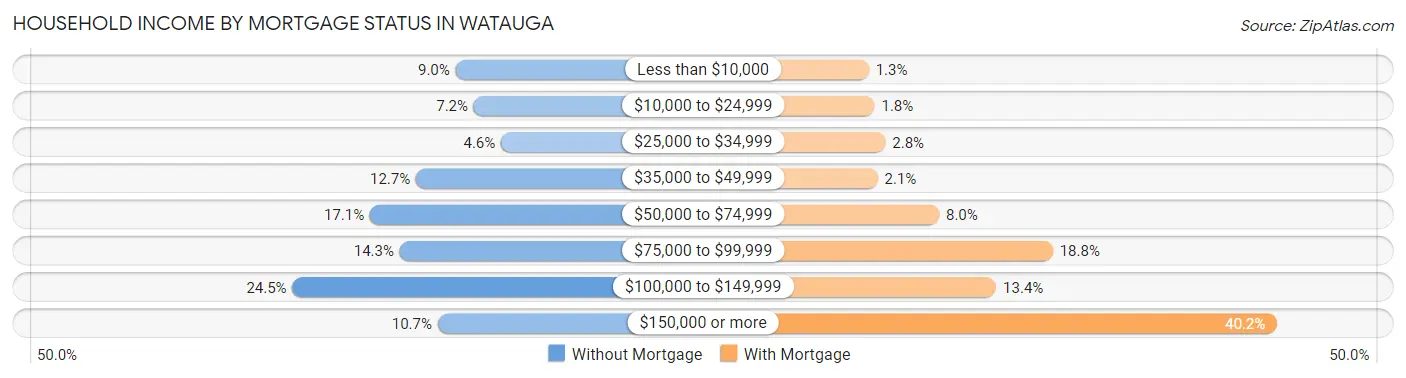
| Household Income | Without Mortgage | With Mortgage |
| Less than $10,000 | 190 (8.9%) | 49 (1.3%) |
| $10,000 to $24,999 | 153 (7.2%) | 71 (1.8%) |
| $25,000 to $34,999 | 98 (4.6%) | 111 (2.8%) |
| $35,000 to $49,999 | 270 (12.7%) | 82 (2.1%) |
| $50,000 to $74,999 | 363 (17.1%) | 311 (8.0%) |
| $75,000 to $99,999 | 303 (14.3%) | 735 (18.8%) |
| $100,000 to $149,999 | 520 (24.5%) | 524 (13.4%) |
| $150,000 or more | 226 (10.6%) | 1,572 (40.2%) |
| Total | 2,123 (100.0%) | 3,914 (100.0%) |
Property Value to Household Income Ratio in Watauga
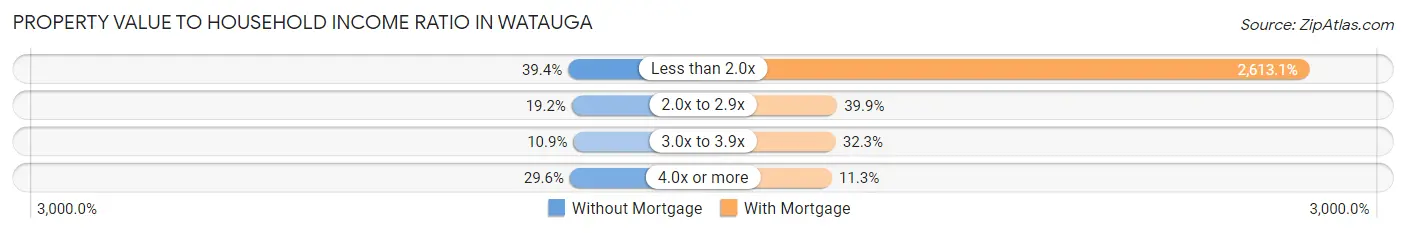
| Value-to-Income Ratio | Without Mortgage | With Mortgage |
| Less than 2.0x | 837 (39.4%) | 102,278 (2,613.1%) |
| 2.0x to 2.9x | 407 (19.2%) | 1,563 (39.9%) |
| 3.0x to 3.9x | 231 (10.9%) | 1,264 (32.3%) |
| 4.0x or more | 629 (29.6%) | 443 (11.3%) |
| Total | 2,123 (100.0%) | 3,914 (100.0%) |
Real Estate Taxes by Mortgage Status in Watauga
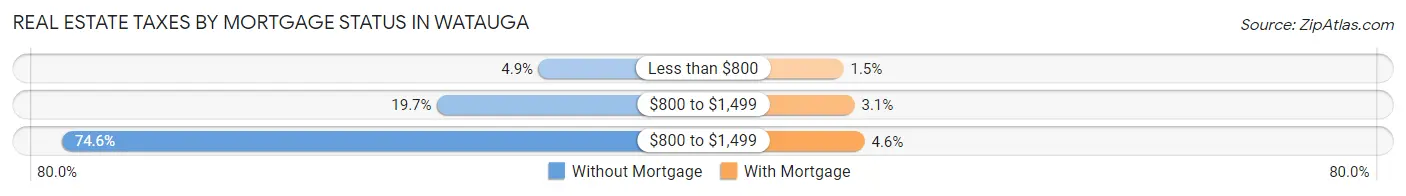
| Property Taxes | Without Mortgage | With Mortgage |
| Less than $800 | 103 (4.9%) | 60 (1.5%) |
| $800 to $1,499 | 418 (19.7%) | 123 (3.1%) |
| $800 to $1,499 | 1,583 (74.6%) | 180 (4.6%) |
| Total | 2,123 (100.0%) | 3,914 (100.0%) |
Health & Disability in Watauga
Health Insurance Coverage by Age in Watauga
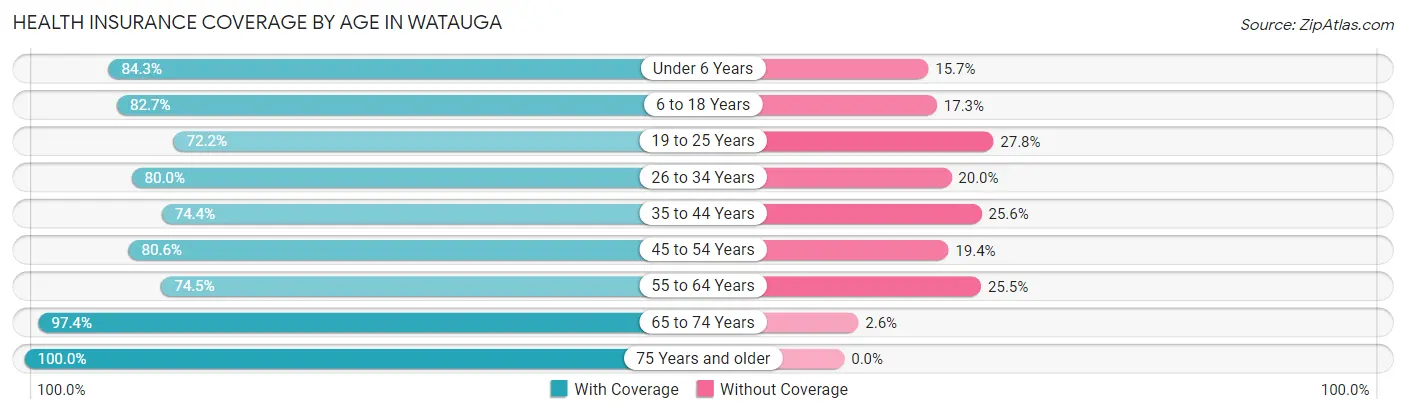
| Age Bracket | With Coverage | Without Coverage |
| Under 6 Years | 1,442 (84.3%) | 268 (15.7%) |
| 6 to 18 Years | 3,534 (82.7%) | 737 (17.3%) |
| 19 to 25 Years | 1,532 (72.2%) | 590 (27.8%) |
| 26 to 34 Years | 2,611 (80.0%) | 651 (20.0%) |
| 35 to 44 Years | 2,274 (74.4%) | 782 (25.6%) |
| 45 to 54 Years | 2,334 (80.6%) | 562 (19.4%) |
| 55 to 64 Years | 2,447 (74.5%) | 838 (25.5%) |
| 65 to 74 Years | 1,930 (97.4%) | 52 (2.6%) |
| 75 Years and older | 809 (100.0%) | 0 (0.0%) |
| Total | 18,913 (80.8%) | 4,480 (19.2%) |
Health Insurance Coverage by Citizenship Status in Watauga
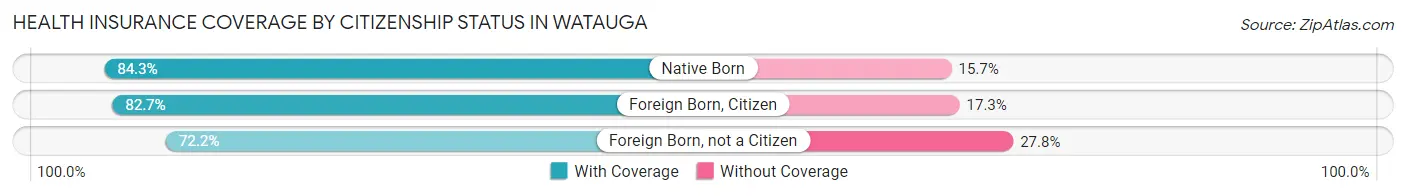
| Citizenship Status | With Coverage | Without Coverage |
| Native Born | 1,442 (84.3%) | 268 (15.7%) |
| Foreign Born, Citizen | 3,534 (82.7%) | 737 (17.3%) |
| Foreign Born, not a Citizen | 1,532 (72.2%) | 590 (27.8%) |
Health Insurance Coverage by Household Income in Watauga
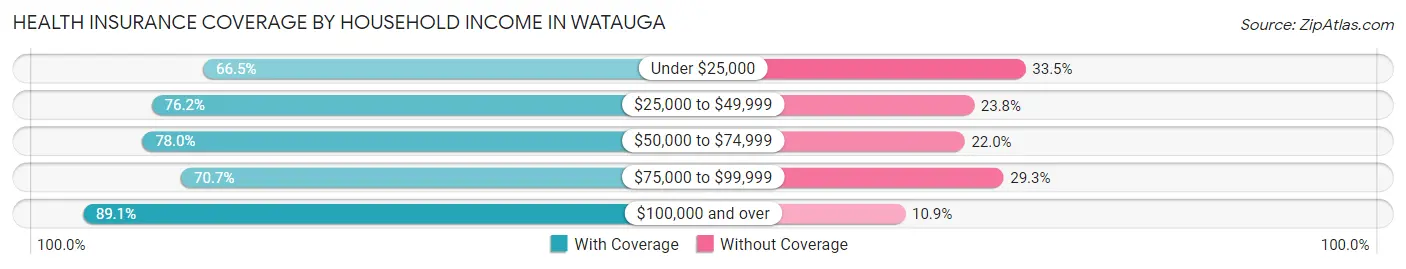
| Household Income | With Coverage | Without Coverage |
| Under $25,000 | 1,062 (66.5%) | 534 (33.5%) |
| $25,000 to $49,999 | 1,936 (76.2%) | 605 (23.8%) |
| $50,000 to $74,999 | 3,657 (78.0%) | 1,034 (22.0%) |
| $75,000 to $99,999 | 2,758 (70.7%) | 1,144 (29.3%) |
| $100,000 and over | 9,500 (89.1%) | 1,163 (10.9%) |
Public vs Private Health Insurance Coverage by Age in Watauga
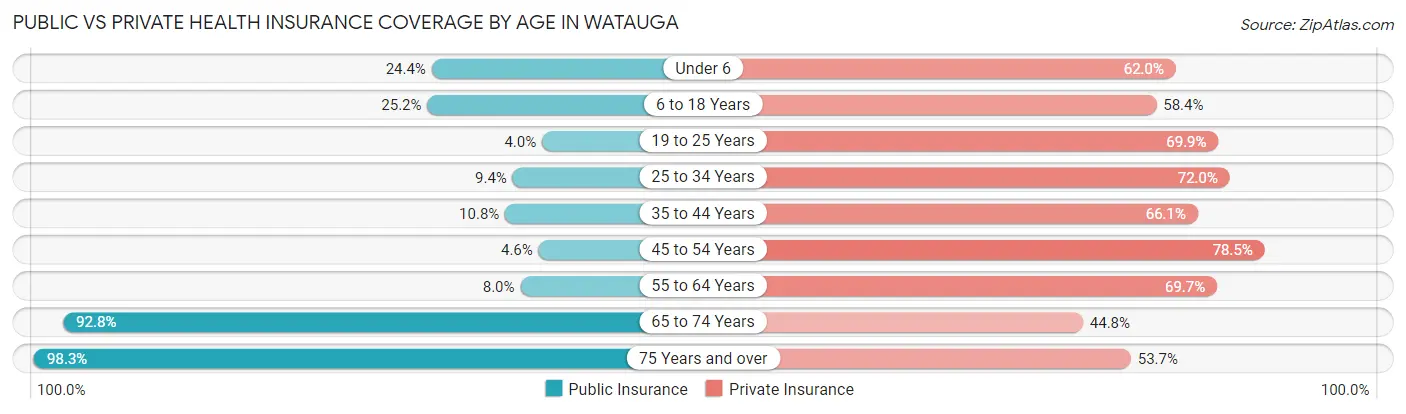
| Age Bracket | Public Insurance | Private Insurance |
| Under 6 | 418 (24.4%) | 1,060 (62.0%) |
| 6 to 18 Years | 1,078 (25.2%) | 2,493 (58.4%) |
| 19 to 25 Years | 84 (4.0%) | 1,483 (69.9%) |
| 25 to 34 Years | 307 (9.4%) | 2,349 (72.0%) |
| 35 to 44 Years | 330 (10.8%) | 2,019 (66.1%) |
| 45 to 54 Years | 133 (4.6%) | 2,273 (78.5%) |
| 55 to 64 Years | 262 (8.0%) | 2,288 (69.7%) |
| 65 to 74 Years | 1,840 (92.8%) | 887 (44.8%) |
| 75 Years and over | 795 (98.3%) | 434 (53.6%) |
| Total | 5,247 (22.4%) | 15,286 (65.3%) |
Disability Status by Sex by Age in Watauga
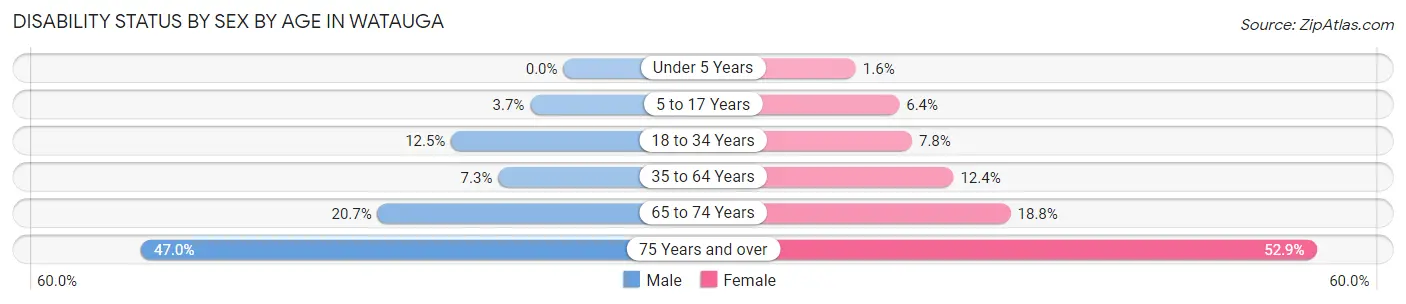
| Age Bracket | Male | Female |
| Under 5 Years | 0 (0.0%) | 10 (1.6%) |
| 5 to 17 Years | 75 (3.7%) | 132 (6.4%) |
| 18 to 34 Years | 417 (12.5%) | 191 (7.8%) |
| 35 to 64 Years | 345 (7.2%) | 557 (12.4%) |
| 65 to 74 Years | 179 (20.7%) | 210 (18.8%) |
| 75 Years and over | 166 (47.0%) | 241 (52.8%) |
Disability Class by Sex by Age in Watauga
Disability Class: Hearing Difficulty
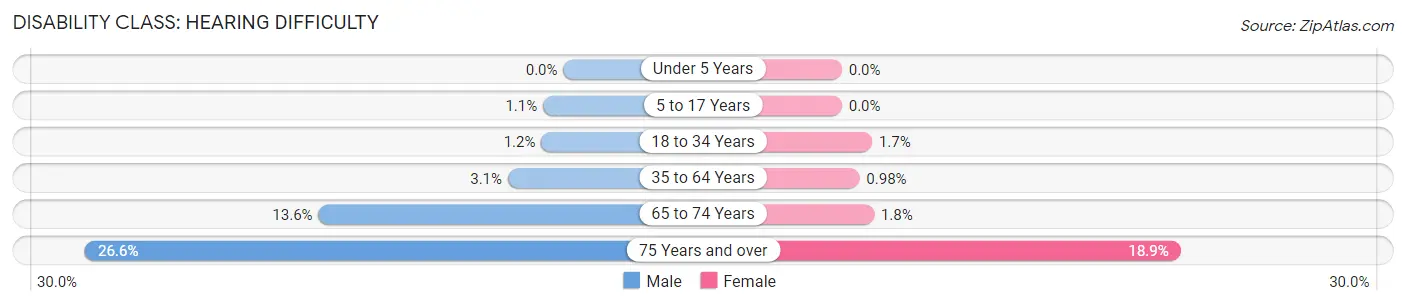
| Age Bracket | Male | Female |
| Under 5 Years | 0 (0.0%) | 0 (0.0%) |
| 5 to 17 Years | 23 (1.1%) | 0 (0.0%) |
| 18 to 34 Years | 41 (1.2%) | 41 (1.7%) |
| 35 to 64 Years | 147 (3.1%) | 44 (1.0%) |
| 65 to 74 Years | 118 (13.6%) | 20 (1.8%) |
| 75 Years and over | 94 (26.6%) | 86 (18.9%) |
Disability Class: Vision Difficulty
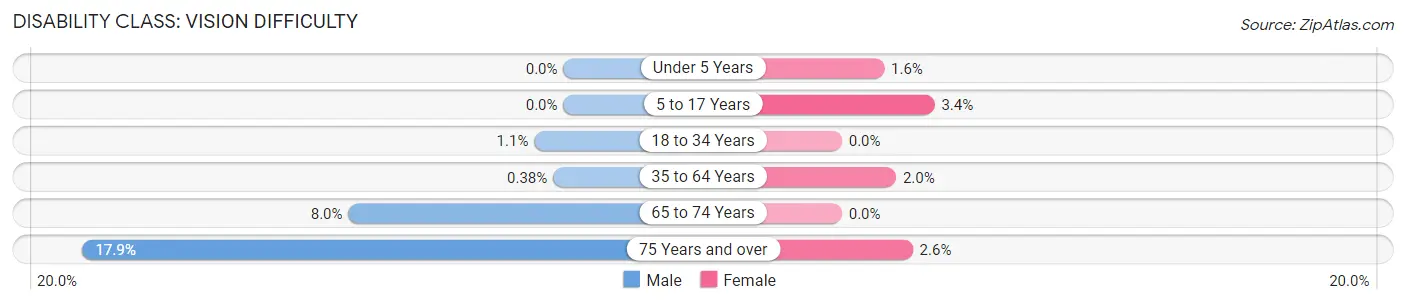
| Age Bracket | Male | Female |
| Under 5 Years | 0 (0.0%) | 10 (1.6%) |
| 5 to 17 Years | 0 (0.0%) | 71 (3.4%) |
| 18 to 34 Years | 36 (1.1%) | 0 (0.0%) |
| 35 to 64 Years | 18 (0.4%) | 90 (2.0%) |
| 65 to 74 Years | 69 (8.0%) | 0 (0.0%) |
| 75 Years and over | 63 (17.8%) | 12 (2.6%) |
Disability Class: Cognitive Difficulty
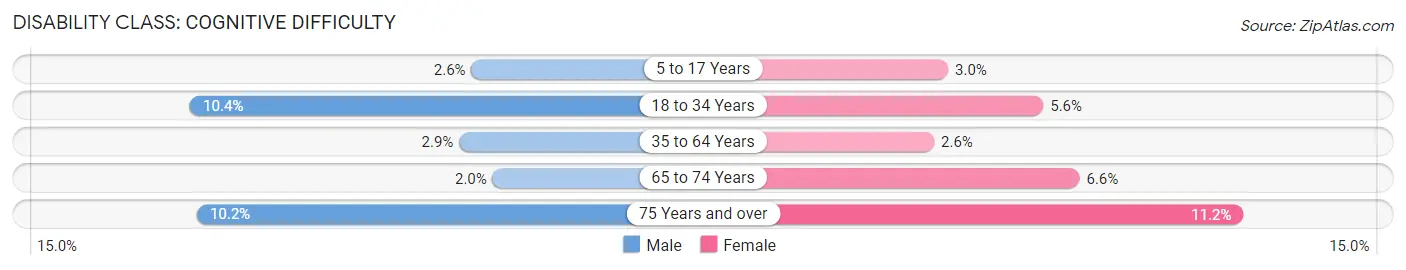
| Age Bracket | Male | Female |
| 5 to 17 Years | 52 (2.6%) | 61 (3.0%) |
| 18 to 34 Years | 347 (10.4%) | 137 (5.6%) |
| 35 to 64 Years | 138 (2.9%) | 115 (2.6%) |
| 65 to 74 Years | 17 (2.0%) | 74 (6.6%) |
| 75 Years and over | 36 (10.2%) | 51 (11.2%) |
Disability Class: Ambulatory Difficulty
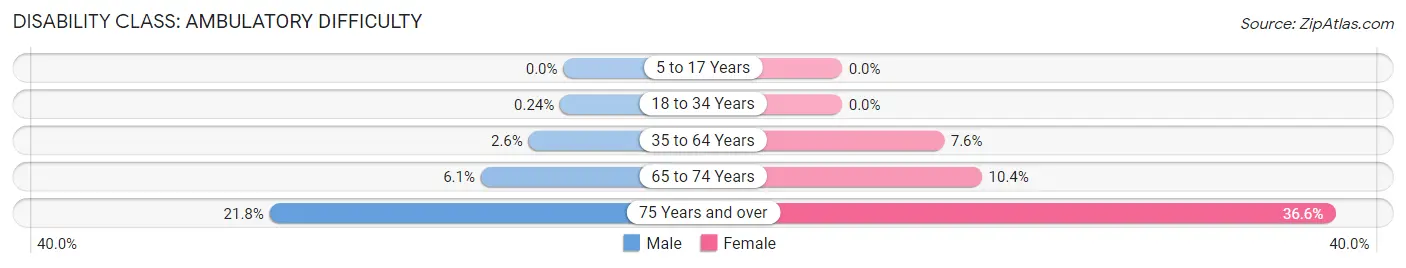
| Age Bracket | Male | Female |
| 5 to 17 Years | 0 (0.0%) | 0 (0.0%) |
| 18 to 34 Years | 8 (0.2%) | 0 (0.0%) |
| 35 to 64 Years | 123 (2.6%) | 339 (7.6%) |
| 65 to 74 Years | 53 (6.1%) | 116 (10.4%) |
| 75 Years and over | 77 (21.8%) | 167 (36.6%) |
Disability Class: Self-Care Difficulty
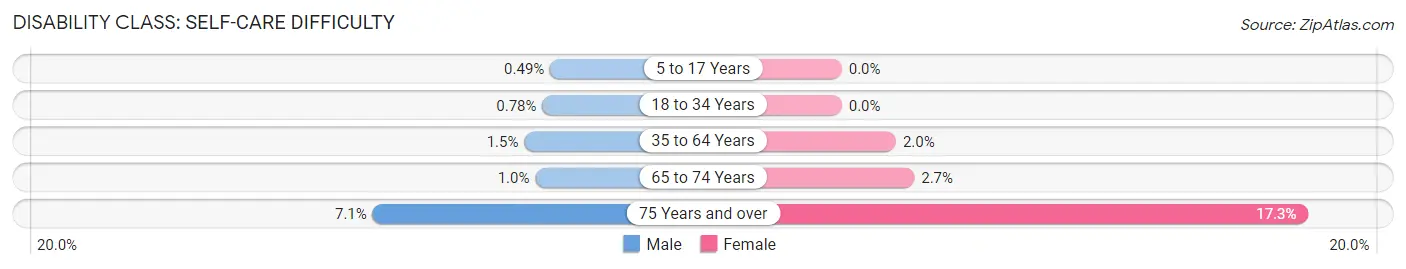
| Age Bracket | Male | Female |
| 5 to 17 Years | 10 (0.5%) | 0 (0.0%) |
| 18 to 34 Years | 26 (0.8%) | 0 (0.0%) |
| 35 to 64 Years | 69 (1.5%) | 90 (2.0%) |
| 65 to 74 Years | 9 (1.0%) | 30 (2.7%) |
| 75 Years and over | 25 (7.1%) | 79 (17.3%) |
Technology Access in Watauga
Computing Device Access in Watauga
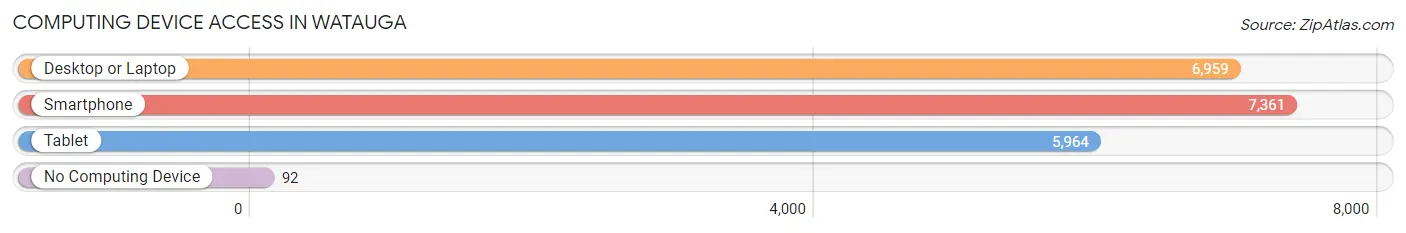
| Device Type | # Households | % Households |
| Desktop or Laptop | 6,959 | 88.9% |
| Smartphone | 7,361 | 94.1% |
| Tablet | 5,964 | 76.2% |
| No Computing Device | 92 | 1.2% |
| Total | 7,825 | 100.0% |
Internet Access in Watauga
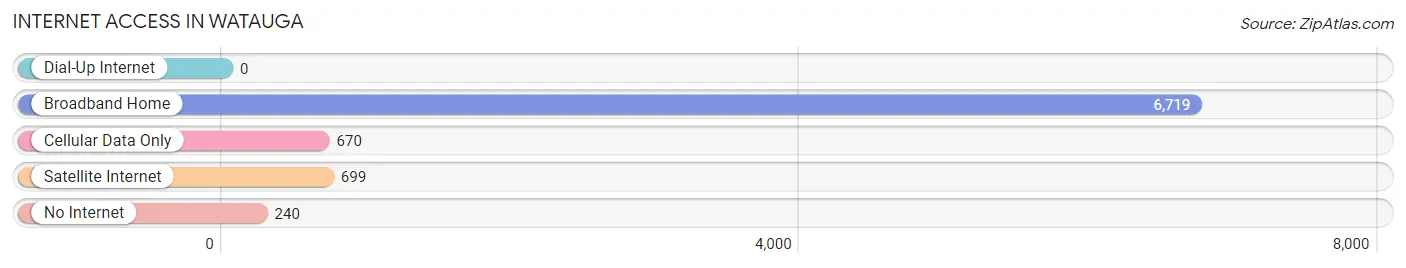
| Internet Type | # Households | % Households |
| Dial-Up Internet | 0 | 0.0% |
| Broadband Home | 6,719 | 85.9% |
| Cellular Data Only | 670 | 8.6% |
| Satellite Internet | 699 | 8.9% |
| No Internet | 240 | 3.1% |
| Total | 7,825 | 100.0% |
Watauga Summary
Watauga is a city located in Tarrant County, Texas, United States. The population was 23,497 at the 2010 census, making it the largest city in the county. Watauga is part of the Dallas-Fort Worth-Arlington metropolitan area.
History
The area that is now Watauga was first settled in the late 1800s. The first settlers were mostly farmers and ranchers who were attracted to the area by its fertile soil and abundant water supply. The town was officially established in 1881 when the Watauga Post Office was established. The town was named after the Watauga River, which runs through the area.
In the early 1900s, Watauga began to grow as a small farming community. The town was home to several cotton gins, a sawmill, and a gristmill. The town also had a school, a church, and a general store.
In the 1950s, Watauga began to experience rapid growth as the Dallas-Fort Worth area began to expand. The population of Watauga increased from 1,000 in 1950 to over 10,000 by the 1970s.
Geography
Watauga is located in Tarrant County, Texas, at the intersection of Interstate 820 and State Highway 377. The city is situated on the western edge of the Dallas-Fort Worth metropolitan area. Watauga is bordered by the cities of Keller to the north, North Richland Hills to the east, and Haltom City to the south.
The city has a total area of 8.3 square miles, all of which is land. The terrain is mostly flat, with some rolling hills in the northern part of the city. The Watauga River runs through the city, providing a source of water for the area.
Economy
Watauga is a primarily residential city, with a small but growing commercial sector. The city is home to several large employers, including the Watauga Medical Center, the Watauga Independent School District, and the Watauga Public Library.
The city also has a growing retail sector, with several large shopping centers and strip malls. The city is home to several restaurants, bars, and other entertainment venues.
Demographics
As of the 2010 census, Watauga had a population of 23,497. The racial makeup of the city was 79.2% White, 8.3% African American, 0.5% Native American, 5.2% Asian, 0.1% Pacific Islander, 4.2% from other races, and 2.5% from two or more races. Hispanic or Latino of any race were 13.2% of the population.
The median income for a household in Watauga was $50,945, and the median income for a family was $60,945. The per capita income for the city was $24,945. About 6.2% of families and 8.2% of the population were below the poverty line, including 10.2% of those under age 18 and 6.2% of those age 65 or over.
Conclusion
Watauga is a city located in Tarrant County, Texas, United States. The city has a population of 23,497 and is part of the Dallas-Fort Worth-Arlington metropolitan area. Watauga is a primarily residential city, with a small but growing commercial sector. The city is home to several large employers, including the Watauga Medical Center, the Watauga Independent School District, and the Watauga Public Library. The racial makeup of the city is 79.2% White, 8.3% African American, 0.5% Native American, 5.2% Asian, 0.1% Pacific Islander, 4.2% from other races, and 2.5% from two or more races. The median income for a household in Watauga was $50,945, and the median income for a family was $60,945. The per capita income for the city was $24,945.
Common Questions
What is Per Capita Income in Watauga?
Per Capita income in Watauga is $32,279.
What is the Median Family Income in Watauga?
Median Family Income in Watauga is $91,419.
What is the Median Household income in Watauga?
Median Household Income in Watauga is $88,775.
What is Income or Wage Gap in Watauga?
Income or Wage Gap in Watauga is 14.3%.
Women in Watauga earn 85.7 cents for every dollar earned by a man.
What is Family Income Deficit in Watauga?
Family Income Deficit in Watauga is $8,481.
Families that are below poverty line in Watauga earn $8,481 less on average than the poverty threshold level.
What is Inequality or Gini Index in Watauga?
Inequality or Gini Index in Watauga is 0.34.
What is the Total Population of Watauga?
Total Population of Watauga is 23,509.
What is the Total Male Population of Watauga?
Total Male Population of Watauga is 12,239.
What is the Total Female Population of Watauga?
Total Female Population of Watauga is 11,270.
What is the Ratio of Males per 100 Females in Watauga?
There are 108.60 Males per 100 Females in Watauga.
What is the Ratio of Females per 100 Males in Watauga?
There are 92.08 Females per 100 Males in Watauga.
What is the Median Population Age in Watauga?
Median Population Age in Watauga is 35.8 Years.
What is the Average Family Size in Watauga
Average Family Size in Watauga is 3.3 People.
What is the Average Household Size in Watauga
Average Household Size in Watauga is 3.0 People.
How Large is the Labor Force in Watauga?
There are 13,613 People in the Labor Forcein in Watauga.
What is the Percentage of People in the Labor Force in Watauga?
72.9% of People are in the Labor Force in Watauga.
What is the Unemployment Rate in Watauga?
Unemployment Rate in Watauga is 5.2%.