Lumberton, TX Map & Demographics
Lumberton Map
Lumberton Overview
$45,137
PER CAPITA INCOME
$113,566
AVG FAMILY INCOME
$99,066
AVG HOUSEHOLD INCOME
41.1%
WAGE / INCOME GAP [ % ]
58.9¢/ $1
WAGE / INCOME GAP [ $ ]
0.37
INEQUALITY / GINI INDEX
13,613
TOTAL POPULATION
6,564
MALE POPULATION
7,049
FEMALE POPULATION
93.12
MALES / 100 FEMALES
107.39
FEMALES / 100 MALES
41.3
MEDIAN AGE
2.9
AVG FAMILY SIZE
2.5
AVG HOUSEHOLD SIZE
6,746
LABOR FORCE [ PEOPLE ]
61.9%
PERCENT IN LABOR FORCE
3.5%
UNEMPLOYMENT RATE
Lumberton Zip Codes
Lumberton Area Codes
Income in Lumberton
Income Overview in Lumberton
Per Capita Income in Lumberton is $45,137, while median incomes of families and households are $113,566 and $99,066 respectively.
| Characteristic | Number | Measure |
| Per Capita Income | 13,613 | $45,137 |
| Median Family Income | 3,965 | $113,566 |
| Mean Family Income | 3,965 | $127,350 |
| Median Household Income | 5,313 | $99,066 |
| Mean Household Income | 5,313 | $110,935 |
| Income Deficit | 3,965 | $0 |
| Wage / Income Gap (%) | 13,613 | 41.09% |
| Wage / Income Gap ($) | 13,613 | 58.91¢ per $1 |
| Gini / Inequality Index | 13,613 | 0.37 |
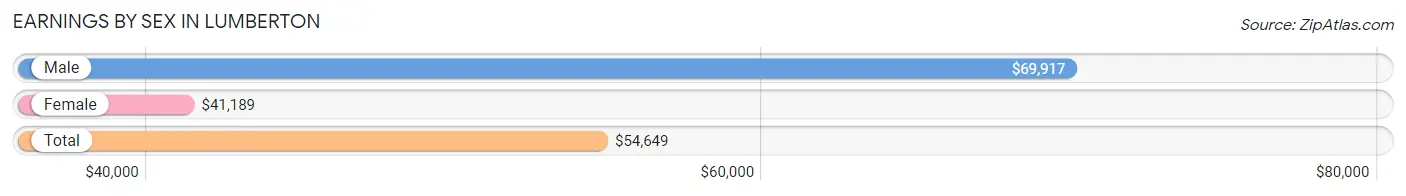
Earnings by Sex in Lumberton
Average Earnings in Lumberton are $54,649, $69,917 for men and $41,189 for women, a difference of 41.1%.
| Sex | Number | Average Earnings |
| Male | 3,660 (51.8%) | $69,917 |
| Female | 3,410 (48.2%) | $41,189 |
| Total | 7,070 (100.0%) | $54,649 |
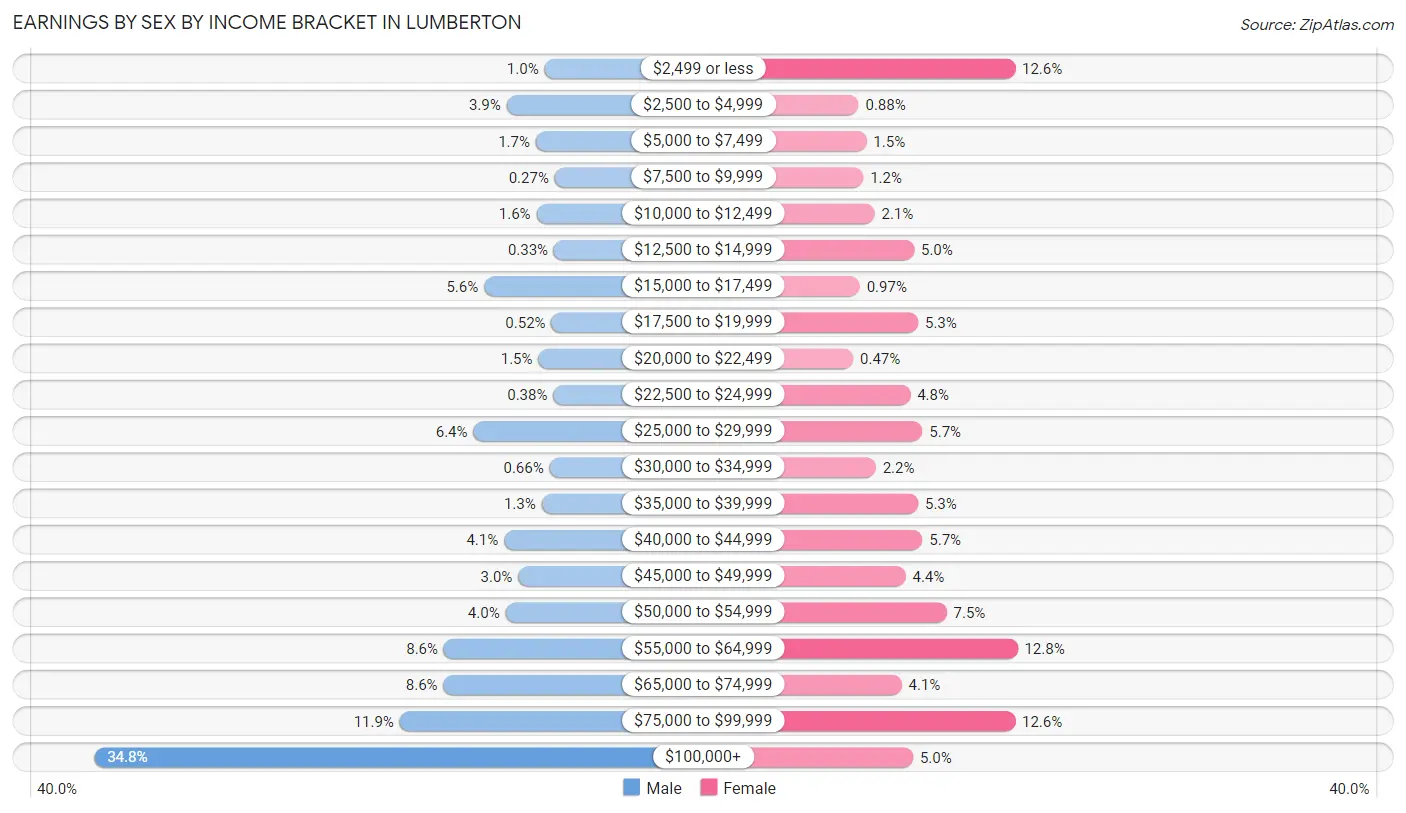
Earnings by Sex by Income Bracket in Lumberton
The most common earnings brackets in Lumberton are $100,000+ for men (1,273 | 34.8%) and $55,000 to $64,999 for women (436 | 12.8%).
| Income | Male | Female |
| $2,499 or less | 38 (1.0%) | 430 (12.6%) |
| $2,500 to $4,999 | 142 (3.9%) | 30 (0.9%) |
| $5,000 to $7,499 | 62 (1.7%) | 50 (1.5%) |
| $7,500 to $9,999 | 10 (0.3%) | 42 (1.2%) |
| $10,000 to $12,499 | 60 (1.6%) | 71 (2.1%) |
| $12,500 to $14,999 | 12 (0.3%) | 172 (5.0%) |
| $15,000 to $17,499 | 204 (5.6%) | 33 (1.0%) |
| $17,500 to $19,999 | 19 (0.5%) | 182 (5.3%) |
| $20,000 to $22,499 | 55 (1.5%) | 16 (0.5%) |
| $22,500 to $24,999 | 14 (0.4%) | 162 (4.8%) |
| $25,000 to $29,999 | 233 (6.4%) | 193 (5.7%) |
| $30,000 to $34,999 | 24 (0.7%) | 74 (2.2%) |
| $35,000 to $39,999 | 46 (1.3%) | 182 (5.3%) |
| $40,000 to $44,999 | 149 (4.1%) | 193 (5.7%) |
| $45,000 to $49,999 | 110 (3.0%) | 150 (4.4%) |
| $50,000 to $54,999 | 145 (4.0%) | 255 (7.5%) |
| $55,000 to $64,999 | 314 (8.6%) | 436 (12.8%) |
| $65,000 to $74,999 | 315 (8.6%) | 140 (4.1%) |
| $75,000 to $99,999 | 435 (11.9%) | 430 (12.6%) |
| $100,000+ | 1,273 (34.8%) | 169 (5.0%) |
| Total | 3,660 (100.0%) | 3,410 (100.0%) |
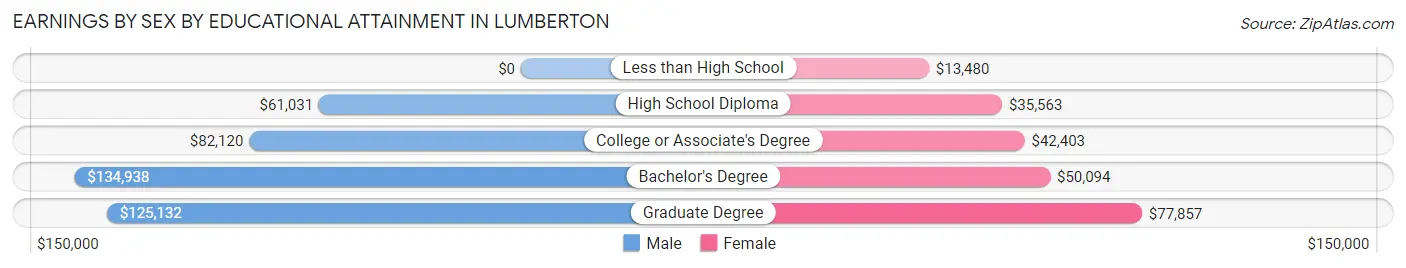
Earnings by Sex by Educational Attainment in Lumberton
Average earnings in Lumberton are $80,884 for men and $43,000 for women, a difference of 46.8%. Men with an educational attainment of bachelor's degree enjoy the highest average annual earnings of $134,938, while those with high school diploma education earn the least with $61,031. Women with an educational attainment of graduate degree earn the most with the average annual earnings of $77,857, while those with less than high school education have the smallest earnings of $13,480.
| Educational Attainment | Male Income | Female Income |
| Less than High School | - | - |
| High School Diploma | $61,031 | $35,563 |
| College or Associate's Degree | $82,120 | $42,403 |
| Bachelor's Degree | $134,938 | $50,094 |
| Graduate Degree | $125,132 | $77,857 |
| Total | $80,884 | $43,000 |
Family Income in Lumberton
Family Income Brackets in Lumberton
According to the Lumberton family income data, there are 1,237 families falling into the $100,000 to $149,999 income range, which is the most common income bracket and makes up 31.2% of all families. Conversely, the $10,000 to $14,999 income bracket is the least frequent group with only 12 families (0.3%) belonging to this category.
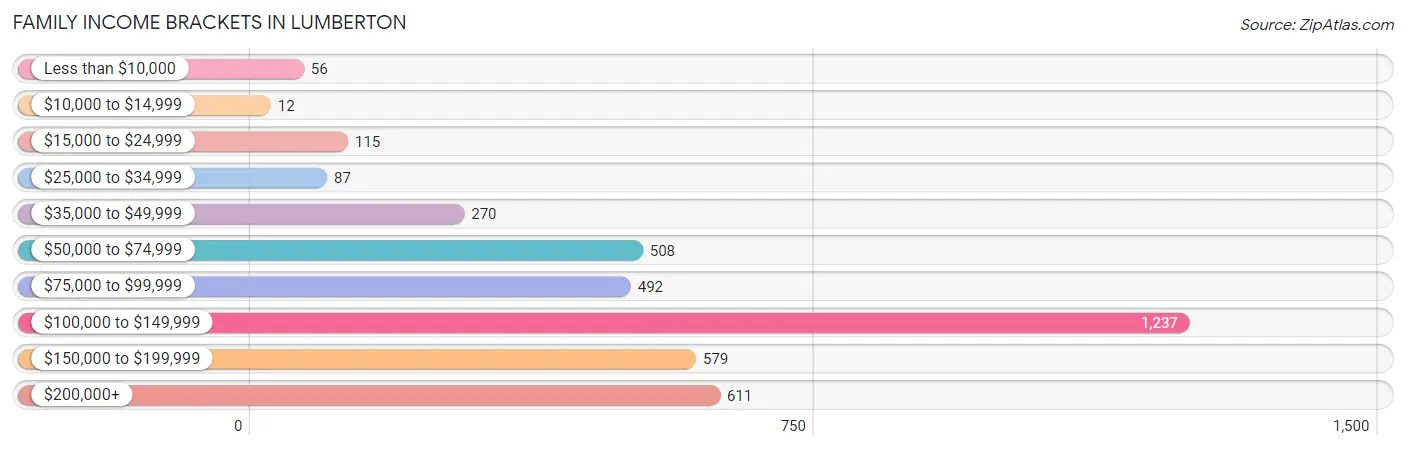
| Income Bracket | # Families | % Families |
| Less than $10,000 | 56 | 1.4% |
| $10,000 to $14,999 | 12 | 0.3% |
| $15,000 to $24,999 | 115 | 2.9% |
| $25,000 to $34,999 | 87 | 2.2% |
| $35,000 to $49,999 | 270 | 6.8% |
| $50,000 to $74,999 | 508 | 12.8% |
| $75,000 to $99,999 | 492 | 12.4% |
| $100,000 to $149,999 | 1,237 | 31.2% |
| $150,000 to $199,999 | 579 | 14.6% |
| $200,000+ | 611 | 15.4% |
Family Income by Famaliy Size in Lumberton
3-person families (976 | 24.6%) account for the highest median family income in Lumberton with $122,143 per family, while 2-person families (2,042 | 51.5%) have the highest median income of $56,593 per family member.
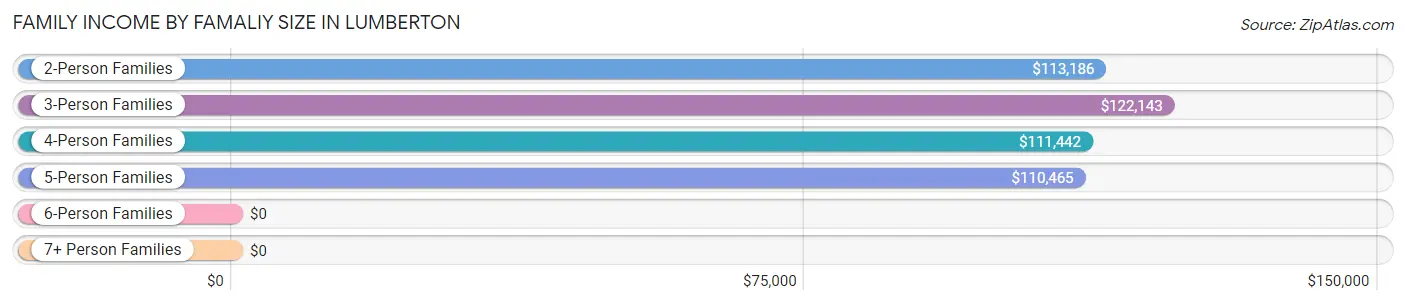
| Income Bracket | # Families | Median Income |
| 2-Person Families | 2,042 (51.5%) | $113,186 |
| 3-Person Families | 976 (24.6%) | $122,143 |
| 4-Person Families | 648 (16.3%) | $111,442 |
| 5-Person Families | 272 (6.9%) | $110,465 |
| 6-Person Families | 17 (0.4%) | $0 |
| 7+ Person Families | 10 (0.3%) | $0 |
| Total | 3,965 (100.0%) | $113,566 |
Family Income by Number of Earners in Lumberton
The median family income in Lumberton is $113,566, with families comprising 3+ earners (363) having the highest median family income of $215,465, while families with no earners (456) have the lowest median family income of $66,563, accounting for 9.2% and 11.5% of families, respectively.
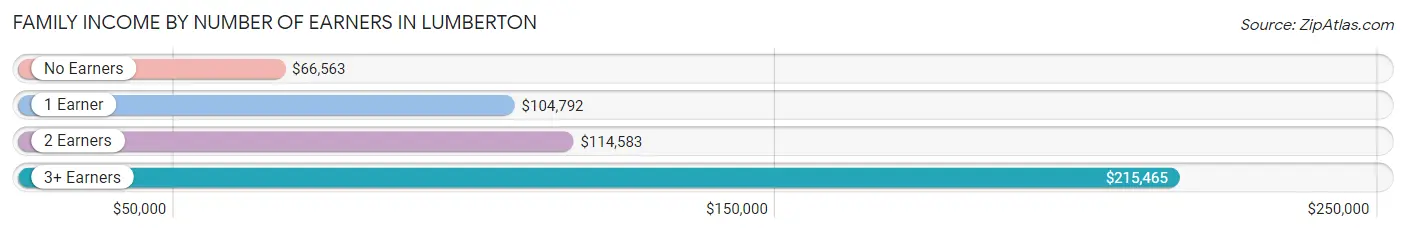
| Number of Earners | # Families | Median Income |
| No Earners | 456 (11.5%) | $66,563 |
| 1 Earner | 1,455 (36.7%) | $104,792 |
| 2 Earners | 1,691 (42.6%) | $114,583 |
| 3+ Earners | 363 (9.2%) | $215,465 |
| Total | 3,965 (100.0%) | $113,566 |
Household Income in Lumberton
Household Income Brackets in Lumberton
With 1,350 households falling in the category, the $100,000 to $149,999 income range is the most frequent in Lumberton, accounting for 25.4% of all households. In contrast, only 43 households (0.8%) fall into the $10,000 to $14,999 income bracket, making it the least populous group.
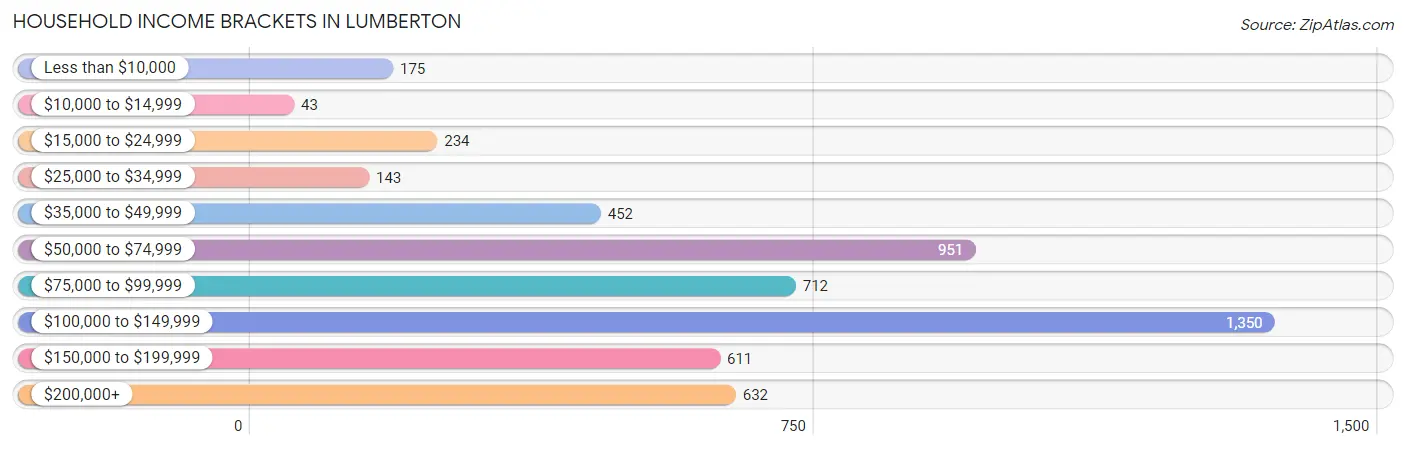
| Income Bracket | # Households | % Households |
| Less than $10,000 | 175 | 3.3% |
| $10,000 to $14,999 | 43 | 0.8% |
| $15,000 to $24,999 | 234 | 4.4% |
| $25,000 to $34,999 | 143 | 2.7% |
| $35,000 to $49,999 | 452 | 8.5% |
| $50,000 to $74,999 | 951 | 17.9% |
| $75,000 to $99,999 | 712 | 13.4% |
| $100,000 to $149,999 | 1,350 | 25.4% |
| $150,000 to $199,999 | 611 | 11.5% |
| $200,000+ | 632 | 11.9% |
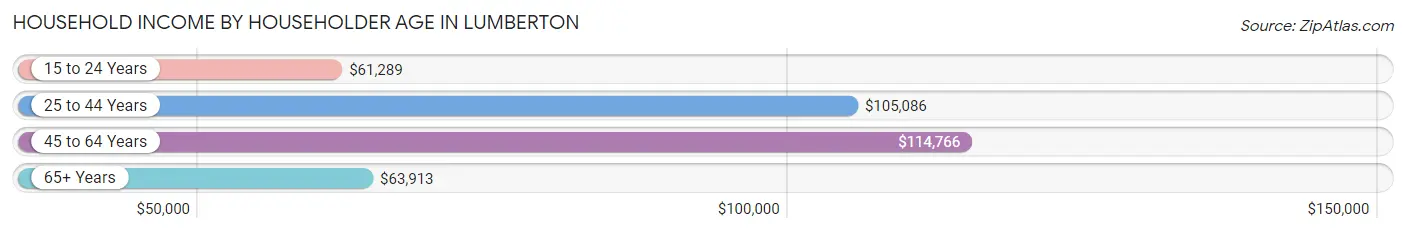
Household Income by Householder Age in Lumberton
The median household income in Lumberton is $99,066, with the highest median household income of $114,766 found in the 45 to 64 years age bracket for the primary householder. A total of 1,830 households (34.4%) fall into this category. Meanwhile, the 15 to 24 years age bracket for the primary householder has the lowest median household income of $61,289, with 95 households (1.8%) in this group.
| Income Bracket | # Households | Median Income |
| 15 to 24 Years | 95 (1.8%) | $61,289 |
| 25 to 44 Years | 1,632 (30.7%) | $105,086 |
| 45 to 64 Years | 1,830 (34.4%) | $114,766 |
| 65+ Years | 1,756 (33.1%) | $63,913 |
| Total | 5,313 (100.0%) | $99,066 |
Poverty in Lumberton
Income Below Poverty by Sex and Age in Lumberton
With 3.0% poverty level for males and 8.4% for females among the residents of Lumberton, 16 and 17 year old males and 12 to 14 year old females are the most vulnerable to poverty, with 12 males (22.2%) and 40 females (19.7%) in their respective age groups living below the poverty level.
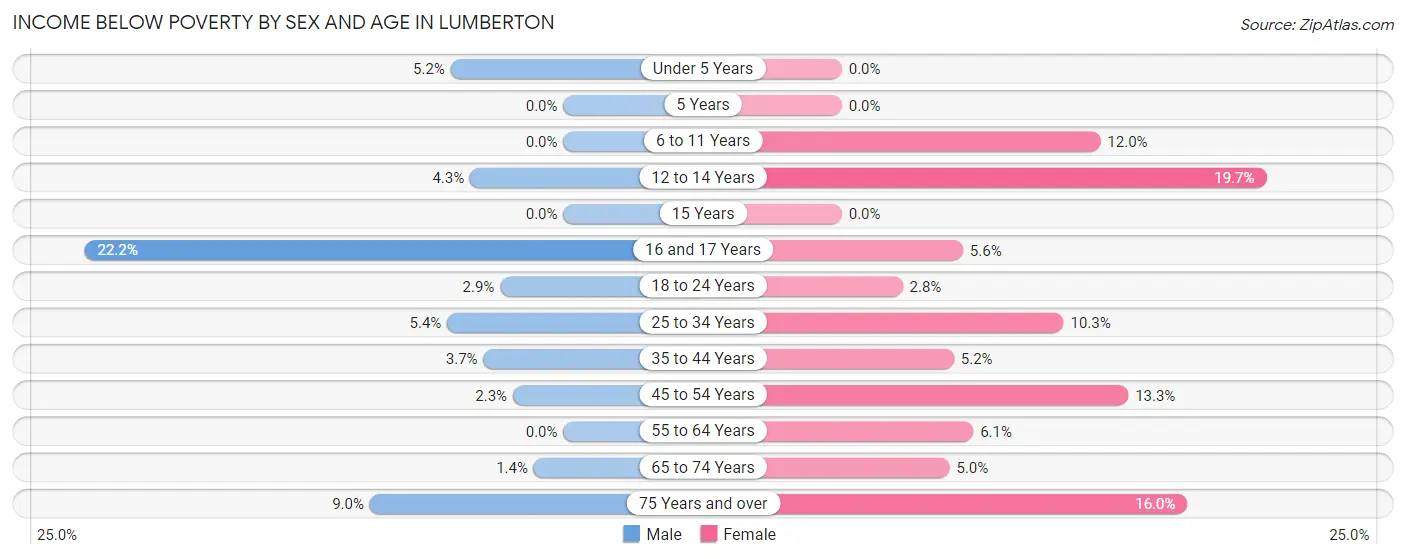
| Age Bracket | Male | Female |
| Under 5 Years | 15 (5.2%) | 0 (0.0%) |
| 5 Years | 0 (0.0%) | 0 (0.0%) |
| 6 to 11 Years | 0 (0.0%) | 48 (12.0%) |
| 12 to 14 Years | 11 (4.3%) | 40 (19.7%) |
| 15 Years | 0 (0.0%) | 0 (0.0%) |
| 16 and 17 Years | 12 (22.2%) | 5 (5.6%) |
| 18 to 24 Years | 12 (2.9%) | 14 (2.8%) |
| 25 to 34 Years | 47 (5.4%) | 97 (10.3%) |
| 35 to 44 Years | 37 (3.7%) | 48 (5.2%) |
| 45 to 54 Years | 20 (2.3%) | 134 (13.3%) |
| 55 to 64 Years | 0 (0.0%) | 50 (6.1%) |
| 65 to 74 Years | 12 (1.4%) | 42 (5.0%) |
| 75 Years and over | 30 (9.0%) | 105 (16.0%) |
| Total | 196 (3.0%) | 583 (8.4%) |
Income Above Poverty by Sex and Age in Lumberton
According to the poverty statistics in Lumberton, males aged 5 years and females aged under 5 years are the age groups that are most secure financially, with 100.0% of males and 100.0% of females in these age groups living above the poverty line.
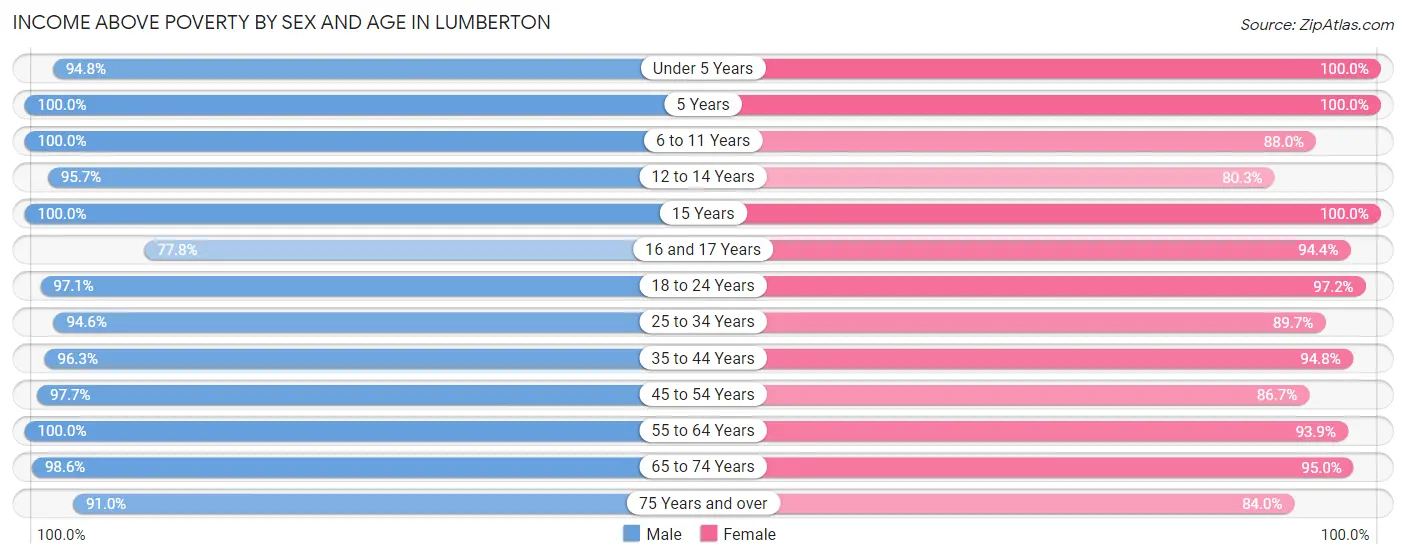
| Age Bracket | Male | Female |
| Under 5 Years | 272 (94.8%) | 303 (100.0%) |
| 5 Years | 129 (100.0%) | 120 (100.0%) |
| 6 to 11 Years | 721 (100.0%) | 352 (88.0%) |
| 12 to 14 Years | 243 (95.7%) | 163 (80.3%) |
| 15 Years | 79 (100.0%) | 181 (100.0%) |
| 16 and 17 Years | 42 (77.8%) | 84 (94.4%) |
| 18 to 24 Years | 398 (97.1%) | 483 (97.2%) |
| 25 to 34 Years | 825 (94.6%) | 846 (89.7%) |
| 35 to 44 Years | 961 (96.3%) | 875 (94.8%) |
| 45 to 54 Years | 834 (97.7%) | 874 (86.7%) |
| 55 to 64 Years | 640 (100.0%) | 770 (93.9%) |
| 65 to 74 Years | 861 (98.6%) | 798 (95.0%) |
| 75 Years and over | 304 (91.0%) | 550 (84.0%) |
| Total | 6,309 (97.0%) | 6,399 (91.6%) |
Income Below Poverty Among Married-Couple Families in Lumberton
The poverty statistics for married-couple families in Lumberton show that 0.4% or 12 of the total 3,224 families live below the poverty line. Families with no children have the highest poverty rate of 0.6%, comprising of 12 families. On the other hand, families with 1 or 2 children have the lowest poverty rate of 0.0%, which includes 0 families.
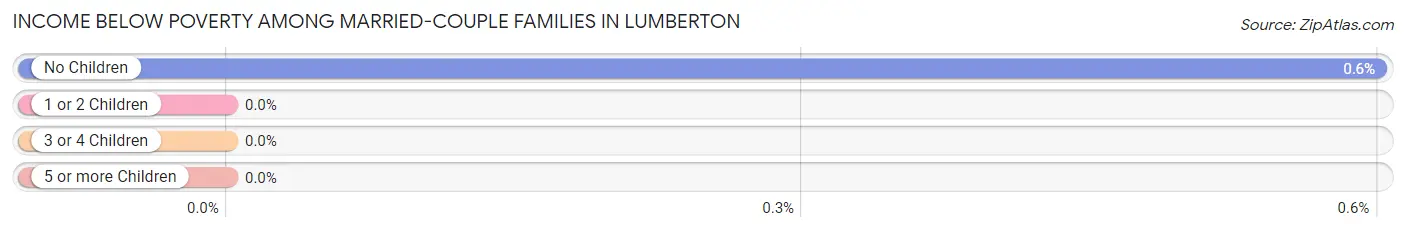
| Children | Above Poverty | Below Poverty |
| No Children | 1,988 (99.4%) | 12 (0.6%) |
| 1 or 2 Children | 1,038 (100.0%) | 0 (0.0%) |
| 3 or 4 Children | 186 (100.0%) | 0 (0.0%) |
| 5 or more Children | 0 (0.0%) | 0 (0.0%) |
| Total | 3,212 (99.6%) | 12 (0.4%) |
Income Below Poverty Among Single-Parent Households in Lumberton
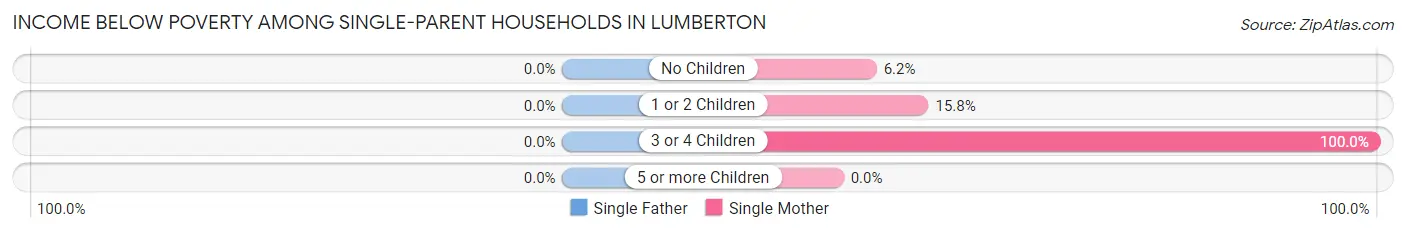
| Children | Single Father | Single Mother |
| No Children | 0 (0.0%) | 12 (6.1%) |
| 1 or 2 Children | 0 (0.0%) | 43 (15.8%) |
| 3 or 4 Children | 0 (0.0%) | 10 (100.0%) |
| 5 or more Children | 0 (0.0%) | 0 (0.0%) |
| Total | 0 (0.0%) | 65 (13.6%) |
Income Below Poverty Among Married-Couple vs Single-Parent Households in Lumberton
The poverty data for Lumberton shows that 12 of the married-couple family households (0.4%) and 65 of the single-parent households (8.8%) are living below the poverty level. Within the married-couple family households, those with no children have the highest poverty rate, with 12 households (0.6%) falling below the poverty line. Among the single-parent households, those with 3 or 4 children have the highest poverty rate, with 10 household (14.5%) living below poverty.
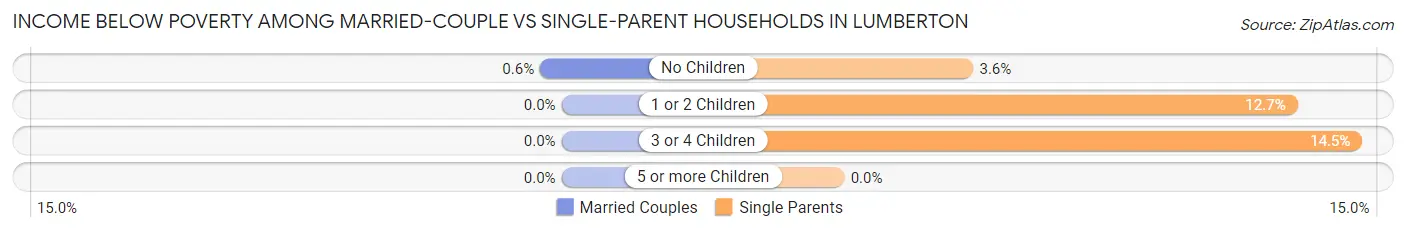
| Children | Married-Couple Families | Single-Parent Households |
| No Children | 12 (0.6%) | 12 (3.6%) |
| 1 or 2 Children | 0 (0.0%) | 43 (12.7%) |
| 3 or 4 Children | 0 (0.0%) | 10 (14.5%) |
| 5 or more Children | 0 (0.0%) | 0 (0.0%) |
| Total | 12 (0.4%) | 65 (8.8%) |
Race in Lumberton
The most populous races in Lumberton are White / Caucasian (12,916 | 94.9%), Hispanic or Latino (854 | 6.3%), and Two or more Races (464 | 3.4%).
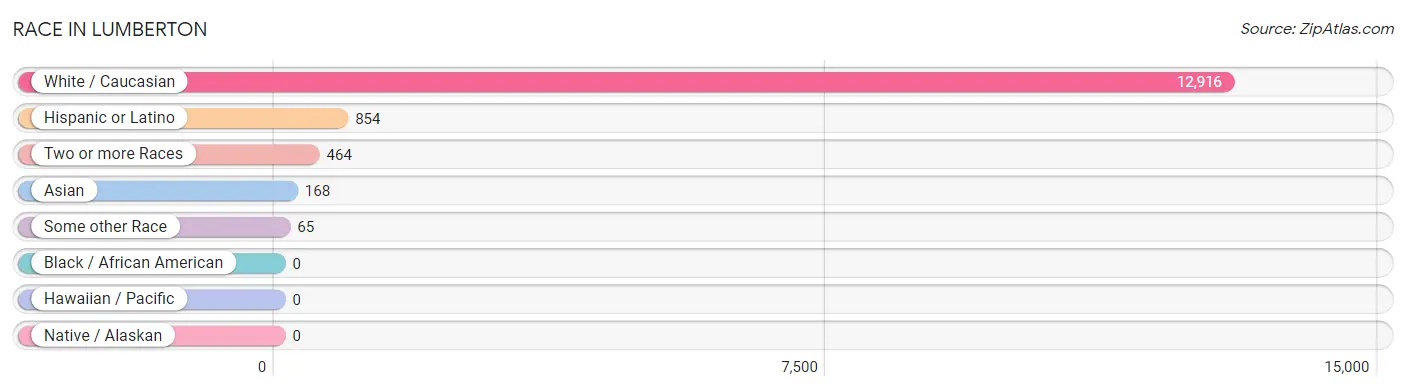
| Race | # Population | % Population |
| Asian | 168 | 1.2% |
| Black / African American | 0 | 0.0% |
| Hawaiian / Pacific | 0 | 0.0% |
| Hispanic or Latino | 854 | 6.3% |
| Native / Alaskan | 0 | 0.0% |
| White / Caucasian | 12,916 | 94.9% |
| Two or more Races | 464 | 3.4% |
| Some other Race | 65 | 0.5% |
| Total | 13,613 | 100.0% |
Ancestry in Lumberton
The most populous ancestries reported in Lumberton are American (1,644 | 12.1%), English (1,548 | 11.4%), German (1,520 | 11.2%), French (1,359 | 10.0%), and Irish (1,326 | 9.7%), together accounting for 54.3% of all Lumberton residents.
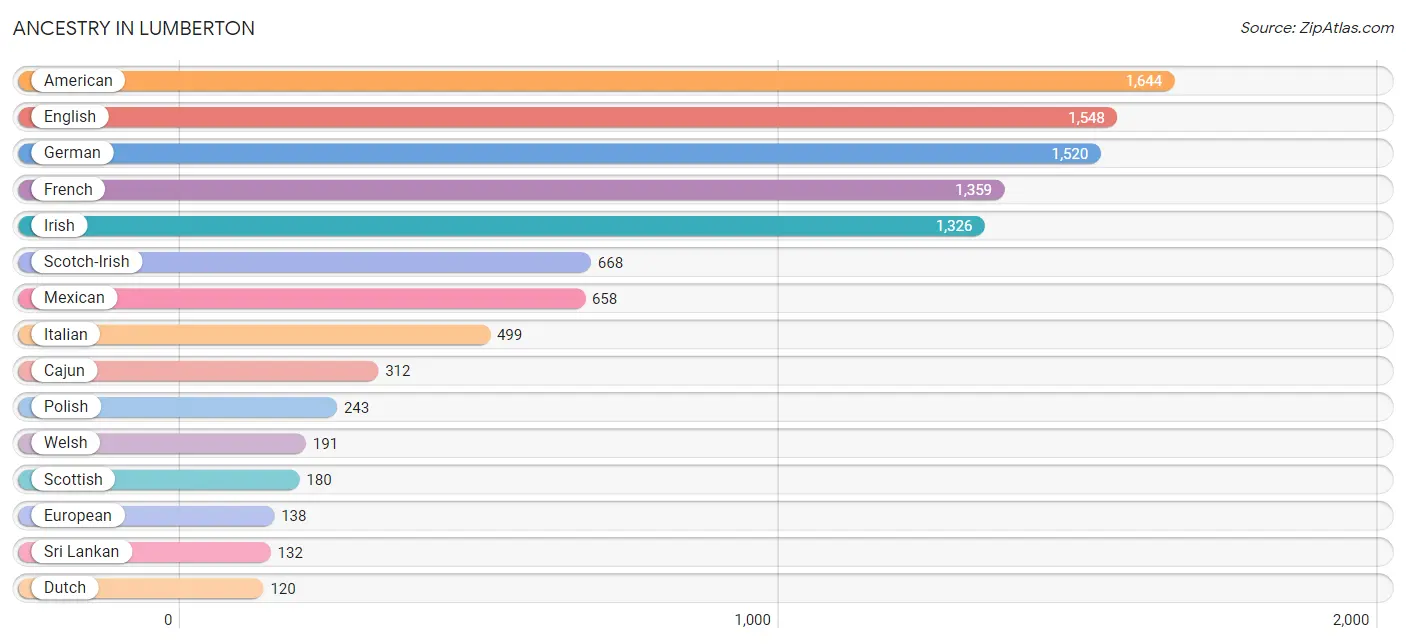
| Ancestry | # Population | % Population |
| American | 1,644 | 12.1% |
| Arab | 42 | 0.3% |
| Bhutanese | 55 | 0.4% |
| British | 67 | 0.5% |
| Burmese | 19 | 0.1% |
| Cajun | 312 | 2.3% |
| Canadian | 36 | 0.3% |
| Cherokee | 50 | 0.4% |
| Comanche | 15 | 0.1% |
| Cuban | 8 | 0.1% |
| Czech | 88 | 0.6% |
| Czechoslovakian | 22 | 0.2% |
| Danish | 79 | 0.6% |
| Dutch | 120 | 0.9% |
| Eastern European | 31 | 0.2% |
| Egyptian | 42 | 0.3% |
| English | 1,548 | 11.4% |
| European | 138 | 1.0% |
| French | 1,359 | 10.0% |
| French Canadian | 60 | 0.4% |
| German | 1,520 | 11.2% |
| Hungarian | 23 | 0.2% |
| Indian (Asian) | 71 | 0.5% |
| Irish | 1,326 | 9.7% |
| Italian | 499 | 3.7% |
| Korean | 14 | 0.1% |
| Mexican | 658 | 4.8% |
| Navajo | 25 | 0.2% |
| Norwegian | 9 | 0.1% |
| Peruvian | 13 | 0.1% |
| Polish | 243 | 1.8% |
| Puerto Rican | 90 | 0.7% |
| Russian | 86 | 0.6% |
| Scandinavian | 21 | 0.2% |
| Scotch-Irish | 668 | 4.9% |
| Scottish | 180 | 1.3% |
| South American | 13 | 0.1% |
| Sri Lankan | 132 | 1.0% |
| Swedish | 25 | 0.2% |
| Swiss | 6 | 0.0% |
| Thai | 29 | 0.2% |
| Welsh | 191 | 1.4% |
| Yugoslavian | 16 | 0.1% | View All 43 Rows |
Immigrants in Lumberton
The most numerous immigrant groups reported in Lumberton came from Latin America (160 | 1.2%), Central America (153 | 1.1%), Mexico (153 | 1.1%), Europe (65 | 0.5%), and Asia (64 | 0.5%), together accounting for 4.4% of all Lumberton residents.
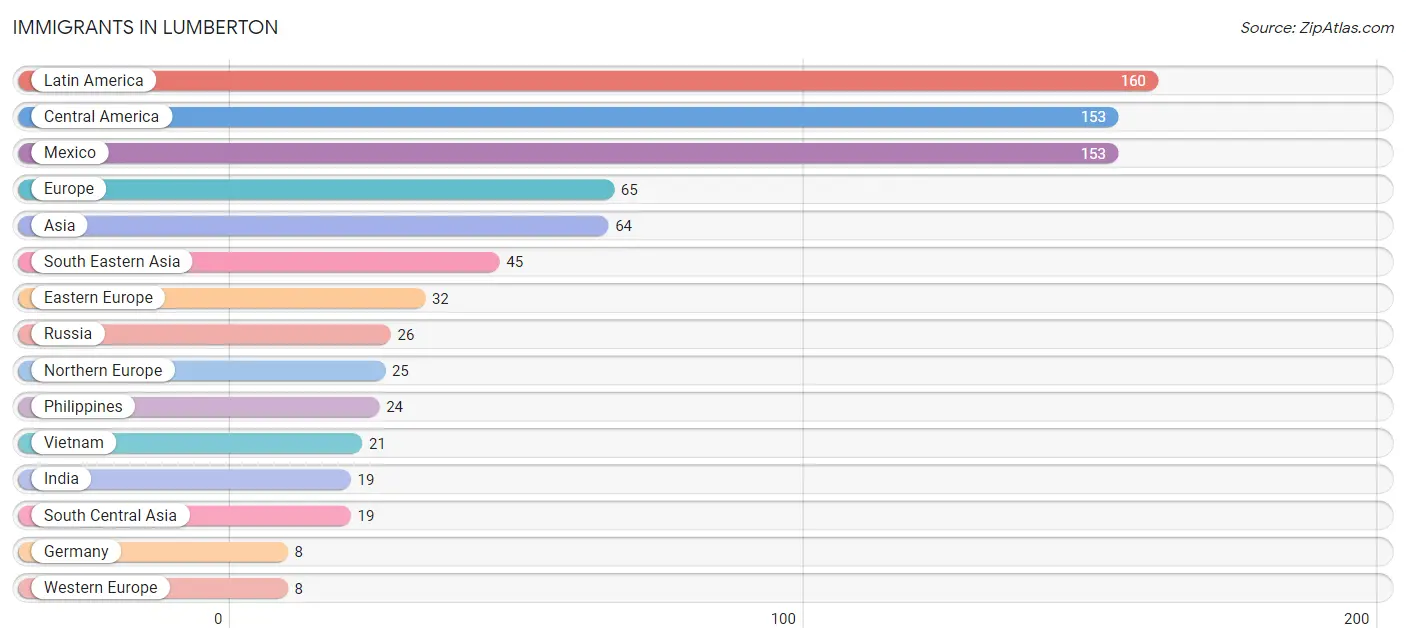
| Immigration Origin | # Population | % Population |
| Asia | 64 | 0.5% |
| Central America | 153 | 1.1% |
| Eastern Europe | 32 | 0.2% |
| Europe | 65 | 0.5% |
| Germany | 8 | 0.1% |
| India | 19 | 0.1% |
| Latin America | 160 | 1.2% |
| Mexico | 153 | 1.1% |
| Northern Europe | 25 | 0.2% |
| Peru | 7 | 0.1% |
| Philippines | 24 | 0.2% |
| Poland | 6 | 0.0% |
| Russia | 26 | 0.2% |
| South America | 7 | 0.1% |
| South Central Asia | 19 | 0.1% |
| South Eastern Asia | 45 | 0.3% |
| Vietnam | 21 | 0.2% |
| Western Europe | 8 | 0.1% | View All 18 Rows |
Sex and Age in Lumberton
Sex and Age in Lumberton
The most populous age groups in Lumberton are 65 to 69 Years (670 | 10.2%) for men and 45 to 49 Years (544 | 7.7%) for women.
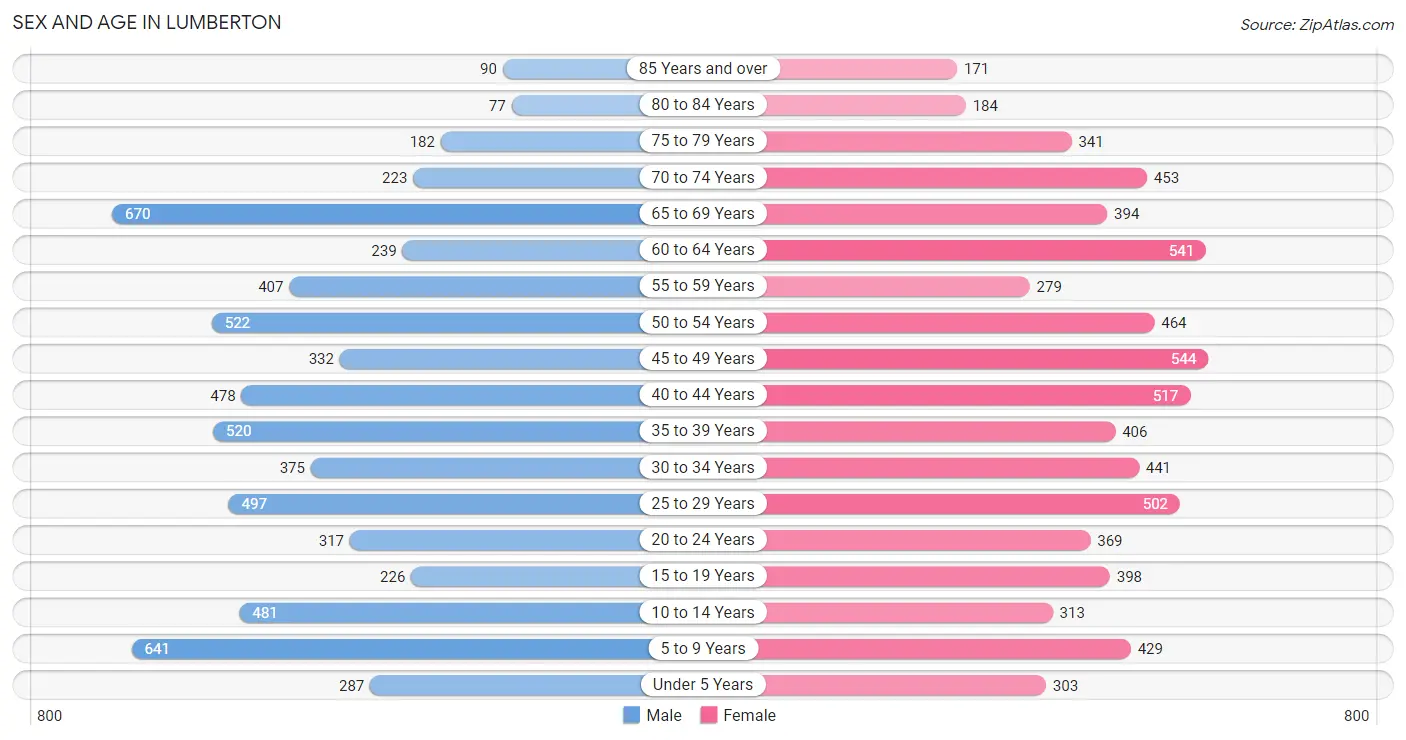
| Age Bracket | Male | Female |
| Under 5 Years | 287 (4.4%) | 303 (4.3%) |
| 5 to 9 Years | 641 (9.8%) | 429 (6.1%) |
| 10 to 14 Years | 481 (7.3%) | 313 (4.4%) |
| 15 to 19 Years | 226 (3.4%) | 398 (5.7%) |
| 20 to 24 Years | 317 (4.8%) | 369 (5.2%) |
| 25 to 29 Years | 497 (7.6%) | 502 (7.1%) |
| 30 to 34 Years | 375 (5.7%) | 441 (6.3%) |
| 35 to 39 Years | 520 (7.9%) | 406 (5.8%) |
| 40 to 44 Years | 478 (7.3%) | 517 (7.3%) |
| 45 to 49 Years | 332 (5.1%) | 544 (7.7%) |
| 50 to 54 Years | 522 (8.0%) | 464 (6.6%) |
| 55 to 59 Years | 407 (6.2%) | 279 (4.0%) |
| 60 to 64 Years | 239 (3.6%) | 541 (7.7%) |
| 65 to 69 Years | 670 (10.2%) | 394 (5.6%) |
| 70 to 74 Years | 223 (3.4%) | 453 (6.4%) |
| 75 to 79 Years | 182 (2.8%) | 341 (4.8%) |
| 80 to 84 Years | 77 (1.2%) | 184 (2.6%) |
| 85 Years and over | 90 (1.4%) | 171 (2.4%) |
| Total | 6,564 (100.0%) | 7,049 (100.0%) |
Families and Households in Lumberton
Median Family Size in Lumberton
The median family size in Lumberton is 2.91 persons per family, with single female/mother families (477 | 12.0%) accounting for the largest median family size of 3.1 persons per family. On the other hand, single male/father families (264 | 6.7%) represent the smallest median family size with 2.71 persons per family.
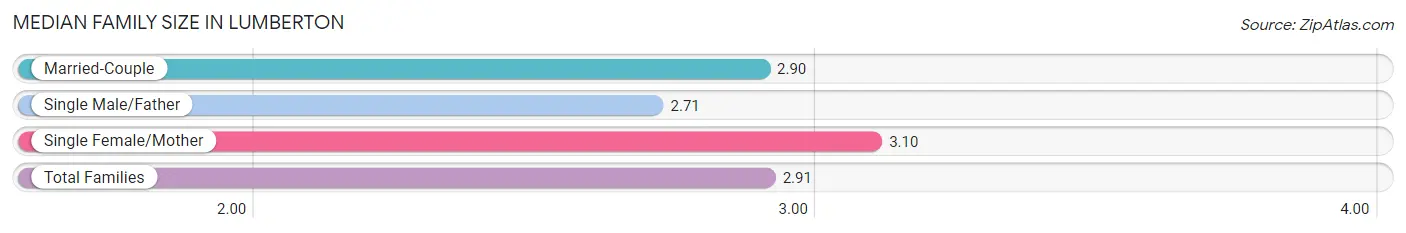
| Family Type | # Families | Family Size |
| Married-Couple | 3,224 (81.3%) | 2.90 |
| Single Male/Father | 264 (6.7%) | 2.71 |
| Single Female/Mother | 477 (12.0%) | 3.10 |
| Total Families | 3,965 (100.0%) | 2.91 |
Median Household Size in Lumberton
The median household size in Lumberton is 2.55 persons per household, with single male/father households (264 | 5.0%) accounting for the largest median household size of 3.32 persons per household. non-family households (1,348 | 25.4%) represent the smallest median household size with 1.35 persons per household.
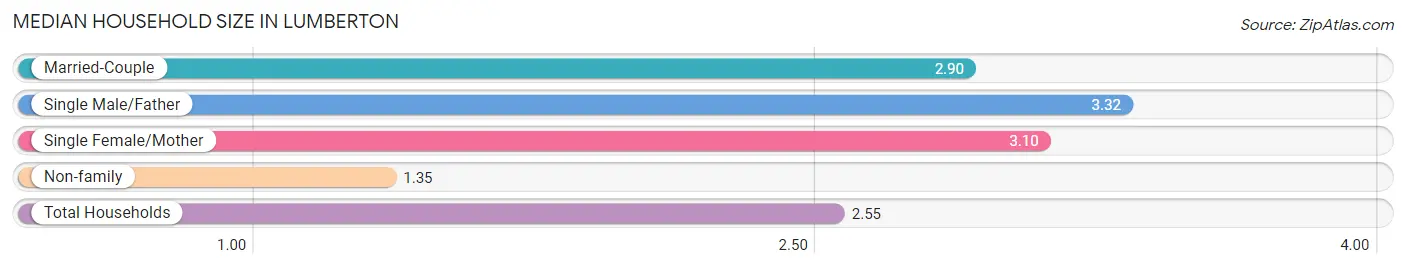
| Household Type | # Households | Household Size |
| Married-Couple | 3,224 (60.7%) | 2.90 |
| Single Male/Father | 264 (5.0%) | 3.32 |
| Single Female/Mother | 477 (9.0%) | 3.10 |
| Non-family | 1,348 (25.4%) | 1.35 |
| Total Households | 5,313 (100.0%) | 2.55 |
Household Size by Marriage Status in Lumberton
Out of a total of 5,313 households in Lumberton, 3,965 (74.6%) are family households, while 1,348 (25.4%) are nonfamily households. The most numerous type of family households are 2-person households, comprising 1,959, and the most common type of nonfamily households are 1-person households, comprising 1,151.
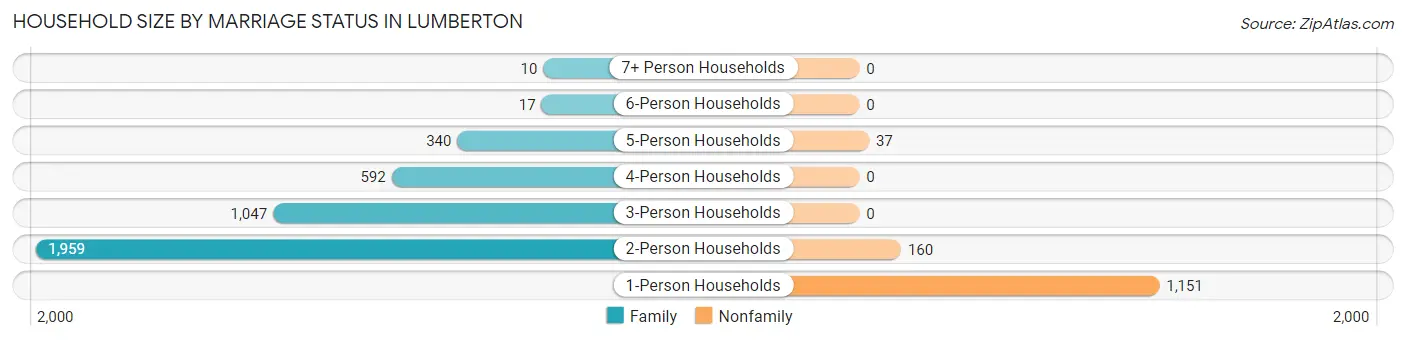
| Household Size | Family Households | Nonfamily Households |
| 1-Person Households | - | 1,151 (21.7%) |
| 2-Person Households | 1,959 (36.9%) | 160 (3.0%) |
| 3-Person Households | 1,047 (19.7%) | 0 (0.0%) |
| 4-Person Households | 592 (11.1%) | 0 (0.0%) |
| 5-Person Households | 340 (6.4%) | 37 (0.7%) |
| 6-Person Households | 17 (0.3%) | 0 (0.0%) |
| 7+ Person Households | 10 (0.2%) | 0 (0.0%) |
| Total | 3,965 (74.6%) | 1,348 (25.4%) |
Female Fertility in Lumberton
Fertility by Age in Lumberton
Average fertility rate in Lumberton is 45.0 births per 1,000 women. Women in the age bracket of 20 to 34 years have the highest fertility rate with 84.0 births per 1,000 women. Women in the age bracket of 20 to 34 years acount for 76.9% of all women with births.
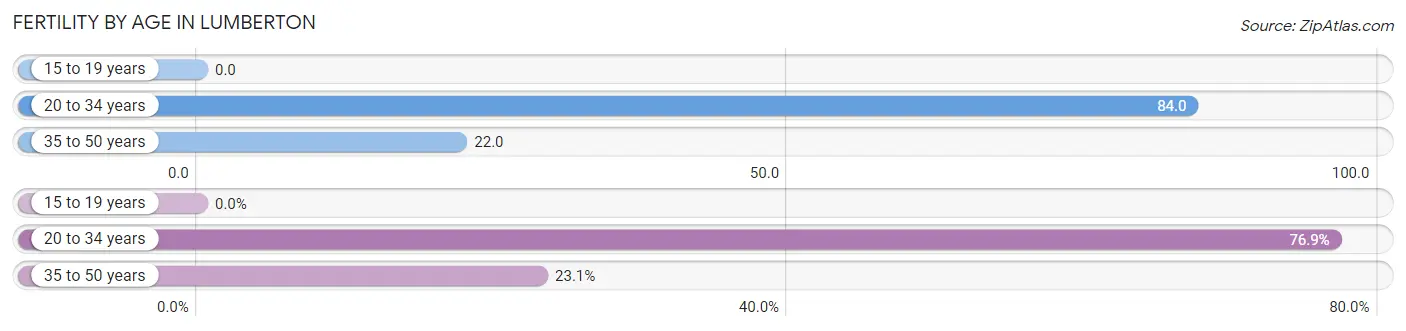
| Age Bracket | Women with Births | Births / 1,000 Women |
| 15 to 19 years | 0 (0.0%) | 0.0 |
| 20 to 34 years | 110 (76.9%) | 84.0 |
| 35 to 50 years | 33 (23.1%) | 22.0 |
| Total | 143 (100.0%) | 45.0 |
Fertility by Age by Marriage Status in Lumberton
71.3% of women with births (143) in Lumberton are married. The highest percentage of unmarried women with births falls into 35 to 50 years age bracket with 78.8% of them unmarried at the time of birth, while the lowest percentage of unmarried women with births belong to 20 to 34 years age bracket with 13.6% of them unmarried.
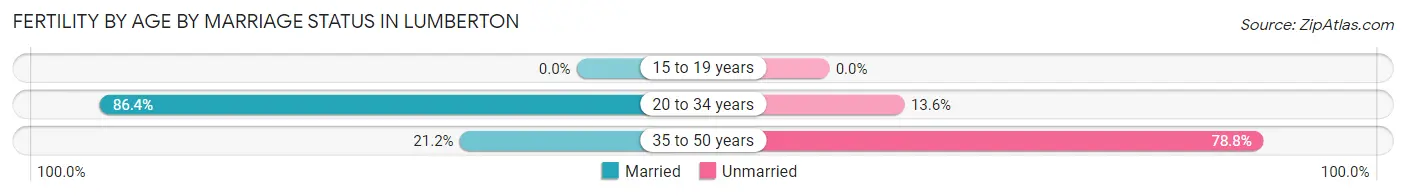
| Age Bracket | Married | Unmarried |
| 15 to 19 years | 0 (0.0%) | 0 (0.0%) |
| 20 to 34 years | 95 (86.4%) | 15 (13.6%) |
| 35 to 50 years | 7 (21.2%) | 26 (78.8%) |
| Total | 102 (71.3%) | 41 (28.7%) |
Fertility by Education in Lumberton
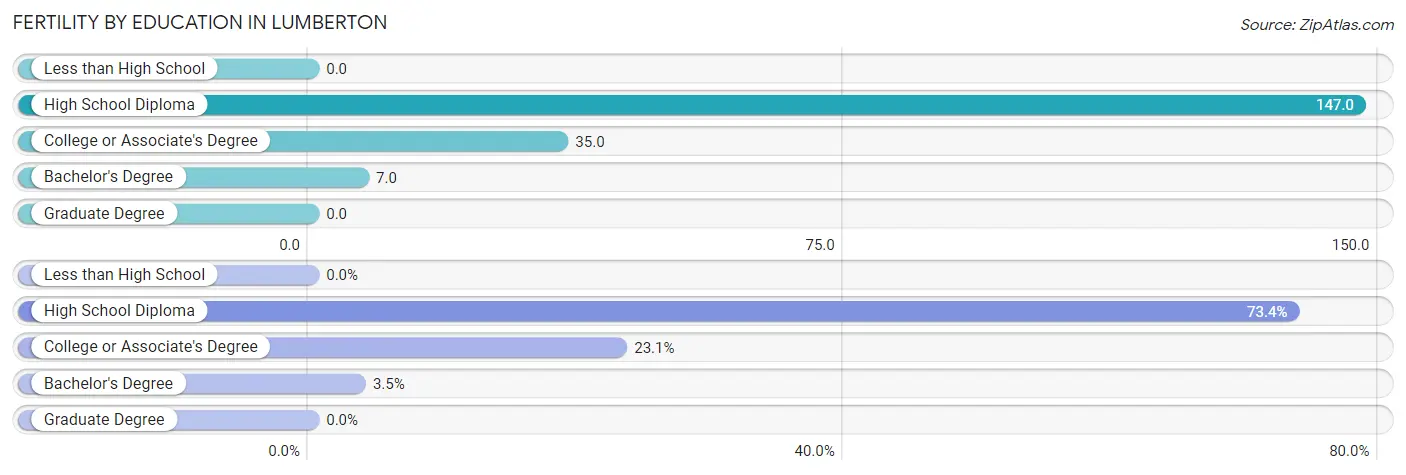
| Educational Attainment | Women with Births | Births / 1,000 Women |
| Less than High School | 0 (0.0%) | 0.0 |
| High School Diploma | 105 (73.4%) | 147.0 |
| College or Associate's Degree | 33 (23.1%) | 35.0 |
| Bachelor's Degree | 5 (3.5%) | 7.0 |
| Graduate Degree | 0 (0.0%) | 0.0 |
| Total | 143 (100.0%) | 45.0 |
Fertility by Education by Marriage Status in Lumberton
28.7% of women with births in Lumberton are unmarried. Women with the educational attainment of bachelor's degree are most likely to be married with 100.0% of them married at childbirth, while women with the educational attainment of college or associate's degree are least likely to be married with 78.8% of them unmarried at childbirth.
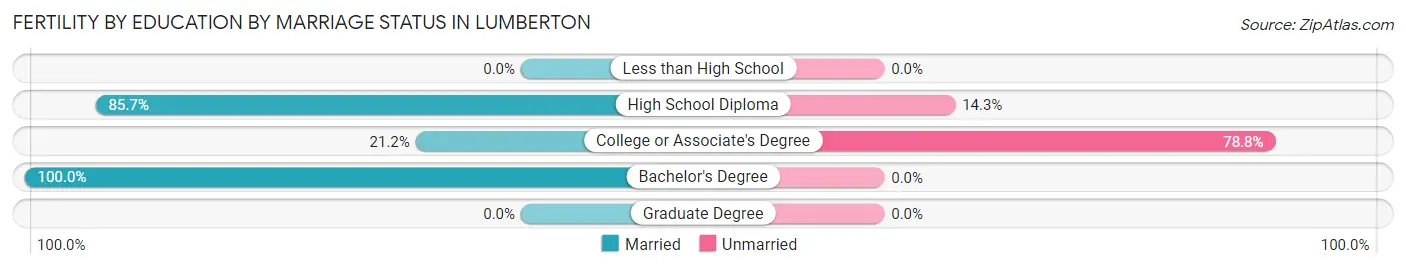
| Educational Attainment | Married | Unmarried |
| Less than High School | 0 (0.0%) | 0 (0.0%) |
| High School Diploma | 90 (85.7%) | 15 (14.3%) |
| College or Associate's Degree | 7 (21.2%) | 26 (78.8%) |
| Bachelor's Degree | 5 (100.0%) | 0 (0.0%) |
| Graduate Degree | 0 (0.0%) | 0 (0.0%) |
| Total | 102 (71.3%) | 41 (28.7%) |
Employment Characteristics in Lumberton
Employment by Class of Employer in Lumberton
Among the 6,470 employed individuals in Lumberton, private company employees (5,105 | 78.9%), local government employees (515 | 8.0%), and self-employed (not incorporated) (229 | 3.5%) make up the most common classes of employment.
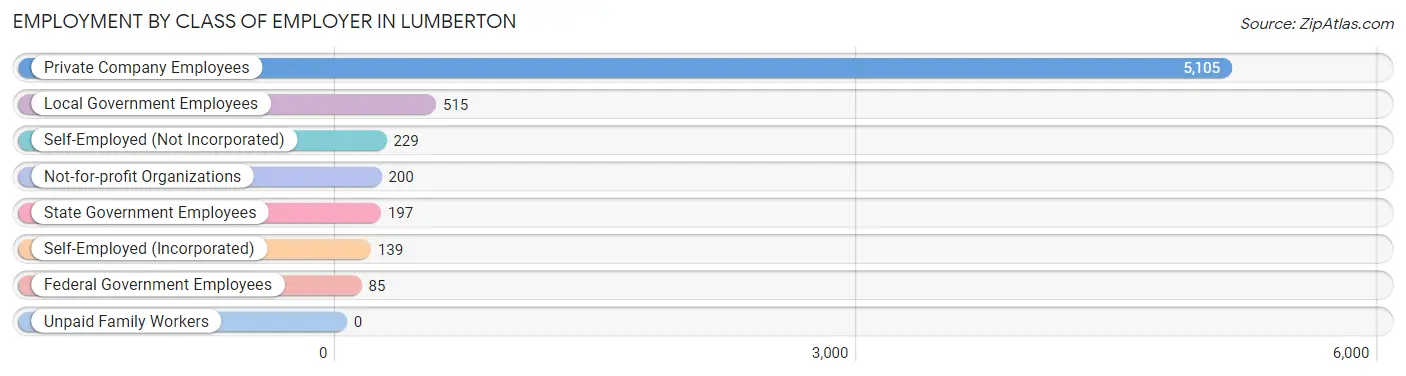
| Employer Class | # Employees | % Employees |
| Private Company Employees | 5,105 | 78.9% |
| Self-Employed (Incorporated) | 139 | 2.1% |
| Self-Employed (Not Incorporated) | 229 | 3.5% |
| Not-for-profit Organizations | 200 | 3.1% |
| Local Government Employees | 515 | 8.0% |
| State Government Employees | 197 | 3.0% |
| Federal Government Employees | 85 | 1.3% |
| Unpaid Family Workers | 0 | 0.0% |
| Total | 6,470 | 100.0% |
Employment Status by Age in Lumberton
According to the labor force statistics for Lumberton, out of the total population over 16 years of age (10,899), 61.9% or 6,746 individuals are in the labor force, with 3.5% or 236 of them unemployed. The age group with the highest labor force participation rate is 20 to 24 years, with 91.8% or 630 individuals in the labor force. Within the labor force, the 20 to 24 years age range has the highest percentage of unemployed individuals, with 15.7% or 99 of them being unemployed.
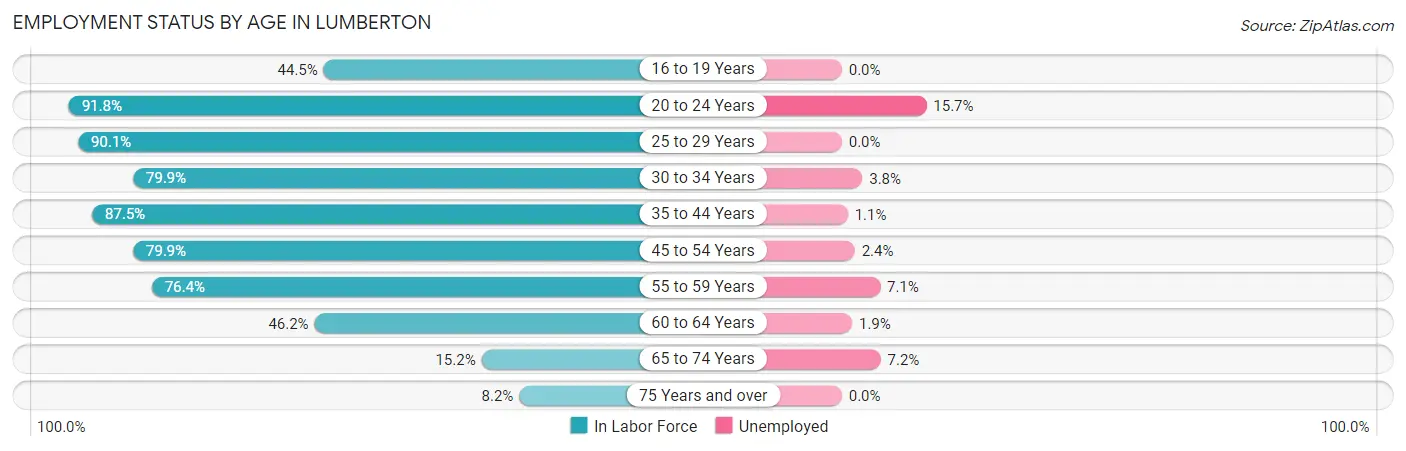
| Age Bracket | In Labor Force | Unemployed |
| 16 to 19 Years | 162 (44.5%) | 0 (0.0%) |
| 20 to 24 Years | 630 (91.8%) | 99 (15.7%) |
| 25 to 29 Years | 900 (90.1%) | 0 (0.0%) |
| 30 to 34 Years | 652 (79.9%) | 25 (3.8%) |
| 35 to 44 Years | 1,681 (87.5%) | 18 (1.1%) |
| 45 to 54 Years | 1,488 (79.9%) | 36 (2.4%) |
| 55 to 59 Years | 524 (76.4%) | 37 (7.1%) |
| 60 to 64 Years | 360 (46.2%) | 7 (1.9%) |
| 65 to 74 Years | 264 (15.2%) | 19 (7.2%) |
| 75 Years and over | 86 (8.2%) | 0 (0.0%) |
| Total | 6,746 (61.9%) | 236 (3.5%) |
Employment Status by Educational Attainment in Lumberton
According to labor force statistics for Lumberton, 79.3% of individuals (5,602) out of the total population between 25 and 64 years of age (7,064) are in the labor force, with 2.2% or 123 of them being unemployed. The group with the highest labor force participation rate are those with the educational attainment of bachelor's degree or higher, with 87.4% or 1,652 individuals in the labor force. Within the labor force, individuals with less than high school education have the highest percentage of unemployment, with 21.4% or 51 of them being unemployed.
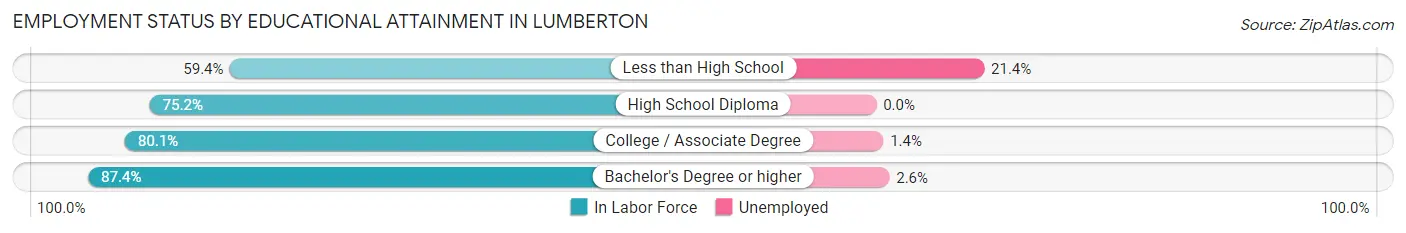
| Educational Attainment | In Labor Force | Unemployed |
| Less than High School | 238 (59.4%) | 86 (21.4%) |
| High School Diploma | 1,672 (75.2%) | 0 (0.0%) |
| College / Associate Degree | 2,042 (80.1%) | 36 (1.4%) |
| Bachelor's Degree or higher | 1,652 (87.4%) | 49 (2.6%) |
| Total | 5,602 (79.3%) | 155 (2.2%) |
Employment Occupations by Sex in Lumberton
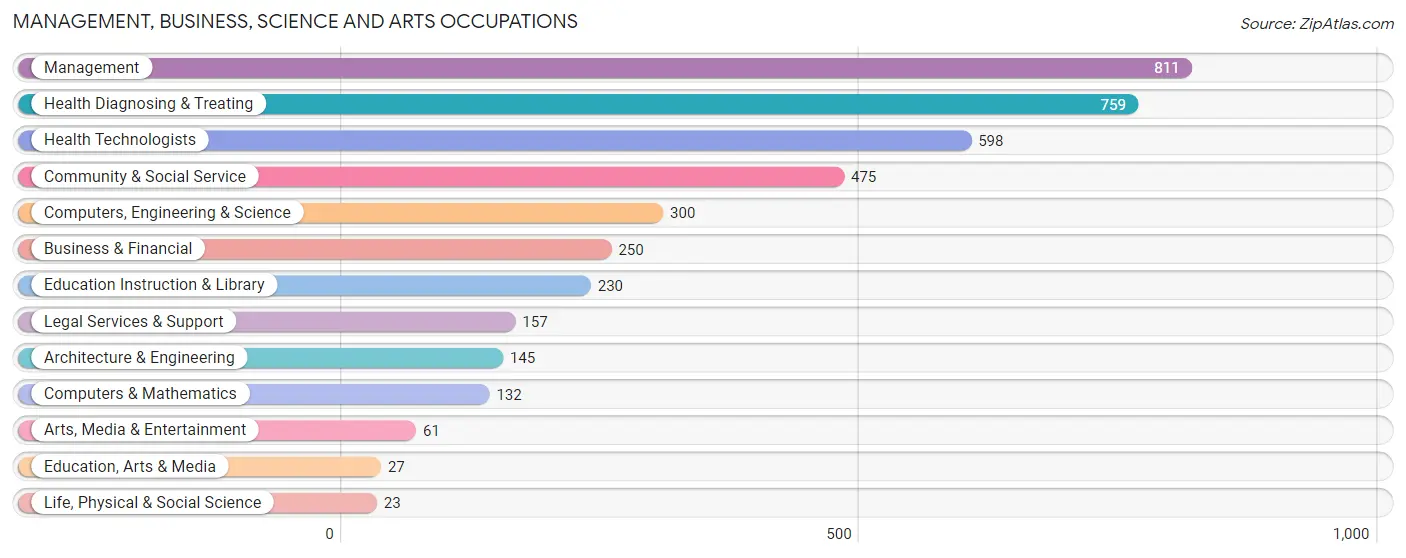
Management, Business, Science and Arts Occupations
The most common Management, Business, Science and Arts occupations in Lumberton are Management (811 | 12.5%), Health Diagnosing & Treating (759 | 11.7%), Health Technologists (598 | 9.2%), Community & Social Service (475 | 7.3%), and Computers, Engineering & Science (300 | 4.6%).
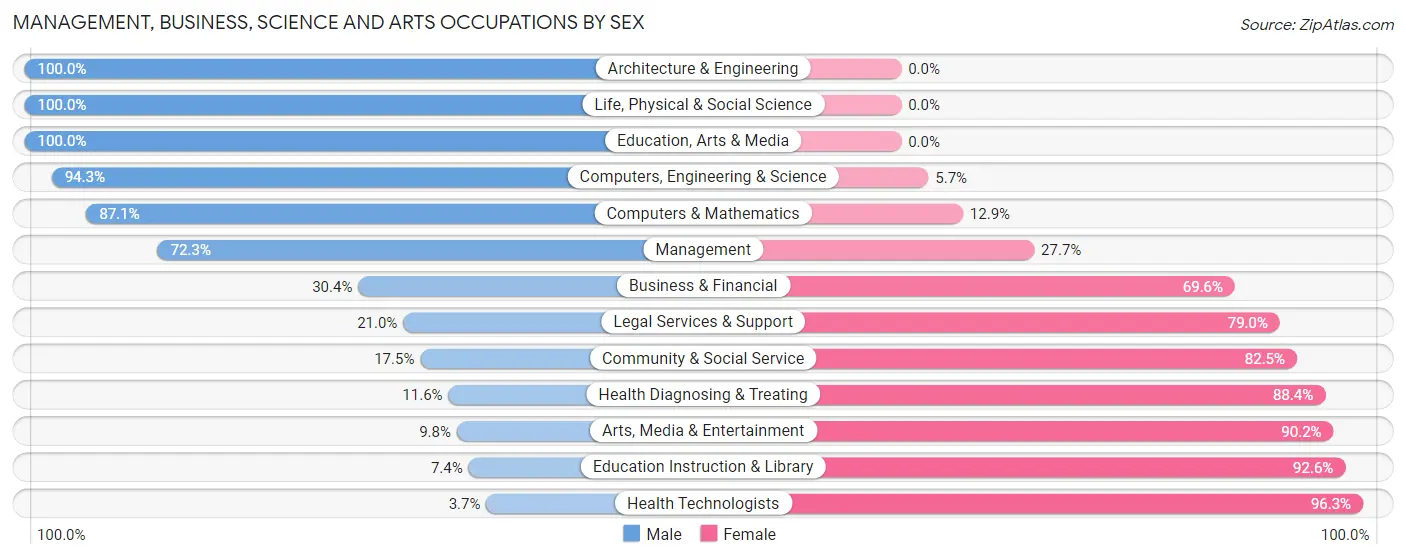
Management, Business, Science and Arts Occupations by Sex
Within the Management, Business, Science and Arts occupations in Lumberton, the most male-oriented occupations are Architecture & Engineering (100.0%), Life, Physical & Social Science (100.0%), and Education, Arts & Media (100.0%), while the most female-oriented occupations are Health Technologists (96.3%), Education Instruction & Library (92.6%), and Arts, Media & Entertainment (90.2%).
| Occupation | Male | Female |
| Management | 586 (72.3%) | 225 (27.7%) |
| Business & Financial | 76 (30.4%) | 174 (69.6%) |
| Computers, Engineering & Science | 283 (94.3%) | 17 (5.7%) |
| Computers & Mathematics | 115 (87.1%) | 17 (12.9%) |
| Architecture & Engineering | 145 (100.0%) | 0 (0.0%) |
| Life, Physical & Social Science | 23 (100.0%) | 0 (0.0%) |
| Community & Social Service | 83 (17.5%) | 392 (82.5%) |
| Education, Arts & Media | 27 (100.0%) | 0 (0.0%) |
| Legal Services & Support | 33 (21.0%) | 124 (79.0%) |
| Education Instruction & Library | 17 (7.4%) | 213 (92.6%) |
| Arts, Media & Entertainment | 6 (9.8%) | 55 (90.2%) |
| Health Diagnosing & Treating | 88 (11.6%) | 671 (88.4%) |
| Health Technologists | 22 (3.7%) | 576 (96.3%) |
| Total (Category) | 1,116 (43.0%) | 1,479 (57.0%) |
| Total (Overall) | 3,552 (54.8%) | 2,927 (45.2%) |
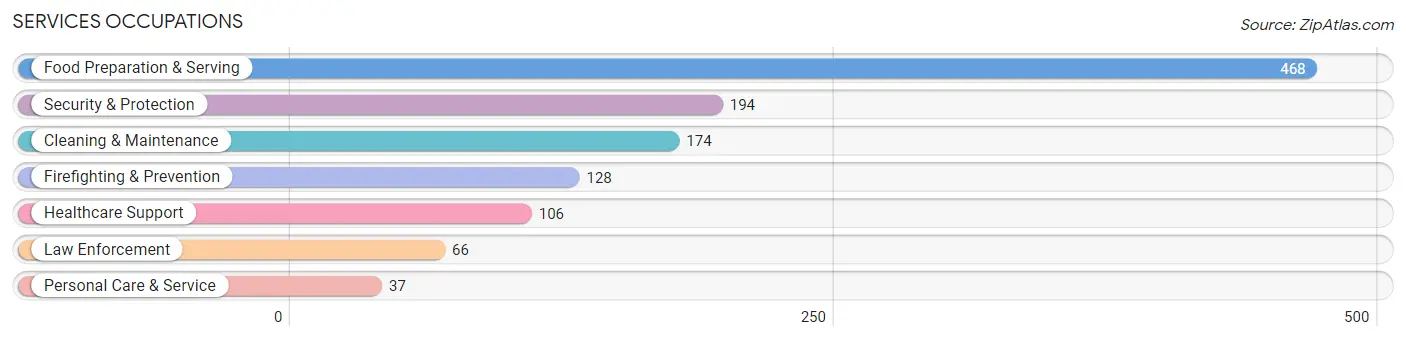
Services Occupations
The most common Services occupations in Lumberton are Food Preparation & Serving (468 | 7.2%), Security & Protection (194 | 3.0%), Cleaning & Maintenance (174 | 2.7%), Firefighting & Prevention (128 | 2.0%), and Healthcare Support (106 | 1.6%).
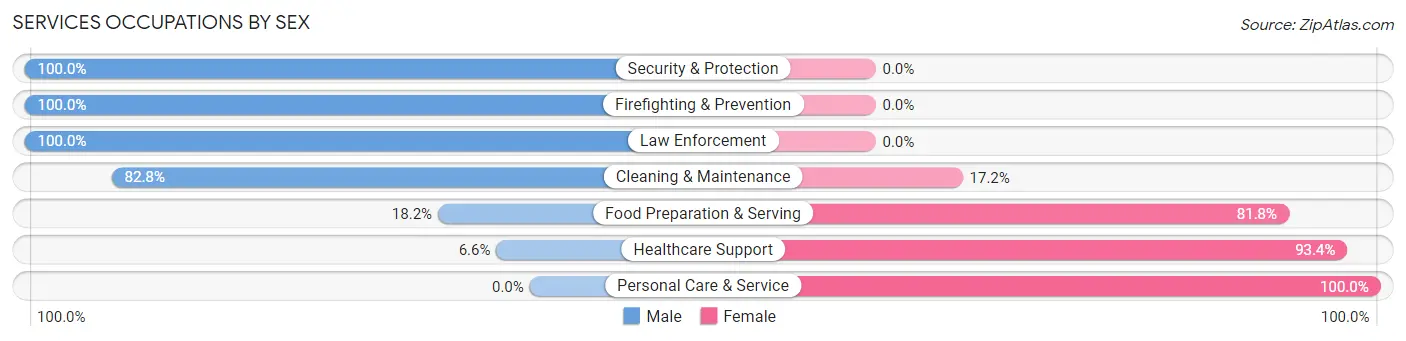
Services Occupations by Sex
Within the Services occupations in Lumberton, the most male-oriented occupations are Security & Protection (100.0%), Firefighting & Prevention (100.0%), and Law Enforcement (100.0%), while the most female-oriented occupations are Personal Care & Service (100.0%), Healthcare Support (93.4%), and Food Preparation & Serving (81.8%).
| Occupation | Male | Female |
| Healthcare Support | 7 (6.6%) | 99 (93.4%) |
| Security & Protection | 194 (100.0%) | 0 (0.0%) |
| Firefighting & Prevention | 128 (100.0%) | 0 (0.0%) |
| Law Enforcement | 66 (100.0%) | 0 (0.0%) |
| Food Preparation & Serving | 85 (18.2%) | 383 (81.8%) |
| Cleaning & Maintenance | 144 (82.8%) | 30 (17.2%) |
| Personal Care & Service | 0 (0.0%) | 37 (100.0%) |
| Total (Category) | 430 (43.9%) | 549 (56.1%) |
| Total (Overall) | 3,552 (54.8%) | 2,927 (45.2%) |
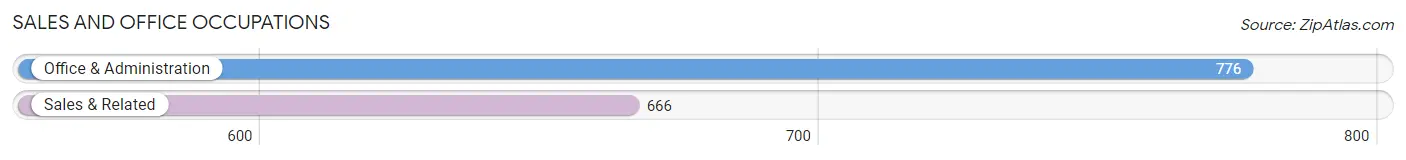
Sales and Office Occupations
The most common Sales and Office occupations in Lumberton are Office & Administration (776 | 12.0%), and Sales & Related (666 | 10.3%).
Sales and Office Occupations by Sex
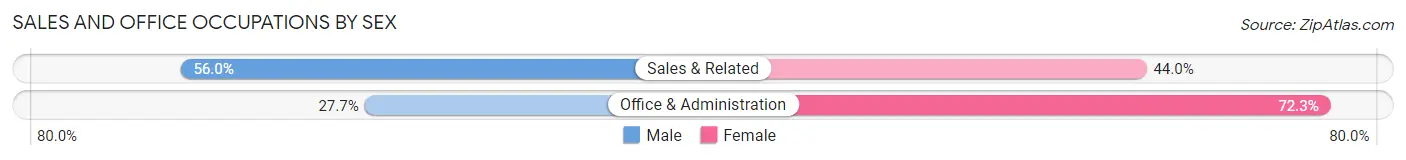
| Occupation | Male | Female |
| Sales & Related | 373 (56.0%) | 293 (44.0%) |
| Office & Administration | 215 (27.7%) | 561 (72.3%) |
| Total (Category) | 588 (40.8%) | 854 (59.2%) |
| Total (Overall) | 3,552 (54.8%) | 2,927 (45.2%) |
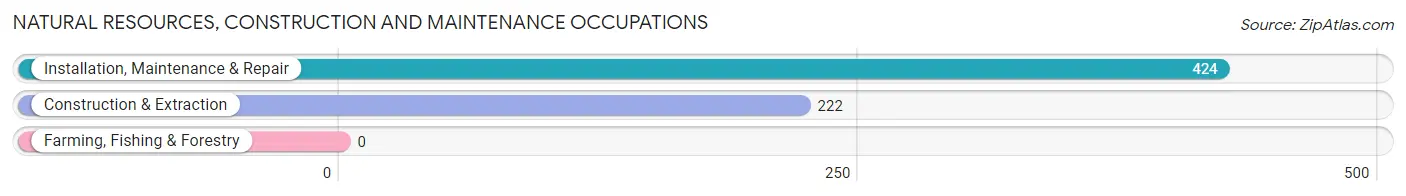
Natural Resources, Construction and Maintenance Occupations
The most common Natural Resources, Construction and Maintenance occupations in Lumberton are Installation, Maintenance & Repair (424 | 6.5%), and Construction & Extraction (222 | 3.4%).
Natural Resources, Construction and Maintenance Occupations by Sex
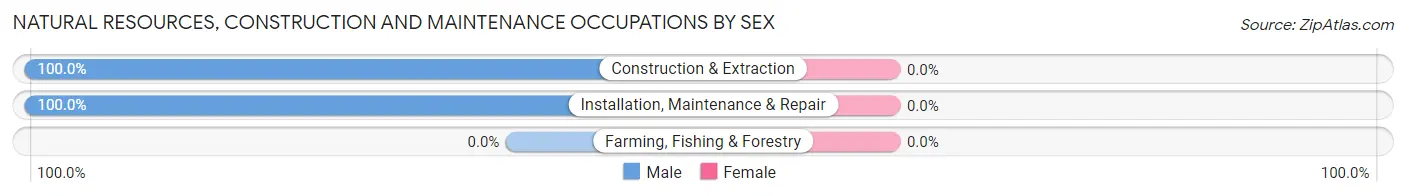
| Occupation | Male | Female |
| Farming, Fishing & Forestry | 0 (0.0%) | 0 (0.0%) |
| Construction & Extraction | 222 (100.0%) | 0 (0.0%) |
| Installation, Maintenance & Repair | 424 (100.0%) | 0 (0.0%) |
| Total (Category) | 646 (100.0%) | 0 (0.0%) |
| Total (Overall) | 3,552 (54.8%) | 2,927 (45.2%) |
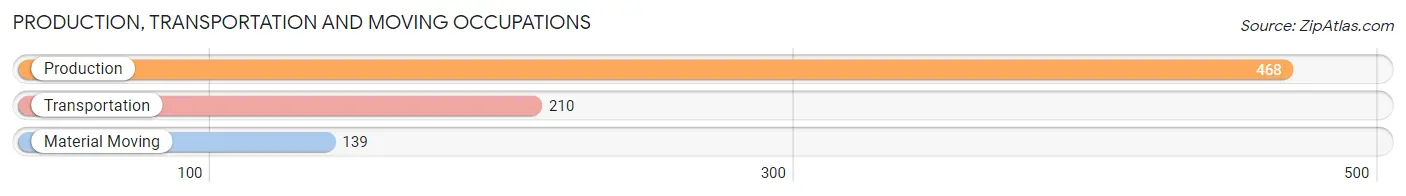
Production, Transportation and Moving Occupations
The most common Production, Transportation and Moving occupations in Lumberton are Production (468 | 7.2%), Transportation (210 | 3.2%), and Material Moving (139 | 2.1%).
Production, Transportation and Moving Occupations by Sex
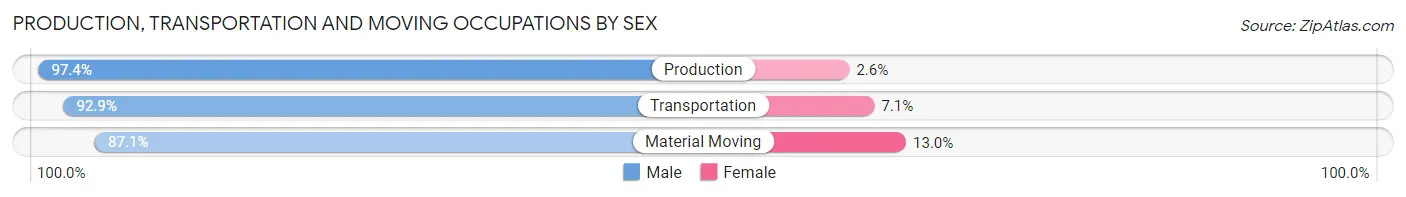
| Occupation | Male | Female |
| Production | 456 (97.4%) | 12 (2.6%) |
| Transportation | 195 (92.9%) | 15 (7.1%) |
| Material Moving | 121 (87.1%) | 18 (13.0%) |
| Total (Category) | 772 (94.5%) | 45 (5.5%) |
| Total (Overall) | 3,552 (54.8%) | 2,927 (45.2%) |
Employment Industries by Sex in Lumberton
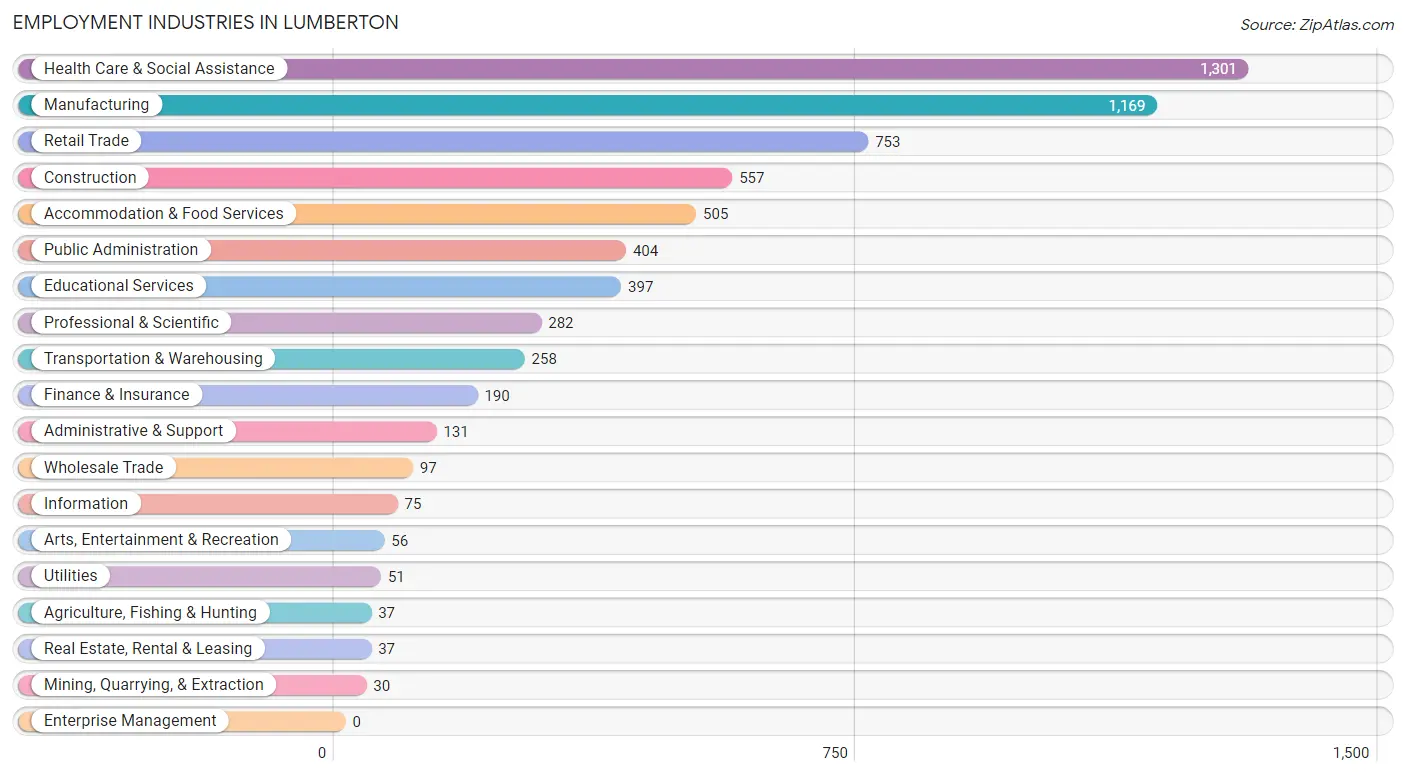
Employment Industries in Lumberton
The major employment industries in Lumberton include Health Care & Social Assistance (1,301 | 20.1%), Manufacturing (1,169 | 18.0%), Retail Trade (753 | 11.6%), Construction (557 | 8.6%), and Accommodation & Food Services (505 | 7.8%).
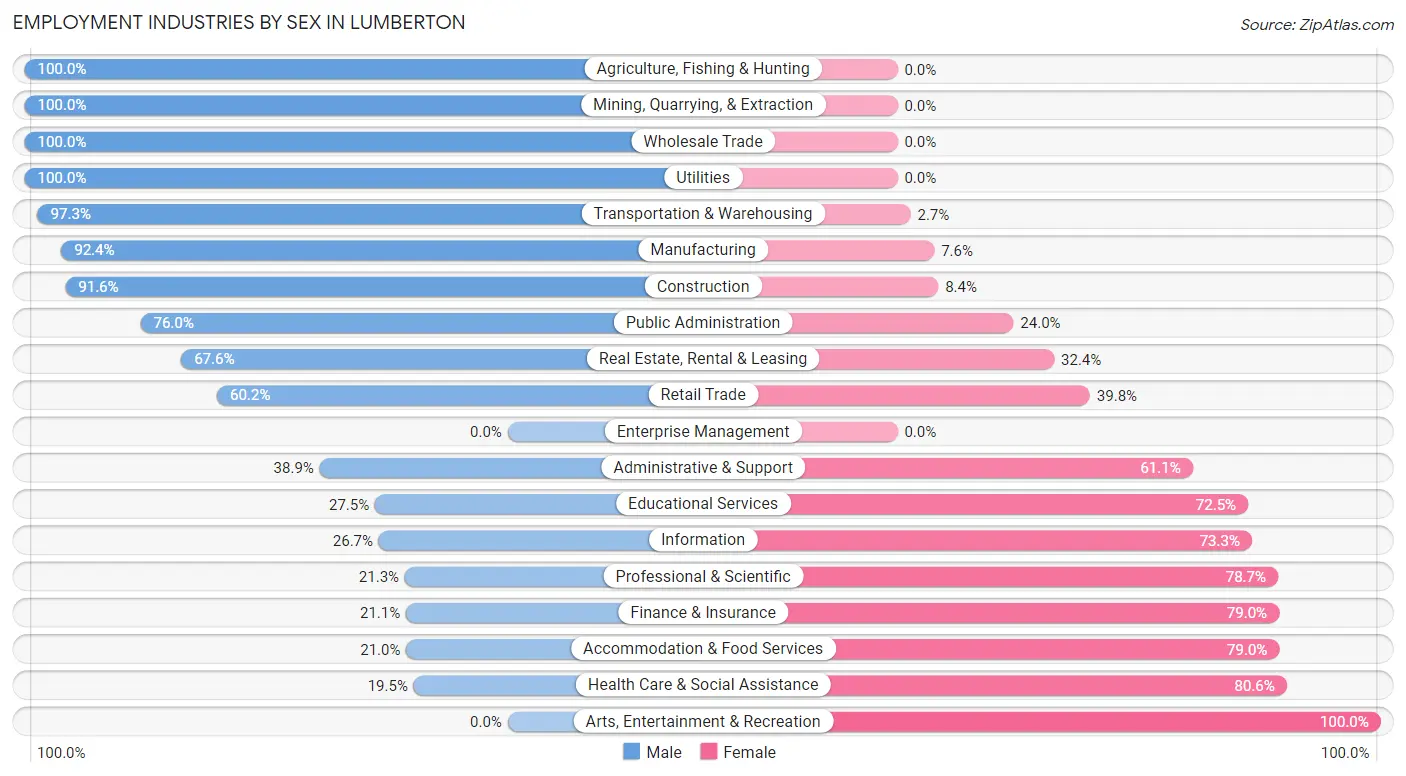
Employment Industries by Sex in Lumberton
The Lumberton industries that see more men than women are Agriculture, Fishing & Hunting (100.0%), Mining, Quarrying, & Extraction (100.0%), and Wholesale Trade (100.0%), whereas the industries that tend to have a higher number of women are Arts, Entertainment & Recreation (100.0%), Health Care & Social Assistance (80.5%), and Accommodation & Food Services (79.0%).
| Industry | Male | Female |
| Agriculture, Fishing & Hunting | 37 (100.0%) | 0 (0.0%) |
| Mining, Quarrying, & Extraction | 30 (100.0%) | 0 (0.0%) |
| Construction | 510 (91.6%) | 47 (8.4%) |
| Manufacturing | 1,080 (92.4%) | 89 (7.6%) |
| Wholesale Trade | 97 (100.0%) | 0 (0.0%) |
| Retail Trade | 453 (60.2%) | 300 (39.8%) |
| Transportation & Warehousing | 251 (97.3%) | 7 (2.7%) |
| Utilities | 51 (100.0%) | 0 (0.0%) |
| Information | 20 (26.7%) | 55 (73.3%) |
| Finance & Insurance | 40 (21.0%) | 150 (78.9%) |
| Real Estate, Rental & Leasing | 25 (67.6%) | 12 (32.4%) |
| Professional & Scientific | 60 (21.3%) | 222 (78.7%) |
| Enterprise Management | 0 (0.0%) | 0 (0.0%) |
| Administrative & Support | 51 (38.9%) | 80 (61.1%) |
| Educational Services | 109 (27.5%) | 288 (72.5%) |
| Health Care & Social Assistance | 253 (19.5%) | 1,048 (80.5%) |
| Arts, Entertainment & Recreation | 0 (0.0%) | 56 (100.0%) |
| Accommodation & Food Services | 106 (21.0%) | 399 (79.0%) |
| Public Administration | 307 (76.0%) | 97 (24.0%) |
| Total | 3,552 (54.8%) | 2,927 (45.2%) |
Education in Lumberton
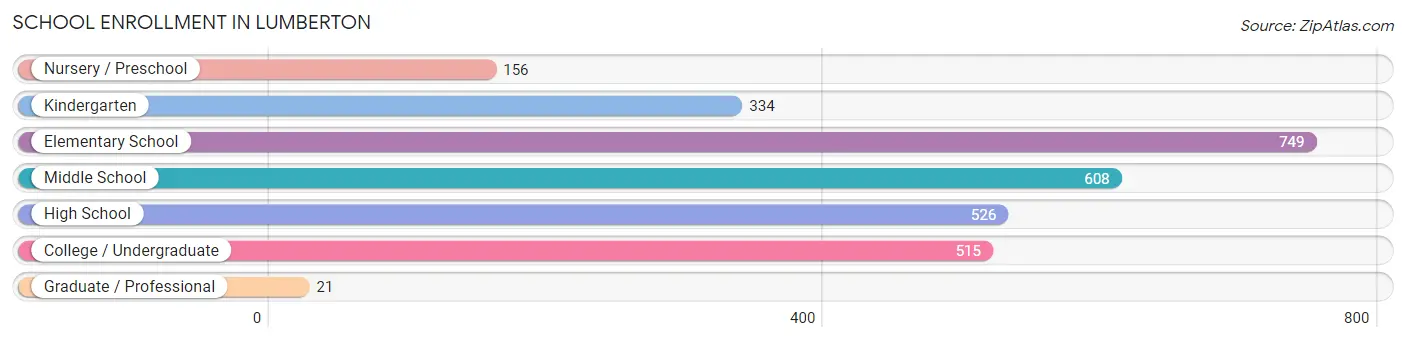
School Enrollment in Lumberton
The most common levels of schooling among the 2,909 students in Lumberton are elementary school (749 | 25.8%), middle school (608 | 20.9%), and high school (526 | 18.1%).
| School Level | # Students | % Students |
| Nursery / Preschool | 156 | 5.4% |
| Kindergarten | 334 | 11.5% |
| Elementary School | 749 | 25.8% |
| Middle School | 608 | 20.9% |
| High School | 526 | 18.1% |
| College / Undergraduate | 515 | 17.7% |
| Graduate / Professional | 21 | 0.7% |
| Total | 2,909 | 100.0% |
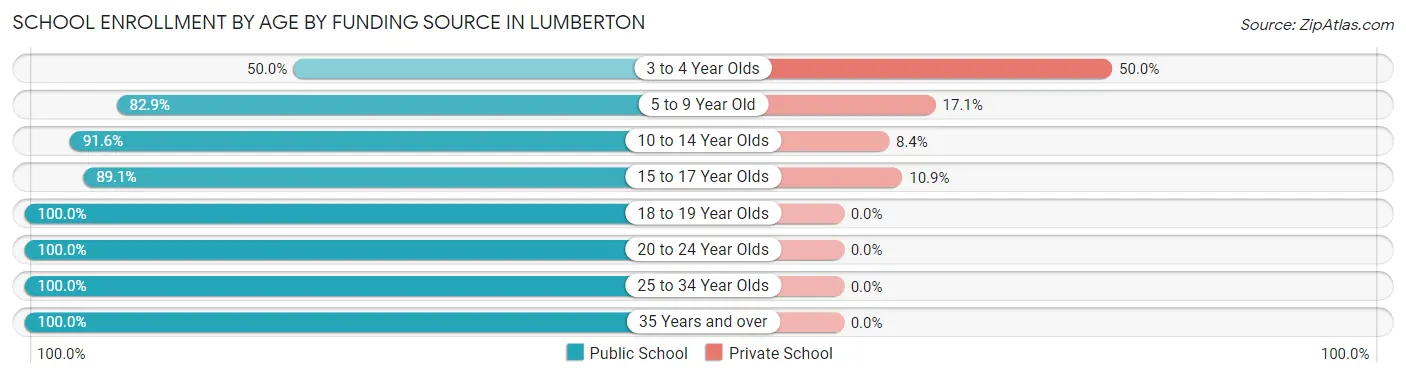
School Enrollment by Age by Funding Source in Lumberton
Out of a total of 2,909 students who are enrolled in schools in Lumberton, 308 (10.6%) attend a private institution, while the remaining 2,601 (89.4%) are enrolled in public schools. The age group of 3 to 4 year olds has the highest likelihood of being enrolled in private schools, with 18 (50.0% in the age bracket) enrolled. Conversely, the age group of 18 to 19 year olds has the lowest likelihood of being enrolled in a private school, with 154 (100.0% in the age bracket) attending a public institution.
| Age Bracket | Public School | Private School |
| 3 to 4 Year Olds | 18 (50.0%) | 18 (50.0%) |
| 5 to 9 Year Old | 871 (82.9%) | 180 (17.1%) |
| 10 to 14 Year Olds | 727 (91.6%) | 67 (8.4%) |
| 15 to 17 Year Olds | 359 (89.1%) | 44 (10.9%) |
| 18 to 19 Year Olds | 154 (100.0%) | 0 (0.0%) |
| 20 to 24 Year Olds | 244 (100.0%) | 0 (0.0%) |
| 25 to 34 Year Olds | 200 (100.0%) | 0 (0.0%) |
| 35 Years and over | 27 (100.0%) | 0 (0.0%) |
| Total | 2,601 (89.4%) | 308 (10.6%) |
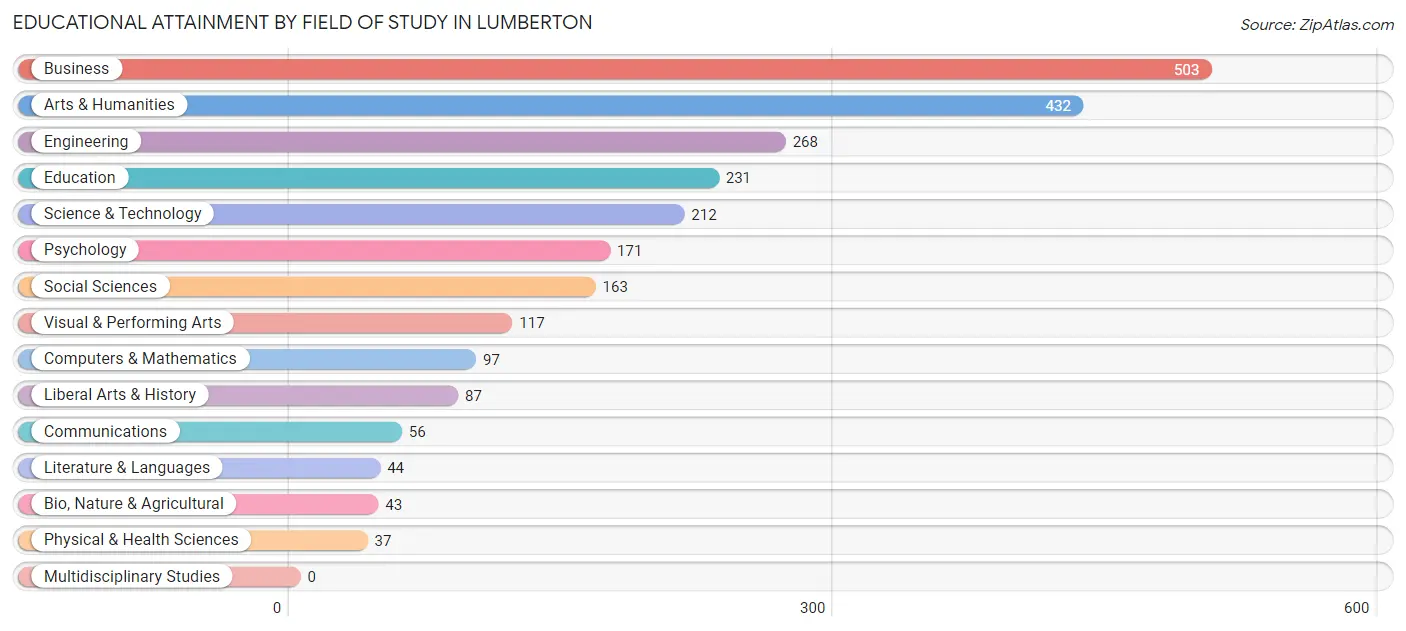
Educational Attainment by Field of Study in Lumberton
Business (503 | 20.4%), arts & humanities (432 | 17.5%), engineering (268 | 10.9%), education (231 | 9.4%), and science & technology (212 | 8.6%) are the most common fields of study among 2,461 individuals in Lumberton who have obtained a bachelor's degree or higher.
| Field of Study | # Graduates | % Graduates |
| Computers & Mathematics | 97 | 3.9% |
| Bio, Nature & Agricultural | 43 | 1.8% |
| Physical & Health Sciences | 37 | 1.5% |
| Psychology | 171 | 7.0% |
| Social Sciences | 163 | 6.6% |
| Engineering | 268 | 10.9% |
| Multidisciplinary Studies | 0 | 0.0% |
| Science & Technology | 212 | 8.6% |
| Business | 503 | 20.4% |
| Education | 231 | 9.4% |
| Literature & Languages | 44 | 1.8% |
| Liberal Arts & History | 87 | 3.5% |
| Visual & Performing Arts | 117 | 4.8% |
| Communications | 56 | 2.3% |
| Arts & Humanities | 432 | 17.5% |
| Total | 2,461 | 100.0% |
Transportation & Commute in Lumberton
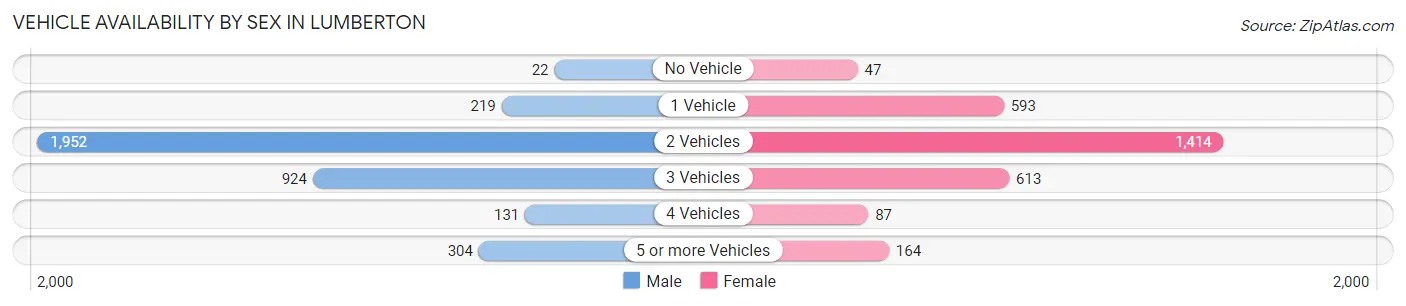
Vehicle Availability by Sex in Lumberton
The most prevalent vehicle ownership categories in Lumberton are males with 2 vehicles (1,952, accounting for 54.9%) and females with 2 vehicles (1,414, making up 66.9%).
| Vehicles Available | Male | Female |
| No Vehicle | 22 (0.6%) | 47 (1.6%) |
| 1 Vehicle | 219 (6.2%) | 593 (20.3%) |
| 2 Vehicles | 1,952 (54.9%) | 1,414 (48.5%) |
| 3 Vehicles | 924 (26.0%) | 613 (21.0%) |
| 4 Vehicles | 131 (3.7%) | 87 (3.0%) |
| 5 or more Vehicles | 304 (8.6%) | 164 (5.6%) |
| Total | 3,552 (100.0%) | 2,918 (100.0%) |
Commute Time in Lumberton
The most frequently occuring commute durations in Lumberton are 30 to 34 minutes (1,393 commuters, 22.6%), 20 to 24 minutes (1,337 commuters, 21.7%), and 5 to 9 minutes (689 commuters, 11.2%).
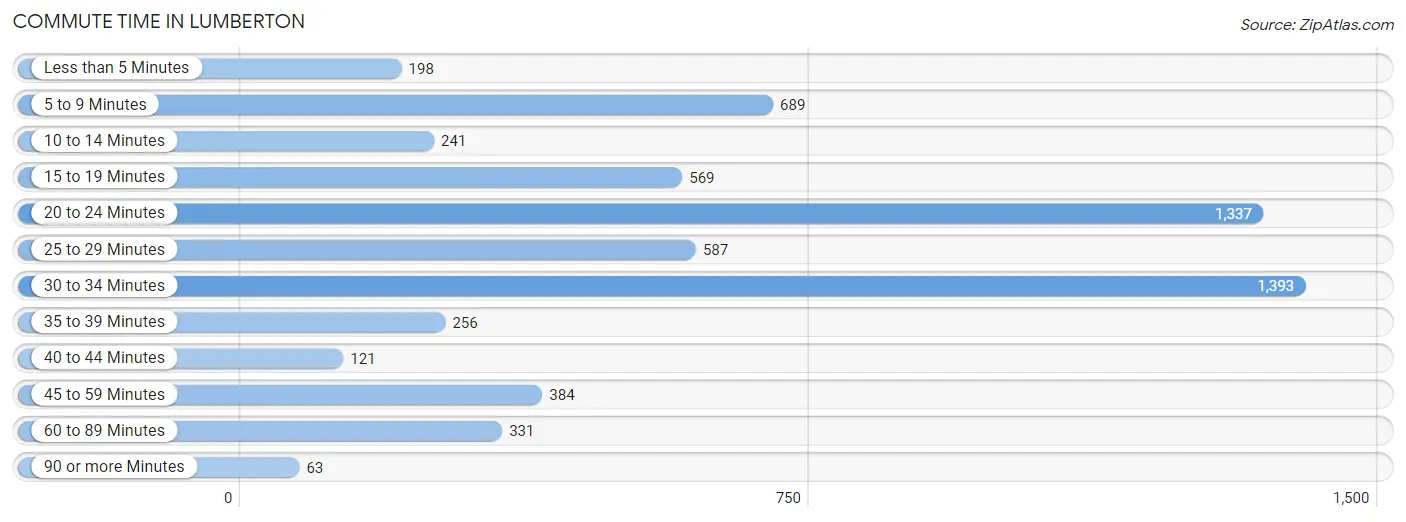
| Commute Time | # Commuters | % Commuters |
| Less than 5 Minutes | 198 | 3.2% |
| 5 to 9 Minutes | 689 | 11.2% |
| 10 to 14 Minutes | 241 | 3.9% |
| 15 to 19 Minutes | 569 | 9.2% |
| 20 to 24 Minutes | 1,337 | 21.7% |
| 25 to 29 Minutes | 587 | 9.5% |
| 30 to 34 Minutes | 1,393 | 22.6% |
| 35 to 39 Minutes | 256 | 4.2% |
| 40 to 44 Minutes | 121 | 2.0% |
| 45 to 59 Minutes | 384 | 6.2% |
| 60 to 89 Minutes | 331 | 5.4% |
| 90 or more Minutes | 63 | 1.0% |
Commute Time by Sex in Lumberton
The most common commute times in Lumberton are 30 to 34 minutes (995 commuters, 28.3%) for males and 20 to 24 minutes (744 commuters, 28.0%) for females.
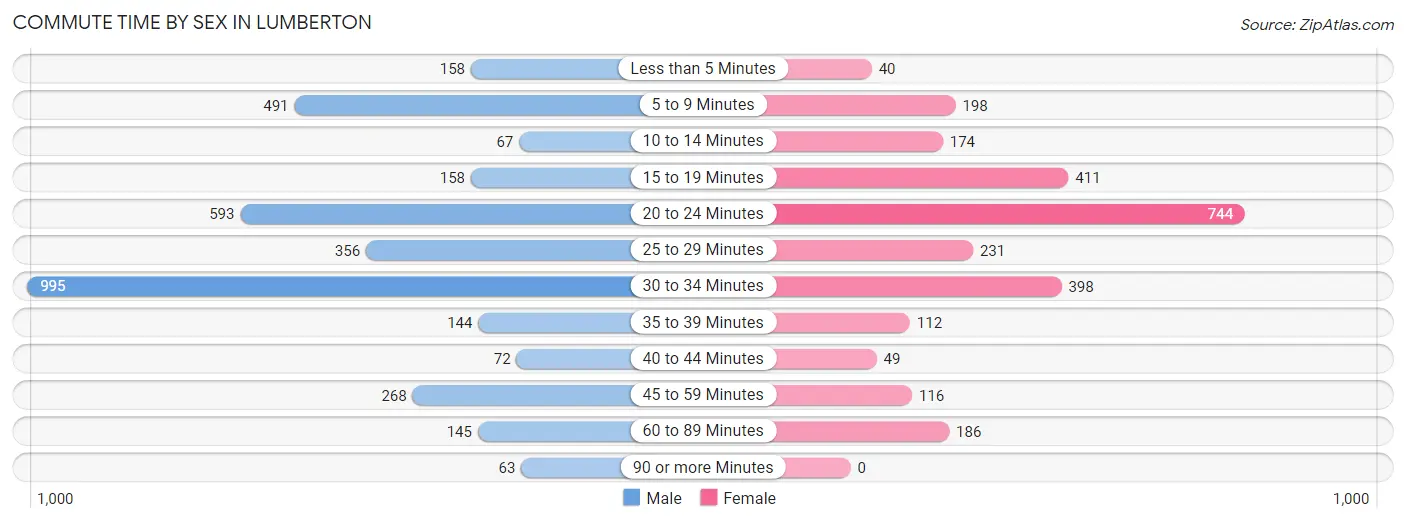
| Commute Time | Male | Female |
| Less than 5 Minutes | 158 (4.5%) | 40 (1.5%) |
| 5 to 9 Minutes | 491 (14.0%) | 198 (7.4%) |
| 10 to 14 Minutes | 67 (1.9%) | 174 (6.5%) |
| 15 to 19 Minutes | 158 (4.5%) | 411 (15.5%) |
| 20 to 24 Minutes | 593 (16.9%) | 744 (28.0%) |
| 25 to 29 Minutes | 356 (10.1%) | 231 (8.7%) |
| 30 to 34 Minutes | 995 (28.3%) | 398 (15.0%) |
| 35 to 39 Minutes | 144 (4.1%) | 112 (4.2%) |
| 40 to 44 Minutes | 72 (2.1%) | 49 (1.8%) |
| 45 to 59 Minutes | 268 (7.6%) | 116 (4.4%) |
| 60 to 89 Minutes | 145 (4.1%) | 186 (7.0%) |
| 90 or more Minutes | 63 (1.8%) | 0 (0.0%) |
Time of Departure to Work by Sex in Lumberton
The most frequent times of departure to work in Lumberton are 7:00 AM to 7:29 AM (789, 22.5%) for males and 7:00 AM to 7:29 AM (723, 27.2%) for females.
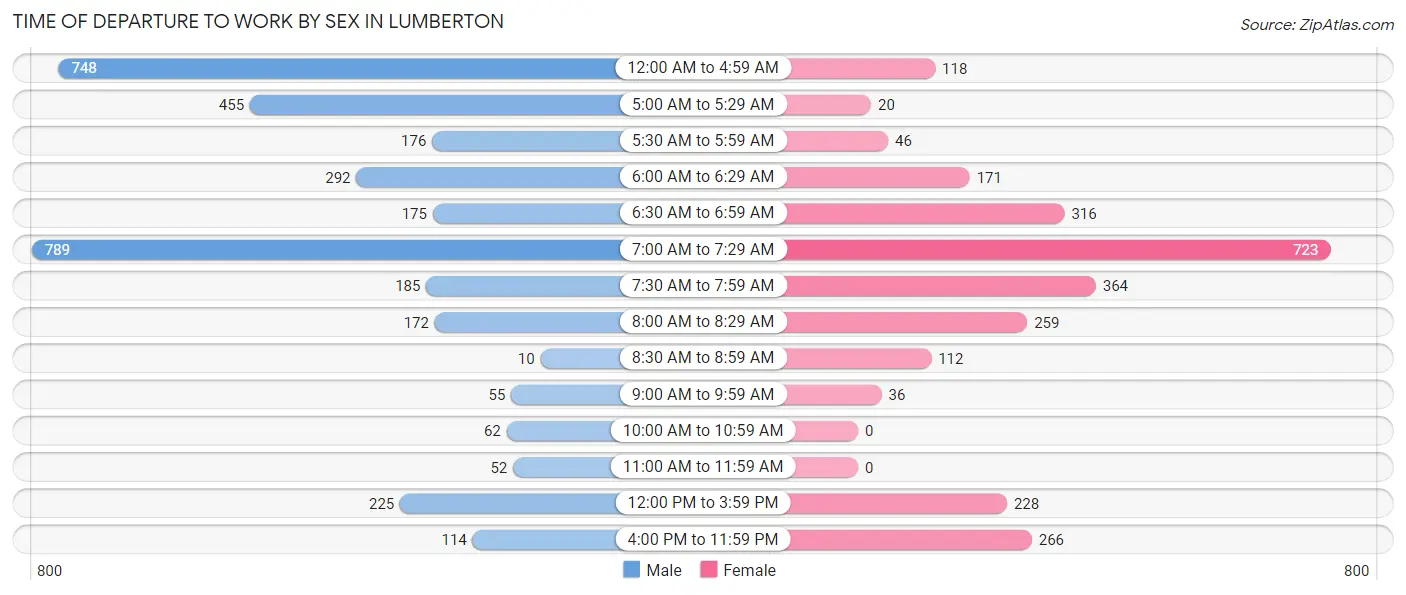
| Time of Departure | Male | Female |
| 12:00 AM to 4:59 AM | 748 (21.3%) | 118 (4.4%) |
| 5:00 AM to 5:29 AM | 455 (13.0%) | 20 (0.7%) |
| 5:30 AM to 5:59 AM | 176 (5.0%) | 46 (1.7%) |
| 6:00 AM to 6:29 AM | 292 (8.3%) | 171 (6.4%) |
| 6:30 AM to 6:59 AM | 175 (5.0%) | 316 (11.9%) |
| 7:00 AM to 7:29 AM | 789 (22.5%) | 723 (27.2%) |
| 7:30 AM to 7:59 AM | 185 (5.3%) | 364 (13.7%) |
| 8:00 AM to 8:29 AM | 172 (4.9%) | 259 (9.7%) |
| 8:30 AM to 8:59 AM | 10 (0.3%) | 112 (4.2%) |
| 9:00 AM to 9:59 AM | 55 (1.6%) | 36 (1.3%) |
| 10:00 AM to 10:59 AM | 62 (1.8%) | 0 (0.0%) |
| 11:00 AM to 11:59 AM | 52 (1.5%) | 0 (0.0%) |
| 12:00 PM to 3:59 PM | 225 (6.4%) | 228 (8.6%) |
| 4:00 PM to 11:59 PM | 114 (3.3%) | 266 (10.0%) |
| Total | 3,510 (100.0%) | 2,659 (100.0%) |
Housing Occupancy in Lumberton
Occupancy by Ownership in Lumberton
Of the total 5,313 dwellings in Lumberton, owner-occupied units account for 4,578 (86.2%), while renter-occupied units make up 735 (13.8%).
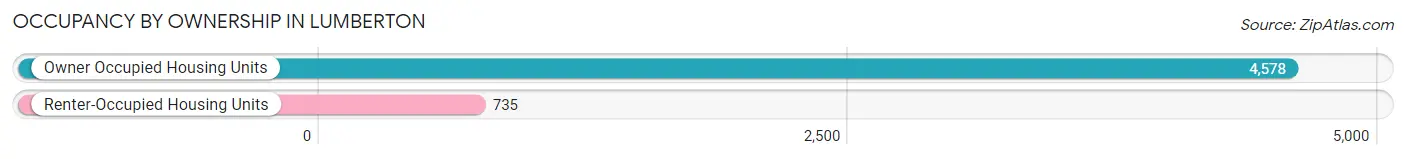
| Occupancy | # Housing Units | % Housing Units |
| Owner Occupied Housing Units | 4,578 | 86.2% |
| Renter-Occupied Housing Units | 735 | 13.8% |
| Total Occupied Housing Units | 5,313 | 100.0% |
Occupancy by Household Size in Lumberton
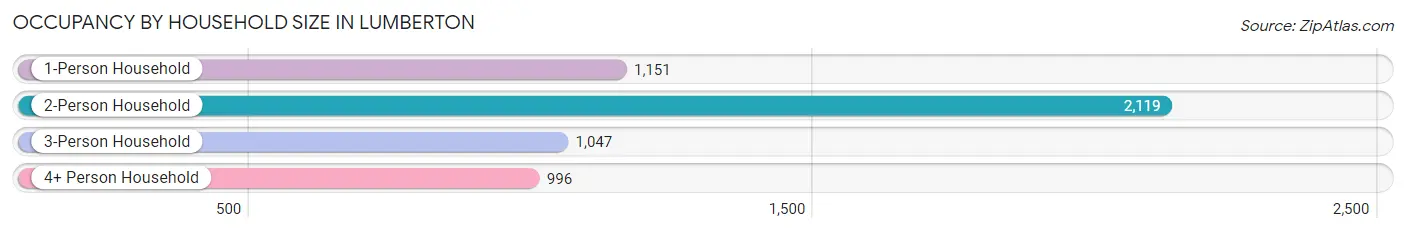
| Household Size | # Housing Units | % Housing Units |
| 1-Person Household | 1,151 | 21.7% |
| 2-Person Household | 2,119 | 39.9% |
| 3-Person Household | 1,047 | 19.7% |
| 4+ Person Household | 996 | 18.8% |
| Total Housing Units | 5,313 | 100.0% |
Occupancy by Ownership by Household Size in Lumberton
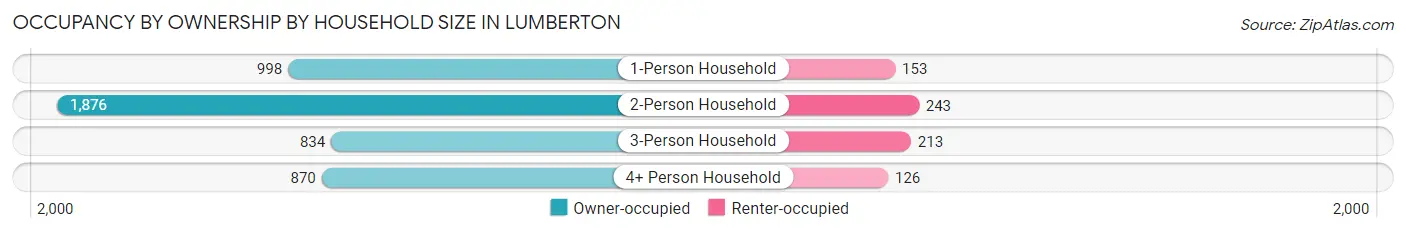
| Household Size | Owner-occupied | Renter-occupied |
| 1-Person Household | 998 (86.7%) | 153 (13.3%) |
| 2-Person Household | 1,876 (88.5%) | 243 (11.5%) |
| 3-Person Household | 834 (79.7%) | 213 (20.3%) |
| 4+ Person Household | 870 (87.4%) | 126 (12.7%) |
| Total Housing Units | 4,578 (86.2%) | 735 (13.8%) |
Occupancy by Educational Attainment in Lumberton
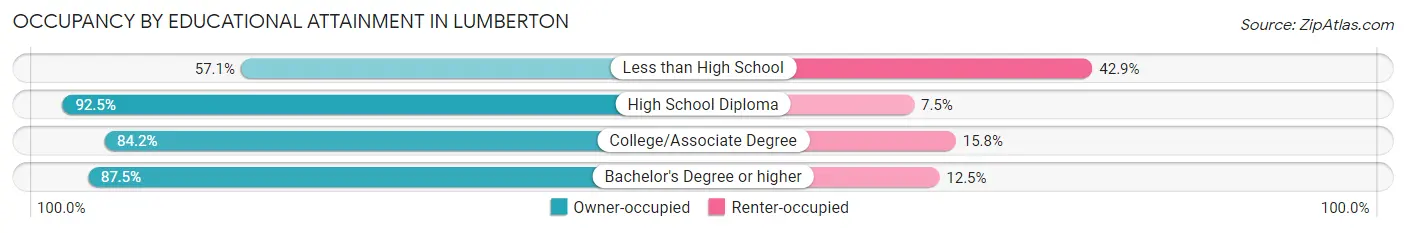
| Household Size | Owner-occupied | Renter-occupied |
| Less than High School | 144 (57.1%) | 108 (42.9%) |
| High School Diploma | 1,451 (92.5%) | 118 (7.5%) |
| College/Associate Degree | 1,852 (84.2%) | 347 (15.8%) |
| Bachelor's Degree or higher | 1,131 (87.5%) | 162 (12.5%) |
Occupancy by Age of Householder in Lumberton
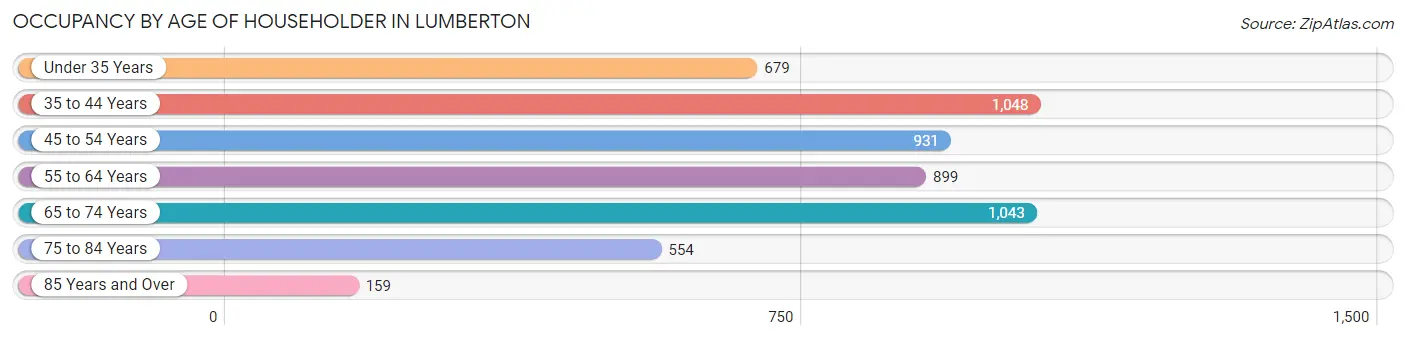
| Age Bracket | # Households | % Households |
| Under 35 Years | 679 | 12.8% |
| 35 to 44 Years | 1,048 | 19.7% |
| 45 to 54 Years | 931 | 17.5% |
| 55 to 64 Years | 899 | 16.9% |
| 65 to 74 Years | 1,043 | 19.6% |
| 75 to 84 Years | 554 | 10.4% |
| 85 Years and Over | 159 | 3.0% |
| Total | 5,313 | 100.0% |
Housing Finances in Lumberton
Median Income by Occupancy in Lumberton
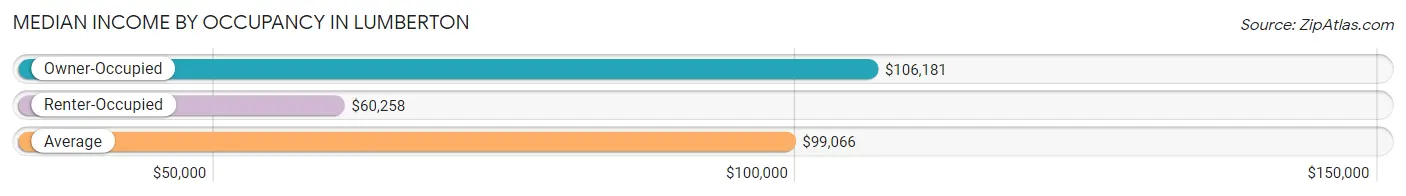
| Occupancy Type | # Households | Median Income |
| Owner-Occupied | 4,578 (86.2%) | $106,181 |
| Renter-Occupied | 735 (13.8%) | $60,258 |
| Average | 5,313 (100.0%) | $99,066 |
Occupancy by Householder Income Bracket in Lumberton
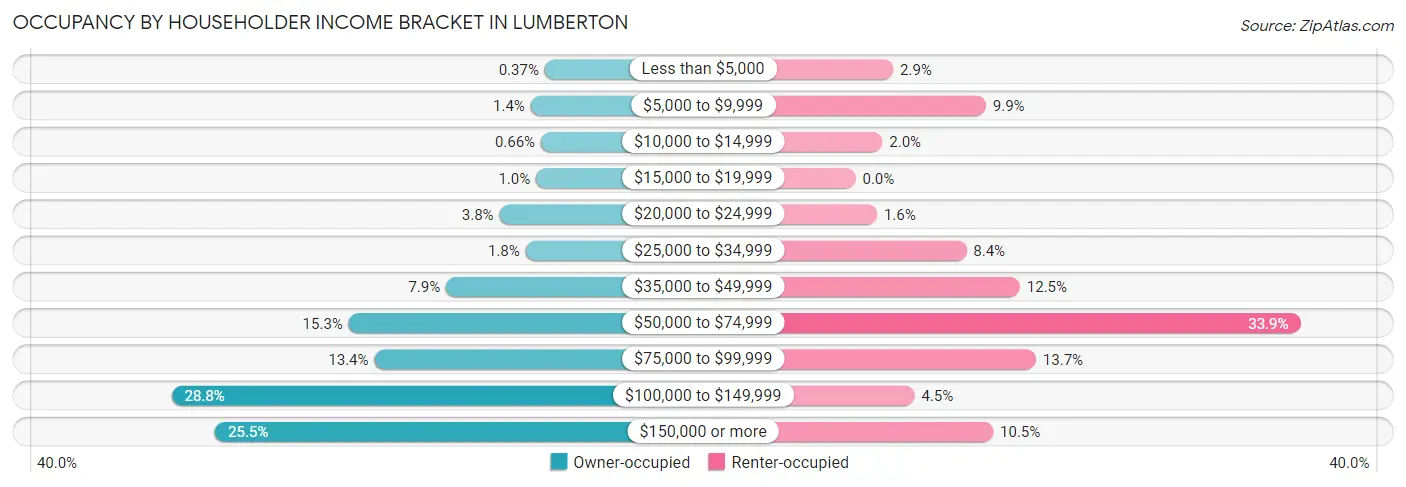
| Income Bracket | Owner-occupied | Renter-occupied |
| Less than $5,000 | 17 (0.4%) | 21 (2.9%) |
| $5,000 to $9,999 | 66 (1.4%) | 73 (9.9%) |
| $10,000 to $14,999 | 30 (0.7%) | 15 (2.0%) |
| $15,000 to $19,999 | 47 (1.0%) | 0 (0.0%) |
| $20,000 to $24,999 | 175 (3.8%) | 12 (1.6%) |
| $25,000 to $34,999 | 84 (1.8%) | 62 (8.4%) |
| $35,000 to $49,999 | 361 (7.9%) | 92 (12.5%) |
| $50,000 to $74,999 | 701 (15.3%) | 249 (33.9%) |
| $75,000 to $99,999 | 611 (13.4%) | 101 (13.7%) |
| $100,000 to $149,999 | 1,319 (28.8%) | 33 (4.5%) |
| $150,000 or more | 1,167 (25.5%) | 77 (10.5%) |
| Total | 4,578 (100.0%) | 735 (100.0%) |
Monthly Housing Cost Tiers in Lumberton
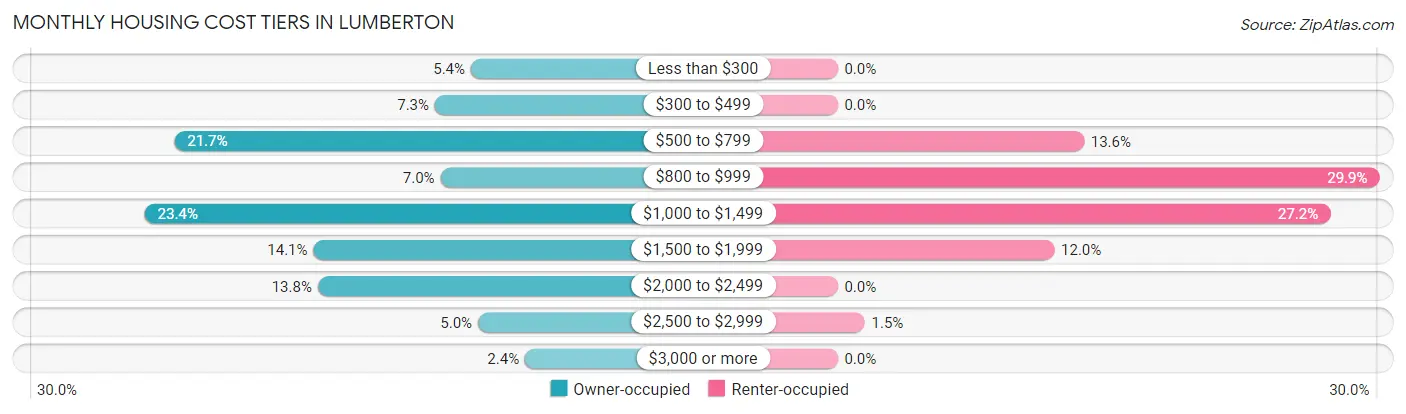
| Monthly Cost | Owner-occupied | Renter-occupied |
| Less than $300 | 245 (5.3%) | 0 (0.0%) |
| $300 to $499 | 336 (7.3%) | 0 (0.0%) |
| $500 to $799 | 995 (21.7%) | 100 (13.6%) |
| $800 to $999 | 322 (7.0%) | 220 (29.9%) |
| $1,000 to $1,499 | 1,070 (23.4%) | 200 (27.2%) |
| $1,500 to $1,999 | 643 (14.1%) | 88 (12.0%) |
| $2,000 to $2,499 | 632 (13.8%) | 0 (0.0%) |
| $2,500 to $2,999 | 227 (5.0%) | 11 (1.5%) |
| $3,000 or more | 108 (2.4%) | 0 (0.0%) |
| Total | 4,578 (100.0%) | 735 (100.0%) |
Physical Housing Characteristics in Lumberton
Housing Structures in Lumberton
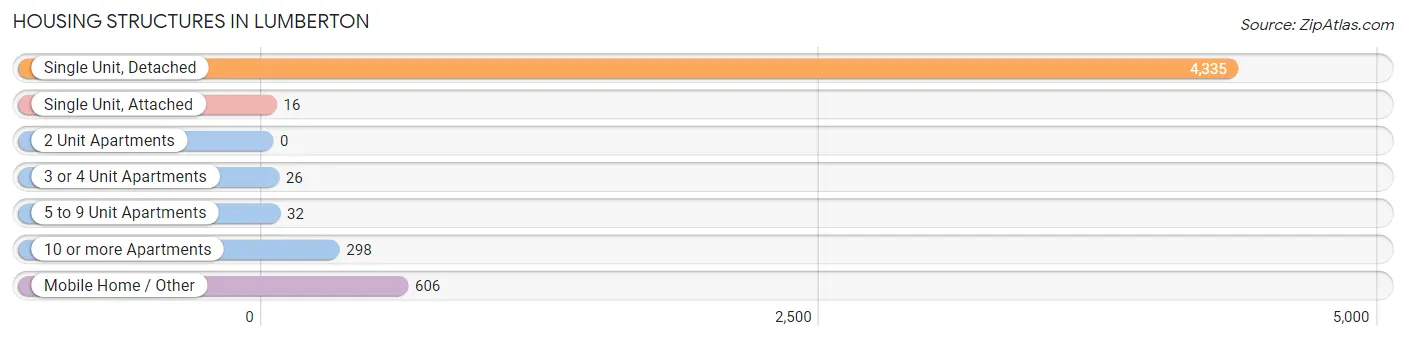
| Structure Type | # Housing Units | % Housing Units |
| Single Unit, Detached | 4,335 | 81.6% |
| Single Unit, Attached | 16 | 0.3% |
| 2 Unit Apartments | 0 | 0.0% |
| 3 or 4 Unit Apartments | 26 | 0.5% |
| 5 to 9 Unit Apartments | 32 | 0.6% |
| 10 or more Apartments | 298 | 5.6% |
| Mobile Home / Other | 606 | 11.4% |
| Total | 5,313 | 100.0% |
Housing Structures by Occupancy in Lumberton
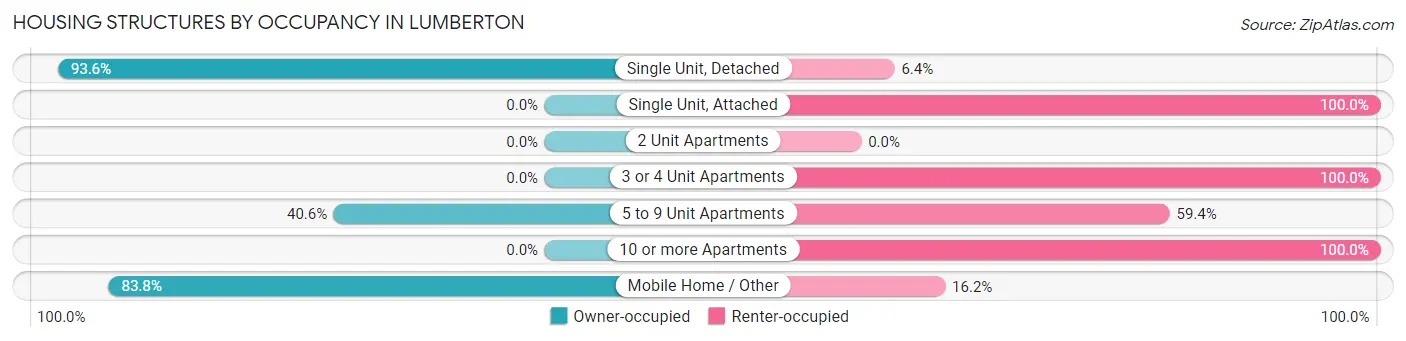
| Structure Type | Owner-occupied | Renter-occupied |
| Single Unit, Detached | 4,057 (93.6%) | 278 (6.4%) |
| Single Unit, Attached | 0 (0.0%) | 16 (100.0%) |
| 2 Unit Apartments | 0 (0.0%) | 0 (0.0%) |
| 3 or 4 Unit Apartments | 0 (0.0%) | 26 (100.0%) |
| 5 to 9 Unit Apartments | 13 (40.6%) | 19 (59.4%) |
| 10 or more Apartments | 0 (0.0%) | 298 (100.0%) |
| Mobile Home / Other | 508 (83.8%) | 98 (16.2%) |
| Total | 4,578 (86.2%) | 735 (13.8%) |
Housing Structures by Number of Rooms in Lumberton
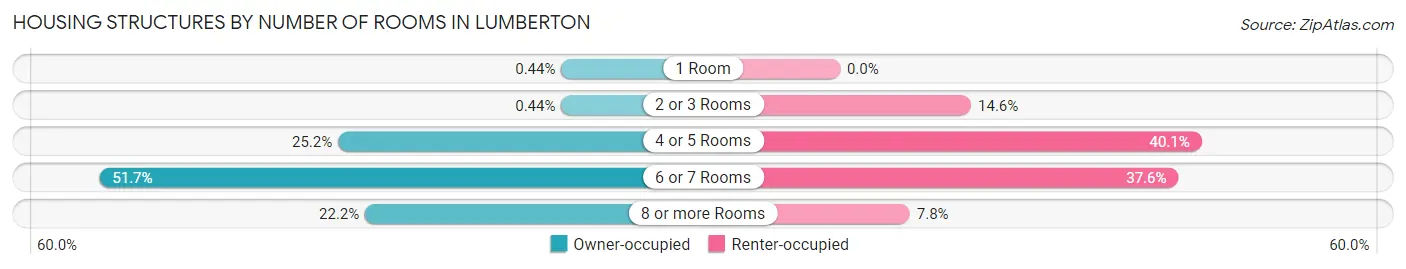
| Number of Rooms | Owner-occupied | Renter-occupied |
| 1 Room | 20 (0.4%) | 0 (0.0%) |
| 2 or 3 Rooms | 20 (0.4%) | 107 (14.6%) |
| 4 or 5 Rooms | 1,154 (25.2%) | 295 (40.1%) |
| 6 or 7 Rooms | 2,367 (51.7%) | 276 (37.6%) |
| 8 or more Rooms | 1,017 (22.2%) | 57 (7.8%) |
| Total | 4,578 (100.0%) | 735 (100.0%) |
Housing Structure by Heating Type in Lumberton
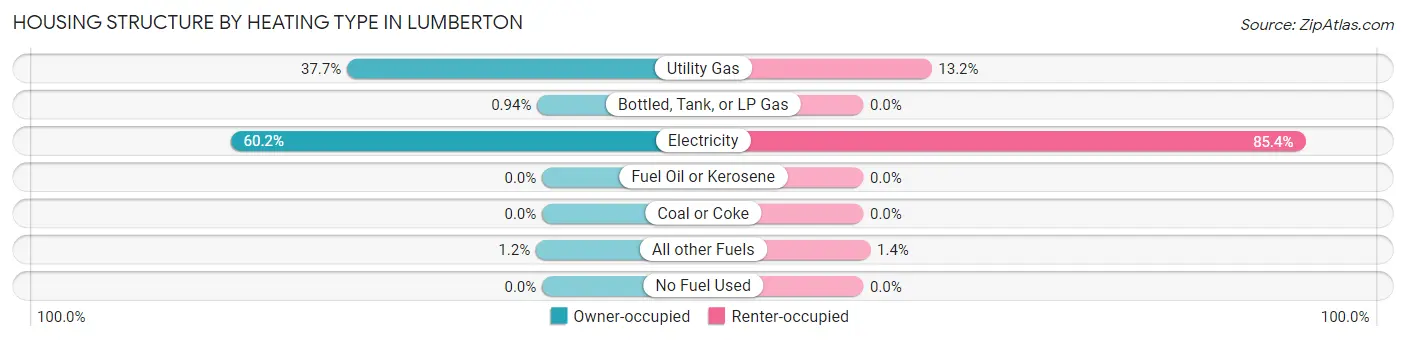
| Heating Type | Owner-occupied | Renter-occupied |
| Utility Gas | 1,726 (37.7%) | 97 (13.2%) |
| Bottled, Tank, or LP Gas | 43 (0.9%) | 0 (0.0%) |
| Electricity | 2,755 (60.2%) | 628 (85.4%) |
| Fuel Oil or Kerosene | 0 (0.0%) | 0 (0.0%) |
| Coal or Coke | 0 (0.0%) | 0 (0.0%) |
| All other Fuels | 54 (1.2%) | 10 (1.4%) |
| No Fuel Used | 0 (0.0%) | 0 (0.0%) |
| Total | 4,578 (100.0%) | 735 (100.0%) |
Household Vehicle Usage in Lumberton
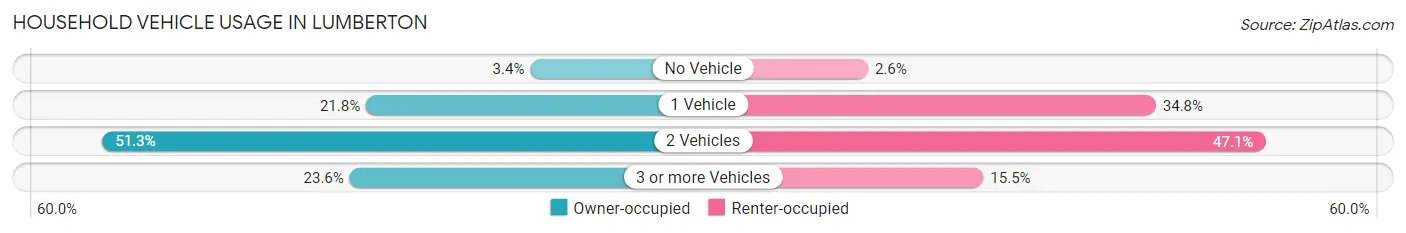
| Vehicles per Household | Owner-occupied | Renter-occupied |
| No Vehicle | 154 (3.4%) | 19 (2.6%) |
| 1 Vehicle | 996 (21.8%) | 256 (34.8%) |
| 2 Vehicles | 2,348 (51.3%) | 346 (47.1%) |
| 3 or more Vehicles | 1,080 (23.6%) | 114 (15.5%) |
| Total | 4,578 (100.0%) | 735 (100.0%) |
Real Estate & Mortgages in Lumberton
Real Estate and Mortgage Overview in Lumberton
| Characteristic | Without Mortgage | With Mortgage |
| Housing Units | 1,785 | 2,793 |
| Median Property Value | $203,300 | $292,100 |
| Median Household Income | $64,185 | $940 |
| Monthly Housing Costs | $587 | $108 |
| Real Estate Taxes | $2,596 | $107 |
Property Value by Mortgage Status in Lumberton
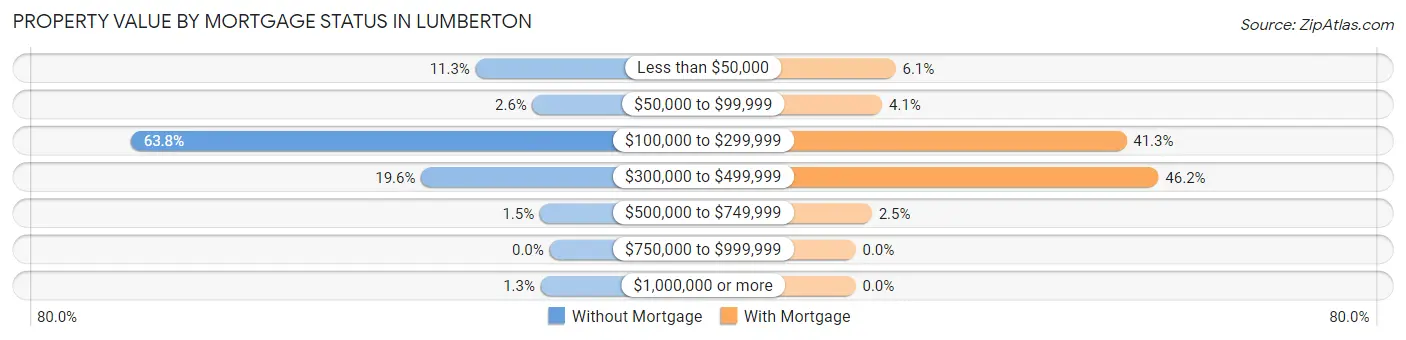
| Property Value | Without Mortgage | With Mortgage |
| Less than $50,000 | 201 (11.3%) | 170 (6.1%) |
| $50,000 to $99,999 | 46 (2.6%) | 113 (4.1%) |
| $100,000 to $299,999 | 1,139 (63.8%) | 1,152 (41.2%) |
| $300,000 to $499,999 | 349 (19.6%) | 1,289 (46.2%) |
| $500,000 to $749,999 | 26 (1.5%) | 69 (2.5%) |
| $750,000 to $999,999 | 0 (0.0%) | 0 (0.0%) |
| $1,000,000 or more | 24 (1.3%) | 0 (0.0%) |
| Total | 1,785 (100.0%) | 2,793 (100.0%) |
Household Income by Mortgage Status in Lumberton
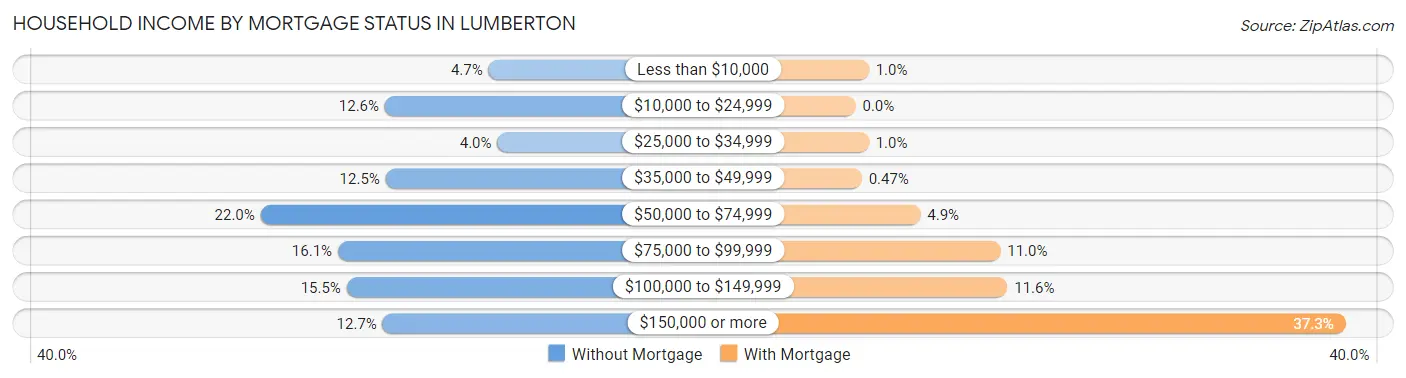
| Household Income | Without Mortgage | With Mortgage |
| Less than $10,000 | 83 (4.6%) | 28 (1.0%) |
| $10,000 to $24,999 | 224 (12.6%) | 0 (0.0%) |
| $25,000 to $34,999 | 71 (4.0%) | 28 (1.0%) |
| $35,000 to $49,999 | 223 (12.5%) | 13 (0.5%) |
| $50,000 to $74,999 | 393 (22.0%) | 138 (4.9%) |
| $75,000 to $99,999 | 288 (16.1%) | 308 (11.0%) |
| $100,000 to $149,999 | 276 (15.5%) | 323 (11.6%) |
| $150,000 or more | 227 (12.7%) | 1,043 (37.3%) |
| Total | 1,785 (100.0%) | 2,793 (100.0%) |
Property Value to Household Income Ratio in Lumberton
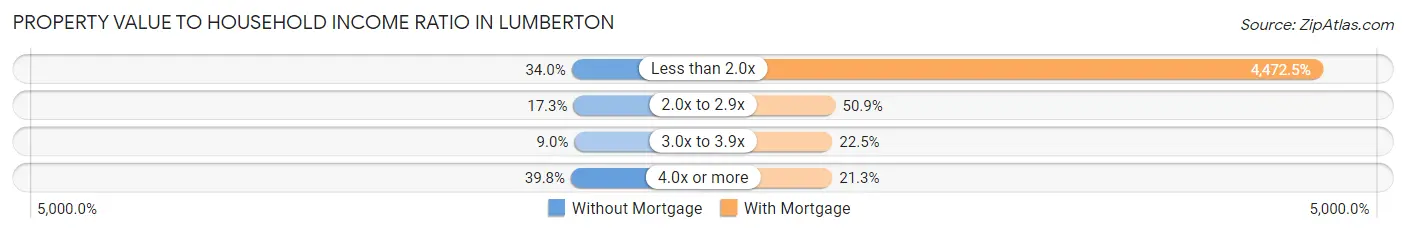
| Value-to-Income Ratio | Without Mortgage | With Mortgage |
| Less than 2.0x | 606 (34.0%) | 124,917 (4,472.5%) |
| 2.0x to 2.9x | 308 (17.2%) | 1,421 (50.9%) |
| 3.0x to 3.9x | 161 (9.0%) | 628 (22.5%) |
| 4.0x or more | 710 (39.8%) | 596 (21.3%) |
| Total | 1,785 (100.0%) | 2,793 (100.0%) |
Real Estate Taxes by Mortgage Status in Lumberton
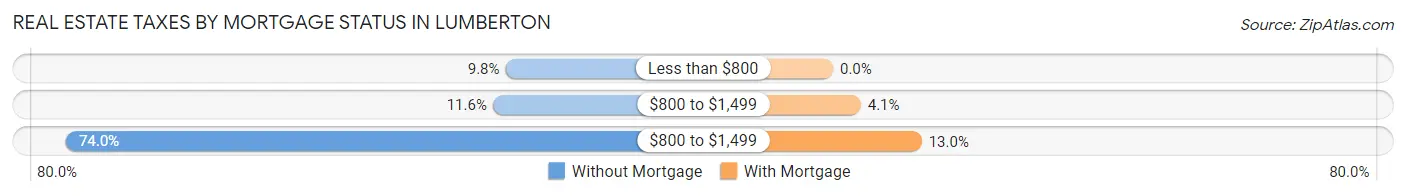
| Property Taxes | Without Mortgage | With Mortgage |
| Less than $800 | 174 (9.8%) | 0 (0.0%) |
| $800 to $1,499 | 207 (11.6%) | 113 (4.1%) |
| $800 to $1,499 | 1,320 (74.0%) | 362 (13.0%) |
| Total | 1,785 (100.0%) | 2,793 (100.0%) |
Health & Disability in Lumberton
Health Insurance Coverage by Age in Lumberton
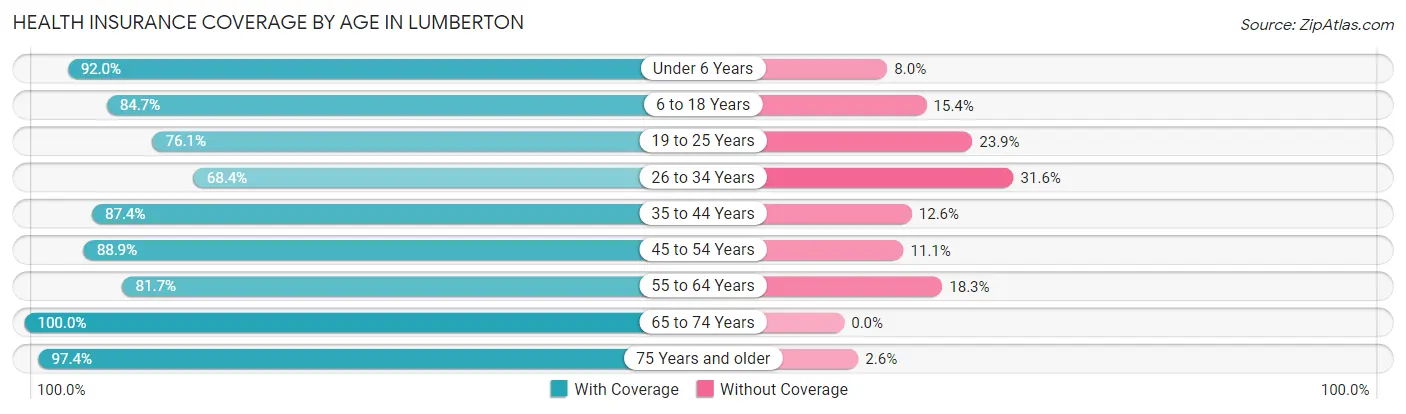
| Age Bracket | With Coverage | Without Coverage |
| Under 6 Years | 789 (92.0%) | 69 (8.0%) |
| 6 to 18 Years | 1,776 (84.7%) | 322 (15.3%) |
| 19 to 25 Years | 644 (76.1%) | 202 (23.9%) |
| 26 to 34 Years | 1,194 (68.4%) | 551 (31.6%) |
| 35 to 44 Years | 1,679 (87.4%) | 242 (12.6%) |
| 45 to 54 Years | 1,656 (88.9%) | 206 (11.1%) |
| 55 to 64 Years | 1,193 (81.7%) | 267 (18.3%) |
| 65 to 74 Years | 1,713 (100.0%) | 0 (0.0%) |
| 75 Years and older | 963 (97.4%) | 26 (2.6%) |
| Total | 11,607 (86.0%) | 1,885 (14.0%) |
Health Insurance Coverage by Citizenship Status in Lumberton
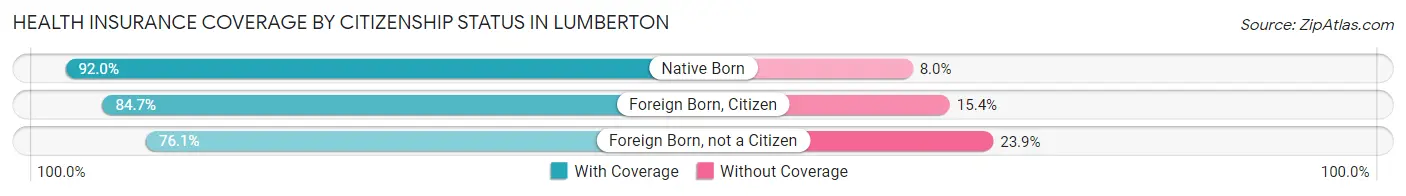
| Citizenship Status | With Coverage | Without Coverage |
| Native Born | 789 (92.0%) | 69 (8.0%) |
| Foreign Born, Citizen | 1,776 (84.7%) | 322 (15.3%) |
| Foreign Born, not a Citizen | 644 (76.1%) | 202 (23.9%) |
Health Insurance Coverage by Household Income in Lumberton
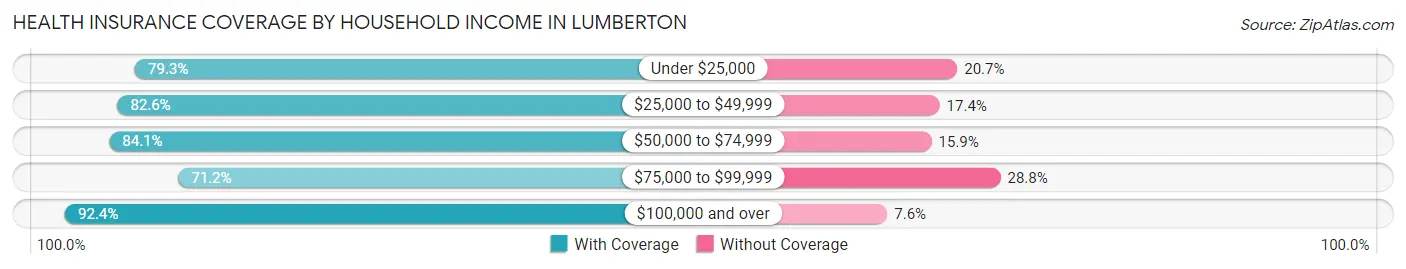
| Household Income | With Coverage | Without Coverage |
| Under $25,000 | 800 (79.3%) | 209 (20.7%) |
| $25,000 to $49,999 | 1,073 (82.6%) | 226 (17.4%) |
| $50,000 to $74,999 | 1,625 (84.1%) | 307 (15.9%) |
| $75,000 to $99,999 | 1,478 (71.2%) | 598 (28.8%) |
| $100,000 and over | 6,631 (92.4%) | 545 (7.6%) |
Public vs Private Health Insurance Coverage by Age in Lumberton
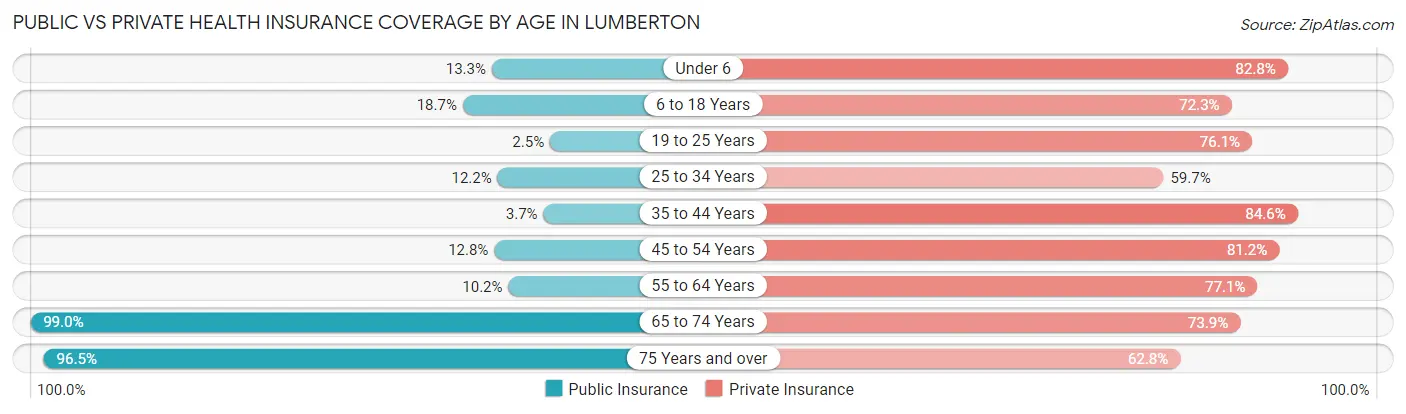
| Age Bracket | Public Insurance | Private Insurance |
| Under 6 | 114 (13.3%) | 710 (82.8%) |
| 6 to 18 Years | 392 (18.7%) | 1,517 (72.3%) |
| 19 to 25 Years | 21 (2.5%) | 644 (76.1%) |
| 25 to 34 Years | 213 (12.2%) | 1,042 (59.7%) |
| 35 to 44 Years | 71 (3.7%) | 1,625 (84.6%) |
| 45 to 54 Years | 239 (12.8%) | 1,511 (81.1%) |
| 55 to 64 Years | 149 (10.2%) | 1,126 (77.1%) |
| 65 to 74 Years | 1,695 (99.0%) | 1,266 (73.9%) |
| 75 Years and over | 954 (96.5%) | 621 (62.8%) |
| Total | 3,848 (28.5%) | 10,062 (74.6%) |
Disability Status by Sex by Age in Lumberton
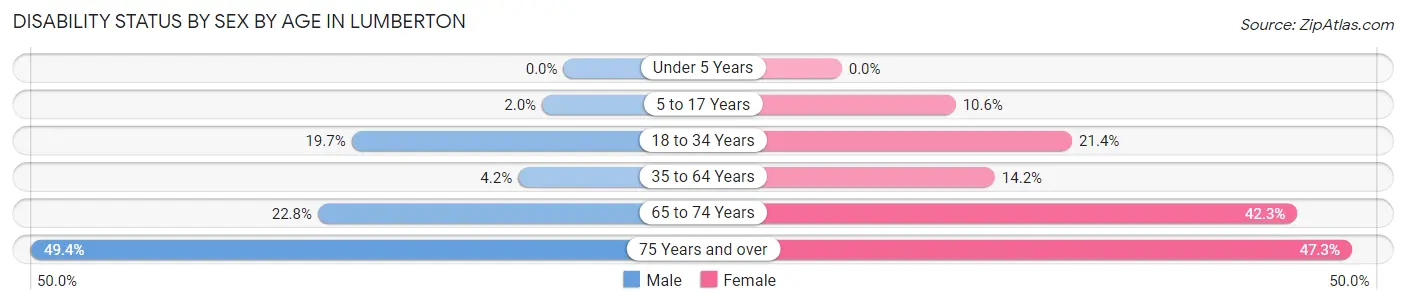
| Age Bracket | Male | Female |
| Under 5 Years | 0 (0.0%) | 0 (0.0%) |
| 5 to 17 Years | 25 (2.0%) | 107 (10.6%) |
| 18 to 34 Years | 252 (19.7%) | 301 (21.4%) |
| 35 to 64 Years | 105 (4.2%) | 391 (14.2%) |
| 65 to 74 Years | 199 (22.8%) | 355 (42.3%) |
| 75 Years and over | 165 (49.4%) | 310 (47.3%) |
Disability Class by Sex by Age in Lumberton
Disability Class: Hearing Difficulty
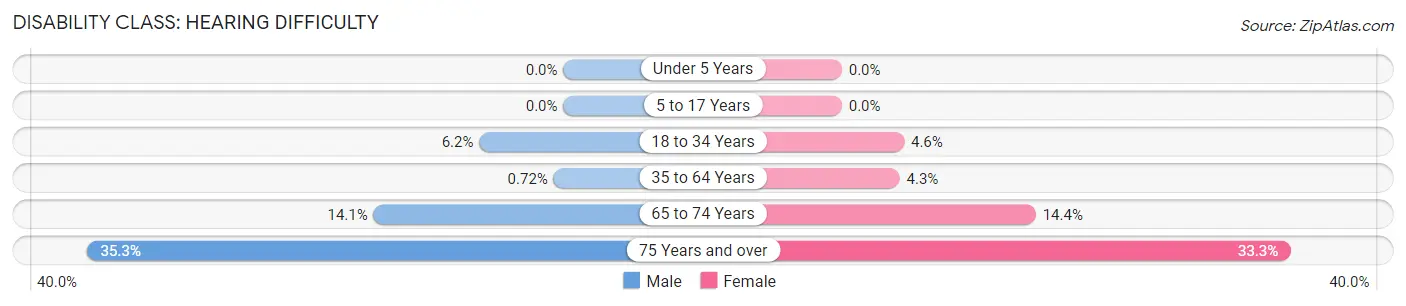
| Age Bracket | Male | Female |
| Under 5 Years | 0 (0.0%) | 0 (0.0%) |
| 5 to 17 Years | 0 (0.0%) | 0 (0.0%) |
| 18 to 34 Years | 80 (6.2%) | 65 (4.6%) |
| 35 to 64 Years | 18 (0.7%) | 118 (4.3%) |
| 65 to 74 Years | 123 (14.1%) | 121 (14.4%) |
| 75 Years and over | 118 (35.3%) | 218 (33.3%) |
Disability Class: Vision Difficulty
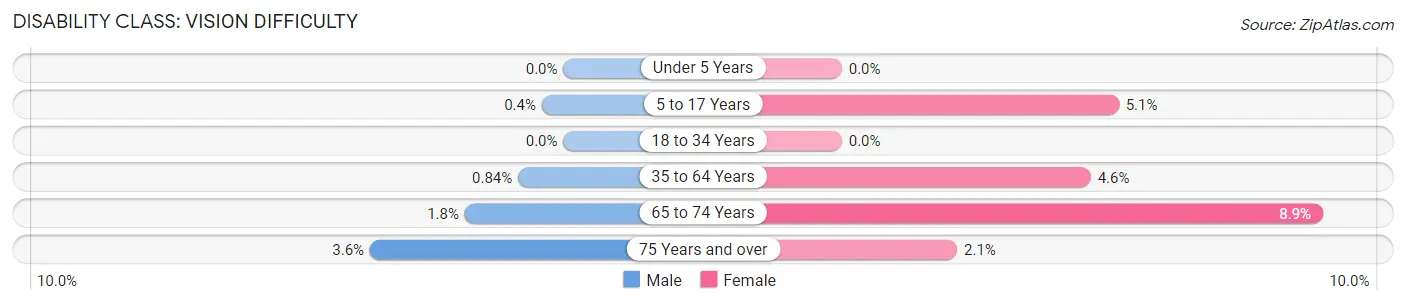
| Age Bracket | Male | Female |
| Under 5 Years | 0 (0.0%) | 0 (0.0%) |
| 5 to 17 Years | 5 (0.4%) | 52 (5.1%) |
| 18 to 34 Years | 0 (0.0%) | 0 (0.0%) |
| 35 to 64 Years | 21 (0.8%) | 127 (4.6%) |
| 65 to 74 Years | 16 (1.8%) | 75 (8.9%) |
| 75 Years and over | 12 (3.6%) | 14 (2.1%) |
Disability Class: Cognitive Difficulty
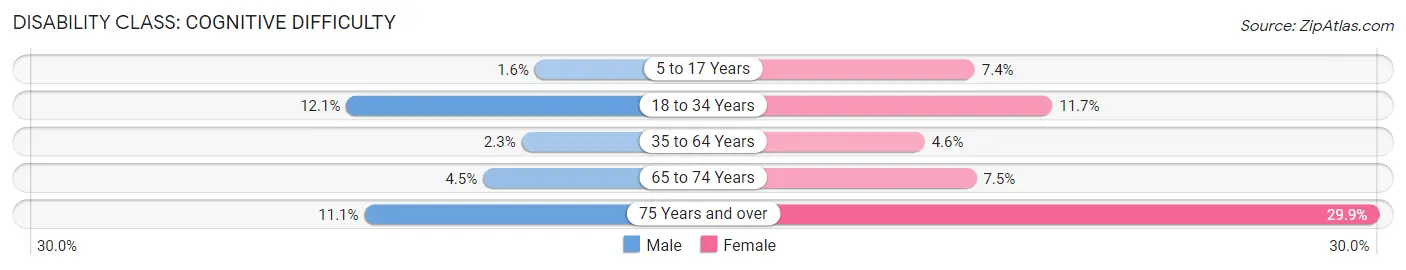
| Age Bracket | Male | Female |
| 5 to 17 Years | 20 (1.6%) | 75 (7.4%) |
| 18 to 34 Years | 155 (12.1%) | 165 (11.7%) |
| 35 to 64 Years | 58 (2.3%) | 127 (4.6%) |
| 65 to 74 Years | 39 (4.5%) | 63 (7.5%) |
| 75 Years and over | 37 (11.1%) | 196 (29.9%) |
Disability Class: Ambulatory Difficulty
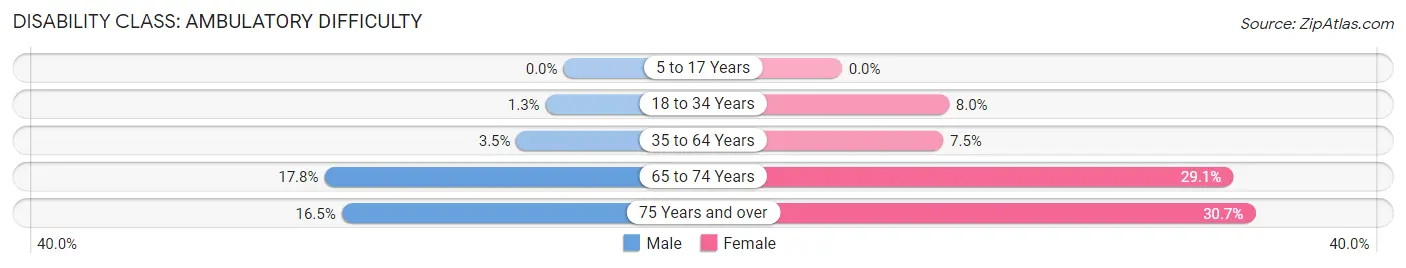
| Age Bracket | Male | Female |
| 5 to 17 Years | 0 (0.0%) | 0 (0.0%) |
| 18 to 34 Years | 17 (1.3%) | 112 (8.0%) |
| 35 to 64 Years | 87 (3.5%) | 207 (7.5%) |
| 65 to 74 Years | 155 (17.7%) | 244 (29.0%) |
| 75 Years and over | 55 (16.5%) | 201 (30.7%) |
Disability Class: Self-Care Difficulty
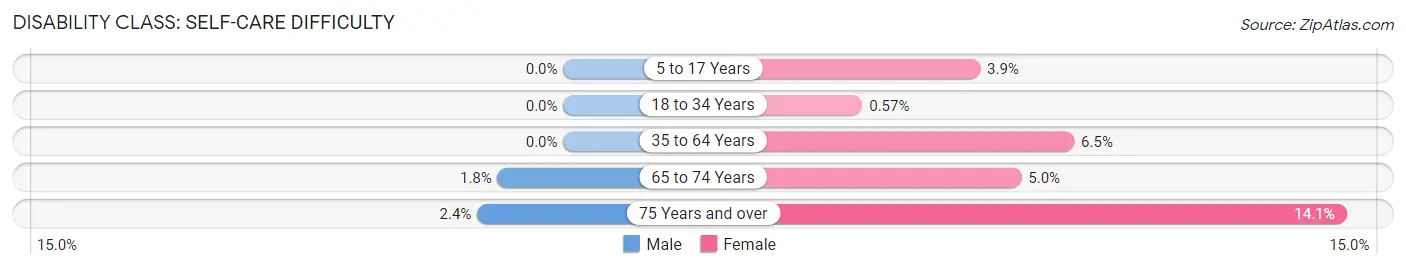
| Age Bracket | Male | Female |
| 5 to 17 Years | 0 (0.0%) | 39 (3.8%) |
| 18 to 34 Years | 0 (0.0%) | 8 (0.6%) |
| 35 to 64 Years | 0 (0.0%) | 178 (6.5%) |
| 65 to 74 Years | 16 (1.8%) | 42 (5.0%) |
| 75 Years and over | 8 (2.4%) | 92 (14.1%) |
Technology Access in Lumberton
Computing Device Access in Lumberton
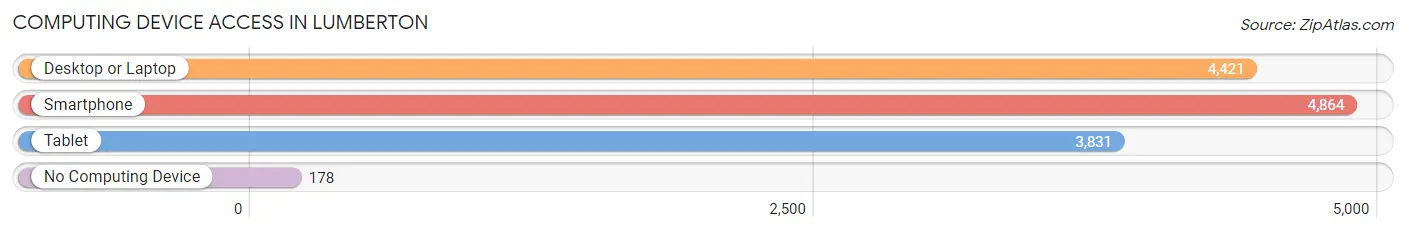
| Device Type | # Households | % Households |
| Desktop or Laptop | 4,421 | 83.2% |
| Smartphone | 4,864 | 91.5% |
| Tablet | 3,831 | 72.1% |
| No Computing Device | 178 | 3.4% |
| Total | 5,313 | 100.0% |
Internet Access in Lumberton
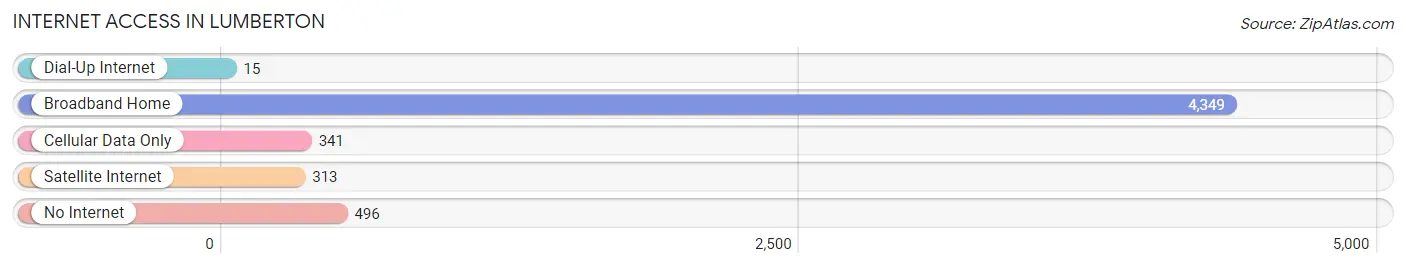
| Internet Type | # Households | % Households |
| Dial-Up Internet | 15 | 0.3% |
| Broadband Home | 4,349 | 81.9% |
| Cellular Data Only | 341 | 6.4% |
| Satellite Internet | 313 | 5.9% |
| No Internet | 496 | 9.3% |
| Total | 5,313 | 100.0% |
Lumberton Summary
Lumberton, Texas is a small city located in Hardin County, Texas, United States. It is situated on the banks of the Neches River, about 25 miles east of Beaumont. The city has a population of approximately 11,000 people and is part of the Beaumont–Port Arthur Metropolitan Statistical Area.
History
The area that is now Lumberton was first settled in the early 1800s by a group of settlers from the United States. The settlement was originally known as “Neches Settlement” and was located near the Neches River. The settlement was later renamed “Lumberton” in 1837, after the lumber industry that had developed in the area.
The city of Lumberton was officially incorporated in 1871. During the late 19th century, the city experienced a period of growth and prosperity due to the lumber industry. The city was also home to several sawmills and other businesses related to the lumber industry.
In the early 20th century, the lumber industry began to decline and the city’s economy shifted to other industries such as oil and gas. The city experienced a period of growth and prosperity during the oil boom of the 1920s and 1930s.
Geography
Lumberton is located in Hardin County, Texas, United States. It is situated on the banks of the Neches River, about 25 miles east of Beaumont. The city has a total area of 4.3 square miles, all of which is land.
The climate in Lumberton is classified as humid subtropical, with hot, humid summers and mild winters. The average annual temperature is 68°F, with an average high of 87°F in the summer and an average low of 48°F in the winter.
Economy
The economy of Lumberton is largely based on the oil and gas industry. The city is home to several oil and gas companies, as well as several related businesses. The city is also home to several manufacturing companies, including a paper mill and a plastics plant.
The city is also home to several retail stores, restaurants, and other businesses. The city is served by the Lumberton Independent School District.
Demographics
As of the 2010 census, the population of Lumberton was 11,039. The racial makeup of the city was 79.2% White, 15.3% African American, 0.7% Native American, 0.7% Asian, 0.1% Pacific Islander, 2.2% from other races, and 2.0% from two or more races. Hispanic or Latino of any race were 6.3% of the population.
The median income for a household in the city was $37,917, and the median income for a family was $45,917. The per capita income for the city was $19,917. About 14.2% of families and 17.3% of the population were below the poverty line, including 25.3% of those under age 18 and 11.2% of those age 65 or over.
Conclusion
Lumberton, Texas is a small city located in Hardin County, Texas, United States. It is situated on the banks of the Neches River, about 25 miles east of Beaumont. The city has a population of approximately 11,000 people and is part of the Beaumont–Port Arthur Metropolitan Statistical Area. The economy of Lumberton is largely based on the oil and gas industry, as well as several other industries. The racial makeup of the city is 79.2% White, 15.3% African American, 0.7% Native American, 0.7% Asian, 0.1% Pacific Islander, 2.2% from other races, and 2.0% from two or more races. The median income for a household in the city was $37,917, and the median income for a family was $45,917. The per capita income for the city was $19,917.
Common Questions
What is Per Capita Income in Lumberton?
Per Capita income in Lumberton is $45,137.
What is the Median Family Income in Lumberton?
Median Family Income in Lumberton is $113,566.
What is the Median Household income in Lumberton?
Median Household Income in Lumberton is $99,066.
What is Income or Wage Gap in Lumberton?
Income or Wage Gap in Lumberton is 41.1%.
Women in Lumberton earn 58.9 cents for every dollar earned by a man.
What is Inequality or Gini Index in Lumberton?
Inequality or Gini Index in Lumberton is 0.37.
What is the Total Population of Lumberton?
Total Population of Lumberton is 13,613.
What is the Total Male Population of Lumberton?
Total Male Population of Lumberton is 6,564.
What is the Total Female Population of Lumberton?
Total Female Population of Lumberton is 7,049.
What is the Ratio of Males per 100 Females in Lumberton?
There are 93.12 Males per 100 Females in Lumberton.
What is the Ratio of Females per 100 Males in Lumberton?
There are 107.39 Females per 100 Males in Lumberton.
What is the Median Population Age in Lumberton?
Median Population Age in Lumberton is 41.3 Years.
What is the Average Family Size in Lumberton
Average Family Size in Lumberton is 2.9 People.
What is the Average Household Size in Lumberton
Average Household Size in Lumberton is 2.5 People.
How Large is the Labor Force in Lumberton?
There are 6,746 People in the Labor Forcein in Lumberton.
What is the Percentage of People in the Labor Force in Lumberton?
61.9% of People are in the Labor Force in Lumberton.
What is the Unemployment Rate in Lumberton?
Unemployment Rate in Lumberton is 3.5%.