Lakeway, TX Map & Demographics
Lakeway Map
Lakeway Overview
$85,011
PER CAPITA INCOME
$181,588
AVG FAMILY INCOME
$154,118
AVG HOUSEHOLD INCOME
45.1%
WAGE / INCOME GAP [ % ]
54.9¢/ $1
WAGE / INCOME GAP [ $ ]
0.45
INEQUALITY / GINI INDEX
18,835
TOTAL POPULATION
9,221
MALE POPULATION
9,614
FEMALE POPULATION
95.91
MALES / 100 FEMALES
104.26
FEMALES / 100 MALES
50.2
MEDIAN AGE
2.7
AVG FAMILY SIZE
2.4
AVG HOUSEHOLD SIZE
8,775
LABOR FORCE [ PEOPLE ]
57.4%
PERCENT IN LABOR FORCE
2.8%
UNEMPLOYMENT RATE
Lakeway Area Codes
Income in Lakeway
Income Overview in Lakeway
Per Capita Income in Lakeway is $85,011, while median incomes of families and households are $181,588 and $154,118 respectively.
| Characteristic | Number | Measure |
| Per Capita Income | 18,835 | $85,011 |
| Median Family Income | 6,237 | $181,588 |
| Mean Family Income | 6,237 | $229,717 |
| Median Household Income | 7,745 | $154,118 |
| Mean Household Income | 7,745 | $204,150 |
| Income Deficit | 6,237 | $0 |
| Wage / Income Gap (%) | 18,835 | 45.13% |
| Wage / Income Gap ($) | 18,835 | 54.87¢ per $1 |
| Gini / Inequality Index | 18,835 | 0.45 |
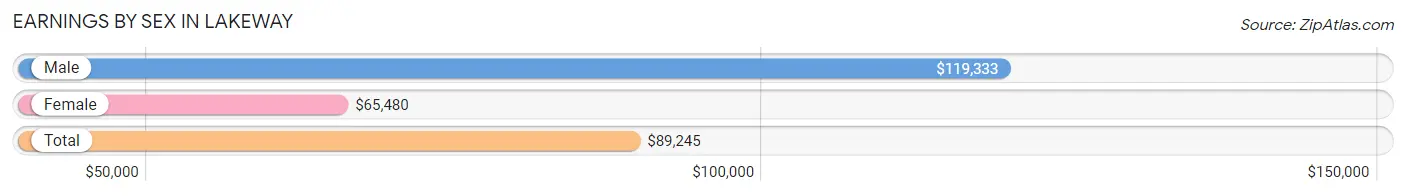
Earnings by Sex in Lakeway
Average Earnings in Lakeway are $89,245, $119,333 for men and $65,480 for women, a difference of 45.1%.
| Sex | Number | Average Earnings |
| Male | 5,208 (55.5%) | $119,333 |
| Female | 4,175 (44.5%) | $65,480 |
| Total | 9,383 (100.0%) | $89,245 |
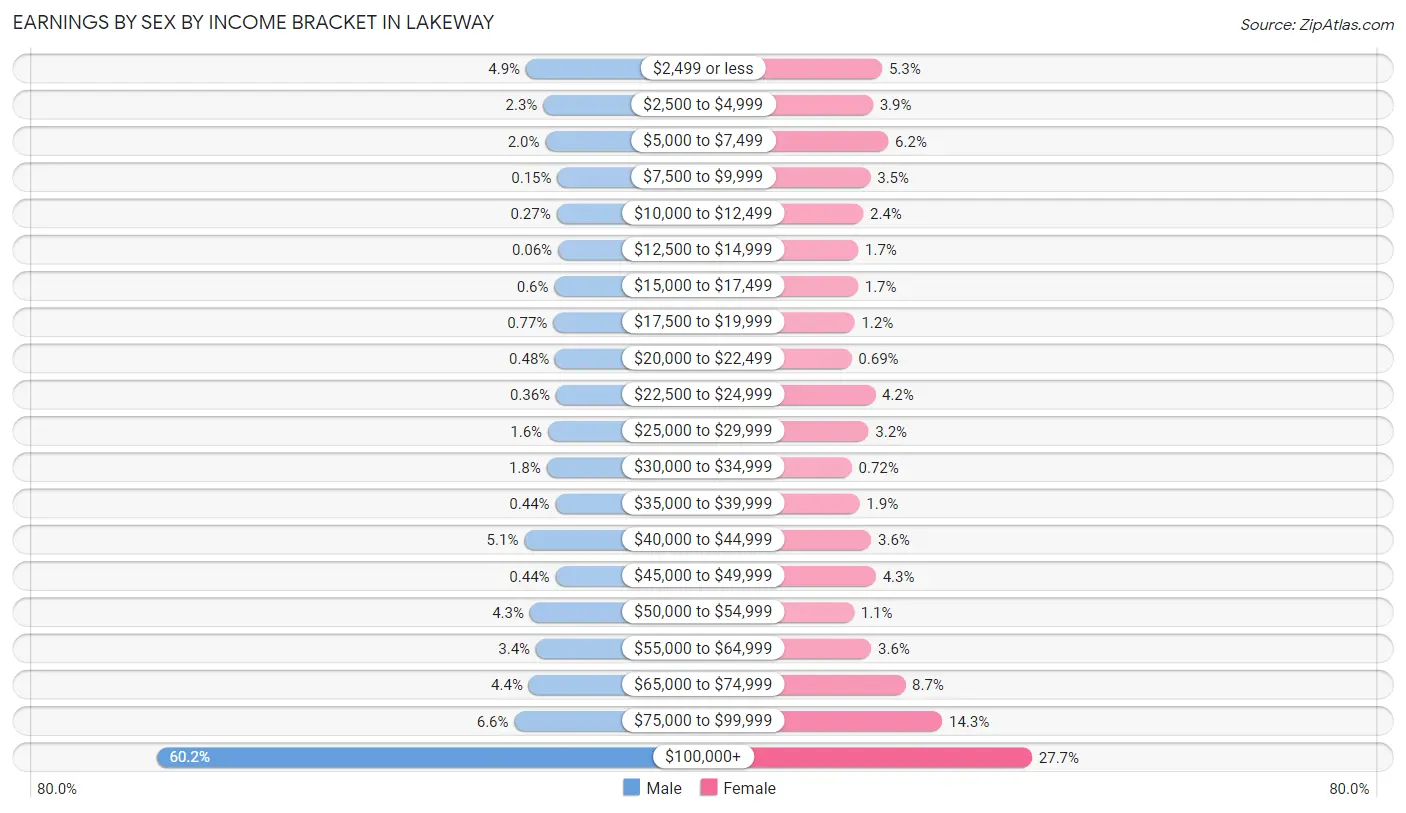
Earnings by Sex by Income Bracket in Lakeway
The most common earnings brackets in Lakeway are $100,000+ for men (3,137 | 60.2%) and $100,000+ for women (1,158 | 27.7%).
| Income | Male | Female |
| $2,499 or less | 253 (4.9%) | 220 (5.3%) |
| $2,500 to $4,999 | 119 (2.3%) | 162 (3.9%) |
| $5,000 to $7,499 | 102 (2.0%) | 259 (6.2%) |
| $7,500 to $9,999 | 8 (0.2%) | 147 (3.5%) |
| $10,000 to $12,499 | 14 (0.3%) | 102 (2.4%) |
| $12,500 to $14,999 | 3 (0.1%) | 71 (1.7%) |
| $15,000 to $17,499 | 31 (0.6%) | 69 (1.7%) |
| $17,500 to $19,999 | 40 (0.8%) | 48 (1.1%) |
| $20,000 to $22,499 | 25 (0.5%) | 29 (0.7%) |
| $22,500 to $24,999 | 19 (0.4%) | 176 (4.2%) |
| $25,000 to $29,999 | 81 (1.6%) | 135 (3.2%) |
| $30,000 to $34,999 | 92 (1.8%) | 30 (0.7%) |
| $35,000 to $39,999 | 23 (0.4%) | 79 (1.9%) |
| $40,000 to $44,999 | 266 (5.1%) | 152 (3.6%) |
| $45,000 to $49,999 | 23 (0.4%) | 181 (4.3%) |
| $50,000 to $54,999 | 223 (4.3%) | 44 (1.1%) |
| $55,000 to $64,999 | 175 (3.4%) | 152 (3.6%) |
| $65,000 to $74,999 | 231 (4.4%) | 365 (8.7%) |
| $75,000 to $99,999 | 343 (6.6%) | 596 (14.3%) |
| $100,000+ | 3,137 (60.2%) | 1,158 (27.7%) |
| Total | 5,208 (100.0%) | 4,175 (100.0%) |
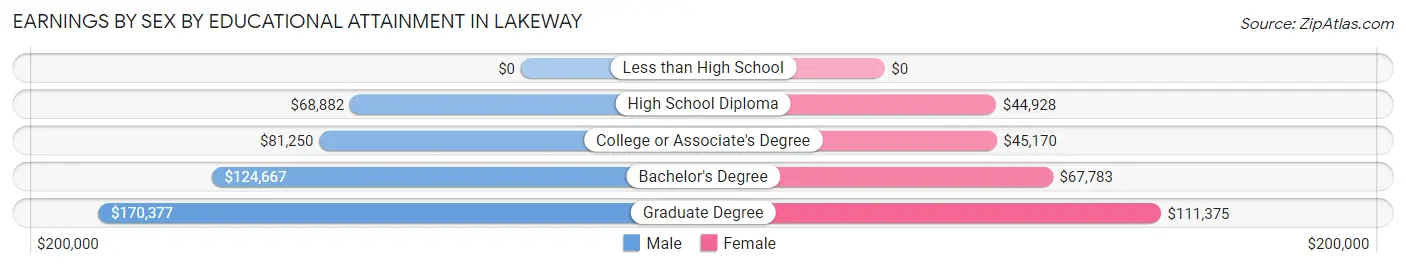
Earnings by Sex by Educational Attainment in Lakeway
Average earnings in Lakeway are $128,090 for men and $68,528 for women, a difference of 46.5%. Men with an educational attainment of graduate degree enjoy the highest average annual earnings of $170,377, while those with high school diploma education earn the least with $68,882. Women with an educational attainment of graduate degree earn the most with the average annual earnings of $111,375, while those with high school diploma education have the smallest earnings of $44,928.
| Educational Attainment | Male Income | Female Income |
| Less than High School | - | - |
| High School Diploma | $68,882 | $44,928 |
| College or Associate's Degree | $81,250 | $45,170 |
| Bachelor's Degree | $124,667 | $67,783 |
| Graduate Degree | $170,377 | $111,375 |
| Total | $128,090 | $68,528 |
Family Income in Lakeway
Family Income Brackets in Lakeway
According to the Lakeway family income data, there are 2,794 families falling into the $200,000+ income range, which is the most common income bracket and makes up 44.8% of all families. Conversely, the $10,000 to $14,999 income bracket is the least frequent group with only 25 families (0.4%) belonging to this category.
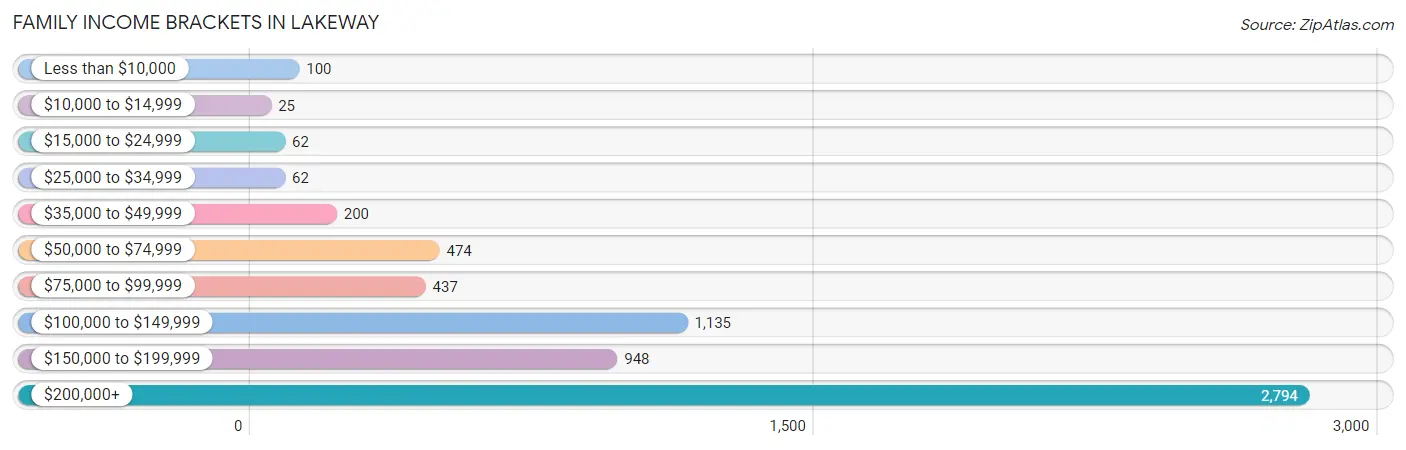
| Income Bracket | # Families | % Families |
| Less than $10,000 | 100 | 1.6% |
| $10,000 to $14,999 | 25 | 0.4% |
| $15,000 to $24,999 | 62 | 1.0% |
| $25,000 to $34,999 | 62 | 1.0% |
| $35,000 to $49,999 | 200 | 3.2% |
| $50,000 to $74,999 | 474 | 7.6% |
| $75,000 to $99,999 | 437 | 7.0% |
| $100,000 to $149,999 | 1,135 | 18.2% |
| $150,000 to $199,999 | 948 | 15.2% |
| $200,000+ | 2,794 | 44.8% |
Family Income by Famaliy Size in Lakeway
6-person families (74 | 1.2%) account for the highest median family income in Lakeway with $250,001 per family, while 2-person families (3,552 | 57.0%) have the highest median income of $73,214 per family member.
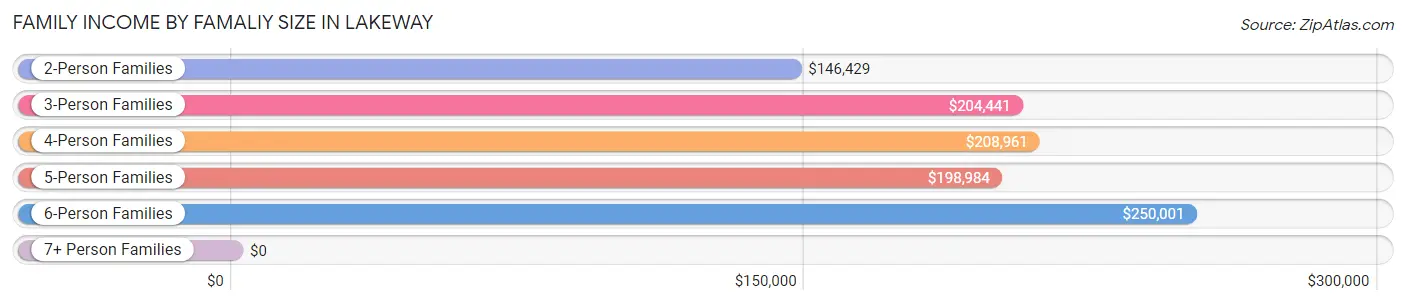
| Income Bracket | # Families | Median Income |
| 2-Person Families | 3,552 (57.0%) | $146,429 |
| 3-Person Families | 1,127 (18.1%) | $204,441 |
| 4-Person Families | 1,071 (17.2%) | $208,961 |
| 5-Person Families | 394 (6.3%) | $198,984 |
| 6-Person Families | 74 (1.2%) | $250,001 |
| 7+ Person Families | 19 (0.3%) | $0 |
| Total | 6,237 (100.0%) | $181,588 |
Family Income by Number of Earners in Lakeway
The median family income in Lakeway is $181,588, with families comprising 3+ earners (389) having the highest median family income of $250,001, while families with no earners (1,203) have the lowest median family income of $92,434, accounting for 6.2% and 19.3% of families, respectively.
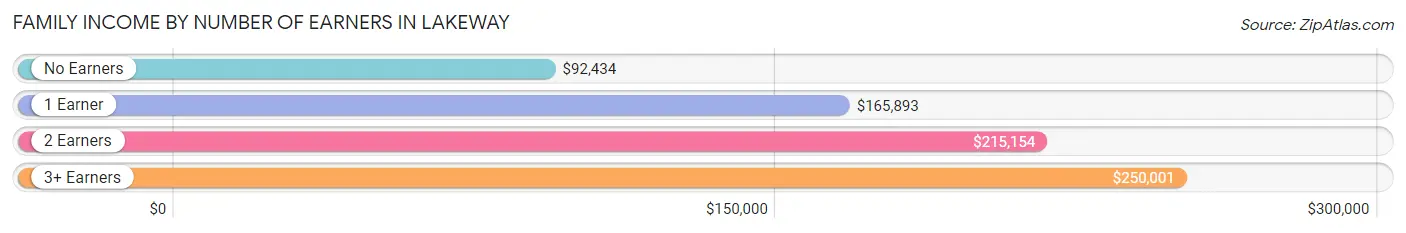
| Number of Earners | # Families | Median Income |
| No Earners | 1,203 (19.3%) | $92,434 |
| 1 Earner | 2,138 (34.3%) | $165,893 |
| 2 Earners | 2,507 (40.2%) | $215,154 |
| 3+ Earners | 389 (6.2%) | $250,001 |
| Total | 6,237 (100.0%) | $181,588 |
Household Income in Lakeway
Household Income Brackets in Lakeway
With 2,928 households falling in the category, the $200,000+ income range is the most frequent in Lakeway, accounting for 37.8% of all households. In contrast, only 39 households (0.5%) fall into the $10,000 to $14,999 income bracket, making it the least populous group.
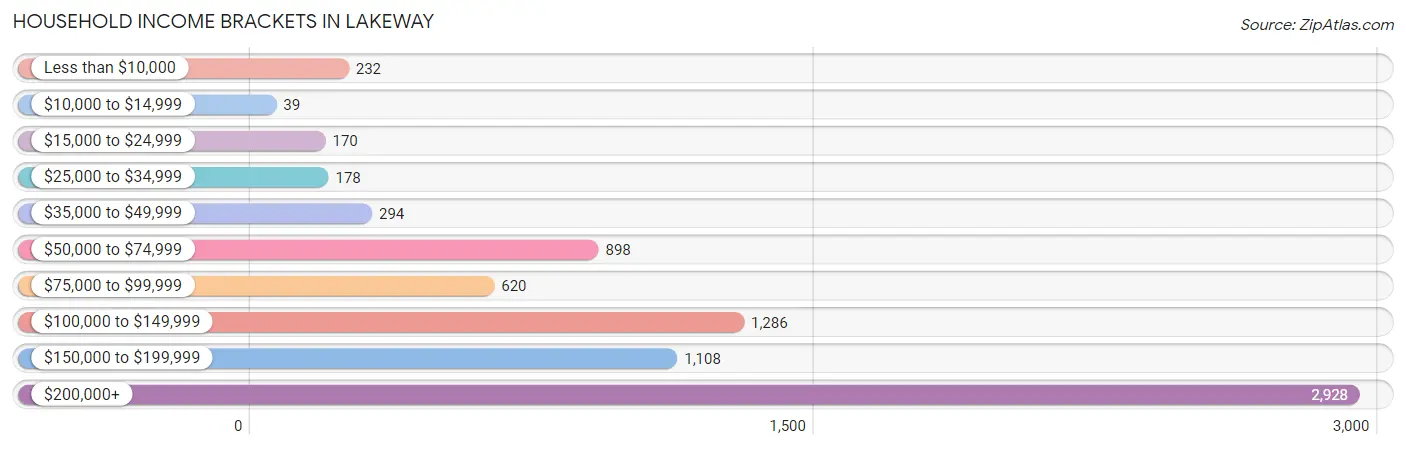
| Income Bracket | # Households | % Households |
| Less than $10,000 | 232 | 3.0% |
| $10,000 to $14,999 | 39 | 0.5% |
| $15,000 to $24,999 | 170 | 2.2% |
| $25,000 to $34,999 | 178 | 2.3% |
| $35,000 to $49,999 | 294 | 3.8% |
| $50,000 to $74,999 | 898 | 11.6% |
| $75,000 to $99,999 | 620 | 8.0% |
| $100,000 to $149,999 | 1,286 | 16.6% |
| $150,000 to $199,999 | 1,108 | 14.3% |
| $200,000+ | 2,928 | 37.8% |
Household Income by Householder Age in Lakeway
The median household income in Lakeway is $154,118, with the highest median household income of $191,071 found in the 25 to 44 years age bracket for the primary householder. A total of 1,602 households (20.7%) fall into this category.
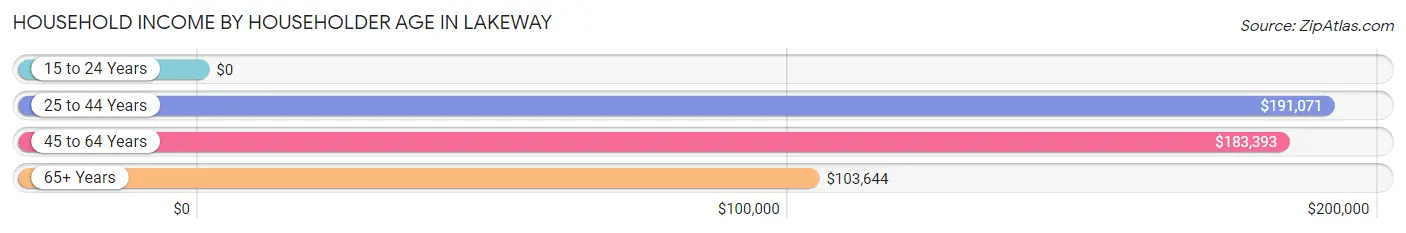
| Income Bracket | # Households | Median Income |
| 15 to 24 Years | 0 (0.0%) | $0 |
| 25 to 44 Years | 1,602 (20.7%) | $191,071 |
| 45 to 64 Years | 3,559 (46.0%) | $183,393 |
| 65+ Years | 2,584 (33.4%) | $103,644 |
| Total | 7,745 (100.0%) | $154,118 |
Poverty in Lakeway
Income Below Poverty by Sex and Age in Lakeway
With 2.0% poverty level for males and 3.9% for females among the residents of Lakeway, 6 to 11 year old males and 55 to 64 year old females are the most vulnerable to poverty, with 26 males (4.1%) and 129 females (9.0%) in their respective age groups living below the poverty level.
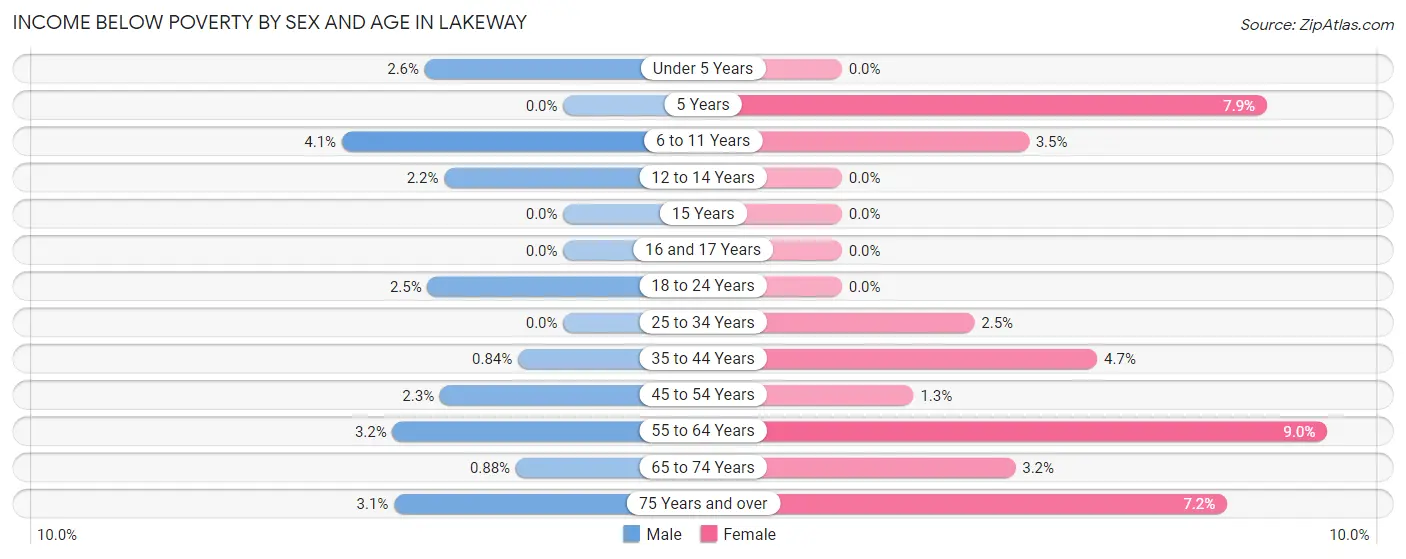
| Age Bracket | Male | Female |
| Under 5 Years | 9 (2.6%) | 0 (0.0%) |
| 5 Years | 0 (0.0%) | 9 (7.9%) |
| 6 to 11 Years | 26 (4.1%) | 31 (3.5%) |
| 12 to 14 Years | 9 (2.2%) | 0 (0.0%) |
| 15 Years | 0 (0.0%) | 0 (0.0%) |
| 16 and 17 Years | 0 (0.0%) | 0 (0.0%) |
| 18 to 24 Years | 8 (2.5%) | 0 (0.0%) |
| 25 to 34 Years | 0 (0.0%) | 11 (2.5%) |
| 35 to 44 Years | 10 (0.8%) | 51 (4.7%) |
| 45 to 54 Years | 34 (2.3%) | 22 (1.3%) |
| 55 to 64 Years | 53 (3.2%) | 129 (9.0%) |
| 65 to 74 Years | 11 (0.9%) | 53 (3.2%) |
| 75 Years and over | 23 (3.1%) | 63 (7.1%) |
| Total | 183 (2.0%) | 369 (3.9%) |
Income Above Poverty by Sex and Age in Lakeway
According to the poverty statistics in Lakeway, males aged 5 years and females aged under 5 years are the age groups that are most secure financially, with 100.0% of males and 100.0% of females in these age groups living above the poverty line.
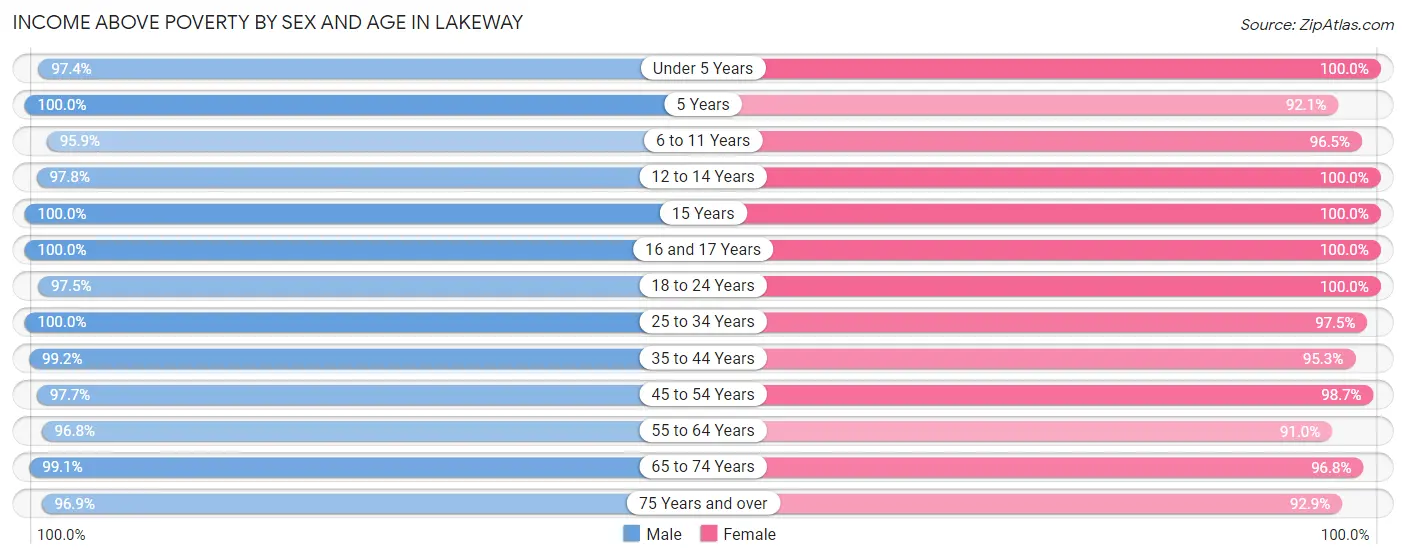
| Age Bracket | Male | Female |
| Under 5 Years | 341 (97.4%) | 412 (100.0%) |
| 5 Years | 120 (100.0%) | 105 (92.1%) |
| 6 to 11 Years | 607 (95.9%) | 862 (96.5%) |
| 12 to 14 Years | 399 (97.8%) | 300 (100.0%) |
| 15 Years | 165 (100.0%) | 153 (100.0%) |
| 16 and 17 Years | 392 (100.0%) | 212 (100.0%) |
| 18 to 24 Years | 309 (97.5%) | 334 (100.0%) |
| 25 to 34 Years | 471 (100.0%) | 437 (97.5%) |
| 35 to 44 Years | 1,178 (99.2%) | 1,024 (95.3%) |
| 45 to 54 Years | 1,449 (97.7%) | 1,627 (98.7%) |
| 55 to 64 Years | 1,617 (96.8%) | 1,302 (91.0%) |
| 65 to 74 Years | 1,233 (99.1%) | 1,595 (96.8%) |
| 75 Years and over | 709 (96.9%) | 818 (92.8%) |
| Total | 8,990 (98.0%) | 9,181 (96.1%) |
Income Below Poverty Among Married-Couple Families in Lakeway
The poverty statistics for married-couple families in Lakeway show that 1.7% or 86 of the total 5,206 families live below the poverty line. Families with no children have the highest poverty rate of 2.3%, comprising of 77 families. On the other hand, families with 3 or 4 children have the lowest poverty rate of 0.0%, which includes 0 families.
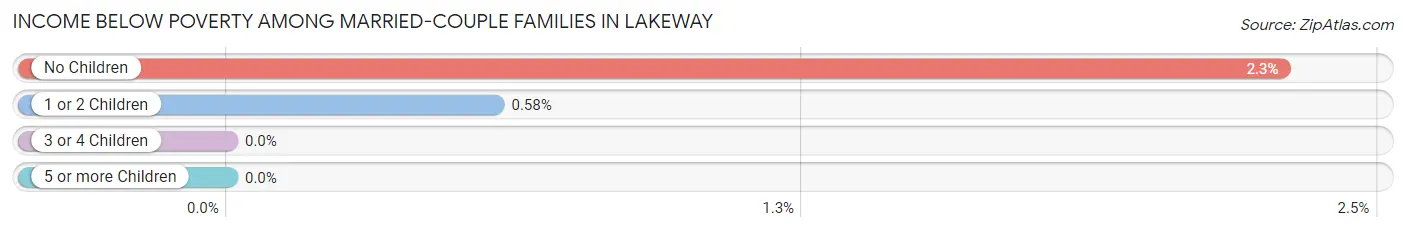
| Children | Above Poverty | Below Poverty |
| No Children | 3,288 (97.7%) | 77 (2.3%) |
| 1 or 2 Children | 1,556 (99.4%) | 9 (0.6%) |
| 3 or 4 Children | 257 (100.0%) | 0 (0.0%) |
| 5 or more Children | 19 (100.0%) | 0 (0.0%) |
| Total | 5,120 (98.4%) | 86 (1.7%) |
Income Below Poverty Among Single-Parent Households in Lakeway
According to the poverty data in Lakeway, 3.1% or 9 single-father households and 7.8% or 58 single-mother households are living below the poverty line. Among single-father households, those with no children have the highest poverty rate, with 9 households (28.1%) experiencing poverty. Likewise, among single-mother households, those with 1 or 2 children have the highest poverty rate, with 49 households (11.6%) falling below the poverty line.
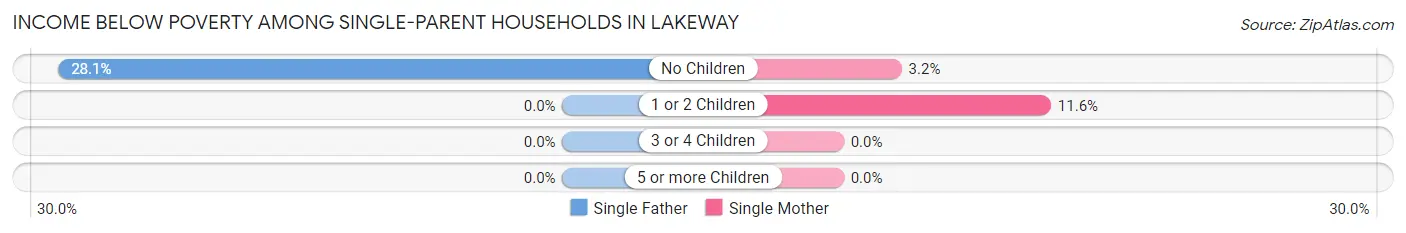
| Children | Single Father | Single Mother |
| No Children | 9 (28.1%) | 9 (3.2%) |
| 1 or 2 Children | 0 (0.0%) | 49 (11.6%) |
| 3 or 4 Children | 0 (0.0%) | 0 (0.0%) |
| 5 or more Children | 0 (0.0%) | 0 (0.0%) |
| Total | 9 (3.1%) | 58 (7.8%) |
Income Below Poverty Among Married-Couple vs Single-Parent Households in Lakeway
The poverty data for Lakeway shows that 86 of the married-couple family households (1.7%) and 67 of the single-parent households (6.5%) are living below the poverty level. Within the married-couple family households, those with no children have the highest poverty rate, with 77 households (2.3%) falling below the poverty line. Among the single-parent households, those with 1 or 2 children have the highest poverty rate, with 49 household (7.8%) living below poverty.
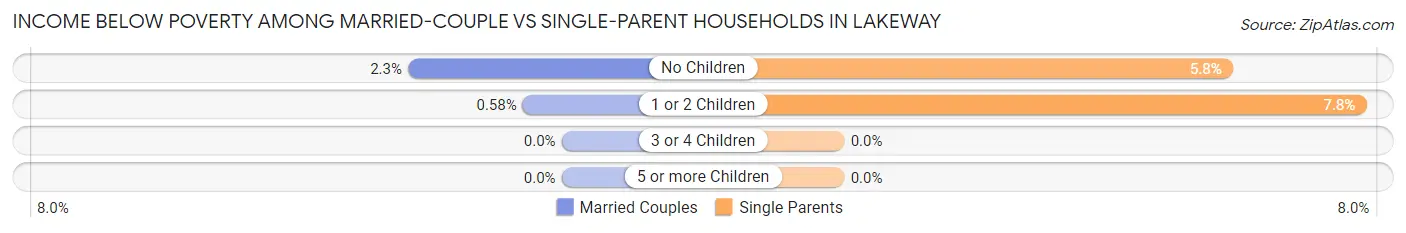
| Children | Married-Couple Families | Single-Parent Households |
| No Children | 77 (2.3%) | 18 (5.8%) |
| 1 or 2 Children | 9 (0.6%) | 49 (7.8%) |
| 3 or 4 Children | 0 (0.0%) | 0 (0.0%) |
| 5 or more Children | 0 (0.0%) | 0 (0.0%) |
| Total | 86 (1.7%) | 67 (6.5%) |
Race in Lakeway
The most populous races in Lakeway are White / Caucasian (15,772 | 83.7%), Hispanic or Latino (1,963 | 10.4%), and Two or more Races (1,325 | 7.0%).
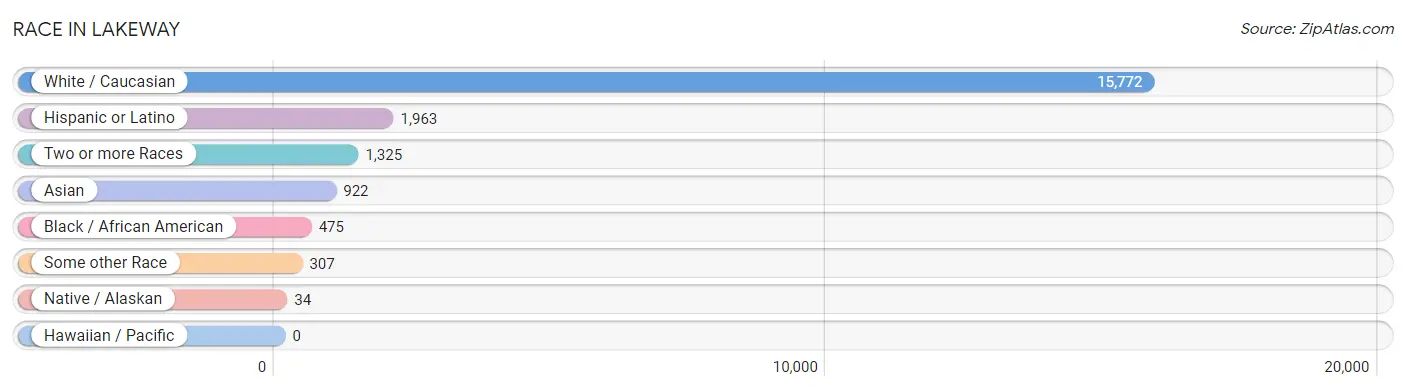
| Race | # Population | % Population |
| Asian | 922 | 4.9% |
| Black / African American | 475 | 2.5% |
| Hawaiian / Pacific | 0 | 0.0% |
| Hispanic or Latino | 1,963 | 10.4% |
| Native / Alaskan | 34 | 0.2% |
| White / Caucasian | 15,772 | 83.7% |
| Two or more Races | 1,325 | 7.0% |
| Some other Race | 307 | 1.6% |
| Total | 18,835 | 100.0% |
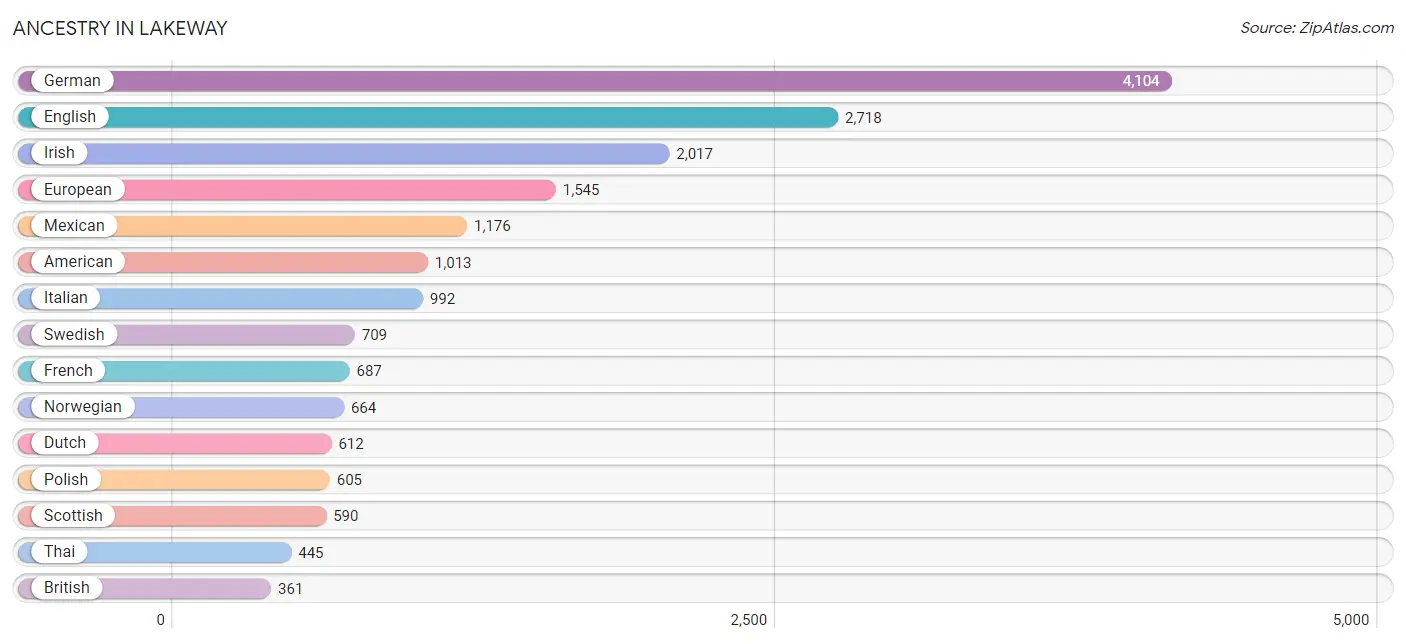
Ancestry in Lakeway
The most populous ancestries reported in Lakeway are German (4,104 | 21.8%), English (2,718 | 14.4%), Irish (2,017 | 10.7%), European (1,545 | 8.2%), and Mexican (1,176 | 6.2%), together accounting for 61.4% of all Lakeway residents.
| Ancestry | # Population | % Population |
| African | 148 | 0.8% |
| Albanian | 61 | 0.3% |
| American | 1,013 | 5.4% |
| Apache | 9 | 0.1% |
| Arab | 106 | 0.6% |
| Armenian | 8 | 0.0% |
| Austrian | 95 | 0.5% |
| Bhutanese | 104 | 0.5% |
| Blackfeet | 9 | 0.1% |
| Brazilian | 7 | 0.0% |
| British | 361 | 1.9% |
| Bulgarian | 54 | 0.3% |
| Burmese | 30 | 0.2% |
| Canadian | 30 | 0.2% |
| Central American | 247 | 1.3% |
| Cherokee | 130 | 0.7% |
| Chilean | 128 | 0.7% |
| Colombian | 12 | 0.1% |
| Croatian | 9 | 0.1% |
| Czech | 317 | 1.7% |
| Danish | 121 | 0.6% |
| Dutch | 612 | 3.3% |
| Eastern European | 50 | 0.3% |
| English | 2,718 | 14.4% |
| European | 1,545 | 8.2% |
| Finnish | 84 | 0.4% |
| French | 687 | 3.6% |
| French Canadian | 43 | 0.2% |
| German | 4,104 | 21.8% |
| Greek | 83 | 0.4% |
| Honduran | 79 | 0.4% |
| Hungarian | 33 | 0.2% |
| Icelander | 8 | 0.0% |
| Indian (Asian) | 292 | 1.5% |
| Iranian | 31 | 0.2% |
| Irish | 2,017 | 10.7% |
| Iroquois | 21 | 0.1% |
| Israeli | 4 | 0.0% |
| Italian | 992 | 5.3% |
| Jamaican | 79 | 0.4% |
| Korean | 35 | 0.2% |
| Lebanese | 46 | 0.2% |
| Lithuanian | 22 | 0.1% |
| Luxembourger | 17 | 0.1% |
| Mexican | 1,176 | 6.2% |
| Navajo | 19 | 0.1% |
| Nicaraguan | 168 | 0.9% |
| Northern European | 33 | 0.2% |
| Norwegian | 664 | 3.5% |
| Pakistani | 9 | 0.1% |
| Polish | 605 | 3.2% |
| Puerto Rican | 129 | 0.7% |
| Russian | 159 | 0.8% |
| Scandinavian | 94 | 0.5% |
| Scotch-Irish | 282 | 1.5% |
| Scottish | 590 | 3.1% |
| Sioux | 127 | 0.7% |
| Slovak | 12 | 0.1% |
| South American | 140 | 0.7% |
| Spaniard | 68 | 0.4% |
| Spanish | 164 | 0.9% |
| Sri Lankan | 162 | 0.9% |
| Subsaharan African | 148 | 0.8% |
| Swedish | 709 | 3.8% |
| Swiss | 142 | 0.7% |
| Syrian | 33 | 0.2% |
| Thai | 445 | 2.4% |
| Ukrainian | 9 | 0.1% |
| Vietnamese | 66 | 0.4% |
| Welsh | 70 | 0.4% | View All 70 Rows |
Immigrants in Lakeway
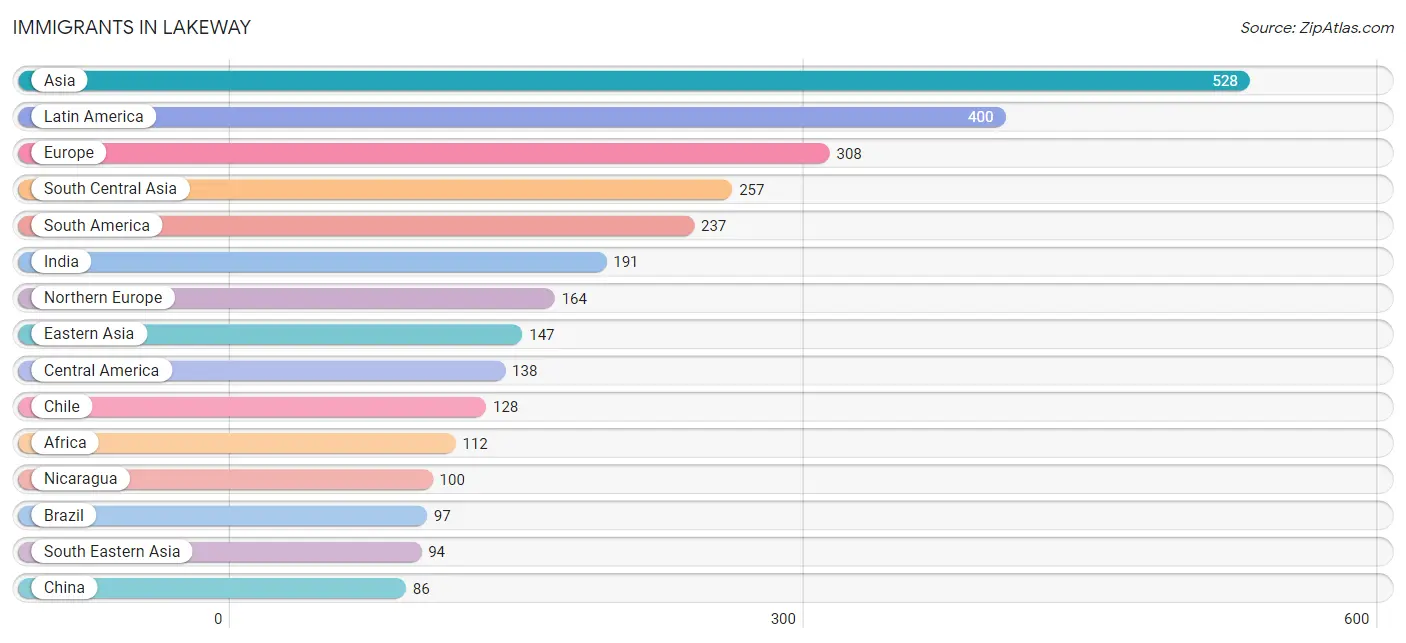
The most numerous immigrant groups reported in Lakeway came from Asia (528 | 2.8%), Latin America (400 | 2.1%), Europe (308 | 1.6%), South Central Asia (257 | 1.4%), and South America (237 | 1.3%), together accounting for 9.2% of all Lakeway residents.
| Immigration Origin | # Population | % Population |
| Africa | 112 | 0.6% |
| Asia | 528 | 2.8% |
| Australia | 9 | 0.1% |
| Austria | 10 | 0.1% |
| Bangladesh | 35 | 0.2% |
| Brazil | 97 | 0.5% |
| Bulgaria | 14 | 0.1% |
| Canada | 66 | 0.4% |
| Caribbean | 25 | 0.1% |
| Central America | 138 | 0.7% |
| Chile | 128 | 0.7% |
| China | 86 | 0.5% |
| Colombia | 12 | 0.1% |
| Czechoslovakia | 24 | 0.1% |
| Eastern Africa | 69 | 0.4% |
| Eastern Asia | 147 | 0.8% |
| Eastern Europe | 58 | 0.3% |
| England | 38 | 0.2% |
| Eritrea | 69 | 0.4% |
| Europe | 308 | 1.6% |
| Germany | 9 | 0.1% |
| Hong Kong | 15 | 0.1% |
| India | 191 | 1.0% |
| Indonesia | 9 | 0.1% |
| Iran | 31 | 0.2% |
| Jamaica | 25 | 0.1% |
| Japan | 31 | 0.2% |
| Korea | 30 | 0.2% |
| Latin America | 400 | 2.1% |
| Mexico | 38 | 0.2% |
| Netherlands | 67 | 0.4% |
| Nicaragua | 100 | 0.5% |
| Northern Africa | 27 | 0.1% |
| Northern Europe | 164 | 0.9% |
| Norway | 34 | 0.2% |
| Oceania | 9 | 0.1% |
| Philippines | 40 | 0.2% |
| South Africa | 16 | 0.1% |
| South America | 237 | 1.3% |
| South Central Asia | 257 | 1.4% |
| South Eastern Asia | 94 | 0.5% |
| Taiwan | 10 | 0.1% |
| Ukraine | 20 | 0.1% |
| Vietnam | 45 | 0.2% |
| Western Asia | 30 | 0.2% |
| Western Europe | 86 | 0.5% |
| Yemen | 30 | 0.2% | View All 47 Rows |
Sex and Age in Lakeway
Sex and Age in Lakeway
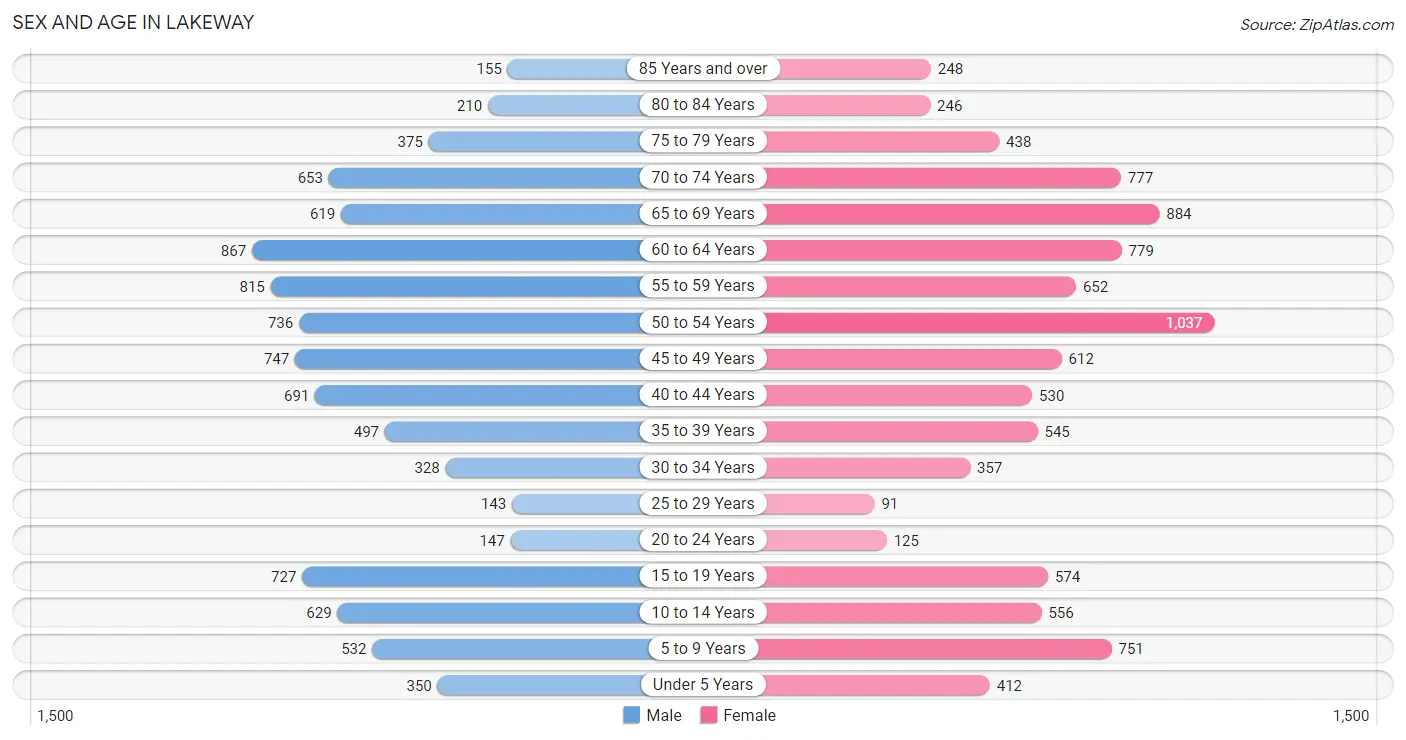
The most populous age groups in Lakeway are 60 to 64 Years (867 | 9.4%) for men and 50 to 54 Years (1,037 | 10.8%) for women.
| Age Bracket | Male | Female |
| Under 5 Years | 350 (3.8%) | 412 (4.3%) |
| 5 to 9 Years | 532 (5.8%) | 751 (7.8%) |
| 10 to 14 Years | 629 (6.8%) | 556 (5.8%) |
| 15 to 19 Years | 727 (7.9%) | 574 (6.0%) |
| 20 to 24 Years | 147 (1.6%) | 125 (1.3%) |
| 25 to 29 Years | 143 (1.5%) | 91 (0.9%) |
| 30 to 34 Years | 328 (3.6%) | 357 (3.7%) |
| 35 to 39 Years | 497 (5.4%) | 545 (5.7%) |
| 40 to 44 Years | 691 (7.5%) | 530 (5.5%) |
| 45 to 49 Years | 747 (8.1%) | 612 (6.4%) |
| 50 to 54 Years | 736 (8.0%) | 1,037 (10.8%) |
| 55 to 59 Years | 815 (8.8%) | 652 (6.8%) |
| 60 to 64 Years | 867 (9.4%) | 779 (8.1%) |
| 65 to 69 Years | 619 (6.7%) | 884 (9.2%) |
| 70 to 74 Years | 653 (7.1%) | 777 (8.1%) |
| 75 to 79 Years | 375 (4.1%) | 438 (4.6%) |
| 80 to 84 Years | 210 (2.3%) | 246 (2.6%) |
| 85 Years and over | 155 (1.7%) | 248 (2.6%) |
| Total | 9,221 (100.0%) | 9,614 (100.0%) |
Families and Households in Lakeway
Median Family Size in Lakeway
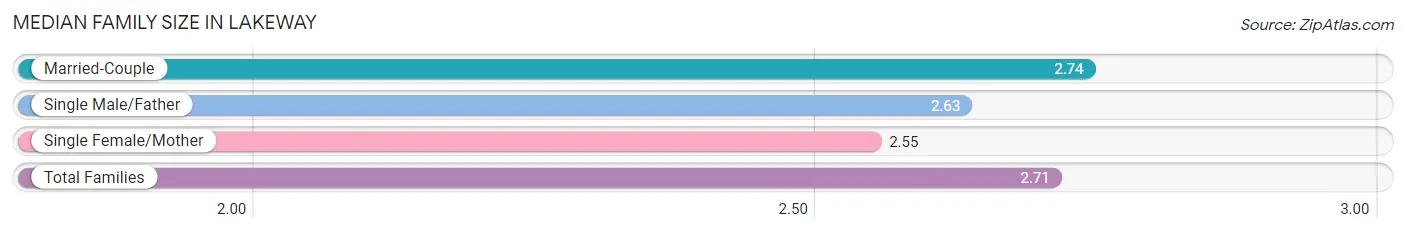
The median family size in Lakeway is 2.71 persons per family, with married-couple families (5,206 | 83.5%) accounting for the largest median family size of 2.74 persons per family. On the other hand, single female/mother families (744 | 11.9%) represent the smallest median family size with 2.55 persons per family.
| Family Type | # Families | Family Size |
| Married-Couple | 5,206 (83.5%) | 2.74 |
| Single Male/Father | 287 (4.6%) | 2.63 |
| Single Female/Mother | 744 (11.9%) | 2.55 |
| Total Families | 6,237 (100.0%) | 2.71 |
Median Household Size in Lakeway
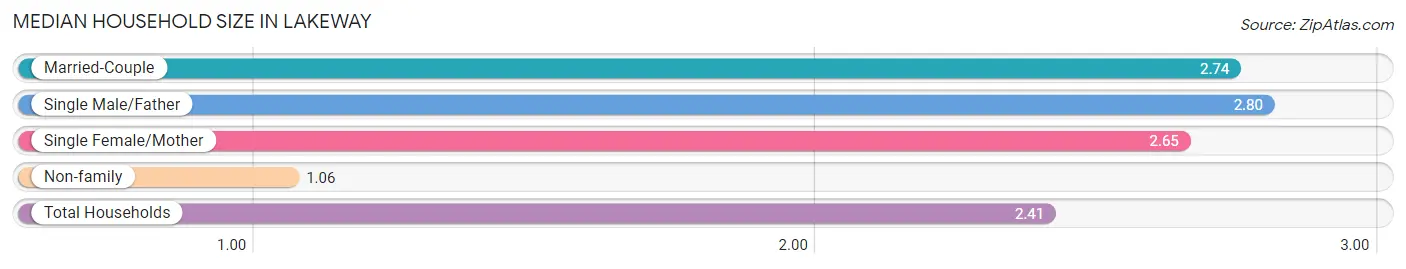
The median household size in Lakeway is 2.41 persons per household, with single male/father households (287 | 3.7%) accounting for the largest median household size of 2.8 persons per household. non-family households (1,508 | 19.5%) represent the smallest median household size with 1.06 persons per household.
| Household Type | # Households | Household Size |
| Married-Couple | 5,206 (67.2%) | 2.74 |
| Single Male/Father | 287 (3.7%) | 2.80 |
| Single Female/Mother | 744 (9.6%) | 2.65 |
| Non-family | 1,508 (19.5%) | 1.06 |
| Total Households | 7,745 (100.0%) | 2.41 |
Household Size by Marriage Status in Lakeway
Out of a total of 7,745 households in Lakeway, 6,237 (80.5%) are family households, while 1,508 (19.5%) are nonfamily households. The most numerous type of family households are 2-person households, comprising 3,485, and the most common type of nonfamily households are 1-person households, comprising 1,422.
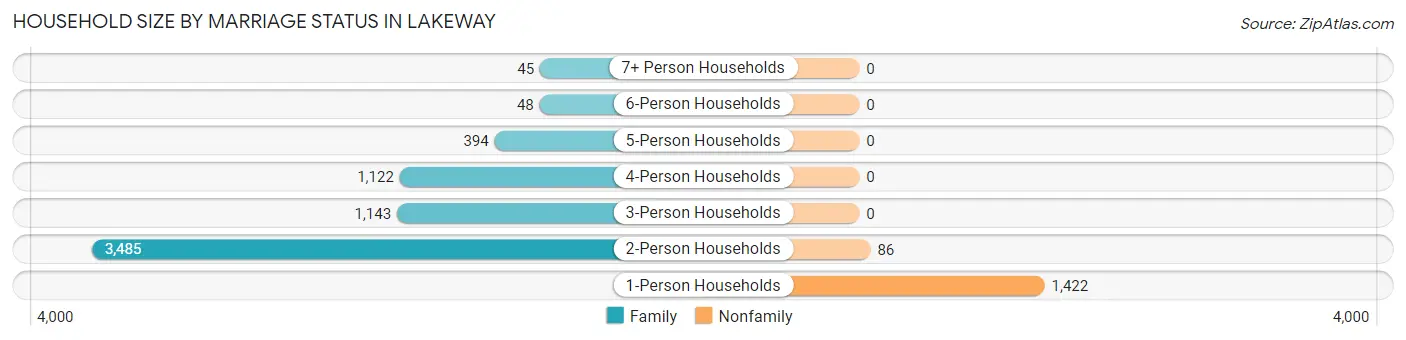
| Household Size | Family Households | Nonfamily Households |
| 1-Person Households | - | 1,422 (18.4%) |
| 2-Person Households | 3,485 (45.0%) | 86 (1.1%) |
| 3-Person Households | 1,143 (14.8%) | 0 (0.0%) |
| 4-Person Households | 1,122 (14.5%) | 0 (0.0%) |
| 5-Person Households | 394 (5.1%) | 0 (0.0%) |
| 6-Person Households | 48 (0.6%) | 0 (0.0%) |
| 7+ Person Households | 45 (0.6%) | 0 (0.0%) |
| Total | 6,237 (80.5%) | 1,508 (19.5%) |
Female Fertility in Lakeway
Fertility by Age in Lakeway
Average fertility rate in Lakeway is 52.0 births per 1,000 women. Women in the age bracket of 20 to 34 years have the highest fertility rate with 176.0 births per 1,000 women. Women in the age bracket of 20 to 34 years acount for 62.7% of all women with births.
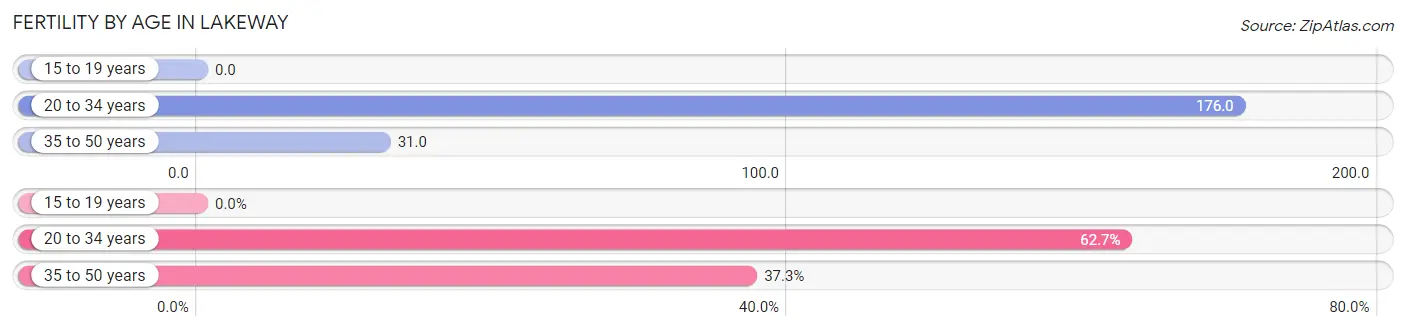
| Age Bracket | Women with Births | Births / 1,000 Women |
| 15 to 19 years | 0 (0.0%) | 0.0 |
| 20 to 34 years | 101 (62.7%) | 176.0 |
| 35 to 50 years | 60 (37.3%) | 31.0 |
| Total | 161 (100.0%) | 52.0 |
Fertility by Age by Marriage Status in Lakeway
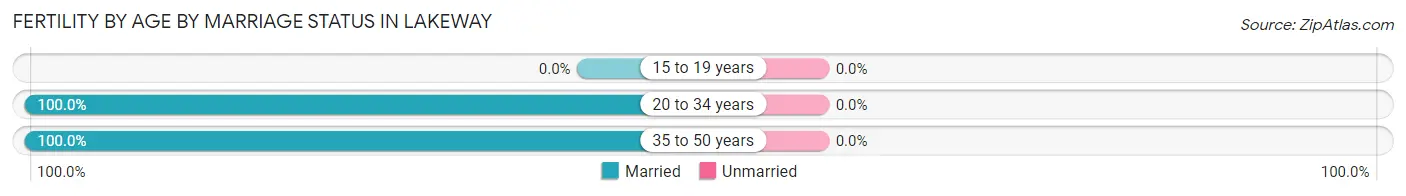
| Age Bracket | Married | Unmarried |
| 15 to 19 years | 0 (0.0%) | 0 (0.0%) |
| 20 to 34 years | 101 (100.0%) | 0 (0.0%) |
| 35 to 50 years | 60 (100.0%) | 0 (0.0%) |
| Total | 161 (100.0%) | 0 (0.0%) |
Fertility by Education in Lakeway
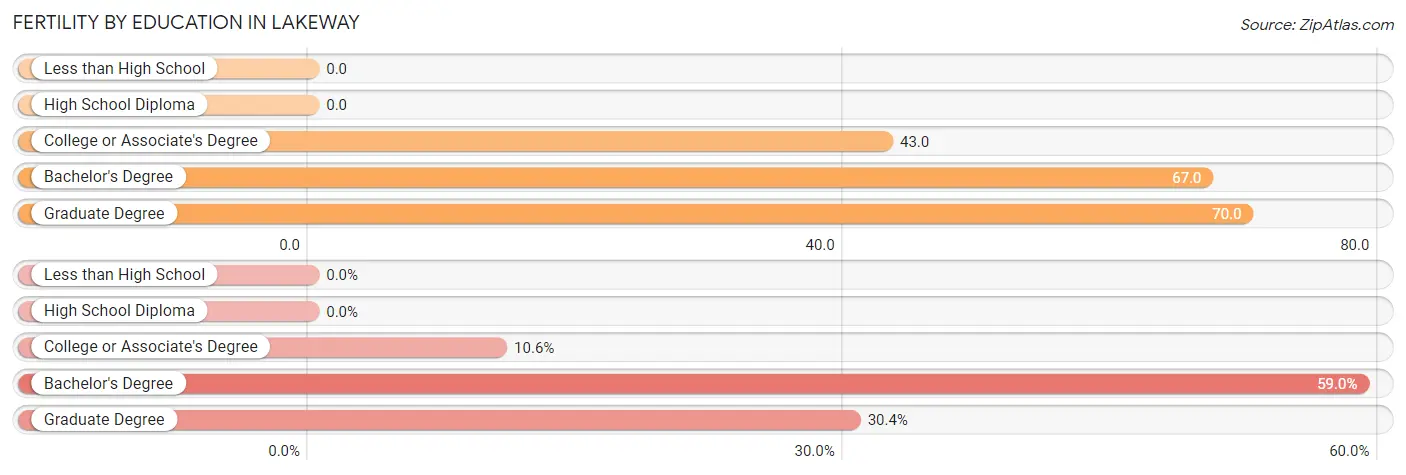
| Educational Attainment | Women with Births | Births / 1,000 Women |
| Less than High School | 0 (0.0%) | 0.0 |
| High School Diploma | 0 (0.0%) | 0.0 |
| College or Associate's Degree | 17 (10.6%) | 43.0 |
| Bachelor's Degree | 95 (59.0%) | 67.0 |
| Graduate Degree | 49 (30.4%) | 70.0 |
| Total | 161 (100.0%) | 52.0 |
Fertility by Education by Marriage Status in Lakeway
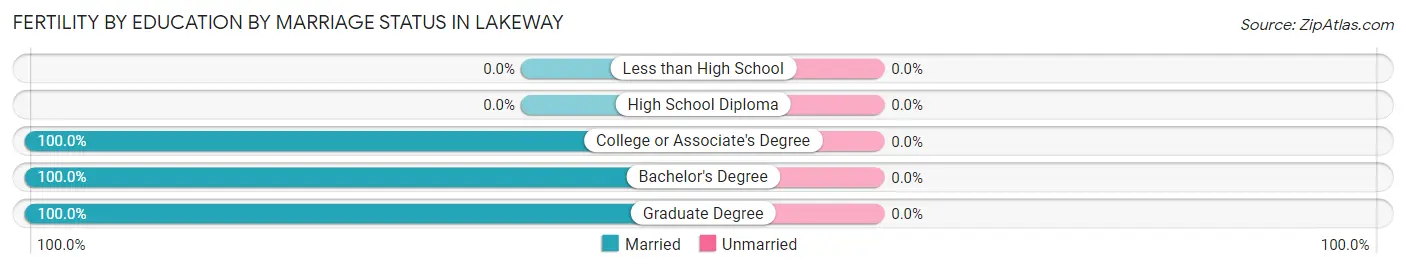
| Educational Attainment | Married | Unmarried |
| Less than High School | 0 (0.0%) | 0 (0.0%) |
| High School Diploma | 0 (0.0%) | 0 (0.0%) |
| College or Associate's Degree | 17 (100.0%) | 0 (0.0%) |
| Bachelor's Degree | 95 (100.0%) | 0 (0.0%) |
| Graduate Degree | 49 (100.0%) | 0 (0.0%) |
| Total | 161 (100.0%) | 0 (0.0%) |
Employment Characteristics in Lakeway
Employment by Class of Employer in Lakeway
Among the 8,375 employed individuals in Lakeway, private company employees (5,642 | 67.4%), self-employed (not incorporated) (791 | 9.4%), and self-employed (incorporated) (725 | 8.7%) make up the most common classes of employment.
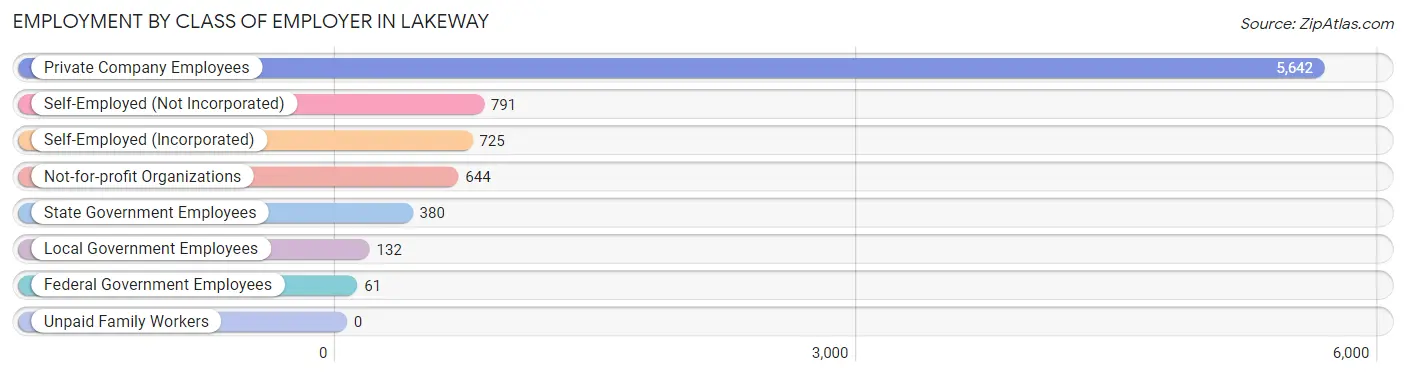
| Employer Class | # Employees | % Employees |
| Private Company Employees | 5,642 | 67.4% |
| Self-Employed (Incorporated) | 725 | 8.7% |
| Self-Employed (Not Incorporated) | 791 | 9.4% |
| Not-for-profit Organizations | 644 | 7.7% |
| Local Government Employees | 132 | 1.6% |
| State Government Employees | 380 | 4.5% |
| Federal Government Employees | 61 | 0.7% |
| Unpaid Family Workers | 0 | 0.0% |
| Total | 8,375 | 100.0% |
Employment Status by Age in Lakeway
According to the labor force statistics for Lakeway, out of the total population over 16 years of age (15,287), 57.4% or 8,775 individuals are in the labor force, with 2.8% or 246 of them unemployed. The age group with the highest labor force participation rate is 30 to 34 years, with 92.3% or 632 individuals in the labor force. Within the labor force, the 16 to 19 years age range has the highest percentage of unemployed individuals, with 13.9% or 53 of them being unemployed.
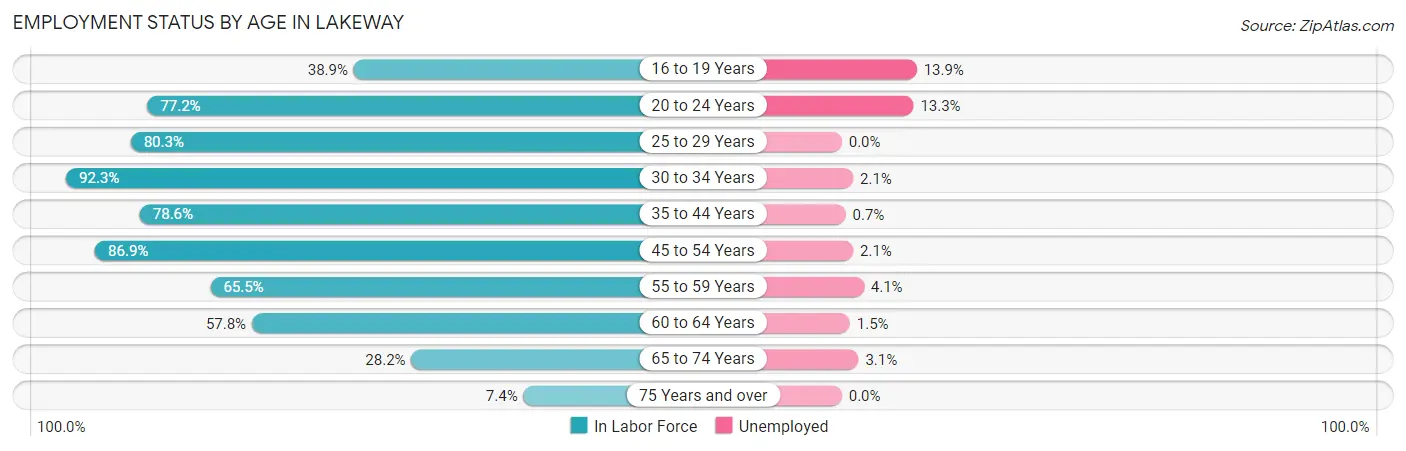
| Age Bracket | In Labor Force | Unemployed |
| 16 to 19 Years | 382 (38.9%) | 53 (13.9%) |
| 20 to 24 Years | 210 (77.2%) | 28 (13.3%) |
| 25 to 29 Years | 188 (80.3%) | 0 (0.0%) |
| 30 to 34 Years | 632 (92.3%) | 13 (2.1%) |
| 35 to 44 Years | 1,779 (78.6%) | 12 (0.7%) |
| 45 to 54 Years | 2,722 (86.9%) | 57 (2.1%) |
| 55 to 59 Years | 961 (65.5%) | 39 (4.1%) |
| 60 to 64 Years | 951 (57.8%) | 14 (1.5%) |
| 65 to 74 Years | 827 (28.2%) | 26 (3.1%) |
| 75 Years and over | 124 (7.4%) | 0 (0.0%) |
| Total | 8,775 (57.4%) | 246 (2.8%) |
Employment Status by Educational Attainment in Lakeway
According to labor force statistics for Lakeway, 76.7% of individuals (7,231) out of the total population between 25 and 64 years of age (9,427) are in the labor force, with 1.9% or 137 of them being unemployed. The group with the highest labor force participation rate are those with the educational attainment of bachelor's degree or higher, with 78.4% or 5,602 individuals in the labor force. Within the labor force, individuals with college / associate degree education have the highest percentage of unemployment, with 2.4% or 29 of them being unemployed.
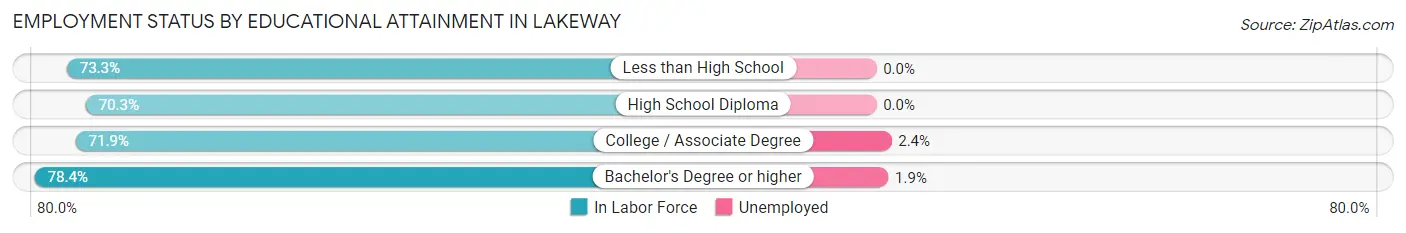
| Educational Attainment | In Labor Force | Unemployed |
| Less than High School | 22 (73.3%) | 0 (0.0%) |
| High School Diploma | 382 (70.3%) | 0 (0.0%) |
| College / Associate Degree | 1,228 (71.9%) | 41 (2.4%) |
| Bachelor's Degree or higher | 5,602 (78.4%) | 136 (1.9%) |
| Total | 7,231 (76.7%) | 179 (1.9%) |
Employment Occupations by Sex in Lakeway
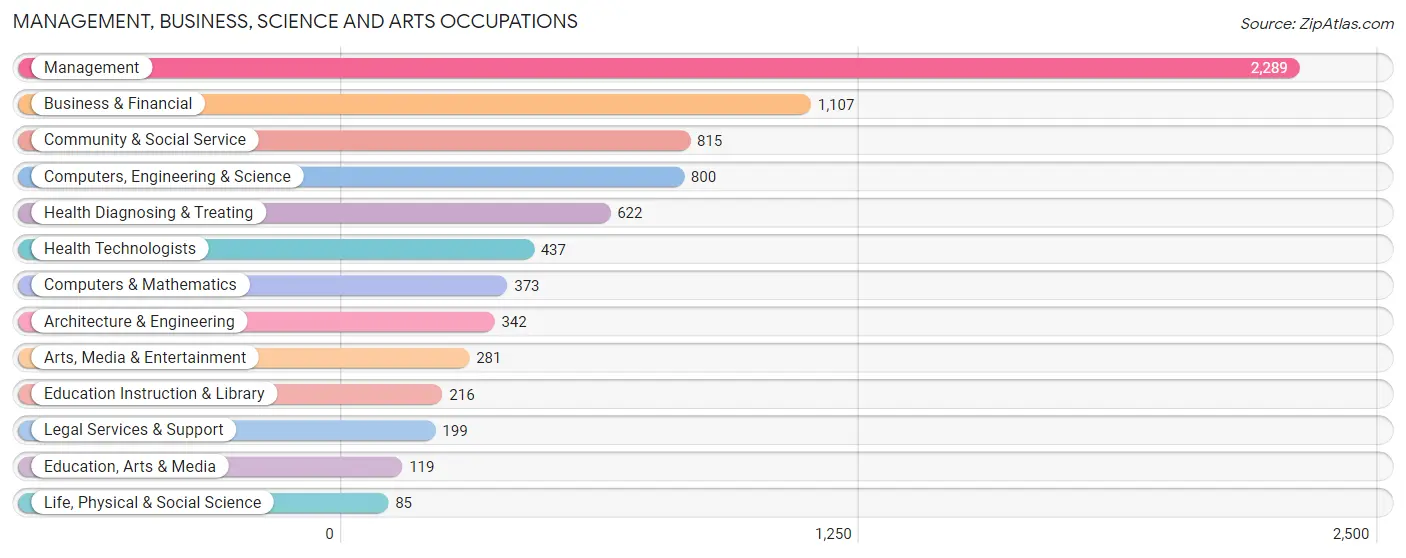
Management, Business, Science and Arts Occupations
The most common Management, Business, Science and Arts occupations in Lakeway are Management (2,289 | 26.8%), Business & Financial (1,107 | 13.0%), Community & Social Service (815 | 9.6%), Computers, Engineering & Science (800 | 9.4%), and Health Diagnosing & Treating (622 | 7.3%).
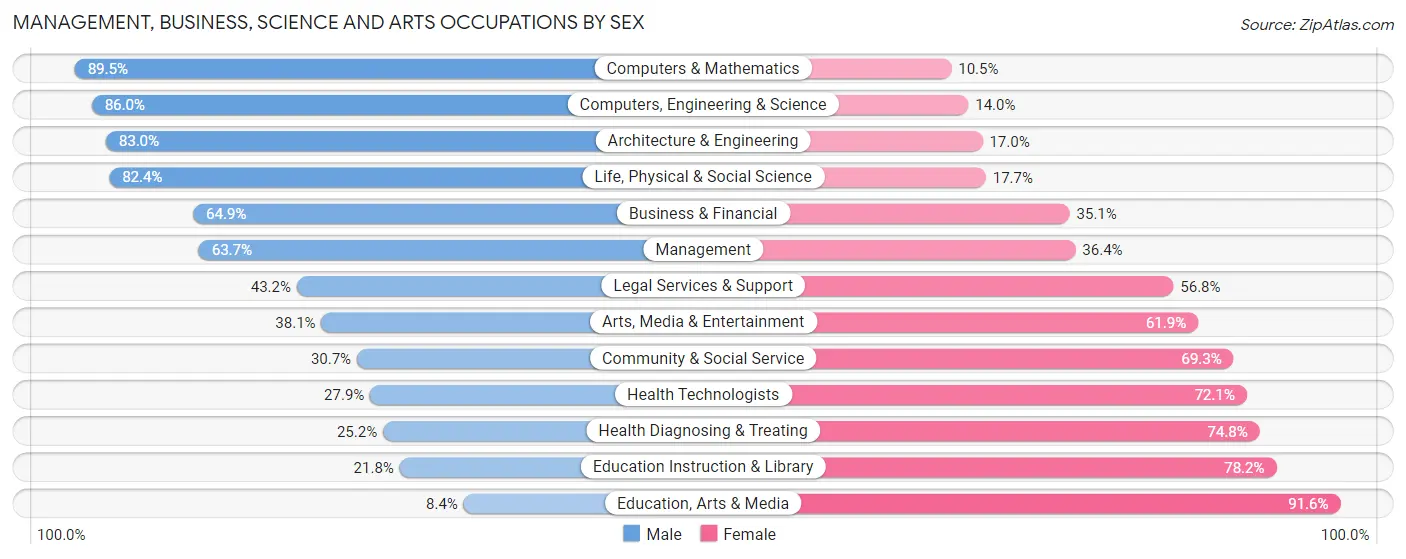
Management, Business, Science and Arts Occupations by Sex
Within the Management, Business, Science and Arts occupations in Lakeway, the most male-oriented occupations are Computers & Mathematics (89.5%), Computers, Engineering & Science (86.0%), and Architecture & Engineering (83.0%), while the most female-oriented occupations are Education, Arts & Media (91.6%), Education Instruction & Library (78.2%), and Health Diagnosing & Treating (74.8%).
| Occupation | Male | Female |
| Management | 1,457 (63.6%) | 832 (36.3%) |
| Business & Financial | 718 (64.9%) | 389 (35.1%) |
| Computers, Engineering & Science | 688 (86.0%) | 112 (14.0%) |
| Computers & Mathematics | 334 (89.5%) | 39 (10.5%) |
| Architecture & Engineering | 284 (83.0%) | 58 (17.0%) |
| Life, Physical & Social Science | 70 (82.4%) | 15 (17.6%) |
| Community & Social Service | 250 (30.7%) | 565 (69.3%) |
| Education, Arts & Media | 10 (8.4%) | 109 (91.6%) |
| Legal Services & Support | 86 (43.2%) | 113 (56.8%) |
| Education Instruction & Library | 47 (21.8%) | 169 (78.2%) |
| Arts, Media & Entertainment | 107 (38.1%) | 174 (61.9%) |
| Health Diagnosing & Treating | 157 (25.2%) | 465 (74.8%) |
| Health Technologists | 122 (27.9%) | 315 (72.1%) |
| Total (Category) | 3,270 (58.1%) | 2,363 (41.9%) |
| Total (Overall) | 4,671 (54.7%) | 3,860 (45.3%) |
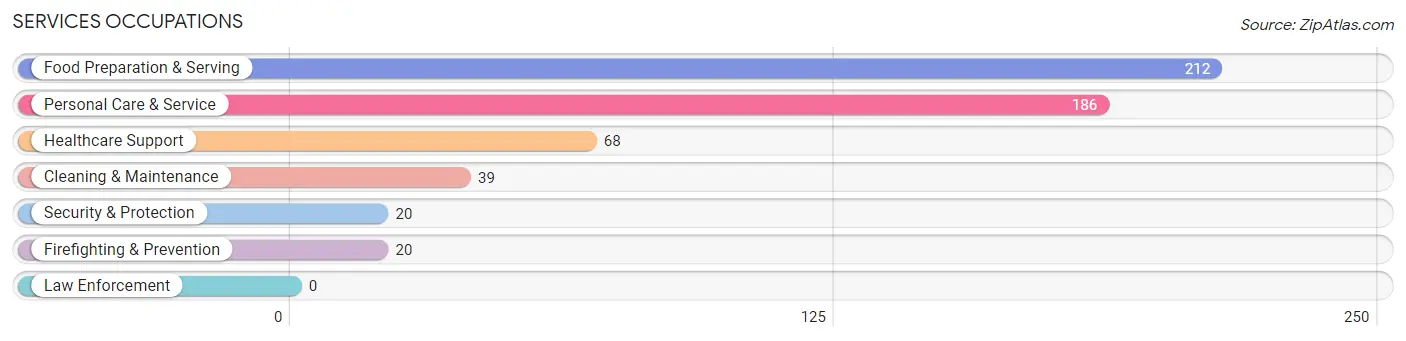
Services Occupations
The most common Services occupations in Lakeway are Food Preparation & Serving (212 | 2.5%), Personal Care & Service (186 | 2.2%), Healthcare Support (68 | 0.8%), Cleaning & Maintenance (39 | 0.5%), and Security & Protection (20 | 0.2%).
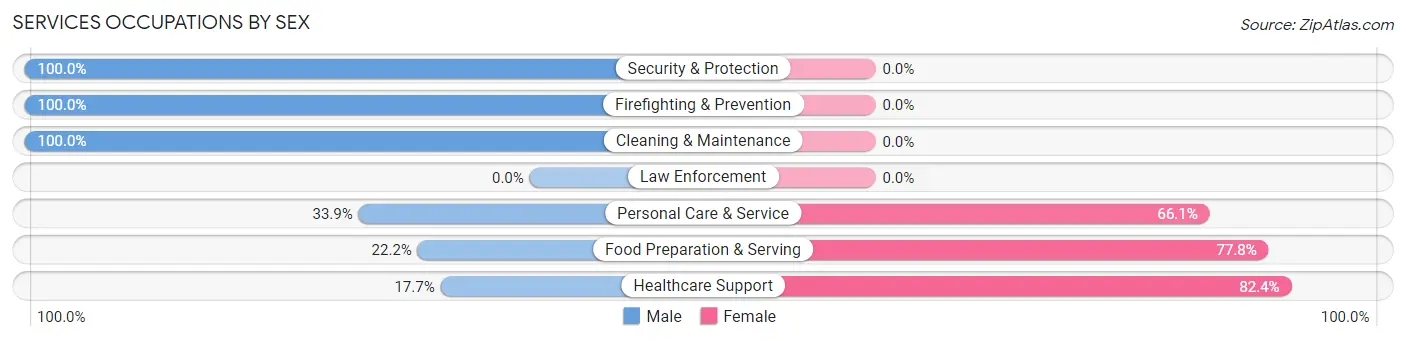
Services Occupations by Sex
Within the Services occupations in Lakeway, the most male-oriented occupations are Security & Protection (100.0%), Firefighting & Prevention (100.0%), and Cleaning & Maintenance (100.0%), while the most female-oriented occupations are Healthcare Support (82.4%), Food Preparation & Serving (77.8%), and Personal Care & Service (66.1%).
| Occupation | Male | Female |
| Healthcare Support | 12 (17.6%) | 56 (82.4%) |
| Security & Protection | 20 (100.0%) | 0 (0.0%) |
| Firefighting & Prevention | 20 (100.0%) | 0 (0.0%) |
| Law Enforcement | 0 (0.0%) | 0 (0.0%) |
| Food Preparation & Serving | 47 (22.2%) | 165 (77.8%) |
| Cleaning & Maintenance | 39 (100.0%) | 0 (0.0%) |
| Personal Care & Service | 63 (33.9%) | 123 (66.1%) |
| Total (Category) | 181 (34.5%) | 344 (65.5%) |
| Total (Overall) | 4,671 (54.7%) | 3,860 (45.3%) |
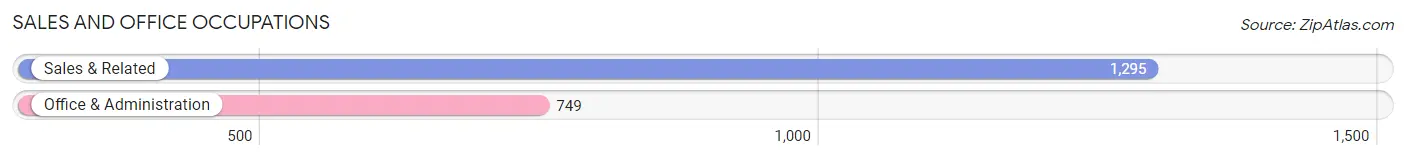
Sales and Office Occupations
The most common Sales and Office occupations in Lakeway are Sales & Related (1,295 | 15.2%), and Office & Administration (749 | 8.8%).
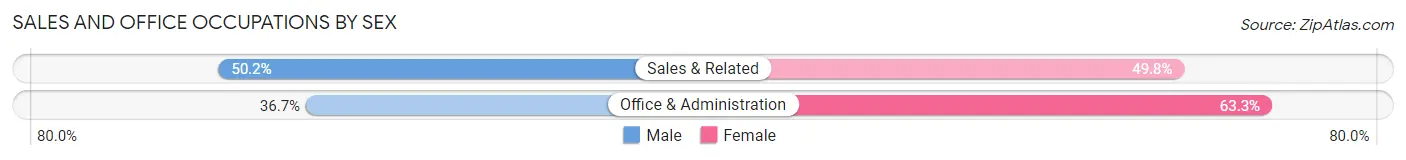
Sales and Office Occupations by Sex
| Occupation | Male | Female |
| Sales & Related | 650 (50.2%) | 645 (49.8%) |
| Office & Administration | 275 (36.7%) | 474 (63.3%) |
| Total (Category) | 925 (45.3%) | 1,119 (54.7%) |
| Total (Overall) | 4,671 (54.7%) | 3,860 (45.3%) |
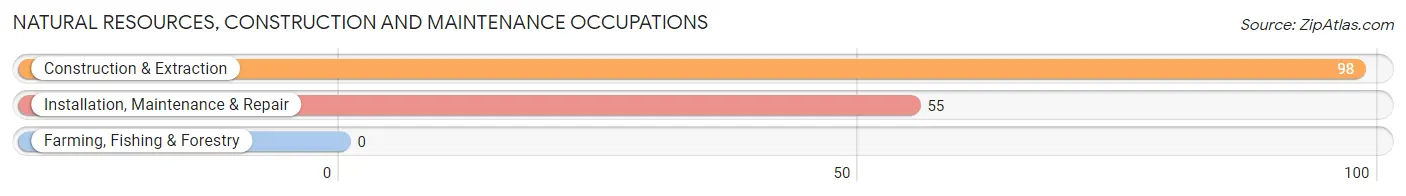
Natural Resources, Construction and Maintenance Occupations
The most common Natural Resources, Construction and Maintenance occupations in Lakeway are Construction & Extraction (98 | 1.1%), and Installation, Maintenance & Repair (55 | 0.6%).
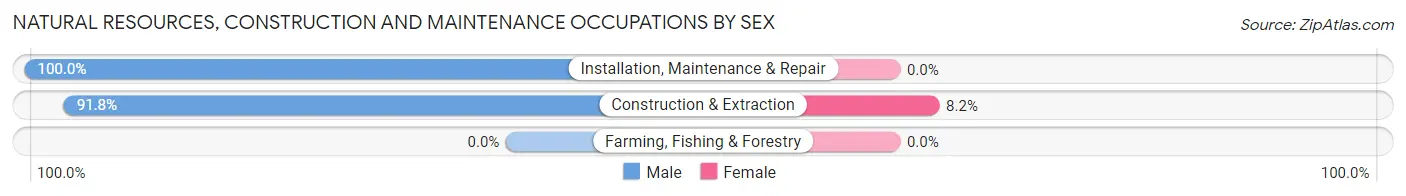
Natural Resources, Construction and Maintenance Occupations by Sex
| Occupation | Male | Female |
| Farming, Fishing & Forestry | 0 (0.0%) | 0 (0.0%) |
| Construction & Extraction | 90 (91.8%) | 8 (8.2%) |
| Installation, Maintenance & Repair | 55 (100.0%) | 0 (0.0%) |
| Total (Category) | 145 (94.8%) | 8 (5.2%) |
| Total (Overall) | 4,671 (54.7%) | 3,860 (45.3%) |
Production, Transportation and Moving Occupations
The most common Production, Transportation and Moving occupations in Lakeway are Transportation (79 | 0.9%), Material Moving (73 | 0.9%), and Production (24 | 0.3%).
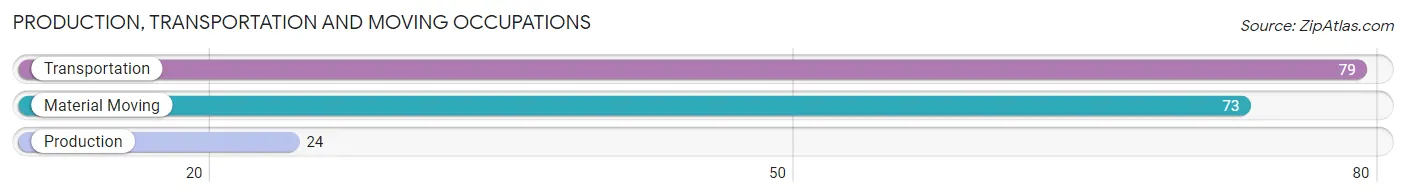
Production, Transportation and Moving Occupations by Sex
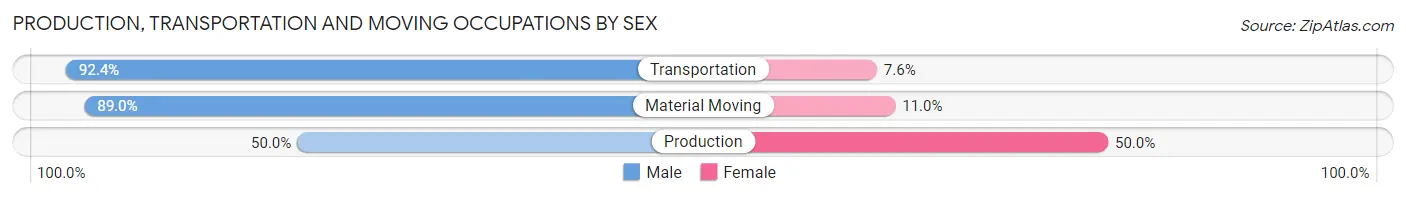
| Occupation | Male | Female |
| Production | 12 (50.0%) | 12 (50.0%) |
| Transportation | 73 (92.4%) | 6 (7.6%) |
| Material Moving | 65 (89.0%) | 8 (11.0%) |
| Total (Category) | 150 (85.2%) | 26 (14.8%) |
| Total (Overall) | 4,671 (54.7%) | 3,860 (45.3%) |
Employment Industries by Sex in Lakeway
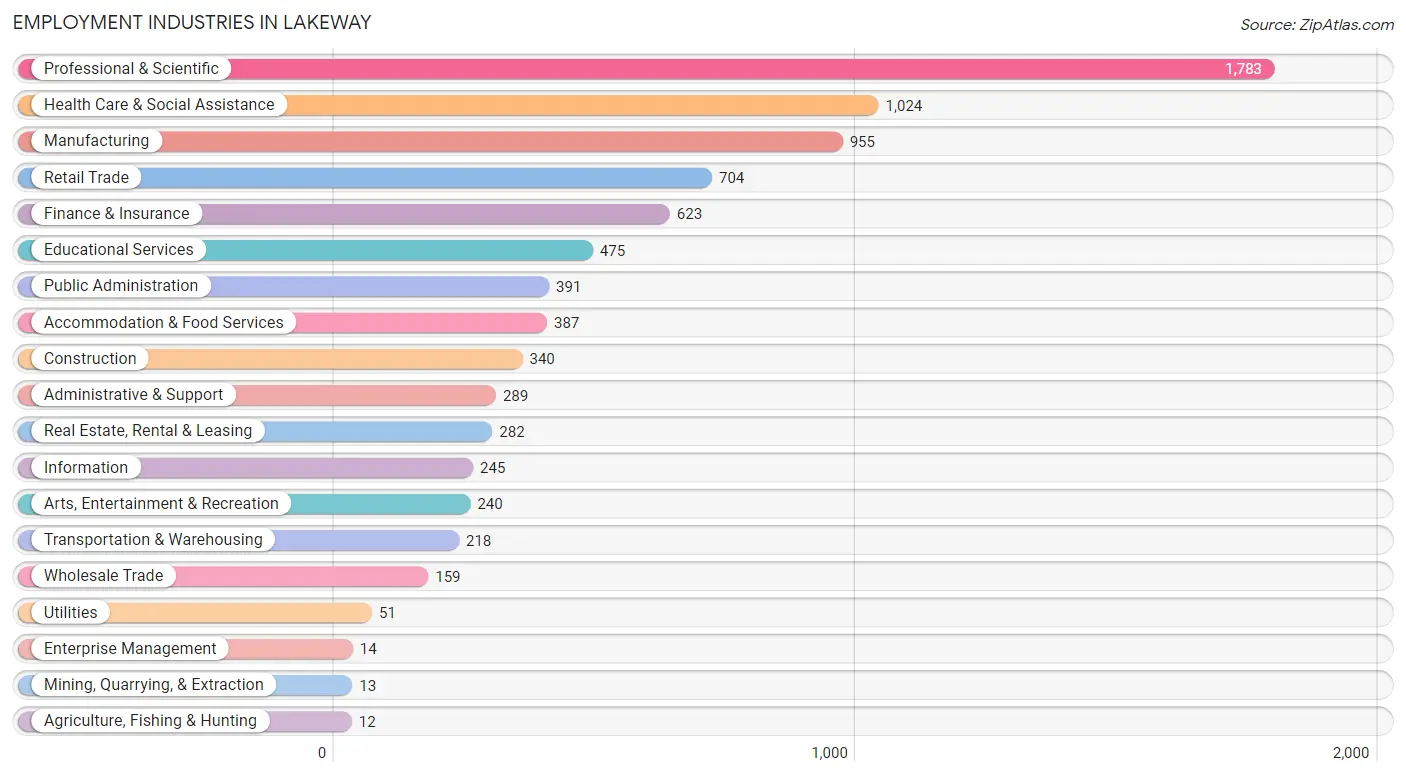
Employment Industries in Lakeway
The major employment industries in Lakeway include Professional & Scientific (1,783 | 20.9%), Health Care & Social Assistance (1,024 | 12.0%), Manufacturing (955 | 11.2%), Retail Trade (704 | 8.3%), and Finance & Insurance (623 | 7.3%).
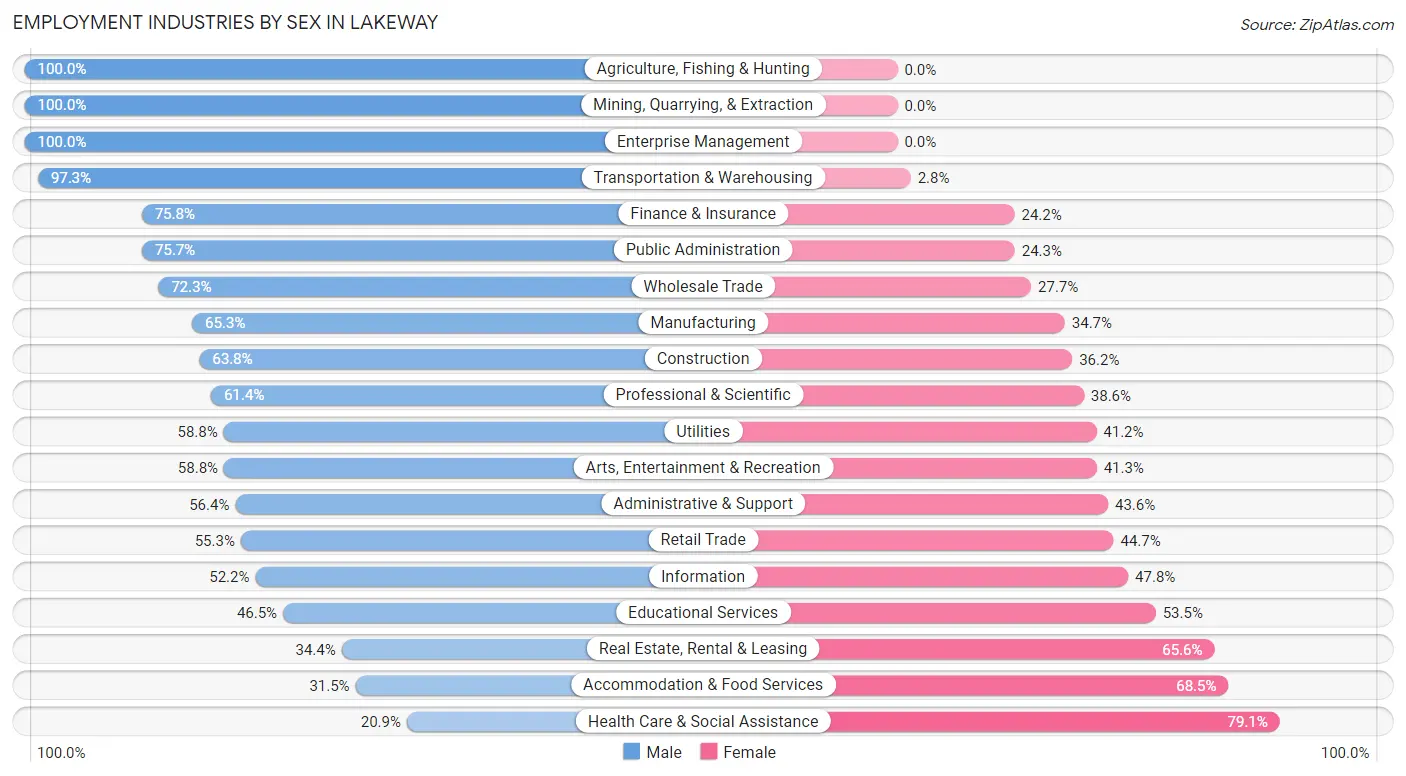
Employment Industries by Sex in Lakeway
The Lakeway industries that see more men than women are Agriculture, Fishing & Hunting (100.0%), Mining, Quarrying, & Extraction (100.0%), and Enterprise Management (100.0%), whereas the industries that tend to have a higher number of women are Health Care & Social Assistance (79.1%), Accommodation & Food Services (68.5%), and Real Estate, Rental & Leasing (65.6%).
| Industry | Male | Female |
| Agriculture, Fishing & Hunting | 12 (100.0%) | 0 (0.0%) |
| Mining, Quarrying, & Extraction | 13 (100.0%) | 0 (0.0%) |
| Construction | 217 (63.8%) | 123 (36.2%) |
| Manufacturing | 624 (65.3%) | 331 (34.7%) |
| Wholesale Trade | 115 (72.3%) | 44 (27.7%) |
| Retail Trade | 389 (55.3%) | 315 (44.7%) |
| Transportation & Warehousing | 212 (97.3%) | 6 (2.8%) |
| Utilities | 30 (58.8%) | 21 (41.2%) |
| Information | 128 (52.2%) | 117 (47.8%) |
| Finance & Insurance | 472 (75.8%) | 151 (24.2%) |
| Real Estate, Rental & Leasing | 97 (34.4%) | 185 (65.6%) |
| Professional & Scientific | 1,095 (61.4%) | 688 (38.6%) |
| Enterprise Management | 14 (100.0%) | 0 (0.0%) |
| Administrative & Support | 163 (56.4%) | 126 (43.6%) |
| Educational Services | 221 (46.5%) | 254 (53.5%) |
| Health Care & Social Assistance | 214 (20.9%) | 810 (79.1%) |
| Arts, Entertainment & Recreation | 141 (58.8%) | 99 (41.2%) |
| Accommodation & Food Services | 122 (31.5%) | 265 (68.5%) |
| Public Administration | 296 (75.7%) | 95 (24.3%) |
| Total | 4,671 (54.7%) | 3,860 (45.3%) |
Education in Lakeway
School Enrollment in Lakeway
The most common levels of schooling among the 4,112 students in Lakeway are high school (1,110 | 27.0%), middle school (963 | 23.4%), and elementary school (868 | 21.1%).
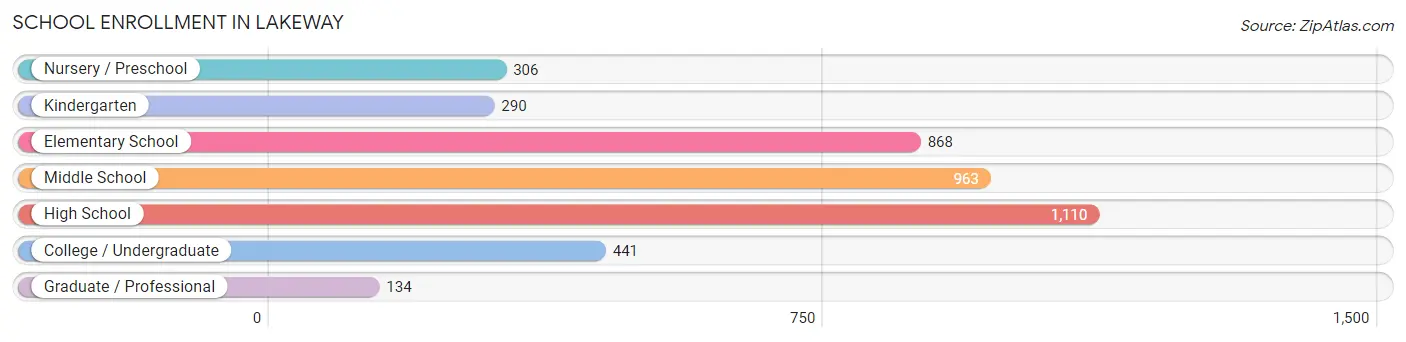
| School Level | # Students | % Students |
| Nursery / Preschool | 306 | 7.4% |
| Kindergarten | 290 | 7.0% |
| Elementary School | 868 | 21.1% |
| Middle School | 963 | 23.4% |
| High School | 1,110 | 27.0% |
| College / Undergraduate | 441 | 10.7% |
| Graduate / Professional | 134 | 3.3% |
| Total | 4,112 | 100.0% |
School Enrollment by Age by Funding Source in Lakeway
Out of a total of 4,112 students who are enrolled in schools in Lakeway, 748 (18.2%) attend a private institution, while the remaining 3,364 (81.8%) are enrolled in public schools. The age group of 3 to 4 year olds has the highest likelihood of being enrolled in private schools, with 150 (72.1% in the age bracket) enrolled. Conversely, the age group of 15 to 17 year olds has the lowest likelihood of being enrolled in a private school, with 876 (98.4% in the age bracket) attending a public institution.
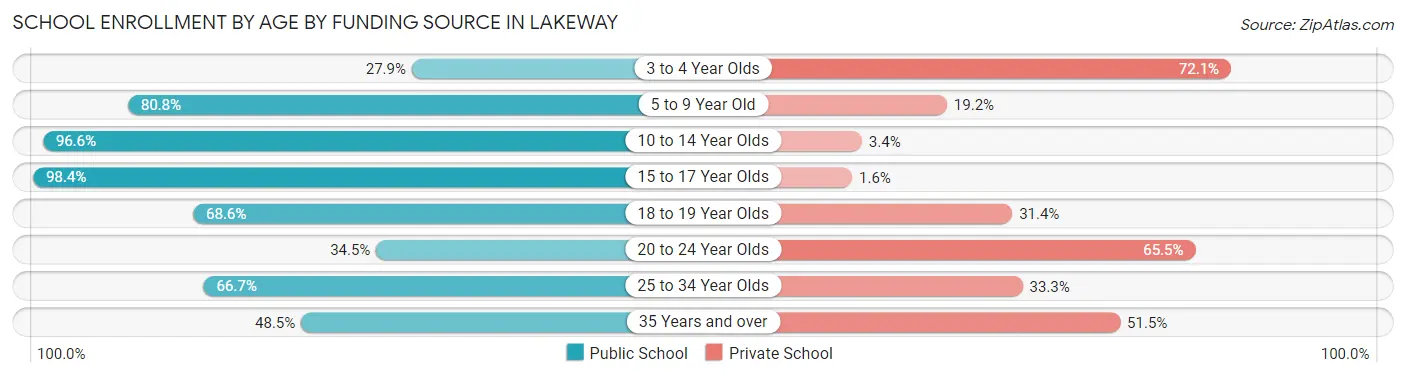
| Age Bracket | Public School | Private School |
| 3 to 4 Year Olds | 58 (27.9%) | 150 (72.1%) |
| 5 to 9 Year Old | 970 (80.8%) | 231 (19.2%) |
| 10 to 14 Year Olds | 1,081 (96.6%) | 38 (3.4%) |
| 15 to 17 Year Olds | 876 (98.4%) | 14 (1.6%) |
| 18 to 19 Year Olds | 188 (68.6%) | 86 (31.4%) |
| 20 to 24 Year Olds | 49 (34.5%) | 93 (65.5%) |
| 25 to 34 Year Olds | 30 (66.7%) | 15 (33.3%) |
| 35 Years and over | 113 (48.5%) | 120 (51.5%) |
| Total | 3,364 (81.8%) | 748 (18.2%) |
Educational Attainment by Field of Study in Lakeway
Business (2,909 | 26.4%), engineering (1,292 | 11.7%), education (856 | 7.7%), communications (834 | 7.5%), and social sciences (788 | 7.1%) are the most common fields of study among 11,040 individuals in Lakeway who have obtained a bachelor's degree or higher.
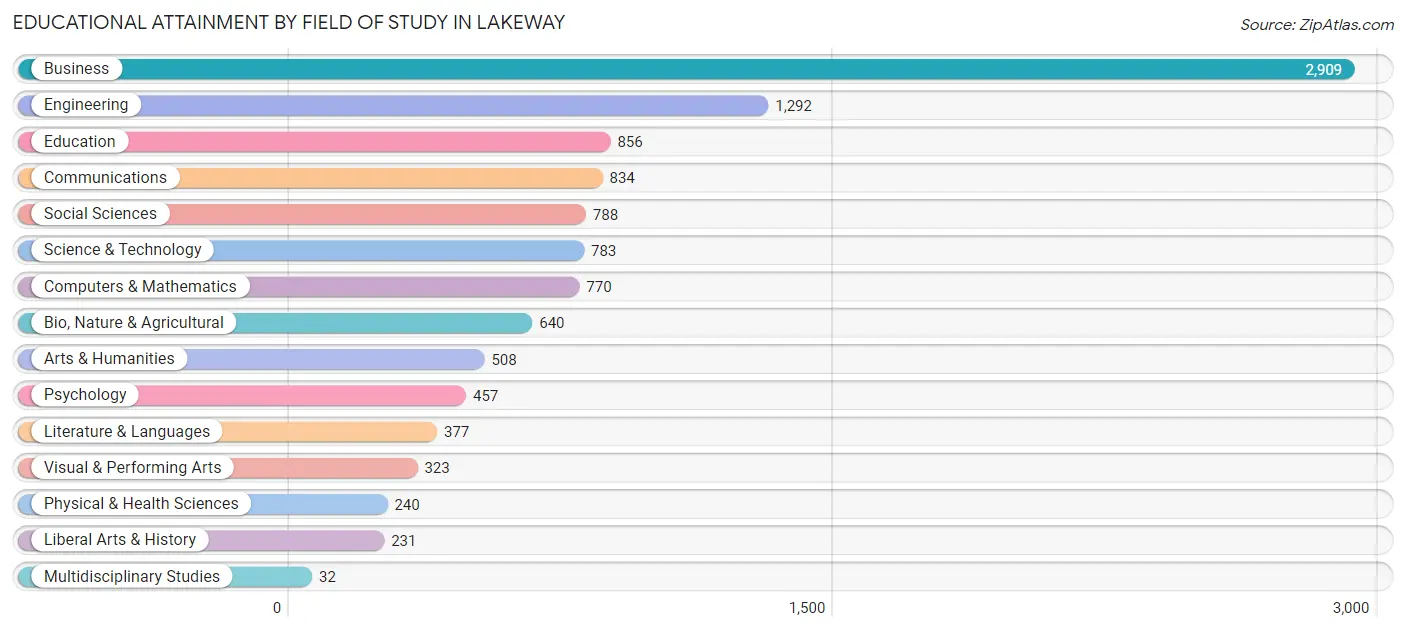
| Field of Study | # Graduates | % Graduates |
| Computers & Mathematics | 770 | 7.0% |
| Bio, Nature & Agricultural | 640 | 5.8% |
| Physical & Health Sciences | 240 | 2.2% |
| Psychology | 457 | 4.1% |
| Social Sciences | 788 | 7.1% |
| Engineering | 1,292 | 11.7% |
| Multidisciplinary Studies | 32 | 0.3% |
| Science & Technology | 783 | 7.1% |
| Business | 2,909 | 26.4% |
| Education | 856 | 7.7% |
| Literature & Languages | 377 | 3.4% |
| Liberal Arts & History | 231 | 2.1% |
| Visual & Performing Arts | 323 | 2.9% |
| Communications | 834 | 7.5% |
| Arts & Humanities | 508 | 4.6% |
| Total | 11,040 | 100.0% |
Transportation & Commute in Lakeway
Vehicle Availability by Sex in Lakeway
The most prevalent vehicle ownership categories in Lakeway are males with 2 vehicles (2,512, accounting for 54.4%) and females with 2 vehicles (1,966, making up 67.0%).
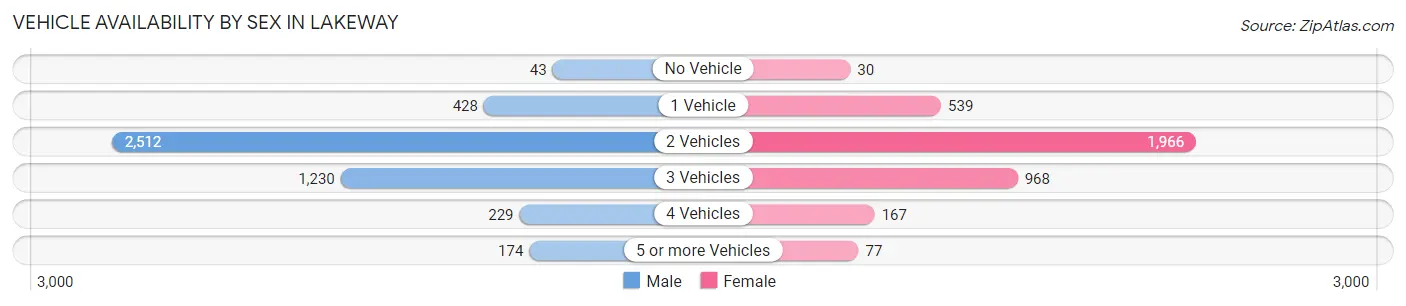
| Vehicles Available | Male | Female |
| No Vehicle | 43 (0.9%) | 30 (0.8%) |
| 1 Vehicle | 428 (9.3%) | 539 (14.4%) |
| 2 Vehicles | 2,512 (54.4%) | 1,966 (52.5%) |
| 3 Vehicles | 1,230 (26.7%) | 968 (25.8%) |
| 4 Vehicles | 229 (5.0%) | 167 (4.5%) |
| 5 or more Vehicles | 174 (3.8%) | 77 (2.1%) |
| Total | 4,616 (100.0%) | 3,747 (100.0%) |
Commute Time in Lakeway
The most frequently occuring commute durations in Lakeway are 45 to 59 minutes (794 commuters, 15.7%), 20 to 24 minutes (615 commuters, 12.2%), and 15 to 19 minutes (609 commuters, 12.1%).
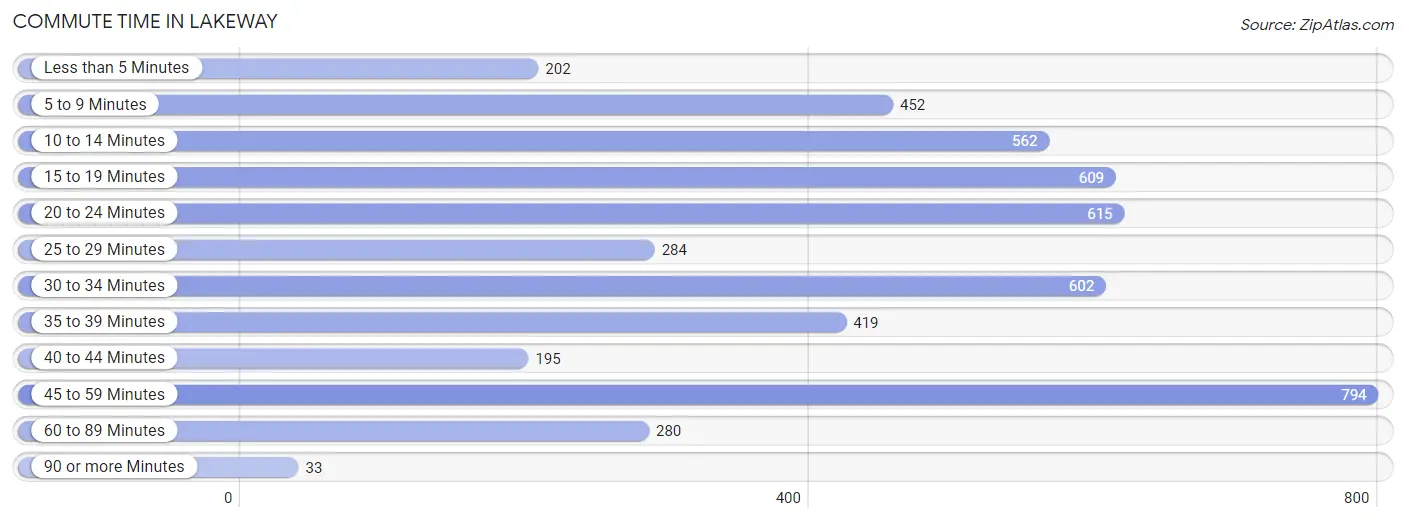
| Commute Time | # Commuters | % Commuters |
| Less than 5 Minutes | 202 | 4.0% |
| 5 to 9 Minutes | 452 | 9.0% |
| 10 to 14 Minutes | 562 | 11.1% |
| 15 to 19 Minutes | 609 | 12.1% |
| 20 to 24 Minutes | 615 | 12.2% |
| 25 to 29 Minutes | 284 | 5.6% |
| 30 to 34 Minutes | 602 | 11.9% |
| 35 to 39 Minutes | 419 | 8.3% |
| 40 to 44 Minutes | 195 | 3.9% |
| 45 to 59 Minutes | 794 | 15.7% |
| 60 to 89 Minutes | 280 | 5.6% |
| 90 or more Minutes | 33 | 0.6% |
Commute Time by Sex in Lakeway
The most common commute times in Lakeway are 45 to 59 minutes (581 commuters, 21.7%) for males and 15 to 19 minutes (440 commuters, 18.5%) for females.
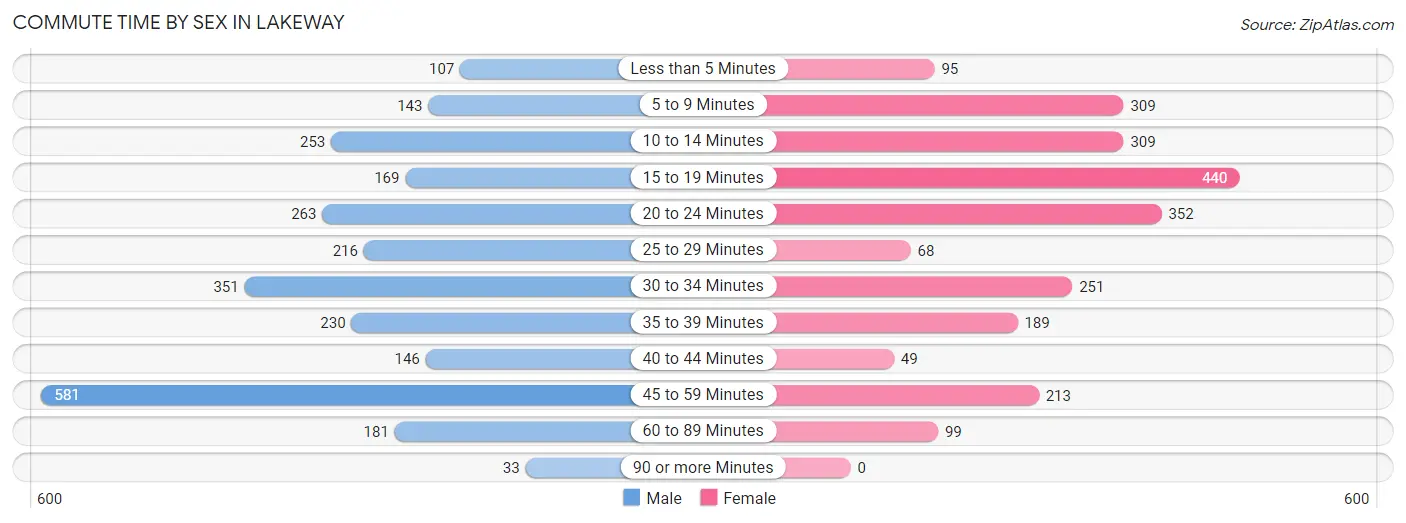
| Commute Time | Male | Female |
| Less than 5 Minutes | 107 (4.0%) | 95 (4.0%) |
| 5 to 9 Minutes | 143 (5.3%) | 309 (13.0%) |
| 10 to 14 Minutes | 253 (9.5%) | 309 (13.0%) |
| 15 to 19 Minutes | 169 (6.3%) | 440 (18.5%) |
| 20 to 24 Minutes | 263 (9.8%) | 352 (14.8%) |
| 25 to 29 Minutes | 216 (8.1%) | 68 (2.9%) |
| 30 to 34 Minutes | 351 (13.1%) | 251 (10.6%) |
| 35 to 39 Minutes | 230 (8.6%) | 189 (8.0%) |
| 40 to 44 Minutes | 146 (5.5%) | 49 (2.1%) |
| 45 to 59 Minutes | 581 (21.7%) | 213 (9.0%) |
| 60 to 89 Minutes | 181 (6.8%) | 99 (4.2%) |
| 90 or more Minutes | 33 (1.2%) | 0 (0.0%) |
Time of Departure to Work by Sex in Lakeway
The most frequent times of departure to work in Lakeway are 7:00 AM to 7:29 AM (536, 20.1%) for males and 8:00 AM to 8:29 AM (466, 19.6%) for females.
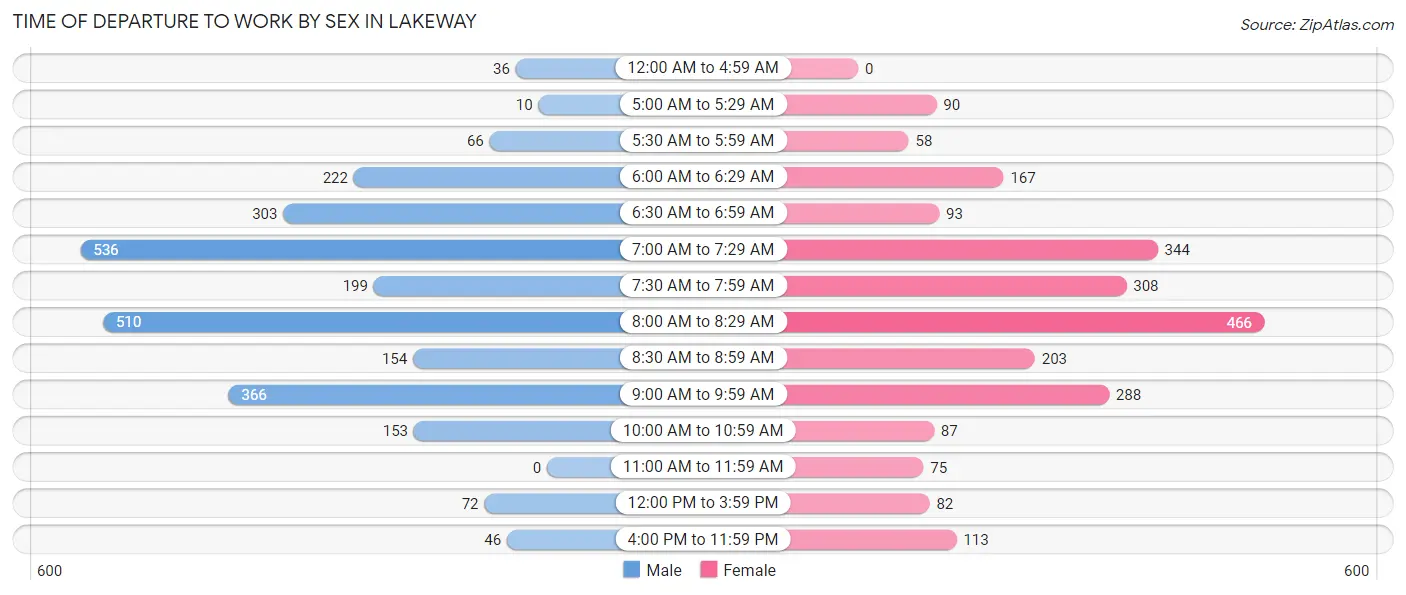
| Time of Departure | Male | Female |
| 12:00 AM to 4:59 AM | 36 (1.3%) | 0 (0.0%) |
| 5:00 AM to 5:29 AM | 10 (0.4%) | 90 (3.8%) |
| 5:30 AM to 5:59 AM | 66 (2.5%) | 58 (2.4%) |
| 6:00 AM to 6:29 AM | 222 (8.3%) | 167 (7.0%) |
| 6:30 AM to 6:59 AM | 303 (11.3%) | 93 (3.9%) |
| 7:00 AM to 7:29 AM | 536 (20.1%) | 344 (14.5%) |
| 7:30 AM to 7:59 AM | 199 (7.4%) | 308 (13.0%) |
| 8:00 AM to 8:29 AM | 510 (19.1%) | 466 (19.6%) |
| 8:30 AM to 8:59 AM | 154 (5.8%) | 203 (8.6%) |
| 9:00 AM to 9:59 AM | 366 (13.7%) | 288 (12.1%) |
| 10:00 AM to 10:59 AM | 153 (5.7%) | 87 (3.7%) |
| 11:00 AM to 11:59 AM | 0 (0.0%) | 75 (3.2%) |
| 12:00 PM to 3:59 PM | 72 (2.7%) | 82 (3.5%) |
| 4:00 PM to 11:59 PM | 46 (1.7%) | 113 (4.8%) |
| Total | 2,673 (100.0%) | 2,374 (100.0%) |
Housing Occupancy in Lakeway
Occupancy by Ownership in Lakeway
Of the total 7,745 dwellings in Lakeway, owner-occupied units account for 6,492 (83.8%), while renter-occupied units make up 1,253 (16.2%).
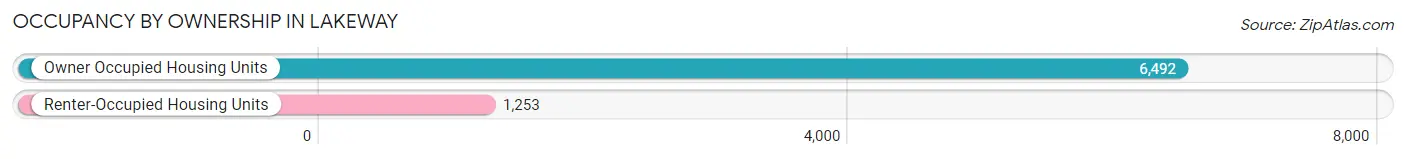
| Occupancy | # Housing Units | % Housing Units |
| Owner Occupied Housing Units | 6,492 | 83.8% |
| Renter-Occupied Housing Units | 1,253 | 16.2% |
| Total Occupied Housing Units | 7,745 | 100.0% |
Occupancy by Household Size in Lakeway
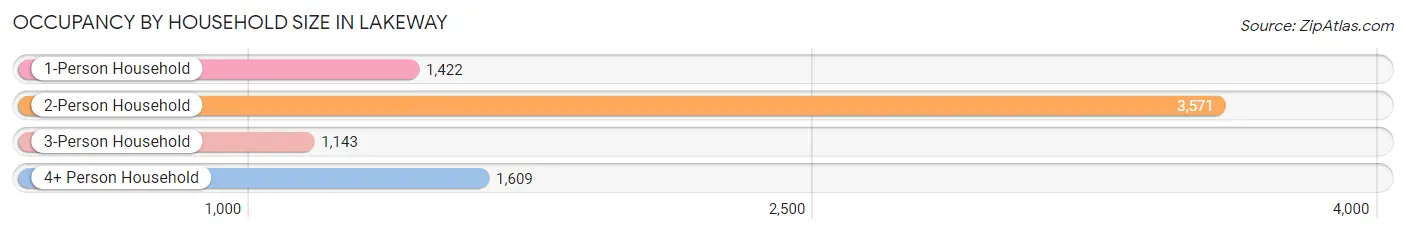
| Household Size | # Housing Units | % Housing Units |
| 1-Person Household | 1,422 | 18.4% |
| 2-Person Household | 3,571 | 46.1% |
| 3-Person Household | 1,143 | 14.8% |
| 4+ Person Household | 1,609 | 20.8% |
| Total Housing Units | 7,745 | 100.0% |
Occupancy by Ownership by Household Size in Lakeway
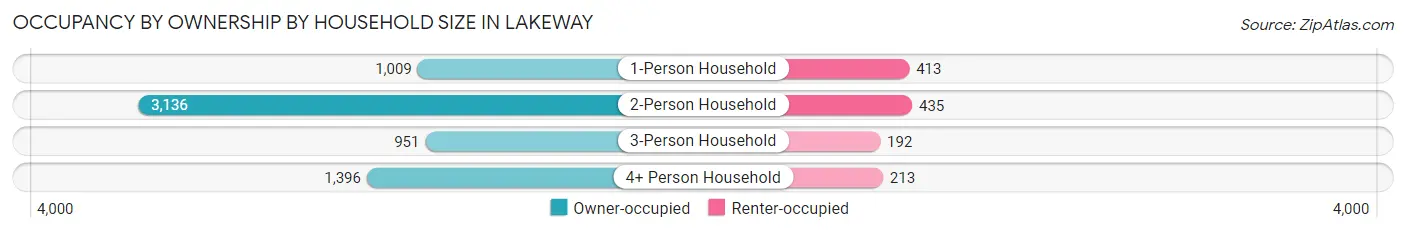
| Household Size | Owner-occupied | Renter-occupied |
| 1-Person Household | 1,009 (71.0%) | 413 (29.0%) |
| 2-Person Household | 3,136 (87.8%) | 435 (12.2%) |
| 3-Person Household | 951 (83.2%) | 192 (16.8%) |
| 4+ Person Household | 1,396 (86.8%) | 213 (13.2%) |
| Total Housing Units | 6,492 (83.8%) | 1,253 (16.2%) |
Occupancy by Educational Attainment in Lakeway
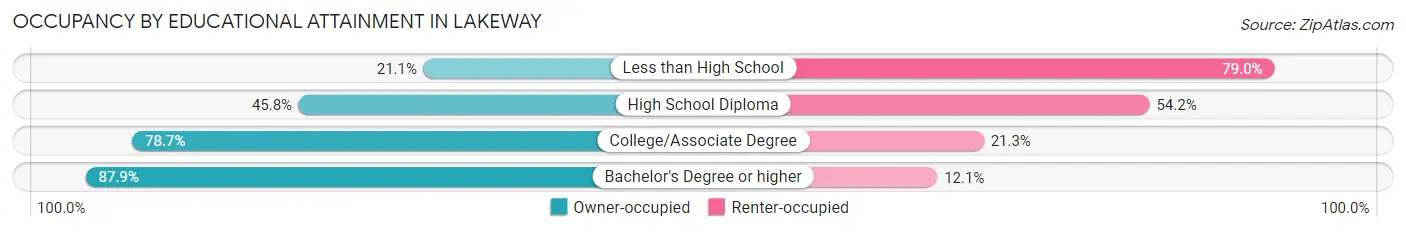
| Household Size | Owner-occupied | Renter-occupied |
| Less than High School | 8 (21.0%) | 30 (78.9%) |
| High School Diploma | 164 (45.8%) | 194 (54.2%) |
| College/Associate Degree | 1,192 (78.7%) | 323 (21.3%) |
| Bachelor's Degree or higher | 5,128 (87.9%) | 706 (12.1%) |
Occupancy by Age of Householder in Lakeway
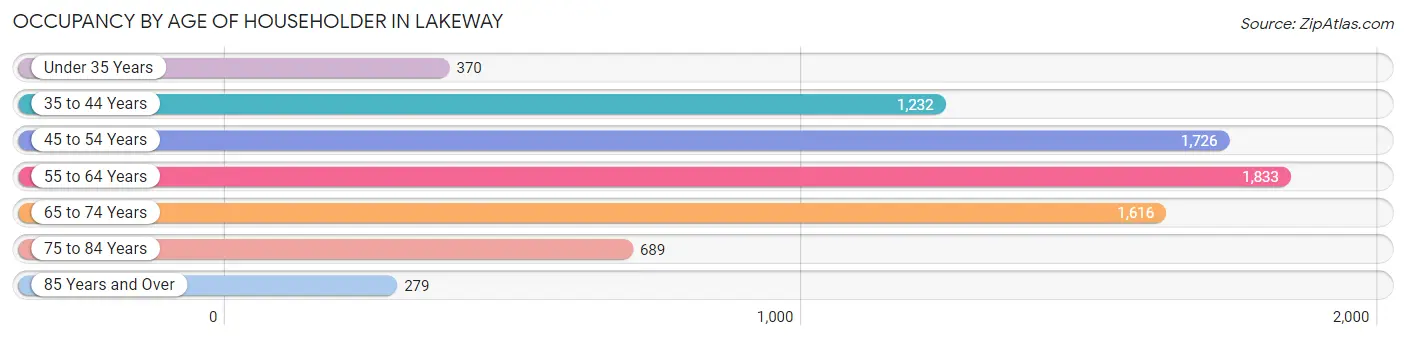
| Age Bracket | # Households | % Households |
| Under 35 Years | 370 | 4.8% |
| 35 to 44 Years | 1,232 | 15.9% |
| 45 to 54 Years | 1,726 | 22.3% |
| 55 to 64 Years | 1,833 | 23.7% |
| 65 to 74 Years | 1,616 | 20.9% |
| 75 to 84 Years | 689 | 8.9% |
| 85 Years and Over | 279 | 3.6% |
| Total | 7,745 | 100.0% |
Housing Finances in Lakeway
Median Income by Occupancy in Lakeway
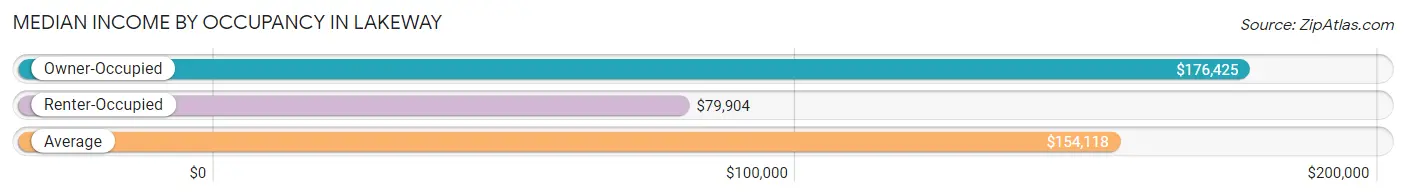
| Occupancy Type | # Households | Median Income |
| Owner-Occupied | 6,492 (83.8%) | $176,425 |
| Renter-Occupied | 1,253 (16.2%) | $79,904 |
| Average | 7,745 (100.0%) | $154,118 |
Occupancy by Householder Income Bracket in Lakeway
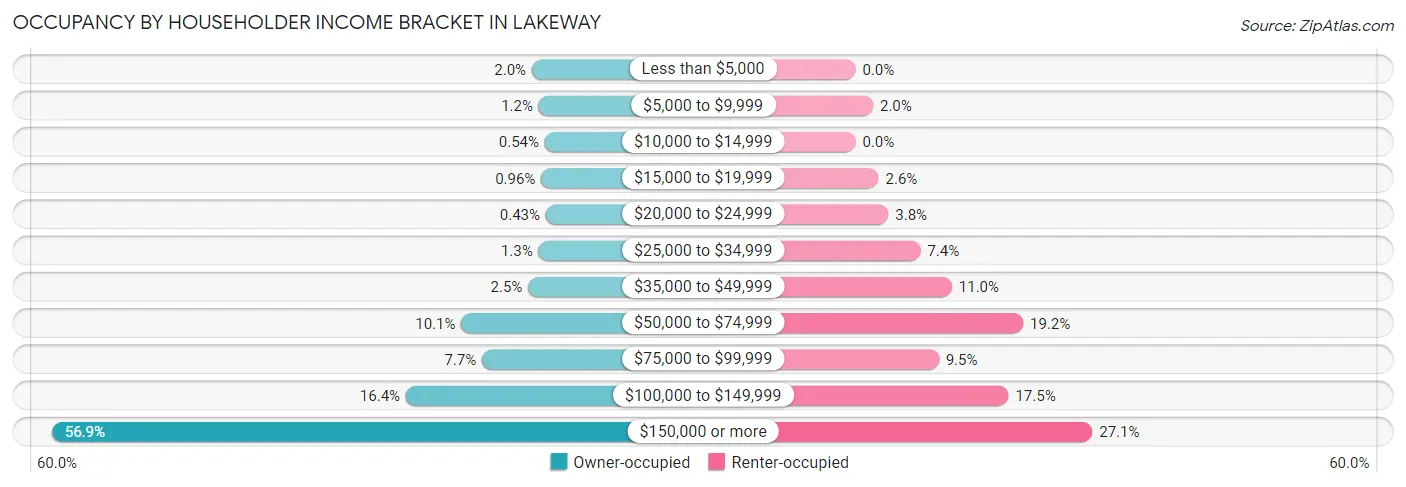
| Income Bracket | Owner-occupied | Renter-occupied |
| Less than $5,000 | 131 (2.0%) | 0 (0.0%) |
| $5,000 to $9,999 | 80 (1.2%) | 25 (2.0%) |
| $10,000 to $14,999 | 35 (0.5%) | 0 (0.0%) |
| $15,000 to $19,999 | 62 (1.0%) | 33 (2.6%) |
| $20,000 to $24,999 | 28 (0.4%) | 47 (3.7%) |
| $25,000 to $34,999 | 82 (1.3%) | 93 (7.4%) |
| $35,000 to $49,999 | 159 (2.5%) | 138 (11.0%) |
| $50,000 to $74,999 | 655 (10.1%) | 240 (19.2%) |
| $75,000 to $99,999 | 501 (7.7%) | 119 (9.5%) |
| $100,000 to $149,999 | 1,066 (16.4%) | 219 (17.5%) |
| $150,000 or more | 3,693 (56.9%) | 339 (27.1%) |
| Total | 6,492 (100.0%) | 1,253 (100.0%) |
Monthly Housing Cost Tiers in Lakeway
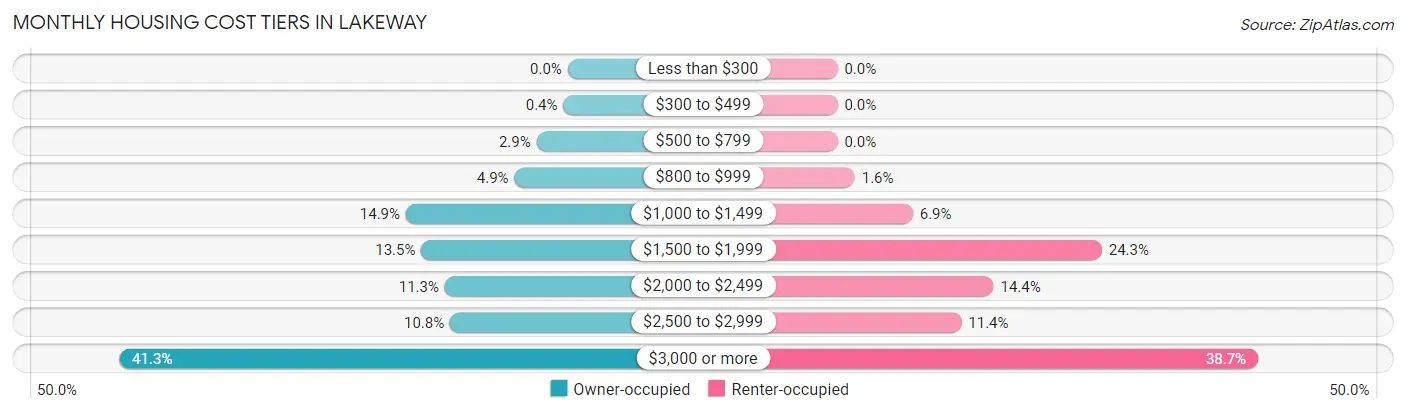
| Monthly Cost | Owner-occupied | Renter-occupied |
| Less than $300 | 0 (0.0%) | 0 (0.0%) |
| $300 to $499 | 26 (0.4%) | 0 (0.0%) |
| $500 to $799 | 186 (2.9%) | 0 (0.0%) |
| $800 to $999 | 319 (4.9%) | 20 (1.6%) |
| $1,000 to $1,499 | 967 (14.9%) | 87 (6.9%) |
| $1,500 to $1,999 | 875 (13.5%) | 305 (24.3%) |
| $2,000 to $2,499 | 735 (11.3%) | 180 (14.4%) |
| $2,500 to $2,999 | 703 (10.8%) | 143 (11.4%) |
| $3,000 or more | 2,681 (41.3%) | 485 (38.7%) |
| Total | 6,492 (100.0%) | 1,253 (100.0%) |
Physical Housing Characteristics in Lakeway
Housing Structures in Lakeway
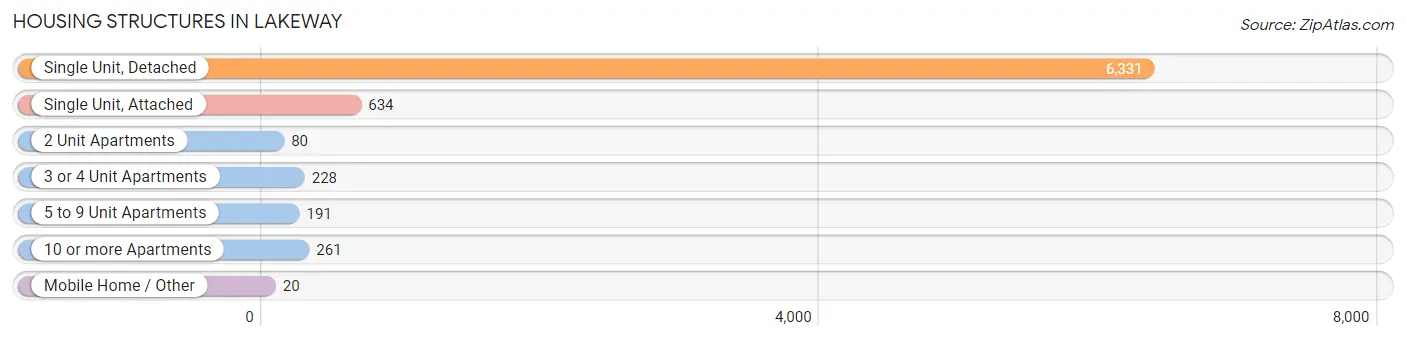
| Structure Type | # Housing Units | % Housing Units |
| Single Unit, Detached | 6,331 | 81.7% |
| Single Unit, Attached | 634 | 8.2% |
| 2 Unit Apartments | 80 | 1.0% |
| 3 or 4 Unit Apartments | 228 | 2.9% |
| 5 to 9 Unit Apartments | 191 | 2.5% |
| 10 or more Apartments | 261 | 3.4% |
| Mobile Home / Other | 20 | 0.3% |
| Total | 7,745 | 100.0% |
Housing Structures by Occupancy in Lakeway
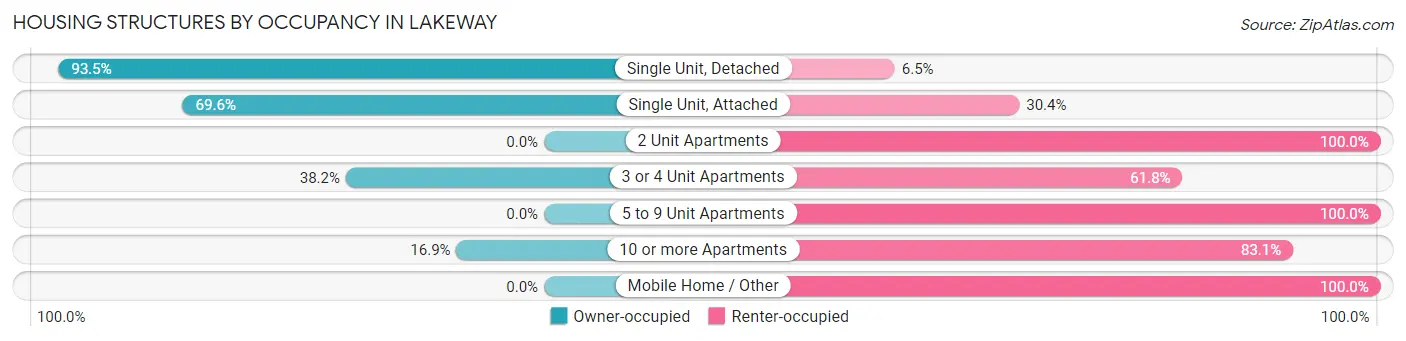
| Structure Type | Owner-occupied | Renter-occupied |
| Single Unit, Detached | 5,920 (93.5%) | 411 (6.5%) |
| Single Unit, Attached | 441 (69.6%) | 193 (30.4%) |
| 2 Unit Apartments | 0 (0.0%) | 80 (100.0%) |
| 3 or 4 Unit Apartments | 87 (38.2%) | 141 (61.8%) |
| 5 to 9 Unit Apartments | 0 (0.0%) | 191 (100.0%) |
| 10 or more Apartments | 44 (16.9%) | 217 (83.1%) |
| Mobile Home / Other | 0 (0.0%) | 20 (100.0%) |
| Total | 6,492 (83.8%) | 1,253 (16.2%) |
Housing Structures by Number of Rooms in Lakeway
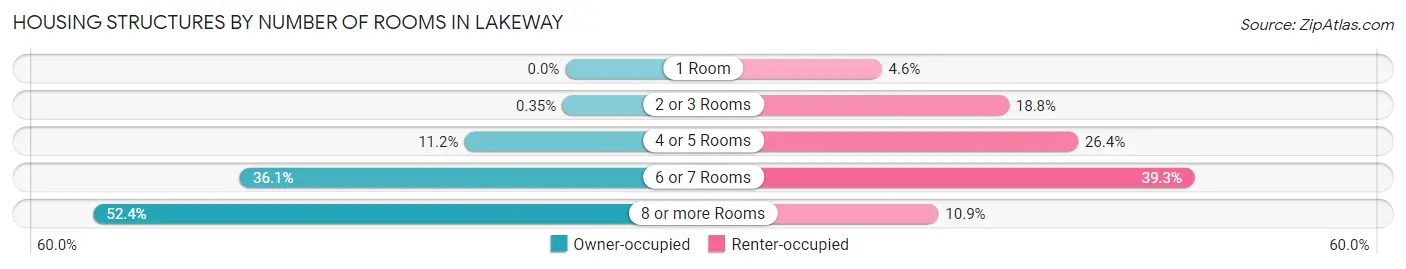
| Number of Rooms | Owner-occupied | Renter-occupied |
| 1 Room | 0 (0.0%) | 58 (4.6%) |
| 2 or 3 Rooms | 23 (0.4%) | 235 (18.8%) |
| 4 or 5 Rooms | 728 (11.2%) | 331 (26.4%) |
| 6 or 7 Rooms | 2,342 (36.1%) | 492 (39.3%) |
| 8 or more Rooms | 3,399 (52.4%) | 137 (10.9%) |
| Total | 6,492 (100.0%) | 1,253 (100.0%) |
Housing Structure by Heating Type in Lakeway
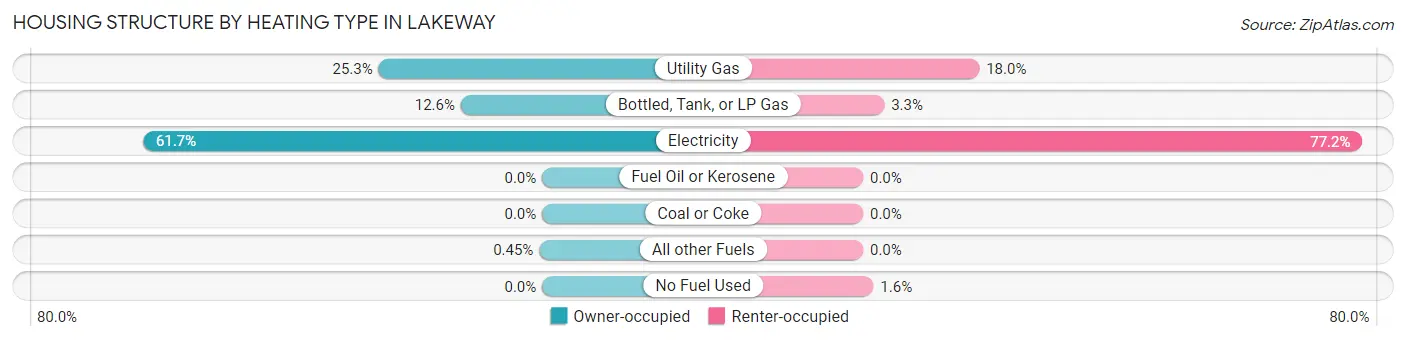
| Heating Type | Owner-occupied | Renter-occupied |
| Utility Gas | 1,641 (25.3%) | 225 (18.0%) |
| Bottled, Tank, or LP Gas | 816 (12.6%) | 41 (3.3%) |
| Electricity | 4,006 (61.7%) | 967 (77.2%) |
| Fuel Oil or Kerosene | 0 (0.0%) | 0 (0.0%) |
| Coal or Coke | 0 (0.0%) | 0 (0.0%) |
| All other Fuels | 29 (0.4%) | 0 (0.0%) |
| No Fuel Used | 0 (0.0%) | 20 (1.6%) |
| Total | 6,492 (100.0%) | 1,253 (100.0%) |
Household Vehicle Usage in Lakeway
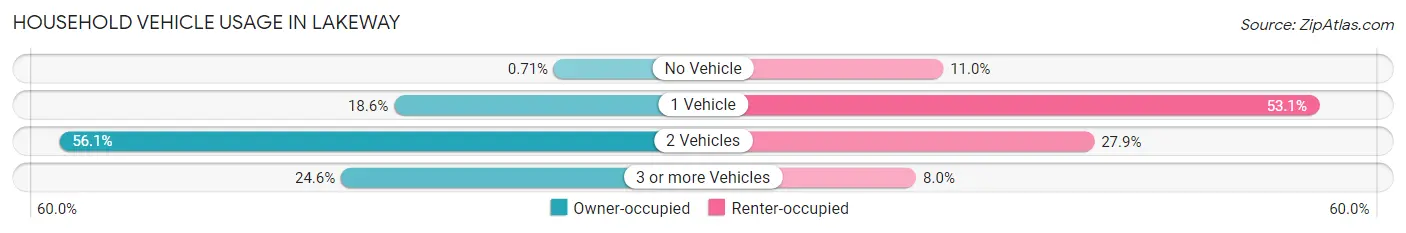
| Vehicles per Household | Owner-occupied | Renter-occupied |
| No Vehicle | 46 (0.7%) | 138 (11.0%) |
| 1 Vehicle | 1,209 (18.6%) | 665 (53.1%) |
| 2 Vehicles | 3,643 (56.1%) | 350 (27.9%) |
| 3 or more Vehicles | 1,594 (24.5%) | 100 (8.0%) |
| Total | 6,492 (100.0%) | 1,253 (100.0%) |
Real Estate & Mortgages in Lakeway
Real Estate and Mortgage Overview in Lakeway
| Characteristic | Without Mortgage | With Mortgage |
| Housing Units | 2,151 | 4,341 |
| Median Property Value | $636,900 | $636,600 |
| Median Household Income | $131,929 | $2,737 |
| Monthly Housing Costs | $1,260 | $2,529 |
| Real Estate Taxes | $8,750 | $14 |
Property Value by Mortgage Status in Lakeway
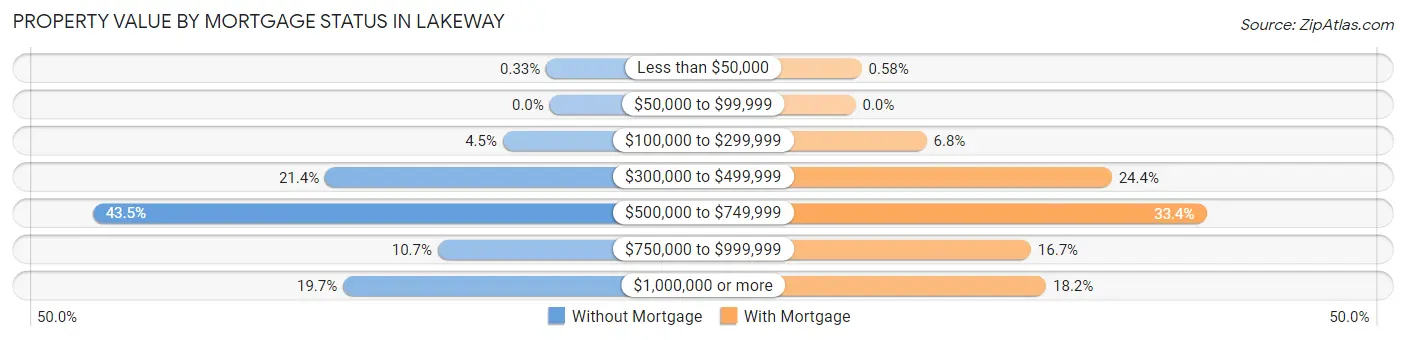
| Property Value | Without Mortgage | With Mortgage |
| Less than $50,000 | 7 (0.3%) | 25 (0.6%) |
| $50,000 to $99,999 | 0 (0.0%) | 0 (0.0%) |
| $100,000 to $299,999 | 96 (4.5%) | 294 (6.8%) |
| $300,000 to $499,999 | 460 (21.4%) | 1,059 (24.4%) |
| $500,000 to $749,999 | 936 (43.5%) | 1,450 (33.4%) |
| $750,000 to $999,999 | 229 (10.6%) | 725 (16.7%) |
| $1,000,000 or more | 423 (19.7%) | 788 (18.1%) |
| Total | 2,151 (100.0%) | 4,341 (100.0%) |
Household Income by Mortgage Status in Lakeway
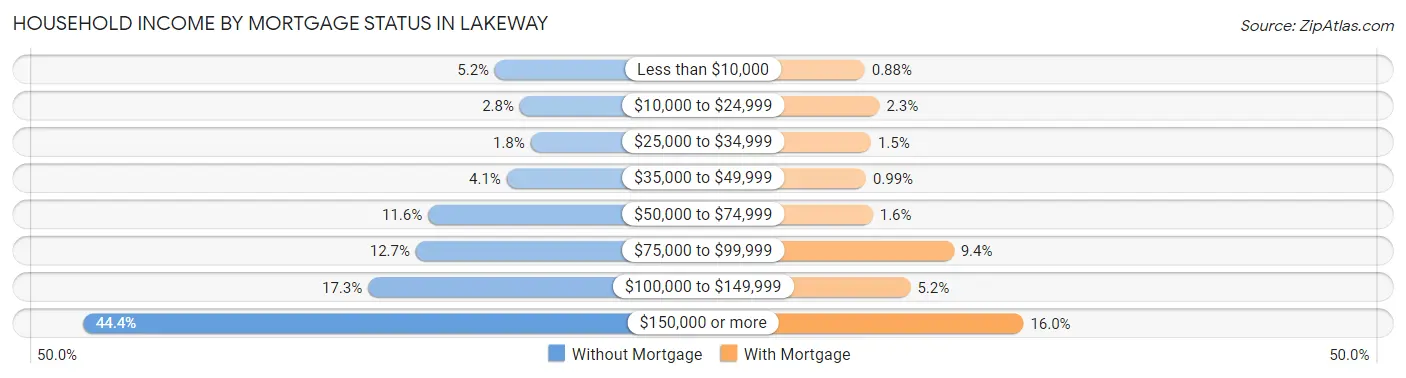
| Household Income | Without Mortgage | With Mortgage |
| Less than $10,000 | 112 (5.2%) | 38 (0.9%) |
| $10,000 to $24,999 | 61 (2.8%) | 99 (2.3%) |
| $25,000 to $34,999 | 39 (1.8%) | 64 (1.5%) |
| $35,000 to $49,999 | 88 (4.1%) | 43 (1.0%) |
| $50,000 to $74,999 | 249 (11.6%) | 71 (1.6%) |
| $75,000 to $99,999 | 274 (12.7%) | 406 (9.3%) |
| $100,000 to $149,999 | 372 (17.3%) | 227 (5.2%) |
| $150,000 or more | 956 (44.4%) | 694 (16.0%) |
| Total | 2,151 (100.0%) | 4,341 (100.0%) |
Property Value to Household Income Ratio in Lakeway
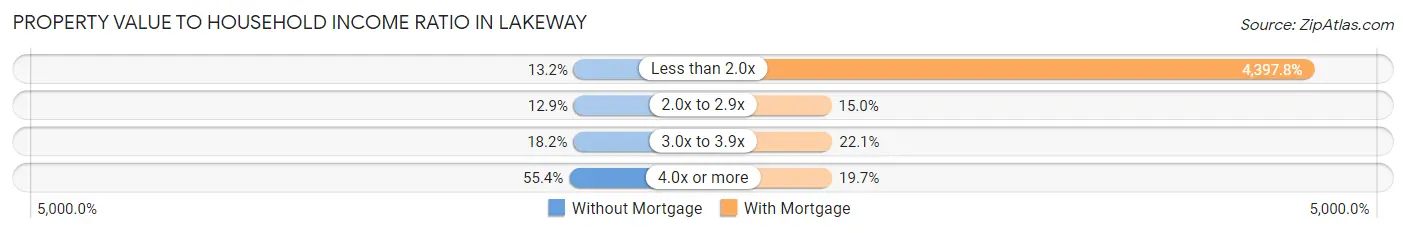
| Value-to-Income Ratio | Without Mortgage | With Mortgage |
| Less than 2.0x | 283 (13.2%) | 190,907 (4,397.8%) |
| 2.0x to 2.9x | 277 (12.9%) | 649 (14.9%) |
| 3.0x to 3.9x | 391 (18.2%) | 959 (22.1%) |
| 4.0x or more | 1,192 (55.4%) | 855 (19.7%) |
| Total | 2,151 (100.0%) | 4,341 (100.0%) |
Real Estate Taxes by Mortgage Status in Lakeway
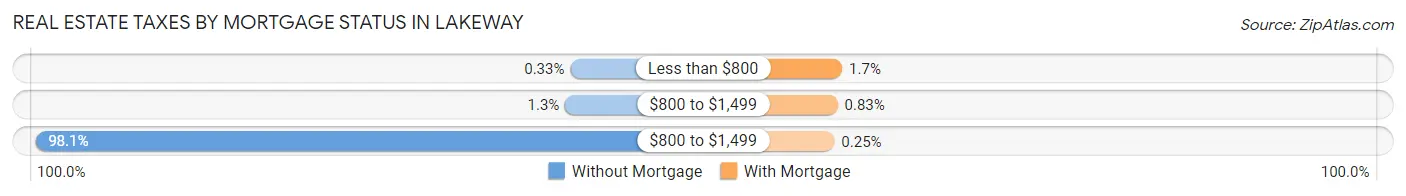
| Property Taxes | Without Mortgage | With Mortgage |
| Less than $800 | 7 (0.3%) | 72 (1.7%) |
| $800 to $1,499 | 27 (1.3%) | 36 (0.8%) |
| $800 to $1,499 | 2,109 (98.1%) | 11 (0.3%) |
| Total | 2,151 (100.0%) | 4,341 (100.0%) |
Health & Disability in Lakeway
Health Insurance Coverage by Age in Lakeway
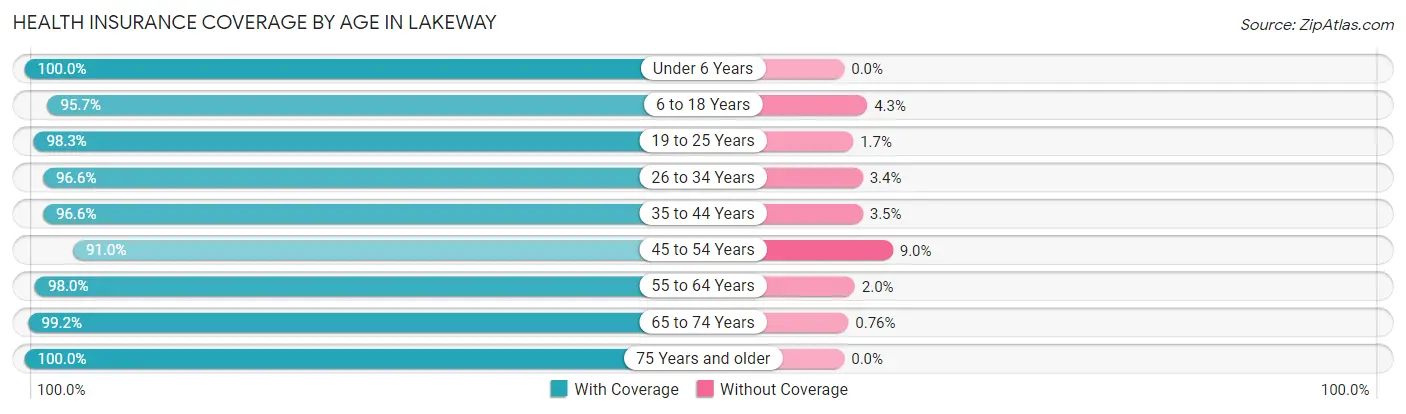
| Age Bracket | With Coverage | Without Coverage |
| Under 6 Years | 996 (100.0%) | 0 (0.0%) |
| 6 to 18 Years | 3,138 (95.7%) | 140 (4.3%) |
| 19 to 25 Years | 594 (98.3%) | 10 (1.7%) |
| 26 to 34 Years | 815 (96.6%) | 29 (3.4%) |
| 35 to 44 Years | 2,185 (96.6%) | 78 (3.5%) |
| 45 to 54 Years | 2,849 (91.0%) | 283 (9.0%) |
| 55 to 64 Years | 3,040 (98.0%) | 61 (2.0%) |
| 65 to 74 Years | 2,870 (99.2%) | 22 (0.8%) |
| 75 Years and older | 1,613 (100.0%) | 0 (0.0%) |
| Total | 18,100 (96.7%) | 623 (3.3%) |
Health Insurance Coverage by Citizenship Status in Lakeway
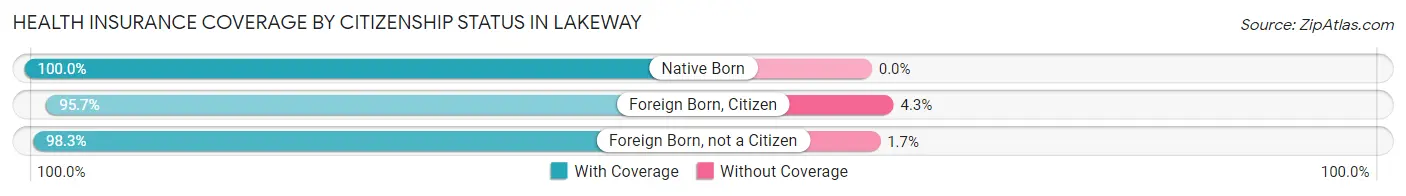
| Citizenship Status | With Coverage | Without Coverage |
| Native Born | 996 (100.0%) | 0 (0.0%) |
| Foreign Born, Citizen | 3,138 (95.7%) | 140 (4.3%) |
| Foreign Born, not a Citizen | 594 (98.3%) | 10 (1.7%) |
Health Insurance Coverage by Household Income in Lakeway
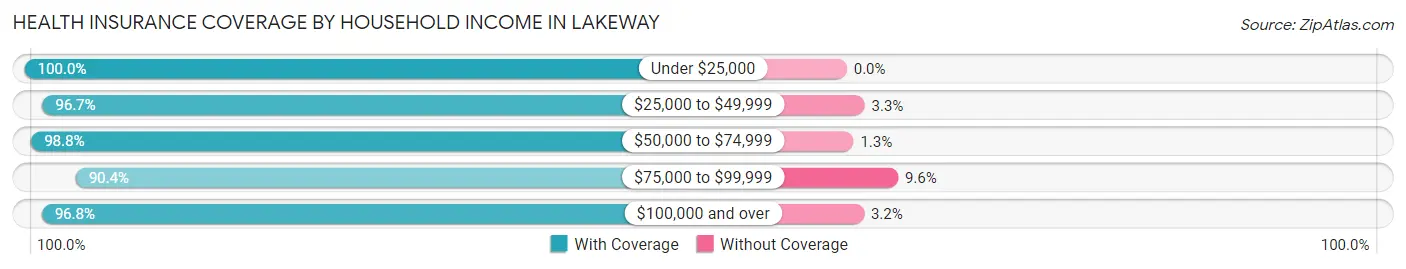
| Household Income | With Coverage | Without Coverage |
| Under $25,000 | 677 (100.0%) | 0 (0.0%) |
| $25,000 to $49,999 | 812 (96.7%) | 28 (3.3%) |
| $50,000 to $74,999 | 1,496 (98.8%) | 19 (1.3%) |
| $75,000 to $99,999 | 1,057 (90.4%) | 112 (9.6%) |
| $100,000 and over | 13,990 (96.8%) | 464 (3.2%) |
Public vs Private Health Insurance Coverage by Age in Lakeway
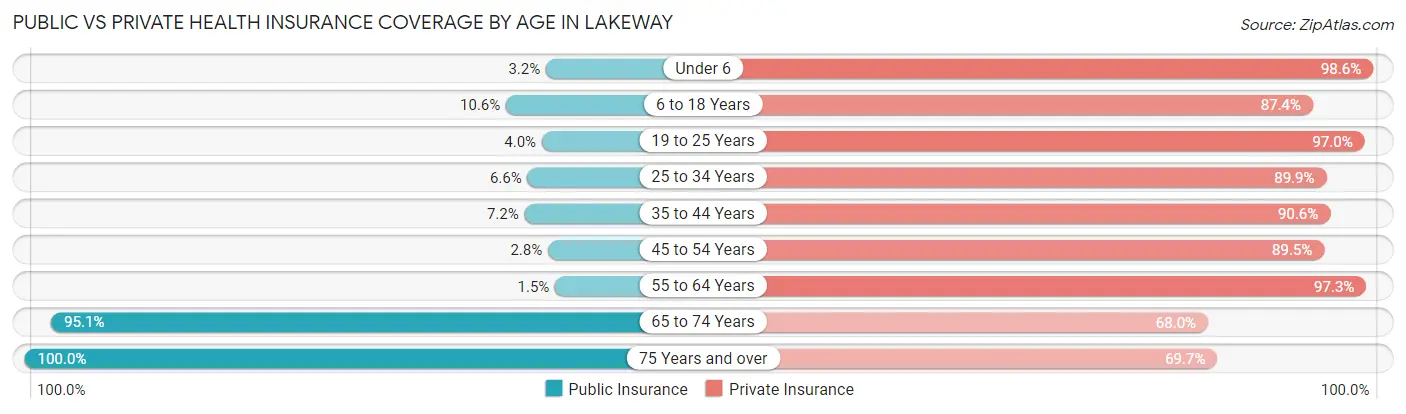
| Age Bracket | Public Insurance | Private Insurance |
| Under 6 | 32 (3.2%) | 982 (98.6%) |
| 6 to 18 Years | 348 (10.6%) | 2,866 (87.4%) |
| 19 to 25 Years | 24 (4.0%) | 586 (97.0%) |
| 25 to 34 Years | 56 (6.6%) | 759 (89.9%) |
| 35 to 44 Years | 163 (7.2%) | 2,051 (90.6%) |
| 45 to 54 Years | 89 (2.8%) | 2,804 (89.5%) |
| 55 to 64 Years | 47 (1.5%) | 3,018 (97.3%) |
| 65 to 74 Years | 2,749 (95.1%) | 1,965 (67.9%) |
| 75 Years and over | 1,613 (100.0%) | 1,124 (69.7%) |
| Total | 5,121 (27.4%) | 16,155 (86.3%) |
Disability Status by Sex by Age in Lakeway
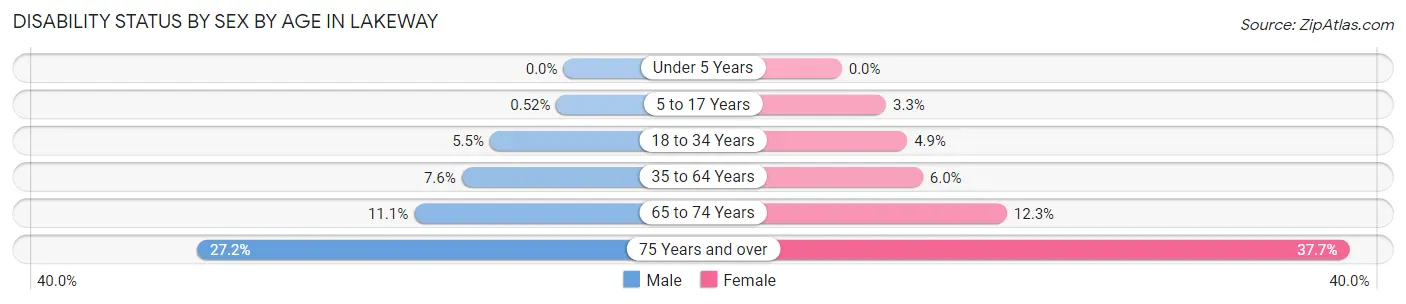
| Age Bracket | Male | Female |
| Under 5 Years | 0 (0.0%) | 0 (0.0%) |
| 5 to 17 Years | 9 (0.5%) | 55 (3.3%) |
| 18 to 34 Years | 43 (5.5%) | 38 (4.9%) |
| 35 to 64 Years | 328 (7.6%) | 250 (6.0%) |
| 65 to 74 Years | 138 (11.1%) | 202 (12.3%) |
| 75 Years and over | 199 (27.2%) | 332 (37.7%) |
Disability Class by Sex by Age in Lakeway
Disability Class: Hearing Difficulty
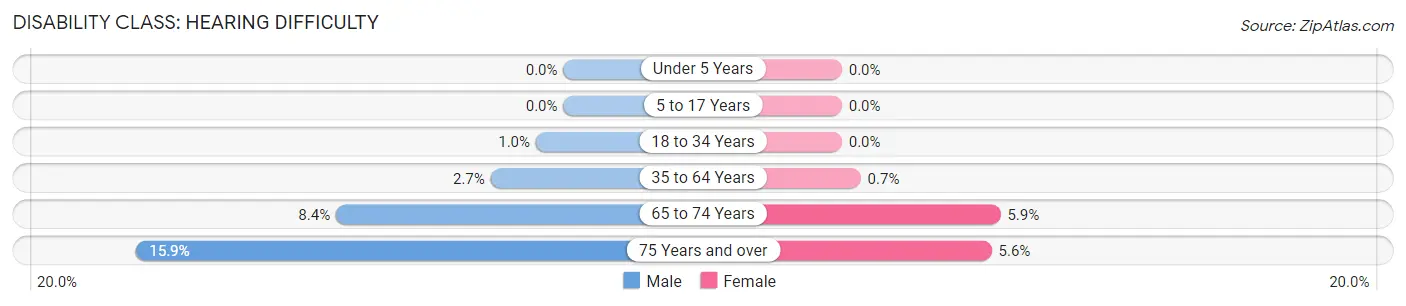
| Age Bracket | Male | Female |
| Under 5 Years | 0 (0.0%) | 0 (0.0%) |
| 5 to 17 Years | 0 (0.0%) | 0 (0.0%) |
| 18 to 34 Years | 8 (1.0%) | 0 (0.0%) |
| 35 to 64 Years | 117 (2.7%) | 29 (0.7%) |
| 65 to 74 Years | 105 (8.4%) | 97 (5.9%) |
| 75 Years and over | 116 (15.9%) | 49 (5.6%) |
Disability Class: Vision Difficulty
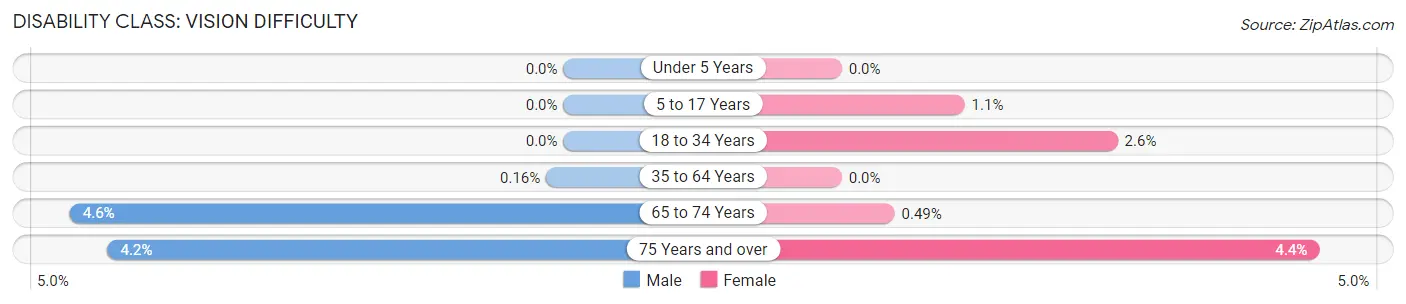
| Age Bracket | Male | Female |
| Under 5 Years | 0 (0.0%) | 0 (0.0%) |
| 5 to 17 Years | 0 (0.0%) | 19 (1.1%) |
| 18 to 34 Years | 0 (0.0%) | 20 (2.6%) |
| 35 to 64 Years | 7 (0.2%) | 0 (0.0%) |
| 65 to 74 Years | 57 (4.6%) | 8 (0.5%) |
| 75 Years and over | 31 (4.2%) | 39 (4.4%) |
Disability Class: Cognitive Difficulty
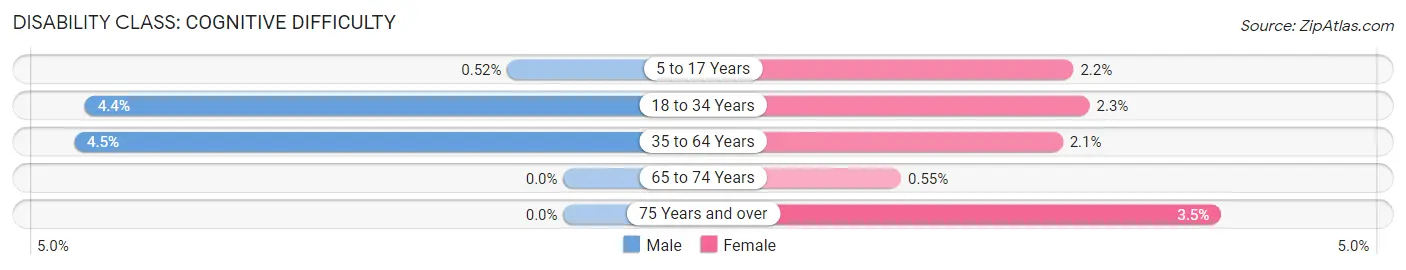
| Age Bracket | Male | Female |
| 5 to 17 Years | 9 (0.5%) | 36 (2.1%) |
| 18 to 34 Years | 35 (4.4%) | 18 (2.3%) |
| 35 to 64 Years | 197 (4.5%) | 85 (2.1%) |
| 65 to 74 Years | 0 (0.0%) | 9 (0.5%) |
| 75 Years and over | 0 (0.0%) | 31 (3.5%) |
Disability Class: Ambulatory Difficulty
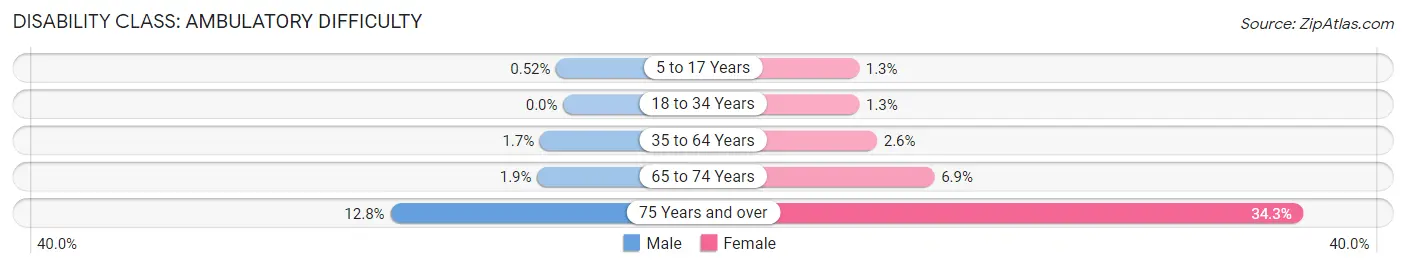
| Age Bracket | Male | Female |
| 5 to 17 Years | 9 (0.5%) | 21 (1.3%) |
| 18 to 34 Years | 0 (0.0%) | 10 (1.3%) |
| 35 to 64 Years | 75 (1.7%) | 108 (2.6%) |
| 65 to 74 Years | 24 (1.9%) | 113 (6.9%) |
| 75 Years and over | 94 (12.8%) | 302 (34.3%) |
Disability Class: Self-Care Difficulty
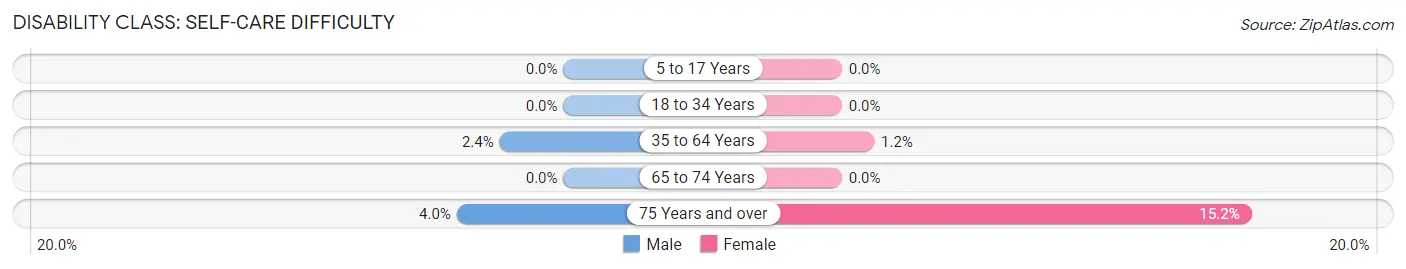
| Age Bracket | Male | Female |
| 5 to 17 Years | 0 (0.0%) | 0 (0.0%) |
| 18 to 34 Years | 0 (0.0%) | 0 (0.0%) |
| 35 to 64 Years | 103 (2.4%) | 50 (1.2%) |
| 65 to 74 Years | 0 (0.0%) | 0 (0.0%) |
| 75 Years and over | 29 (4.0%) | 134 (15.2%) |
Technology Access in Lakeway
Computing Device Access in Lakeway
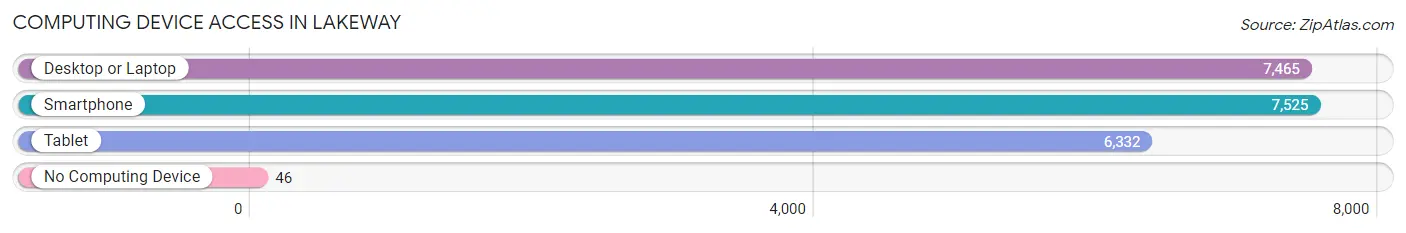
| Device Type | # Households | % Households |
| Desktop or Laptop | 7,465 | 96.4% |
| Smartphone | 7,525 | 97.2% |
| Tablet | 6,332 | 81.8% |
| No Computing Device | 46 | 0.6% |
| Total | 7,745 | 100.0% |
Internet Access in Lakeway
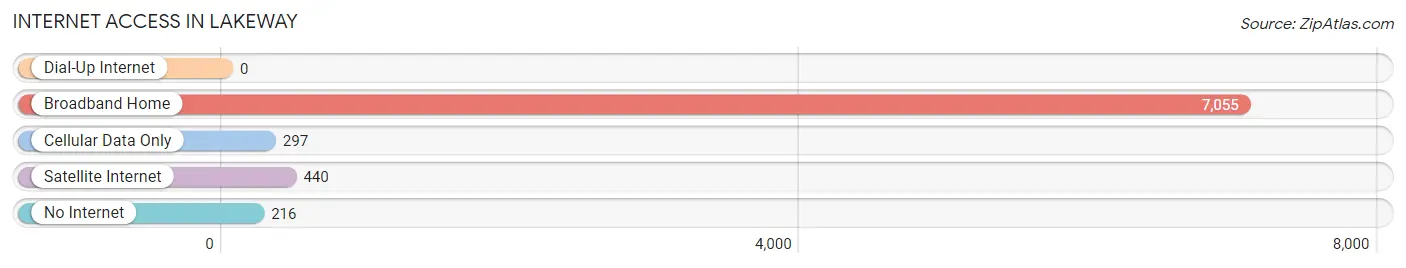
| Internet Type | # Households | % Households |
| Dial-Up Internet | 0 | 0.0% |
| Broadband Home | 7,055 | 91.1% |
| Cellular Data Only | 297 | 3.8% |
| Satellite Internet | 440 | 5.7% |
| No Internet | 216 | 2.8% |
| Total | 7,745 | 100.0% |
Lakeway Summary
Lakeway, Texas is a city located in Travis County, Texas, United States. It is situated on the shores of Lake Travis, a reservoir on the Colorado River. The city is part of the Austin-Round Rock metropolitan area and is located about 20 miles northwest of downtown Austin. As of the 2010 census, the city had a population of 11,391.
History
The area that is now Lakeway was originally inhabited by the Tonkawa Native American tribe. The first settlers in the area were German immigrants who arrived in the late 1800s. The area was known as Flint Rock, named after the flint rocks that were found in the area. In the early 1900s, the area was developed as a resort community. The first hotel was built in the area in 1912 and the first golf course was built in the 1920s.
In the 1950s, the area was developed as a residential community. The city of Lakeway was incorporated in 1962. The city was named after the lake that it is situated on.
Geography
Lakeway is located at 30°21'25" North, 97°58'45" West (30.356944, -97.979167). The city has a total area of 8.3 square miles, of which 8.2 square miles is land and 0.1 square miles is water.
The city is situated on the shores of Lake Travis, a reservoir on the Colorado River. The lake is a popular destination for fishing, boating, and other recreational activities.
Economy
The economy of Lakeway is largely based on tourism and recreation. The city is home to several resorts and golf courses, as well as a marina. The city also has a number of restaurants, bars, and shops.
The city is also home to several technology companies including Dell IBM and Oracle
Demographics
As of the 2010 census, the city had a population of 11,391. The racial makeup of the city was 87.3% White, 4.2% African American, 0.3% Native American, 3.2% Asian, 0.1% Pacific Islander, 2.2% from other races, and 2.9% from two or more races. Hispanic or Latino of any race were 8.7% of the population.
The median income for a household in the city was $76,945, and the median income for a family was $90,945. The per capita income for the city was $37,945. About 4.2% of families and 5.7% of the population were below the poverty line, including 6.3% of those under age 18 and 4.2% of those age 65 or over.
Common Questions
What is Per Capita Income in Lakeway?
Per Capita income in Lakeway is $85,011.
What is the Median Family Income in Lakeway?
Median Family Income in Lakeway is $181,588.
What is the Median Household income in Lakeway?
Median Household Income in Lakeway is $154,118.
What is Income or Wage Gap in Lakeway?
Income or Wage Gap in Lakeway is 45.1%.
Women in Lakeway earn 54.9 cents for every dollar earned by a man.
What is Inequality or Gini Index in Lakeway?
Inequality or Gini Index in Lakeway is 0.45.
What is the Total Population of Lakeway?
Total Population of Lakeway is 18,835.
What is the Total Male Population of Lakeway?
Total Male Population of Lakeway is 9,221.
What is the Total Female Population of Lakeway?
Total Female Population of Lakeway is 9,614.
What is the Ratio of Males per 100 Females in Lakeway?
There are 95.91 Males per 100 Females in Lakeway.
What is the Ratio of Females per 100 Males in Lakeway?
There are 104.26 Females per 100 Males in Lakeway.
What is the Median Population Age in Lakeway?
Median Population Age in Lakeway is 50.2 Years.
What is the Average Family Size in Lakeway
Average Family Size in Lakeway is 2.7 People.
What is the Average Household Size in Lakeway
Average Household Size in Lakeway is 2.4 People.
How Large is the Labor Force in Lakeway?
There are 8,775 People in the Labor Forcein in Lakeway.
What is the Percentage of People in the Labor Force in Lakeway?
57.4% of People are in the Labor Force in Lakeway.
What is the Unemployment Rate in Lakeway?
Unemployment Rate in Lakeway is 2.8%.