Waskom, TX Map & Demographics
Waskom Map
Waskom Overview
$22,688
PER CAPITA INCOME
$62,279
AVG FAMILY INCOME
$47,313
AVG HOUSEHOLD INCOME
51.8%
WAGE / INCOME GAP [ % ]
48.2¢/ $1
WAGE / INCOME GAP [ $ ]
0.38
INEQUALITY / GINI INDEX
1,682
TOTAL POPULATION
821
MALE POPULATION
861
FEMALE POPULATION
95.35
MALES / 100 FEMALES
104.87
FEMALES / 100 MALES
32.9
MEDIAN AGE
3.6
AVG FAMILY SIZE
3.0
AVG HOUSEHOLD SIZE
690
LABOR FORCE [ PEOPLE ]
52.5%
PERCENT IN LABOR FORCE
5.4%
UNEMPLOYMENT RATE
Waskom Zip Codes
Waskom Area Codes
Income in Waskom
Income Overview in Waskom
Per Capita Income in Waskom is $22,688, while median incomes of families and households are $62,279 and $47,313 respectively.
| Characteristic | Number | Measure |
| Per Capita Income | 1,682 | $22,688 |
| Median Family Income | 391 | $62,279 |
| Mean Family Income | 391 | $73,736 |
| Median Household Income | 551 | $47,313 |
| Mean Household Income | 551 | $62,054 |
| Income Deficit | 391 | $0 |
| Wage / Income Gap (%) | 1,682 | 51.80% |
| Wage / Income Gap ($) | 1,682 | 48.20¢ per $1 |
| Gini / Inequality Index | 1,682 | 0.38 |
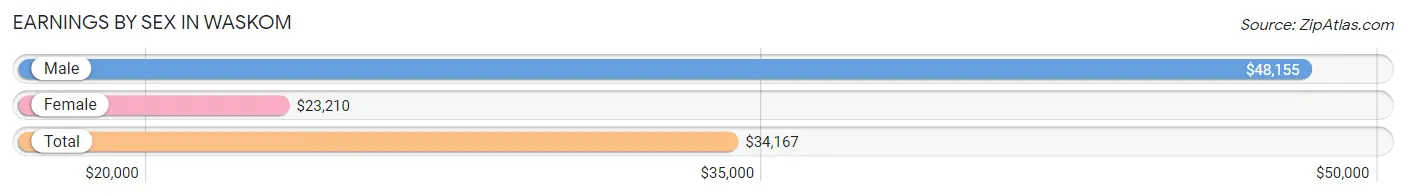
Earnings by Sex in Waskom
Average Earnings in Waskom are $34,167, $48,155 for men and $23,210 for women, a difference of 51.8%.
| Sex | Number | Average Earnings |
| Male | 401 (54.9%) | $48,155 |
| Female | 329 (45.1%) | $23,210 |
| Total | 730 (100.0%) | $34,167 |
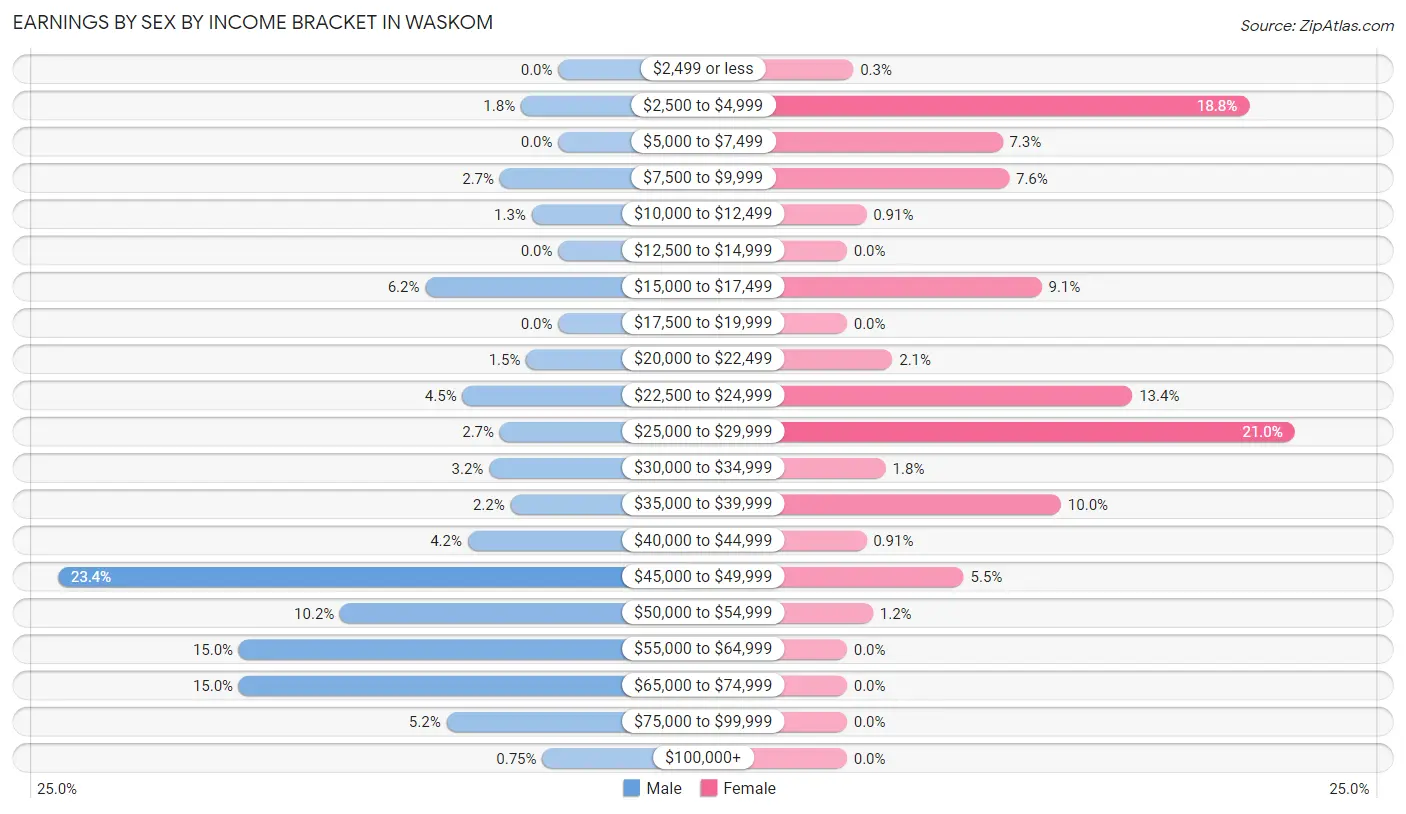
Earnings by Sex by Income Bracket in Waskom
The most common earnings brackets in Waskom are $45,000 to $49,999 for men (94 | 23.4%) and $25,000 to $29,999 for women (69 | 21.0%).
| Income | Male | Female |
| $2,499 or less | 0 (0.0%) | 1 (0.3%) |
| $2,500 to $4,999 | 7 (1.8%) | 62 (18.8%) |
| $5,000 to $7,499 | 0 (0.0%) | 24 (7.3%) |
| $7,500 to $9,999 | 11 (2.7%) | 25 (7.6%) |
| $10,000 to $12,499 | 5 (1.3%) | 3 (0.9%) |
| $12,500 to $14,999 | 0 (0.0%) | 0 (0.0%) |
| $15,000 to $17,499 | 25 (6.2%) | 30 (9.1%) |
| $17,500 to $19,999 | 0 (0.0%) | 0 (0.0%) |
| $20,000 to $22,499 | 6 (1.5%) | 7 (2.1%) |
| $22,500 to $24,999 | 18 (4.5%) | 44 (13.4%) |
| $25,000 to $29,999 | 11 (2.7%) | 69 (21.0%) |
| $30,000 to $34,999 | 13 (3.2%) | 6 (1.8%) |
| $35,000 to $39,999 | 9 (2.2%) | 33 (10.0%) |
| $40,000 to $44,999 | 17 (4.2%) | 3 (0.9%) |
| $45,000 to $49,999 | 94 (23.4%) | 18 (5.5%) |
| $50,000 to $54,999 | 41 (10.2%) | 4 (1.2%) |
| $55,000 to $64,999 | 60 (15.0%) | 0 (0.0%) |
| $65,000 to $74,999 | 60 (15.0%) | 0 (0.0%) |
| $75,000 to $99,999 | 21 (5.2%) | 0 (0.0%) |
| $100,000+ | 3 (0.7%) | 0 (0.0%) |
| Total | 401 (100.0%) | 329 (100.0%) |
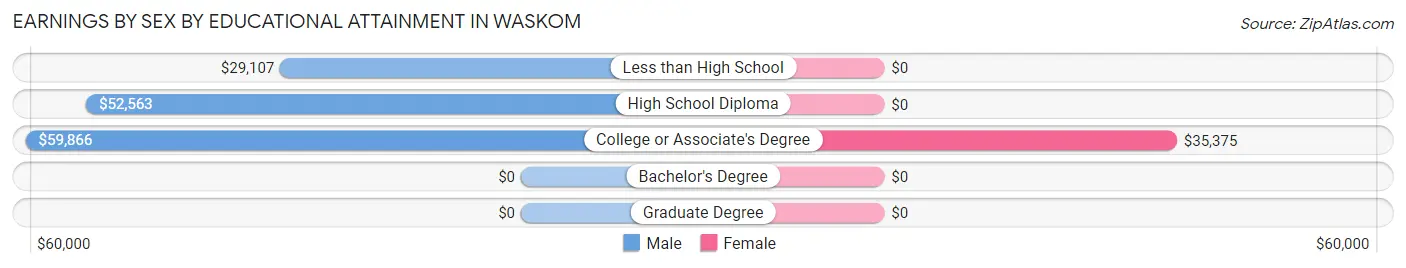
Earnings by Sex by Educational Attainment in Waskom
Average earnings in Waskom are $54,268 for men and $24,034 for women, a difference of 55.7%. Men with an educational attainment of college or associate's degree enjoy the highest average annual earnings of $59,866, while those with less than high school education earn the least with $29,107. Women with an educational attainment of college or associate's degree earn the most with the average annual earnings of $35,375, while those with college or associate's degree education have the smallest earnings of $35,375.
| Educational Attainment | Male Income | Female Income |
| Less than High School | $29,107 | $0 |
| High School Diploma | $52,563 | $0 |
| College or Associate's Degree | $59,866 | $35,375 |
| Bachelor's Degree | - | - |
| Graduate Degree | - | - |
| Total | $54,268 | $24,034 |
Family Income in Waskom
Family Income Brackets in Waskom
According to the Waskom family income data, there are 114 families falling into the $75,000 to $99,999 income range, which is the most common income bracket and makes up 29.2% of all families. Conversely, the $150,000 to $199,999 income bracket is the least frequent group with only 4 families (1.0%) belonging to this category.
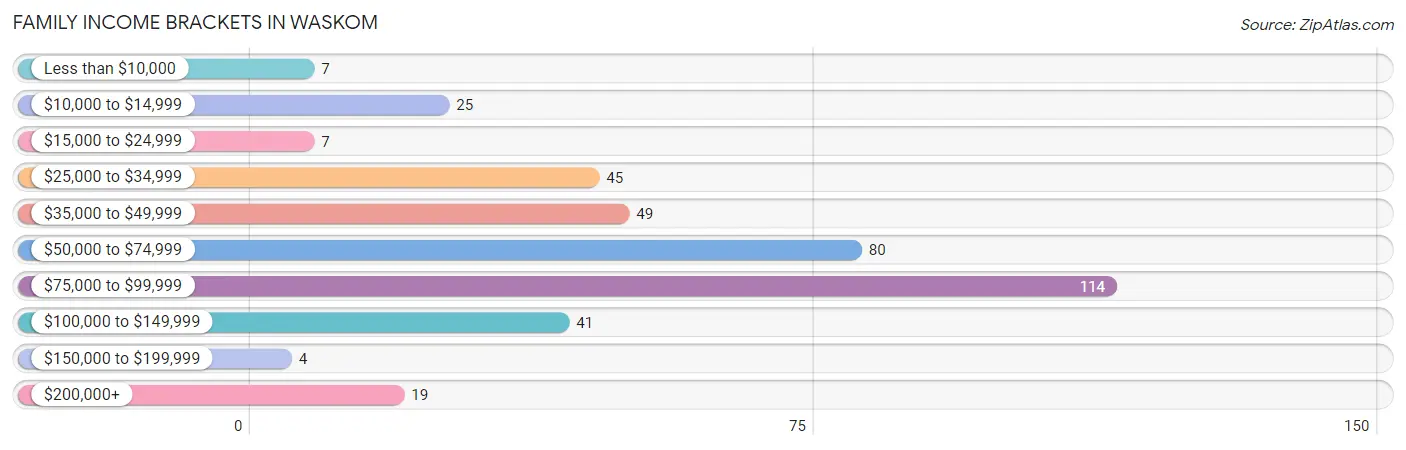
| Income Bracket | # Families | % Families |
| Less than $10,000 | 7 | 1.8% |
| $10,000 to $14,999 | 25 | 6.4% |
| $15,000 to $24,999 | 7 | 1.8% |
| $25,000 to $34,999 | 45 | 11.5% |
| $35,000 to $49,999 | 49 | 12.5% |
| $50,000 to $74,999 | 80 | 20.5% |
| $75,000 to $99,999 | 114 | 29.2% |
| $100,000 to $149,999 | 41 | 10.5% |
| $150,000 to $199,999 | 4 | 1.0% |
| $200,000+ | 19 | 4.9% |
Family Income by Famaliy Size in Waskom
6-person families (27 | 6.9%) account for the highest median family income in Waskom with $250,001 per family, while 6-person families (27 | 6.9%) have the highest median income of $41,667 per family member.
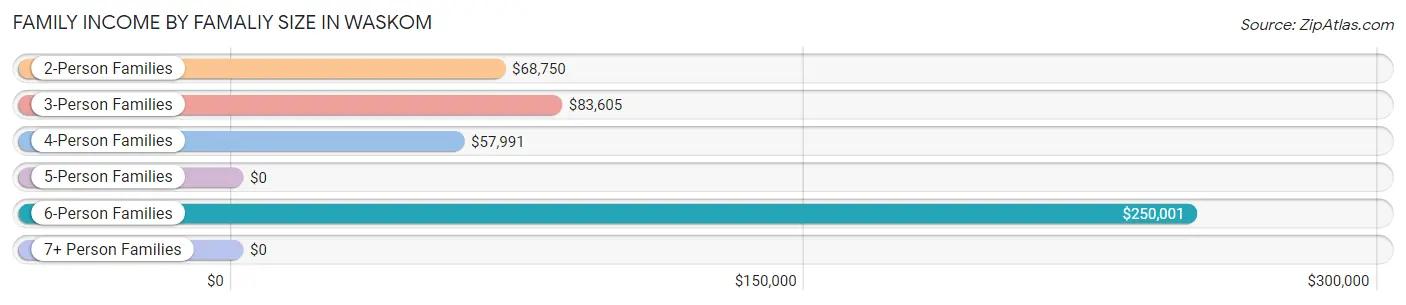
| Income Bracket | # Families | Median Income |
| 2-Person Families | 172 (44.0%) | $68,750 |
| 3-Person Families | 80 (20.5%) | $83,605 |
| 4-Person Families | 77 (19.7%) | $57,991 |
| 5-Person Families | 35 (8.9%) | $0 |
| 6-Person Families | 27 (6.9%) | $250,001 |
| 7+ Person Families | 0 (0.0%) | $0 |
| Total | 391 (100.0%) | $62,279 |
Family Income by Number of Earners in Waskom
The median family income in Waskom is $62,279, with families comprising 3+ earners (31) having the highest median family income of $250,001, while families with no earners (84) have the lowest median family income of $30,926, accounting for 7.9% and 21.5% of families, respectively.
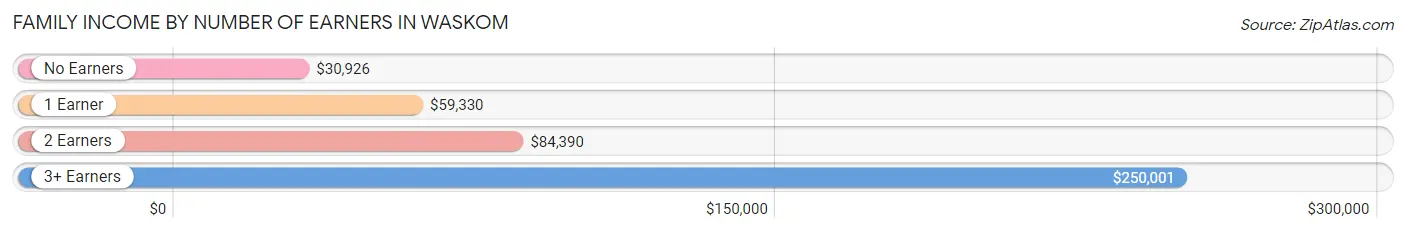
| Number of Earners | # Families | Median Income |
| No Earners | 84 (21.5%) | $30,926 |
| 1 Earner | 147 (37.6%) | $59,330 |
| 2 Earners | 129 (33.0%) | $84,390 |
| 3+ Earners | 31 (7.9%) | $250,001 |
| Total | 391 (100.0%) | $62,279 |
Household Income in Waskom
Household Income Brackets in Waskom
With 150 households falling in the category, the $75,000 to $99,999 income range is the most frequent in Waskom, accounting for 27.2% of all households.
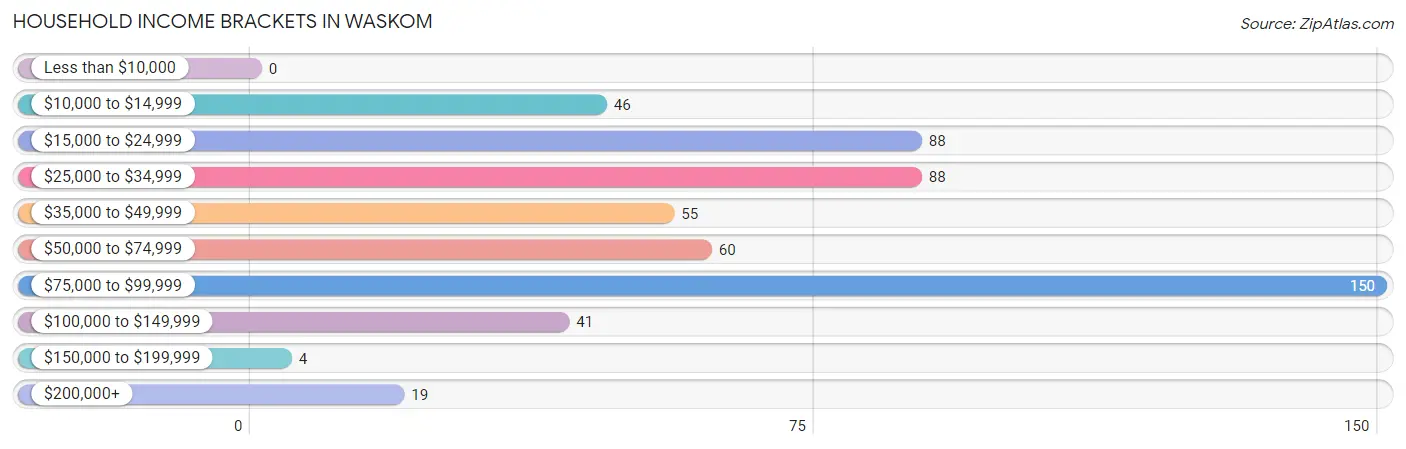
| Income Bracket | # Households | % Households |
| Less than $10,000 | 0 | 0.0% |
| $10,000 to $14,999 | 46 | 8.3% |
| $15,000 to $24,999 | 88 | 16.0% |
| $25,000 to $34,999 | 88 | 16.0% |
| $35,000 to $49,999 | 55 | 10.0% |
| $50,000 to $74,999 | 60 | 10.9% |
| $75,000 to $99,999 | 150 | 27.2% |
| $100,000 to $149,999 | 41 | 7.4% |
| $150,000 to $199,999 | 4 | 0.7% |
| $200,000+ | 19 | 3.4% |
Household Income by Householder Age in Waskom
The median household income in Waskom is $47,313, with the highest median household income of $82,907 found in the 45 to 64 years age bracket for the primary householder. A total of 186 households (33.8%) fall into this category. Meanwhile, the 15 to 24 years age bracket for the primary householder has the lowest median household income of $0, with 4 households (0.7%) in this group.
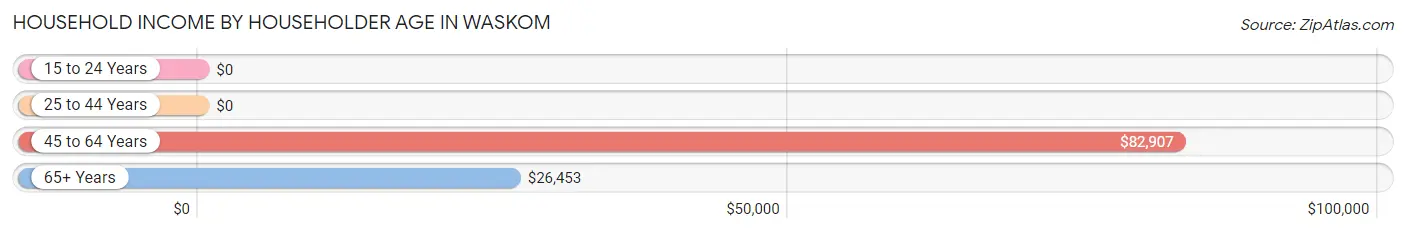
| Income Bracket | # Households | Median Income |
| 15 to 24 Years | 4 (0.7%) | $0 |
| 25 to 44 Years | 143 (26.0%) | $0 |
| 45 to 64 Years | 186 (33.8%) | $82,907 |
| 65+ Years | 218 (39.6%) | $26,453 |
| Total | 551 (100.0%) | $47,313 |
Poverty in Waskom
Income Below Poverty by Sex and Age in Waskom
With 12.1% poverty level for males and 20.1% for females among the residents of Waskom, 15 year old males and 16 and 17 year old females are the most vulnerable to poverty, with 24 males (100.0%) and 28 females (84.9%) in their respective age groups living below the poverty level.
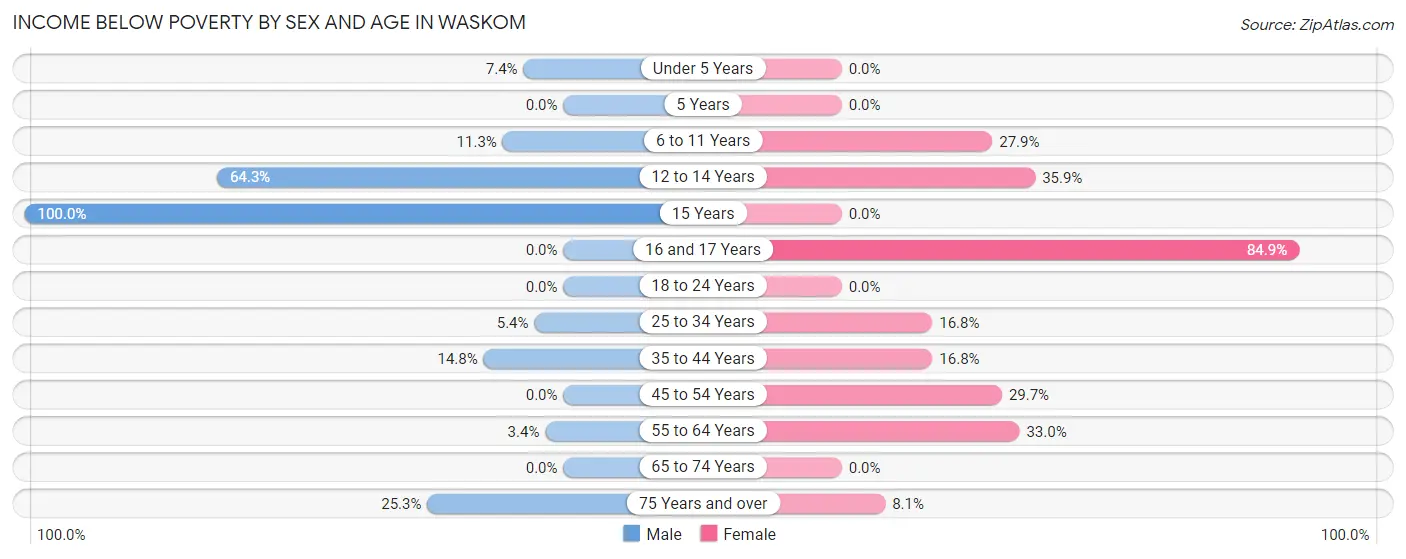
| Age Bracket | Male | Female |
| Under 5 Years | 4 (7.4%) | 0 (0.0%) |
| 5 Years | 0 (0.0%) | 0 (0.0%) |
| 6 to 11 Years | 8 (11.3%) | 19 (27.9%) |
| 12 to 14 Years | 18 (64.3%) | 14 (35.9%) |
| 15 Years | 24 (100.0%) | 0 (0.0%) |
| 16 and 17 Years | 0 (0.0%) | 28 (84.9%) |
| 18 to 24 Years | 0 (0.0%) | 0 (0.0%) |
| 25 to 34 Years | 7 (5.4%) | 42 (16.8%) |
| 35 to 44 Years | 8 (14.8%) | 18 (16.8%) |
| 45 to 54 Years | 0 (0.0%) | 11 (29.7%) |
| 55 to 64 Years | 5 (3.4%) | 31 (33.0%) |
| 65 to 74 Years | 0 (0.0%) | 0 (0.0%) |
| 75 Years and over | 25 (25.3%) | 10 (8.1%) |
| Total | 99 (12.1%) | 173 (20.1%) |
Income Above Poverty by Sex and Age in Waskom
According to the poverty statistics in Waskom, males aged 16 and 17 years and females aged under 5 years are the age groups that are most secure financially, with 100.0% of males and 100.0% of females in these age groups living above the poverty line.
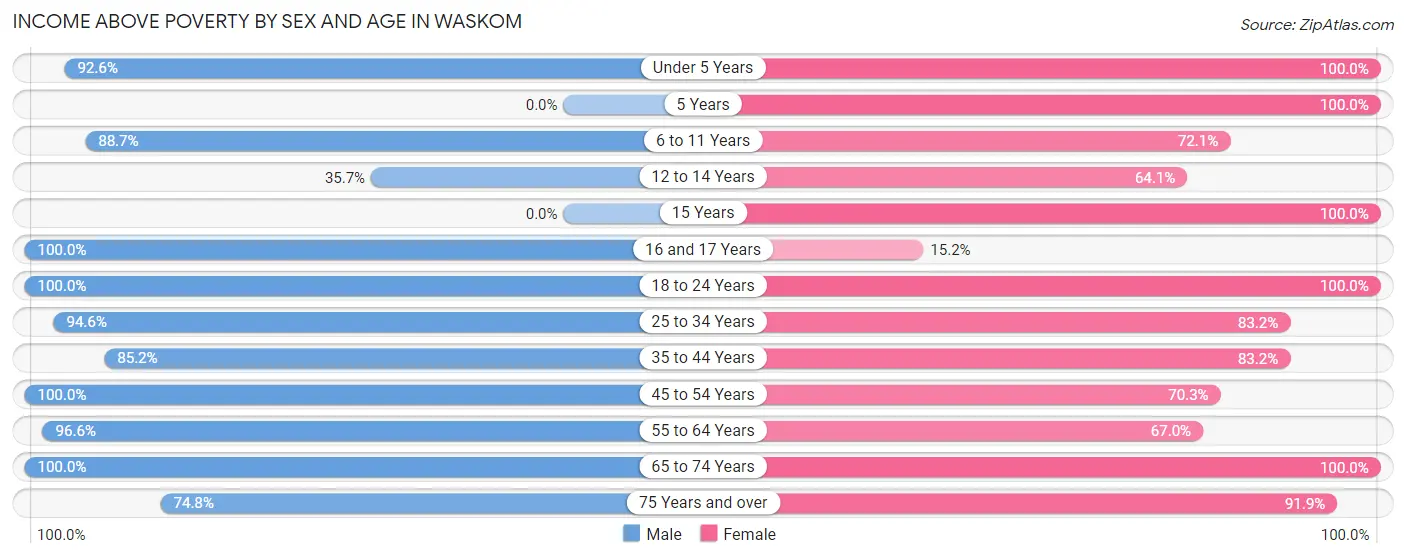
| Age Bracket | Male | Female |
| Under 5 Years | 50 (92.6%) | 53 (100.0%) |
| 5 Years | 0 (0.0%) | 26 (100.0%) |
| 6 to 11 Years | 63 (88.7%) | 49 (72.1%) |
| 12 to 14 Years | 10 (35.7%) | 25 (64.1%) |
| 15 Years | 0 (0.0%) | 5 (100.0%) |
| 16 and 17 Years | 4 (100.0%) | 5 (15.1%) |
| 18 to 24 Years | 115 (100.0%) | 15 (100.0%) |
| 25 to 34 Years | 123 (94.6%) | 208 (83.2%) |
| 35 to 44 Years | 46 (85.2%) | 89 (83.2%) |
| 45 to 54 Years | 56 (100.0%) | 26 (70.3%) |
| 55 to 64 Years | 144 (96.6%) | 63 (67.0%) |
| 65 to 74 Years | 37 (100.0%) | 10 (100.0%) |
| 75 Years and over | 74 (74.8%) | 114 (91.9%) |
| Total | 722 (87.9%) | 688 (79.9%) |
Income Below Poverty Among Married-Couple Families in Waskom
The poverty statistics for married-couple families in Waskom show that 14.8% or 30 of the total 203 families live below the poverty line. Families with no children have the highest poverty rate of 15.1%, comprising of 25 families. On the other hand, families with 1 or 2 children have the lowest poverty rate of 13.2%, which includes 5 families.
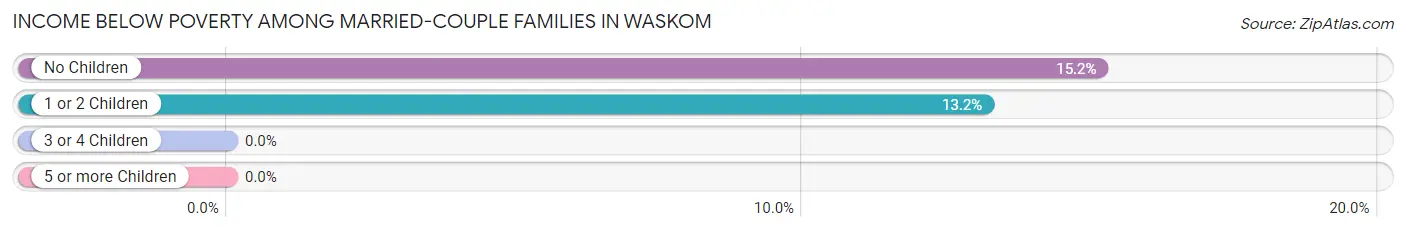
| Children | Above Poverty | Below Poverty |
| No Children | 140 (84.9%) | 25 (15.1%) |
| 1 or 2 Children | 33 (86.8%) | 5 (13.2%) |
| 3 or 4 Children | 0 (0.0%) | 0 (0.0%) |
| 5 or more Children | 0 (0.0%) | 0 (0.0%) |
| Total | 173 (85.2%) | 30 (14.8%) |
Income Below Poverty Among Single-Parent Households in Waskom
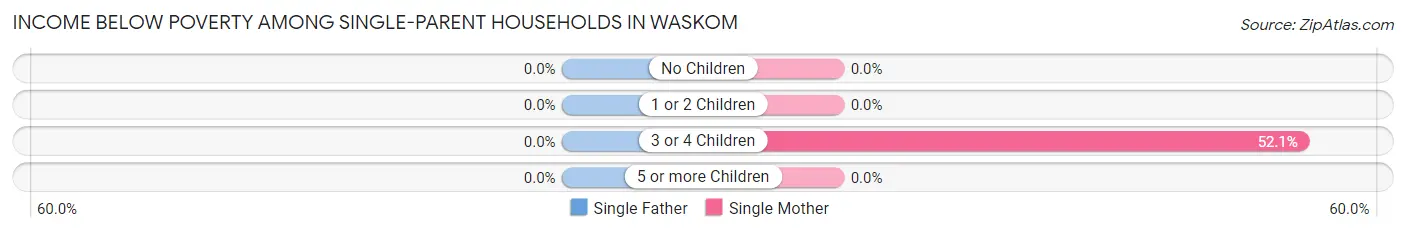
| Children | Single Father | Single Mother |
| No Children | 0 (0.0%) | 0 (0.0%) |
| 1 or 2 Children | 0 (0.0%) | 0 (0.0%) |
| 3 or 4 Children | 0 (0.0%) | 25 (52.1%) |
| 5 or more Children | 0 (0.0%) | 0 (0.0%) |
| Total | 0 (0.0%) | 25 (20.7%) |
Income Below Poverty Among Married-Couple vs Single-Parent Households in Waskom
The poverty data for Waskom shows that 30 of the married-couple family households (14.8%) and 25 of the single-parent households (13.3%) are living below the poverty level. Within the married-couple family households, those with no children have the highest poverty rate, with 25 households (15.1%) falling below the poverty line. Among the single-parent households, those with 3 or 4 children have the highest poverty rate, with 25 household (32.9%) living below poverty.
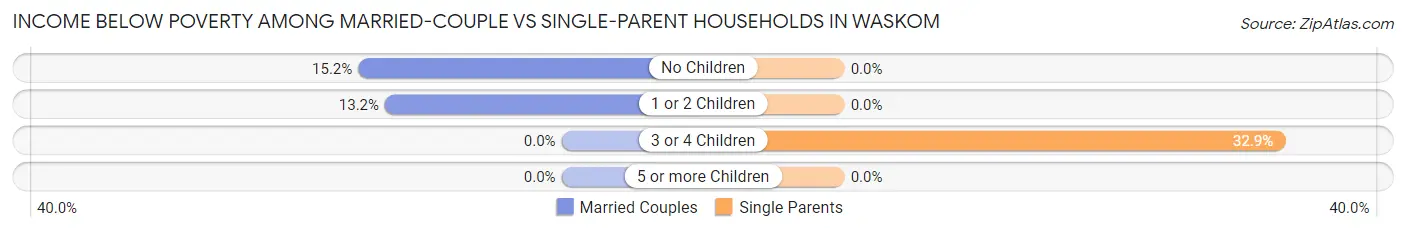
| Children | Married-Couple Families | Single-Parent Households |
| No Children | 25 (15.1%) | 0 (0.0%) |
| 1 or 2 Children | 5 (13.2%) | 0 (0.0%) |
| 3 or 4 Children | 0 (0.0%) | 25 (32.9%) |
| 5 or more Children | 0 (0.0%) | 0 (0.0%) |
| Total | 30 (14.8%) | 25 (13.3%) |
Race in Waskom
The most populous races in Waskom are White / Caucasian (1,137 | 67.6%), Black / African American (310 | 18.4%), and Hispanic or Latino (171 | 10.2%).
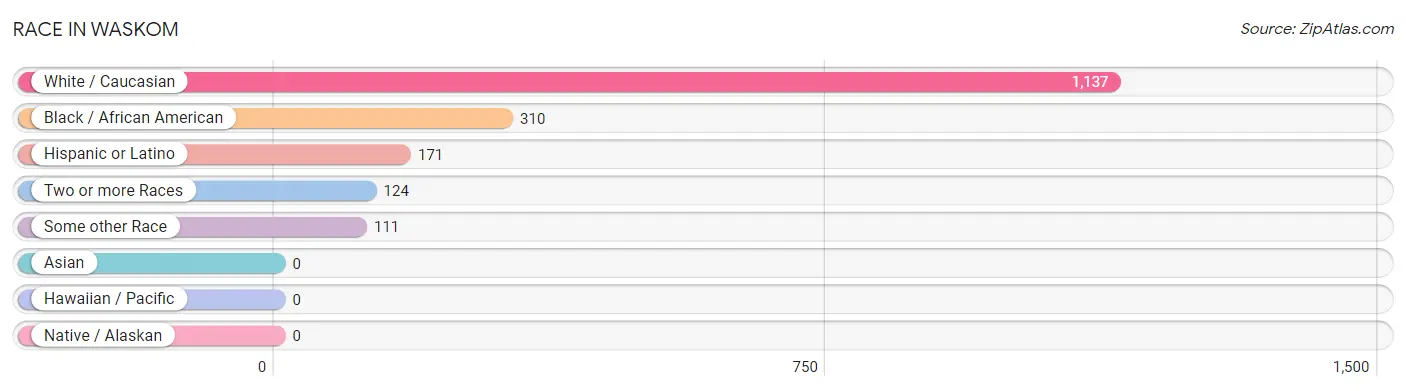
| Race | # Population | % Population |
| Asian | 0 | 0.0% |
| Black / African American | 310 | 18.4% |
| Hawaiian / Pacific | 0 | 0.0% |
| Hispanic or Latino | 171 | 10.2% |
| Native / Alaskan | 0 | 0.0% |
| White / Caucasian | 1,137 | 67.6% |
| Two or more Races | 124 | 7.4% |
| Some other Race | 111 | 6.6% |
| Total | 1,682 | 100.0% |
Ancestry in Waskom
The most populous ancestries reported in Waskom are Irish (322 | 19.1%), American (278 | 16.5%), German (198 | 11.8%), Mexican (127 | 7.5%), and English (29 | 1.7%), together accounting for 56.7% of all Waskom residents.
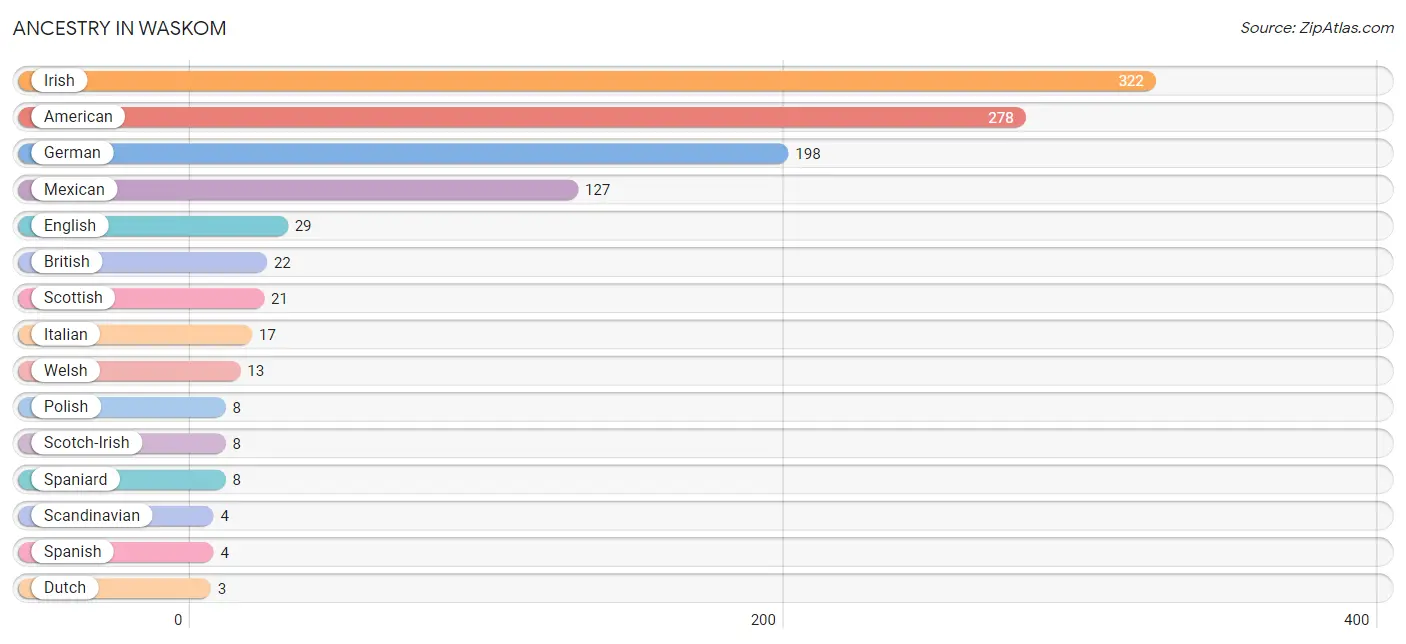
| Ancestry | # Population | % Population |
| American | 278 | 16.5% |
| British | 22 | 1.3% |
| Dutch | 3 | 0.2% |
| English | 29 | 1.7% |
| French | 3 | 0.2% |
| German | 198 | 11.8% |
| Hungarian | 2 | 0.1% |
| Irish | 322 | 19.1% |
| Italian | 17 | 1.0% |
| Mexican | 127 | 7.5% |
| Polish | 8 | 0.5% |
| Scandinavian | 4 | 0.2% |
| Scotch-Irish | 8 | 0.5% |
| Scottish | 21 | 1.3% |
| South American | 2 | 0.1% |
| Spaniard | 8 | 0.5% |
| Spanish | 4 | 0.2% |
| Venezuelan | 2 | 0.1% |
| Welsh | 13 | 0.8% | View All 19 Rows |
Immigrants in Waskom
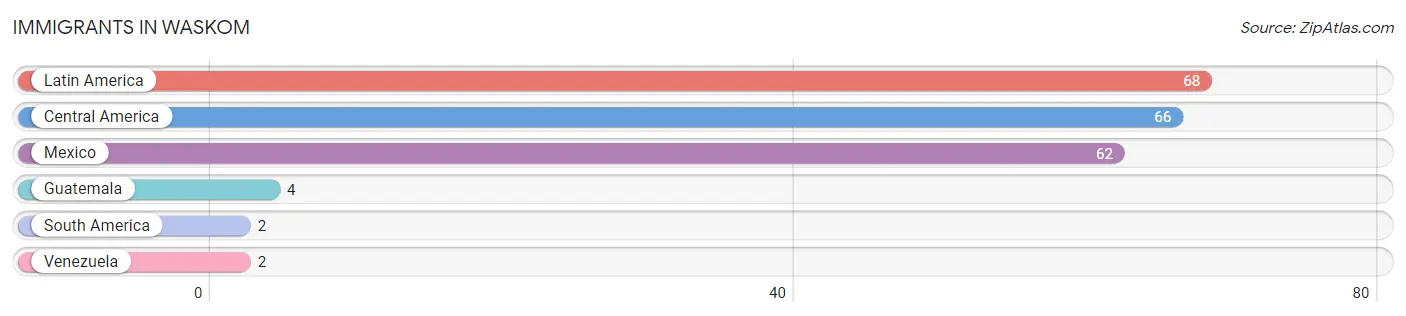
The most numerous immigrant groups reported in Waskom came from Latin America (68 | 4.0%), Central America (66 | 3.9%), Mexico (62 | 3.7%), Guatemala (4 | 0.2%), and South America (2 | 0.1%), together accounting for 12.0% of all Waskom residents.
| Immigration Origin | # Population | % Population |
| Central America | 66 | 3.9% |
| Guatemala | 4 | 0.2% |
| Latin America | 68 | 4.0% |
| Mexico | 62 | 3.7% |
| South America | 2 | 0.1% |
| Venezuela | 2 | 0.1% | View All 6 Rows |
Sex and Age in Waskom
Sex and Age in Waskom
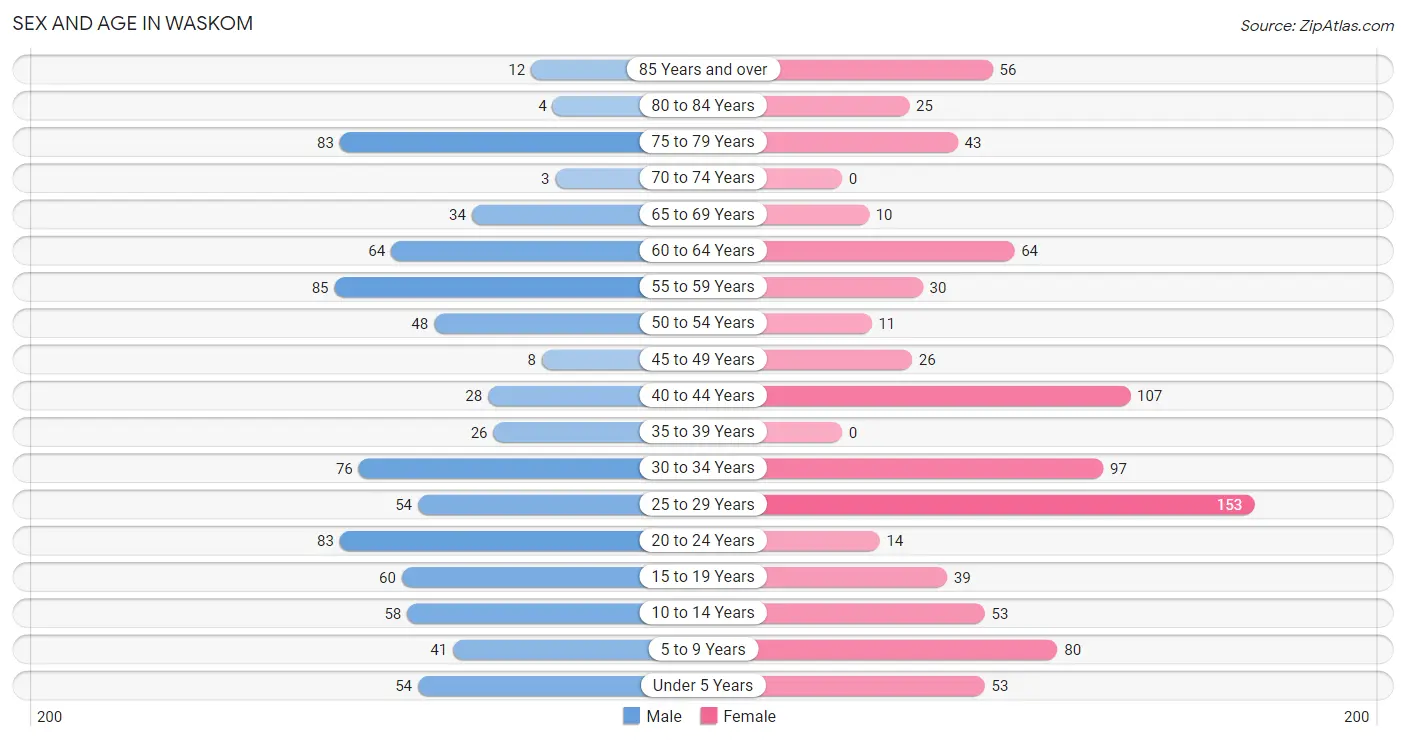
The most populous age groups in Waskom are 55 to 59 Years (85 | 10.3%) for men and 25 to 29 Years (153 | 17.8%) for women.
| Age Bracket | Male | Female |
| Under 5 Years | 54 (6.6%) | 53 (6.2%) |
| 5 to 9 Years | 41 (5.0%) | 80 (9.3%) |
| 10 to 14 Years | 58 (7.1%) | 53 (6.2%) |
| 15 to 19 Years | 60 (7.3%) | 39 (4.5%) |
| 20 to 24 Years | 83 (10.1%) | 14 (1.6%) |
| 25 to 29 Years | 54 (6.6%) | 153 (17.8%) |
| 30 to 34 Years | 76 (9.3%) | 97 (11.3%) |
| 35 to 39 Years | 26 (3.2%) | 0 (0.0%) |
| 40 to 44 Years | 28 (3.4%) | 107 (12.4%) |
| 45 to 49 Years | 8 (1.0%) | 26 (3.0%) |
| 50 to 54 Years | 48 (5.9%) | 11 (1.3%) |
| 55 to 59 Years | 85 (10.3%) | 30 (3.5%) |
| 60 to 64 Years | 64 (7.8%) | 64 (7.4%) |
| 65 to 69 Years | 34 (4.1%) | 10 (1.2%) |
| 70 to 74 Years | 3 (0.4%) | 0 (0.0%) |
| 75 to 79 Years | 83 (10.1%) | 43 (5.0%) |
| 80 to 84 Years | 4 (0.5%) | 25 (2.9%) |
| 85 Years and over | 12 (1.5%) | 56 (6.5%) |
| Total | 821 (100.0%) | 861 (100.0%) |
Families and Households in Waskom
Median Family Size in Waskom
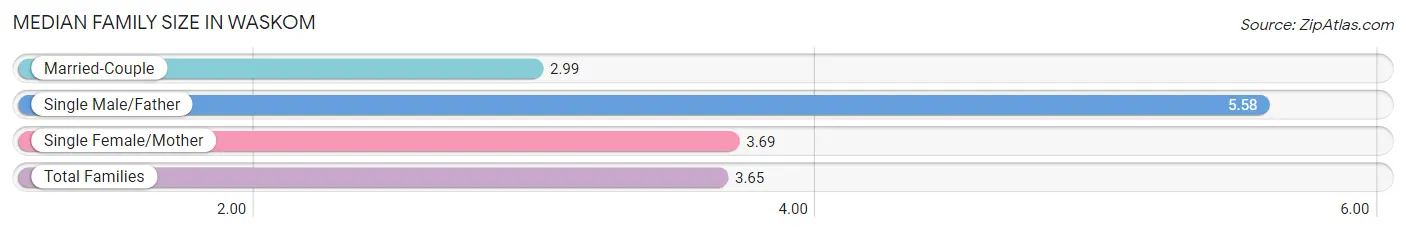
The median family size in Waskom is 3.65 persons per family, with single male/father families (67 | 17.1%) accounting for the largest median family size of 5.58 persons per family. On the other hand, married-couple families (203 | 51.9%) represent the smallest median family size with 2.99 persons per family.
| Family Type | # Families | Family Size |
| Married-Couple | 203 (51.9%) | 2.99 |
| Single Male/Father | 67 (17.1%) | 5.58 |
| Single Female/Mother | 121 (30.9%) | 3.69 |
| Total Families | 391 (100.0%) | 3.65 |
Median Household Size in Waskom
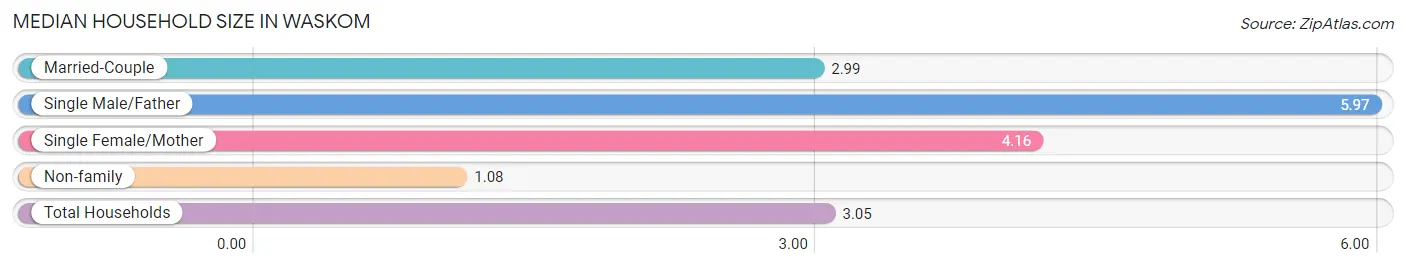
The median household size in Waskom is 3.05 persons per household, with single male/father households (67 | 12.2%) accounting for the largest median household size of 5.97 persons per household. non-family households (160 | 29.0%) represent the smallest median household size with 1.08 persons per household.
| Household Type | # Households | Household Size |
| Married-Couple | 203 (36.8%) | 2.99 |
| Single Male/Father | 67 (12.2%) | 5.97 |
| Single Female/Mother | 121 (22.0%) | 4.16 |
| Non-family | 160 (29.0%) | 1.08 |
| Total Households | 551 (100.0%) | 3.05 |
Household Size by Marriage Status in Waskom
Out of a total of 551 households in Waskom, 391 (71.0%) are family households, while 160 (29.0%) are nonfamily households. The most numerous type of family households are 2-person households, comprising 169, and the most common type of nonfamily households are 1-person households, comprising 148.
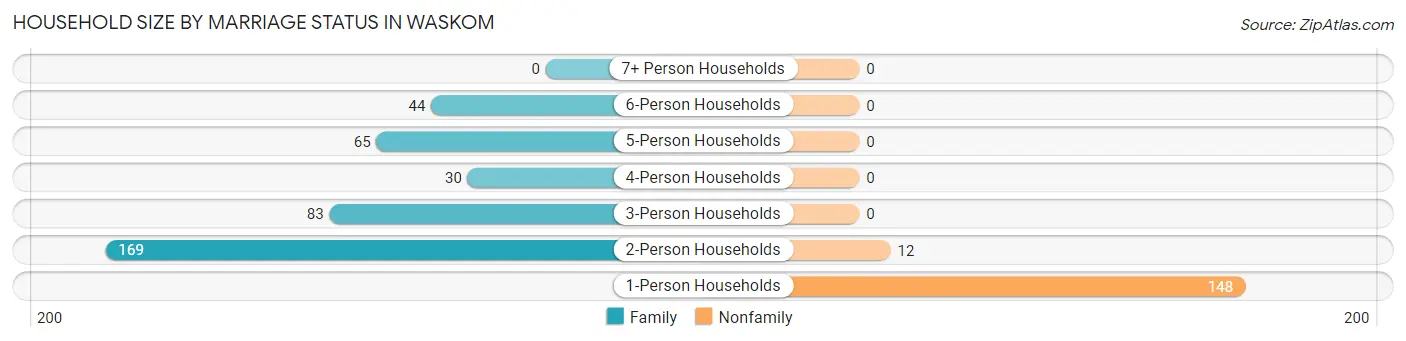
| Household Size | Family Households | Nonfamily Households |
| 1-Person Households | - | 148 (26.9%) |
| 2-Person Households | 169 (30.7%) | 12 (2.2%) |
| 3-Person Households | 83 (15.1%) | 0 (0.0%) |
| 4-Person Households | 30 (5.4%) | 0 (0.0%) |
| 5-Person Households | 65 (11.8%) | 0 (0.0%) |
| 6-Person Households | 44 (8.0%) | 0 (0.0%) |
| 7+ Person Households | 0 (0.0%) | 0 (0.0%) |
| Total | 391 (71.0%) | 160 (29.0%) |
Female Fertility in Waskom
Fertility by Age in Waskom
Average fertility rate in Waskom is 7.0 births per 1,000 women. Women in the age bracket of 20 to 34 years have the highest fertility rate with 11.0 births per 1,000 women. Women in the age bracket of 20 to 34 years acount for 100.0% of all women with births.
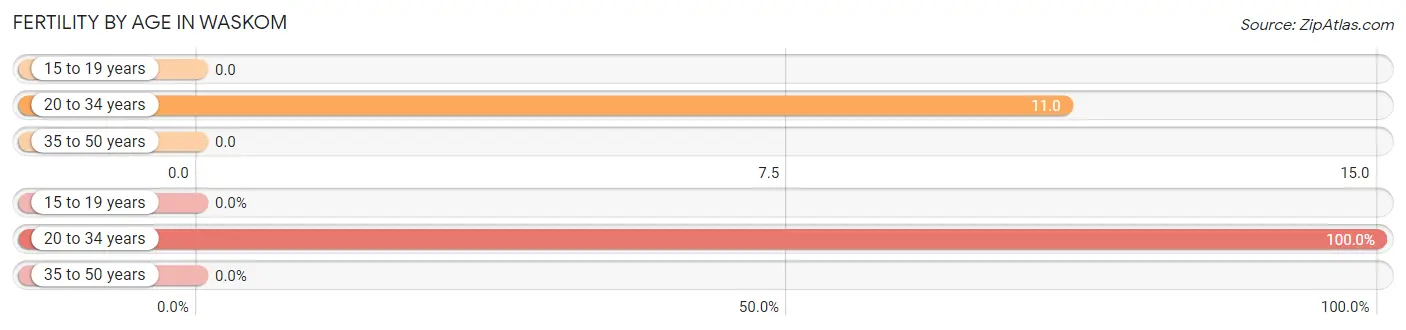
| Age Bracket | Women with Births | Births / 1,000 Women |
| 15 to 19 years | 0 (0.0%) | 0.0 |
| 20 to 34 years | 3 (100.0%) | 11.0 |
| 35 to 50 years | 0 (0.0%) | 0.0 |
| Total | 3 (100.0%) | 7.0 |
Fertility by Age by Marriage Status in Waskom
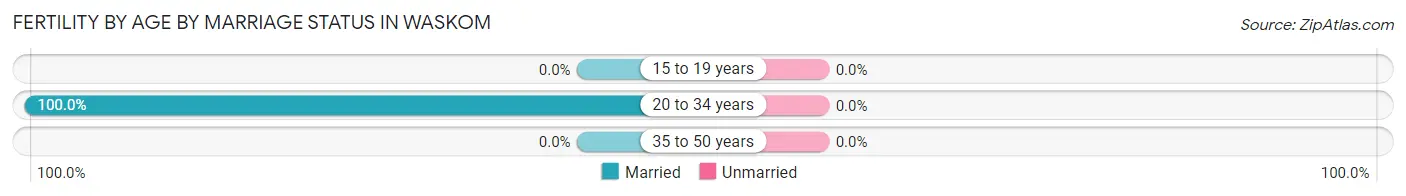
| Age Bracket | Married | Unmarried |
| 15 to 19 years | 0 (0.0%) | 0 (0.0%) |
| 20 to 34 years | 3 (100.0%) | 0 (0.0%) |
| 35 to 50 years | 0 (0.0%) | 0 (0.0%) |
| Total | 3 (100.0%) | 0 (0.0%) |
Fertility by Education in Waskom
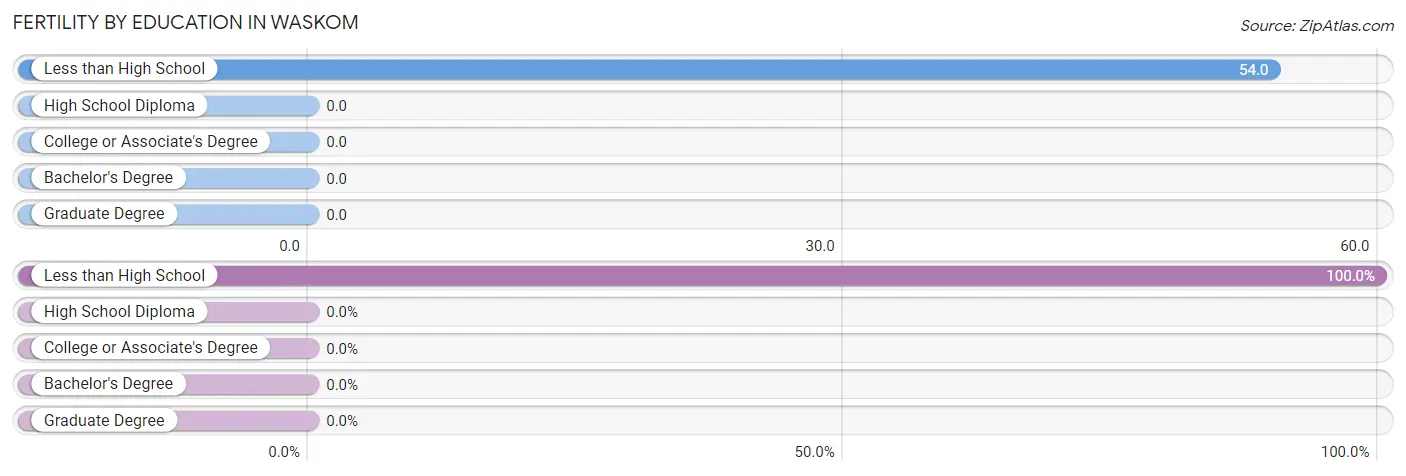
| Educational Attainment | Women with Births | Births / 1,000 Women |
| Less than High School | 3 (100.0%) | 54.0 |
| High School Diploma | 0 (0.0%) | 0.0 |
| College or Associate's Degree | 0 (0.0%) | 0.0 |
| Bachelor's Degree | 0 (0.0%) | 0.0 |
| Graduate Degree | 0 (0.0%) | 0.0 |
| Total | 3 (100.0%) | 7.0 |
Fertility by Education by Marriage Status in Waskom
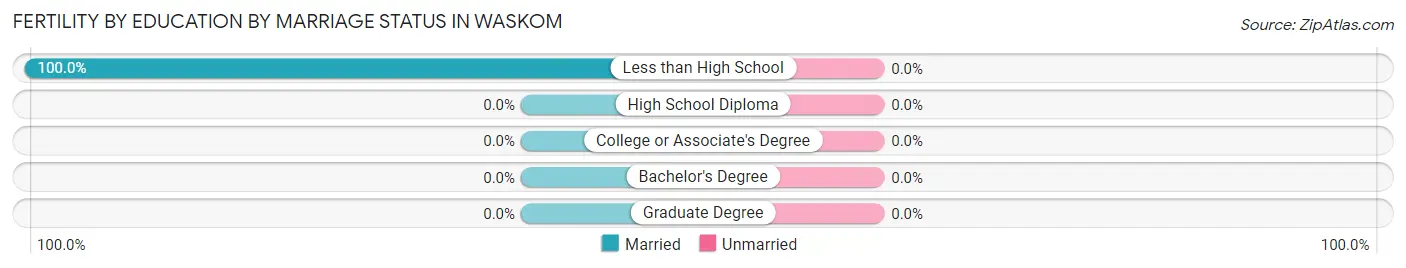
| Educational Attainment | Married | Unmarried |
| Less than High School | 3 (100.0%) | 0 (0.0%) |
| High School Diploma | 0 (0.0%) | 0 (0.0%) |
| College or Associate's Degree | 0 (0.0%) | 0 (0.0%) |
| Bachelor's Degree | 0 (0.0%) | 0 (0.0%) |
| Graduate Degree | 0 (0.0%) | 0 (0.0%) |
| Total | 3 (100.0%) | 0 (0.0%) |
Employment Characteristics in Waskom
Employment by Class of Employer in Waskom
Among the 649 employed individuals in Waskom, private company employees (518 | 79.8%), not-for-profit organizations (41 | 6.3%), and state government employees (36 | 5.6%) make up the most common classes of employment.
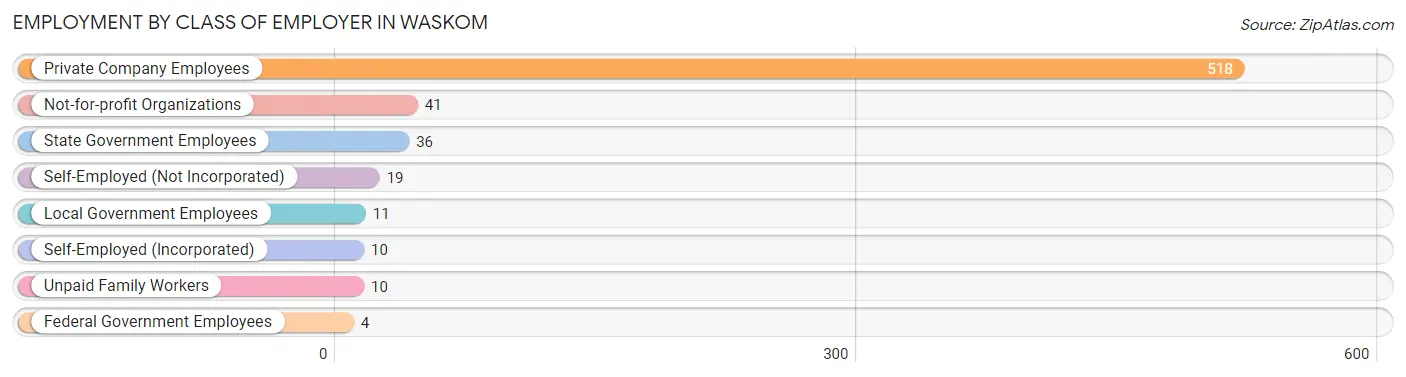
| Employer Class | # Employees | % Employees |
| Private Company Employees | 518 | 79.8% |
| Self-Employed (Incorporated) | 10 | 1.5% |
| Self-Employed (Not Incorporated) | 19 | 2.9% |
| Not-for-profit Organizations | 41 | 6.3% |
| Local Government Employees | 11 | 1.7% |
| State Government Employees | 36 | 5.6% |
| Federal Government Employees | 4 | 0.6% |
| Unpaid Family Workers | 10 | 1.5% |
| Total | 649 | 100.0% |
Employment Status by Age in Waskom
According to the labor force statistics for Waskom, out of the total population over 16 years of age (1,314), 52.5% or 690 individuals are in the labor force, with 5.4% or 37 of them unemployed. The age group with the highest labor force participation rate is 20 to 24 years, with 93.8% or 91 individuals in the labor force. Within the labor force, the 30 to 34 years age range has the highest percentage of unemployed individuals, with 23.9% or 37 of them being unemployed.
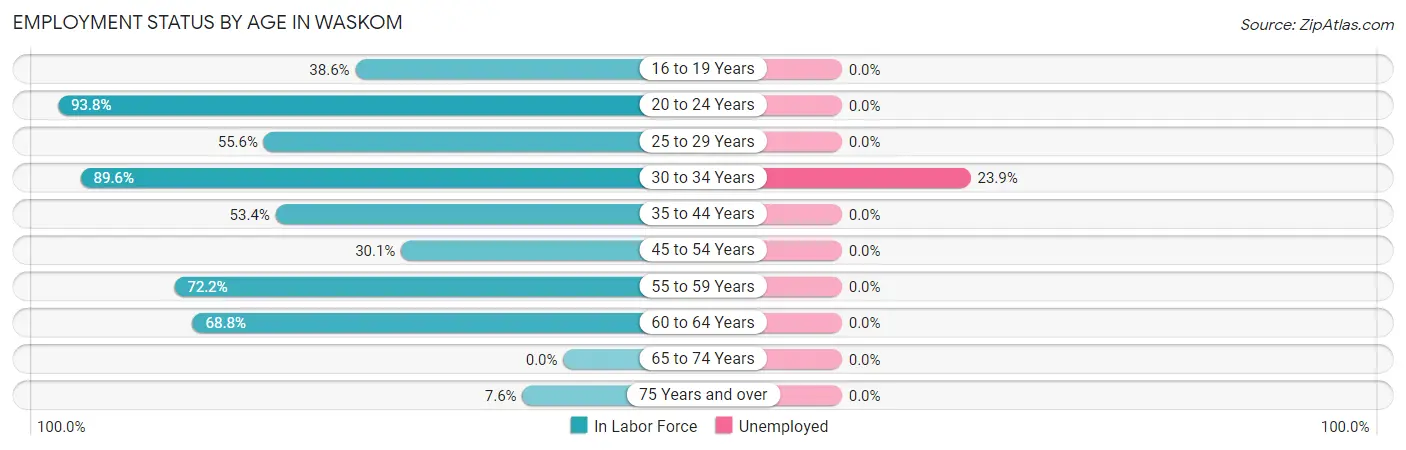
| Age Bracket | In Labor Force | Unemployed |
| 16 to 19 Years | 27 (38.6%) | 0 (0.0%) |
| 20 to 24 Years | 91 (93.8%) | 0 (0.0%) |
| 25 to 29 Years | 115 (55.6%) | 0 (0.0%) |
| 30 to 34 Years | 155 (89.6%) | 37 (23.9%) |
| 35 to 44 Years | 86 (53.4%) | 0 (0.0%) |
| 45 to 54 Years | 28 (30.1%) | 0 (0.0%) |
| 55 to 59 Years | 83 (72.2%) | 0 (0.0%) |
| 60 to 64 Years | 88 (68.8%) | 0 (0.0%) |
| 65 to 74 Years | 0 (0.0%) | 0 (0.0%) |
| 75 Years and over | 17 (7.6%) | 0 (0.0%) |
| Total | 690 (52.5%) | 37 (5.4%) |
Employment Status by Educational Attainment in Waskom
According to labor force statistics for Waskom, 63.3% of individuals (555) out of the total population between 25 and 64 years of age (877) are in the labor force, with 6.7% or 37 of them being unemployed. The group with the highest labor force participation rate are those with the educational attainment of bachelor's degree or higher, with 78.7% or 48 individuals in the labor force. Within the labor force, individuals with college / associate degree education have the highest percentage of unemployment, with 16.2% or 37 of them being unemployed.
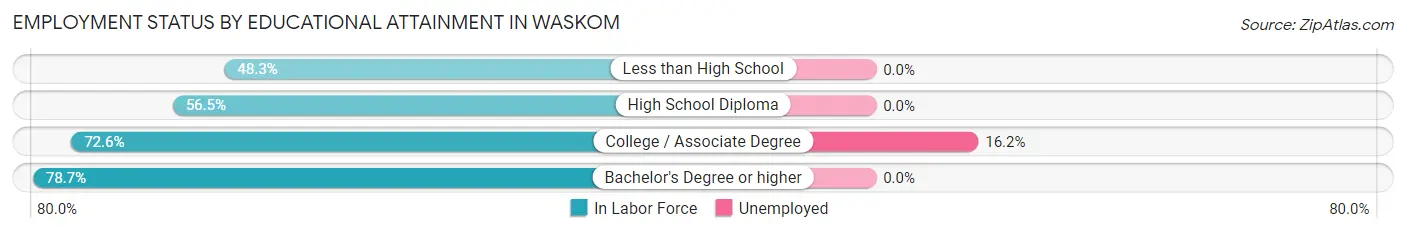
| Educational Attainment | In Labor Force | Unemployed |
| Less than High School | 28 (48.3%) | 0 (0.0%) |
| High School Diploma | 251 (56.5%) | 0 (0.0%) |
| College / Associate Degree | 228 (72.6%) | 51 (16.2%) |
| Bachelor's Degree or higher | 48 (78.7%) | 0 (0.0%) |
| Total | 555 (63.3%) | 59 (6.7%) |
Employment Occupations by Sex in Waskom
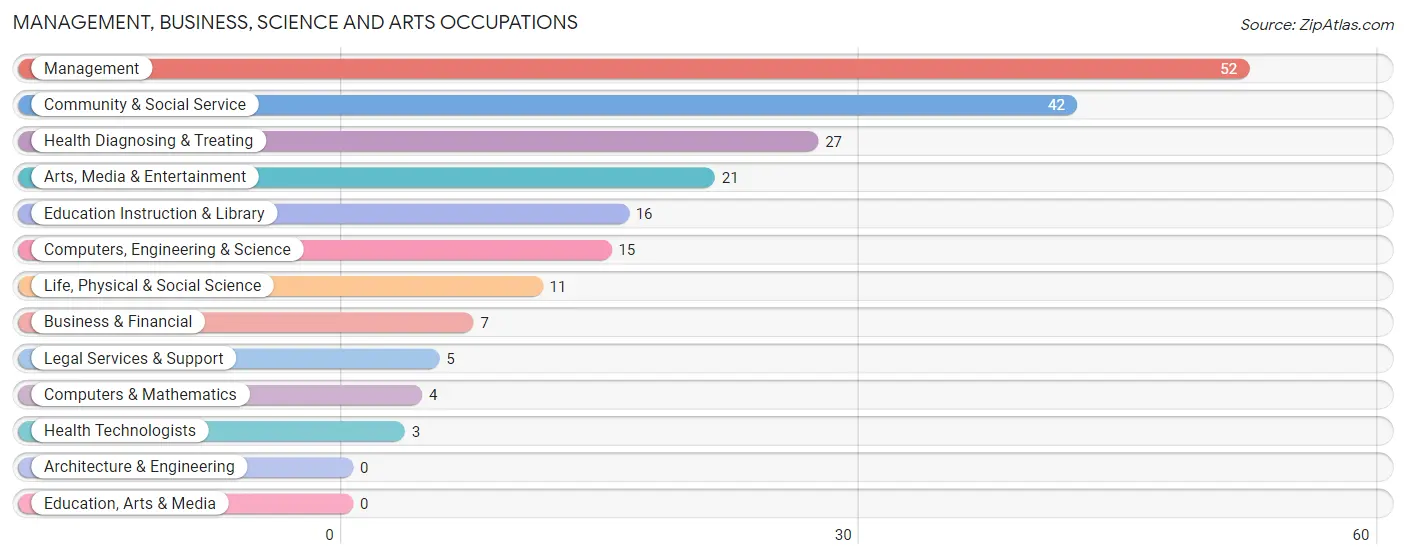
Management, Business, Science and Arts Occupations
The most common Management, Business, Science and Arts occupations in Waskom are Management (52 | 8.0%), Community & Social Service (42 | 6.4%), Health Diagnosing & Treating (27 | 4.1%), Arts, Media & Entertainment (21 | 3.2%), and Education Instruction & Library (16 | 2.5%).
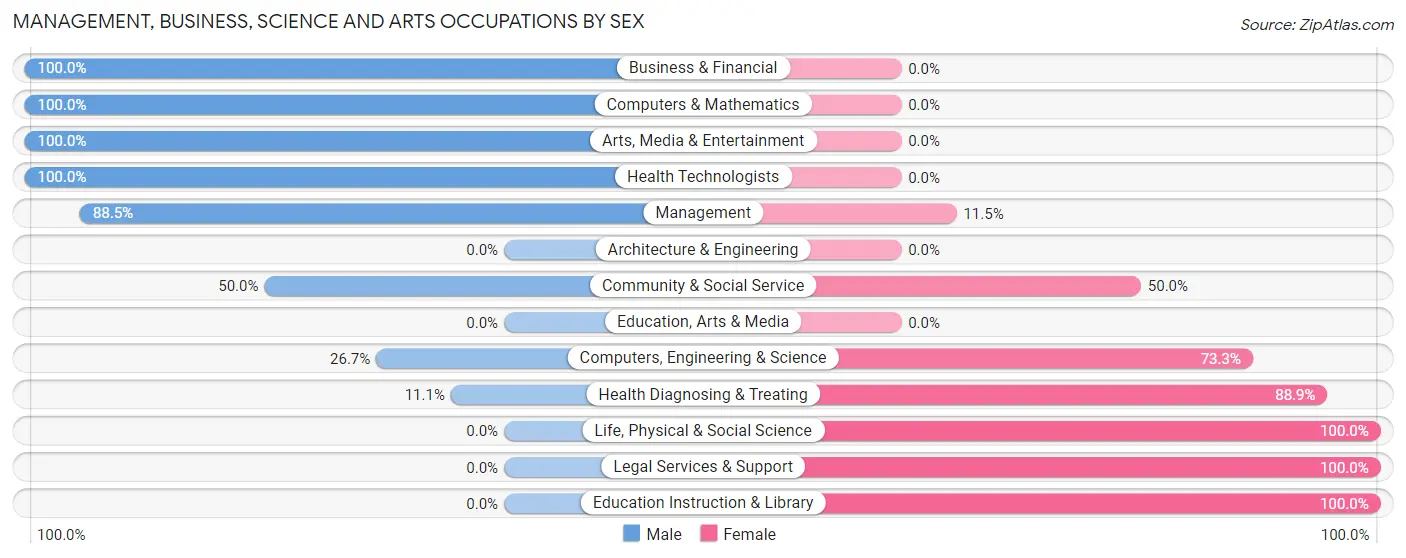
Management, Business, Science and Arts Occupations by Sex
Within the Management, Business, Science and Arts occupations in Waskom, the most male-oriented occupations are Business & Financial (100.0%), Computers & Mathematics (100.0%), and Arts, Media & Entertainment (100.0%), while the most female-oriented occupations are Life, Physical & Social Science (100.0%), Legal Services & Support (100.0%), and Education Instruction & Library (100.0%).
| Occupation | Male | Female |
| Management | 46 (88.5%) | 6 (11.5%) |
| Business & Financial | 7 (100.0%) | 0 (0.0%) |
| Computers, Engineering & Science | 4 (26.7%) | 11 (73.3%) |
| Computers & Mathematics | 4 (100.0%) | 0 (0.0%) |
| Architecture & Engineering | 0 (0.0%) | 0 (0.0%) |
| Life, Physical & Social Science | 0 (0.0%) | 11 (100.0%) |
| Community & Social Service | 21 (50.0%) | 21 (50.0%) |
| Education, Arts & Media | 0 (0.0%) | 0 (0.0%) |
| Legal Services & Support | 0 (0.0%) | 5 (100.0%) |
| Education Instruction & Library | 0 (0.0%) | 16 (100.0%) |
| Arts, Media & Entertainment | 21 (100.0%) | 0 (0.0%) |
| Health Diagnosing & Treating | 3 (11.1%) | 24 (88.9%) |
| Health Technologists | 3 (100.0%) | 0 (0.0%) |
| Total (Category) | 81 (56.6%) | 62 (43.4%) |
| Total (Overall) | 388 (59.4%) | 265 (40.6%) |
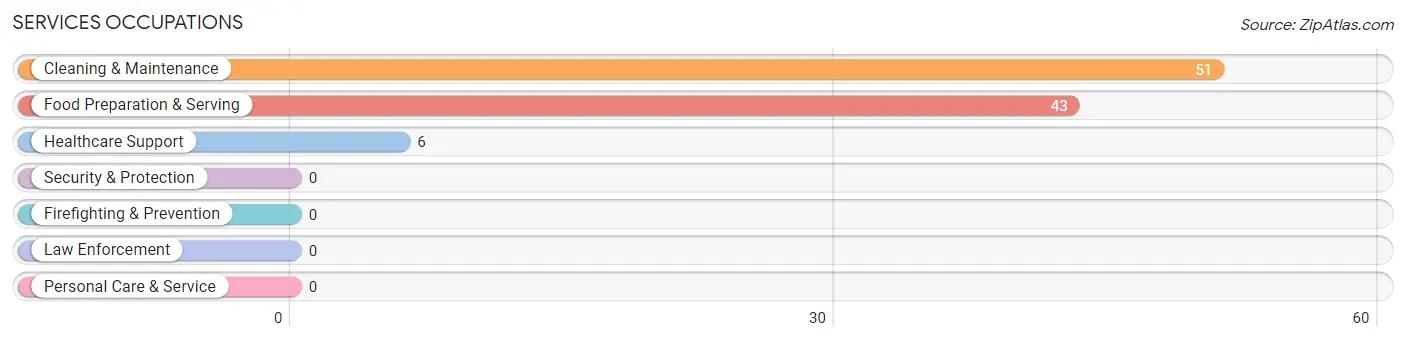
Services Occupations
The most common Services occupations in Waskom are Cleaning & Maintenance (51 | 7.8%), Food Preparation & Serving (43 | 6.6%), and Healthcare Support (6 | 0.9%).
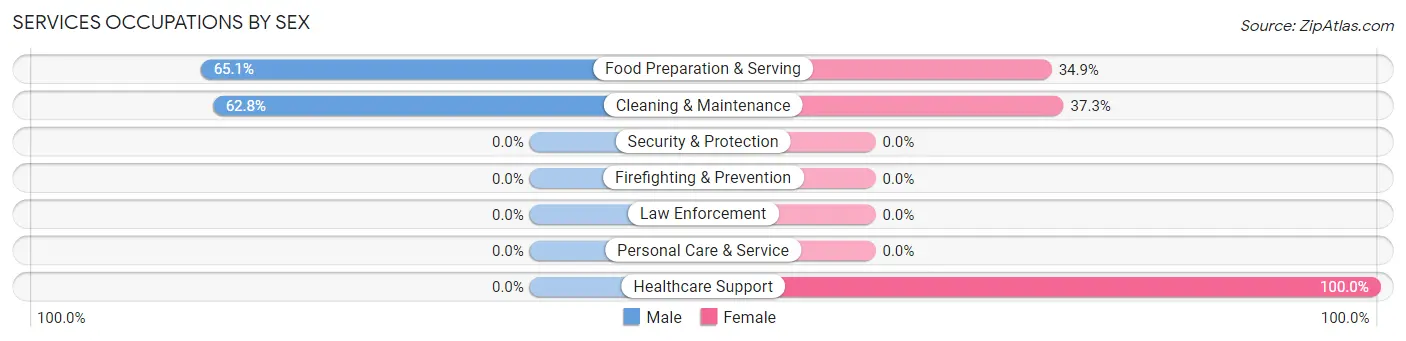
Services Occupations by Sex
Within the Services occupations in Waskom, the most male-oriented occupations are Food Preparation & Serving (65.1%), and Cleaning & Maintenance (62.7%), while the most female-oriented occupations are Healthcare Support (100.0%), Cleaning & Maintenance (37.2%), and Food Preparation & Serving (34.9%).
| Occupation | Male | Female |
| Healthcare Support | 0 (0.0%) | 6 (100.0%) |
| Security & Protection | 0 (0.0%) | 0 (0.0%) |
| Firefighting & Prevention | 0 (0.0%) | 0 (0.0%) |
| Law Enforcement | 0 (0.0%) | 0 (0.0%) |
| Food Preparation & Serving | 28 (65.1%) | 15 (34.9%) |
| Cleaning & Maintenance | 32 (62.7%) | 19 (37.2%) |
| Personal Care & Service | 0 (0.0%) | 0 (0.0%) |
| Total (Category) | 60 (60.0%) | 40 (40.0%) |
| Total (Overall) | 388 (59.4%) | 265 (40.6%) |
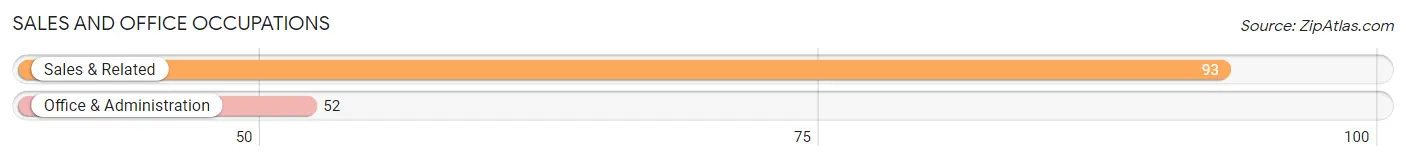
Sales and Office Occupations
The most common Sales and Office occupations in Waskom are Sales & Related (93 | 14.2%), and Office & Administration (52 | 8.0%).
Sales and Office Occupations by Sex
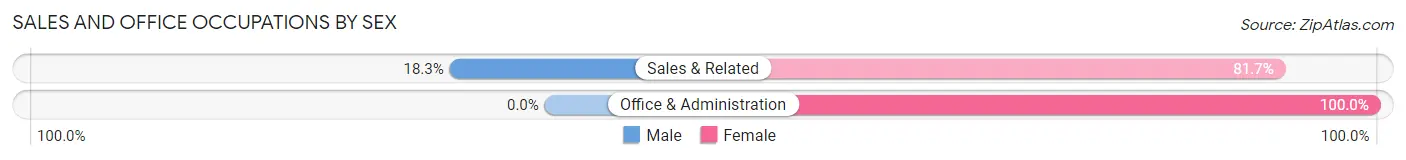
| Occupation | Male | Female |
| Sales & Related | 17 (18.3%) | 76 (81.7%) |
| Office & Administration | 0 (0.0%) | 52 (100.0%) |
| Total (Category) | 17 (11.7%) | 128 (88.3%) |
| Total (Overall) | 388 (59.4%) | 265 (40.6%) |
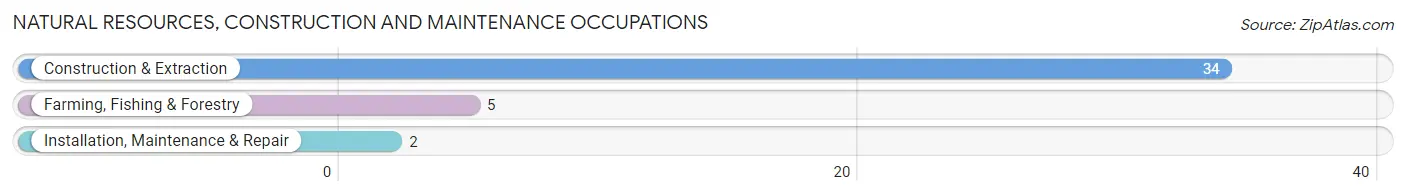
Natural Resources, Construction and Maintenance Occupations
The most common Natural Resources, Construction and Maintenance occupations in Waskom are Construction & Extraction (34 | 5.2%), Farming, Fishing & Forestry (5 | 0.8%), and Installation, Maintenance & Repair (2 | 0.3%).
Natural Resources, Construction and Maintenance Occupations by Sex
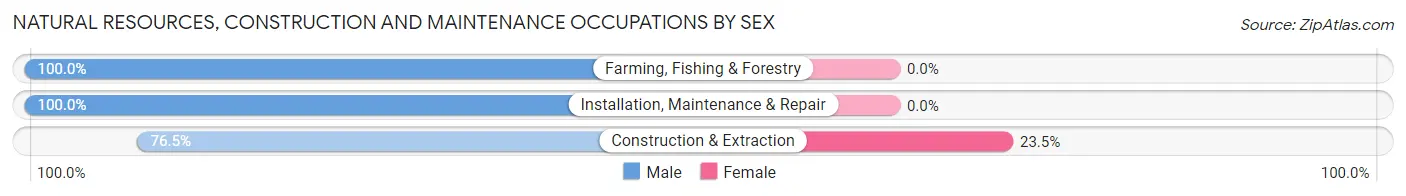
| Occupation | Male | Female |
| Farming, Fishing & Forestry | 5 (100.0%) | 0 (0.0%) |
| Construction & Extraction | 26 (76.5%) | 8 (23.5%) |
| Installation, Maintenance & Repair | 2 (100.0%) | 0 (0.0%) |
| Total (Category) | 33 (80.5%) | 8 (19.5%) |
| Total (Overall) | 388 (59.4%) | 265 (40.6%) |
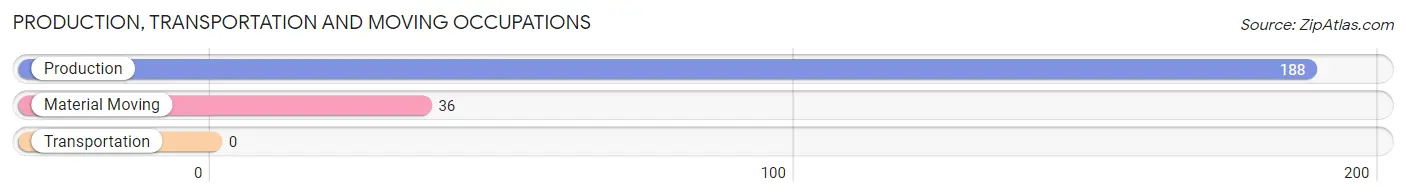
Production, Transportation and Moving Occupations
The most common Production, Transportation and Moving occupations in Waskom are Production (188 | 28.8%), and Material Moving (36 | 5.5%).
Production, Transportation and Moving Occupations by Sex
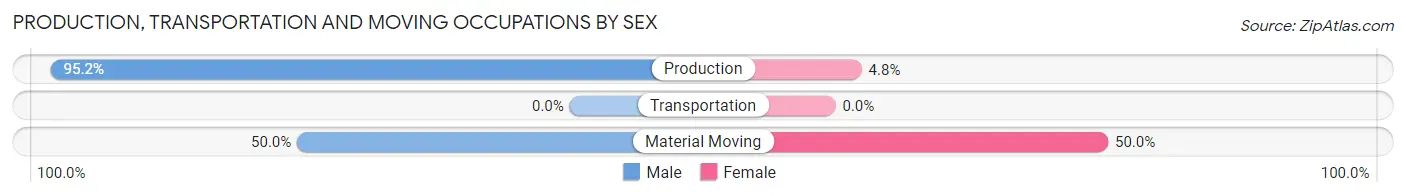
| Occupation | Male | Female |
| Production | 179 (95.2%) | 9 (4.8%) |
| Transportation | 0 (0.0%) | 0 (0.0%) |
| Material Moving | 18 (50.0%) | 18 (50.0%) |
| Total (Category) | 197 (87.9%) | 27 (12.0%) |
| Total (Overall) | 388 (59.4%) | 265 (40.6%) |
Employment Industries by Sex in Waskom
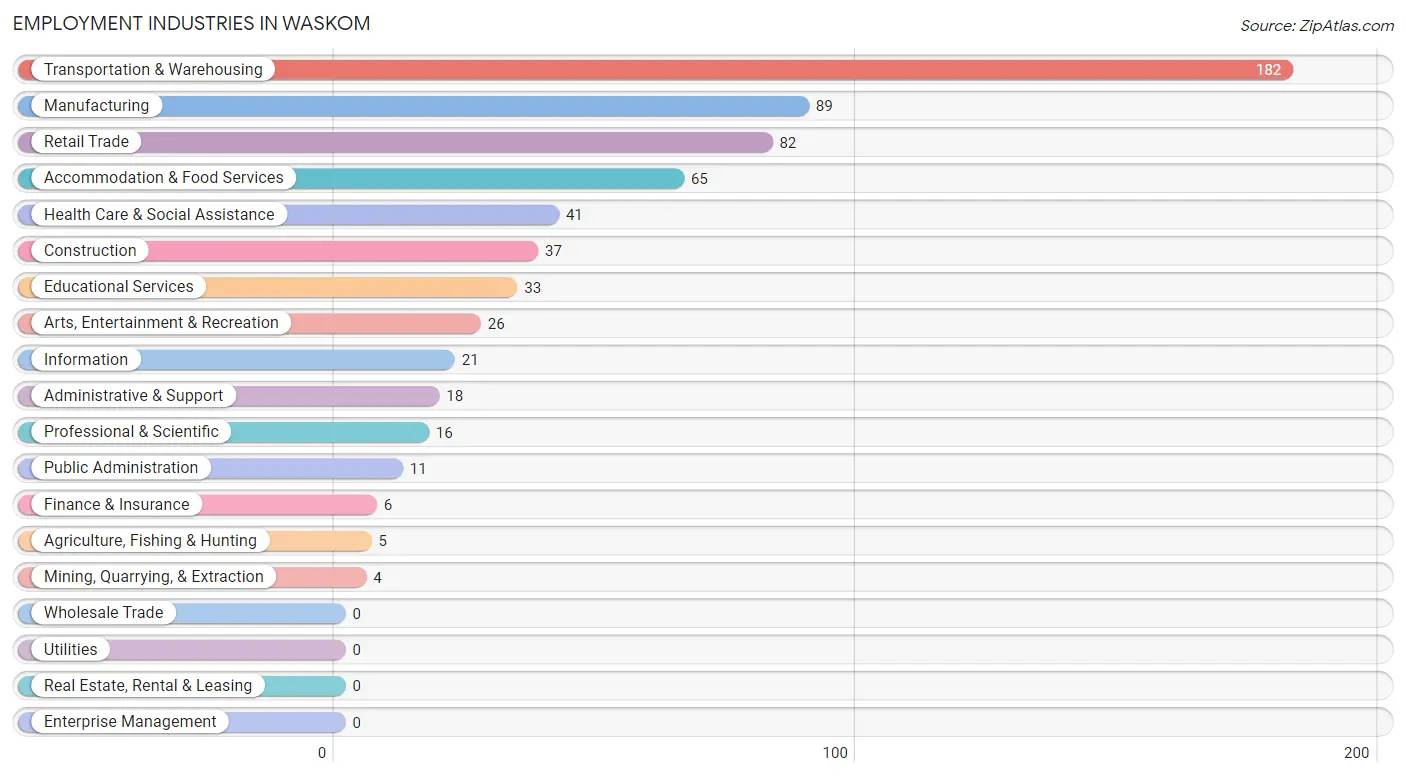
Employment Industries in Waskom
The major employment industries in Waskom include Transportation & Warehousing (182 | 27.9%), Manufacturing (89 | 13.6%), Retail Trade (82 | 12.6%), Accommodation & Food Services (65 | 10.0%), and Health Care & Social Assistance (41 | 6.3%).
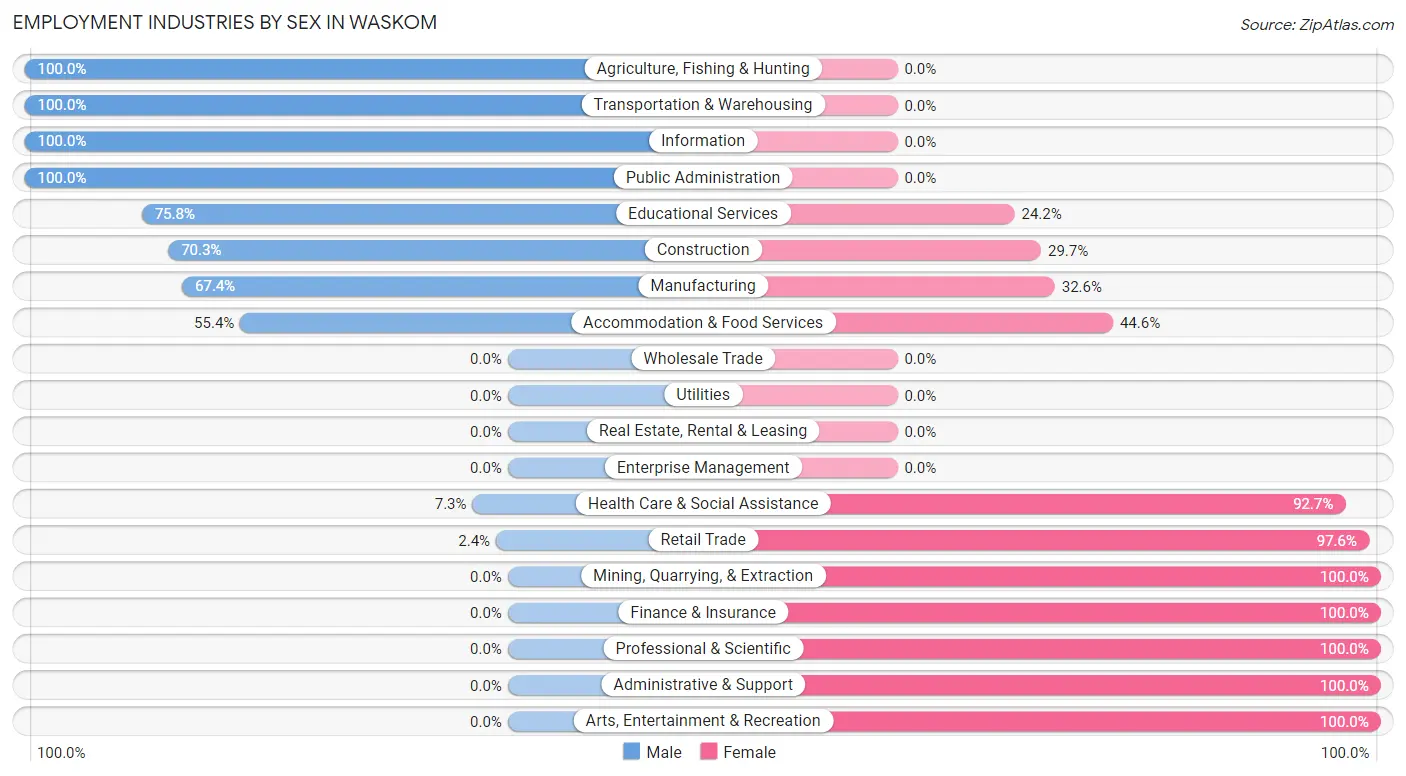
Employment Industries by Sex in Waskom
The Waskom industries that see more men than women are Agriculture, Fishing & Hunting (100.0%), Transportation & Warehousing (100.0%), and Information (100.0%), whereas the industries that tend to have a higher number of women are Mining, Quarrying, & Extraction (100.0%), Finance & Insurance (100.0%), and Professional & Scientific (100.0%).
| Industry | Male | Female |
| Agriculture, Fishing & Hunting | 5 (100.0%) | 0 (0.0%) |
| Mining, Quarrying, & Extraction | 0 (0.0%) | 4 (100.0%) |
| Construction | 26 (70.3%) | 11 (29.7%) |
| Manufacturing | 60 (67.4%) | 29 (32.6%) |
| Wholesale Trade | 0 (0.0%) | 0 (0.0%) |
| Retail Trade | 2 (2.4%) | 80 (97.6%) |
| Transportation & Warehousing | 182 (100.0%) | 0 (0.0%) |
| Utilities | 0 (0.0%) | 0 (0.0%) |
| Information | 21 (100.0%) | 0 (0.0%) |
| Finance & Insurance | 0 (0.0%) | 6 (100.0%) |
| Real Estate, Rental & Leasing | 0 (0.0%) | 0 (0.0%) |
| Professional & Scientific | 0 (0.0%) | 16 (100.0%) |
| Enterprise Management | 0 (0.0%) | 0 (0.0%) |
| Administrative & Support | 0 (0.0%) | 18 (100.0%) |
| Educational Services | 25 (75.8%) | 8 (24.2%) |
| Health Care & Social Assistance | 3 (7.3%) | 38 (92.7%) |
| Arts, Entertainment & Recreation | 0 (0.0%) | 26 (100.0%) |
| Accommodation & Food Services | 36 (55.4%) | 29 (44.6%) |
| Public Administration | 11 (100.0%) | 0 (0.0%) |
| Total | 388 (59.4%) | 265 (40.6%) |
Education in Waskom
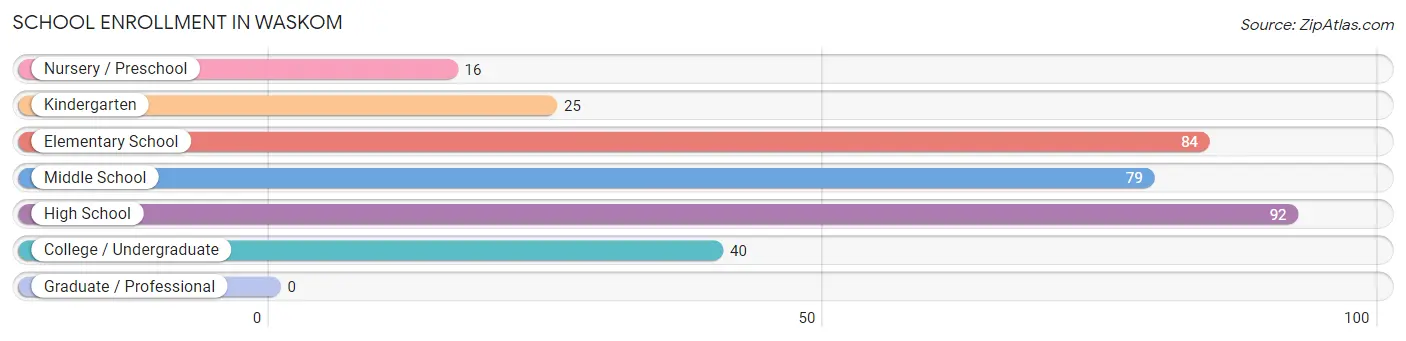
School Enrollment in Waskom
The most common levels of schooling among the 336 students in Waskom are high school (92 | 27.4%), elementary school (84 | 25.0%), and middle school (79 | 23.5%).
| School Level | # Students | % Students |
| Nursery / Preschool | 16 | 4.8% |
| Kindergarten | 25 | 7.4% |
| Elementary School | 84 | 25.0% |
| Middle School | 79 | 23.5% |
| High School | 92 | 27.4% |
| College / Undergraduate | 40 | 11.9% |
| Graduate / Professional | 0 | 0.0% |
| Total | 336 | 100.0% |
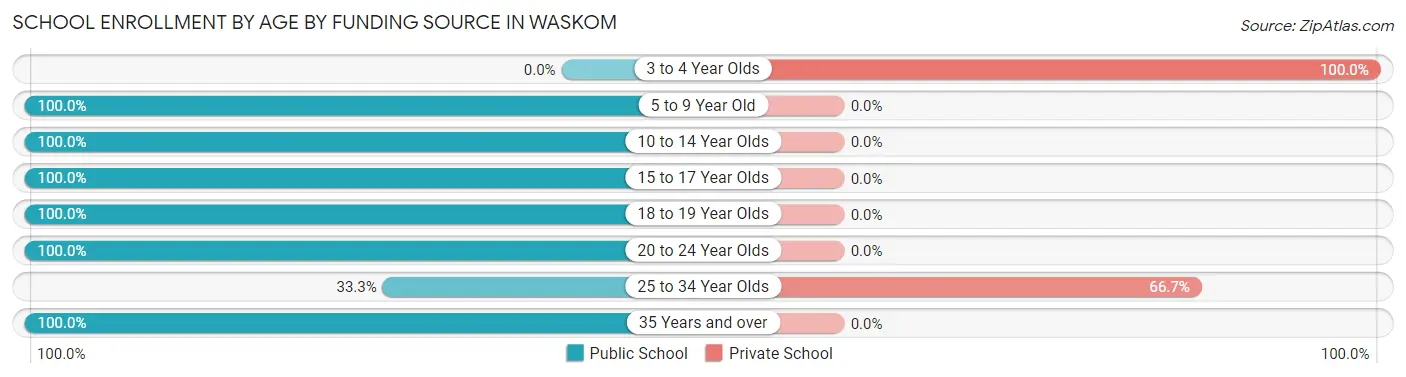
School Enrollment by Age by Funding Source in Waskom
Out of a total of 336 students who are enrolled in schools in Waskom, 22 (6.5%) attend a private institution, while the remaining 314 (93.5%) are enrolled in public schools. The age group of 3 to 4 year olds has the highest likelihood of being enrolled in private schools, with 16 (100.0% in the age bracket) enrolled. Conversely, the age group of 5 to 9 year old has the lowest likelihood of being enrolled in a private school, with 95 (100.0% in the age bracket) attending a public institution.
| Age Bracket | Public School | Private School |
| 3 to 4 Year Olds | 0 (0.0%) | 16 (100.0%) |
| 5 to 9 Year Old | 95 (100.0%) | 0 (0.0%) |
| 10 to 14 Year Olds | 111 (100.0%) | 0 (0.0%) |
| 15 to 17 Year Olds | 66 (100.0%) | 0 (0.0%) |
| 18 to 19 Year Olds | 13 (100.0%) | 0 (0.0%) |
| 20 to 24 Year Olds | 18 (100.0%) | 0 (0.0%) |
| 25 to 34 Year Olds | 3 (33.3%) | 6 (66.7%) |
| 35 Years and over | 8 (100.0%) | 0 (0.0%) |
| Total | 314 (93.5%) | 22 (6.5%) |
Educational Attainment by Field of Study in Waskom
Education (38 | 42.2%), computers & mathematics (21 | 23.3%), business (14 | 15.6%), arts & humanities (13 | 14.4%), and visual & performing arts (4 | 4.4%) are the most common fields of study among 90 individuals in Waskom who have obtained a bachelor's degree or higher.
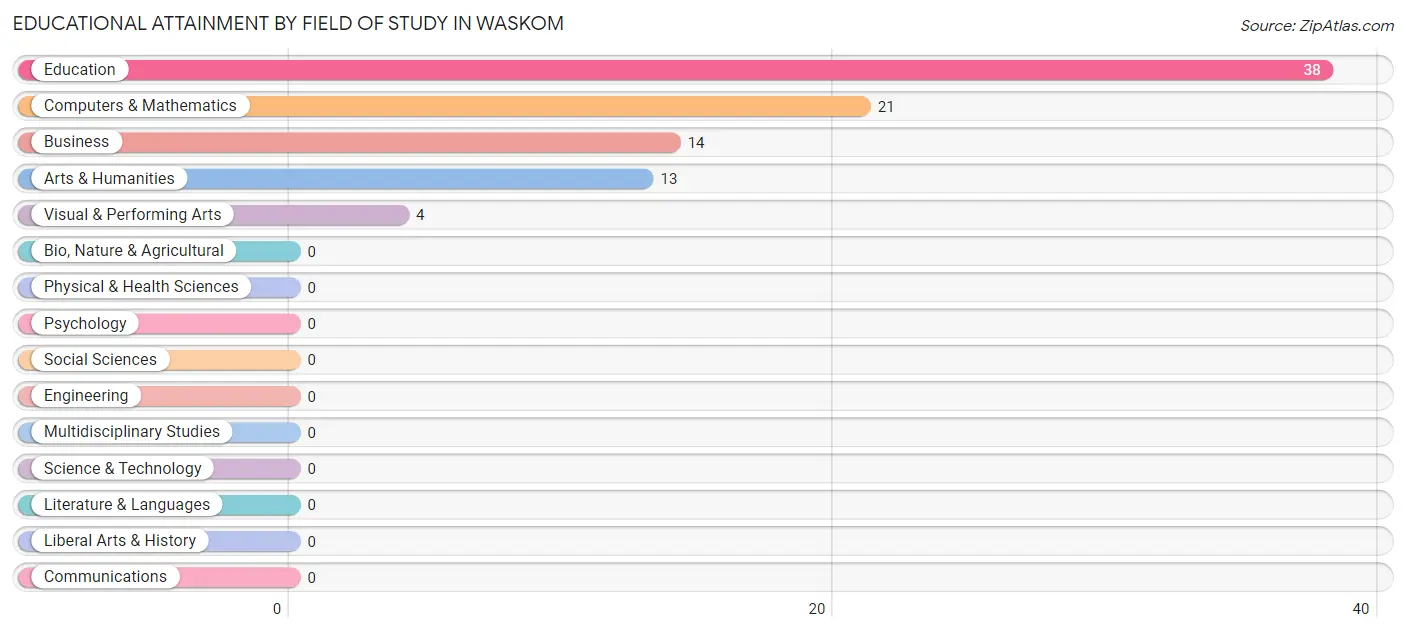
| Field of Study | # Graduates | % Graduates |
| Computers & Mathematics | 21 | 23.3% |
| Bio, Nature & Agricultural | 0 | 0.0% |
| Physical & Health Sciences | 0 | 0.0% |
| Psychology | 0 | 0.0% |
| Social Sciences | 0 | 0.0% |
| Engineering | 0 | 0.0% |
| Multidisciplinary Studies | 0 | 0.0% |
| Science & Technology | 0 | 0.0% |
| Business | 14 | 15.6% |
| Education | 38 | 42.2% |
| Literature & Languages | 0 | 0.0% |
| Liberal Arts & History | 0 | 0.0% |
| Visual & Performing Arts | 4 | 4.4% |
| Communications | 0 | 0.0% |
| Arts & Humanities | 13 | 14.4% |
| Total | 90 | 100.0% |
Transportation & Commute in Waskom
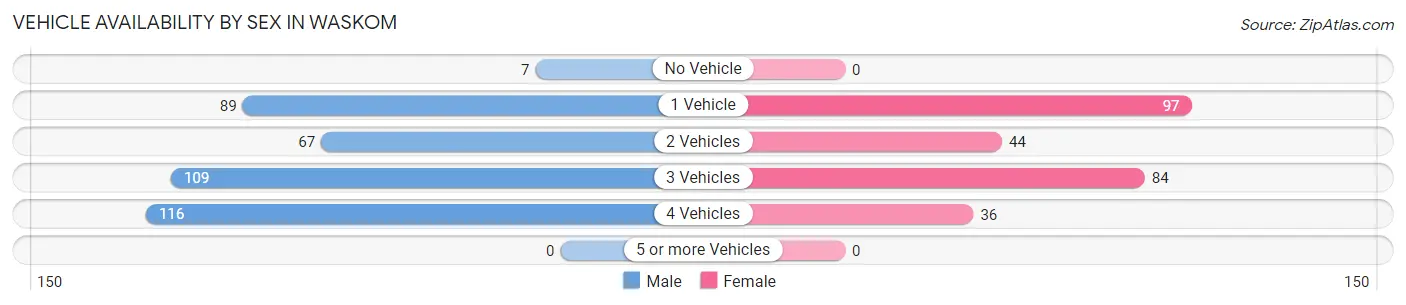
Vehicle Availability by Sex in Waskom
The most prevalent vehicle ownership categories in Waskom are males with 4 vehicles (116, accounting for 29.9%) and females with 4 vehicles (36, making up 44.4%).
| Vehicles Available | Male | Female |
| No Vehicle | 7 (1.8%) | 0 (0.0%) |
| 1 Vehicle | 89 (22.9%) | 97 (37.2%) |
| 2 Vehicles | 67 (17.3%) | 44 (16.9%) |
| 3 Vehicles | 109 (28.1%) | 84 (32.2%) |
| 4 Vehicles | 116 (29.9%) | 36 (13.8%) |
| 5 or more Vehicles | 0 (0.0%) | 0 (0.0%) |
| Total | 388 (100.0%) | 261 (100.0%) |
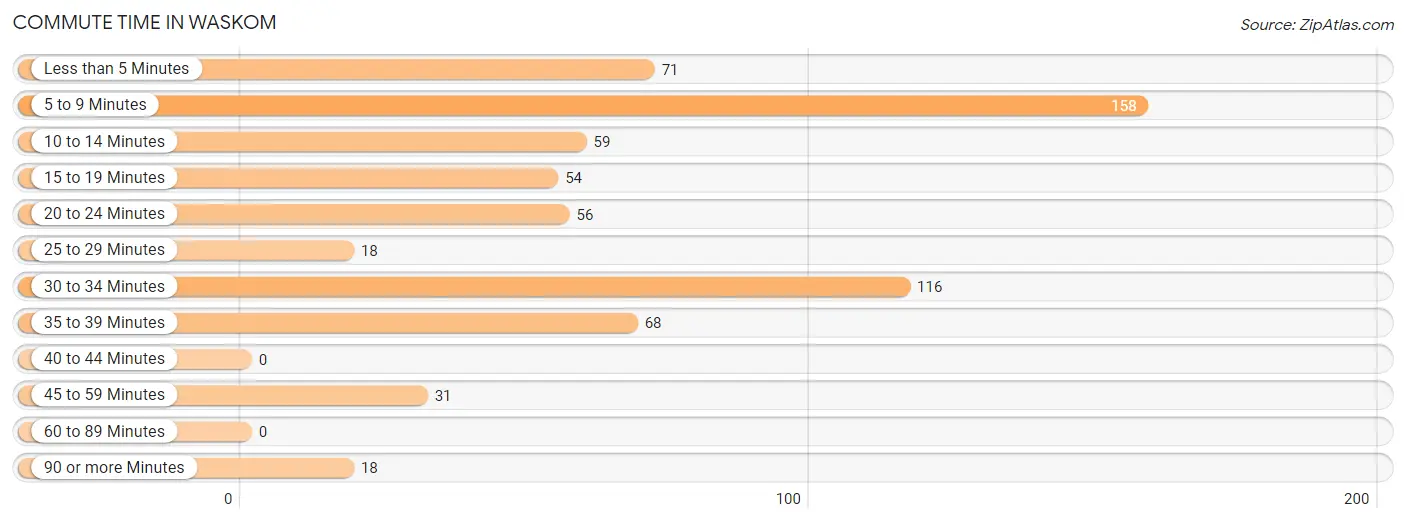
Commute Time in Waskom
The most frequently occuring commute durations in Waskom are 5 to 9 minutes (158 commuters, 24.3%), 30 to 34 minutes (116 commuters, 17.9%), and less than 5 minutes (71 commuters, 10.9%).
| Commute Time | # Commuters | % Commuters |
| Less than 5 Minutes | 71 | 10.9% |
| 5 to 9 Minutes | 158 | 24.3% |
| 10 to 14 Minutes | 59 | 9.1% |
| 15 to 19 Minutes | 54 | 8.3% |
| 20 to 24 Minutes | 56 | 8.6% |
| 25 to 29 Minutes | 18 | 2.8% |
| 30 to 34 Minutes | 116 | 17.9% |
| 35 to 39 Minutes | 68 | 10.5% |
| 40 to 44 Minutes | 0 | 0.0% |
| 45 to 59 Minutes | 31 | 4.8% |
| 60 to 89 Minutes | 0 | 0.0% |
| 90 or more Minutes | 18 | 2.8% |
Commute Time by Sex in Waskom
The most common commute times in Waskom are 5 to 9 minutes (117 commuters, 30.1%) for males and 35 to 39 minutes (68 commuters, 26.1%) for females.
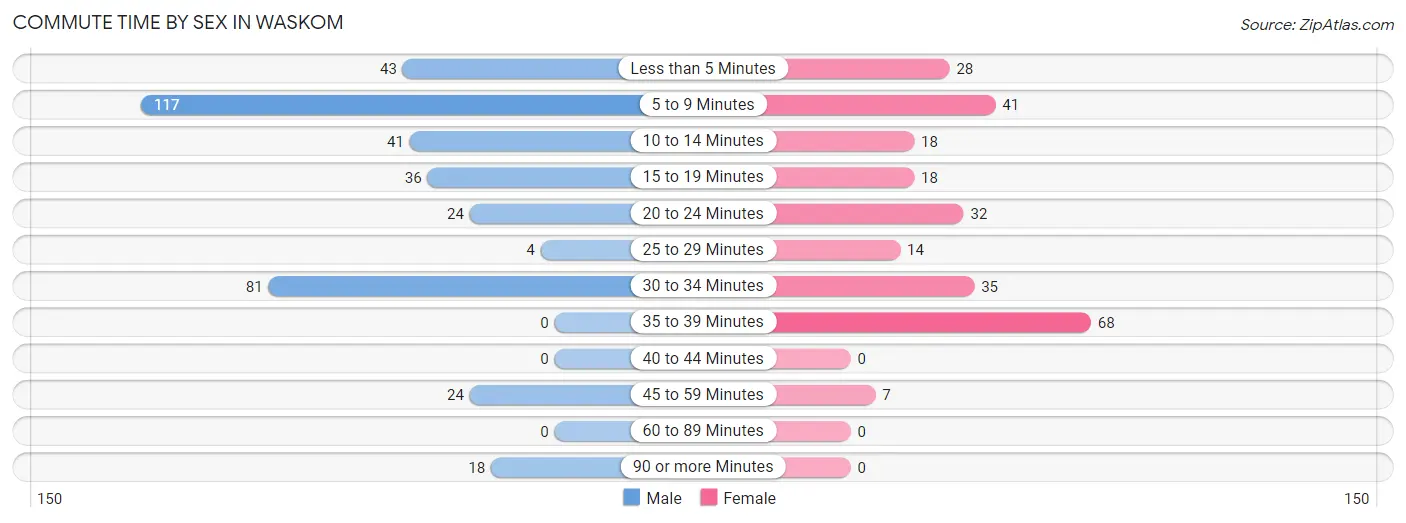
| Commute Time | Male | Female |
| Less than 5 Minutes | 43 (11.1%) | 28 (10.7%) |
| 5 to 9 Minutes | 117 (30.1%) | 41 (15.7%) |
| 10 to 14 Minutes | 41 (10.6%) | 18 (6.9%) |
| 15 to 19 Minutes | 36 (9.3%) | 18 (6.9%) |
| 20 to 24 Minutes | 24 (6.2%) | 32 (12.3%) |
| 25 to 29 Minutes | 4 (1.0%) | 14 (5.4%) |
| 30 to 34 Minutes | 81 (20.9%) | 35 (13.4%) |
| 35 to 39 Minutes | 0 (0.0%) | 68 (26.1%) |
| 40 to 44 Minutes | 0 (0.0%) | 0 (0.0%) |
| 45 to 59 Minutes | 24 (6.2%) | 7 (2.7%) |
| 60 to 89 Minutes | 0 (0.0%) | 0 (0.0%) |
| 90 or more Minutes | 18 (4.6%) | 0 (0.0%) |
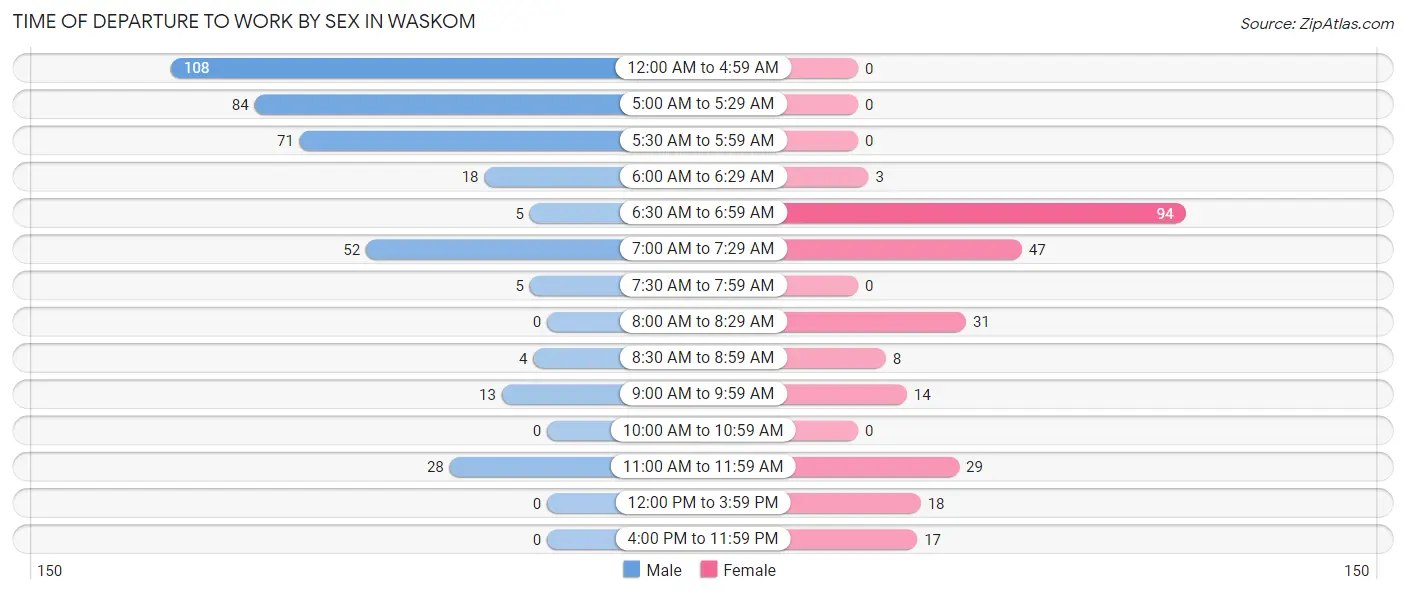
Time of Departure to Work by Sex in Waskom
The most frequent times of departure to work in Waskom are 12:00 AM to 4:59 AM (108, 27.8%) for males and 6:30 AM to 6:59 AM (94, 36.0%) for females.
| Time of Departure | Male | Female |
| 12:00 AM to 4:59 AM | 108 (27.8%) | 0 (0.0%) |
| 5:00 AM to 5:29 AM | 84 (21.6%) | 0 (0.0%) |
| 5:30 AM to 5:59 AM | 71 (18.3%) | 0 (0.0%) |
| 6:00 AM to 6:29 AM | 18 (4.6%) | 3 (1.1%) |
| 6:30 AM to 6:59 AM | 5 (1.3%) | 94 (36.0%) |
| 7:00 AM to 7:29 AM | 52 (13.4%) | 47 (18.0%) |
| 7:30 AM to 7:59 AM | 5 (1.3%) | 0 (0.0%) |
| 8:00 AM to 8:29 AM | 0 (0.0%) | 31 (11.9%) |
| 8:30 AM to 8:59 AM | 4 (1.0%) | 8 (3.1%) |
| 9:00 AM to 9:59 AM | 13 (3.4%) | 14 (5.4%) |
| 10:00 AM to 10:59 AM | 0 (0.0%) | 0 (0.0%) |
| 11:00 AM to 11:59 AM | 28 (7.2%) | 29 (11.1%) |
| 12:00 PM to 3:59 PM | 0 (0.0%) | 18 (6.9%) |
| 4:00 PM to 11:59 PM | 0 (0.0%) | 17 (6.5%) |
| Total | 388 (100.0%) | 261 (100.0%) |
Housing Occupancy in Waskom
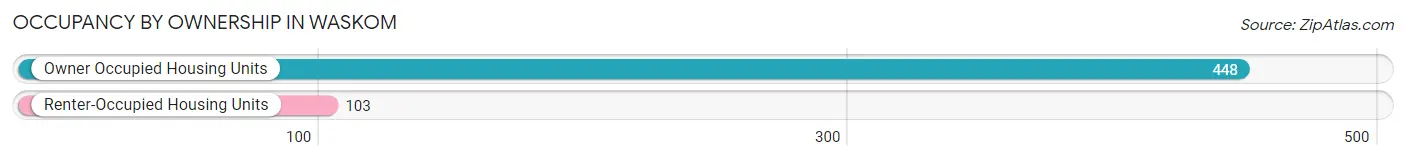
Occupancy by Ownership in Waskom
Of the total 551 dwellings in Waskom, owner-occupied units account for 448 (81.3%), while renter-occupied units make up 103 (18.7%).
| Occupancy | # Housing Units | % Housing Units |
| Owner Occupied Housing Units | 448 | 81.3% |
| Renter-Occupied Housing Units | 103 | 18.7% |
| Total Occupied Housing Units | 551 | 100.0% |
Occupancy by Household Size in Waskom
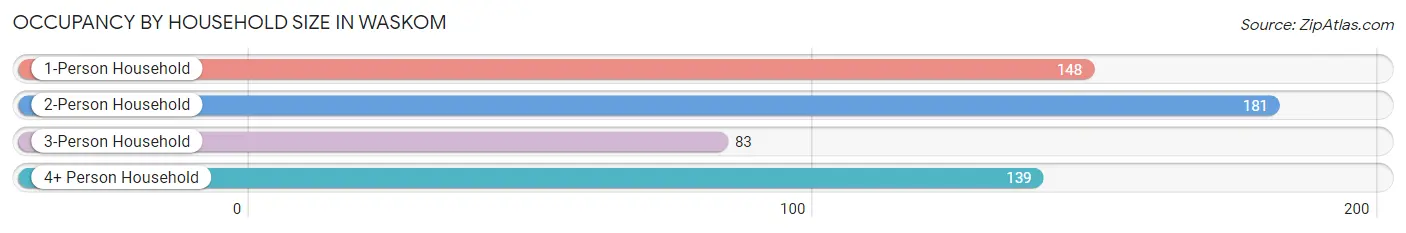
| Household Size | # Housing Units | % Housing Units |
| 1-Person Household | 148 | 26.9% |
| 2-Person Household | 181 | 32.9% |
| 3-Person Household | 83 | 15.1% |
| 4+ Person Household | 139 | 25.2% |
| Total Housing Units | 551 | 100.0% |
Occupancy by Ownership by Household Size in Waskom
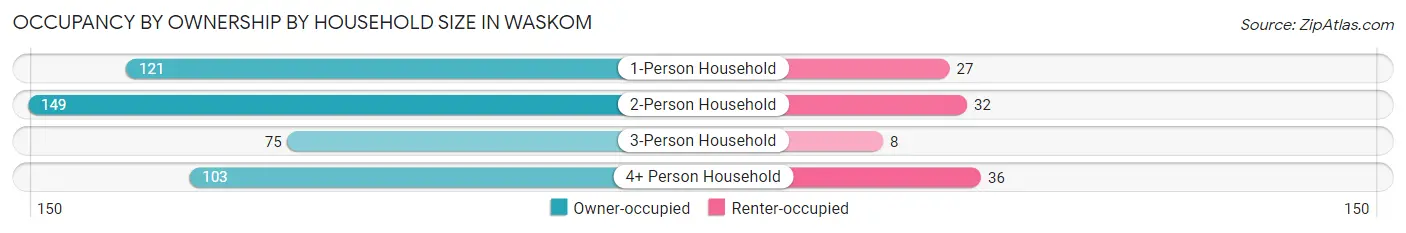
| Household Size | Owner-occupied | Renter-occupied |
| 1-Person Household | 121 (81.8%) | 27 (18.2%) |
| 2-Person Household | 149 (82.3%) | 32 (17.7%) |
| 3-Person Household | 75 (90.4%) | 8 (9.6%) |
| 4+ Person Household | 103 (74.1%) | 36 (25.9%) |
| Total Housing Units | 448 (81.3%) | 103 (18.7%) |
Occupancy by Educational Attainment in Waskom
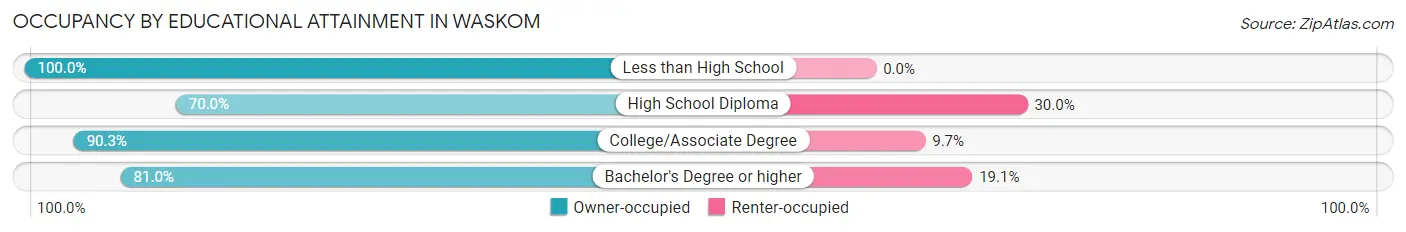
| Household Size | Owner-occupied | Renter-occupied |
| Less than High School | 96 (100.0%) | 0 (0.0%) |
| High School Diploma | 196 (70.0%) | 84 (30.0%) |
| College/Associate Degree | 139 (90.3%) | 15 (9.7%) |
| Bachelor's Degree or higher | 17 (80.9%) | 4 (19.1%) |
Occupancy by Age of Householder in Waskom
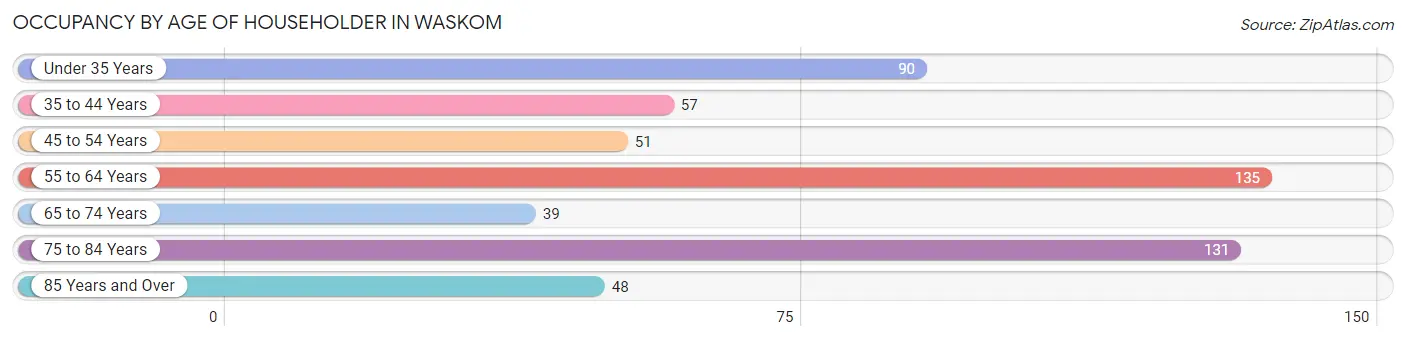
| Age Bracket | # Households | % Households |
| Under 35 Years | 90 | 16.3% |
| 35 to 44 Years | 57 | 10.3% |
| 45 to 54 Years | 51 | 9.3% |
| 55 to 64 Years | 135 | 24.5% |
| 65 to 74 Years | 39 | 7.1% |
| 75 to 84 Years | 131 | 23.8% |
| 85 Years and Over | 48 | 8.7% |
| Total | 551 | 100.0% |
Housing Finances in Waskom
Median Income by Occupancy in Waskom
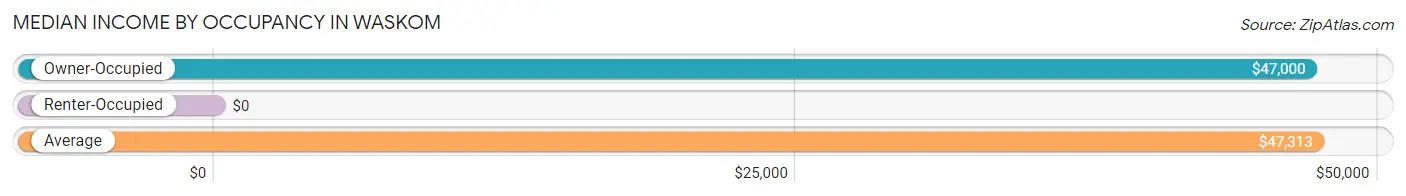
| Occupancy Type | # Households | Median Income |
| Owner-Occupied | 448 (81.3%) | $47,000 |
| Renter-Occupied | 103 (18.7%) | $0 |
| Average | 551 (100.0%) | $47,313 |
Occupancy by Householder Income Bracket in Waskom
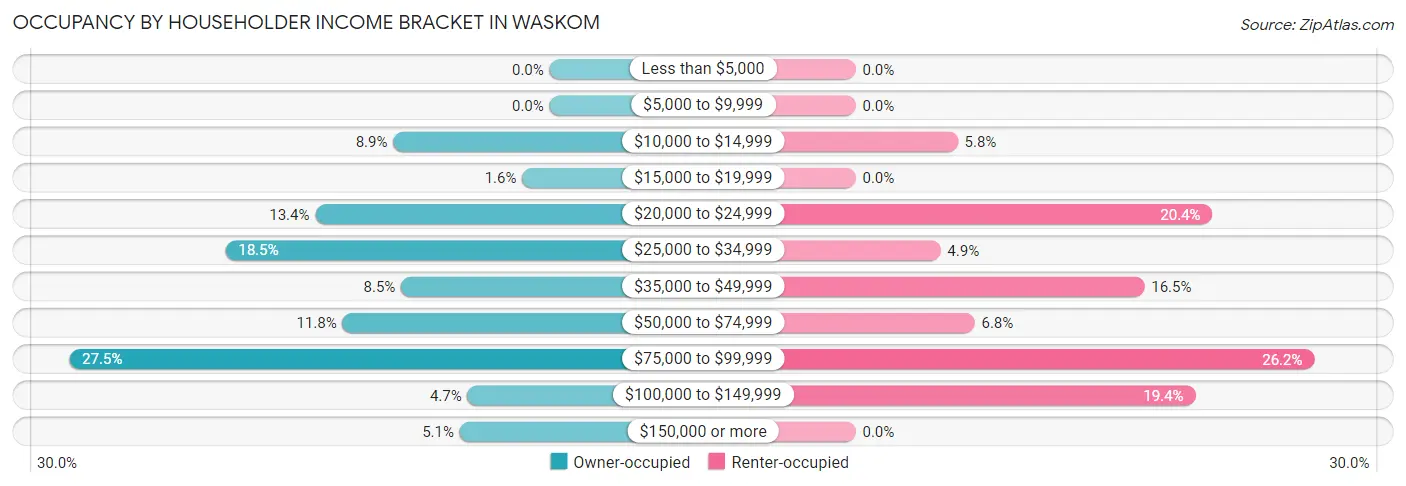
| Income Bracket | Owner-occupied | Renter-occupied |
| Less than $5,000 | 0 (0.0%) | 0 (0.0%) |
| $5,000 to $9,999 | 0 (0.0%) | 0 (0.0%) |
| $10,000 to $14,999 | 40 (8.9%) | 6 (5.8%) |
| $15,000 to $19,999 | 7 (1.6%) | 0 (0.0%) |
| $20,000 to $24,999 | 60 (13.4%) | 21 (20.4%) |
| $25,000 to $34,999 | 83 (18.5%) | 5 (4.9%) |
| $35,000 to $49,999 | 38 (8.5%) | 17 (16.5%) |
| $50,000 to $74,999 | 53 (11.8%) | 7 (6.8%) |
| $75,000 to $99,999 | 123 (27.5%) | 27 (26.2%) |
| $100,000 to $149,999 | 21 (4.7%) | 20 (19.4%) |
| $150,000 or more | 23 (5.1%) | 0 (0.0%) |
| Total | 448 (100.0%) | 103 (100.0%) |
Monthly Housing Cost Tiers in Waskom
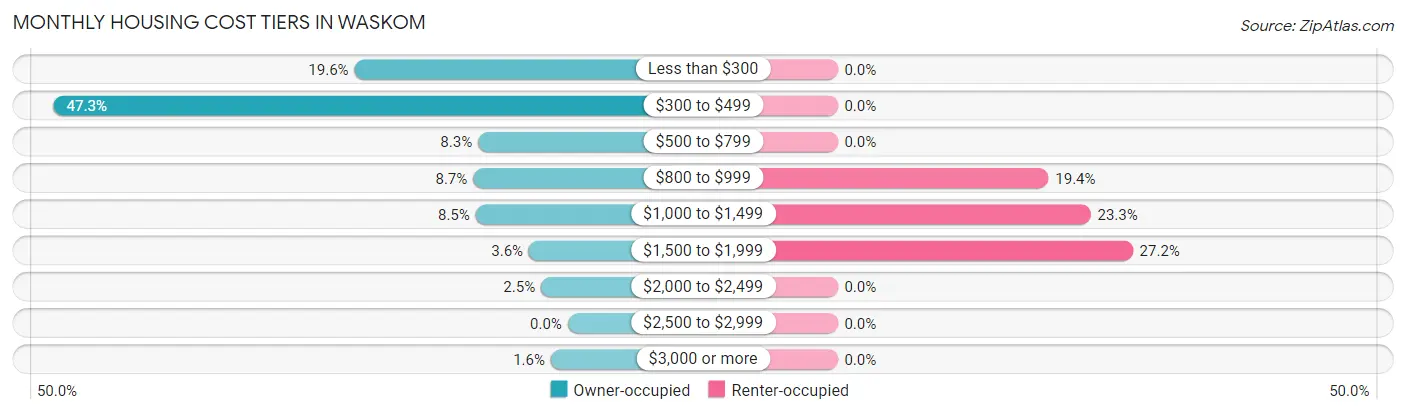
| Monthly Cost | Owner-occupied | Renter-occupied |
| Less than $300 | 88 (19.6%) | 0 (0.0%) |
| $300 to $499 | 212 (47.3%) | 0 (0.0%) |
| $500 to $799 | 37 (8.3%) | 0 (0.0%) |
| $800 to $999 | 39 (8.7%) | 20 (19.4%) |
| $1,000 to $1,499 | 38 (8.5%) | 24 (23.3%) |
| $1,500 to $1,999 | 16 (3.6%) | 28 (27.2%) |
| $2,000 to $2,499 | 11 (2.5%) | 0 (0.0%) |
| $2,500 to $2,999 | 0 (0.0%) | 0 (0.0%) |
| $3,000 or more | 7 (1.6%) | 0 (0.0%) |
| Total | 448 (100.0%) | 103 (100.0%) |
Physical Housing Characteristics in Waskom
Housing Structures in Waskom
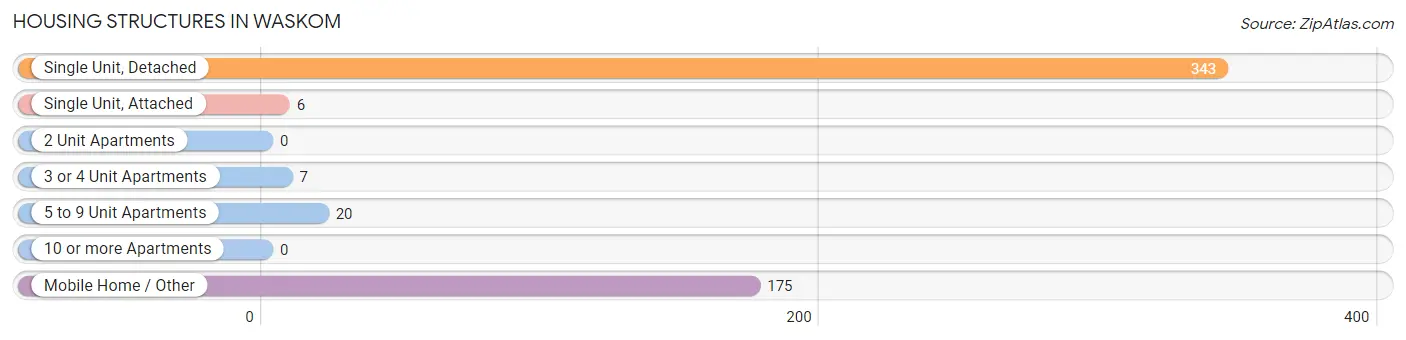
| Structure Type | # Housing Units | % Housing Units |
| Single Unit, Detached | 343 | 62.3% |
| Single Unit, Attached | 6 | 1.1% |
| 2 Unit Apartments | 0 | 0.0% |
| 3 or 4 Unit Apartments | 7 | 1.3% |
| 5 to 9 Unit Apartments | 20 | 3.6% |
| 10 or more Apartments | 0 | 0.0% |
| Mobile Home / Other | 175 | 31.8% |
| Total | 551 | 100.0% |
Housing Structures by Occupancy in Waskom
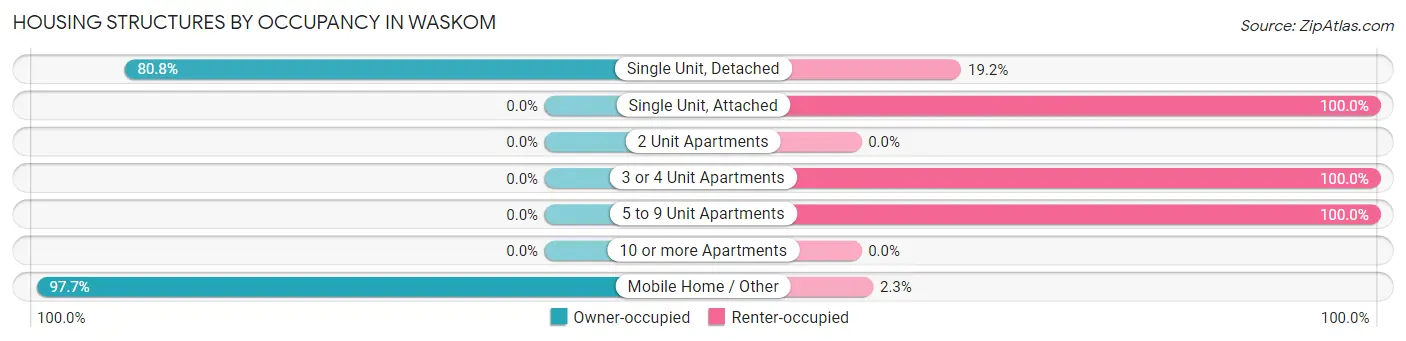
| Structure Type | Owner-occupied | Renter-occupied |
| Single Unit, Detached | 277 (80.8%) | 66 (19.2%) |
| Single Unit, Attached | 0 (0.0%) | 6 (100.0%) |
| 2 Unit Apartments | 0 (0.0%) | 0 (0.0%) |
| 3 or 4 Unit Apartments | 0 (0.0%) | 7 (100.0%) |
| 5 to 9 Unit Apartments | 0 (0.0%) | 20 (100.0%) |
| 10 or more Apartments | 0 (0.0%) | 0 (0.0%) |
| Mobile Home / Other | 171 (97.7%) | 4 (2.3%) |
| Total | 448 (81.3%) | 103 (18.7%) |
Housing Structures by Number of Rooms in Waskom
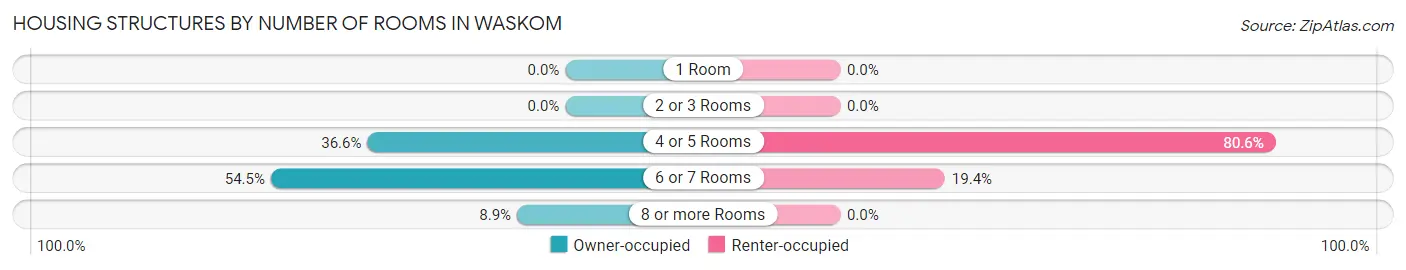
| Number of Rooms | Owner-occupied | Renter-occupied |
| 1 Room | 0 (0.0%) | 0 (0.0%) |
| 2 or 3 Rooms | 0 (0.0%) | 0 (0.0%) |
| 4 or 5 Rooms | 164 (36.6%) | 83 (80.6%) |
| 6 or 7 Rooms | 244 (54.5%) | 20 (19.4%) |
| 8 or more Rooms | 40 (8.9%) | 0 (0.0%) |
| Total | 448 (100.0%) | 103 (100.0%) |
Housing Structure by Heating Type in Waskom
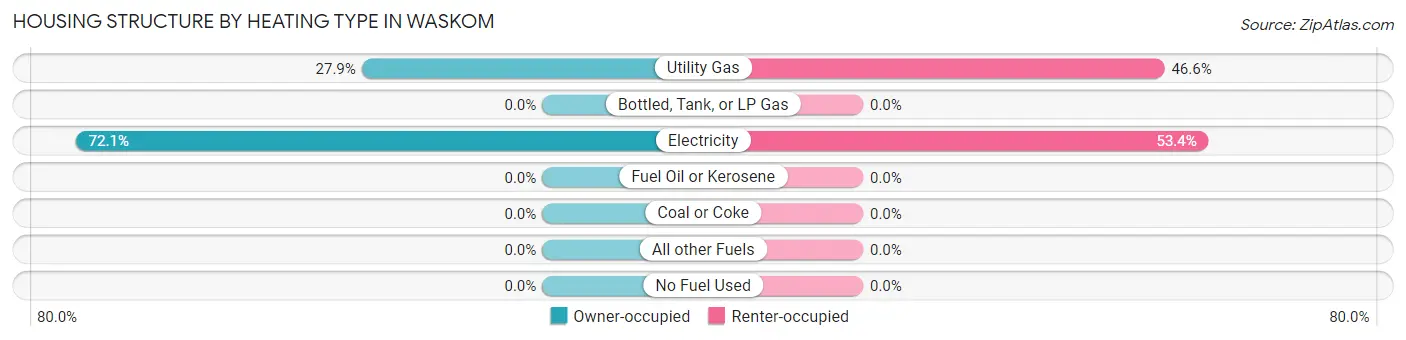
| Heating Type | Owner-occupied | Renter-occupied |
| Utility Gas | 125 (27.9%) | 48 (46.6%) |
| Bottled, Tank, or LP Gas | 0 (0.0%) | 0 (0.0%) |
| Electricity | 323 (72.1%) | 55 (53.4%) |
| Fuel Oil or Kerosene | 0 (0.0%) | 0 (0.0%) |
| Coal or Coke | 0 (0.0%) | 0 (0.0%) |
| All other Fuels | 0 (0.0%) | 0 (0.0%) |
| No Fuel Used | 0 (0.0%) | 0 (0.0%) |
| Total | 448 (100.0%) | 103 (100.0%) |
Household Vehicle Usage in Waskom
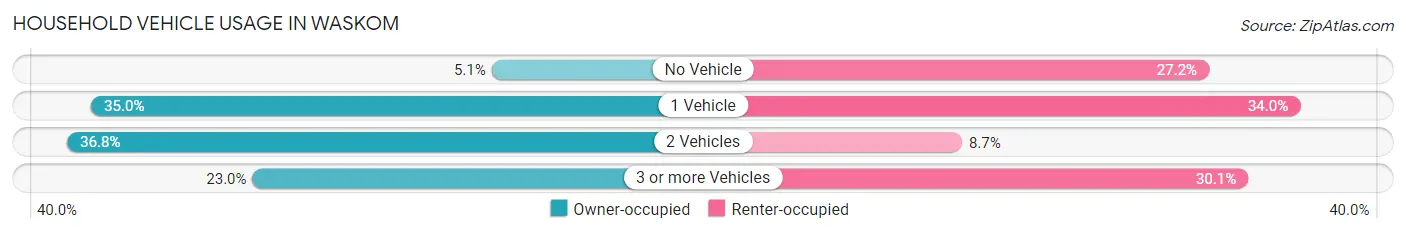
| Vehicles per Household | Owner-occupied | Renter-occupied |
| No Vehicle | 23 (5.1%) | 28 (27.2%) |
| 1 Vehicle | 157 (35.0%) | 35 (34.0%) |
| 2 Vehicles | 165 (36.8%) | 9 (8.7%) |
| 3 or more Vehicles | 103 (23.0%) | 31 (30.1%) |
| Total | 448 (100.0%) | 103 (100.0%) |
Real Estate & Mortgages in Waskom
Real Estate and Mortgage Overview in Waskom
| Characteristic | Without Mortgage | With Mortgage |
| Housing Units | 331 | 117 |
| Median Property Value | $85,700 | $0 |
| Median Household Income | - | - |
| Monthly Housing Costs | $342 | $7 |
| Real Estate Taxes | $424 | $0 |
Property Value by Mortgage Status in Waskom
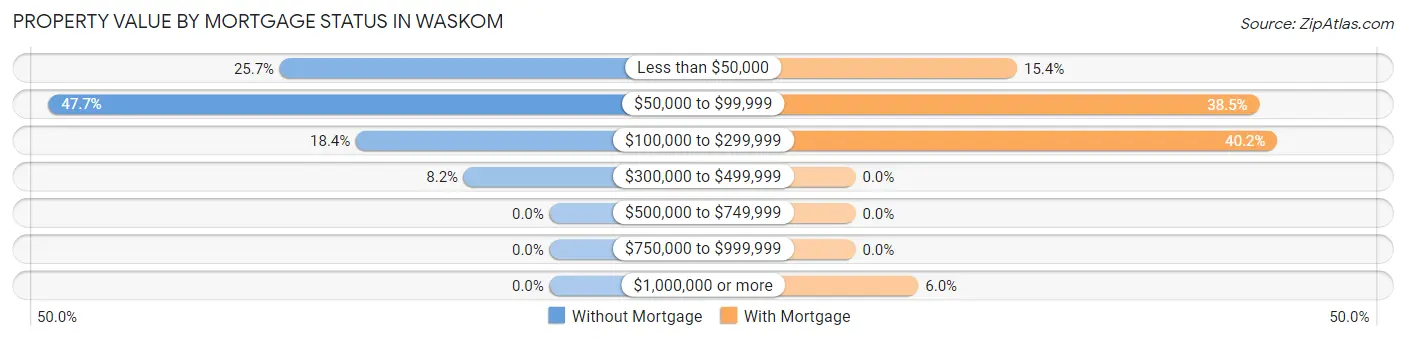
| Property Value | Without Mortgage | With Mortgage |
| Less than $50,000 | 85 (25.7%) | 18 (15.4%) |
| $50,000 to $99,999 | 158 (47.7%) | 45 (38.5%) |
| $100,000 to $299,999 | 61 (18.4%) | 47 (40.2%) |
| $300,000 to $499,999 | 27 (8.2%) | 0 (0.0%) |
| $500,000 to $749,999 | 0 (0.0%) | 0 (0.0%) |
| $750,000 to $999,999 | 0 (0.0%) | 0 (0.0%) |
| $1,000,000 or more | 0 (0.0%) | 7 (6.0%) |
| Total | 331 (100.0%) | 117 (100.0%) |
Household Income by Mortgage Status in Waskom
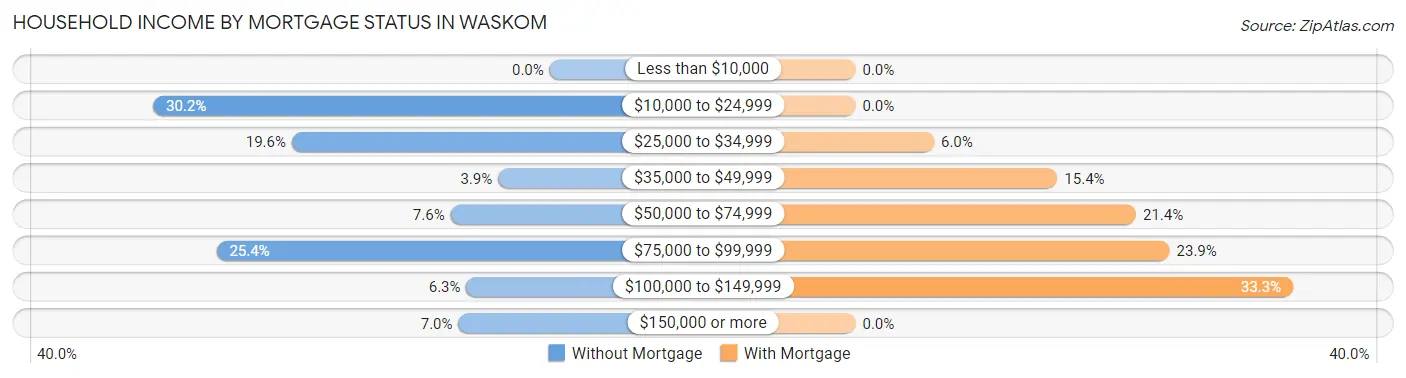
| Household Income | Without Mortgage | With Mortgage |
| Less than $10,000 | 0 (0.0%) | 0 (0.0%) |
| $10,000 to $24,999 | 100 (30.2%) | 0 (0.0%) |
| $25,000 to $34,999 | 65 (19.6%) | 7 (6.0%) |
| $35,000 to $49,999 | 13 (3.9%) | 18 (15.4%) |
| $50,000 to $74,999 | 25 (7.5%) | 25 (21.4%) |
| $75,000 to $99,999 | 84 (25.4%) | 28 (23.9%) |
| $100,000 to $149,999 | 21 (6.3%) | 39 (33.3%) |
| $150,000 or more | 23 (7.0%) | 0 (0.0%) |
| Total | 331 (100.0%) | 117 (100.0%) |
Property Value to Household Income Ratio in Waskom
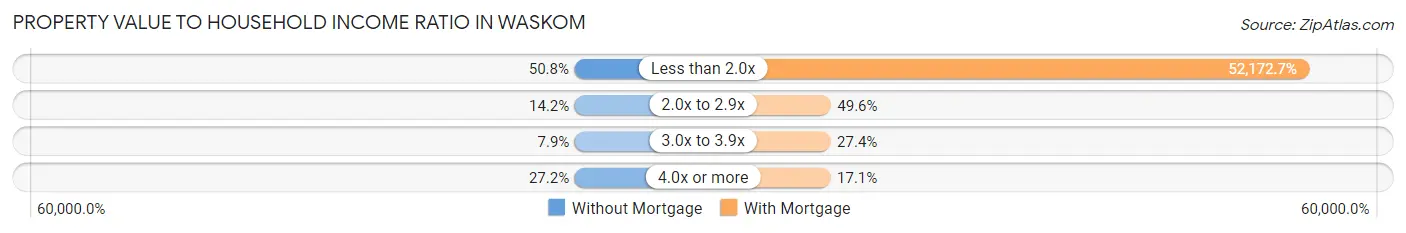
| Value-to-Income Ratio | Without Mortgage | With Mortgage |
| Less than 2.0x | 168 (50.8%) | 61,042 (52,172.6%) |
| 2.0x to 2.9x | 47 (14.2%) | 58 (49.6%) |
| 3.0x to 3.9x | 26 (7.9%) | 32 (27.4%) |
| 4.0x or more | 90 (27.2%) | 20 (17.1%) |
| Total | 331 (100.0%) | 117 (100.0%) |
Real Estate Taxes by Mortgage Status in Waskom
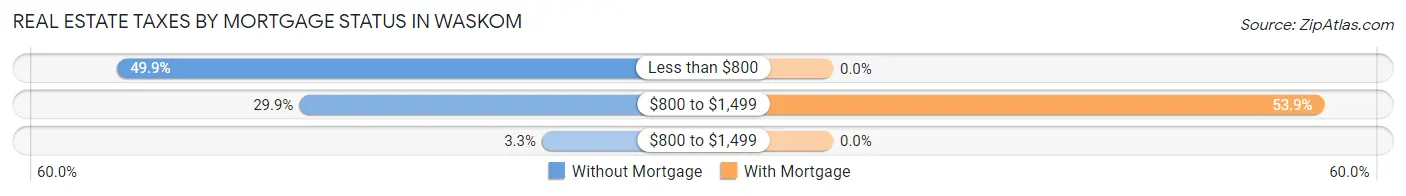
| Property Taxes | Without Mortgage | With Mortgage |
| Less than $800 | 165 (49.8%) | 0 (0.0%) |
| $800 to $1,499 | 99 (29.9%) | 63 (53.8%) |
| $800 to $1,499 | 11 (3.3%) | 0 (0.0%) |
| Total | 331 (100.0%) | 117 (100.0%) |
Health & Disability in Waskom
Health Insurance Coverage by Age in Waskom
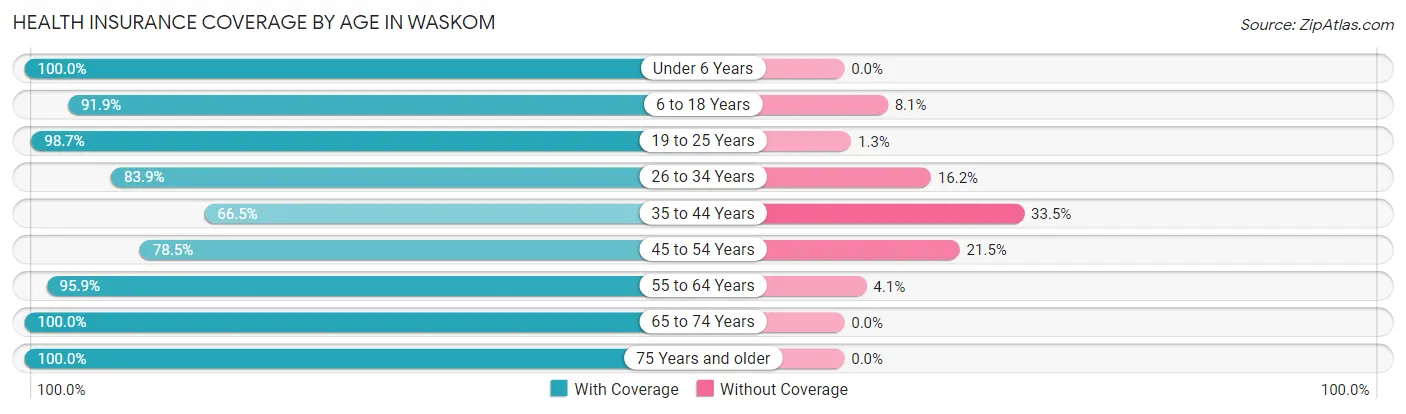
| Age Bracket | With Coverage | Without Coverage |
| Under 6 Years | 133 (100.0%) | 0 (0.0%) |
| 6 to 18 Years | 250 (91.9%) | 22 (8.1%) |
| 19 to 25 Years | 155 (98.7%) | 2 (1.3%) |
| 26 to 34 Years | 296 (83.9%) | 57 (16.2%) |
| 35 to 44 Years | 107 (66.5%) | 54 (33.5%) |
| 45 to 54 Years | 73 (78.5%) | 20 (21.5%) |
| 55 to 64 Years | 233 (95.9%) | 10 (4.1%) |
| 65 to 74 Years | 47 (100.0%) | 0 (0.0%) |
| 75 Years and older | 223 (100.0%) | 0 (0.0%) |
| Total | 1,517 (90.2%) | 165 (9.8%) |
Health Insurance Coverage by Citizenship Status in Waskom
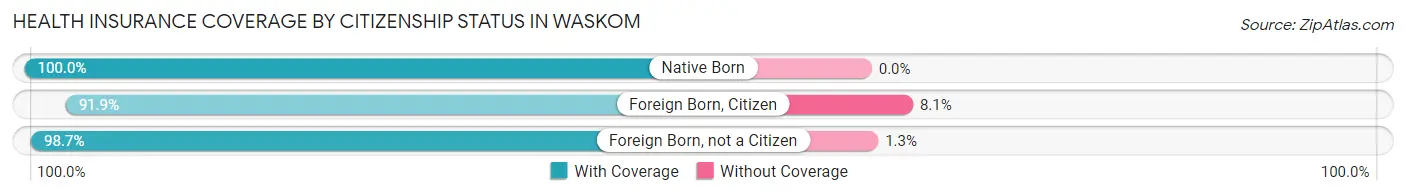
| Citizenship Status | With Coverage | Without Coverage |
| Native Born | 133 (100.0%) | 0 (0.0%) |
| Foreign Born, Citizen | 250 (91.9%) | 22 (8.1%) |
| Foreign Born, not a Citizen | 155 (98.7%) | 2 (1.3%) |
Health Insurance Coverage by Household Income in Waskom
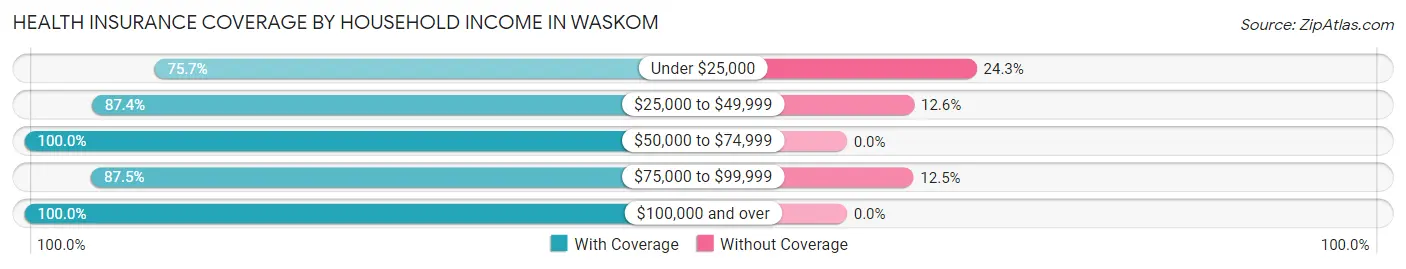
| Household Income | With Coverage | Without Coverage |
| Under $25,000 | 168 (75.7%) | 54 (24.3%) |
| $25,000 to $49,999 | 319 (87.4%) | 46 (12.6%) |
| $50,000 to $74,999 | 250 (100.0%) | 0 (0.0%) |
| $75,000 to $99,999 | 456 (87.5%) | 65 (12.5%) |
| $100,000 and over | 324 (100.0%) | 0 (0.0%) |
Public vs Private Health Insurance Coverage by Age in Waskom
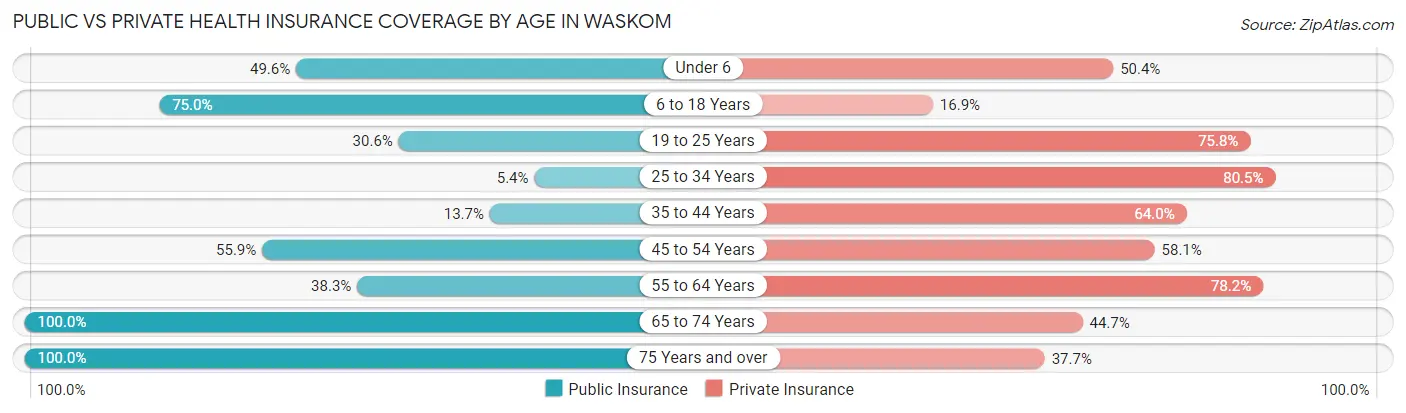
| Age Bracket | Public Insurance | Private Insurance |
| Under 6 | 66 (49.6%) | 67 (50.4%) |
| 6 to 18 Years | 204 (75.0%) | 46 (16.9%) |
| 19 to 25 Years | 48 (30.6%) | 119 (75.8%) |
| 25 to 34 Years | 19 (5.4%) | 284 (80.4%) |
| 35 to 44 Years | 22 (13.7%) | 103 (64.0%) |
| 45 to 54 Years | 52 (55.9%) | 54 (58.1%) |
| 55 to 64 Years | 93 (38.3%) | 190 (78.2%) |
| 65 to 74 Years | 47 (100.0%) | 21 (44.7%) |
| 75 Years and over | 223 (100.0%) | 84 (37.7%) |
| Total | 774 (46.0%) | 968 (57.6%) |
Disability Status by Sex by Age in Waskom
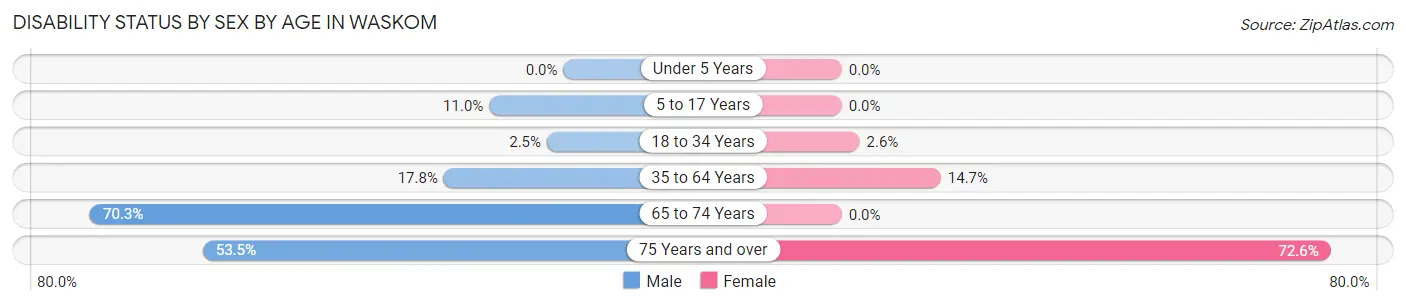
| Age Bracket | Male | Female |
| Under 5 Years | 0 (0.0%) | 0 (0.0%) |
| 5 to 17 Years | 14 (11.0%) | 0 (0.0%) |
| 18 to 34 Years | 6 (2.5%) | 7 (2.6%) |
| 35 to 64 Years | 46 (17.8%) | 35 (14.7%) |
| 65 to 74 Years | 26 (70.3%) | 0 (0.0%) |
| 75 Years and over | 53 (53.5%) | 90 (72.6%) |
Disability Class by Sex by Age in Waskom
Disability Class: Hearing Difficulty
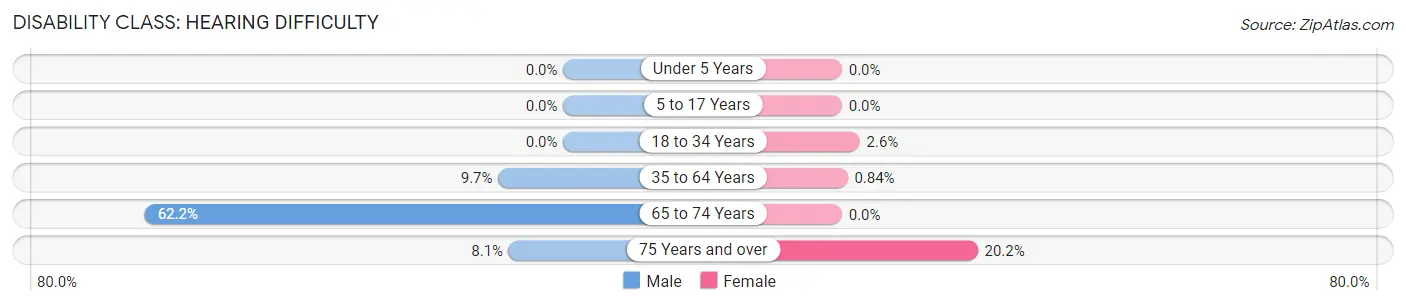
| Age Bracket | Male | Female |
| Under 5 Years | 0 (0.0%) | 0 (0.0%) |
| 5 to 17 Years | 0 (0.0%) | 0 (0.0%) |
| 18 to 34 Years | 0 (0.0%) | 7 (2.6%) |
| 35 to 64 Years | 25 (9.7%) | 2 (0.8%) |
| 65 to 74 Years | 23 (62.2%) | 0 (0.0%) |
| 75 Years and over | 8 (8.1%) | 25 (20.2%) |
Disability Class: Vision Difficulty
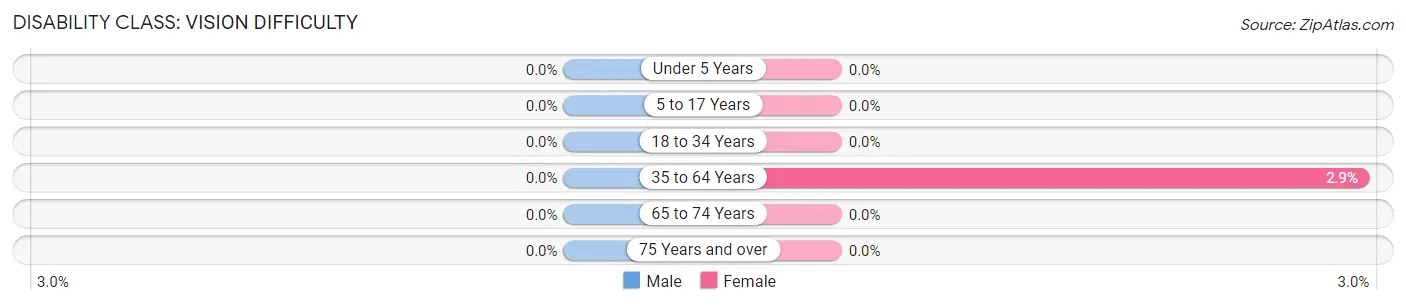
| Age Bracket | Male | Female |
| Under 5 Years | 0 (0.0%) | 0 (0.0%) |
| 5 to 17 Years | 0 (0.0%) | 0 (0.0%) |
| 18 to 34 Years | 0 (0.0%) | 0 (0.0%) |
| 35 to 64 Years | 0 (0.0%) | 7 (2.9%) |
| 65 to 74 Years | 0 (0.0%) | 0 (0.0%) |
| 75 Years and over | 0 (0.0%) | 0 (0.0%) |
Disability Class: Cognitive Difficulty
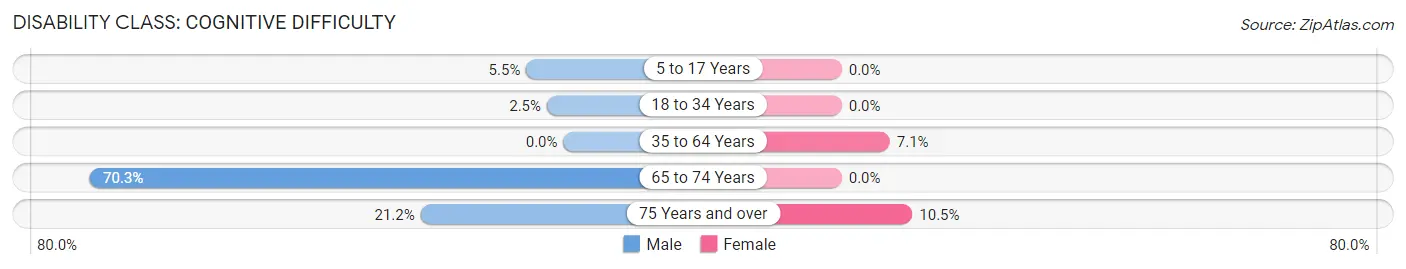
| Age Bracket | Male | Female |
| 5 to 17 Years | 7 (5.5%) | 0 (0.0%) |
| 18 to 34 Years | 6 (2.5%) | 0 (0.0%) |
| 35 to 64 Years | 0 (0.0%) | 17 (7.1%) |
| 65 to 74 Years | 26 (70.3%) | 0 (0.0%) |
| 75 Years and over | 21 (21.2%) | 13 (10.5%) |
Disability Class: Ambulatory Difficulty
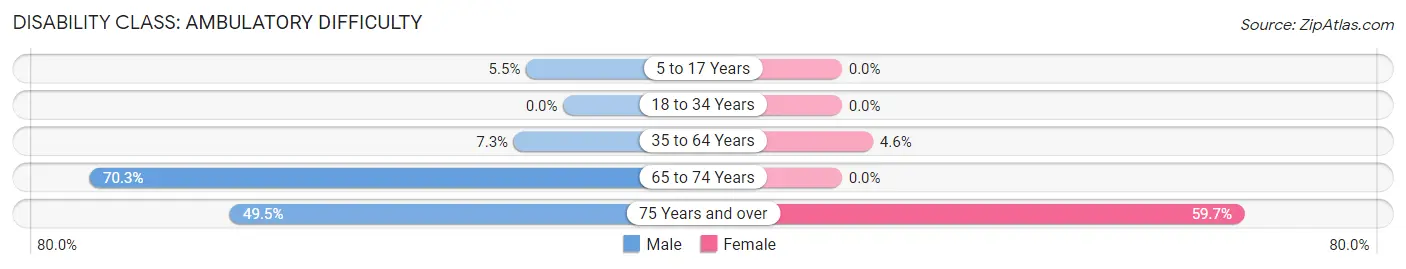
| Age Bracket | Male | Female |
| 5 to 17 Years | 7 (5.5%) | 0 (0.0%) |
| 18 to 34 Years | 0 (0.0%) | 0 (0.0%) |
| 35 to 64 Years | 19 (7.3%) | 11 (4.6%) |
| 65 to 74 Years | 26 (70.3%) | 0 (0.0%) |
| 75 Years and over | 49 (49.5%) | 74 (59.7%) |
Disability Class: Self-Care Difficulty
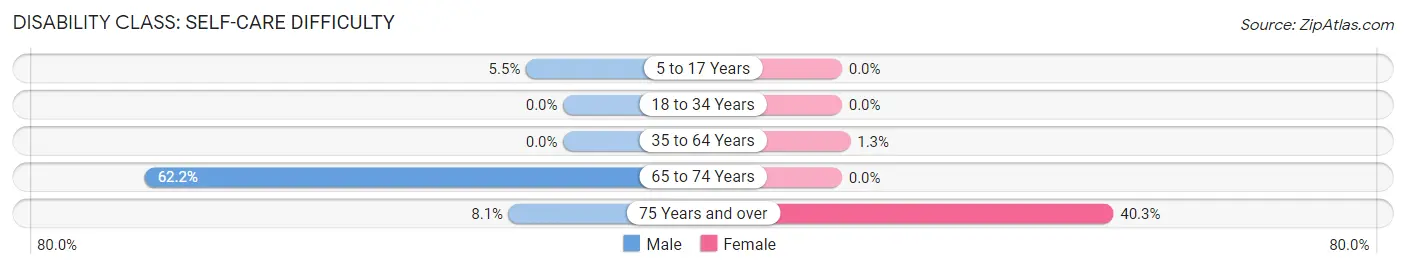
| Age Bracket | Male | Female |
| 5 to 17 Years | 7 (5.5%) | 0 (0.0%) |
| 18 to 34 Years | 0 (0.0%) | 0 (0.0%) |
| 35 to 64 Years | 0 (0.0%) | 3 (1.3%) |
| 65 to 74 Years | 23 (62.2%) | 0 (0.0%) |
| 75 Years and over | 8 (8.1%) | 50 (40.3%) |
Technology Access in Waskom
Computing Device Access in Waskom
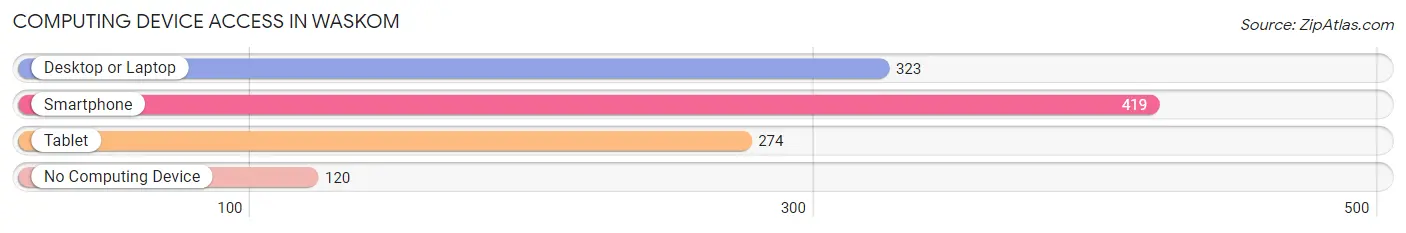
| Device Type | # Households | % Households |
| Desktop or Laptop | 323 | 58.6% |
| Smartphone | 419 | 76.0% |
| Tablet | 274 | 49.7% |
| No Computing Device | 120 | 21.8% |
| Total | 551 | 100.0% |
Internet Access in Waskom
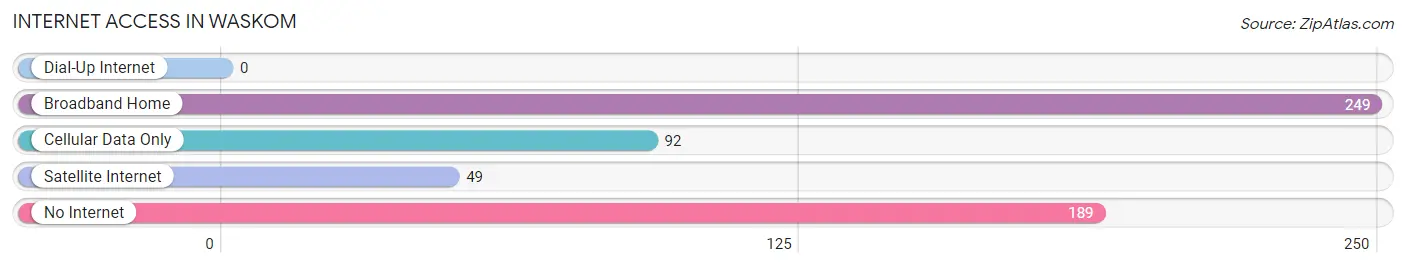
| Internet Type | # Households | % Households |
| Dial-Up Internet | 0 | 0.0% |
| Broadband Home | 249 | 45.2% |
| Cellular Data Only | 92 | 16.7% |
| Satellite Internet | 49 | 8.9% |
| No Internet | 189 | 34.3% |
| Total | 551 | 100.0% |
Waskom Summary
Waskom, Texas is a small town located in Harrison County, Texas, United States. It is situated on the border of Texas and Louisiana, and is part of the Longview-Marshall Metropolitan Statistical Area. The population of Waskom was 1,741 at the 2010 census.
History
The area that is now Waskom was first settled in the early 1800s by a group of settlers from the United States. The town was originally known as "Waskom Station" and was a stop on the Texas and Pacific Railway. The town was officially incorporated in 1873 and was named after the Waskom family, who were early settlers in the area.
In the late 1800s, Waskom was a thriving community with a population of over 1,000 people. The town was home to several businesses, including a cotton gin, a sawmill, a gristmill, and a blacksmith shop. The town also had a school, a post office, and a church.
In the early 1900s, Waskom experienced a period of decline due to the Great Depression and the Dust Bowl. The population of the town decreased to just over 500 people by the 1940s.
In the 1950s, Waskom began to experience a period of growth and development. The town was home to several new businesses, including a grocery store, a hardware store, and a bank. The population of the town increased to over 1,000 people by the 1960s.
Geography
Waskom is located at 32°45'25" North, 94°17'45" West (32.756944, -94.295833). The town is situated on the border of Texas and Louisiana, and is part of the Longview-Marshall Metropolitan Statistical Area.
The town has a total area of 1.2 square miles, all of which is land. The town is located in the East Texas Piney Woods region and is surrounded by forests and rolling hills.
Economy
The economy of Waskom is largely based on agriculture and timber production. The town is home to several farms and ranches, as well as several timber companies. The town is also home to several small businesses, including a grocery store, a hardware store, and a bank.
Demographics
As of the 2010 census, the population of Waskom was 1,741. The racial makeup of the town was 79.3% White, 17.2% African American, 0.7% Native American, 0.3% Asian, 0.1% Pacific Islander, and 2.4% from other races. Hispanic or Latino of any race were 4.2% of the population.
The median household income in Waskom was $37,917, and the median family income was $45,625. The per capita income for the town was $17,945. About 17.2% of families and 20.3% of the population were below the poverty line, including 28.3% of those under age 18 and 11.2% of those age 65 or over.
Common Questions
What is Per Capita Income in Waskom?
Per Capita income in Waskom is $22,688.
What is the Median Family Income in Waskom?
Median Family Income in Waskom is $62,279.
What is the Median Household income in Waskom?
Median Household Income in Waskom is $47,313.
What is Income or Wage Gap in Waskom?
Income or Wage Gap in Waskom is 51.8%.
Women in Waskom earn 48.2 cents for every dollar earned by a man.
What is Inequality or Gini Index in Waskom?
Inequality or Gini Index in Waskom is 0.38.
What is the Total Population of Waskom?
Total Population of Waskom is 1,682.
What is the Total Male Population of Waskom?
Total Male Population of Waskom is 821.
What is the Total Female Population of Waskom?
Total Female Population of Waskom is 861.
What is the Ratio of Males per 100 Females in Waskom?
There are 95.35 Males per 100 Females in Waskom.
What is the Ratio of Females per 100 Males in Waskom?
There are 104.87 Females per 100 Males in Waskom.
What is the Median Population Age in Waskom?
Median Population Age in Waskom is 32.9 Years.
What is the Average Family Size in Waskom
Average Family Size in Waskom is 3.6 People.
What is the Average Household Size in Waskom
Average Household Size in Waskom is 3.0 People.
How Large is the Labor Force in Waskom?
There are 690 People in the Labor Forcein in Waskom.
What is the Percentage of People in the Labor Force in Waskom?
52.5% of People are in the Labor Force in Waskom.
What is the Unemployment Rate in Waskom?
Unemployment Rate in Waskom is 5.4%.