Zip Codes with the Lowest Poverty Level Among Children Under the Age of 5 in Fort Worth, TX

RELATED REPORTS & OPTIONS

Lowest Poverty | Child 0-5
Population
Families and Households
Female Fertility
Female Fertility (Unmarried)
Race (Community Size)
Race (Percentage)
Ancestry (Community Size)
AfghanAfricanAlbanianAlsatianAmericanApacheArabArgentineanArmenianAustralianAustrianBahamianBangladeshiBarbadianBasqueBelgianBhutaneseBlackfeetBolivianBrazilianBritishBritish West IndianBulgarianBurmeseCajunCambodianCanadianCelticCentral AmericanCentral American IndianCherokeeCheyenneChickasawChileanChippewaChoctawColombianComancheCosta RicanCreekCroatianCrowCubanCzechCzechoslovakianDanishDelawareDominicanDutchDutch West IndianEastern EuropeanEcuadorianEgyptianEnglishEstonianEthiopianEuropeanFilipinoFinnishFrenchFrench American IndianFrench CanadianGermanGerman RussianGhanaianGreekGuamanian / ChamorroGuatemalanGuyaneseHaitianHonduranHopiHungarianIcelanderIndian (Asian)IndonesianInupiatIranianIraqiIrishIroquoisIsraeliItalianJamaicanJapaneseJordanianKenyanKiowaKoreanLaotianLatvianLebaneseLiberianLithuanianLuxembourgerMalaysianMalteseMexicanMexican American IndianMongolianMoroccanNative HawaiianNavajoNicaraguanNigerianNorthern EuropeanNorwegianOsageOttawaPakistaniPalestinianPanamanianPennsylvania GermanPeruvianPolishPortuguesePotawatomiPuebloPuerto RicanRomanianRussianSalvadoranSamoanScandinavianScotch-IrishScottishSerbianSiouxSlavicSlovakSloveneSomaliSouth AfricanSouth AmericanSouth American IndianSpaniardSpanishSpanish AmericanSpanish American IndianSri LankanSubsaharan AfricanSudaneseSwedishSwissSyrianThaiTonganTrinidadian and TobagonianTurkishUgandanUkrainianVenezuelanVietnameseWelshWest IndianYaquiYugoslavianZimbabwean
Ancestry (Percentage)
AfghanAfricanAlbanianAlsatianAmericanApacheArabArgentineanArmenianAustralianAustrianBahamianBangladeshiBarbadianBasqueBelgianBhutaneseBlackfeetBolivianBrazilianBritishBritish West IndianBulgarianBurmeseCajunCambodianCanadianCelticCentral AmericanCentral American IndianCherokeeCheyenneChickasawChileanChippewaChoctawColombianComancheCosta RicanCreekCroatianCrowCubanCzechCzechoslovakianDanishDelawareDominicanDutchDutch West IndianEastern EuropeanEcuadorianEgyptianEnglishEstonianEthiopianEuropeanFilipinoFinnishFrenchFrench American IndianFrench CanadianGermanGerman RussianGhanaianGreekGuamanian / ChamorroGuatemalanGuyaneseHaitianHonduranHopiHungarianIcelanderIndian (Asian)IndonesianInupiatIranianIraqiIrishIroquoisIsraeliItalianJamaicanJapaneseJordanianKenyanKiowaKoreanLaotianLatvianLebaneseLiberianLithuanianLuxembourgerMalaysianMalteseMexicanMexican American IndianMongolianMoroccanNative HawaiianNavajoNicaraguanNigerianNorthern EuropeanNorwegianOsageOttawaPakistaniPalestinianPanamanianPennsylvania GermanPeruvianPolishPortuguesePotawatomiPuebloPuerto RicanRomanianRussianSalvadoranSamoanScandinavianScotch-IrishScottishSerbianSiouxSlavicSlovakSloveneSomaliSouth AfricanSouth AmericanSouth American IndianSpaniardSpanishSpanish AmericanSpanish American IndianSri LankanSubsaharan AfricanSudaneseSwedishSwissSyrianThaiTonganTrinidadian and TobagonianTurkishUgandanUkrainianVenezuelanVietnameseWelshWest IndianYaquiYugoslavianZimbabwean
Immigrant Origin (Total)
AfghanistanAfricaAlbaniaArgentinaAsiaAustraliaBahamasBangladeshBarbadosBelarusBelizeBoliviaBosnia and HerzegovinaBrazilBulgariaBurma / MyanmarCambodiaCameroonCanadaCaribbeanCentral AmericaChileChinaColombiaCongoCosta RicaCroatiaCubaCzechoslovakiaDominican RepublicEastern AfricaEastern AsiaEastern EuropeEcuadorEgyptEl SalvadorEnglandEritreaEthiopiaEuropeFranceGermanyGhanaGreeceGuatemalaHaitiHondurasHong KongHungaryIndiaIndonesiaIranIraqIrelandIsraelItalyJamaicaJapanJordanKenyaKoreaLaosLatin AmericaLebanonLiberiaMalaysiaMexicoMicronesiaMiddle AfricaMoroccoNepalNetherlandsNicaraguaNigeriaNorthern AfricaNorthern EuropeOceaniaPakistanPanamaPeruPhilippinesPolandPortugalRomaniaRussiaScotlandSenegalSerbiaSomaliaSouth AfricaSouth AmericaSouth Central AsiaSouth Eastern AsiaSouthern EuropeSpainSri LankaSudanSwedenSwitzerlandSyriaTaiwanThailandTrinidad and TobagoTurkeyUgandaUkraineVenezuelaVietnamWestern AfricaWestern AsiaWestern EuropeZaireZimbabwe
Immigrant Origin (Percentage)
AfghanistanAfricaAlbaniaArgentinaAsiaAustraliaBahamasBangladeshBarbadosBelarusBelizeBoliviaBosnia and HerzegovinaBrazilBulgariaBurma / MyanmarCambodiaCameroonCanadaCaribbeanCentral AmericaChileChinaColombiaCongoCosta RicaCroatiaCubaCzechoslovakiaDominican RepublicEastern AfricaEastern AsiaEastern EuropeEcuadorEgyptEl SalvadorEnglandEritreaEthiopiaEuropeFranceGermanyGhanaGreeceGuatemalaHaitiHondurasHong KongHungaryIndiaIndonesiaIranIraqIrelandIsraelItalyJamaicaJapanJordanKenyaKoreaLaosLatin AmericaLebanonLiberiaMalaysiaMexicoMicronesiaMiddle AfricaMoroccoNepalNetherlandsNicaraguaNigeriaNorthern AfricaNorthern EuropeOceaniaPakistanPanamaPeruPhilippinesPolandPortugalRomaniaRussiaScotlandSenegalSerbiaSomaliaSouth AfricaSouth AmericaSouth Central AsiaSouth Eastern AsiaSouthern EuropeSpainSri LankaSudanSwedenSwitzerlandSyriaTaiwanThailandTrinidad and TobagoTurkeyUgandaUkraineVenezuelaVietnamWestern AfricaWestern AsiaWestern EuropeZaireZimbabwe
Income
Income (Families)
Income (Households)
Poverty
Poverty (Families)
Unemployment
Employment Occupations
Employment Industries
Employer Class
Commute Time
Commute Means
School Enrollment
Education by Degree Field
Occupancy
Finances
Physical Characteristics
Fort Worth
Compare Zip Codes
Comparison Subject

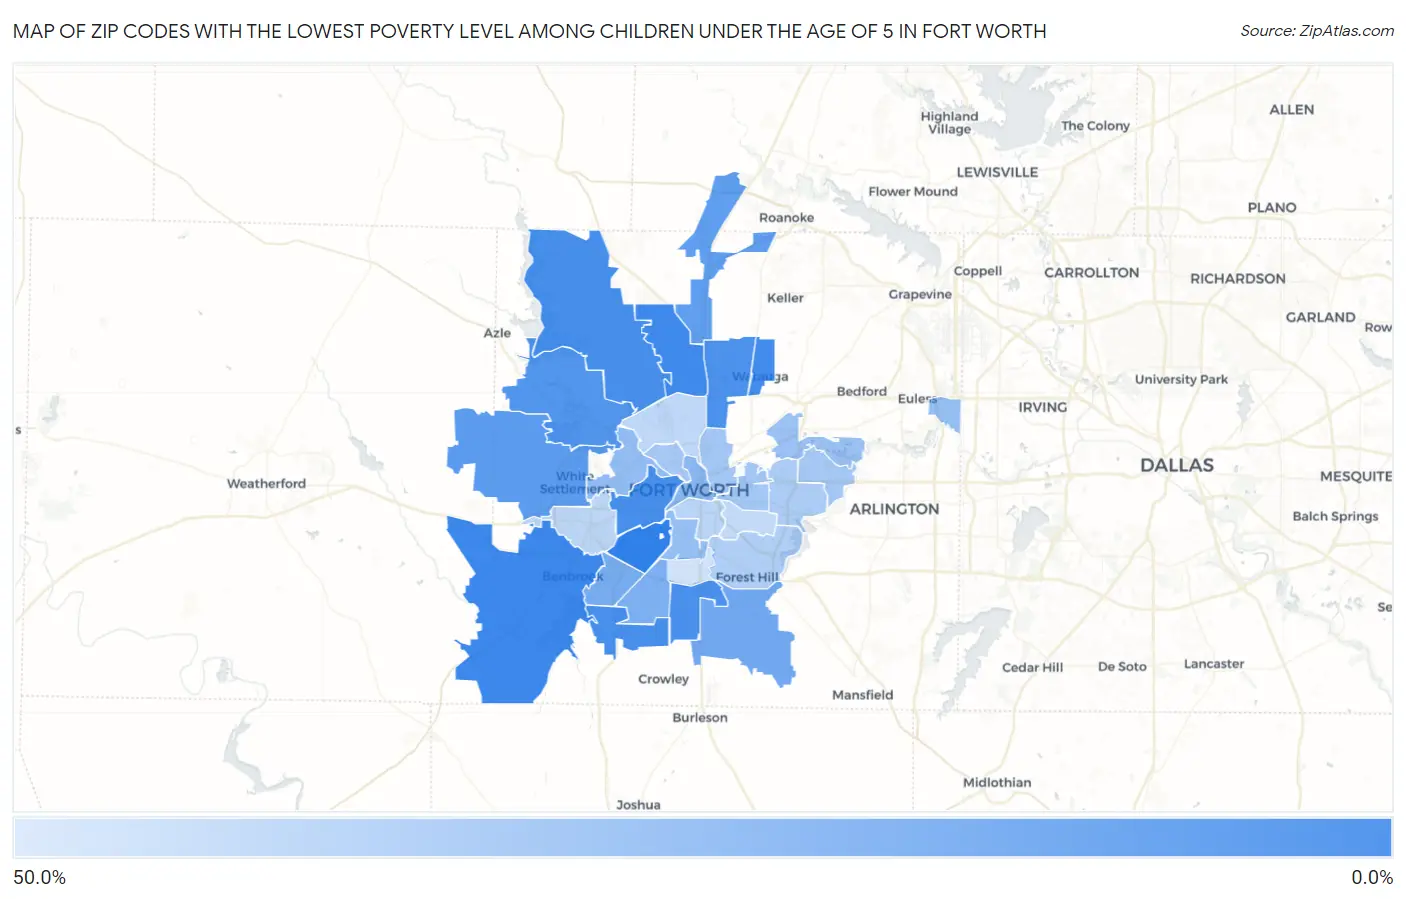
Map of Zip Codes with the Lowest Poverty Level Among Children Under the Age of 5 in Fort Worth

50.0%
0.0%
Zip Codes with the Lowest Poverty Level Among Children Under the Age of 5 in Fort Worth Map

Zip Codes with the Lowest Poverty Level Among Children Under the Age of 5 in Fort Worth, TX

Zip Code Child Poverty vs State vs National
1.761264.2%21.1%(-16.9)#10518.1%(-13.9)#2,349
2.761315.1%21.1%(-16.0)#13618.1%(-13.0)#2,948
3.761486.0%21.1%(-15.1)#16618.1%(-12.0)#3,607
4.761076.7%21.1%(-14.4)#18318.1%(-11.4)#4,024
5.761796.8%21.1%(-14.3)#18918.1%(-11.3)#4,129
6.761237.1%21.1%(-14.0)#20418.1%(-11.0)#4,345
7.761347.2%21.1%(-13.9)#20818.1%(-10.9)#4,421
8.761377.8%21.1%(-13.3)#23318.1%(-10.3)#4,802
9.761359.8%21.1%(-11.3)#29618.1%(-8.27)#6,132
10.7610811.9%21.1%(-9.20)#38218.1%(-6.17)#7,390
11.7617712.8%21.1%(-8.32)#41218.1%(-5.29)#7,908
12.7614017.3%21.1%(-3.79)#57318.1%(-0.765)#10,394
13.7613218.7%21.1%(-2.37)#61118.1%(+0.657)#11,039
14.7613320.7%21.1%(-0.338)#66518.1%(+2.69)#11,966
15.7610224.1%21.1%(+3.05)#75918.1%(+6.08)#13,365
16.7611426.3%21.1%(+5.21)#81018.1%(+8.23)#14,120
17.7611026.9%21.1%(+5.82)#82618.1%(+8.84)#14,338
18.7615527.0%21.1%(+5.95)#82918.1%(+8.97)#14,375
19.7611829.0%21.1%(+7.93)#88718.1%(+10.9)#15,020
20.7611130.7%21.1%(+9.60)#93618.1%(+12.6)#15,499
21.7610330.7%21.1%(+9.62)#93718.1%(+12.6)#15,504
22.7616431.4%21.1%(+10.3)#95118.1%(+13.3)#15,693
23.7612031.6%21.1%(+10.5)#95418.1%(+13.6)#15,748
24.7611233.6%21.1%(+12.5)#99718.1%(+15.5)#16,279
25.7611935.4%21.1%(+14.3)#1,03018.1%(+17.3)#16,691
26.7610437.6%21.1%(+16.5)#1,06818.1%(+19.5)#17,194
27.7611638.9%21.1%(+17.8)#1,08718.1%(+20.8)#17,435
28.7610640.1%21.1%(+19.0)#1,11018.1%(+22.0)#17,678
29.7610540.8%21.1%(+19.7)#1,11818.1%(+22.7)#17,803
30.7611545.0%21.1%(+23.9)#1,18318.1%(+27.0)#18,492

Common Questions

What are the Top 10 Zip Codes with the Lowest Poverty Level Among Children Under the Age of 5 in Fort Worth, TX?
Top 10 Zip Codes with the Lowest Poverty Level Among Children Under the Age of 5 in Fort Worth, TX are:
#1
0.0%
#2
4.2%
#3
5.1%
#4
6.0%
#5
6.7%
#6
6.8%
#7
7.1%
#8
7.2%
#9
7.8%
#10
9.8%
What zip code has the Lowest Poverty Level Among Children Under the Age of 5 in Fort Worth, TX?
76126 has the Lowest Poverty Level Among Children Under the Age of 5 in Fort Worth, TX with 4.2%.
What is the Poverty Level Among Children Under the Age of 5 in Fort Worth, TX?
Poverty Level Among Children Under the Age of 5 in Fort Worth is 19.6%.
What is the Poverty Level Among Children Under the Age of 5 in Texas?
Poverty Level Among Children Under the Age of 5 in Texas is 21.1%.
What is the Poverty Level Among Children Under the Age of 5 in the United States?
Poverty Level Among Children Under the Age of 5 in the United States is 18.1%.