Stephenville, TX Map & Demographics
Stephenville Map
Stephenville Overview
$27,158
PER CAPITA INCOME
$82,154
AVG FAMILY INCOME
$48,088
AVG HOUSEHOLD INCOME
34.4%
WAGE / INCOME GAP [ % ]
65.6¢/ $1
WAGE / INCOME GAP [ $ ]
0.48
INEQUALITY / GINI INDEX
21,020
TOTAL POPULATION
9,850
MALE POPULATION
11,170
FEMALE POPULATION
88.18
MALES / 100 FEMALES
113.40
FEMALES / 100 MALES
25.5
MEDIAN AGE
3.1
AVG FAMILY SIZE
2.3
AVG HOUSEHOLD SIZE
11,398
LABOR FORCE [ PEOPLE ]
65.2%
PERCENT IN LABOR FORCE
7.4%
UNEMPLOYMENT RATE
Stephenville Area Codes
Income in Stephenville
Income Overview in Stephenville
Per Capita Income in Stephenville is $27,158, while median incomes of families and households are $82,154 and $48,088 respectively.
| Characteristic | Number | Measure |
| Per Capita Income | 21,020 | $27,158 |
| Median Family Income | 4,087 | $82,154 |
| Mean Family Income | 4,087 | $91,127 |
| Median Household Income | 8,072 | $48,088 |
| Mean Household Income | 8,072 | $68,292 |
| Income Deficit | 4,087 | $0 |
| Wage / Income Gap (%) | 21,020 | 34.36% |
| Wage / Income Gap ($) | 21,020 | 65.64¢ per $1 |
| Gini / Inequality Index | 21,020 | 0.48 |
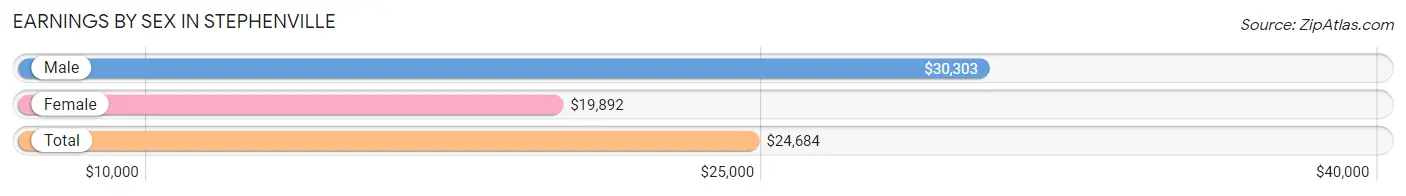
Earnings by Sex in Stephenville
Average Earnings in Stephenville are $24,684, $30,303 for men and $19,892 for women, a difference of 34.4%.
| Sex | Number | Average Earnings |
| Male | 6,417 (51.2%) | $30,303 |
| Female | 6,127 (48.8%) | $19,892 |
| Total | 12,544 (100.0%) | $24,684 |
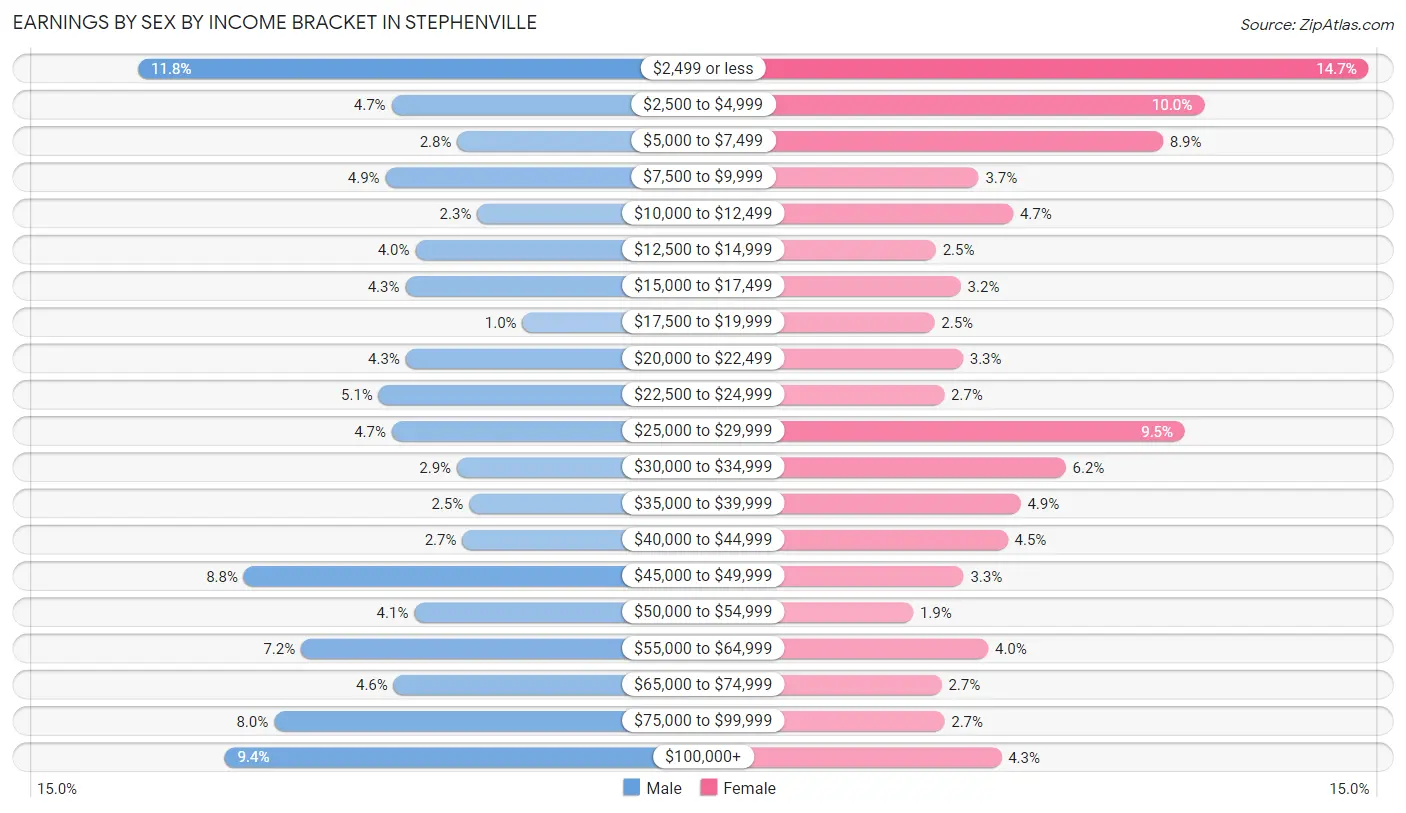
Earnings by Sex by Income Bracket in Stephenville
The most common earnings brackets in Stephenville are $2,499 or less for men (758 | 11.8%) and $2,499 or less for women (898 | 14.7%).
| Income | Male | Female |
| $2,499 or less | 758 (11.8%) | 898 (14.7%) |
| $2,500 to $4,999 | 301 (4.7%) | 615 (10.0%) |
| $5,000 to $7,499 | 182 (2.8%) | 544 (8.9%) |
| $7,500 to $9,999 | 312 (4.9%) | 227 (3.7%) |
| $10,000 to $12,499 | 146 (2.3%) | 286 (4.7%) |
| $12,500 to $14,999 | 258 (4.0%) | 153 (2.5%) |
| $15,000 to $17,499 | 276 (4.3%) | 196 (3.2%) |
| $17,500 to $19,999 | 65 (1.0%) | 151 (2.5%) |
| $20,000 to $22,499 | 275 (4.3%) | 200 (3.3%) |
| $22,500 to $24,999 | 324 (5.1%) | 167 (2.7%) |
| $25,000 to $29,999 | 300 (4.7%) | 582 (9.5%) |
| $30,000 to $34,999 | 183 (2.9%) | 377 (6.1%) |
| $35,000 to $39,999 | 161 (2.5%) | 299 (4.9%) |
| $40,000 to $44,999 | 173 (2.7%) | 277 (4.5%) |
| $45,000 to $49,999 | 567 (8.8%) | 201 (3.3%) |
| $50,000 to $54,999 | 260 (4.1%) | 114 (1.9%) |
| $55,000 to $64,999 | 464 (7.2%) | 243 (4.0%) |
| $65,000 to $74,999 | 297 (4.6%) | 163 (2.7%) |
| $75,000 to $99,999 | 513 (8.0%) | 168 (2.7%) |
| $100,000+ | 602 (9.4%) | 266 (4.3%) |
| Total | 6,417 (100.0%) | 6,127 (100.0%) |
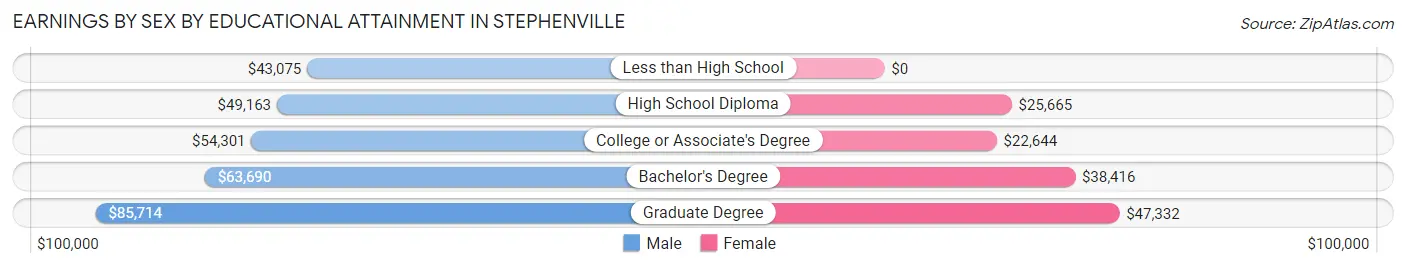
Earnings by Sex by Educational Attainment in Stephenville
Average earnings in Stephenville are $53,413 for men and $33,014 for women, a difference of 38.2%. Men with an educational attainment of graduate degree enjoy the highest average annual earnings of $85,714, while those with less than high school education earn the least with $43,075. Women with an educational attainment of graduate degree earn the most with the average annual earnings of $47,332, while those with college or associate's degree education have the smallest earnings of $22,644.
| Educational Attainment | Male Income | Female Income |
| Less than High School | $43,075 | $0 |
| High School Diploma | $49,163 | $25,665 |
| College or Associate's Degree | $54,301 | $22,644 |
| Bachelor's Degree | $63,690 | $38,416 |
| Graduate Degree | $85,714 | $47,332 |
| Total | $53,413 | $33,014 |
Family Income in Stephenville
Family Income Brackets in Stephenville
According to the Stephenville family income data, there are 977 families falling into the $100,000 to $149,999 income range, which is the most common income bracket and makes up 23.9% of all families. Conversely, the $10,000 to $14,999 income bracket is the least frequent group with only 20 families (0.5%) belonging to this category.
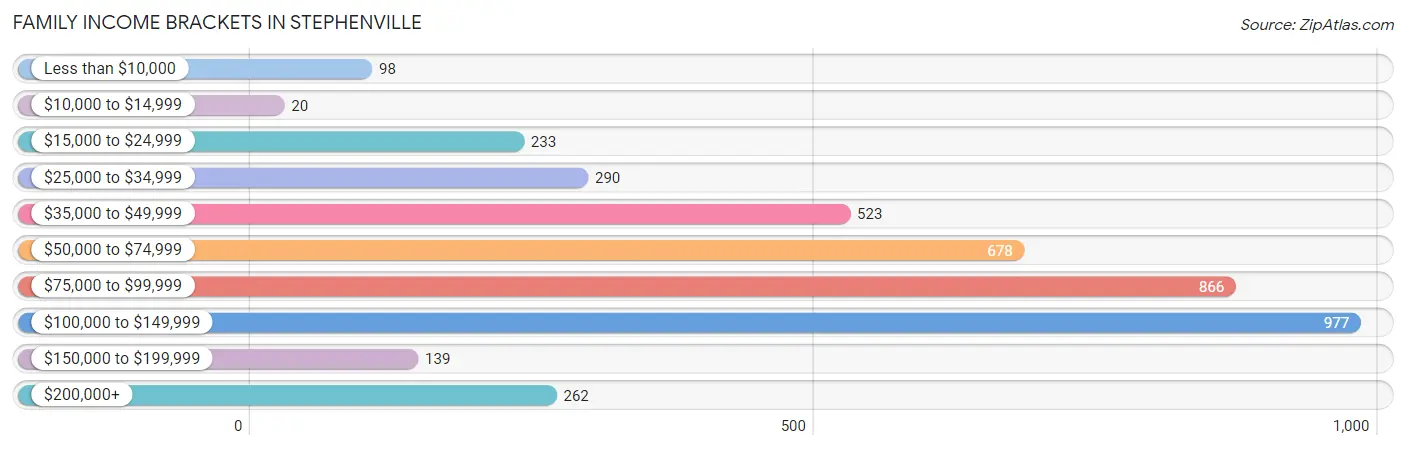
| Income Bracket | # Families | % Families |
| Less than $10,000 | 98 | 2.4% |
| $10,000 to $14,999 | 20 | 0.5% |
| $15,000 to $24,999 | 233 | 5.7% |
| $25,000 to $34,999 | 290 | 7.1% |
| $35,000 to $49,999 | 523 | 12.8% |
| $50,000 to $74,999 | 678 | 16.6% |
| $75,000 to $99,999 | 866 | 21.2% |
| $100,000 to $149,999 | 977 | 23.9% |
| $150,000 to $199,999 | 139 | 3.4% |
| $200,000+ | 262 | 6.4% |
Family Income by Famaliy Size in Stephenville
5-person families (381 | 9.3%) account for the highest median family income in Stephenville with $107,891 per family, while 2-person families (1,622 | 39.7%) have the highest median income of $41,352 per family member.
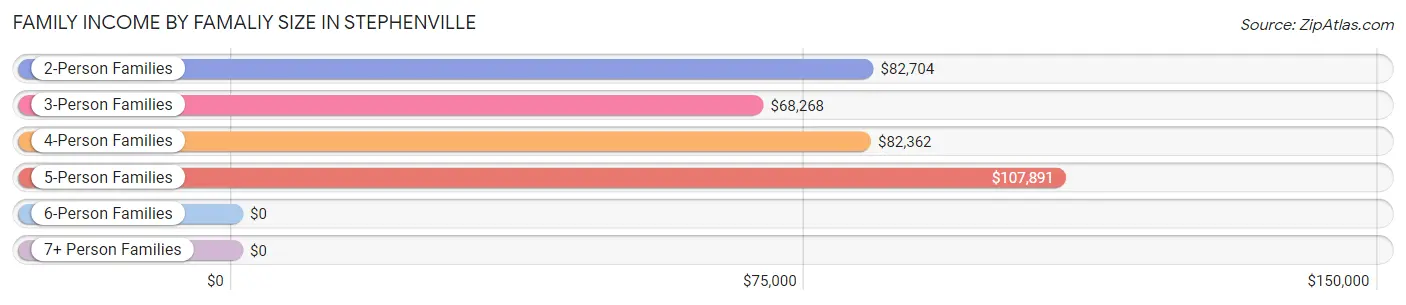
| Income Bracket | # Families | Median Income |
| 2-Person Families | 1,622 (39.7%) | $82,704 |
| 3-Person Families | 1,229 (30.1%) | $68,268 |
| 4-Person Families | 715 (17.5%) | $82,362 |
| 5-Person Families | 381 (9.3%) | $107,891 |
| 6-Person Families | 59 (1.4%) | $0 |
| 7+ Person Families | 81 (2.0%) | $0 |
| Total | 4,087 (100.0%) | $82,154 |
Family Income by Number of Earners in Stephenville
The median family income in Stephenville is $82,154, with families comprising 3+ earners (660) having the highest median family income of $108,505, while families with no earners (229) have the lowest median family income of $47,969, accounting for 16.2% and 5.6% of families, respectively.
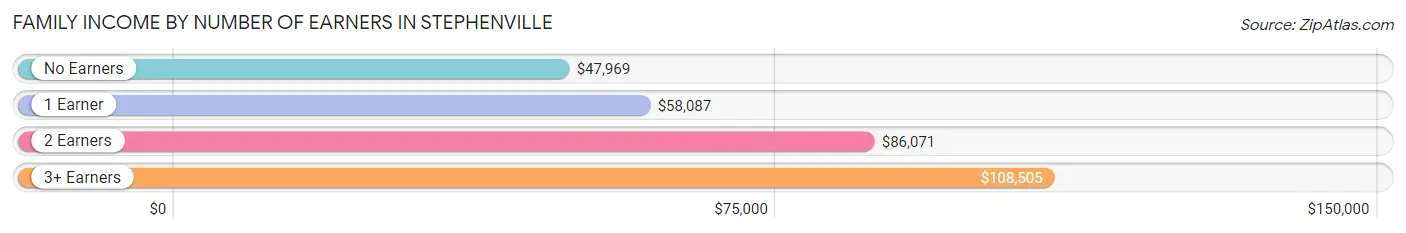
| Number of Earners | # Families | Median Income |
| No Earners | 229 (5.6%) | $47,969 |
| 1 Earner | 1,214 (29.7%) | $58,087 |
| 2 Earners | 1,984 (48.5%) | $86,071 |
| 3+ Earners | 660 (16.2%) | $108,505 |
| Total | 4,087 (100.0%) | $82,154 |
Household Income in Stephenville
Household Income Brackets in Stephenville
With 1,179 households falling in the category, the $100,000 to $149,999 income range is the most frequent in Stephenville, accounting for 14.6% of all households. In contrast, only 218 households (2.7%) fall into the $150,000 to $199,999 income bracket, making it the least populous group.
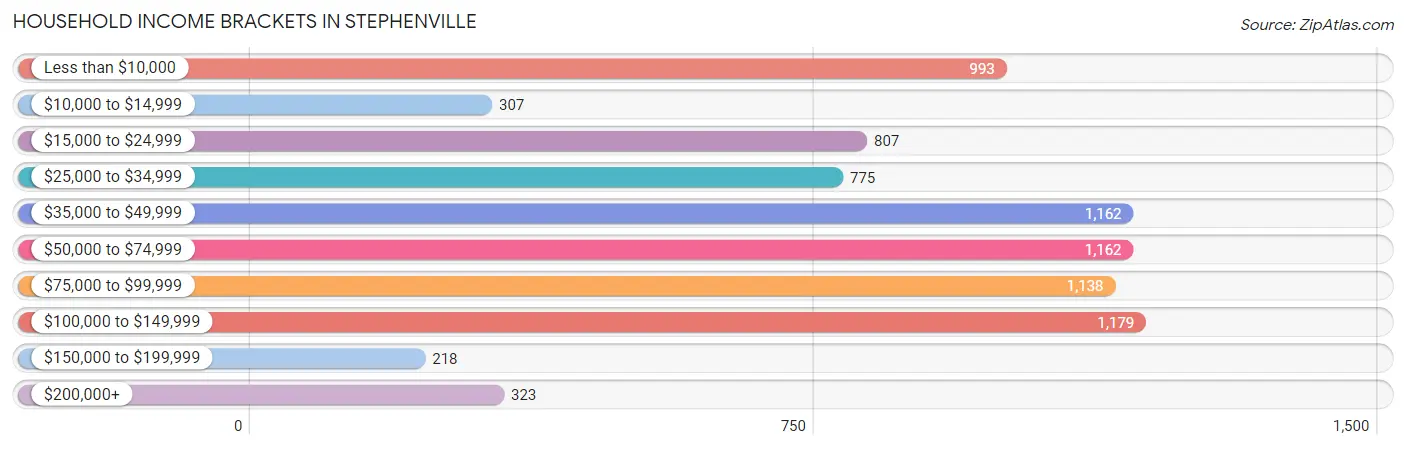
| Income Bracket | # Households | % Households |
| Less than $10,000 | 993 | 12.3% |
| $10,000 to $14,999 | 307 | 3.8% |
| $15,000 to $24,999 | 807 | 10.0% |
| $25,000 to $34,999 | 775 | 9.6% |
| $35,000 to $49,999 | 1,162 | 14.4% |
| $50,000 to $74,999 | 1,162 | 14.4% |
| $75,000 to $99,999 | 1,138 | 14.1% |
| $100,000 to $149,999 | 1,179 | 14.6% |
| $150,000 to $199,999 | 218 | 2.7% |
| $200,000+ | 323 | 4.0% |
Household Income by Householder Age in Stephenville
The median household income in Stephenville is $48,088, with the highest median household income of $75,121 found in the 25 to 44 years age bracket for the primary householder. A total of 2,843 households (35.2%) fall into this category. Meanwhile, the 15 to 24 years age bracket for the primary householder has the lowest median household income of $19,788, with 1,885 households (23.4%) in this group.
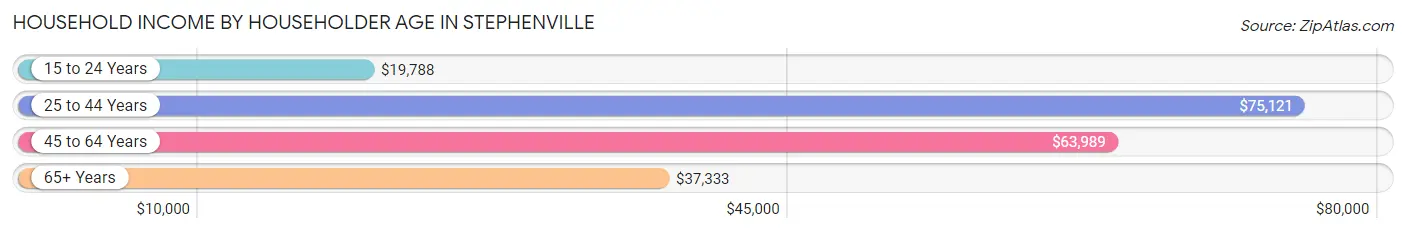
| Income Bracket | # Households | Median Income |
| 15 to 24 Years | 1,885 (23.4%) | $19,788 |
| 25 to 44 Years | 2,843 (35.2%) | $75,121 |
| 45 to 64 Years | 1,850 (22.9%) | $63,989 |
| 65+ Years | 1,494 (18.5%) | $37,333 |
| Total | 8,072 (100.0%) | $48,088 |
Poverty in Stephenville
Income Below Poverty by Sex and Age in Stephenville
With 19.6% poverty level for males and 19.6% for females among the residents of Stephenville, 18 to 24 year old males and 18 to 24 year old females are the most vulnerable to poverty, with 1,100 males (49.1%) and 1,185 females (52.8%) in their respective age groups living below the poverty level.
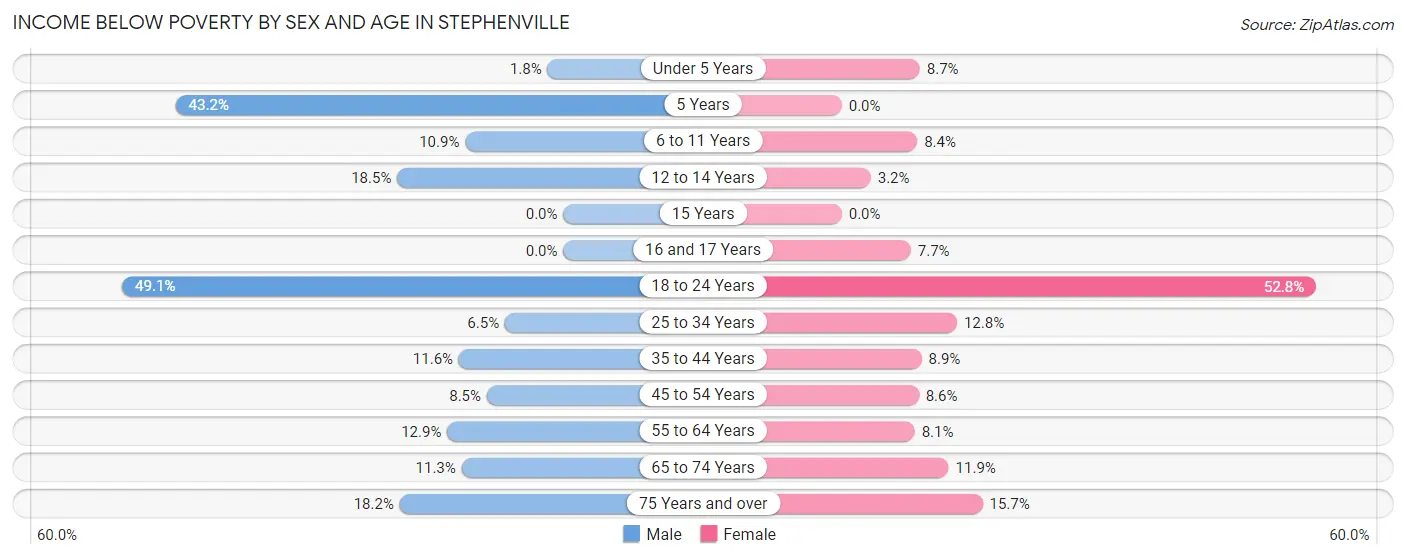
| Age Bracket | Male | Female |
| Under 5 Years | 8 (1.8%) | 53 (8.7%) |
| 5 Years | 19 (43.2%) | 0 (0.0%) |
| 6 to 11 Years | 66 (10.9%) | 45 (8.4%) |
| 12 to 14 Years | 59 (18.5%) | 16 (3.2%) |
| 15 Years | 0 (0.0%) | 0 (0.0%) |
| 16 and 17 Years | 0 (0.0%) | 19 (7.7%) |
| 18 to 24 Years | 1,100 (49.1%) | 1,185 (52.8%) |
| 25 to 34 Years | 96 (6.5%) | 211 (12.8%) |
| 35 to 44 Years | 126 (11.6%) | 78 (8.9%) |
| 45 to 54 Years | 71 (8.5%) | 74 (8.6%) |
| 55 to 64 Years | 79 (12.9%) | 63 (8.1%) |
| 65 to 74 Years | 62 (11.3%) | 85 (11.9%) |
| 75 Years and over | 45 (18.2%) | 89 (15.7%) |
| Total | 1,731 (19.6%) | 1,918 (19.6%) |
Income Above Poverty by Sex and Age in Stephenville
According to the poverty statistics in Stephenville, males aged 15 years and females aged 5 years are the age groups that are most secure financially, with 100.0% of males and 100.0% of females in these age groups living above the poverty line.
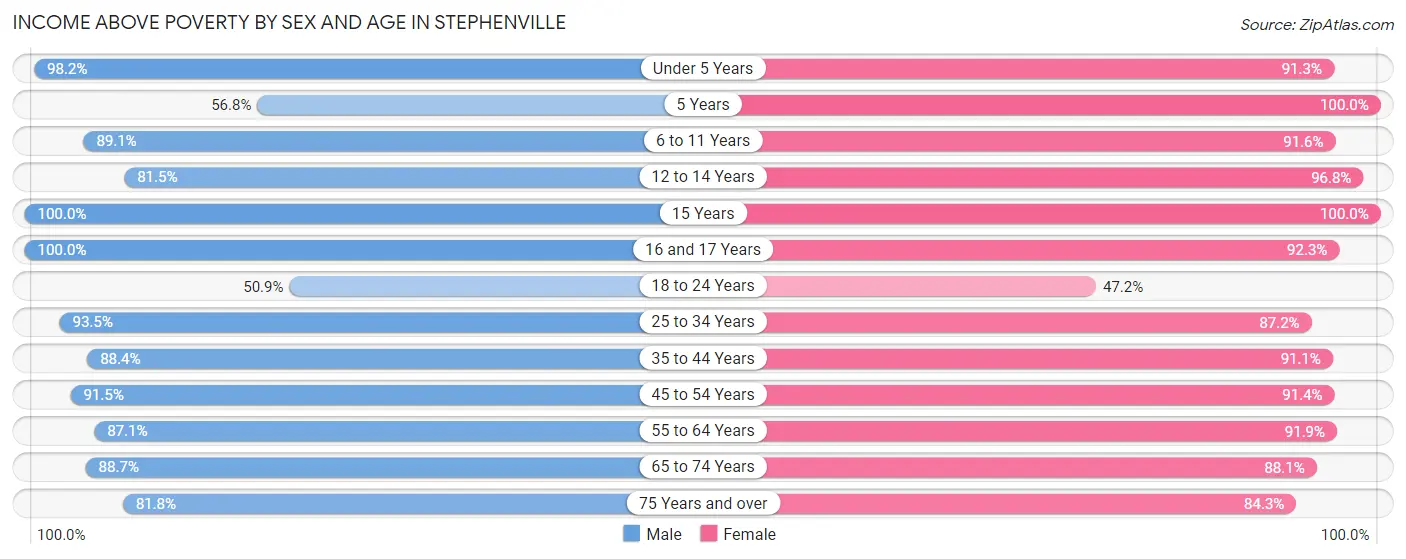
| Age Bracket | Male | Female |
| Under 5 Years | 446 (98.2%) | 557 (91.3%) |
| 5 Years | 25 (56.8%) | 93 (100.0%) |
| 6 to 11 Years | 538 (89.1%) | 491 (91.6%) |
| 12 to 14 Years | 260 (81.5%) | 480 (96.8%) |
| 15 Years | 219 (100.0%) | 131 (100.0%) |
| 16 and 17 Years | 142 (100.0%) | 228 (92.3%) |
| 18 to 24 Years | 1,139 (50.9%) | 1,059 (47.2%) |
| 25 to 34 Years | 1,380 (93.5%) | 1,434 (87.2%) |
| 35 to 44 Years | 957 (88.4%) | 799 (91.1%) |
| 45 to 54 Years | 762 (91.5%) | 789 (91.4%) |
| 55 to 64 Years | 532 (87.1%) | 713 (91.9%) |
| 65 to 74 Years | 485 (88.7%) | 629 (88.1%) |
| 75 Years and over | 202 (81.8%) | 479 (84.3%) |
| Total | 7,087 (80.4%) | 7,882 (80.4%) |
Income Below Poverty Among Married-Couple Families in Stephenville
The poverty statistics for married-couple families in Stephenville show that 2.5% or 81 of the total 3,211 families live below the poverty line. Families with 3 or 4 children have the highest poverty rate of 5.0%, comprising of 17 families. On the other hand, families with 5 or more children have the lowest poverty rate of 0.0%, which includes 0 families.

| Children | Above Poverty | Below Poverty |
| No Children | 1,510 (97.4%) | 41 (2.6%) |
| 1 or 2 Children | 1,224 (98.2%) | 23 (1.8%) |
| 3 or 4 Children | 325 (95.0%) | 17 (5.0%) |
| 5 or more Children | 71 (100.0%) | 0 (0.0%) |
| Total | 3,130 (97.5%) | 81 (2.5%) |
Income Below Poverty Among Single-Parent Households in Stephenville
According to the poverty data in Stephenville, 20.2% or 56 single-father households and 20.5% or 123 single-mother households are living below the poverty line. Among single-father households, those with no children have the highest poverty rate, with 56 households (47.1%) experiencing poverty. Likewise, among single-mother households, those with 5 or more children have the highest poverty rate, with 10 households (100.0%) falling below the poverty line.
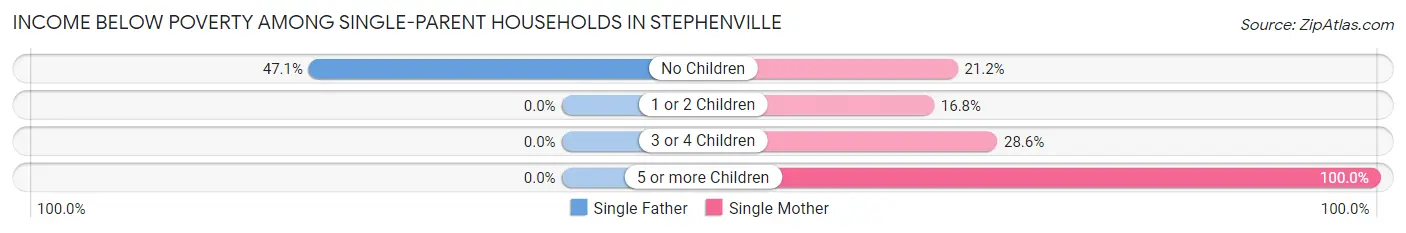
| Children | Single Father | Single Mother |
| No Children | 56 (47.1%) | 32 (21.2%) |
| 1 or 2 Children | 0 (0.0%) | 63 (16.8%) |
| 3 or 4 Children | 0 (0.0%) | 18 (28.6%) |
| 5 or more Children | 0 (0.0%) | 10 (100.0%) |
| Total | 56 (20.2%) | 123 (20.5%) |
Income Below Poverty Among Married-Couple vs Single-Parent Households in Stephenville
The poverty data for Stephenville shows that 81 of the married-couple family households (2.5%) and 179 of the single-parent households (20.4%) are living below the poverty level. Within the married-couple family households, those with 3 or 4 children have the highest poverty rate, with 17 households (5.0%) falling below the poverty line. Among the single-parent households, those with 5 or more children have the highest poverty rate, with 10 household (100.0%) living below poverty.
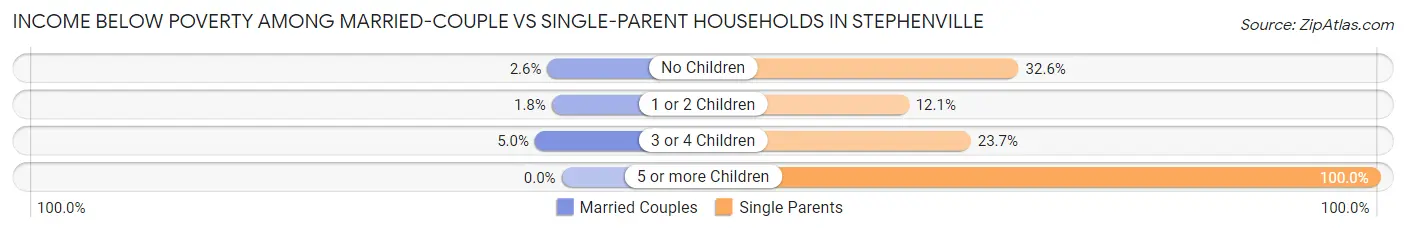
| Children | Married-Couple Families | Single-Parent Households |
| No Children | 41 (2.6%) | 88 (32.6%) |
| 1 or 2 Children | 23 (1.8%) | 63 (12.1%) |
| 3 or 4 Children | 17 (5.0%) | 18 (23.7%) |
| 5 or more Children | 0 (0.0%) | 10 (100.0%) |
| Total | 81 (2.5%) | 179 (20.4%) |
Race in Stephenville
The most populous races in Stephenville are White / Caucasian (17,030 | 81.0%), Hispanic or Latino (4,303 | 20.5%), and Two or more Races (1,616 | 7.7%).
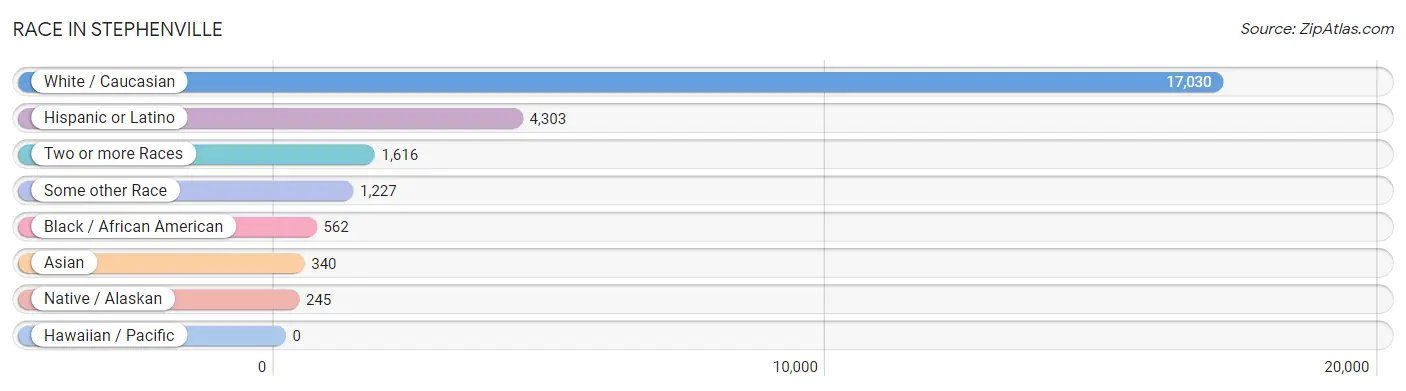
| Race | # Population | % Population |
| Asian | 340 | 1.6% |
| Black / African American | 562 | 2.7% |
| Hawaiian / Pacific | 0 | 0.0% |
| Hispanic or Latino | 4,303 | 20.5% |
| Native / Alaskan | 245 | 1.2% |
| White / Caucasian | 17,030 | 81.0% |
| Two or more Races | 1,616 | 7.7% |
| Some other Race | 1,227 | 5.8% |
| Total | 21,020 | 100.0% |
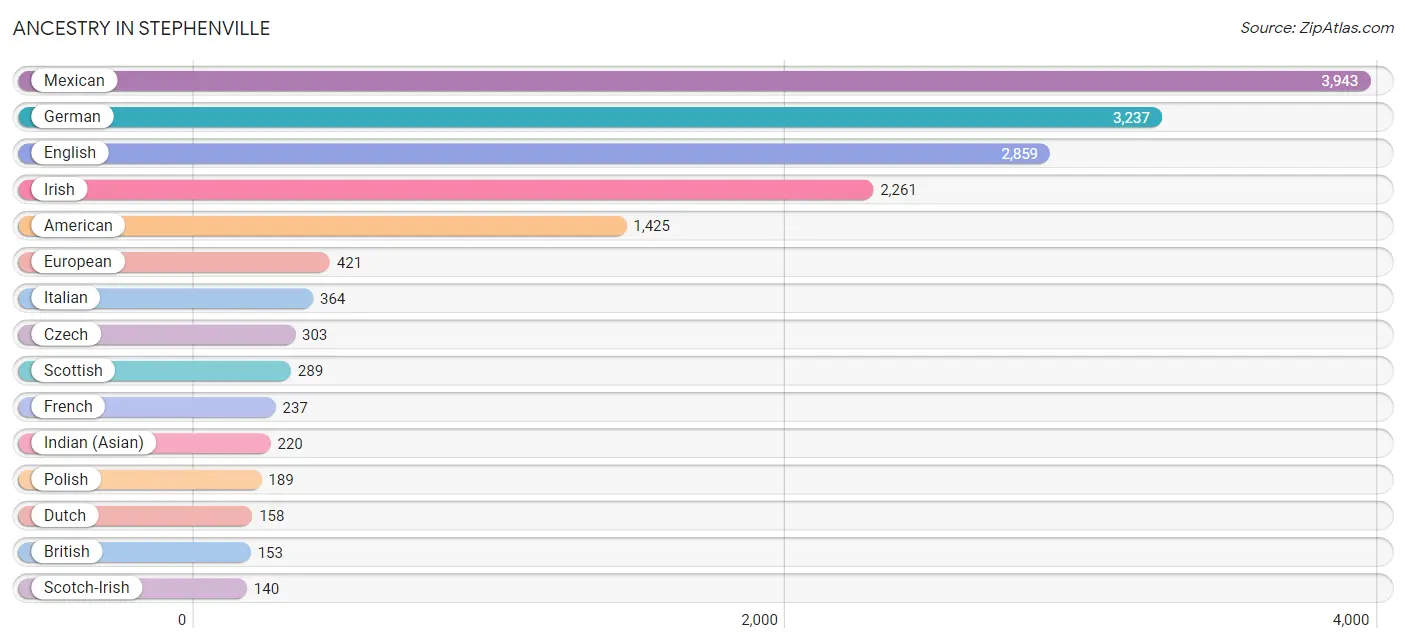
Ancestry in Stephenville
The most populous ancestries reported in Stephenville are Mexican (3,943 | 18.8%), German (3,237 | 15.4%), English (2,859 | 13.6%), Irish (2,261 | 10.8%), and American (1,425 | 6.8%), together accounting for 65.3% of all Stephenville residents.
| Ancestry | # Population | % Population |
| African | 18 | 0.1% |
| American | 1,425 | 6.8% |
| Apache | 11 | 0.1% |
| Arab | 71 | 0.3% |
| Austrian | 6 | 0.0% |
| Bhutanese | 12 | 0.1% |
| British | 153 | 0.7% |
| British West Indian | 4 | 0.0% |
| Burmese | 21 | 0.1% |
| Central American | 53 | 0.3% |
| Cherokee | 46 | 0.2% |
| Choctaw | 34 | 0.2% |
| Colombian | 12 | 0.1% |
| Costa Rican | 8 | 0.0% |
| Cuban | 13 | 0.1% |
| Czech | 303 | 1.4% |
| Danish | 32 | 0.2% |
| Dutch | 158 | 0.7% |
| English | 2,859 | 13.6% |
| European | 421 | 2.0% |
| Filipino | 6 | 0.0% |
| French | 237 | 1.1% |
| German | 3,237 | 15.4% |
| Greek | 38 | 0.2% |
| Honduran | 4 | 0.0% |
| Indian (Asian) | 220 | 1.1% |
| Irish | 2,261 | 10.8% |
| Italian | 364 | 1.7% |
| Jordanian | 21 | 0.1% |
| Korean | 86 | 0.4% |
| Lebanese | 50 | 0.2% |
| Lithuanian | 33 | 0.2% |
| Malaysian | 3 | 0.0% |
| Mexican | 3,943 | 18.8% |
| Nigerian | 14 | 0.1% |
| Northern European | 70 | 0.3% |
| Norwegian | 101 | 0.5% |
| Panamanian | 14 | 0.1% |
| Pennsylvania German | 11 | 0.1% |
| Polish | 189 | 0.9% |
| Portuguese | 33 | 0.2% |
| Puerto Rican | 68 | 0.3% |
| Russian | 73 | 0.4% |
| Salvadoran | 27 | 0.1% |
| Scandinavian | 96 | 0.5% |
| Scotch-Irish | 140 | 0.7% |
| Scottish | 289 | 1.4% |
| Sioux | 59 | 0.3% |
| Slovene | 32 | 0.2% |
| South African | 10 | 0.1% |
| South American | 12 | 0.1% |
| Spaniard | 19 | 0.1% |
| Spanish | 34 | 0.2% |
| Sri Lankan | 35 | 0.2% |
| Subsaharan African | 38 | 0.2% |
| Swedish | 38 | 0.2% |
| Thai | 9 | 0.0% |
| Welsh | 78 | 0.4% | View All 58 Rows |
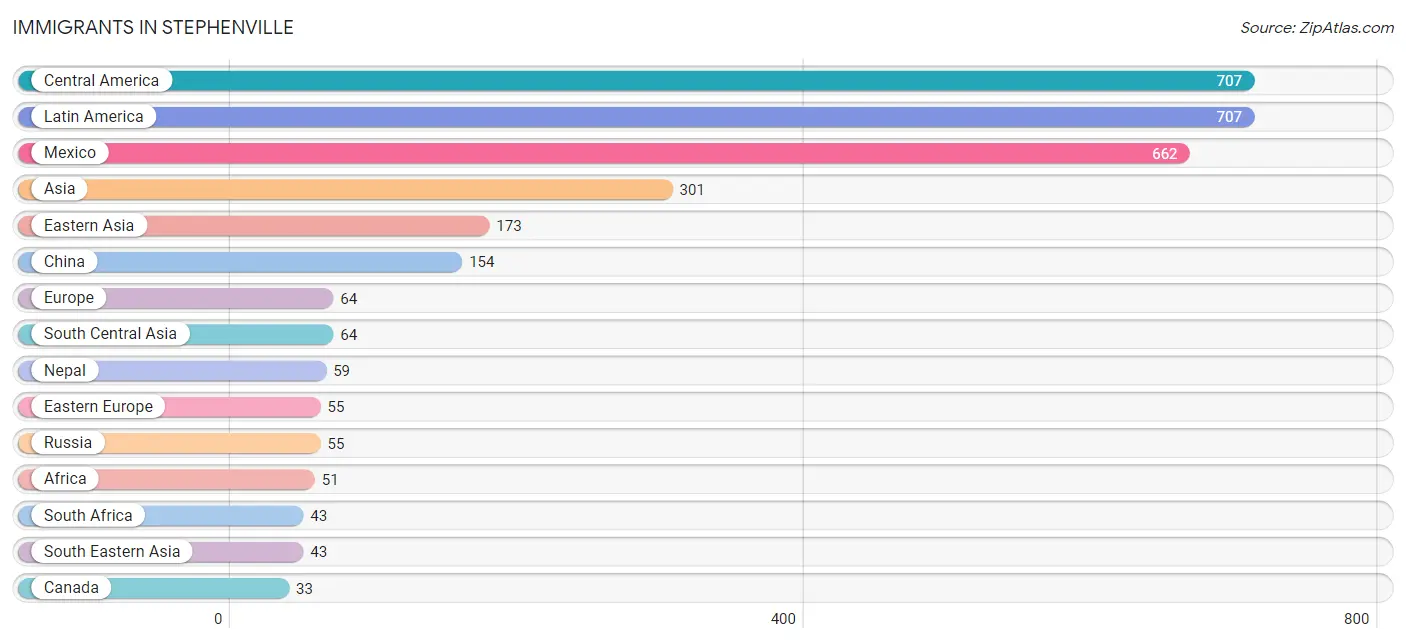
Immigrants in Stephenville
The most numerous immigrant groups reported in Stephenville came from Central America (707 | 3.4%), Latin America (707 | 3.4%), Mexico (662 | 3.2%), Asia (301 | 1.4%), and Eastern Asia (173 | 0.8%), together accounting for 12.1% of all Stephenville residents.
| Immigration Origin | # Population | % Population |
| Africa | 51 | 0.2% |
| Asia | 301 | 1.4% |
| Canada | 33 | 0.2% |
| Central America | 707 | 3.4% |
| China | 154 | 0.7% |
| Eastern Africa | 4 | 0.0% |
| Eastern Asia | 173 | 0.8% |
| Eastern Europe | 55 | 0.3% |
| El Salvador | 27 | 0.1% |
| England | 9 | 0.0% |
| Europe | 64 | 0.3% |
| Honduras | 4 | 0.0% |
| India | 5 | 0.0% |
| Japan | 11 | 0.1% |
| Korea | 8 | 0.0% |
| Kuwait | 21 | 0.1% |
| Laos | 3 | 0.0% |
| Latin America | 707 | 3.4% |
| Malaysia | 6 | 0.0% |
| Mexico | 662 | 3.2% |
| Nepal | 59 | 0.3% |
| Nigeria | 4 | 0.0% |
| Northern Europe | 9 | 0.0% |
| Panama | 14 | 0.1% |
| Philippines | 17 | 0.1% |
| Russia | 55 | 0.3% |
| South Africa | 43 | 0.2% |
| South Central Asia | 64 | 0.3% |
| South Eastern Asia | 43 | 0.2% |
| Thailand | 7 | 0.0% |
| Vietnam | 10 | 0.1% |
| Western Africa | 4 | 0.0% |
| Western Asia | 21 | 0.1% |
| Zimbabwe | 4 | 0.0% | View All 34 Rows |
Sex and Age in Stephenville
Sex and Age in Stephenville
The most populous age groups in Stephenville are 20 to 24 Years (2,097 | 21.3%) for men and 20 to 24 Years (2,128 | 19.1%) for women.
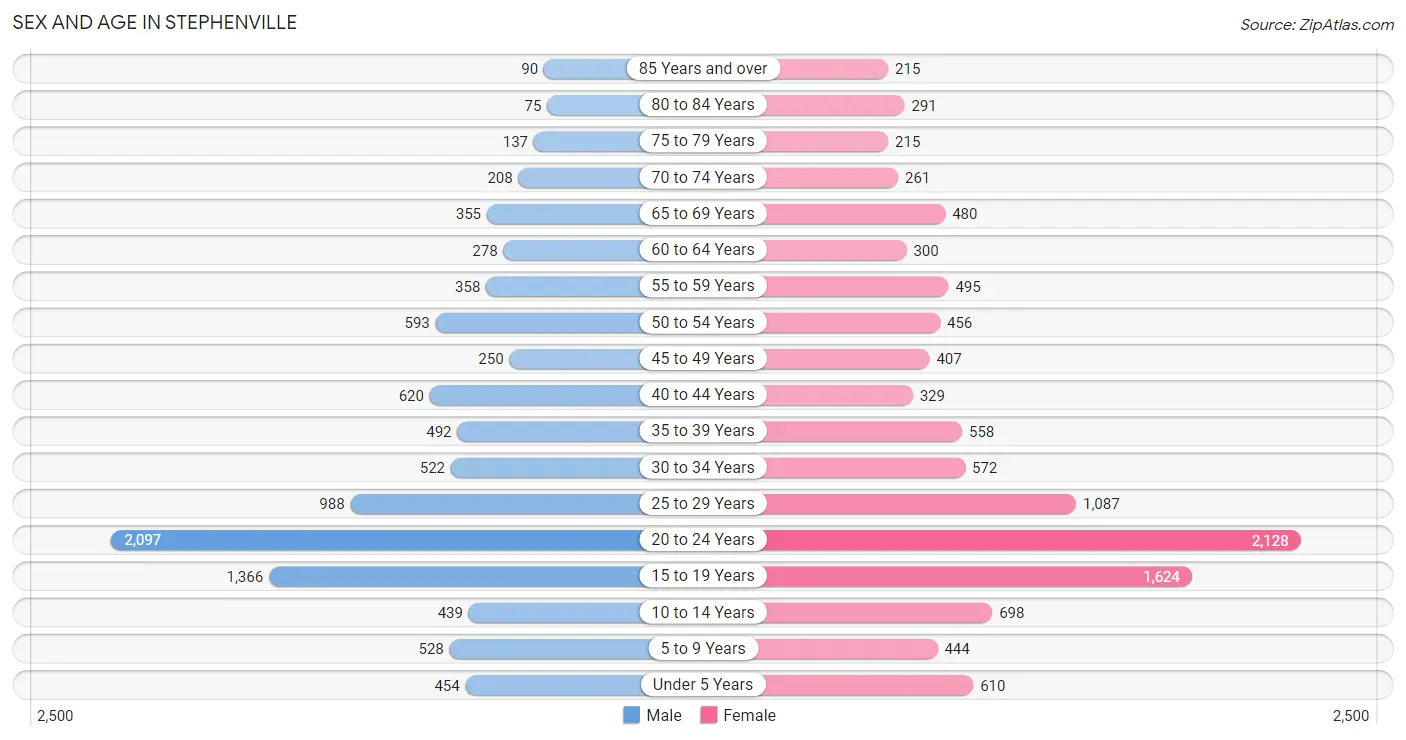
| Age Bracket | Male | Female |
| Under 5 Years | 454 (4.6%) | 610 (5.5%) |
| 5 to 9 Years | 528 (5.4%) | 444 (4.0%) |
| 10 to 14 Years | 439 (4.5%) | 698 (6.2%) |
| 15 to 19 Years | 1,366 (13.9%) | 1,624 (14.5%) |
| 20 to 24 Years | 2,097 (21.3%) | 2,128 (19.1%) |
| 25 to 29 Years | 988 (10.0%) | 1,087 (9.7%) |
| 30 to 34 Years | 522 (5.3%) | 572 (5.1%) |
| 35 to 39 Years | 492 (5.0%) | 558 (5.0%) |
| 40 to 44 Years | 620 (6.3%) | 329 (2.9%) |
| 45 to 49 Years | 250 (2.5%) | 407 (3.6%) |
| 50 to 54 Years | 593 (6.0%) | 456 (4.1%) |
| 55 to 59 Years | 358 (3.6%) | 495 (4.4%) |
| 60 to 64 Years | 278 (2.8%) | 300 (2.7%) |
| 65 to 69 Years | 355 (3.6%) | 480 (4.3%) |
| 70 to 74 Years | 208 (2.1%) | 261 (2.3%) |
| 75 to 79 Years | 137 (1.4%) | 215 (1.9%) |
| 80 to 84 Years | 75 (0.8%) | 291 (2.6%) |
| 85 Years and over | 90 (0.9%) | 215 (1.9%) |
| Total | 9,850 (100.0%) | 11,170 (100.0%) |
Families and Households in Stephenville
Median Family Size in Stephenville
The median family size in Stephenville is 3.06 persons per family, with single female/mother families (599 | 14.7%) accounting for the largest median family size of 3.34 persons per family. On the other hand, single male/father families (277 | 6.8%) represent the smallest median family size with 2.65 persons per family.
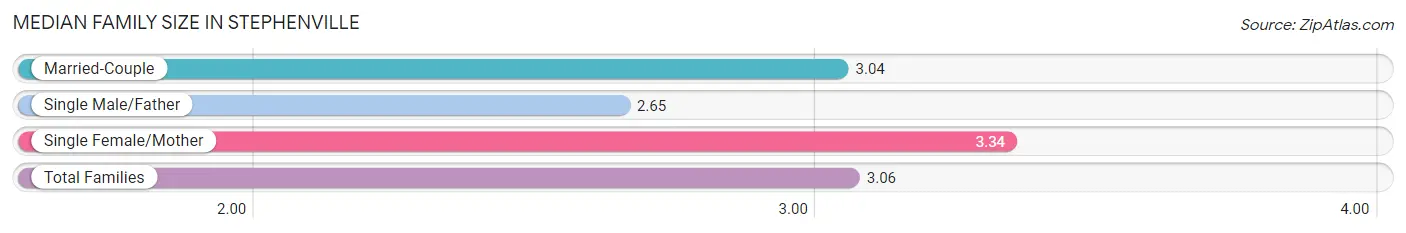
| Family Type | # Families | Family Size |
| Married-Couple | 3,211 (78.6%) | 3.04 |
| Single Male/Father | 277 (6.8%) | 2.65 |
| Single Female/Mother | 599 (14.7%) | 3.34 |
| Total Families | 4,087 (100.0%) | 3.06 |
Median Household Size in Stephenville
The median household size in Stephenville is 2.28 persons per household, with single female/mother households (599 | 7.4%) accounting for the largest median household size of 3.68 persons per household. non-family households (3,985 | 49.4%) represent the smallest median household size with 1.40 persons per household.
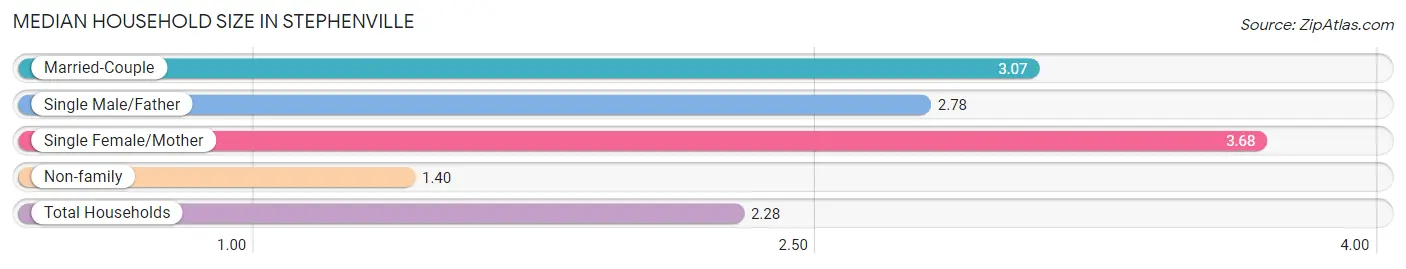
| Household Type | # Households | Household Size |
| Married-Couple | 3,211 (39.8%) | 3.07 |
| Single Male/Father | 277 (3.4%) | 2.78 |
| Single Female/Mother | 599 (7.4%) | 3.68 |
| Non-family | 3,985 (49.4%) | 1.40 |
| Total Households | 8,072 (100.0%) | 2.28 |
Household Size by Marriage Status in Stephenville
Out of a total of 8,072 households in Stephenville, 4,087 (50.6%) are family households, while 3,985 (49.4%) are nonfamily households. The most numerous type of family households are 2-person households, comprising 1,508, and the most common type of nonfamily households are 1-person households, comprising 2,714.
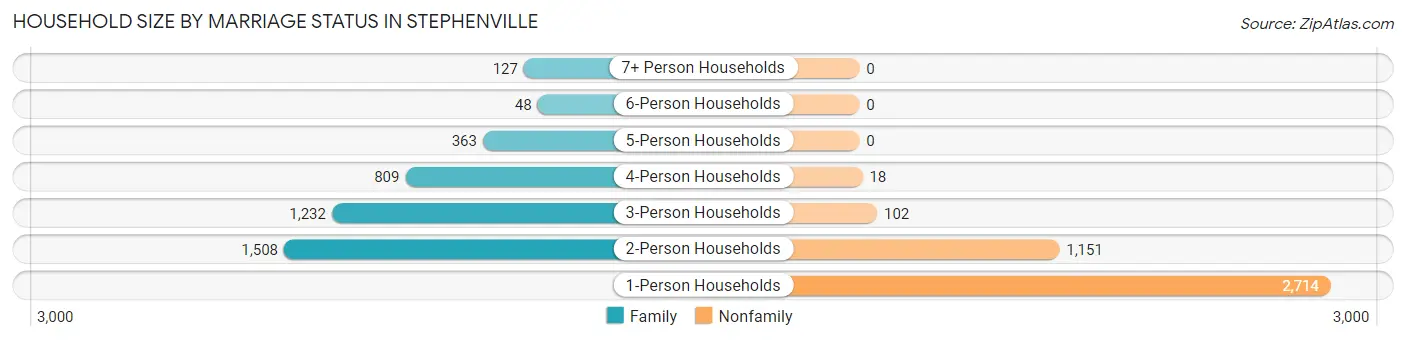
| Household Size | Family Households | Nonfamily Households |
| 1-Person Households | - | 2,714 (33.6%) |
| 2-Person Households | 1,508 (18.7%) | 1,151 (14.3%) |
| 3-Person Households | 1,232 (15.3%) | 102 (1.3%) |
| 4-Person Households | 809 (10.0%) | 18 (0.2%) |
| 5-Person Households | 363 (4.5%) | 0 (0.0%) |
| 6-Person Households | 48 (0.6%) | 0 (0.0%) |
| 7+ Person Households | 127 (1.6%) | 0 (0.0%) |
| Total | 4,087 (50.6%) | 3,985 (49.4%) |
Female Fertility in Stephenville
Fertility by Age in Stephenville
Average fertility rate in Stephenville is 50.0 births per 1,000 women. Women in the age bracket of 20 to 34 years have the highest fertility rate with 78.0 births per 1,000 women. Women in the age bracket of 20 to 34 years acount for 88.7% of all women with births.
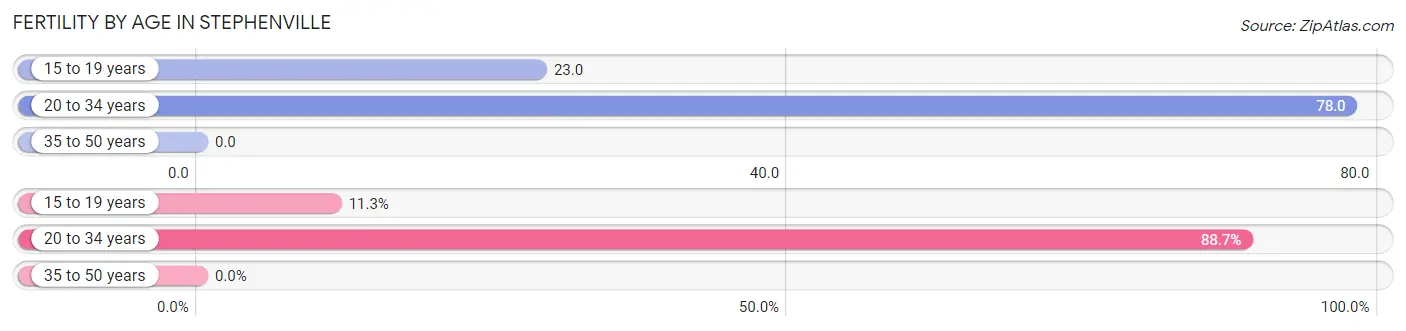
| Age Bracket | Women with Births | Births / 1,000 Women |
| 15 to 19 years | 38 (11.3%) | 23.0 |
| 20 to 34 years | 297 (88.7%) | 78.0 |
| 35 to 50 years | 0 (0.0%) | 0.0 |
| Total | 335 (100.0%) | 50.0 |
Fertility by Age by Marriage Status in Stephenville
68.1% of women with births (335) in Stephenville are married. The highest percentage of unmarried women with births falls into 15 to 19 years age bracket with 100.0% of them unmarried at the time of birth, while the lowest percentage of unmarried women with births belong to 20 to 34 years age bracket with 23.2% of them unmarried.
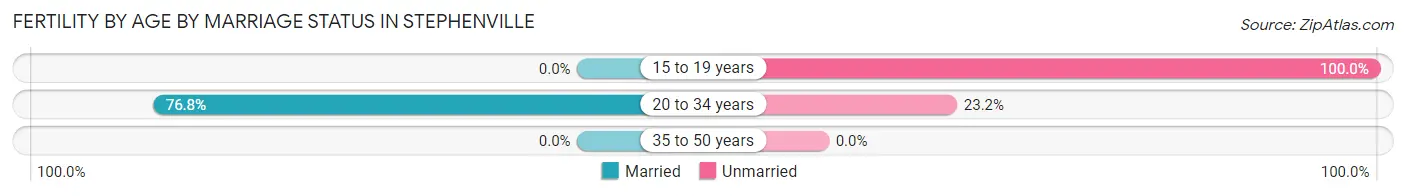
| Age Bracket | Married | Unmarried |
| 15 to 19 years | 0 (0.0%) | 38 (100.0%) |
| 20 to 34 years | 228 (76.8%) | 69 (23.2%) |
| 35 to 50 years | 0 (0.0%) | 0 (0.0%) |
| Total | 228 (68.1%) | 107 (31.9%) |
Fertility by Education in Stephenville
Average fertility rate in Stephenville is 50.0 births per 1,000 women. Women with the education attainment of bachelor's degree have the highest fertility rate of 83.0 births per 1,000 women, while women with the education attainment of college or associate's degree have the lowest fertility at 32.0 births per 1,000 women. Women with the education attainment of high school diploma represent 32.2% of all women with births.
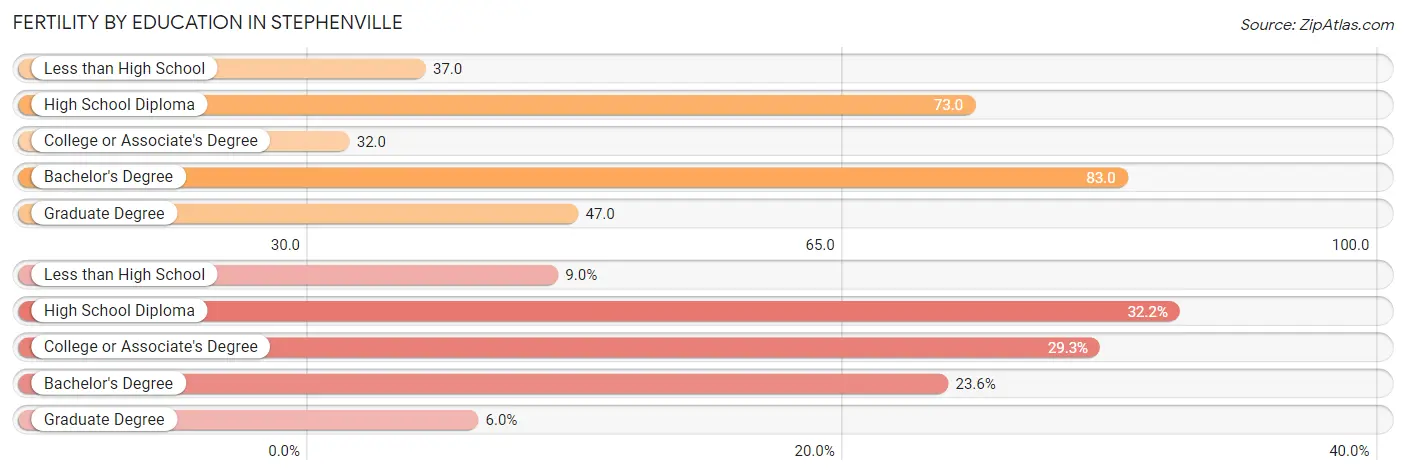
| Educational Attainment | Women with Births | Births / 1,000 Women |
| Less than High School | 30 (9.0%) | 37.0 |
| High School Diploma | 108 (32.2%) | 73.0 |
| College or Associate's Degree | 98 (29.2%) | 32.0 |
| Bachelor's Degree | 79 (23.6%) | 83.0 |
| Graduate Degree | 20 (6.0%) | 47.0 |
| Total | 335 (100.0%) | 50.0 |
Fertility by Education by Marriage Status in Stephenville
31.9% of women with births in Stephenville are unmarried. Women with the educational attainment of less than high school are most likely to be married with 100.0% of them married at childbirth, while women with the educational attainment of high school diploma are least likely to be married with 67.6% of them unmarried at childbirth.
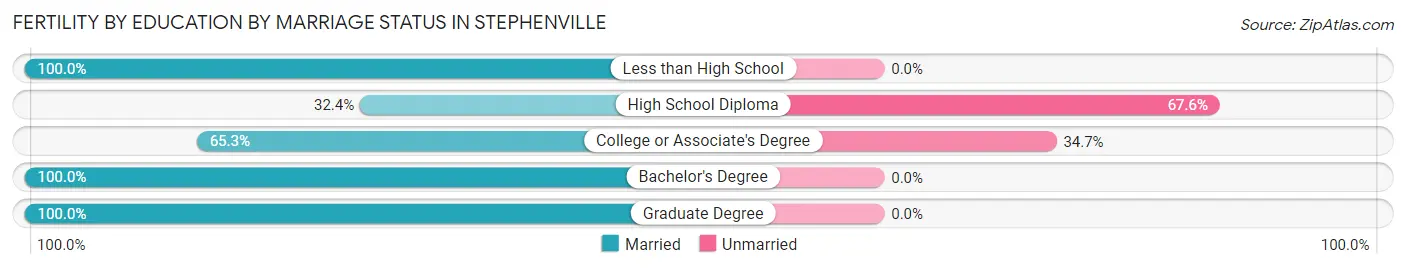
| Educational Attainment | Married | Unmarried |
| Less than High School | 30 (100.0%) | 0 (0.0%) |
| High School Diploma | 35 (32.4%) | 73 (67.6%) |
| College or Associate's Degree | 64 (65.3%) | 34 (34.7%) |
| Bachelor's Degree | 79 (100.0%) | 0 (0.0%) |
| Graduate Degree | 20 (100.0%) | 0 (0.0%) |
| Total | 228 (68.1%) | 107 (31.9%) |
Employment Characteristics in Stephenville
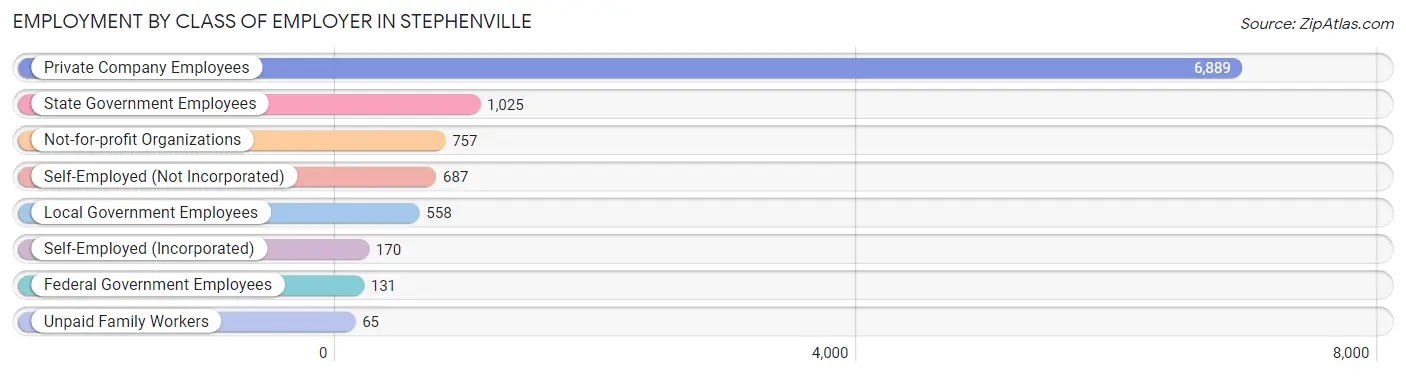
Employment by Class of Employer in Stephenville
Among the 10,282 employed individuals in Stephenville, private company employees (6,889 | 67.0%), state government employees (1,025 | 10.0%), and not-for-profit organizations (757 | 7.4%) make up the most common classes of employment.
| Employer Class | # Employees | % Employees |
| Private Company Employees | 6,889 | 67.0% |
| Self-Employed (Incorporated) | 170 | 1.7% |
| Self-Employed (Not Incorporated) | 687 | 6.7% |
| Not-for-profit Organizations | 757 | 7.4% |
| Local Government Employees | 558 | 5.4% |
| State Government Employees | 1,025 | 10.0% |
| Federal Government Employees | 131 | 1.3% |
| Unpaid Family Workers | 65 | 0.6% |
| Total | 10,282 | 100.0% |
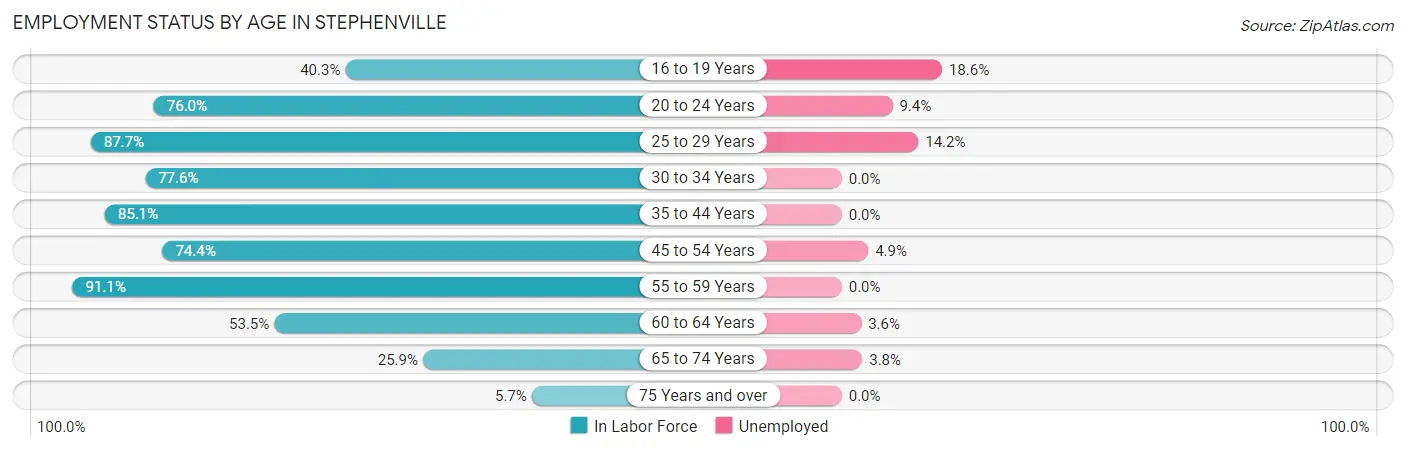
Employment Status by Age in Stephenville
According to the labor force statistics for Stephenville, out of the total population over 16 years of age (17,481), 65.2% or 11,398 individuals are in the labor force, with 7.4% or 843 of them unemployed. The age group with the highest labor force participation rate is 55 to 59 years, with 91.1% or 777 individuals in the labor force. Within the labor force, the 16 to 19 years age range has the highest percentage of unemployed individuals, with 18.6% or 197 of them being unemployed.
| Age Bracket | In Labor Force | Unemployed |
| 16 to 19 Years | 1,057 (40.3%) | 197 (18.6%) |
| 20 to 24 Years | 3,211 (76.0%) | 302 (9.4%) |
| 25 to 29 Years | 1,820 (87.7%) | 258 (14.2%) |
| 30 to 34 Years | 849 (77.6%) | 0 (0.0%) |
| 35 to 44 Years | 1,701 (85.1%) | 0 (0.0%) |
| 45 to 54 Years | 1,269 (74.4%) | 62 (4.9%) |
| 55 to 59 Years | 777 (91.1%) | 0 (0.0%) |
| 60 to 64 Years | 309 (53.5%) | 11 (3.6%) |
| 65 to 74 Years | 338 (25.9%) | 13 (3.8%) |
| 75 Years and over | 58 (5.7%) | 0 (0.0%) |
| Total | 11,398 (65.2%) | 843 (7.4%) |
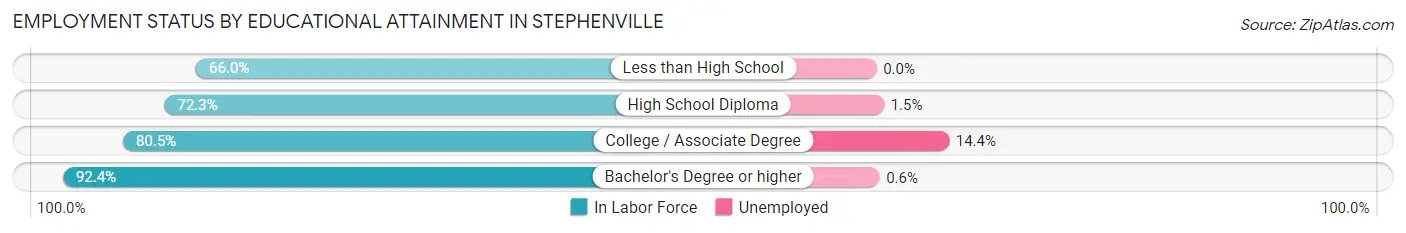
Employment Status by Educational Attainment in Stephenville
According to labor force statistics for Stephenville, 81.0% of individuals (6,727) out of the total population between 25 and 64 years of age (8,305) are in the labor force, with 4.9% or 330 of them being unemployed. The group with the highest labor force participation rate are those with the educational attainment of bachelor's degree or higher, with 92.4% or 2,636 individuals in the labor force. Within the labor force, individuals with college / associate degree education have the highest percentage of unemployment, with 14.4% or 293 of them being unemployed.
| Educational Attainment | In Labor Force | Unemployed |
| Less than High School | 613 (66.0%) | 0 (0.0%) |
| High School Diploma | 1,442 (72.3%) | 30 (1.5%) |
| College / Associate Degree | 2,036 (80.5%) | 364 (14.4%) |
| Bachelor's Degree or higher | 2,636 (92.4%) | 17 (0.6%) |
| Total | 6,727 (81.0%) | 407 (4.9%) |
Employment Occupations by Sex in Stephenville
Management, Business, Science and Arts Occupations
The most common Management, Business, Science and Arts occupations in Stephenville are Community & Social Service (1,438 | 13.6%), Education Instruction & Library (996 | 9.5%), Management (718 | 6.8%), Computers, Engineering & Science (505 | 4.8%), and Business & Financial (457 | 4.3%).
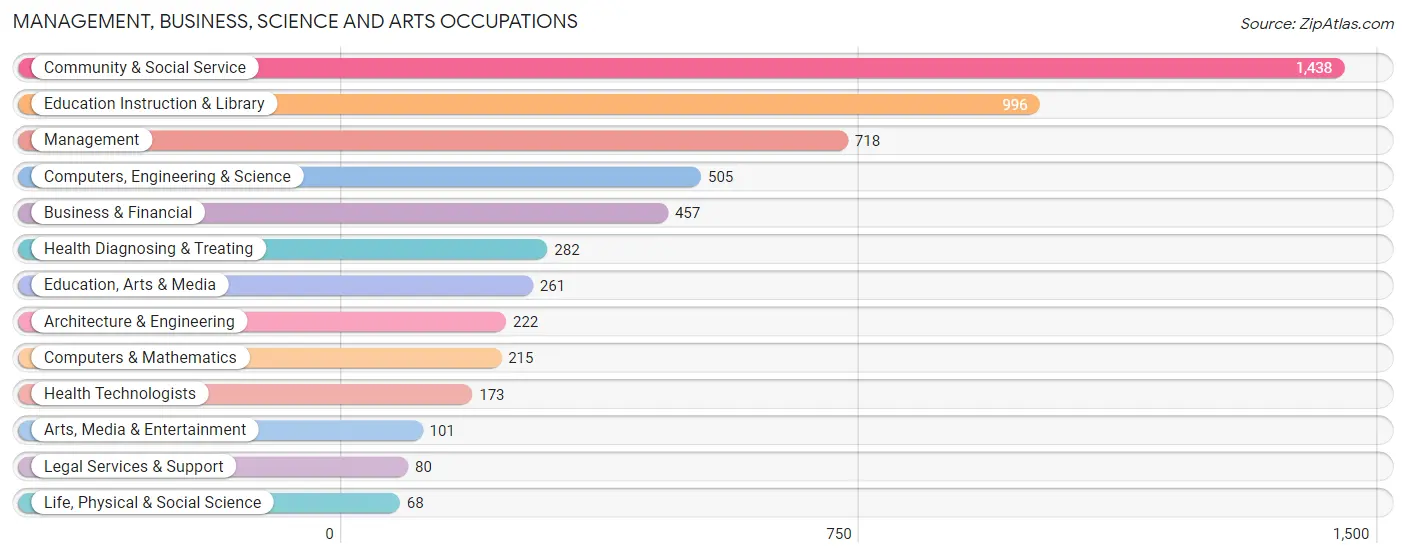
Management, Business, Science and Arts Occupations by Sex
Within the Management, Business, Science and Arts occupations in Stephenville, the most male-oriented occupations are Architecture & Engineering (100.0%), Computers & Mathematics (91.2%), and Computers, Engineering & Science (91.1%), while the most female-oriented occupations are Legal Services & Support (100.0%), Health Technologists (85.0%), and Health Diagnosing & Treating (83.0%).
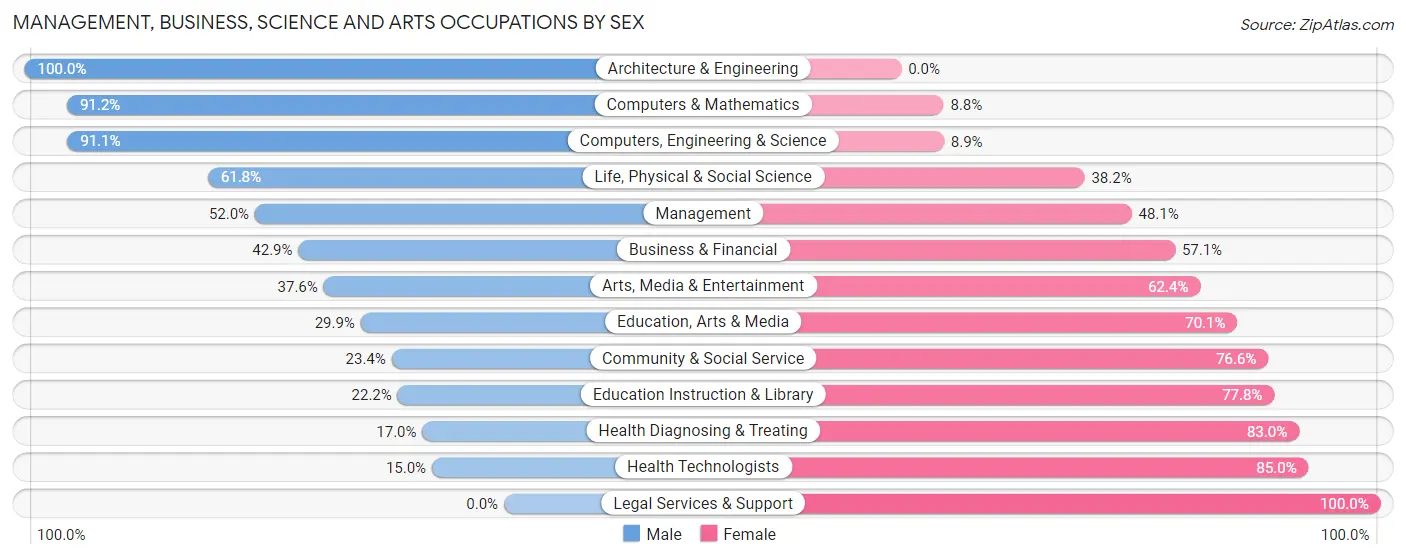
| Occupation | Male | Female |
| Management | 373 (51.9%) | 345 (48.0%) |
| Business & Financial | 196 (42.9%) | 261 (57.1%) |
| Computers, Engineering & Science | 460 (91.1%) | 45 (8.9%) |
| Computers & Mathematics | 196 (91.2%) | 19 (8.8%) |
| Architecture & Engineering | 222 (100.0%) | 0 (0.0%) |
| Life, Physical & Social Science | 42 (61.8%) | 26 (38.2%) |
| Community & Social Service | 337 (23.4%) | 1,101 (76.6%) |
| Education, Arts & Media | 78 (29.9%) | 183 (70.1%) |
| Legal Services & Support | 0 (0.0%) | 80 (100.0%) |
| Education Instruction & Library | 221 (22.2%) | 775 (77.8%) |
| Arts, Media & Entertainment | 38 (37.6%) | 63 (62.4%) |
| Health Diagnosing & Treating | 48 (17.0%) | 234 (83.0%) |
| Health Technologists | 26 (15.0%) | 147 (85.0%) |
| Total (Category) | 1,414 (41.6%) | 1,986 (58.4%) |
| Total (Overall) | 5,486 (52.0%) | 5,055 (48.0%) |
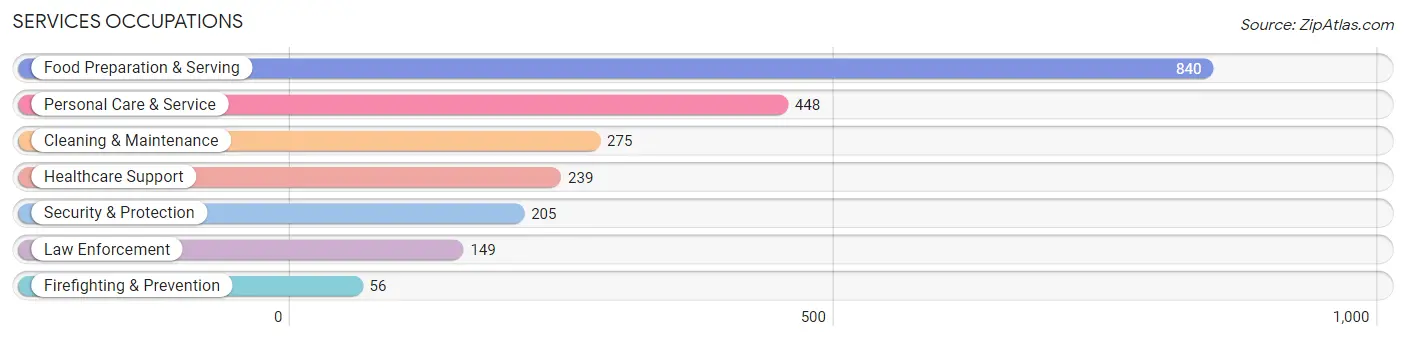
Services Occupations
The most common Services occupations in Stephenville are Food Preparation & Serving (840 | 8.0%), Personal Care & Service (448 | 4.3%), Cleaning & Maintenance (275 | 2.6%), Healthcare Support (239 | 2.3%), and Security & Protection (205 | 1.9%).
Services Occupations by Sex
Within the Services occupations in Stephenville, the most male-oriented occupations are Firefighting & Prevention (94.6%), Cleaning & Maintenance (78.5%), and Security & Protection (68.8%), while the most female-oriented occupations are Personal Care & Service (88.8%), Healthcare Support (77.8%), and Food Preparation & Serving (68.9%).
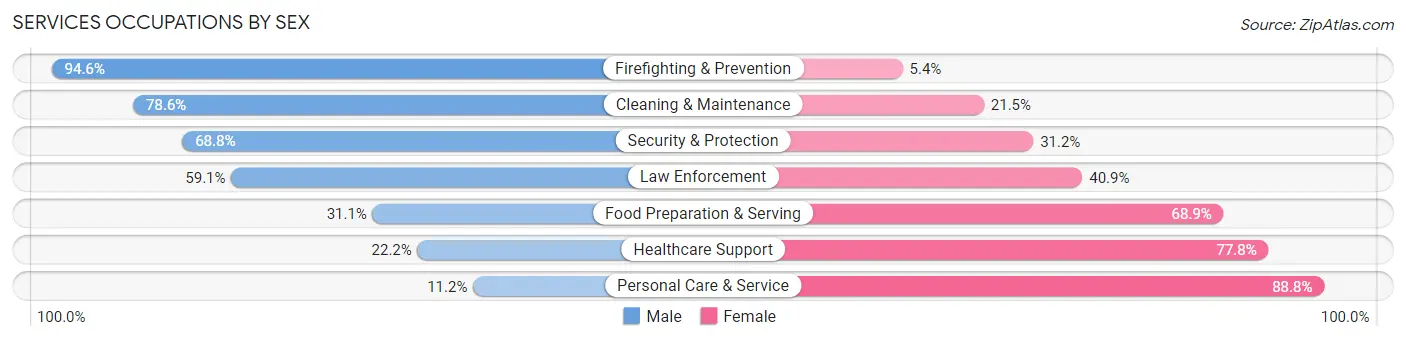
| Occupation | Male | Female |
| Healthcare Support | 53 (22.2%) | 186 (77.8%) |
| Security & Protection | 141 (68.8%) | 64 (31.2%) |
| Firefighting & Prevention | 53 (94.6%) | 3 (5.4%) |
| Law Enforcement | 88 (59.1%) | 61 (40.9%) |
| Food Preparation & Serving | 261 (31.1%) | 579 (68.9%) |
| Cleaning & Maintenance | 216 (78.5%) | 59 (21.4%) |
| Personal Care & Service | 50 (11.2%) | 398 (88.8%) |
| Total (Category) | 721 (35.9%) | 1,286 (64.1%) |
| Total (Overall) | 5,486 (52.0%) | 5,055 (48.0%) |
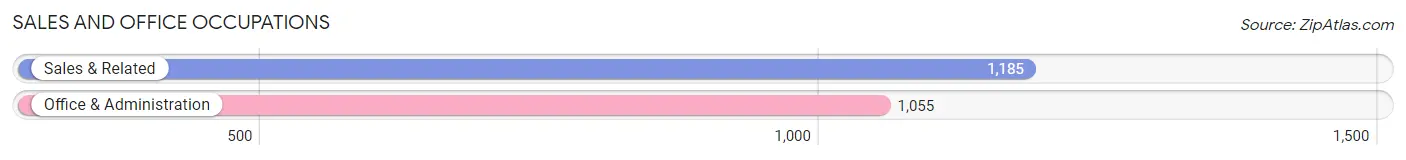
Sales and Office Occupations
The most common Sales and Office occupations in Stephenville are Sales & Related (1,185 | 11.2%), and Office & Administration (1,055 | 10.0%).
Sales and Office Occupations by Sex
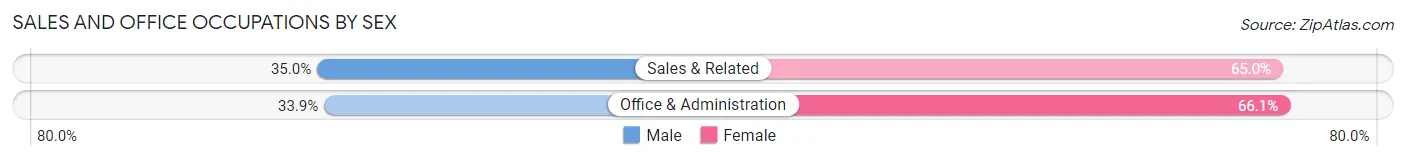
| Occupation | Male | Female |
| Sales & Related | 415 (35.0%) | 770 (65.0%) |
| Office & Administration | 358 (33.9%) | 697 (66.1%) |
| Total (Category) | 773 (34.5%) | 1,467 (65.5%) |
| Total (Overall) | 5,486 (52.0%) | 5,055 (48.0%) |
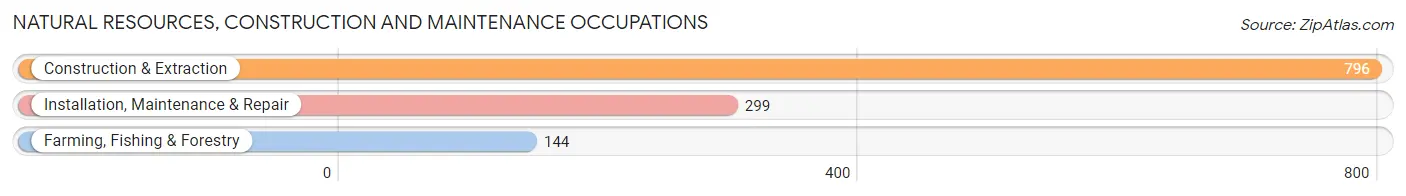
Natural Resources, Construction and Maintenance Occupations
The most common Natural Resources, Construction and Maintenance occupations in Stephenville are Construction & Extraction (796 | 7.5%), Installation, Maintenance & Repair (299 | 2.8%), and Farming, Fishing & Forestry (144 | 1.4%).
Natural Resources, Construction and Maintenance Occupations by Sex
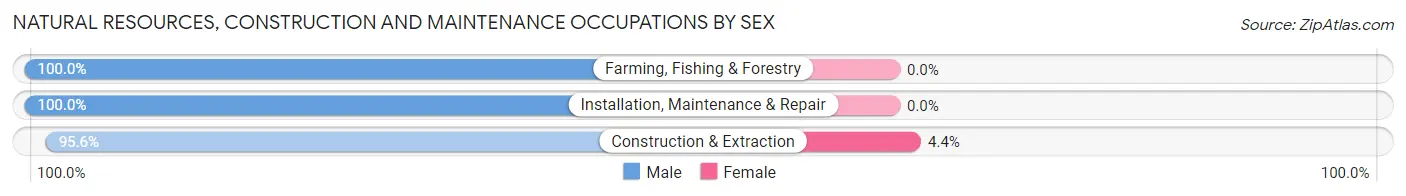
| Occupation | Male | Female |
| Farming, Fishing & Forestry | 144 (100.0%) | 0 (0.0%) |
| Construction & Extraction | 761 (95.6%) | 35 (4.4%) |
| Installation, Maintenance & Repair | 299 (100.0%) | 0 (0.0%) |
| Total (Category) | 1,204 (97.2%) | 35 (2.8%) |
| Total (Overall) | 5,486 (52.0%) | 5,055 (48.0%) |
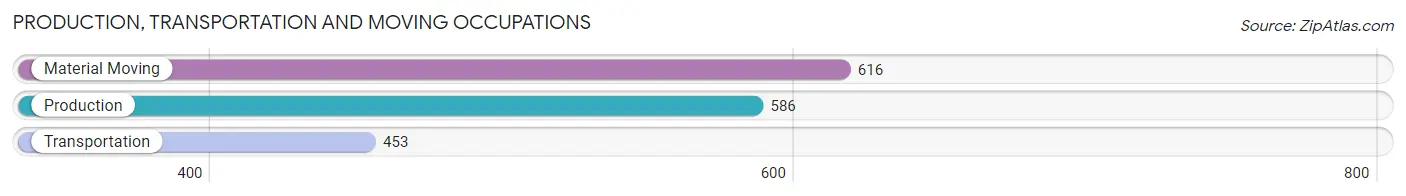
Production, Transportation and Moving Occupations
The most common Production, Transportation and Moving occupations in Stephenville are Material Moving (616 | 5.8%), Production (586 | 5.6%), and Transportation (453 | 4.3%).
Production, Transportation and Moving Occupations by Sex
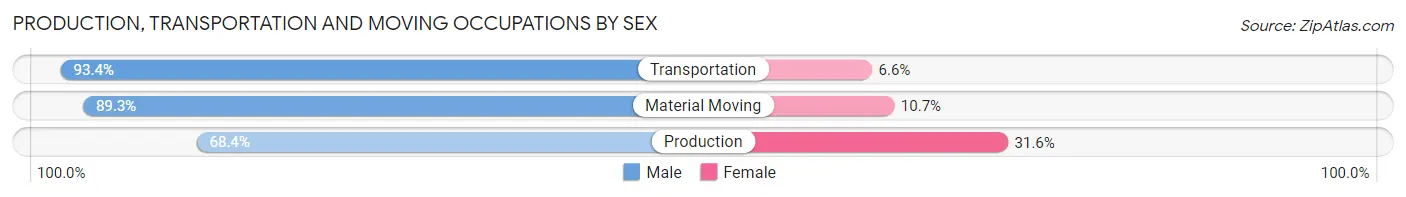
| Occupation | Male | Female |
| Production | 401 (68.4%) | 185 (31.6%) |
| Transportation | 423 (93.4%) | 30 (6.6%) |
| Material Moving | 550 (89.3%) | 66 (10.7%) |
| Total (Category) | 1,374 (83.0%) | 281 (17.0%) |
| Total (Overall) | 5,486 (52.0%) | 5,055 (48.0%) |
Employment Industries by Sex in Stephenville
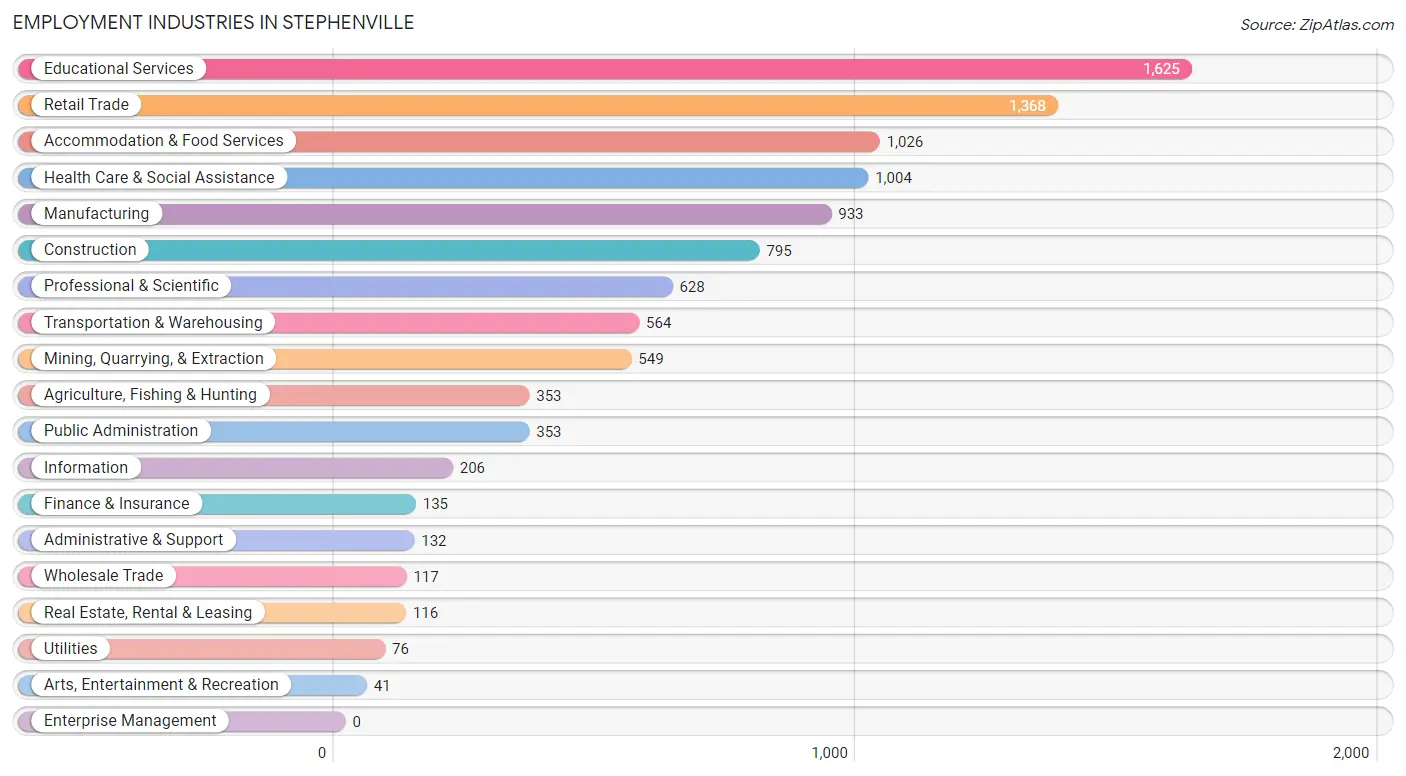
Employment Industries in Stephenville
The major employment industries in Stephenville include Educational Services (1,625 | 15.4%), Retail Trade (1,368 | 13.0%), Accommodation & Food Services (1,026 | 9.7%), Health Care & Social Assistance (1,004 | 9.5%), and Manufacturing (933 | 8.8%).
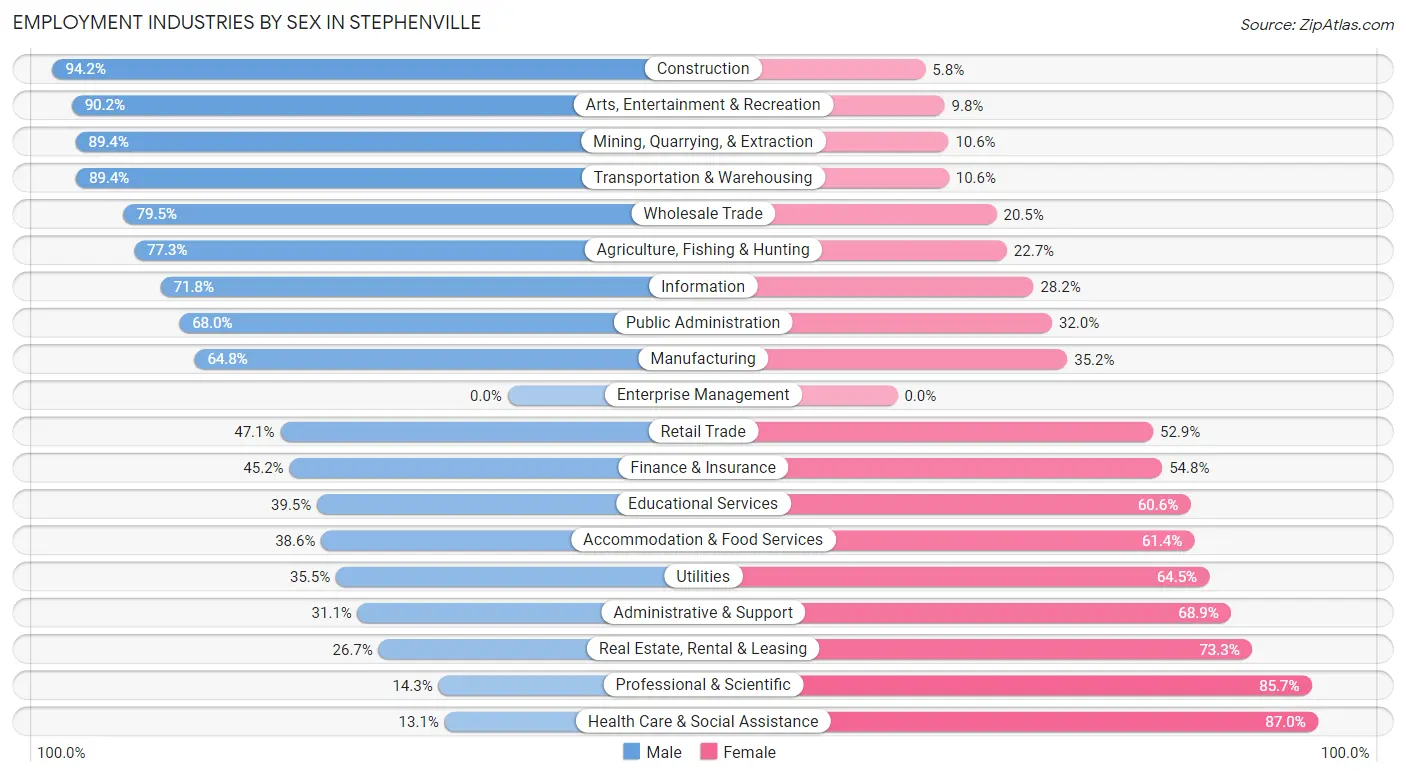
Employment Industries by Sex in Stephenville
The Stephenville industries that see more men than women are Construction (94.2%), Arts, Entertainment & Recreation (90.2%), and Mining, Quarrying, & Extraction (89.4%), whereas the industries that tend to have a higher number of women are Health Care & Social Assistance (87.0%), Professional & Scientific (85.7%), and Real Estate, Rental & Leasing (73.3%).
| Industry | Male | Female |
| Agriculture, Fishing & Hunting | 273 (77.3%) | 80 (22.7%) |
| Mining, Quarrying, & Extraction | 491 (89.4%) | 58 (10.6%) |
| Construction | 749 (94.2%) | 46 (5.8%) |
| Manufacturing | 605 (64.8%) | 328 (35.2%) |
| Wholesale Trade | 93 (79.5%) | 24 (20.5%) |
| Retail Trade | 644 (47.1%) | 724 (52.9%) |
| Transportation & Warehousing | 504 (89.4%) | 60 (10.6%) |
| Utilities | 27 (35.5%) | 49 (64.5%) |
| Information | 148 (71.8%) | 58 (28.2%) |
| Finance & Insurance | 61 (45.2%) | 74 (54.8%) |
| Real Estate, Rental & Leasing | 31 (26.7%) | 85 (73.3%) |
| Professional & Scientific | 90 (14.3%) | 538 (85.7%) |
| Enterprise Management | 0 (0.0%) | 0 (0.0%) |
| Administrative & Support | 41 (31.1%) | 91 (68.9%) |
| Educational Services | 641 (39.5%) | 984 (60.6%) |
| Health Care & Social Assistance | 131 (13.1%) | 873 (87.0%) |
| Arts, Entertainment & Recreation | 37 (90.2%) | 4 (9.8%) |
| Accommodation & Food Services | 396 (38.6%) | 630 (61.4%) |
| Public Administration | 240 (68.0%) | 113 (32.0%) |
| Total | 5,486 (52.0%) | 5,055 (48.0%) |
Education in Stephenville
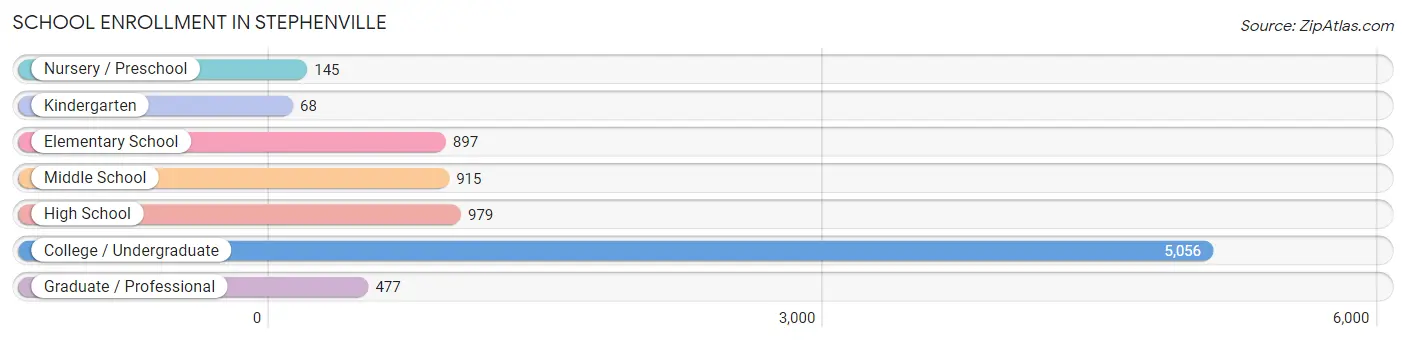
School Enrollment in Stephenville
The most common levels of schooling among the 8,537 students in Stephenville are college / undergraduate (5,056 | 59.2%), high school (979 | 11.5%), and middle school (915 | 10.7%).
| School Level | # Students | % Students |
| Nursery / Preschool | 145 | 1.7% |
| Kindergarten | 68 | 0.8% |
| Elementary School | 897 | 10.5% |
| Middle School | 915 | 10.7% |
| High School | 979 | 11.5% |
| College / Undergraduate | 5,056 | 59.2% |
| Graduate / Professional | 477 | 5.6% |
| Total | 8,537 | 100.0% |
School Enrollment by Age by Funding Source in Stephenville
Out of a total of 8,537 students who are enrolled in schools in Stephenville, 384 (4.5%) attend a private institution, while the remaining 8,153 (95.5%) are enrolled in public schools. The age group of 3 to 4 year olds has the highest likelihood of being enrolled in private schools, with 17 (23.9% in the age bracket) enrolled. Conversely, the age group of 5 to 9 year old has the lowest likelihood of being enrolled in a private school, with 938 (99.1% in the age bracket) attending a public institution.
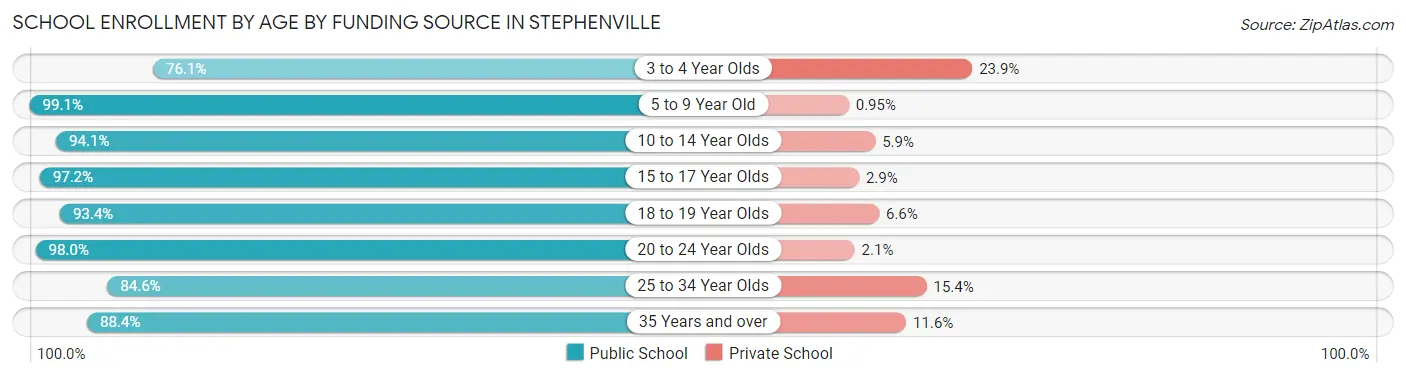
| Age Bracket | Public School | Private School |
| 3 to 4 Year Olds | 54 (76.1%) | 17 (23.9%) |
| 5 to 9 Year Old | 938 (99.1%) | 9 (0.9%) |
| 10 to 14 Year Olds | 993 (94.1%) | 62 (5.9%) |
| 15 to 17 Year Olds | 648 (97.2%) | 19 (2.9%) |
| 18 to 19 Year Olds | 1,914 (93.4%) | 135 (6.6%) |
| 20 to 24 Year Olds | 3,160 (98.0%) | 66 (2.1%) |
| 25 to 34 Year Olds | 318 (84.6%) | 58 (15.4%) |
| 35 Years and over | 129 (88.4%) | 17 (11.6%) |
| Total | 8,153 (95.5%) | 384 (4.5%) |
Educational Attainment by Field of Study in Stephenville
Business (698 | 19.3%), education (591 | 16.3%), bio, nature & agricultural (358 | 9.9%), arts & humanities (275 | 7.6%), and computers & mathematics (259 | 7.2%) are the most common fields of study among 3,618 individuals in Stephenville who have obtained a bachelor's degree or higher.
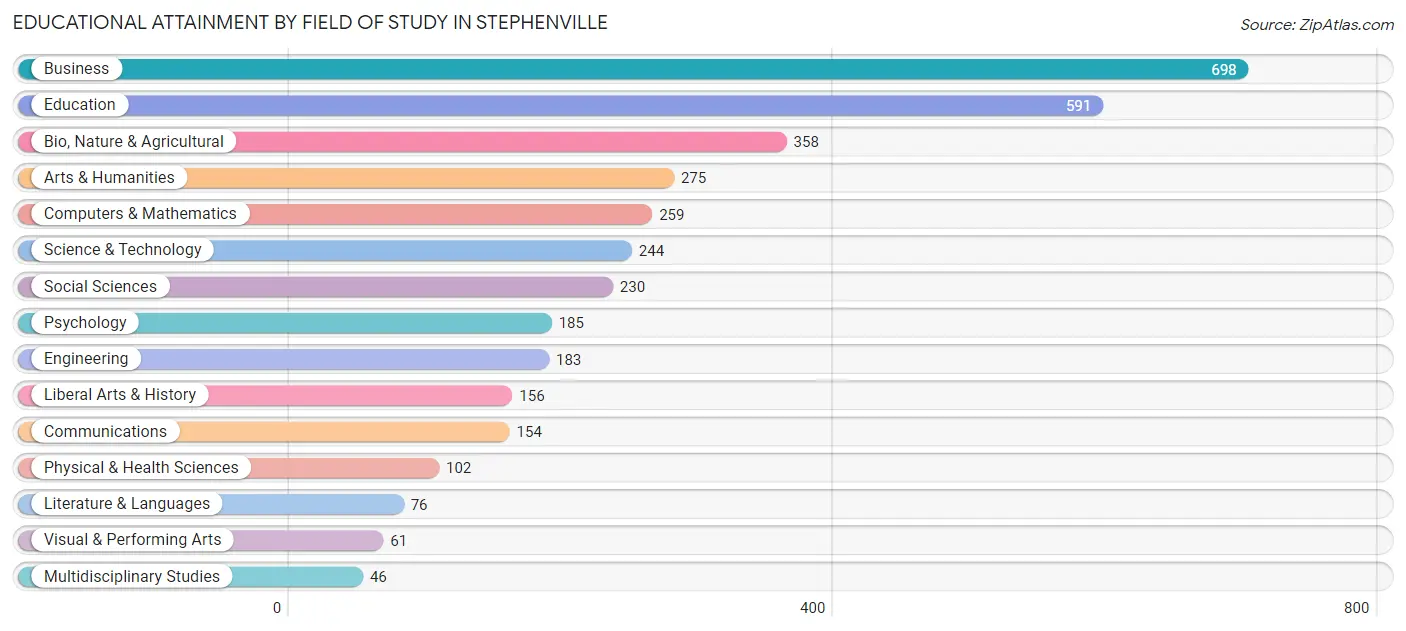
| Field of Study | # Graduates | % Graduates |
| Computers & Mathematics | 259 | 7.2% |
| Bio, Nature & Agricultural | 358 | 9.9% |
| Physical & Health Sciences | 102 | 2.8% |
| Psychology | 185 | 5.1% |
| Social Sciences | 230 | 6.4% |
| Engineering | 183 | 5.1% |
| Multidisciplinary Studies | 46 | 1.3% |
| Science & Technology | 244 | 6.7% |
| Business | 698 | 19.3% |
| Education | 591 | 16.3% |
| Literature & Languages | 76 | 2.1% |
| Liberal Arts & History | 156 | 4.3% |
| Visual & Performing Arts | 61 | 1.7% |
| Communications | 154 | 4.3% |
| Arts & Humanities | 275 | 7.6% |
| Total | 3,618 | 100.0% |
Transportation & Commute in Stephenville
Vehicle Availability by Sex in Stephenville
The most prevalent vehicle ownership categories in Stephenville are males with 2 vehicles (2,706, accounting for 53.4%) and females with 2 vehicles (2,056, making up 62.1%).
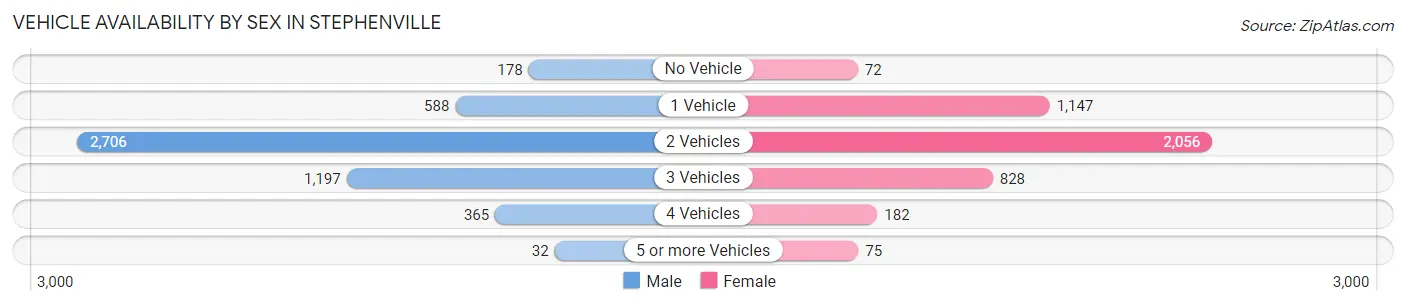
| Vehicles Available | Male | Female |
| No Vehicle | 178 (3.5%) | 72 (1.7%) |
| 1 Vehicle | 588 (11.6%) | 1,147 (26.3%) |
| 2 Vehicles | 2,706 (53.4%) | 2,056 (47.2%) |
| 3 Vehicles | 1,197 (23.6%) | 828 (19.0%) |
| 4 Vehicles | 365 (7.2%) | 182 (4.2%) |
| 5 or more Vehicles | 32 (0.6%) | 75 (1.7%) |
| Total | 5,066 (100.0%) | 4,360 (100.0%) |
Commute Time in Stephenville
The most frequently occuring commute durations in Stephenville are 5 to 9 minutes (3,234 commuters, 32.7%), 10 to 14 minutes (2,968 commuters, 30.0%), and less than 5 minutes (987 commuters, 10.0%).
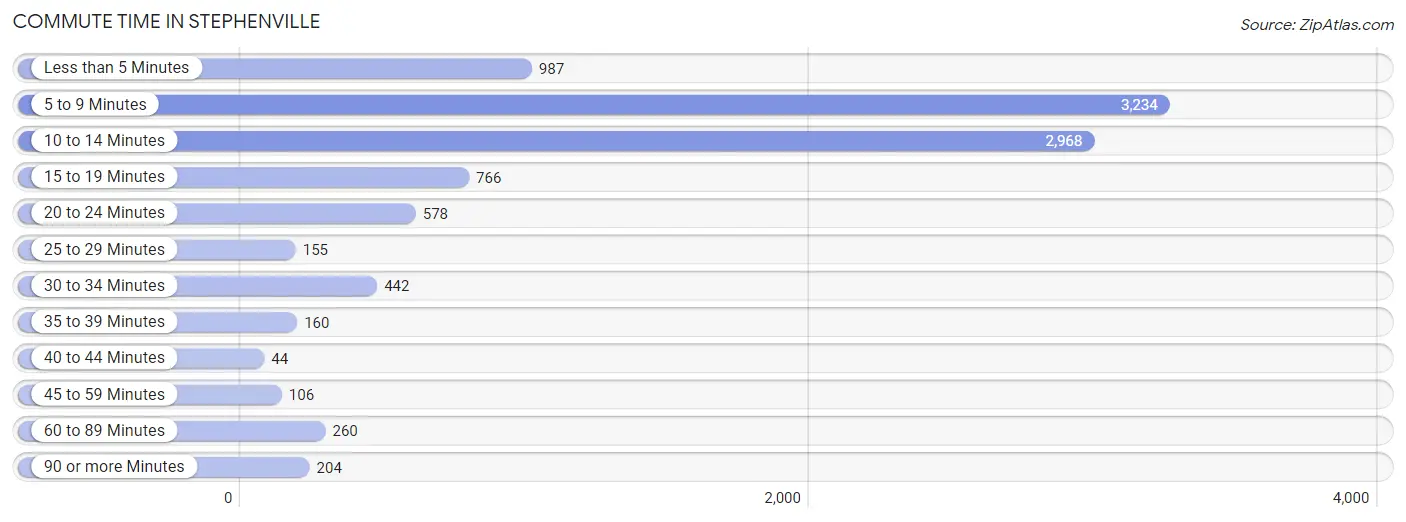
| Commute Time | # Commuters | % Commuters |
| Less than 5 Minutes | 987 | 10.0% |
| 5 to 9 Minutes | 3,234 | 32.7% |
| 10 to 14 Minutes | 2,968 | 30.0% |
| 15 to 19 Minutes | 766 | 7.7% |
| 20 to 24 Minutes | 578 | 5.8% |
| 25 to 29 Minutes | 155 | 1.6% |
| 30 to 34 Minutes | 442 | 4.5% |
| 35 to 39 Minutes | 160 | 1.6% |
| 40 to 44 Minutes | 44 | 0.4% |
| 45 to 59 Minutes | 106 | 1.1% |
| 60 to 89 Minutes | 260 | 2.6% |
| 90 or more Minutes | 204 | 2.1% |
Commute Time by Sex in Stephenville
The most common commute times in Stephenville are 10 to 14 minutes (1,628 commuters, 31.2%) for males and 5 to 9 minutes (1,677 commuters, 35.8%) for females.
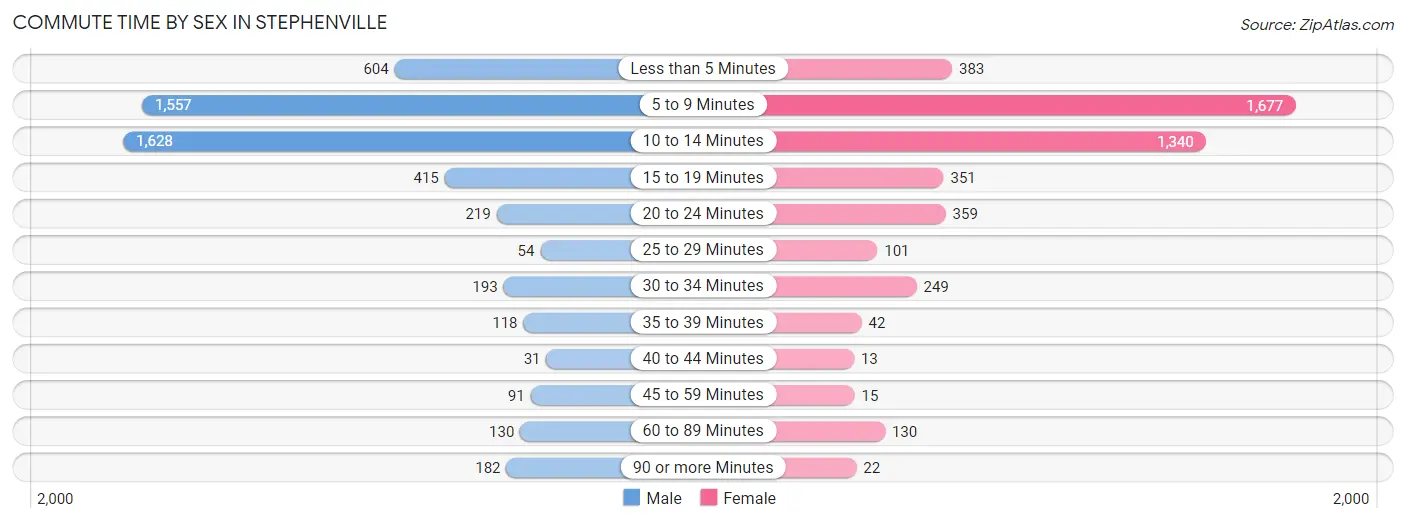
| Commute Time | Male | Female |
| Less than 5 Minutes | 604 (11.6%) | 383 (8.2%) |
| 5 to 9 Minutes | 1,557 (29.8%) | 1,677 (35.8%) |
| 10 to 14 Minutes | 1,628 (31.2%) | 1,340 (28.6%) |
| 15 to 19 Minutes | 415 (8.0%) | 351 (7.5%) |
| 20 to 24 Minutes | 219 (4.2%) | 359 (7.7%) |
| 25 to 29 Minutes | 54 (1.0%) | 101 (2.2%) |
| 30 to 34 Minutes | 193 (3.7%) | 249 (5.3%) |
| 35 to 39 Minutes | 118 (2.3%) | 42 (0.9%) |
| 40 to 44 Minutes | 31 (0.6%) | 13 (0.3%) |
| 45 to 59 Minutes | 91 (1.7%) | 15 (0.3%) |
| 60 to 89 Minutes | 130 (2.5%) | 130 (2.8%) |
| 90 or more Minutes | 182 (3.5%) | 22 (0.5%) |
Time of Departure to Work by Sex in Stephenville
The most frequent times of departure to work in Stephenville are 7:00 AM to 7:29 AM (748, 14.3%) for males and 7:30 AM to 7:59 AM (941, 20.1%) for females.
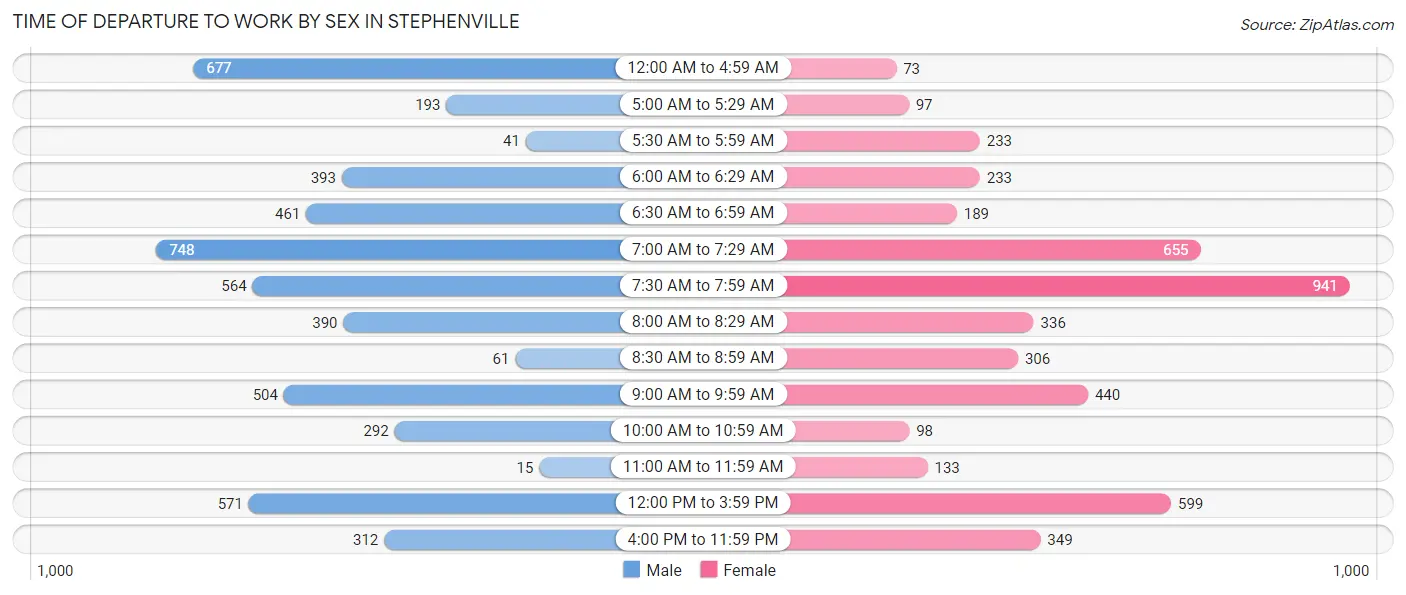
| Time of Departure | Male | Female |
| 12:00 AM to 4:59 AM | 677 (13.0%) | 73 (1.6%) |
| 5:00 AM to 5:29 AM | 193 (3.7%) | 97 (2.1%) |
| 5:30 AM to 5:59 AM | 41 (0.8%) | 233 (5.0%) |
| 6:00 AM to 6:29 AM | 393 (7.5%) | 233 (5.0%) |
| 6:30 AM to 6:59 AM | 461 (8.8%) | 189 (4.0%) |
| 7:00 AM to 7:29 AM | 748 (14.3%) | 655 (14.0%) |
| 7:30 AM to 7:59 AM | 564 (10.8%) | 941 (20.1%) |
| 8:00 AM to 8:29 AM | 390 (7.5%) | 336 (7.2%) |
| 8:30 AM to 8:59 AM | 61 (1.2%) | 306 (6.5%) |
| 9:00 AM to 9:59 AM | 504 (9.7%) | 440 (9.4%) |
| 10:00 AM to 10:59 AM | 292 (5.6%) | 98 (2.1%) |
| 11:00 AM to 11:59 AM | 15 (0.3%) | 133 (2.8%) |
| 12:00 PM to 3:59 PM | 571 (10.9%) | 599 (12.8%) |
| 4:00 PM to 11:59 PM | 312 (6.0%) | 349 (7.4%) |
| Total | 5,222 (100.0%) | 4,682 (100.0%) |
Housing Occupancy in Stephenville
Occupancy by Ownership in Stephenville
Of the total 8,072 dwellings in Stephenville, owner-occupied units account for 3,705 (45.9%), while renter-occupied units make up 4,367 (54.1%).
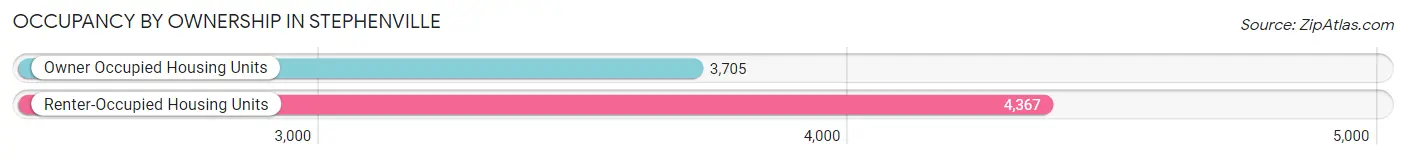
| Occupancy | # Housing Units | % Housing Units |
| Owner Occupied Housing Units | 3,705 | 45.9% |
| Renter-Occupied Housing Units | 4,367 | 54.1% |
| Total Occupied Housing Units | 8,072 | 100.0% |
Occupancy by Household Size in Stephenville
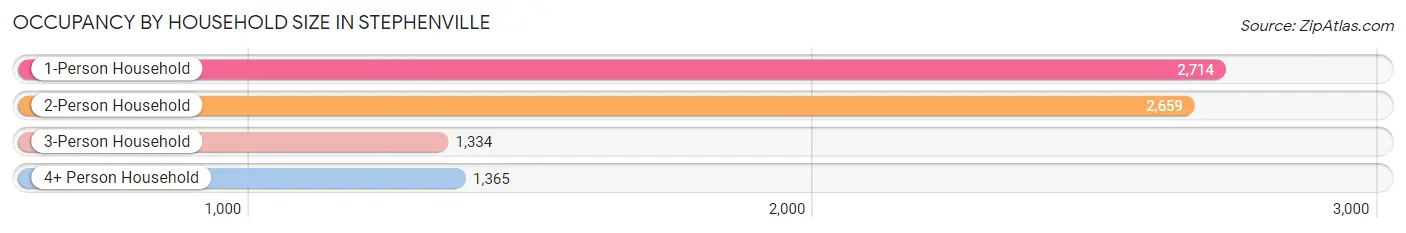
| Household Size | # Housing Units | % Housing Units |
| 1-Person Household | 2,714 | 33.6% |
| 2-Person Household | 2,659 | 32.9% |
| 3-Person Household | 1,334 | 16.5% |
| 4+ Person Household | 1,365 | 16.9% |
| Total Housing Units | 8,072 | 100.0% |
Occupancy by Ownership by Household Size in Stephenville
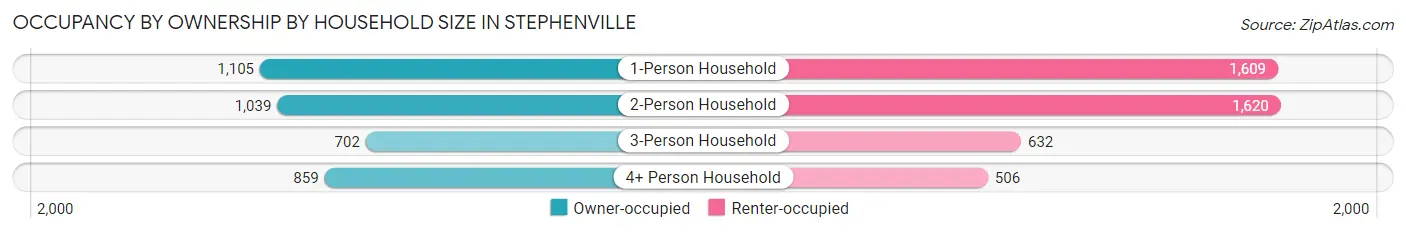
| Household Size | Owner-occupied | Renter-occupied |
| 1-Person Household | 1,105 (40.7%) | 1,609 (59.3%) |
| 2-Person Household | 1,039 (39.1%) | 1,620 (60.9%) |
| 3-Person Household | 702 (52.6%) | 632 (47.4%) |
| 4+ Person Household | 859 (62.9%) | 506 (37.1%) |
| Total Housing Units | 3,705 (45.9%) | 4,367 (54.1%) |
Occupancy by Educational Attainment in Stephenville
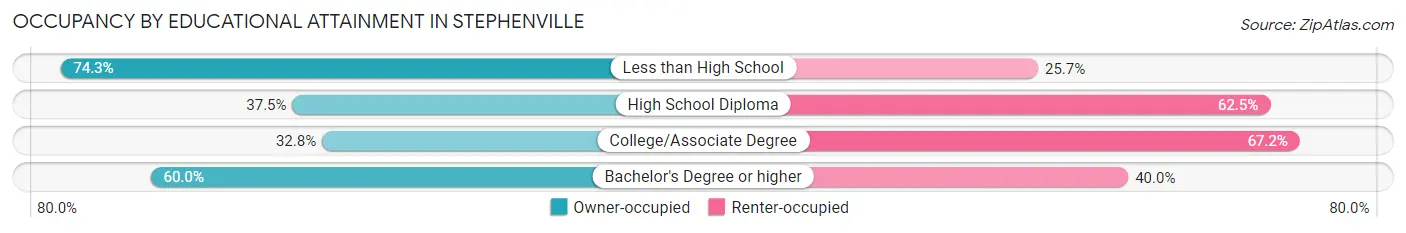
| Household Size | Owner-occupied | Renter-occupied |
| Less than High School | 489 (74.3%) | 169 (25.7%) |
| High School Diploma | 727 (37.5%) | 1,210 (62.5%) |
| College/Associate Degree | 964 (32.8%) | 1,972 (67.2%) |
| Bachelor's Degree or higher | 1,525 (60.0%) | 1,016 (40.0%) |
Occupancy by Age of Householder in Stephenville
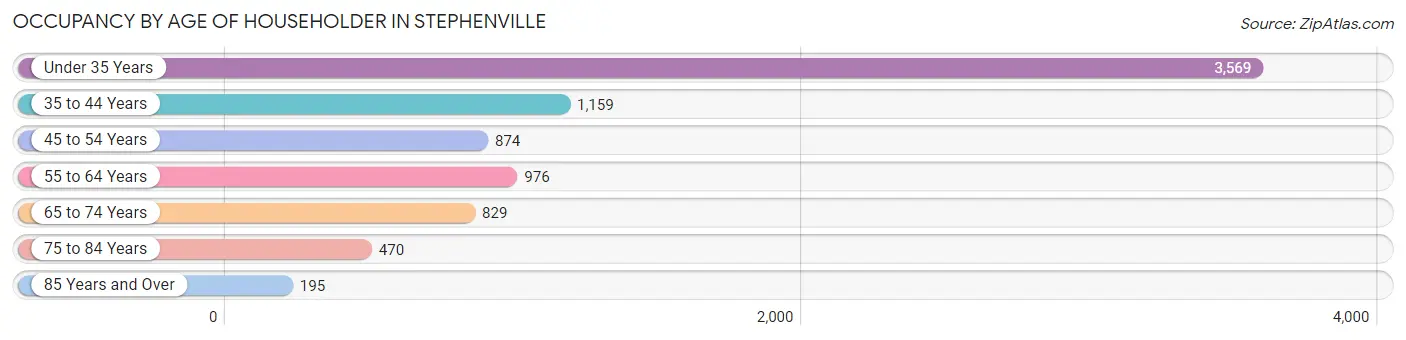
| Age Bracket | # Households | % Households |
| Under 35 Years | 3,569 | 44.2% |
| 35 to 44 Years | 1,159 | 14.4% |
| 45 to 54 Years | 874 | 10.8% |
| 55 to 64 Years | 976 | 12.1% |
| 65 to 74 Years | 829 | 10.3% |
| 75 to 84 Years | 470 | 5.8% |
| 85 Years and Over | 195 | 2.4% |
| Total | 8,072 | 100.0% |
Housing Finances in Stephenville
Median Income by Occupancy in Stephenville
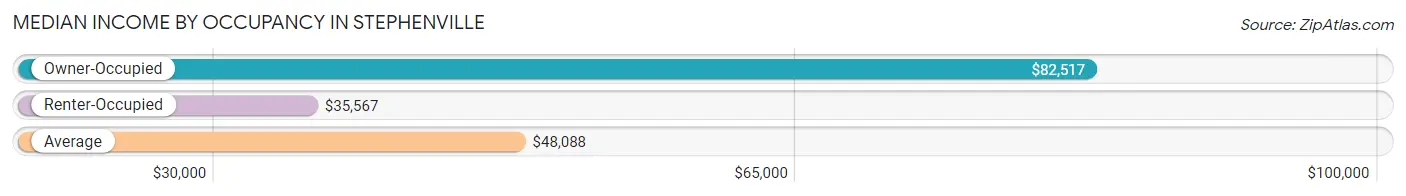
| Occupancy Type | # Households | Median Income |
| Owner-Occupied | 3,705 (45.9%) | $82,517 |
| Renter-Occupied | 4,367 (54.1%) | $35,567 |
| Average | 8,072 (100.0%) | $48,088 |
Occupancy by Householder Income Bracket in Stephenville
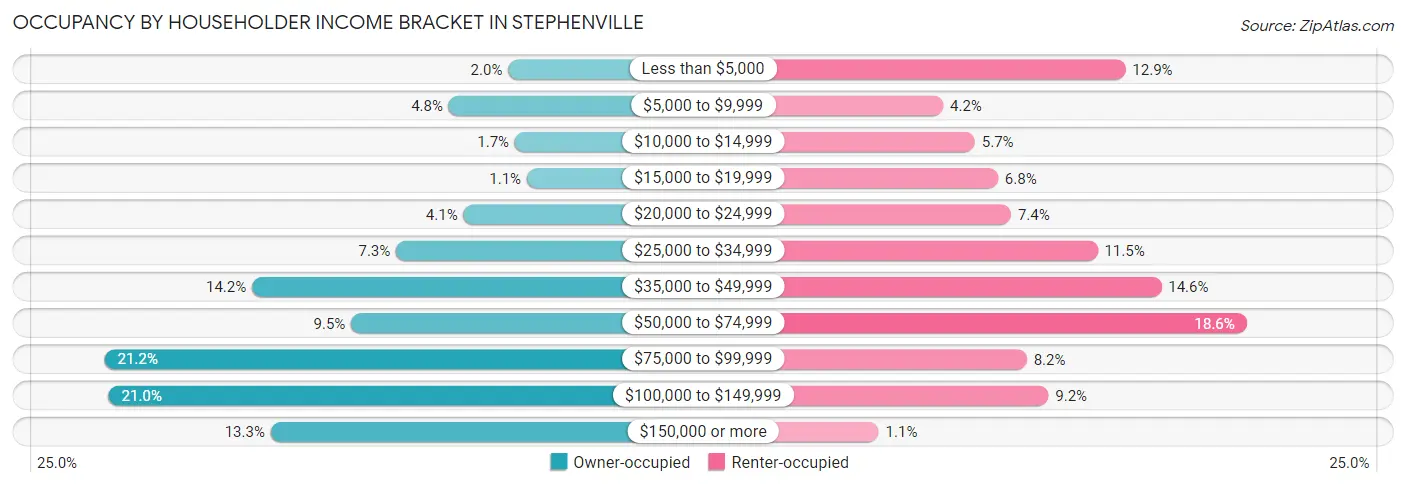
| Income Bracket | Owner-occupied | Renter-occupied |
| Less than $5,000 | 73 (2.0%) | 561 (12.9%) |
| $5,000 to $9,999 | 178 (4.8%) | 182 (4.2%) |
| $10,000 to $14,999 | 61 (1.7%) | 248 (5.7%) |
| $15,000 to $19,999 | 40 (1.1%) | 296 (6.8%) |
| $20,000 to $24,999 | 152 (4.1%) | 323 (7.4%) |
| $25,000 to $34,999 | 271 (7.3%) | 503 (11.5%) |
| $35,000 to $49,999 | 525 (14.2%) | 636 (14.6%) |
| $50,000 to $74,999 | 350 (9.5%) | 813 (18.6%) |
| $75,000 to $99,999 | 785 (21.2%) | 356 (8.2%) |
| $100,000 to $149,999 | 778 (21.0%) | 401 (9.2%) |
| $150,000 or more | 492 (13.3%) | 48 (1.1%) |
| Total | 3,705 (100.0%) | 4,367 (100.0%) |
Monthly Housing Cost Tiers in Stephenville
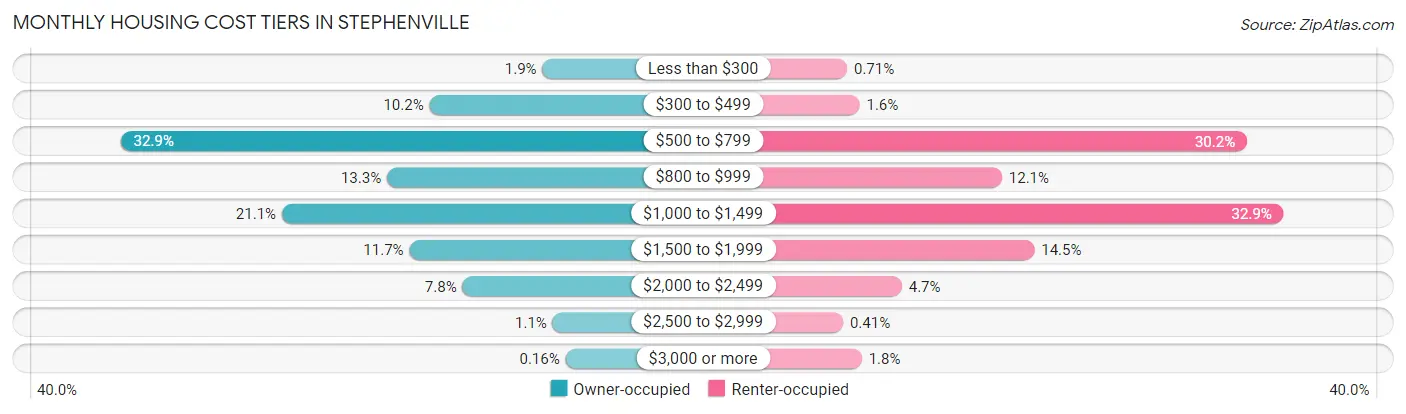
| Monthly Cost | Owner-occupied | Renter-occupied |
| Less than $300 | 69 (1.9%) | 31 (0.7%) |
| $300 to $499 | 377 (10.2%) | 71 (1.6%) |
| $500 to $799 | 1,220 (32.9%) | 1,317 (30.2%) |
| $800 to $999 | 493 (13.3%) | 529 (12.1%) |
| $1,000 to $1,499 | 780 (21.0%) | 1,435 (32.9%) |
| $1,500 to $1,999 | 432 (11.7%) | 633 (14.5%) |
| $2,000 to $2,499 | 287 (7.7%) | 207 (4.7%) |
| $2,500 to $2,999 | 41 (1.1%) | 18 (0.4%) |
| $3,000 or more | 6 (0.2%) | 78 (1.8%) |
| Total | 3,705 (100.0%) | 4,367 (100.0%) |
Physical Housing Characteristics in Stephenville
Housing Structures in Stephenville
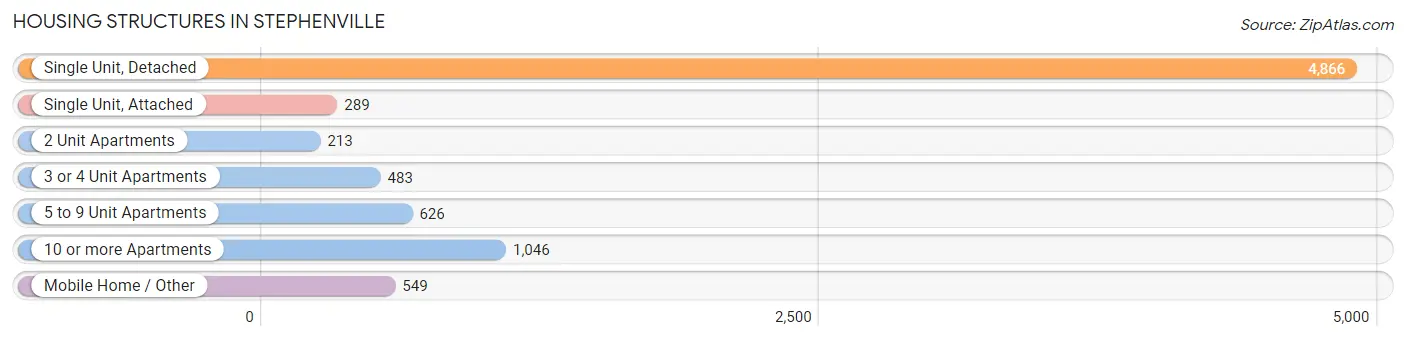
| Structure Type | # Housing Units | % Housing Units |
| Single Unit, Detached | 4,866 | 60.3% |
| Single Unit, Attached | 289 | 3.6% |
| 2 Unit Apartments | 213 | 2.6% |
| 3 or 4 Unit Apartments | 483 | 6.0% |
| 5 to 9 Unit Apartments | 626 | 7.8% |
| 10 or more Apartments | 1,046 | 13.0% |
| Mobile Home / Other | 549 | 6.8% |
| Total | 8,072 | 100.0% |
Housing Structures by Occupancy in Stephenville
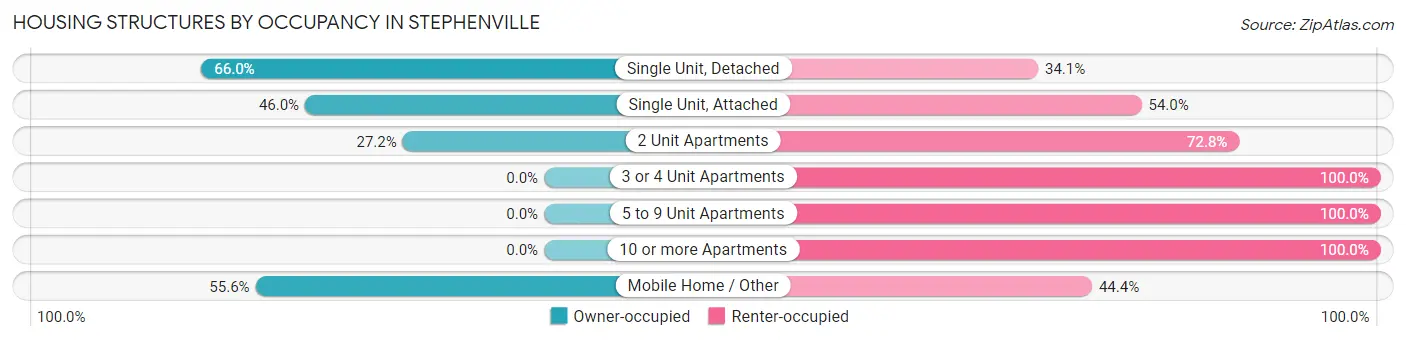
| Structure Type | Owner-occupied | Renter-occupied |
| Single Unit, Detached | 3,209 (65.9%) | 1,657 (34.1%) |
| Single Unit, Attached | 133 (46.0%) | 156 (54.0%) |
| 2 Unit Apartments | 58 (27.2%) | 155 (72.8%) |
| 3 or 4 Unit Apartments | 0 (0.0%) | 483 (100.0%) |
| 5 to 9 Unit Apartments | 0 (0.0%) | 626 (100.0%) |
| 10 or more Apartments | 0 (0.0%) | 1,046 (100.0%) |
| Mobile Home / Other | 305 (55.6%) | 244 (44.4%) |
| Total | 3,705 (45.9%) | 4,367 (54.1%) |
Housing Structures by Number of Rooms in Stephenville
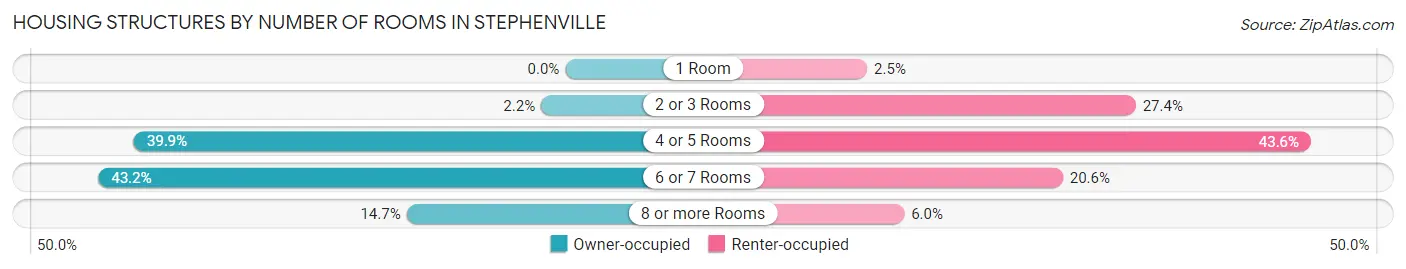
| Number of Rooms | Owner-occupied | Renter-occupied |
| 1 Room | 0 (0.0%) | 110 (2.5%) |
| 2 or 3 Rooms | 83 (2.2%) | 1,195 (27.4%) |
| 4 or 5 Rooms | 1,478 (39.9%) | 1,902 (43.5%) |
| 6 or 7 Rooms | 1,600 (43.2%) | 900 (20.6%) |
| 8 or more Rooms | 544 (14.7%) | 260 (5.9%) |
| Total | 3,705 (100.0%) | 4,367 (100.0%) |
Housing Structure by Heating Type in Stephenville
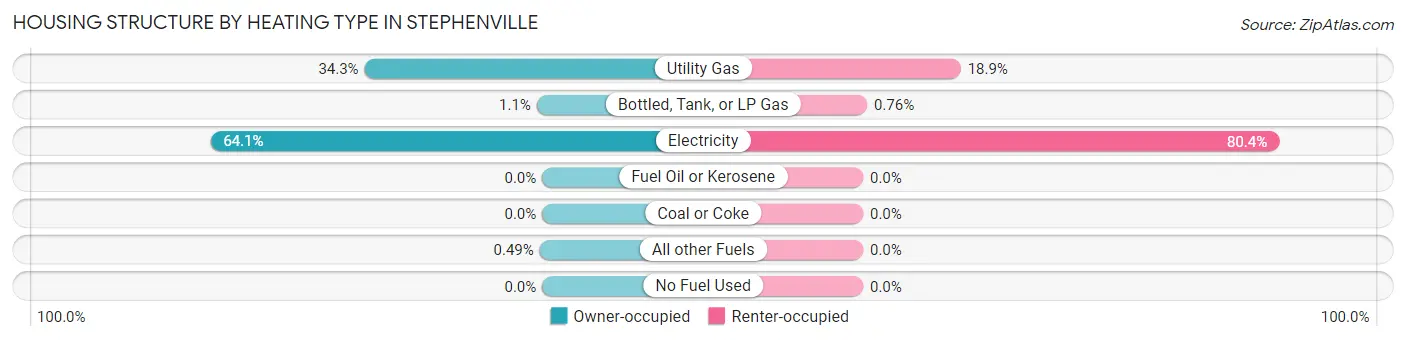
| Heating Type | Owner-occupied | Renter-occupied |
| Utility Gas | 1,272 (34.3%) | 824 (18.9%) |
| Bottled, Tank, or LP Gas | 39 (1.1%) | 33 (0.8%) |
| Electricity | 2,376 (64.1%) | 3,510 (80.4%) |
| Fuel Oil or Kerosene | 0 (0.0%) | 0 (0.0%) |
| Coal or Coke | 0 (0.0%) | 0 (0.0%) |
| All other Fuels | 18 (0.5%) | 0 (0.0%) |
| No Fuel Used | 0 (0.0%) | 0 (0.0%) |
| Total | 3,705 (100.0%) | 4,367 (100.0%) |
Household Vehicle Usage in Stephenville
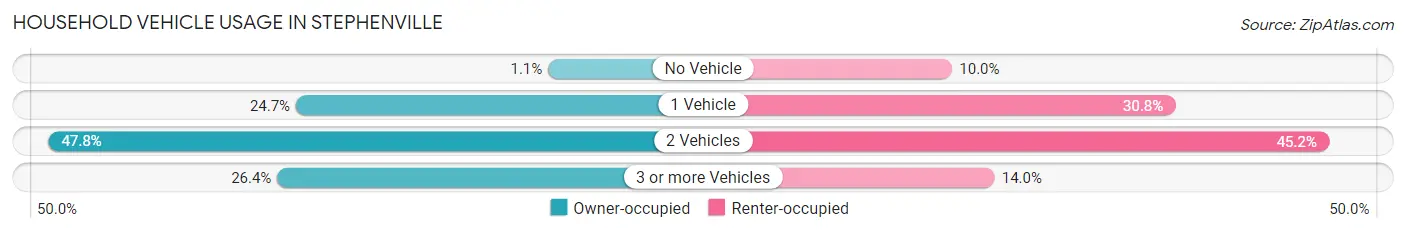
| Vehicles per Household | Owner-occupied | Renter-occupied |
| No Vehicle | 42 (1.1%) | 438 (10.0%) |
| 1 Vehicle | 914 (24.7%) | 1,346 (30.8%) |
| 2 Vehicles | 1,770 (47.8%) | 1,972 (45.2%) |
| 3 or more Vehicles | 979 (26.4%) | 611 (14.0%) |
| Total | 3,705 (100.0%) | 4,367 (100.0%) |
Real Estate & Mortgages in Stephenville
Real Estate and Mortgage Overview in Stephenville
| Characteristic | Without Mortgage | With Mortgage |
| Housing Units | 1,844 | 1,861 |
| Median Property Value | $212,400 | $188,300 |
| Median Household Income | $67,755 | $198 |
| Monthly Housing Costs | $633 | $6 |
| Real Estate Taxes | $3,124 | $155 |
Property Value by Mortgage Status in Stephenville
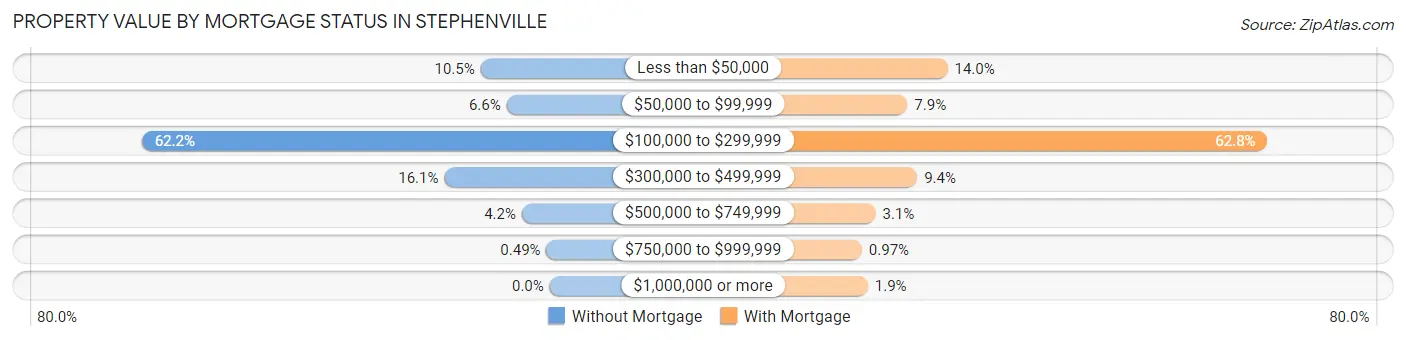
| Property Value | Without Mortgage | With Mortgage |
| Less than $50,000 | 194 (10.5%) | 261 (14.0%) |
| $50,000 to $99,999 | 121 (6.6%) | 147 (7.9%) |
| $100,000 to $299,999 | 1,146 (62.2%) | 1,168 (62.8%) |
| $300,000 to $499,999 | 296 (16.1%) | 175 (9.4%) |
| $500,000 to $749,999 | 78 (4.2%) | 57 (3.1%) |
| $750,000 to $999,999 | 9 (0.5%) | 18 (1.0%) |
| $1,000,000 or more | 0 (0.0%) | 35 (1.9%) |
| Total | 1,844 (100.0%) | 1,861 (100.0%) |
Household Income by Mortgage Status in Stephenville
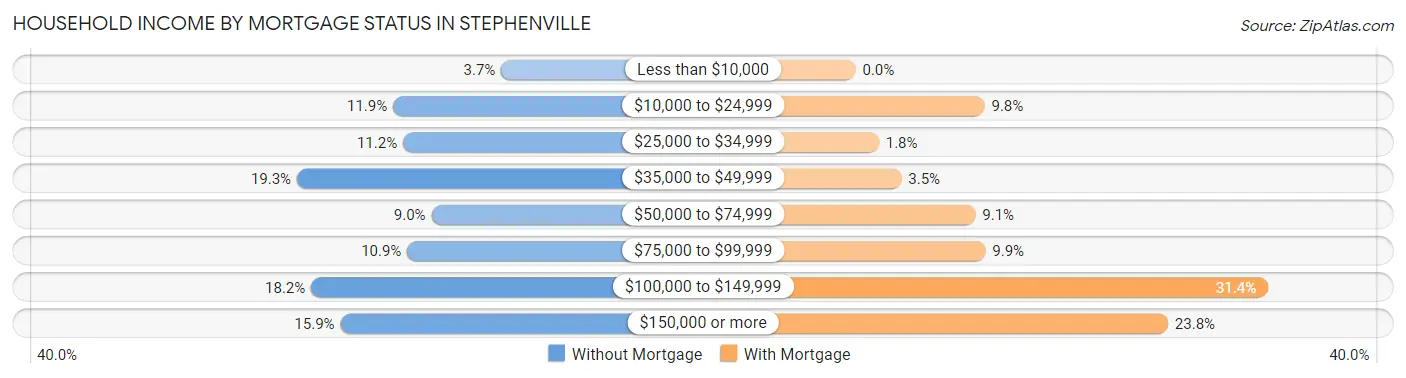
| Household Income | Without Mortgage | With Mortgage |
| Less than $10,000 | 68 (3.7%) | 0 (0.0%) |
| $10,000 to $24,999 | 220 (11.9%) | 183 (9.8%) |
| $25,000 to $34,999 | 206 (11.2%) | 33 (1.8%) |
| $35,000 to $49,999 | 355 (19.3%) | 65 (3.5%) |
| $50,000 to $74,999 | 166 (9.0%) | 170 (9.1%) |
| $75,000 to $99,999 | 200 (10.8%) | 184 (9.9%) |
| $100,000 to $149,999 | 335 (18.2%) | 585 (31.4%) |
| $150,000 or more | 294 (15.9%) | 443 (23.8%) |
| Total | 1,844 (100.0%) | 1,861 (100.0%) |
Property Value to Household Income Ratio in Stephenville
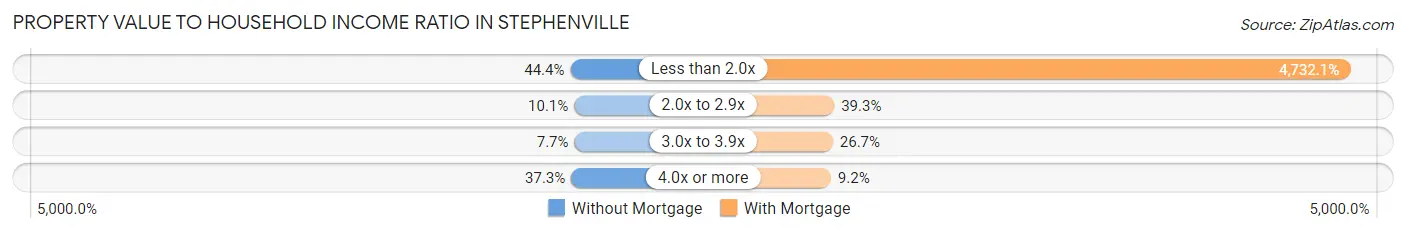
| Value-to-Income Ratio | Without Mortgage | With Mortgage |
| Less than 2.0x | 819 (44.4%) | 88,065 (4,732.1%) |
| 2.0x to 2.9x | 186 (10.1%) | 732 (39.3%) |
| 3.0x to 3.9x | 141 (7.6%) | 496 (26.7%) |
| 4.0x or more | 687 (37.3%) | 171 (9.2%) |
| Total | 1,844 (100.0%) | 1,861 (100.0%) |
Real Estate Taxes by Mortgage Status in Stephenville
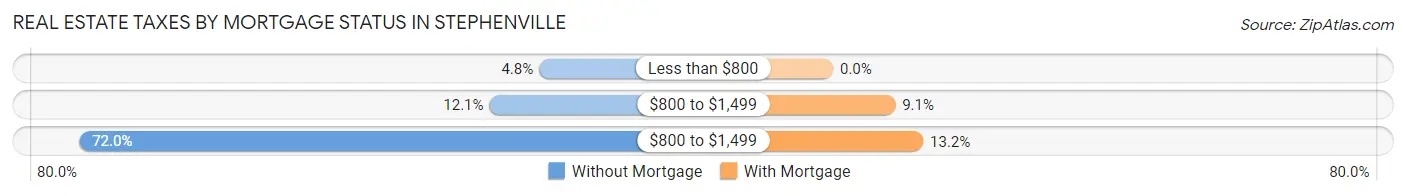
| Property Taxes | Without Mortgage | With Mortgage |
| Less than $800 | 89 (4.8%) | 0 (0.0%) |
| $800 to $1,499 | 223 (12.1%) | 169 (9.1%) |
| $800 to $1,499 | 1,328 (72.0%) | 245 (13.2%) |
| Total | 1,844 (100.0%) | 1,861 (100.0%) |
Health & Disability in Stephenville
Health Insurance Coverage by Age in Stephenville
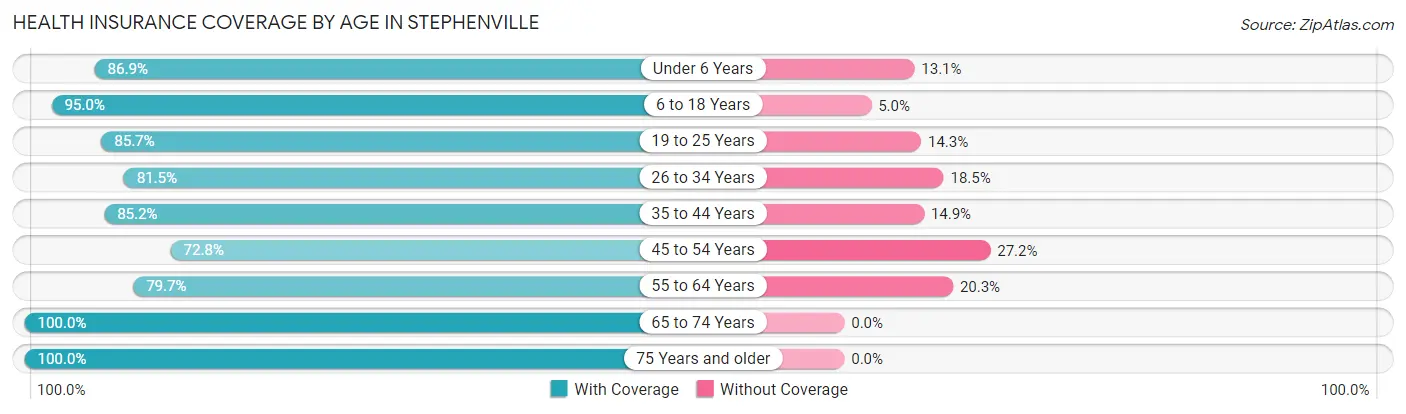
| Age Bracket | With Coverage | Without Coverage |
| Under 6 Years | 1,044 (86.9%) | 157 (13.1%) |
| 6 to 18 Years | 3,464 (95.0%) | 183 (5.0%) |
| 19 to 25 Years | 4,902 (85.7%) | 819 (14.3%) |
| 26 to 34 Years | 2,369 (81.5%) | 538 (18.5%) |
| 35 to 44 Years | 1,669 (85.2%) | 291 (14.8%) |
| 45 to 54 Years | 1,232 (72.8%) | 461 (27.2%) |
| 55 to 64 Years | 1,106 (79.7%) | 281 (20.3%) |
| 65 to 74 Years | 1,261 (100.0%) | 0 (0.0%) |
| 75 Years and older | 815 (100.0%) | 0 (0.0%) |
| Total | 17,862 (86.7%) | 2,730 (13.3%) |
Health Insurance Coverage by Citizenship Status in Stephenville
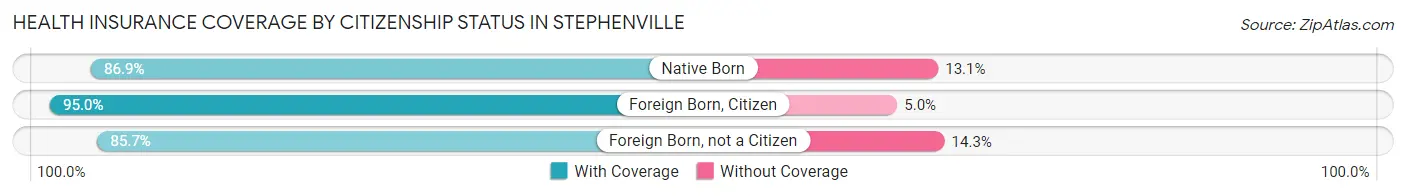
| Citizenship Status | With Coverage | Without Coverage |
| Native Born | 1,044 (86.9%) | 157 (13.1%) |
| Foreign Born, Citizen | 3,464 (95.0%) | 183 (5.0%) |
| Foreign Born, not a Citizen | 4,902 (85.7%) | 819 (14.3%) |
Health Insurance Coverage by Household Income in Stephenville
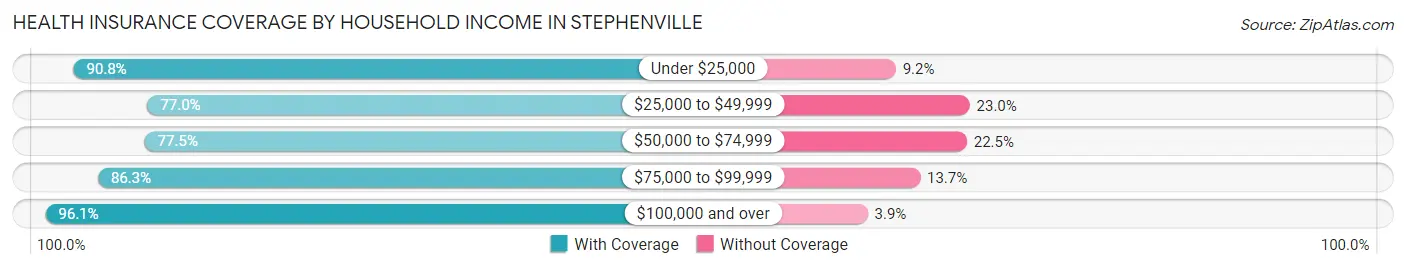
| Household Income | With Coverage | Without Coverage |
| Under $25,000 | 3,163 (90.8%) | 319 (9.2%) |
| $25,000 to $49,999 | 2,897 (77.0%) | 866 (23.0%) |
| $50,000 to $74,999 | 2,003 (77.5%) | 581 (22.5%) |
| $75,000 to $99,999 | 2,546 (86.3%) | 405 (13.7%) |
| $100,000 and over | 5,396 (96.1%) | 219 (3.9%) |
Public vs Private Health Insurance Coverage by Age in Stephenville
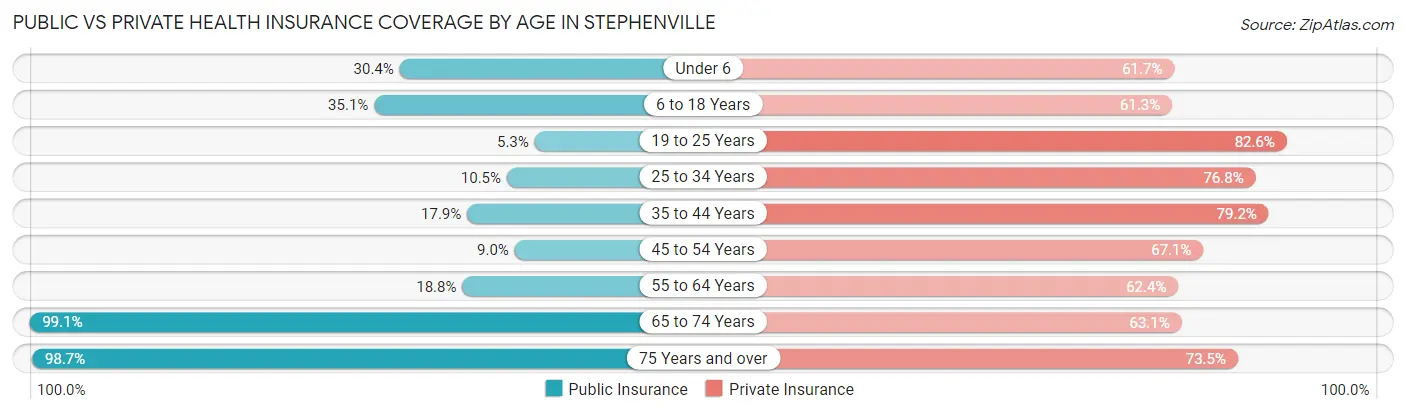
| Age Bracket | Public Insurance | Private Insurance |
| Under 6 | 365 (30.4%) | 741 (61.7%) |
| 6 to 18 Years | 1,281 (35.1%) | 2,236 (61.3%) |
| 19 to 25 Years | 305 (5.3%) | 4,724 (82.6%) |
| 25 to 34 Years | 305 (10.5%) | 2,232 (76.8%) |
| 35 to 44 Years | 350 (17.9%) | 1,553 (79.2%) |
| 45 to 54 Years | 153 (9.0%) | 1,136 (67.1%) |
| 55 to 64 Years | 260 (18.8%) | 866 (62.4%) |
| 65 to 74 Years | 1,250 (99.1%) | 795 (63.0%) |
| 75 Years and over | 804 (98.7%) | 599 (73.5%) |
| Total | 5,073 (24.6%) | 14,882 (72.3%) |
Disability Status by Sex by Age in Stephenville
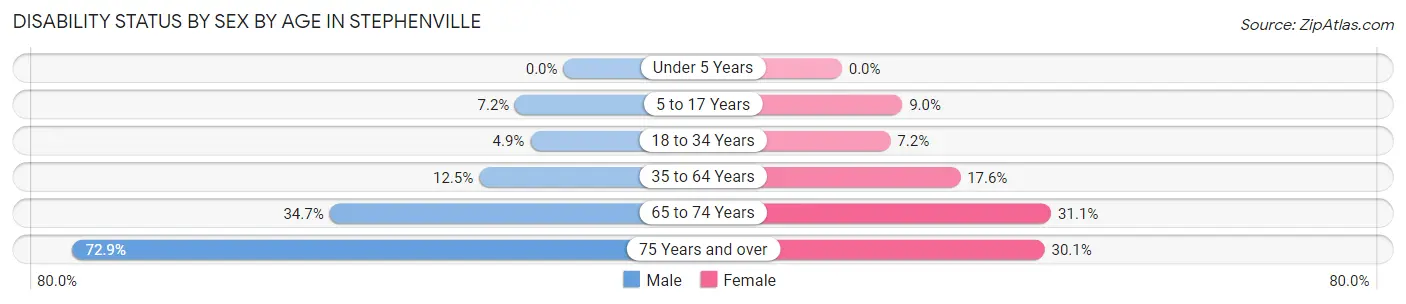
| Age Bracket | Male | Female |
| Under 5 Years | 0 (0.0%) | 0 (0.0%) |
| 5 to 17 Years | 95 (7.1%) | 136 (9.0%) |
| 18 to 34 Years | 224 (4.9%) | 362 (7.2%) |
| 35 to 64 Years | 317 (12.5%) | 441 (17.6%) |
| 65 to 74 Years | 190 (34.7%) | 222 (31.1%) |
| 75 Years and over | 180 (72.9%) | 171 (30.1%) |
Disability Class by Sex by Age in Stephenville
Disability Class: Hearing Difficulty
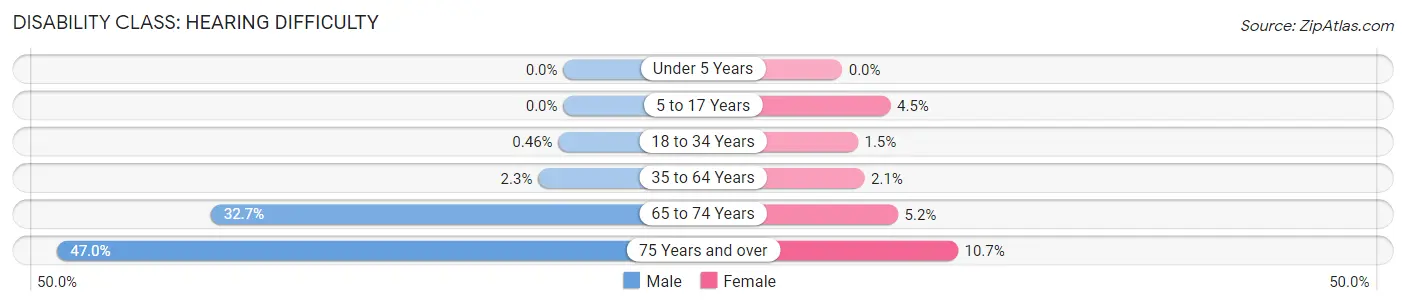
| Age Bracket | Male | Female |
| Under 5 Years | 0 (0.0%) | 0 (0.0%) |
| 5 to 17 Years | 0 (0.0%) | 68 (4.5%) |
| 18 to 34 Years | 21 (0.5%) | 73 (1.5%) |
| 35 to 64 Years | 59 (2.3%) | 52 (2.1%) |
| 65 to 74 Years | 179 (32.7%) | 37 (5.2%) |
| 75 Years and over | 116 (47.0%) | 61 (10.7%) |
Disability Class: Vision Difficulty
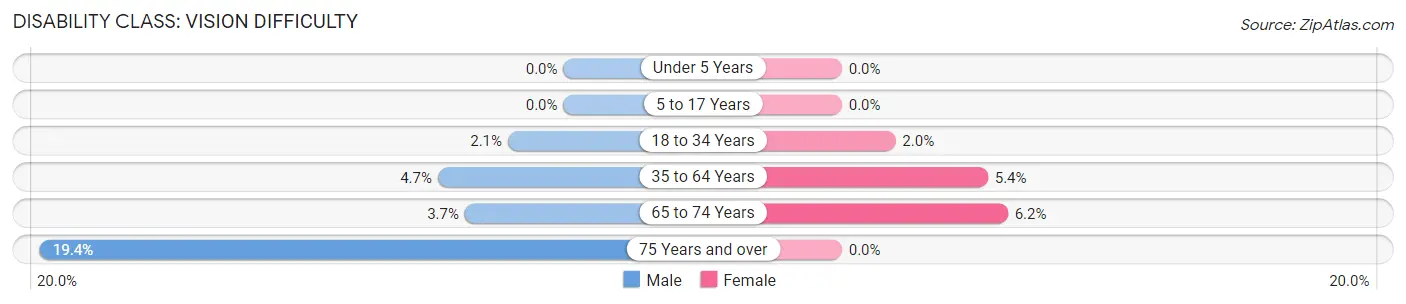
| Age Bracket | Male | Female |
| Under 5 Years | 0 (0.0%) | 0 (0.0%) |
| 5 to 17 Years | 0 (0.0%) | 0 (0.0%) |
| 18 to 34 Years | 94 (2.1%) | 100 (2.0%) |
| 35 to 64 Years | 118 (4.7%) | 136 (5.4%) |
| 65 to 74 Years | 20 (3.7%) | 44 (6.2%) |
| 75 Years and over | 48 (19.4%) | 0 (0.0%) |
Disability Class: Cognitive Difficulty
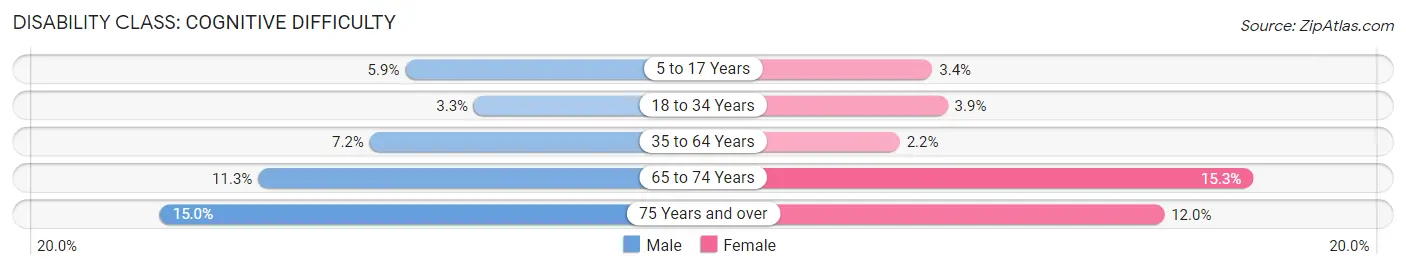
| Age Bracket | Male | Female |
| 5 to 17 Years | 78 (5.9%) | 51 (3.4%) |
| 18 to 34 Years | 151 (3.3%) | 197 (3.9%) |
| 35 to 64 Years | 182 (7.2%) | 54 (2.1%) |
| 65 to 74 Years | 62 (11.3%) | 109 (15.3%) |
| 75 Years and over | 37 (15.0%) | 68 (12.0%) |
Disability Class: Ambulatory Difficulty
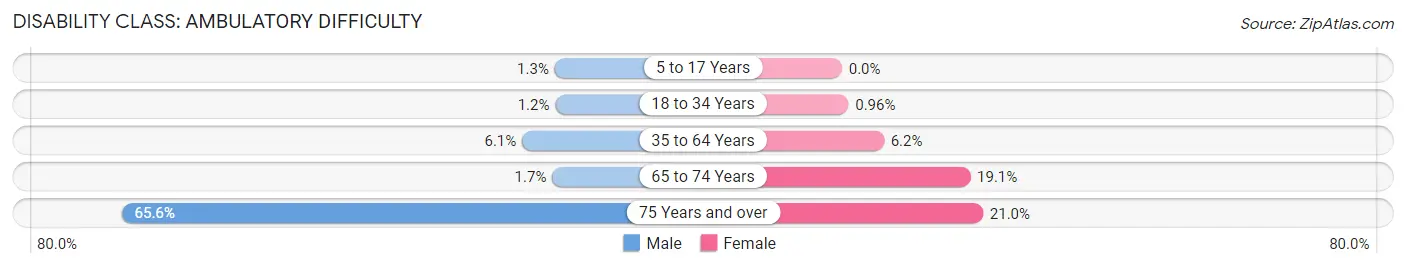
| Age Bracket | Male | Female |
| 5 to 17 Years | 17 (1.3%) | 0 (0.0%) |
| 18 to 34 Years | 54 (1.2%) | 48 (1.0%) |
| 35 to 64 Years | 155 (6.1%) | 156 (6.2%) |
| 65 to 74 Years | 9 (1.7%) | 136 (19.1%) |
| 75 Years and over | 162 (65.6%) | 119 (20.9%) |
Disability Class: Self-Care Difficulty
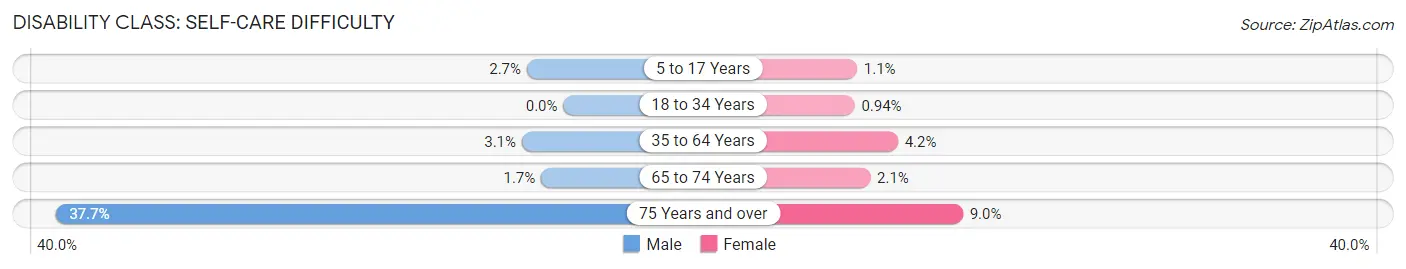
| Age Bracket | Male | Female |
| 5 to 17 Years | 36 (2.7%) | 17 (1.1%) |
| 18 to 34 Years | 0 (0.0%) | 47 (0.9%) |
| 35 to 64 Years | 78 (3.1%) | 104 (4.2%) |
| 65 to 74 Years | 9 (1.7%) | 15 (2.1%) |
| 75 Years and over | 93 (37.7%) | 51 (9.0%) |
Technology Access in Stephenville
Computing Device Access in Stephenville
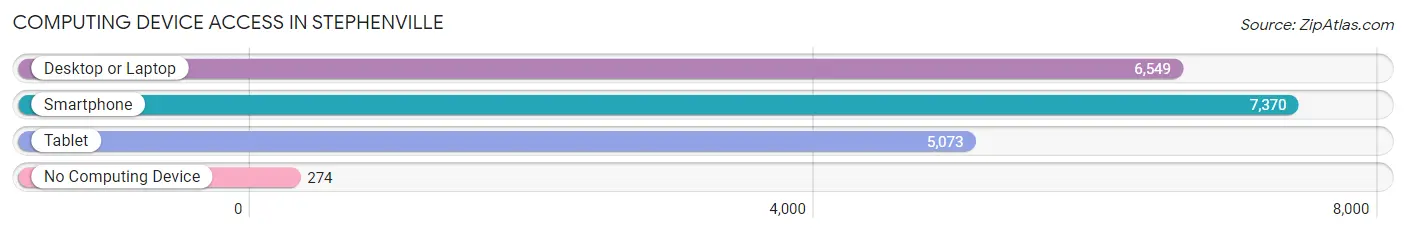
| Device Type | # Households | % Households |
| Desktop or Laptop | 6,549 | 81.1% |
| Smartphone | 7,370 | 91.3% |
| Tablet | 5,073 | 62.8% |
| No Computing Device | 274 | 3.4% |
| Total | 8,072 | 100.0% |
Internet Access in Stephenville
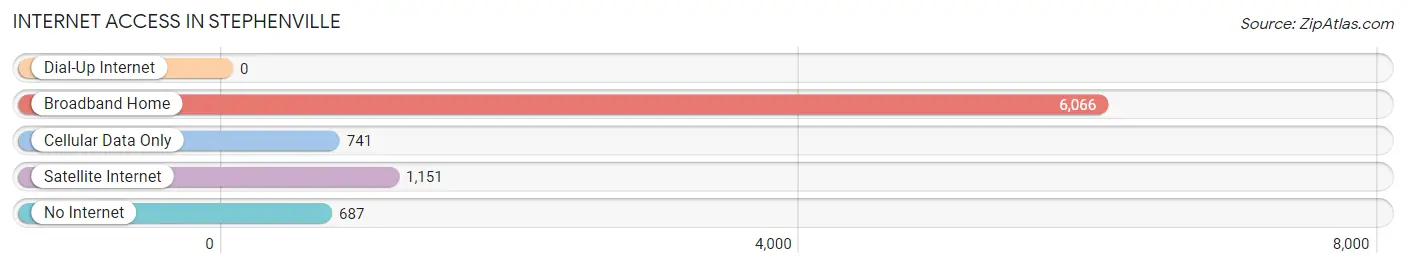
| Internet Type | # Households | % Households |
| Dial-Up Internet | 0 | 0.0% |
| Broadband Home | 6,066 | 75.1% |
| Cellular Data Only | 741 | 9.2% |
| Satellite Internet | 1,151 | 14.3% |
| No Internet | 687 | 8.5% |
| Total | 8,072 | 100.0% |
Stephenville Summary
Introduction
Stephenville, Texas is a small city located in Erath County in the state of Texas. It is the county seat of Erath County and is located about 100 miles southwest of Dallas. The city has a population of around 20,000 people and is known for its rich history, diverse geography, vibrant economy, and diverse demographics.
History
The area that is now Stephenville was first settled in the early 1840s by a group of settlers from Tennessee. The town was originally called “Buck’s Settlement” after one of the settlers, John B. Buck. In 1856, the town was renamed “Stephenville” after the first postmaster, Stephen F. Sparks.
The city was officially incorporated in 1856 and quickly became a center of commerce and industry. The city was home to several cotton gins, a flour mill, and a brick factory. The city also had a thriving cattle industry, which was the main source of income for many of the residents.
In the late 19th century, Stephenville was a major stop on the Chisholm Trail, which was used by cowboys to drive cattle from Texas to Kansas. The city was also home to several military bases during World War II, including the Stephenville Army Air Field.
Geography
Stephenville is located in the rolling hills of Central Texas, about 100 miles southwest of Dallas. The city is situated at the intersection of U.S. Highway 377 and State Highway 6. The city is surrounded by several small towns, including Dublin, Lingleville, and Morgan Mill.
The city is located in a region known as the Cross Timbers, which is characterized by a mix of hardwood forests and grasslands. The area is also home to several lakes, including Lake Proctor, Lake Granbury, and Lake Stephenville.
Economy
The economy of Stephenville is largely based on agriculture and ranching. The city is home to several large ranches, including the famous YO Ranch. The city is also home to several manufacturing companies, including a large paper mill and a large food processing plant.
The city is also home to several educational institutions, including Tarleton State University and the Stephenville Independent School District. The city is also home to several retail stores, restaurants, and other businesses.
Demographics
As of the 2010 census, the population of Stephenville was 17,123. The racial makeup of the city was 79.3% White, 11.2% Hispanic or Latino, 6.2% African American, and 3.3% other. The median household income was $37,945, and the median age was 36.
Conclusion
Stephenville, Texas is a small city located in Erath County in the state of Texas. It is the county seat of Erath County and is known for its rich history, diverse geography, vibrant economy, and diverse demographics. The city is home to several large ranches, manufacturing companies, educational institutions, and other businesses. The population of Stephenville was 17,123 as of the 2010 census, and the median household income was $37,945.
Common Questions
What is Per Capita Income in Stephenville?
Per Capita income in Stephenville is $27,158.
What is the Median Family Income in Stephenville?
Median Family Income in Stephenville is $82,154.
What is the Median Household income in Stephenville?
Median Household Income in Stephenville is $48,088.
What is Income or Wage Gap in Stephenville?
Income or Wage Gap in Stephenville is 34.4%.
Women in Stephenville earn 65.6 cents for every dollar earned by a man.
What is Inequality or Gini Index in Stephenville?
Inequality or Gini Index in Stephenville is 0.48.
What is the Total Population of Stephenville?
Total Population of Stephenville is 21,020.
What is the Total Male Population of Stephenville?
Total Male Population of Stephenville is 9,850.
What is the Total Female Population of Stephenville?
Total Female Population of Stephenville is 11,170.
What is the Ratio of Males per 100 Females in Stephenville?
There are 88.18 Males per 100 Females in Stephenville.
What is the Ratio of Females per 100 Males in Stephenville?
There are 113.40 Females per 100 Males in Stephenville.
What is the Median Population Age in Stephenville?
Median Population Age in Stephenville is 25.5 Years.
What is the Average Family Size in Stephenville
Average Family Size in Stephenville is 3.1 People.
What is the Average Household Size in Stephenville
Average Household Size in Stephenville is 2.3 People.
How Large is the Labor Force in Stephenville?
There are 11,398 People in the Labor Forcein in Stephenville.
What is the Percentage of People in the Labor Force in Stephenville?
65.2% of People are in the Labor Force in Stephenville.
What is the Unemployment Rate in Stephenville?
Unemployment Rate in Stephenville is 7.4%.