Zip Codes with the Lowest Poverty Level Among Children Under the Age of 5 in El Paso, TX
RELATED REPORTS & OPTIONS
Lowest Poverty | Child 0-5
El Paso
Compare Zip Codes
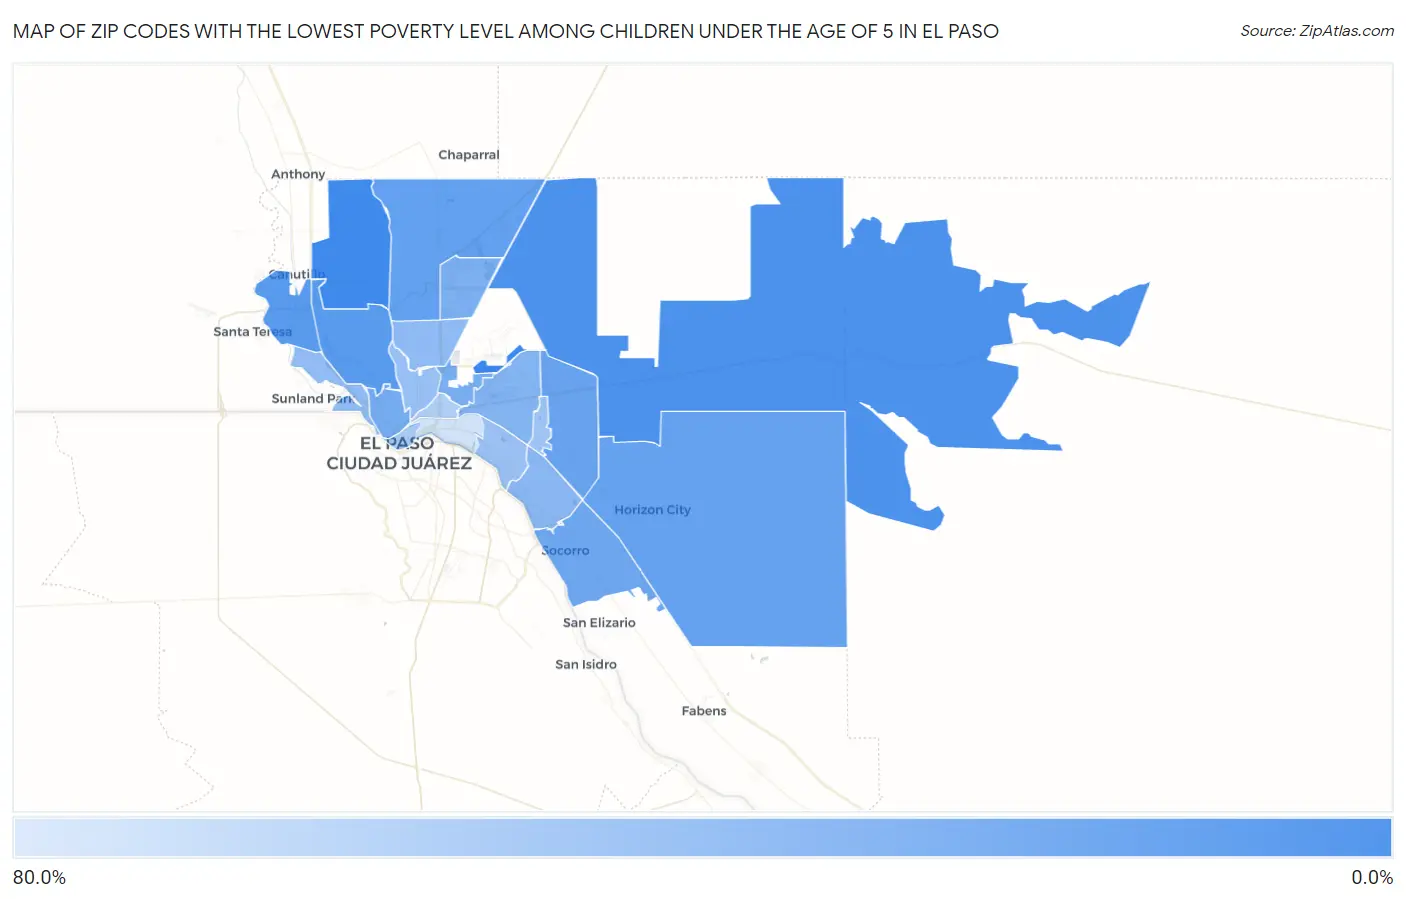
Map of Zip Codes with the Lowest Poverty Level Among Children Under the Age of 5 in El Paso
76.7%
4.0%
Zip Codes with the Lowest Poverty Level Among Children Under the Age of 5 in El Paso, TX
| Zip Code | Child Poverty | vs State | vs National | |
| 1. | 79908 | 4.0% | 21.1%(-17.1)#98 | 18.1%(-14.1)#2,140 |
| 2. | 79911 | 5.9% | 21.1%(-15.1)#162 | 18.1%(-12.1)#3,565 |
| 3. | 79938 | 9.7% | 21.1%(-11.4)#294 | 18.1%(-8.39)#6,059 |
| 4. | 79912 | 15.2% | 21.1%(-5.86)#501 | 18.1%(-2.84)#9,340 |
| 5. | 79932 | 15.5% | 21.1%(-5.59)#506 | 18.1%(-2.56)#9,501 |
| 6. | 79934 | 19.0% | 21.1%(-2.06)#619 | 18.1%(+0.959)#11,175 |
| 7. | 79928 | 20.1% | 21.1%(-0.948)#649 | 18.1%(+2.08)#11,711 |
| 8. | 79936 | 21.4% | 21.1%(+0.342)#686 | 18.1%(+3.37)#12,241 |
| 9. | 79927 | 23.9% | 21.1%(+2.80)#753 | 18.1%(+5.83)#13,273 |
| 10. | 79902 | 27.4% | 21.1%(+6.33)#841 | 18.1%(+9.35)#14,513 |
| 11. | 79906 | 28.7% | 21.1%(+7.66)#881 | 18.1%(+10.7)#14,950 |
| 12. | 79924 | 30.8% | 21.1%(+9.74)#940 | 18.1%(+12.8)#15,532 |
| 13. | 79925 | 33.8% | 21.1%(+12.8)#1,003 | 18.1%(+15.8)#16,337 |
| 14. | 79907 | 36.9% | 21.1%(+15.9)#1,058 | 18.1%(+18.9)#17,065 |
| 15. | 79904 | 39.1% | 21.1%(+18.0)#1,091 | 18.1%(+21.0)#17,476 |
| 16. | 79922 | 40.4% | 21.1%(+19.3)#1,111 | 18.1%(+22.3)#17,720 |
| 17. | 79930 | 43.6% | 21.1%(+22.5)#1,162 | 18.1%(+25.5)#18,271 |
| 18. | 79915 | 44.8% | 21.1%(+23.7)#1,178 | 18.1%(+26.7)#18,461 |
| 19. | 79935 | 47.5% | 21.1%(+26.4)#1,206 | 18.1%(+29.5)#18,806 |
| 20. | 79901 | 52.9% | 21.1%(+31.9)#1,236 | 18.1%(+34.9)#19,418 |
| 21. | 79903 | 56.0% | 21.1%(+34.9)#1,255 | 18.1%(+38.0)#19,687 |
| 22. | 79905 | 76.7% | 21.1%(+55.6)#1,322 | 18.1%(+58.6)#20,762 |
1
Common Questions
What are the Top 10 Zip Codes with the Lowest Poverty Level Among Children Under the Age of 5 in El Paso, TX?
Top 10 Zip Codes with the Lowest Poverty Level Among Children Under the Age of 5 in El Paso, TX are:
What zip code has the Lowest Poverty Level Among Children Under the Age of 5 in El Paso, TX?
79908 has the Lowest Poverty Level Among Children Under the Age of 5 in El Paso, TX with 4.0%.
What is the Poverty Level Among Children Under the Age of 5 in El Paso, TX?
Poverty Level Among Children Under the Age of 5 in El Paso is 28.0%.
What is the Poverty Level Among Children Under the Age of 5 in Texas?
Poverty Level Among Children Under the Age of 5 in Texas is 21.1%.
What is the Poverty Level Among Children Under the Age of 5 in the United States?
Poverty Level Among Children Under the Age of 5 in the United States is 18.1%.