Val Verde Park, TX Map & Demographics
Val Verde Park Map
Val Verde Park Overview
$22,364
PER CAPITA INCOME
$56,284
AVG FAMILY INCOME
$58,815
AVG HOUSEHOLD INCOME
0.39
INEQUALITY / GINI INDEX
3,319
TOTAL POPULATION
1,582
MALE POPULATION
1,737
FEMALE POPULATION
91.08
MALES / 100 FEMALES
109.80
FEMALES / 100 MALES
28.1
MEDIAN AGE
4.4
AVG FAMILY SIZE
3.4
AVG HOUSEHOLD SIZE
1,620
LABOR FORCE [ PEOPLE ]
69.7%
PERCENT IN LABOR FORCE
1.8%
UNEMPLOYMENT RATE
Income in Val Verde Park
Income Overview in Val Verde Park
Per Capita Income in Val Verde Park is $22,364, while median incomes of families and households are $56,284 and $58,815 respectively.
| Characteristic | Number | Measure |
| Per Capita Income | 3,319 | $22,364 |
| Median Family Income | 678 | $56,284 |
| Mean Family Income | 678 | $86,154 |
| Median Household Income | 975 | $58,815 |
| Mean Household Income | 975 | $76,138 |
| Income Deficit | 678 | $0 |
| Wage / Income Gap (%) | 3,319 | 0.00% |
| Wage / Income Gap ($) | 3,319 | 100.00¢ per $1 |
| Gini / Inequality Index | 3,319 | 0.39 |
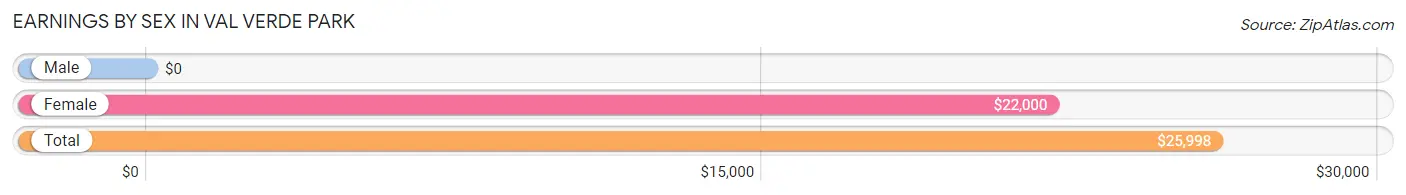
Earnings by Sex in Val Verde Park
| Sex | Number | Average Earnings |
| Male | 932 (57.2%) | $0 |
| Female | 698 (42.8%) | $22,000 |
| Total | 1,630 (100.0%) | $25,998 |
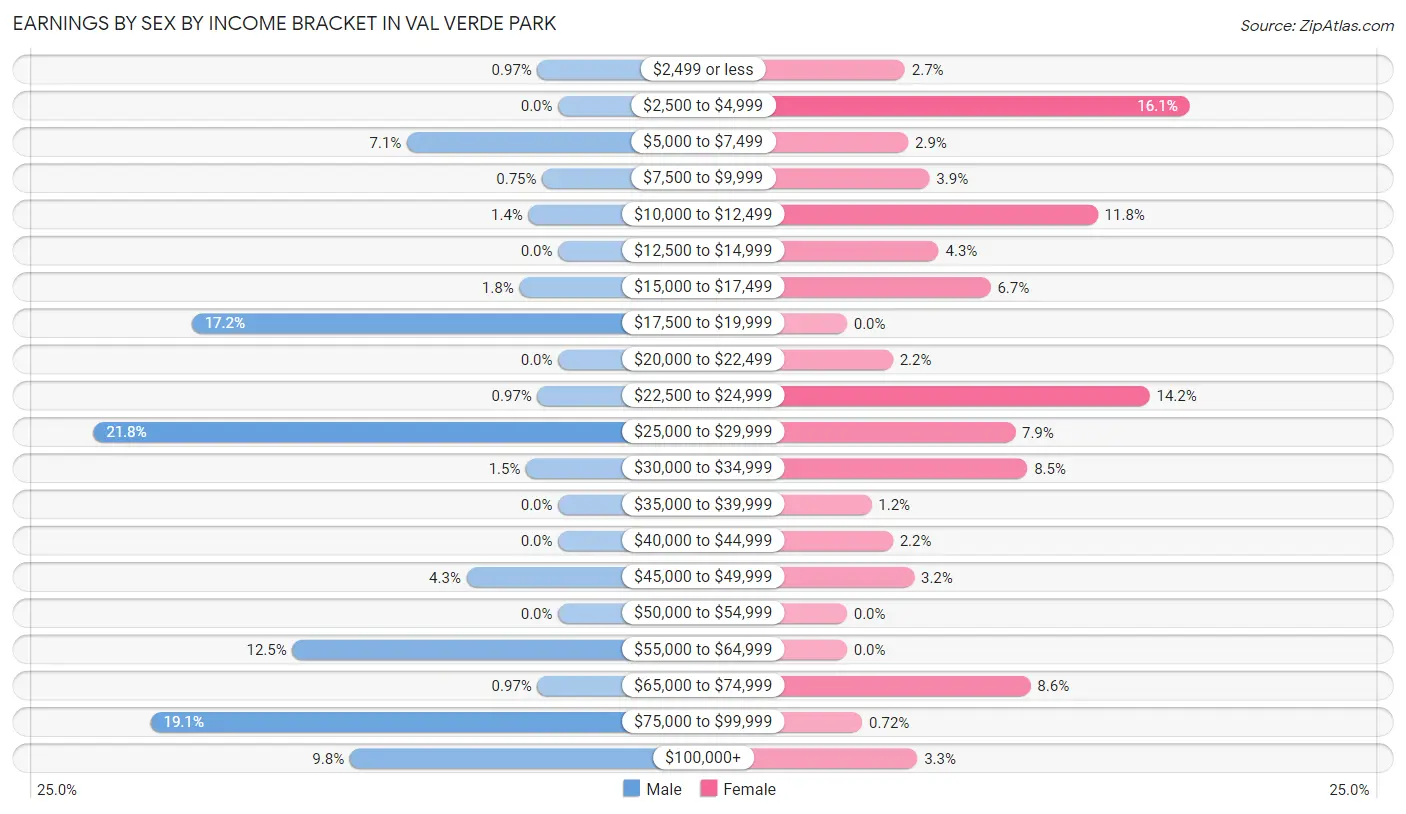
Earnings by Sex by Income Bracket in Val Verde Park
The most common earnings brackets in Val Verde Park are $25,000 to $29,999 for men (203 | 21.8%) and $2,500 to $4,999 for women (112 | 16.1%).
| Income | Male | Female |
| $2,499 or less | 9 (1.0%) | 19 (2.7%) |
| $2,500 to $4,999 | 0 (0.0%) | 112 (16.1%) |
| $5,000 to $7,499 | 66 (7.1%) | 20 (2.9%) |
| $7,500 to $9,999 | 7 (0.7%) | 27 (3.9%) |
| $10,000 to $12,499 | 13 (1.4%) | 82 (11.7%) |
| $12,500 to $14,999 | 0 (0.0%) | 30 (4.3%) |
| $15,000 to $17,499 | 17 (1.8%) | 47 (6.7%) |
| $17,500 to $19,999 | 160 (17.2%) | 0 (0.0%) |
| $20,000 to $22,499 | 0 (0.0%) | 15 (2.1%) |
| $22,500 to $24,999 | 9 (1.0%) | 99 (14.2%) |
| $25,000 to $29,999 | 203 (21.8%) | 55 (7.9%) |
| $30,000 to $34,999 | 14 (1.5%) | 59 (8.5%) |
| $35,000 to $39,999 | 0 (0.0%) | 8 (1.1%) |
| $40,000 to $44,999 | 0 (0.0%) | 15 (2.1%) |
| $45,000 to $49,999 | 40 (4.3%) | 22 (3.2%) |
| $50,000 to $54,999 | 0 (0.0%) | 0 (0.0%) |
| $55,000 to $64,999 | 116 (12.4%) | 0 (0.0%) |
| $65,000 to $74,999 | 9 (1.0%) | 60 (8.6%) |
| $75,000 to $99,999 | 178 (19.1%) | 5 (0.7%) |
| $100,000+ | 91 (9.8%) | 23 (3.3%) |
| Total | 932 (100.0%) | 698 (100.0%) |
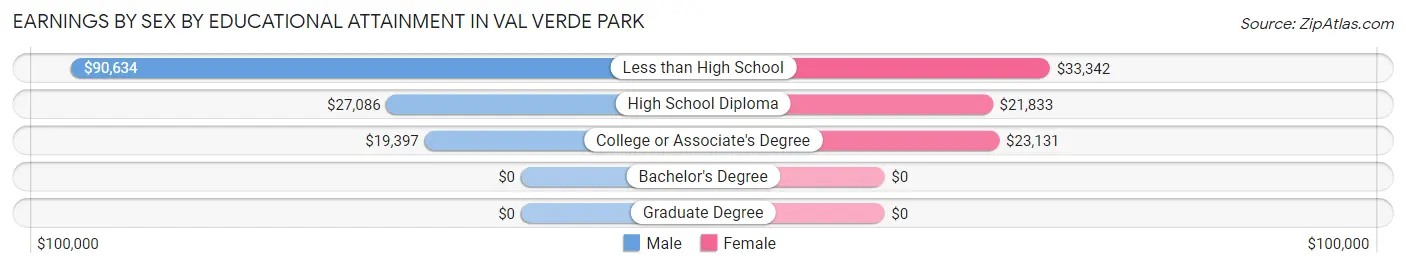
Earnings by Sex by Educational Attainment in Val Verde Park
| Educational Attainment | Male Income | Female Income |
| Less than High School | $90,634 | $33,342 |
| High School Diploma | $27,086 | $21,833 |
| College or Associate's Degree | $19,397 | $23,131 |
| Bachelor's Degree | - | - |
| Graduate Degree | - | - |
| Total | - | - |
Family Income in Val Verde Park
Family Income Brackets in Val Verde Park
According to the Val Verde Park family income data, there are 200 families falling into the $100,000 to $149,999 income range, which is the most common income bracket and makes up 29.5% of all families.
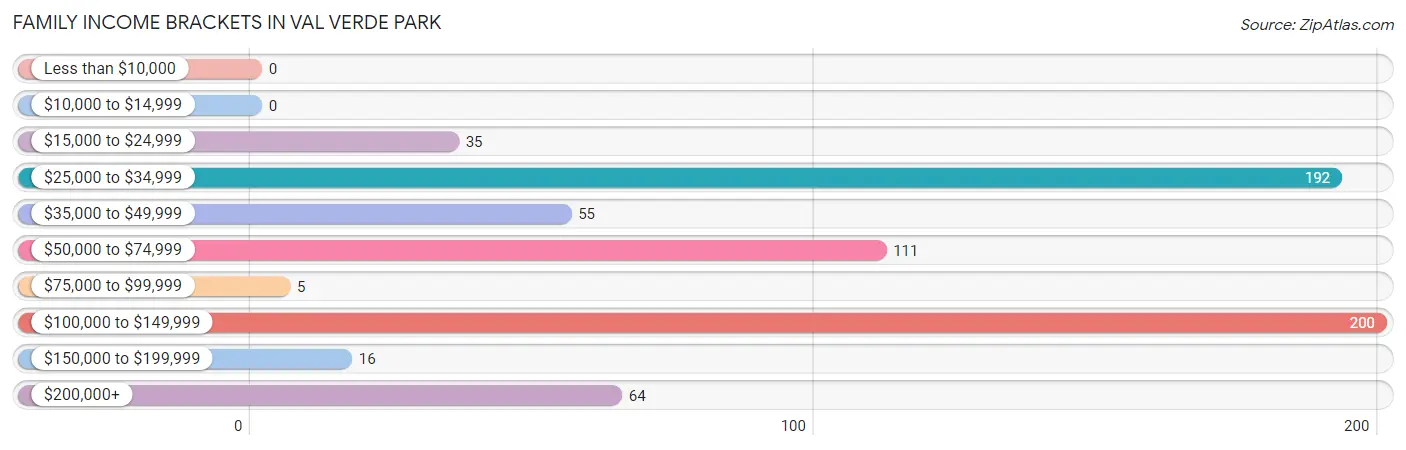
| Income Bracket | # Families | % Families |
| Less than $10,000 | 0 | 0.0% |
| $10,000 to $14,999 | 0 | 0.0% |
| $15,000 to $24,999 | 35 | 5.2% |
| $25,000 to $34,999 | 192 | 28.3% |
| $35,000 to $49,999 | 55 | 8.1% |
| $50,000 to $74,999 | 111 | 16.4% |
| $75,000 to $99,999 | 5 | 0.7% |
| $100,000 to $149,999 | 200 | 29.5% |
| $150,000 to $199,999 | 16 | 2.4% |
| $200,000+ | 64 | 9.4% |
Family Income by Famaliy Size in Val Verde Park
7+ person families (206 | 30.4%) account for the highest median family income in Val Verde Park with $136,813 per family, while 2-person families (154 | 22.7%) have the highest median income of $22,206 per family member.
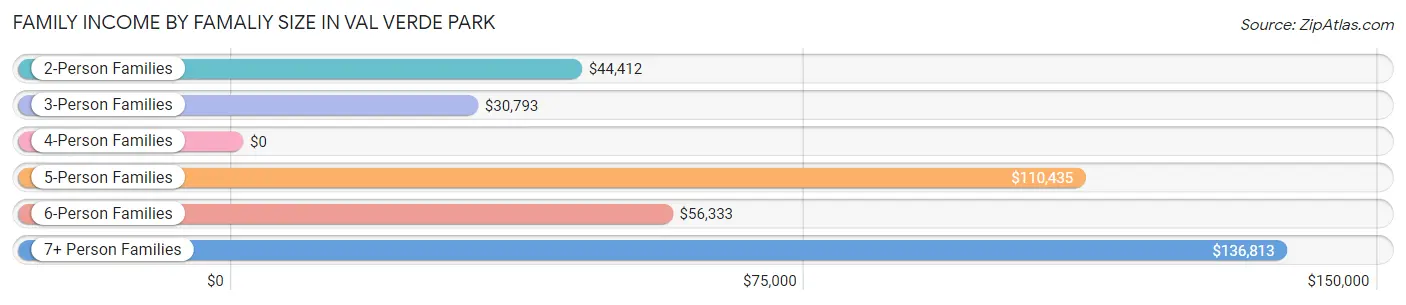
| Income Bracket | # Families | Median Income |
| 2-Person Families | 154 (22.7%) | $44,412 |
| 3-Person Families | 167 (24.6%) | $30,793 |
| 4-Person Families | 29 (4.3%) | $0 |
| 5-Person Families | 70 (10.3%) | $110,435 |
| 6-Person Families | 52 (7.7%) | $56,333 |
| 7+ Person Families | 206 (30.4%) | $136,813 |
| Total | 678 (100.0%) | $56,284 |
Family Income by Number of Earners in Val Verde Park
The median family income in Val Verde Park is $56,284, with families comprising 3+ earners (232) having the highest median family income of $136,866, while families with 2 earners (255) have the lowest median family income of $33,287, accounting for 34.2% and 37.6% of families, respectively.
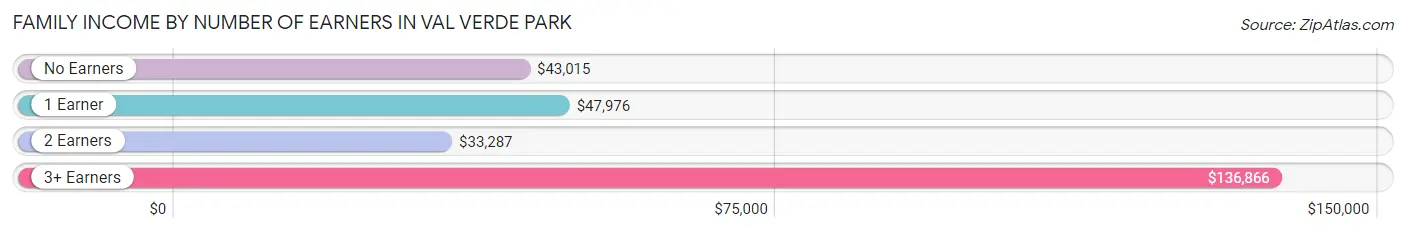
| Number of Earners | # Families | Median Income |
| No Earners | 51 (7.5%) | $43,015 |
| 1 Earner | 140 (20.6%) | $47,976 |
| 2 Earners | 255 (37.6%) | $33,287 |
| 3+ Earners | 232 (34.2%) | $136,866 |
| Total | 678 (100.0%) | $56,284 |
Household Income in Val Verde Park
Household Income Brackets in Val Verde Park
With 316 households falling in the category, the $50,000 to $74,999 income range is the most frequent in Val Verde Park, accounting for 32.4% of all households.
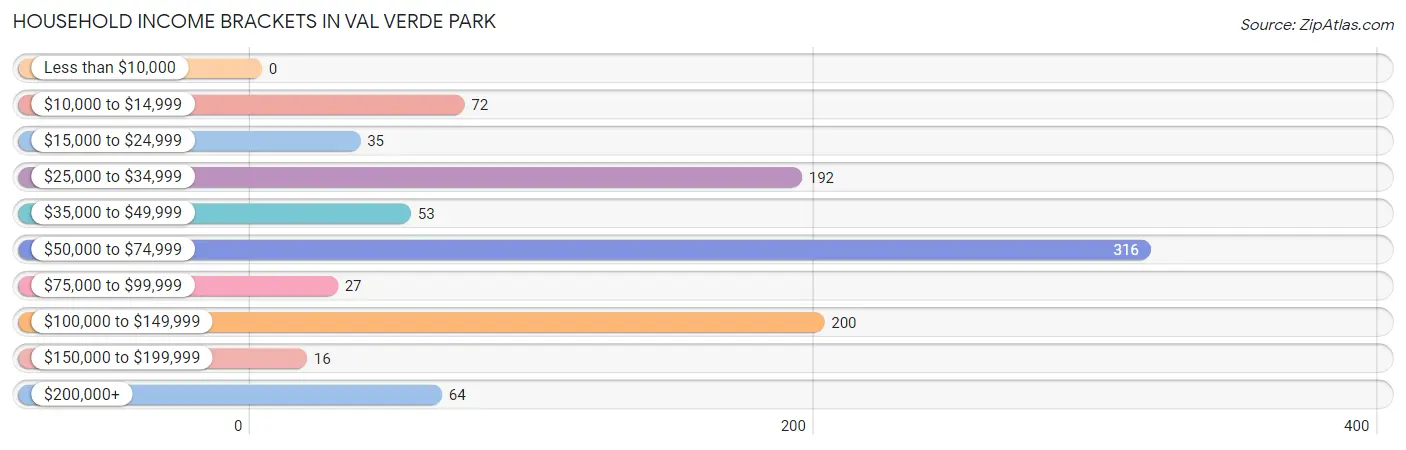
| Income Bracket | # Households | % Households |
| Less than $10,000 | 0 | 0.0% |
| $10,000 to $14,999 | 72 | 7.4% |
| $15,000 to $24,999 | 35 | 3.6% |
| $25,000 to $34,999 | 192 | 19.7% |
| $35,000 to $49,999 | 53 | 5.4% |
| $50,000 to $74,999 | 316 | 32.4% |
| $75,000 to $99,999 | 27 | 2.8% |
| $100,000 to $149,999 | 200 | 20.5% |
| $150,000 to $199,999 | 16 | 1.6% |
| $200,000+ | 64 | 6.6% |
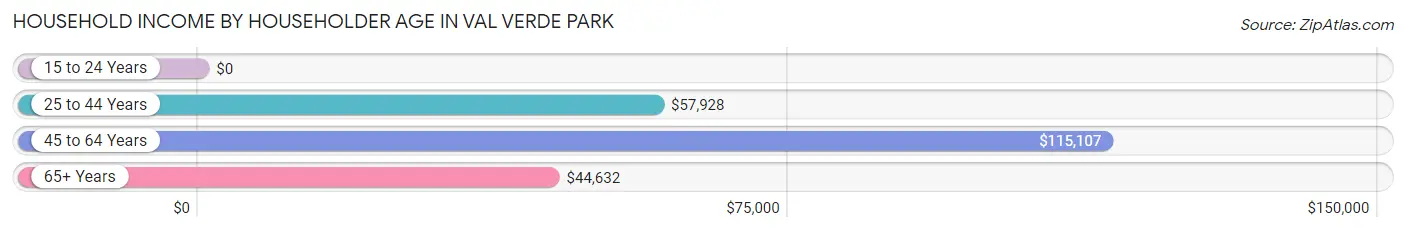
Household Income by Householder Age in Val Verde Park
The median household income in Val Verde Park is $58,815, with the highest median household income of $115,107 found in the 45 to 64 years age bracket for the primary householder. A total of 511 households (52.4%) fall into this category. Meanwhile, the 15 to 24 years age bracket for the primary householder has the lowest median household income of $0, with 60 households (6.1%) in this group.
| Income Bracket | # Households | Median Income |
| 15 to 24 Years | 60 (6.1%) | $0 |
| 25 to 44 Years | 239 (24.5%) | $57,928 |
| 45 to 64 Years | 511 (52.4%) | $115,107 |
| 65+ Years | 165 (16.9%) | $44,632 |
| Total | 975 (100.0%) | $58,815 |
Poverty in Val Verde Park
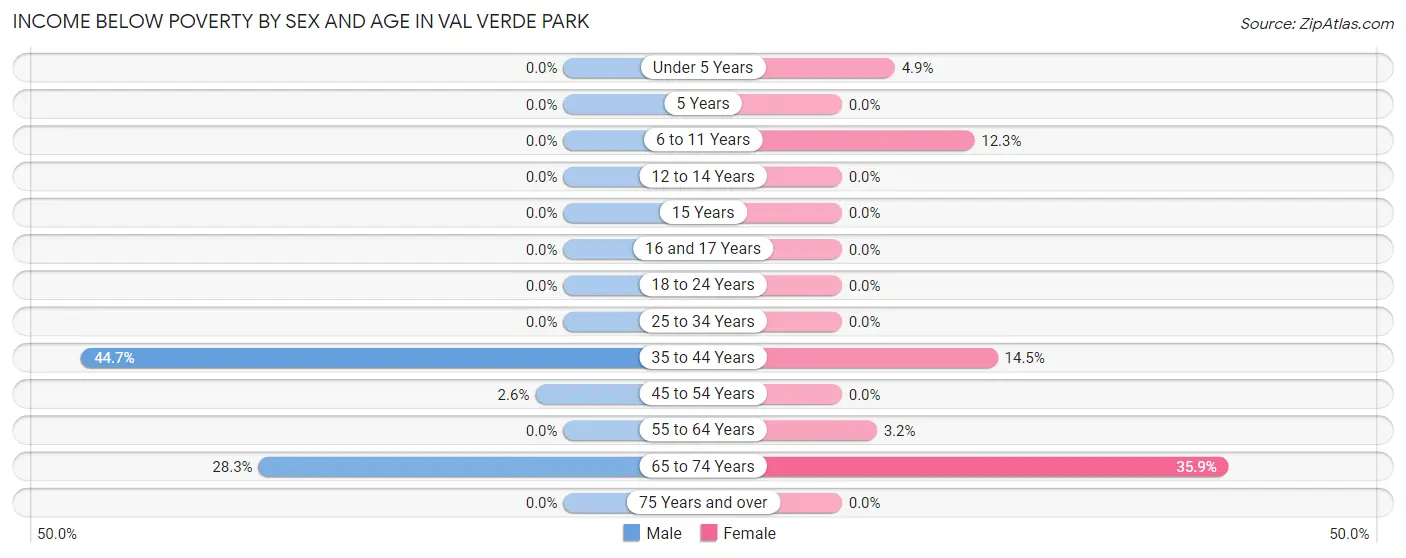
Income Below Poverty by Sex and Age in Val Verde Park
With 2.5% poverty level for males and 5.2% for females among the residents of Val Verde Park, 35 to 44 year old males and 65 to 74 year old females are the most vulnerable to poverty, with 17 males (44.7%) and 42 females (35.9%) in their respective age groups living below the poverty level.
| Age Bracket | Male | Female |
| Under 5 Years | 0 (0.0%) | 14 (4.9%) |
| 5 Years | 0 (0.0%) | 0 (0.0%) |
| 6 to 11 Years | 0 (0.0%) | 15 (12.3%) |
| 12 to 14 Years | 0 (0.0%) | 0 (0.0%) |
| 15 Years | 0 (0.0%) | 0 (0.0%) |
| 16 and 17 Years | 0 (0.0%) | 0 (0.0%) |
| 18 to 24 Years | 0 (0.0%) | 0 (0.0%) |
| 25 to 34 Years | 0 (0.0%) | 0 (0.0%) |
| 35 to 44 Years | 17 (44.7%) | 12 (14.5%) |
| 45 to 54 Years | 7 (2.6%) | 0 (0.0%) |
| 55 to 64 Years | 0 (0.0%) | 8 (3.2%) |
| 65 to 74 Years | 15 (28.3%) | 42 (35.9%) |
| 75 Years and over | 0 (0.0%) | 0 (0.0%) |
| Total | 39 (2.5%) | 91 (5.2%) |
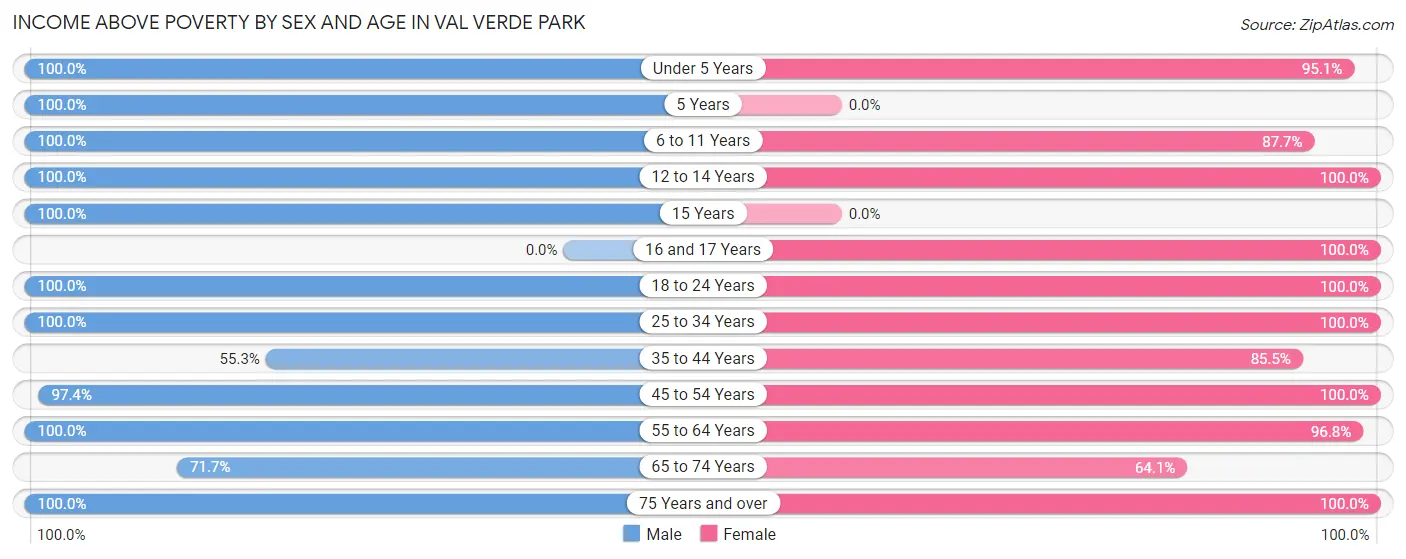
Income Above Poverty by Sex and Age in Val Verde Park
According to the poverty statistics in Val Verde Park, males aged under 5 years and females aged 12 to 14 years are the age groups that are most secure financially, with 100.0% of males and 100.0% of females in these age groups living above the poverty line.
| Age Bracket | Male | Female |
| Under 5 Years | 160 (100.0%) | 271 (95.1%) |
| 5 Years | 98 (100.0%) | 0 (0.0%) |
| 6 to 11 Years | 202 (100.0%) | 107 (87.7%) |
| 12 to 14 Years | 31 (100.0%) | 73 (100.0%) |
| 15 Years | 24 (100.0%) | 0 (0.0%) |
| 16 and 17 Years | 0 (0.0%) | 27 (100.0%) |
| 18 to 24 Years | 53 (100.0%) | 265 (100.0%) |
| 25 to 34 Years | 577 (100.0%) | 296 (100.0%) |
| 35 to 44 Years | 21 (55.3%) | 71 (85.5%) |
| 45 to 54 Years | 261 (97.4%) | 176 (100.0%) |
| 55 to 64 Years | 50 (100.0%) | 239 (96.8%) |
| 65 to 74 Years | 38 (71.7%) | 75 (64.1%) |
| 75 Years and over | 28 (100.0%) | 46 (100.0%) |
| Total | 1,543 (97.5%) | 1,646 (94.8%) |
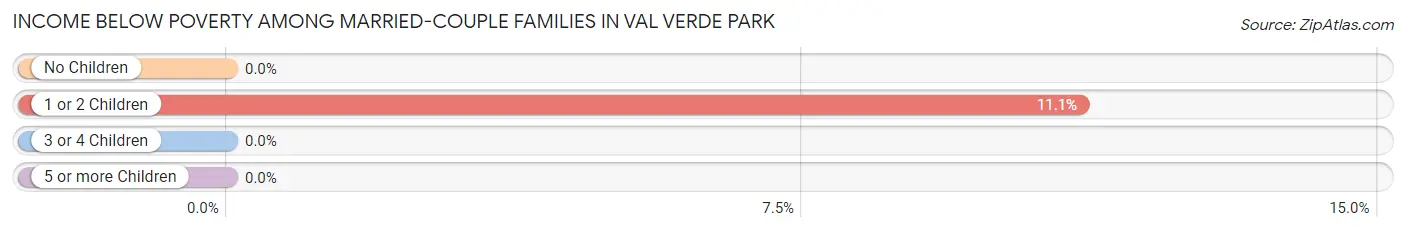
Income Below Poverty Among Married-Couple Families in Val Verde Park
The poverty statistics for married-couple families in Val Verde Park show that 4.0% or 17 of the total 425 families live below the poverty line. Families with 1 or 2 children have the highest poverty rate of 11.1%, comprising of 17 families. On the other hand, families with no children have the lowest poverty rate of 0.0%, which includes 0 families.
| Children | Above Poverty | Below Poverty |
| No Children | 106 (100.0%) | 0 (0.0%) |
| 1 or 2 Children | 136 (88.9%) | 17 (11.1%) |
| 3 or 4 Children | 166 (100.0%) | 0 (0.0%) |
| 5 or more Children | 0 (0.0%) | 0 (0.0%) |
| Total | 408 (96.0%) | 17 (4.0%) |
Income Below Poverty Among Single-Parent Households in Val Verde Park
| Children | Single Father | Single Mother |
| No Children | 0 (0.0%) | 0 (0.0%) |
| 1 or 2 Children | 0 (0.0%) | 0 (0.0%) |
| 3 or 4 Children | 0 (0.0%) | 0 (0.0%) |
| 5 or more Children | 0 (0.0%) | 0 (0.0%) |
| Total | 0 (0.0%) | 0 (0.0%) |
Income Below Poverty Among Married-Couple vs Single-Parent Households in Val Verde Park
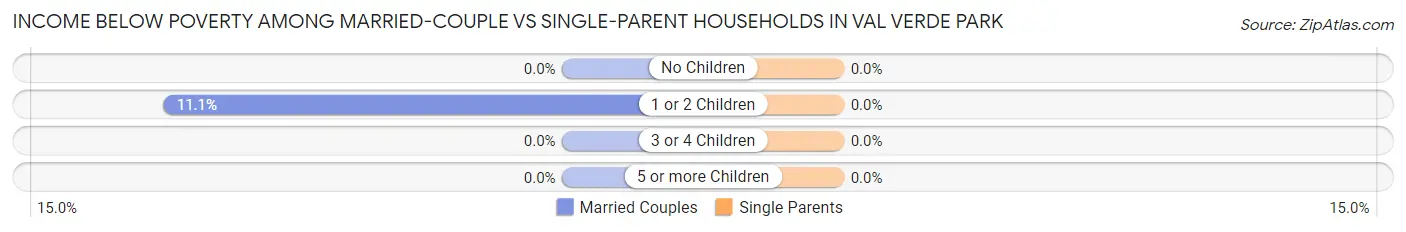
| Children | Married-Couple Families | Single-Parent Households |
| No Children | 0 (0.0%) | 0 (0.0%) |
| 1 or 2 Children | 17 (11.1%) | 0 (0.0%) |
| 3 or 4 Children | 0 (0.0%) | 0 (0.0%) |
| 5 or more Children | 0 (0.0%) | 0 (0.0%) |
| Total | 17 (4.0%) | 0 (0.0%) |
Race in Val Verde Park
The most populous races in Val Verde Park are Hispanic or Latino (3,205 | 96.6%), White / Caucasian (1,844 | 55.6%), and Two or more Races (1,293 | 39.0%).
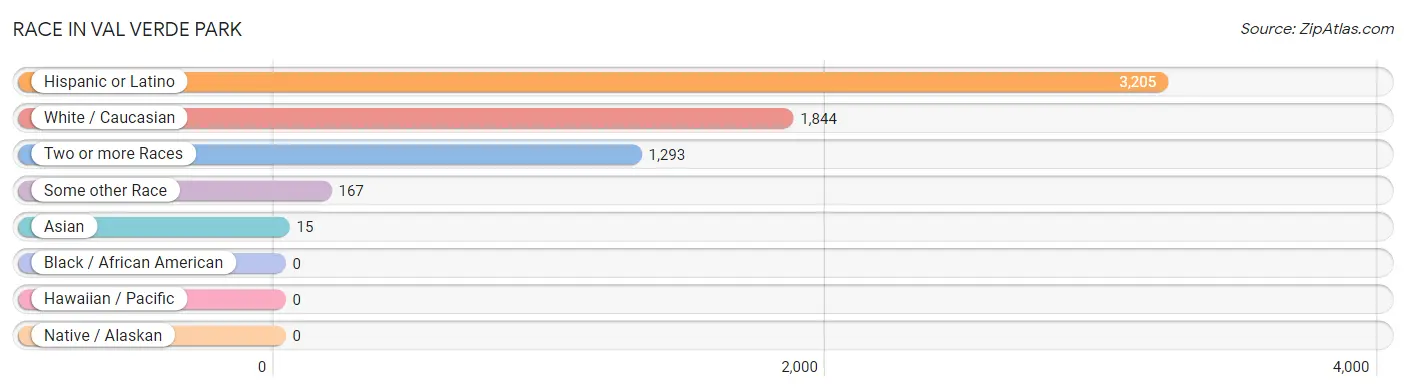
| Race | # Population | % Population |
| Asian | 15 | 0.4% |
| Black / African American | 0 | 0.0% |
| Hawaiian / Pacific | 0 | 0.0% |
| Hispanic or Latino | 3,205 | 96.6% |
| Native / Alaskan | 0 | 0.0% |
| White / Caucasian | 1,844 | 55.6% |
| Two or more Races | 1,293 | 39.0% |
| Some other Race | 167 | 5.0% |
| Total | 3,319 | 100.0% |
Ancestry in Val Verde Park
The most populous ancestries reported in Val Verde Park are Mexican (3,142 | 94.7%), English (100 | 3.0%), Polish (35 | 1.1%), and Korean (15 | 0.4%), together accounting for 99.2% of all Val Verde Park residents.
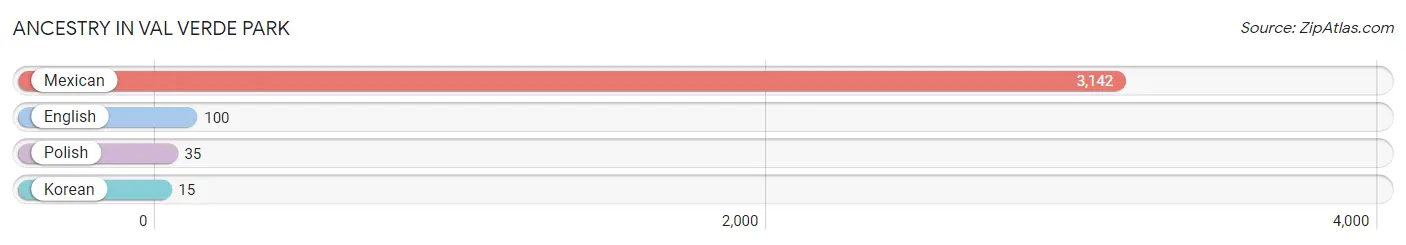
| Ancestry | # Population | % Population |
| English | 100 | 3.0% |
| Korean | 15 | 0.4% |
| Mexican | 3,142 | 94.7% |
| Polish | 35 | 1.1% | View All 4 Rows |
Immigrants in Val Verde Park
The most numerous immigrant groups reported in Val Verde Park came from Central America (626 | 18.9%), Latin America (626 | 18.9%), Mexico (626 | 18.9%), Asia (15 | 0.4%), and Philippines (15 | 0.4%), together accounting for 57.5% of all Val Verde Park residents.
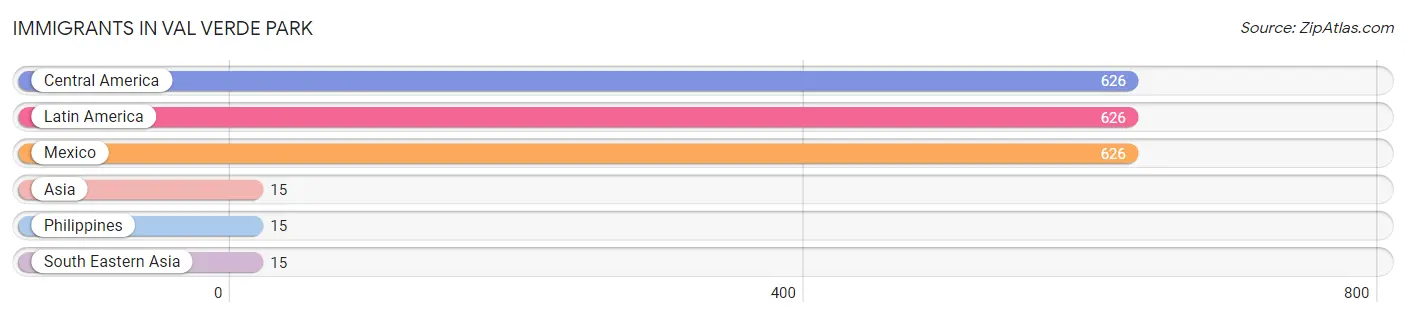
| Immigration Origin | # Population | % Population |
| Asia | 15 | 0.4% |
| Central America | 626 | 18.9% |
| Latin America | 626 | 18.9% |
| Mexico | 626 | 18.9% |
| Philippines | 15 | 0.4% |
| South Eastern Asia | 15 | 0.4% | View All 6 Rows |
Sex and Age in Val Verde Park
Sex and Age in Val Verde Park
The most populous age groups in Val Verde Park are 25 to 29 Years (407 | 25.7%) for men and Under 5 Years (285 | 16.4%) for women.
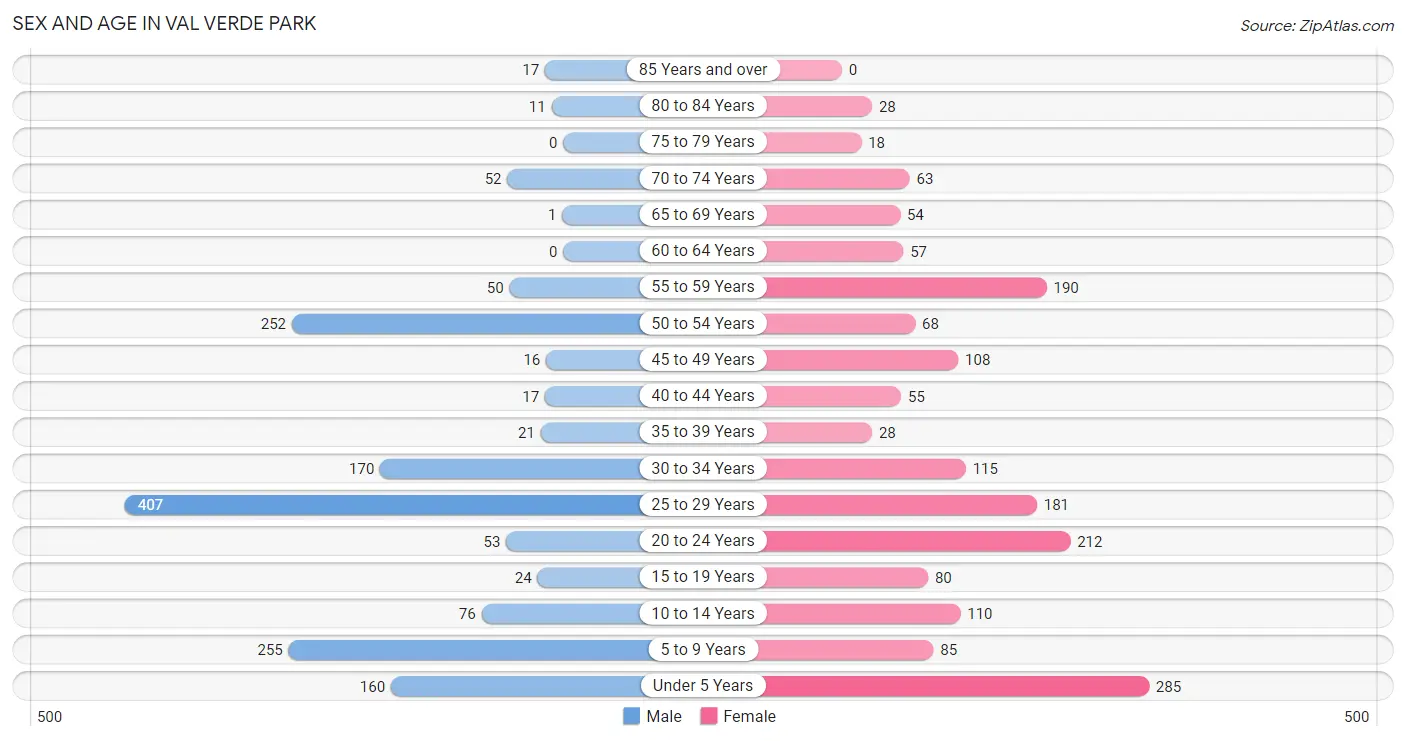
| Age Bracket | Male | Female |
| Under 5 Years | 160 (10.1%) | 285 (16.4%) |
| 5 to 9 Years | 255 (16.1%) | 85 (4.9%) |
| 10 to 14 Years | 76 (4.8%) | 110 (6.3%) |
| 15 to 19 Years | 24 (1.5%) | 80 (4.6%) |
| 20 to 24 Years | 53 (3.4%) | 212 (12.2%) |
| 25 to 29 Years | 407 (25.7%) | 181 (10.4%) |
| 30 to 34 Years | 170 (10.7%) | 115 (6.6%) |
| 35 to 39 Years | 21 (1.3%) | 28 (1.6%) |
| 40 to 44 Years | 17 (1.1%) | 55 (3.2%) |
| 45 to 49 Years | 16 (1.0%) | 108 (6.2%) |
| 50 to 54 Years | 252 (15.9%) | 68 (3.9%) |
| 55 to 59 Years | 50 (3.2%) | 190 (10.9%) |
| 60 to 64 Years | 0 (0.0%) | 57 (3.3%) |
| 65 to 69 Years | 1 (0.1%) | 54 (3.1%) |
| 70 to 74 Years | 52 (3.3%) | 63 (3.6%) |
| 75 to 79 Years | 0 (0.0%) | 18 (1.0%) |
| 80 to 84 Years | 11 (0.7%) | 28 (1.6%) |
| 85 Years and over | 17 (1.1%) | 0 (0.0%) |
| Total | 1,582 (100.0%) | 1,737 (100.0%) |
Families and Households in Val Verde Park
Median Family Size in Val Verde Park
The median family size in Val Verde Park is 4.44 persons per family, with married-couple families (425 | 62.7%) accounting for the largest median family size of 4.66 persons per family. On the other hand, single male/father families (32 | 4.7%) represent the smallest median family size with 2.38 persons per family.
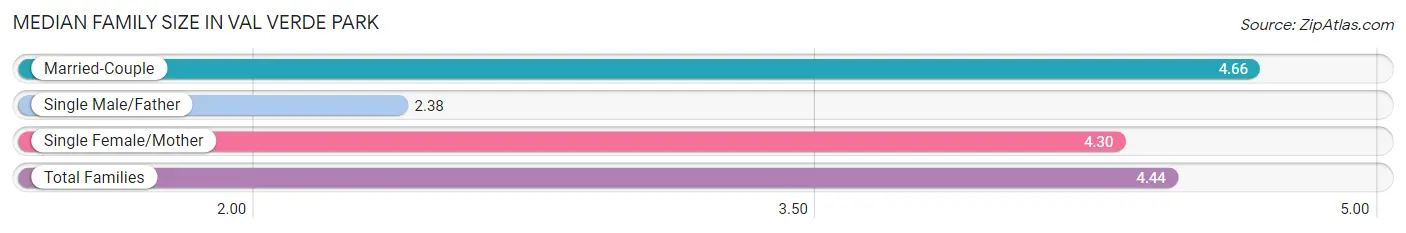
| Family Type | # Families | Family Size |
| Married-Couple | 425 (62.7%) | 4.66 |
| Single Male/Father | 32 (4.7%) | 2.38 |
| Single Female/Mother | 221 (32.6%) | 4.30 |
| Total Families | 678 (100.0%) | 4.44 |
Median Household Size in Val Verde Park
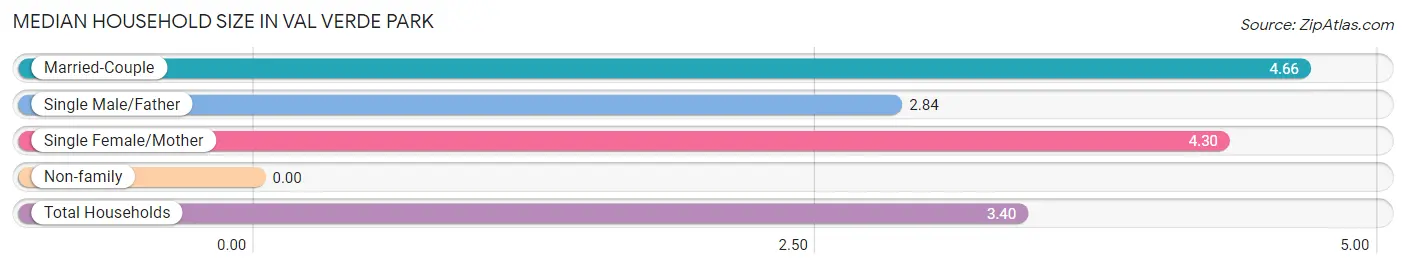
| Household Type | # Households | Household Size |
| Married-Couple | 425 (43.6%) | 4.66 |
| Single Male/Father | 32 (3.3%) | 2.84 |
| Single Female/Mother | 221 (22.7%) | 4.30 |
| Non-family | 297 (30.5%) | - |
| Total Households | 975 (100.0%) | 3.40 |
Household Size by Marriage Status in Val Verde Park
Out of a total of 975 households in Val Verde Park, 678 (69.5%) are family households, while 297 (30.5%) are nonfamily households. The most numerous type of family households are 7+ person households, comprising 206, and the most common type of nonfamily households are 1-person households, comprising 297.
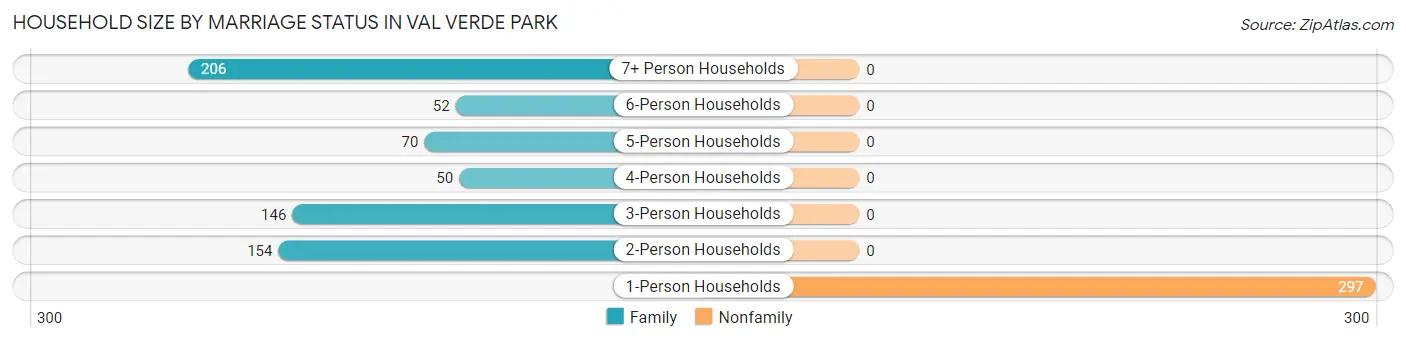
| Household Size | Family Households | Nonfamily Households |
| 1-Person Households | - | 297 (30.5%) |
| 2-Person Households | 154 (15.8%) | 0 (0.0%) |
| 3-Person Households | 146 (15.0%) | 0 (0.0%) |
| 4-Person Households | 50 (5.1%) | 0 (0.0%) |
| 5-Person Households | 70 (7.2%) | 0 (0.0%) |
| 6-Person Households | 52 (5.3%) | 0 (0.0%) |
| 7+ Person Households | 206 (21.1%) | 0 (0.0%) |
| Total | 678 (69.5%) | 297 (30.5%) |
Female Fertility in Val Verde Park
Fertility by Age in Val Verde Park
Average fertility rate in Val Verde Park is 124.0 births per 1,000 women. Women in the age bracket of 20 to 34 years have the highest fertility rate with 193.0 births per 1,000 women. Women in the age bracket of 20 to 34 years acount for 100.0% of all women with births.
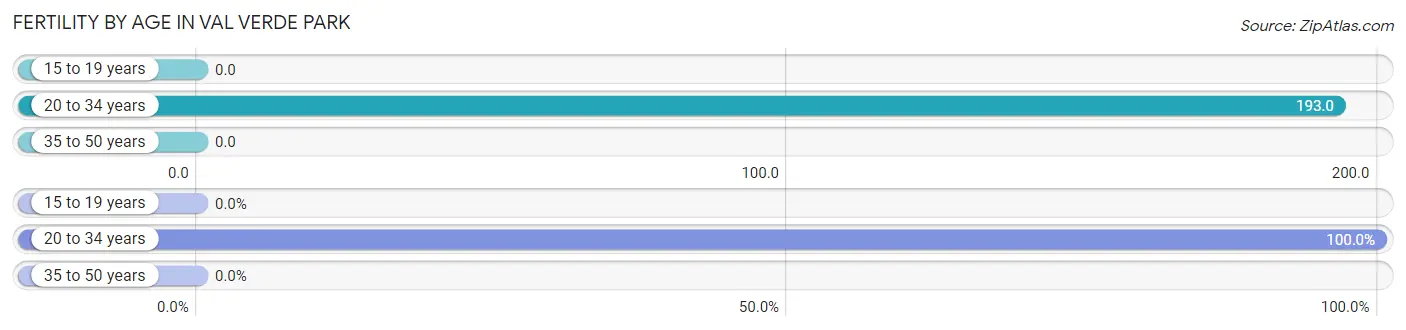
| Age Bracket | Women with Births | Births / 1,000 Women |
| 15 to 19 years | 0 (0.0%) | 0.0 |
| 20 to 34 years | 98 (100.0%) | 193.0 |
| 35 to 50 years | 0 (0.0%) | 0.0 |
| Total | 98 (100.0%) | 124.0 |
Fertility by Age by Marriage Status in Val Verde Park
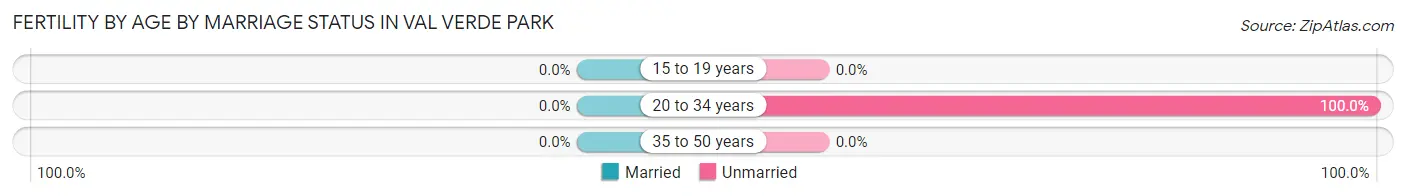
| Age Bracket | Married | Unmarried |
| 15 to 19 years | 0 (0.0%) | 0 (0.0%) |
| 20 to 34 years | 0 (0.0%) | 98 (100.0%) |
| 35 to 50 years | 0 (0.0%) | 0 (0.0%) |
| Total | 0 (0.0%) | 98 (100.0%) |
Fertility by Education in Val Verde Park
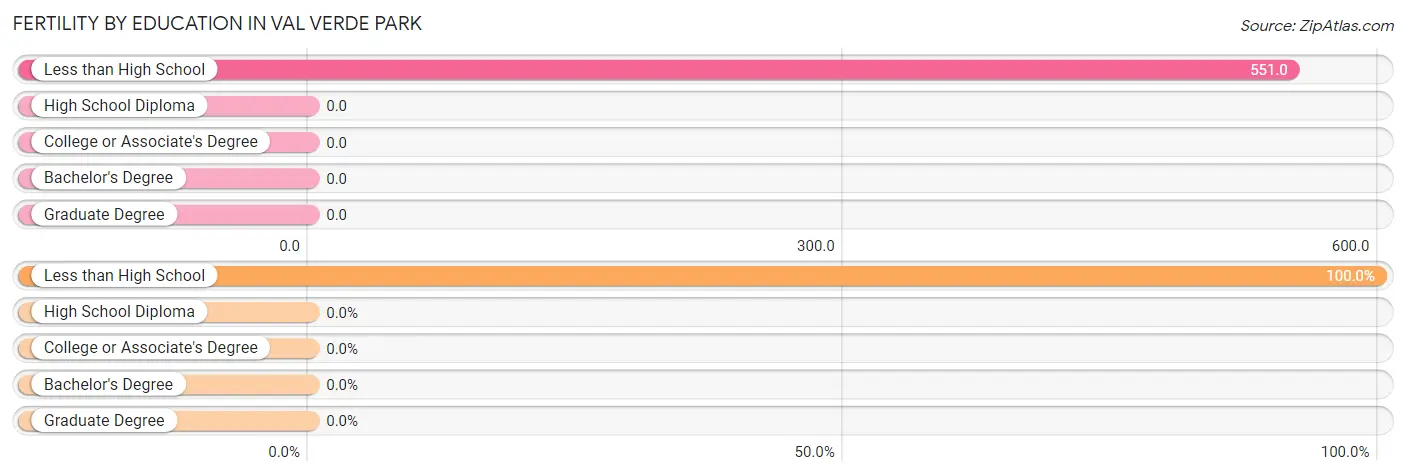
| Educational Attainment | Women with Births | Births / 1,000 Women |
| Less than High School | 98 (100.0%) | 551.0 |
| High School Diploma | 0 (0.0%) | 0.0 |
| College or Associate's Degree | 0 (0.0%) | 0.0 |
| Bachelor's Degree | 0 (0.0%) | 0.0 |
| Graduate Degree | 0 (0.0%) | 0.0 |
| Total | 98 (100.0%) | 124.0 |
Fertility by Education by Marriage Status in Val Verde Park
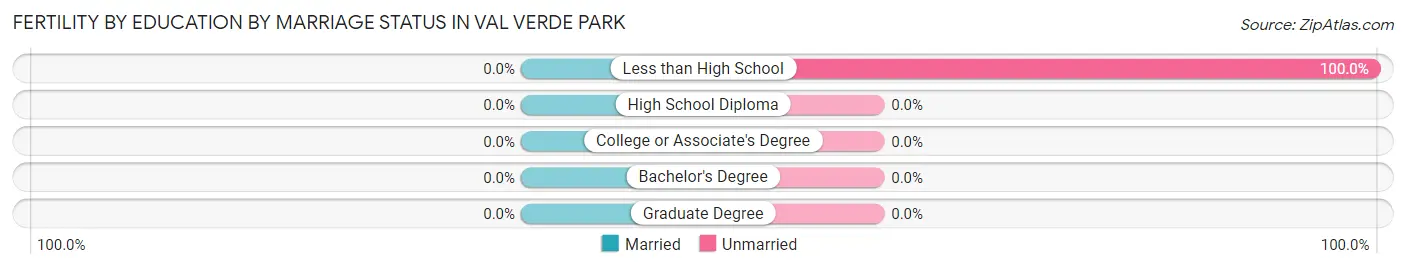
| Educational Attainment | Married | Unmarried |
| Less than High School | 0 (0.0%) | 98 (100.0%) |
| High School Diploma | 0 (0.0%) | 0 (0.0%) |
| College or Associate's Degree | 0 (0.0%) | 0 (0.0%) |
| Bachelor's Degree | 0 (0.0%) | 0 (0.0%) |
| Graduate Degree | 0 (0.0%) | 0 (0.0%) |
| Total | 0 (0.0%) | 98 (100.0%) |
Employment Characteristics in Val Verde Park
Employment by Class of Employer in Val Verde Park
Among the 1,435 employed individuals in Val Verde Park, private company employees (785 | 54.7%), federal government employees (214 | 14.9%), and not-for-profit organizations (130 | 9.1%) make up the most common classes of employment.
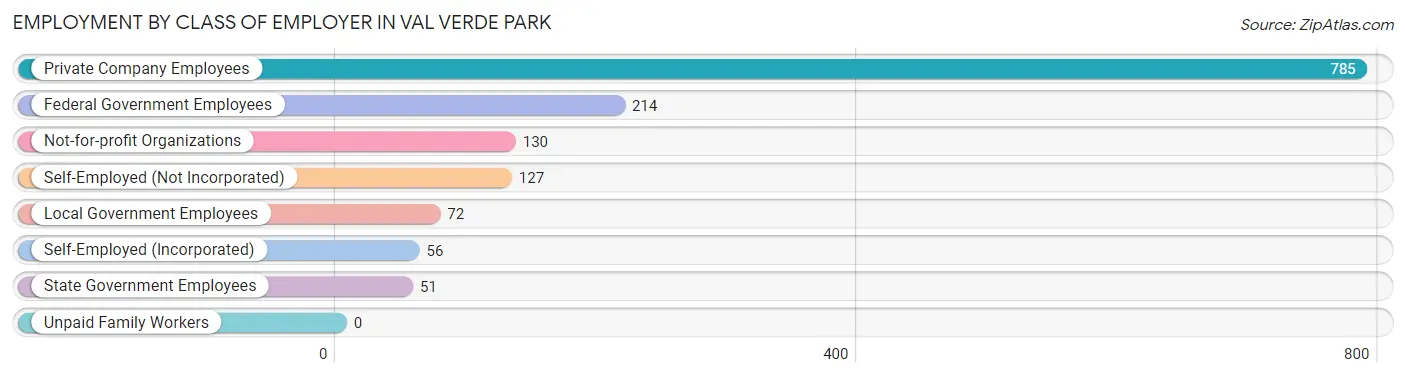
| Employer Class | # Employees | % Employees |
| Private Company Employees | 785 | 54.7% |
| Self-Employed (Incorporated) | 56 | 3.9% |
| Self-Employed (Not Incorporated) | 127 | 8.8% |
| Not-for-profit Organizations | 130 | 9.1% |
| Local Government Employees | 72 | 5.0% |
| State Government Employees | 51 | 3.5% |
| Federal Government Employees | 214 | 14.9% |
| Unpaid Family Workers | 0 | 0.0% |
| Total | 1,435 | 100.0% |
Employment Status by Age in Val Verde Park
According to the labor force statistics for Val Verde Park, out of the total population over 16 years of age (2,324), 69.7% or 1,620 individuals are in the labor force, with 1.8% or 29 of them unemployed. The age group with the highest labor force participation rate is 30 to 34 years, with 93.0% or 265 individuals in the labor force. Within the labor force, the 55 to 59 years age range has the highest percentage of unemployed individuals, with 21.1% or 15 of them being unemployed.
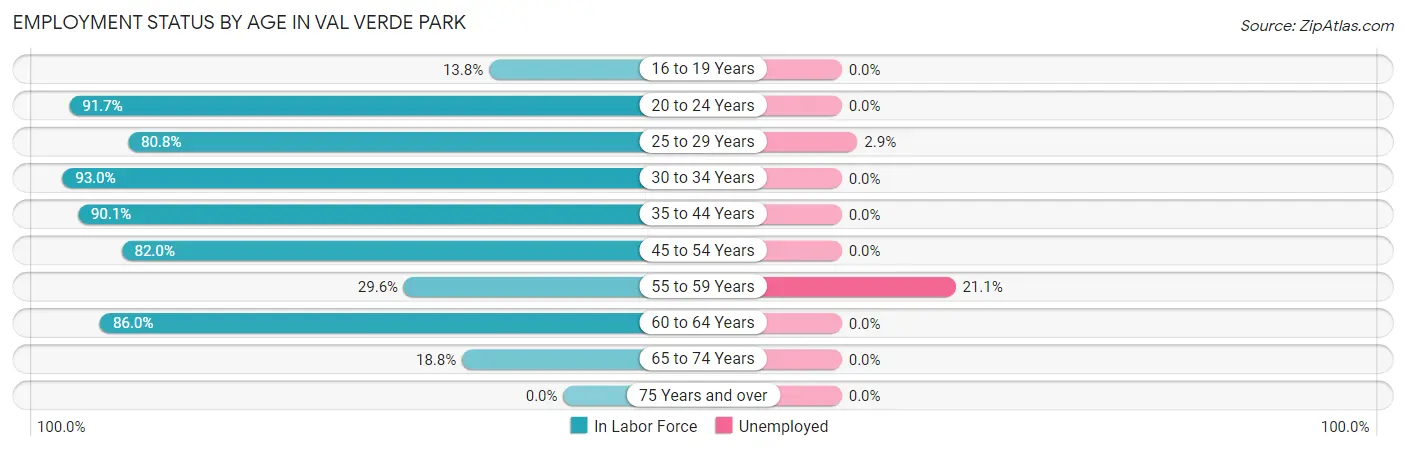
| Age Bracket | In Labor Force | Unemployed |
| 16 to 19 Years | 11 (13.8%) | 0 (0.0%) |
| 20 to 24 Years | 243 (91.7%) | 0 (0.0%) |
| 25 to 29 Years | 475 (80.8%) | 14 (2.9%) |
| 30 to 34 Years | 265 (93.0%) | 0 (0.0%) |
| 35 to 44 Years | 109 (90.1%) | 0 (0.0%) |
| 45 to 54 Years | 364 (82.0%) | 0 (0.0%) |
| 55 to 59 Years | 71 (29.6%) | 15 (21.1%) |
| 60 to 64 Years | 49 (86.0%) | 0 (0.0%) |
| 65 to 74 Years | 32 (18.8%) | 0 (0.0%) |
| 75 Years and over | 0 (0.0%) | 0 (0.0%) |
| Total | 1,620 (69.7%) | 29 (1.8%) |
Employment Status by Educational Attainment in Val Verde Park
According to labor force statistics for Val Verde Park, 76.8% of individuals (1,332) out of the total population between 25 and 64 years of age (1,735) are in the labor force, with 2.2% or 29 of them being unemployed. The group with the highest labor force participation rate are those with the educational attainment of college / associate degree, with 92.7% or 510 individuals in the labor force. Within the labor force, individuals with high school diploma education have the highest percentage of unemployment, with 3.7% or 14 of them being unemployed.
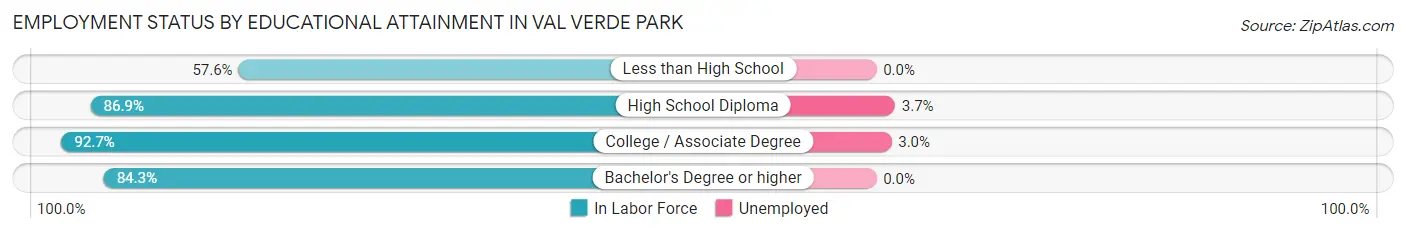
| Educational Attainment | In Labor Force | Unemployed |
| Less than High School | 403 (57.6%) | 0 (0.0%) |
| High School Diploma | 377 (86.9%) | 16 (3.7%) |
| College / Associate Degree | 510 (92.7%) | 16 (3.0%) |
| Bachelor's Degree or higher | 43 (84.3%) | 0 (0.0%) |
| Total | 1,332 (76.8%) | 38 (2.2%) |
Employment Occupations by Sex in Val Verde Park
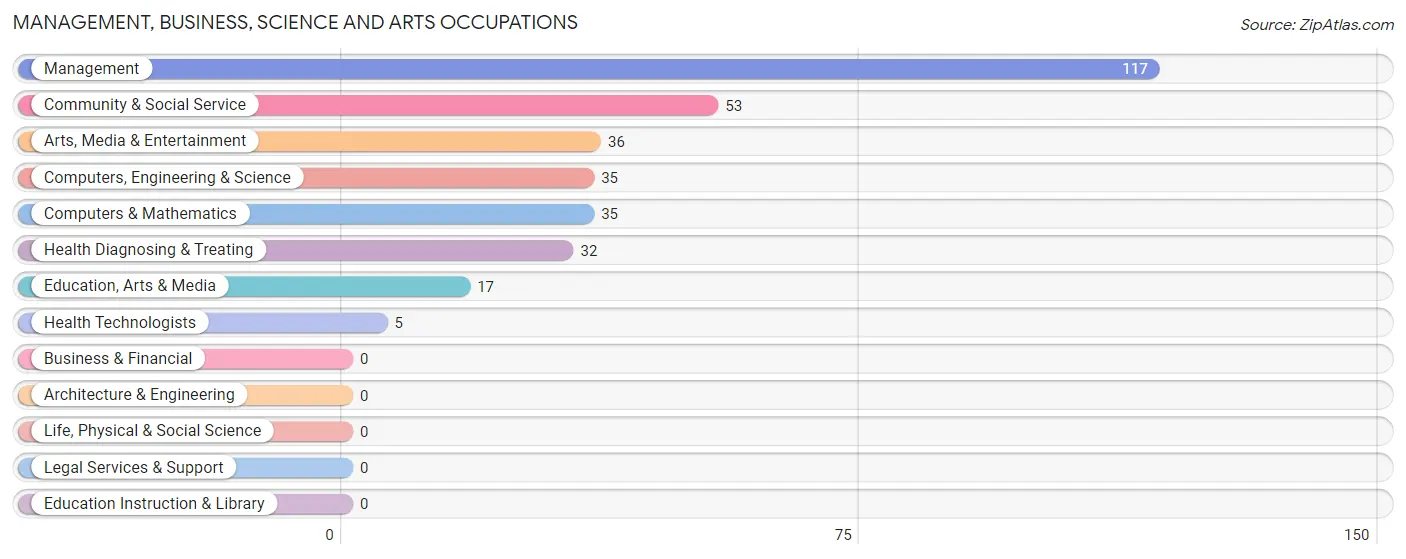
Management, Business, Science and Arts Occupations
The most common Management, Business, Science and Arts occupations in Val Verde Park are Management (117 | 7.4%), Community & Social Service (53 | 3.4%), Arts, Media & Entertainment (36 | 2.3%), Computers, Engineering & Science (35 | 2.2%), and Computers & Mathematics (35 | 2.2%).
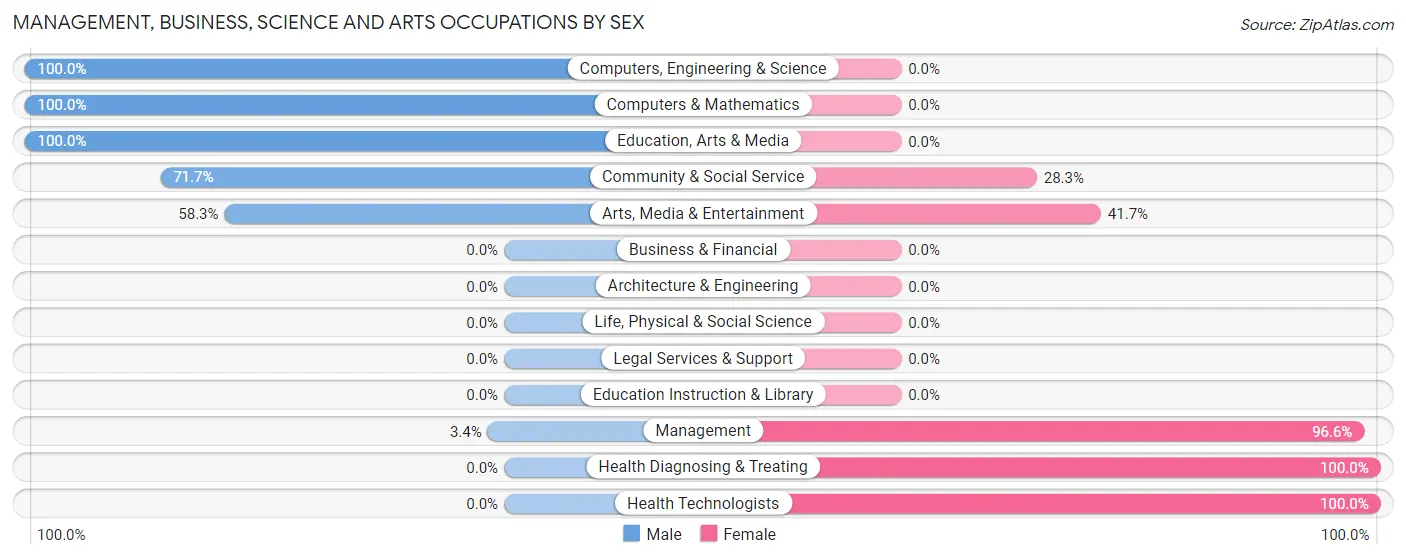
Management, Business, Science and Arts Occupations by Sex
Within the Management, Business, Science and Arts occupations in Val Verde Park, the most male-oriented occupations are Computers, Engineering & Science (100.0%), Computers & Mathematics (100.0%), and Education, Arts & Media (100.0%), while the most female-oriented occupations are Health Diagnosing & Treating (100.0%), Health Technologists (100.0%), and Management (96.6%).
| Occupation | Male | Female |
| Management | 4 (3.4%) | 113 (96.6%) |
| Business & Financial | 0 (0.0%) | 0 (0.0%) |
| Computers, Engineering & Science | 35 (100.0%) | 0 (0.0%) |
| Computers & Mathematics | 35 (100.0%) | 0 (0.0%) |
| Architecture & Engineering | 0 (0.0%) | 0 (0.0%) |
| Life, Physical & Social Science | 0 (0.0%) | 0 (0.0%) |
| Community & Social Service | 38 (71.7%) | 15 (28.3%) |
| Education, Arts & Media | 17 (100.0%) | 0 (0.0%) |
| Legal Services & Support | 0 (0.0%) | 0 (0.0%) |
| Education Instruction & Library | 0 (0.0%) | 0 (0.0%) |
| Arts, Media & Entertainment | 21 (58.3%) | 15 (41.7%) |
| Health Diagnosing & Treating | 0 (0.0%) | 32 (100.0%) |
| Health Technologists | 0 (0.0%) | 5 (100.0%) |
| Total (Category) | 77 (32.5%) | 160 (67.5%) |
| Total (Overall) | 892 (56.4%) | 689 (43.6%) |
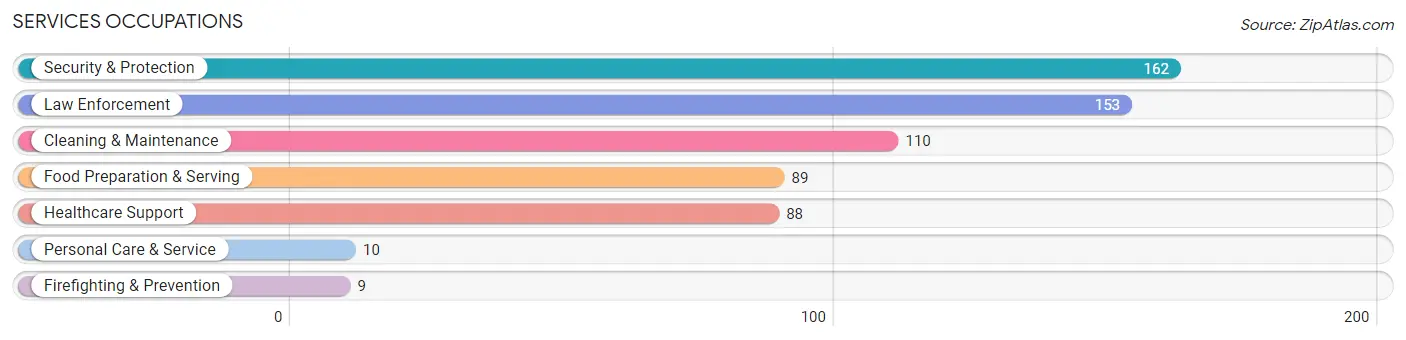
Services Occupations
The most common Services occupations in Val Verde Park are Security & Protection (162 | 10.2%), Law Enforcement (153 | 9.7%), Cleaning & Maintenance (110 | 7.0%), Food Preparation & Serving (89 | 5.6%), and Healthcare Support (88 | 5.6%).
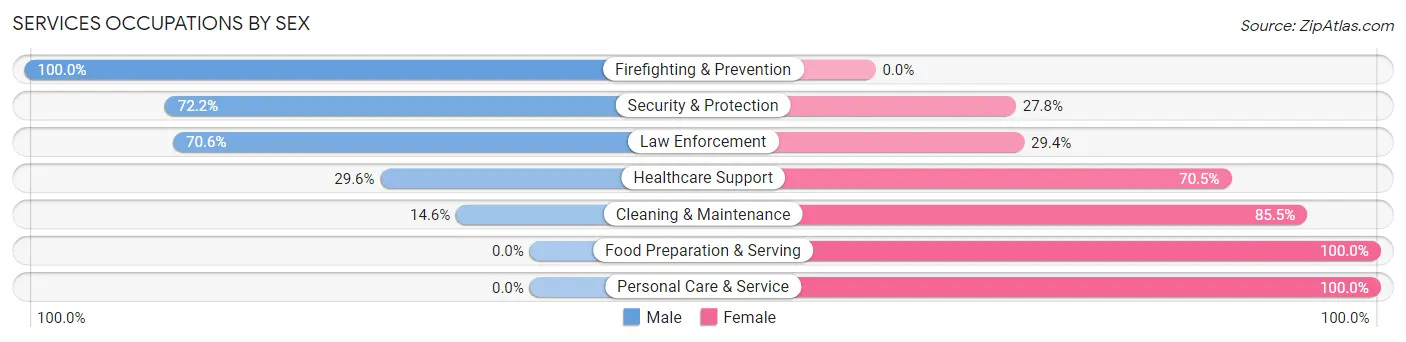
Services Occupations by Sex
Within the Services occupations in Val Verde Park, the most male-oriented occupations are Firefighting & Prevention (100.0%), Security & Protection (72.2%), and Law Enforcement (70.6%), while the most female-oriented occupations are Food Preparation & Serving (100.0%), Personal Care & Service (100.0%), and Cleaning & Maintenance (85.5%).
| Occupation | Male | Female |
| Healthcare Support | 26 (29.5%) | 62 (70.5%) |
| Security & Protection | 117 (72.2%) | 45 (27.8%) |
| Firefighting & Prevention | 9 (100.0%) | 0 (0.0%) |
| Law Enforcement | 108 (70.6%) | 45 (29.4%) |
| Food Preparation & Serving | 0 (0.0%) | 89 (100.0%) |
| Cleaning & Maintenance | 16 (14.5%) | 94 (85.5%) |
| Personal Care & Service | 0 (0.0%) | 10 (100.0%) |
| Total (Category) | 159 (34.6%) | 300 (65.4%) |
| Total (Overall) | 892 (56.4%) | 689 (43.6%) |
Sales and Office Occupations
The most common Sales and Office occupations in Val Verde Park are Office & Administration (318 | 20.1%), and Sales & Related (44 | 2.8%).

Sales and Office Occupations by Sex

| Occupation | Male | Female |
| Sales & Related | 0 (0.0%) | 44 (100.0%) |
| Office & Administration | 143 (45.0%) | 175 (55.0%) |
| Total (Category) | 143 (39.5%) | 219 (60.5%) |
| Total (Overall) | 892 (56.4%) | 689 (43.6%) |
Natural Resources, Construction and Maintenance Occupations
The most common Natural Resources, Construction and Maintenance occupations in Val Verde Park are , and Construction & Extraction (292 | 18.5%).
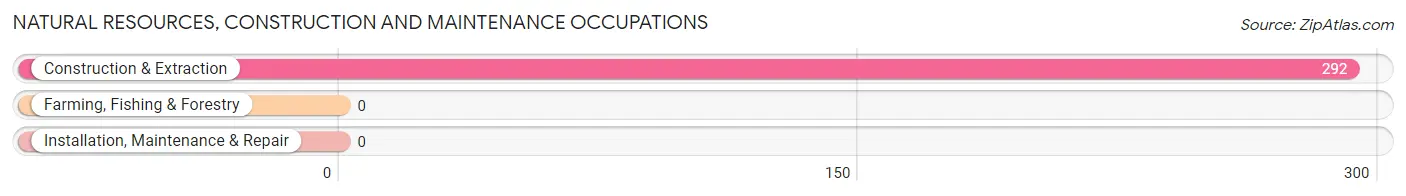
Natural Resources, Construction and Maintenance Occupations by Sex
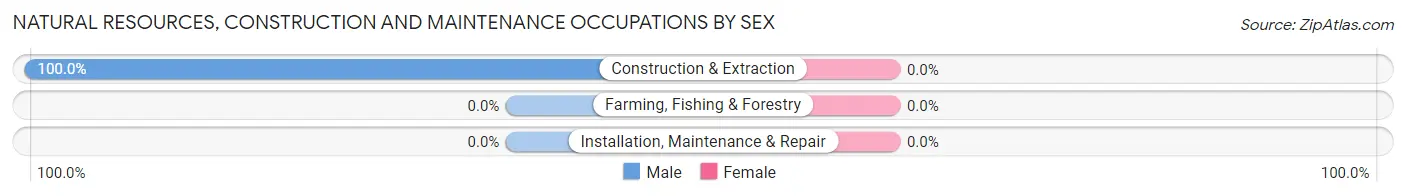
| Occupation | Male | Female |
| Farming, Fishing & Forestry | 0 (0.0%) | 0 (0.0%) |
| Construction & Extraction | 292 (100.0%) | 0 (0.0%) |
| Installation, Maintenance & Repair | 0 (0.0%) | 0 (0.0%) |
| Total (Category) | 292 (100.0%) | 0 (0.0%) |
| Total (Overall) | 892 (56.4%) | 689 (43.6%) |
Production, Transportation and Moving Occupations
The most common Production, Transportation and Moving occupations in Val Verde Park are Production (150 | 9.5%), Material Moving (46 | 2.9%), and Transportation (35 | 2.2%).
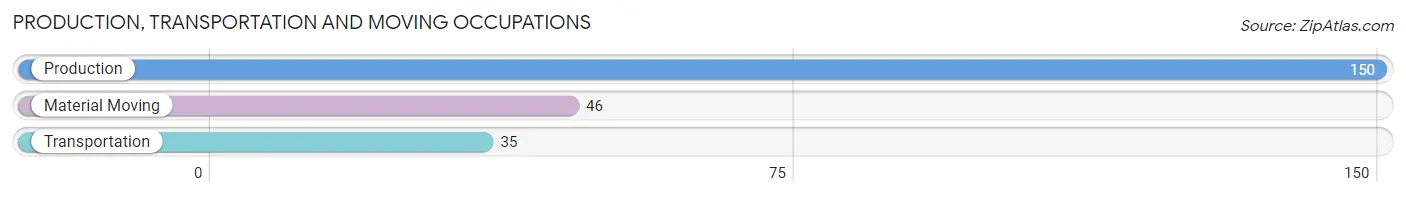
Production, Transportation and Moving Occupations by Sex
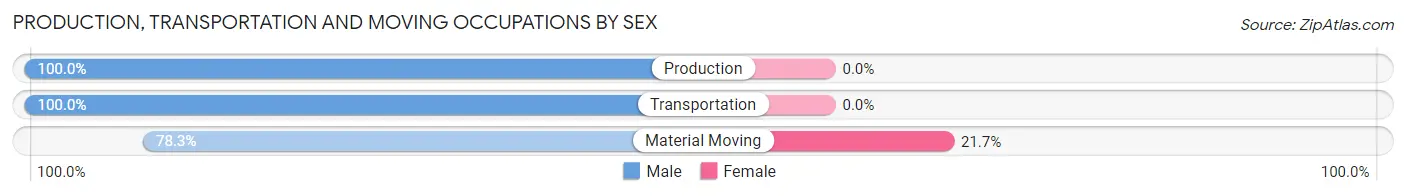
| Occupation | Male | Female |
| Production | 150 (100.0%) | 0 (0.0%) |
| Transportation | 35 (100.0%) | 0 (0.0%) |
| Material Moving | 36 (78.3%) | 10 (21.7%) |
| Total (Category) | 221 (95.7%) | 10 (4.3%) |
| Total (Overall) | 892 (56.4%) | 689 (43.6%) |
Employment Industries by Sex in Val Verde Park
Employment Industries in Val Verde Park
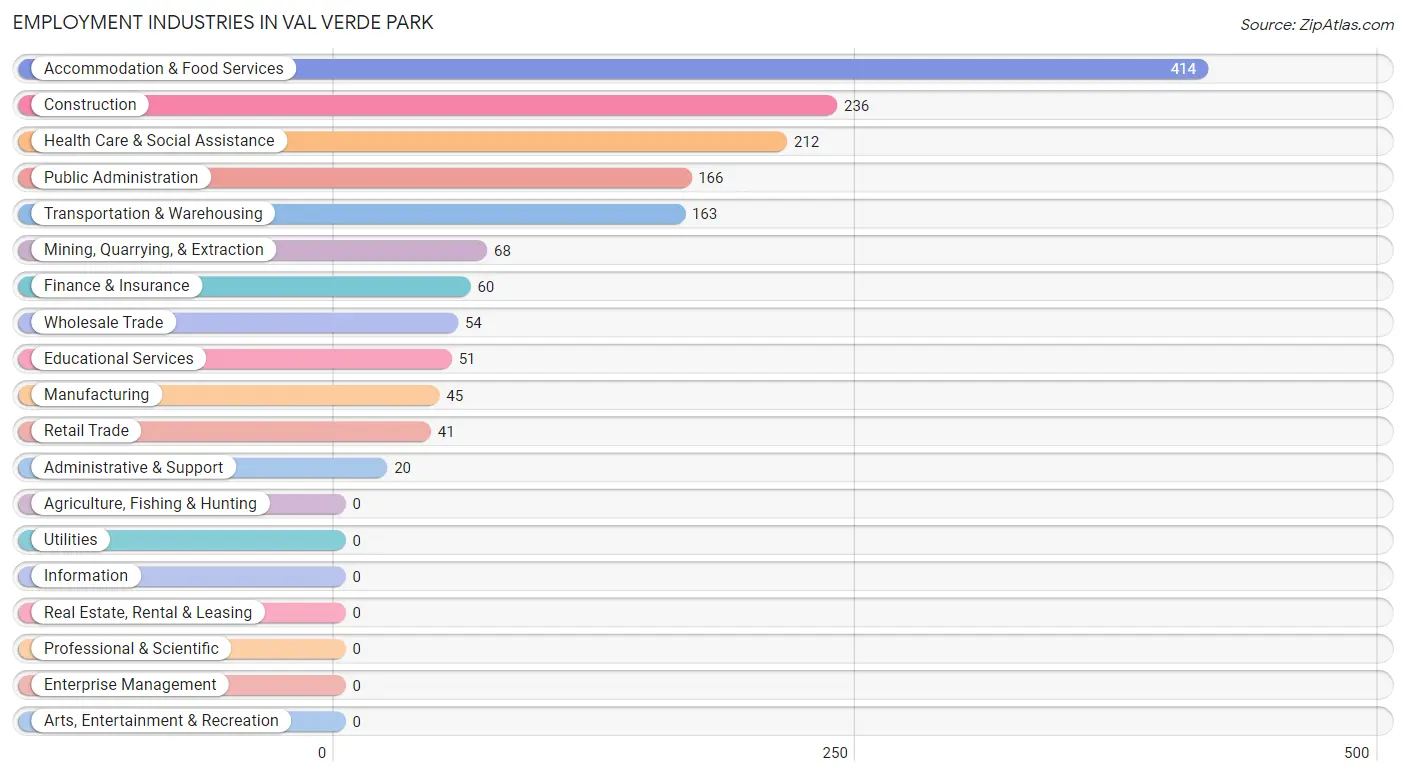
The major employment industries in Val Verde Park include Accommodation & Food Services (414 | 26.2%), Construction (236 | 14.9%), Health Care & Social Assistance (212 | 13.4%), Public Administration (166 | 10.5%), and Transportation & Warehousing (163 | 10.3%).
Employment Industries by Sex in Val Verde Park
The Val Verde Park industries that see more men than women are Mining, Quarrying, & Extraction (100.0%), Construction (100.0%), and Transportation & Warehousing (100.0%), whereas the industries that tend to have a higher number of women are Finance & Insurance (100.0%), Health Care & Social Assistance (87.7%), and Retail Trade (65.8%).
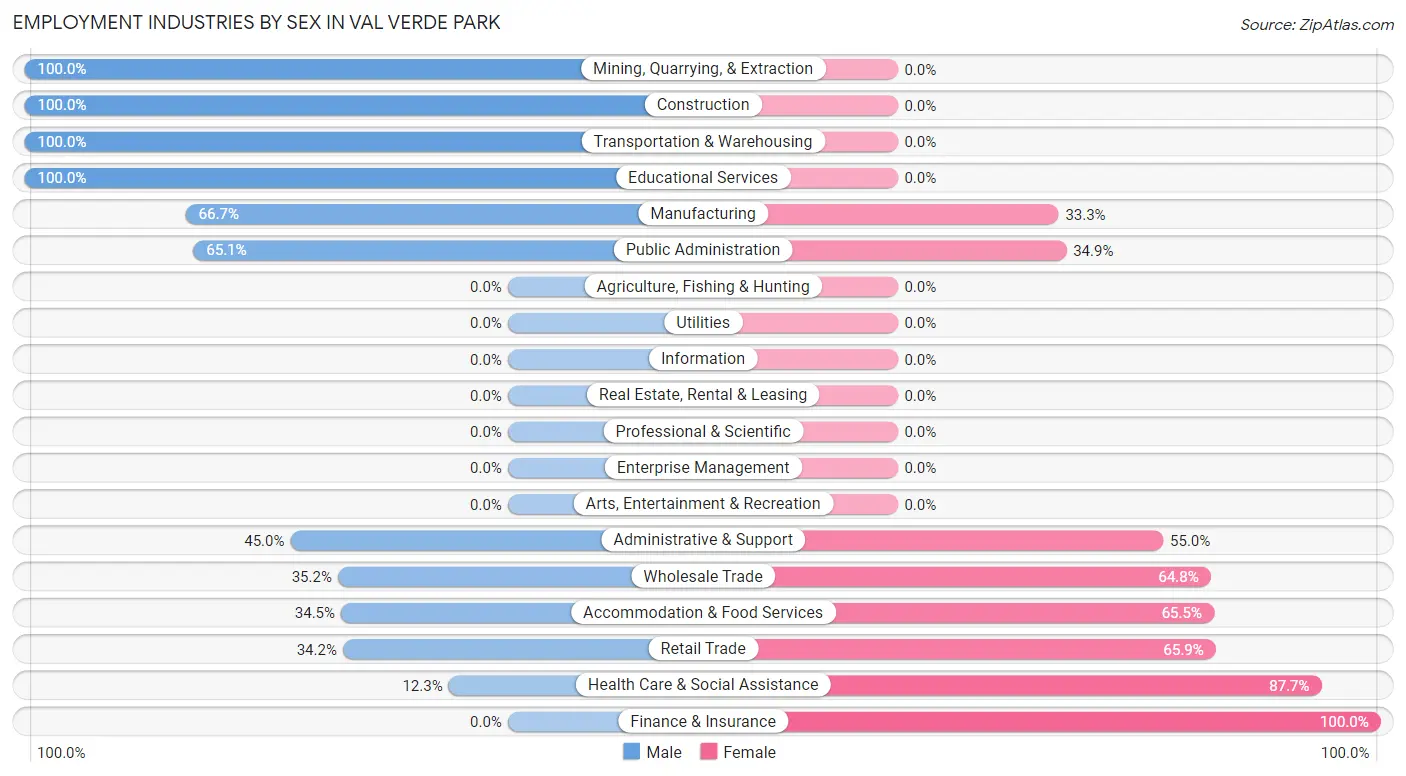
| Industry | Male | Female |
| Agriculture, Fishing & Hunting | 0 (0.0%) | 0 (0.0%) |
| Mining, Quarrying, & Extraction | 68 (100.0%) | 0 (0.0%) |
| Construction | 236 (100.0%) | 0 (0.0%) |
| Manufacturing | 30 (66.7%) | 15 (33.3%) |
| Wholesale Trade | 19 (35.2%) | 35 (64.8%) |
| Retail Trade | 14 (34.2%) | 27 (65.8%) |
| Transportation & Warehousing | 163 (100.0%) | 0 (0.0%) |
| Utilities | 0 (0.0%) | 0 (0.0%) |
| Information | 0 (0.0%) | 0 (0.0%) |
| Finance & Insurance | 0 (0.0%) | 60 (100.0%) |
| Real Estate, Rental & Leasing | 0 (0.0%) | 0 (0.0%) |
| Professional & Scientific | 0 (0.0%) | 0 (0.0%) |
| Enterprise Management | 0 (0.0%) | 0 (0.0%) |
| Administrative & Support | 9 (45.0%) | 11 (55.0%) |
| Educational Services | 51 (100.0%) | 0 (0.0%) |
| Health Care & Social Assistance | 26 (12.3%) | 186 (87.7%) |
| Arts, Entertainment & Recreation | 0 (0.0%) | 0 (0.0%) |
| Accommodation & Food Services | 143 (34.5%) | 271 (65.5%) |
| Public Administration | 108 (65.1%) | 58 (34.9%) |
| Total | 892 (56.4%) | 689 (43.6%) |
Education in Val Verde Park
School Enrollment in Val Verde Park
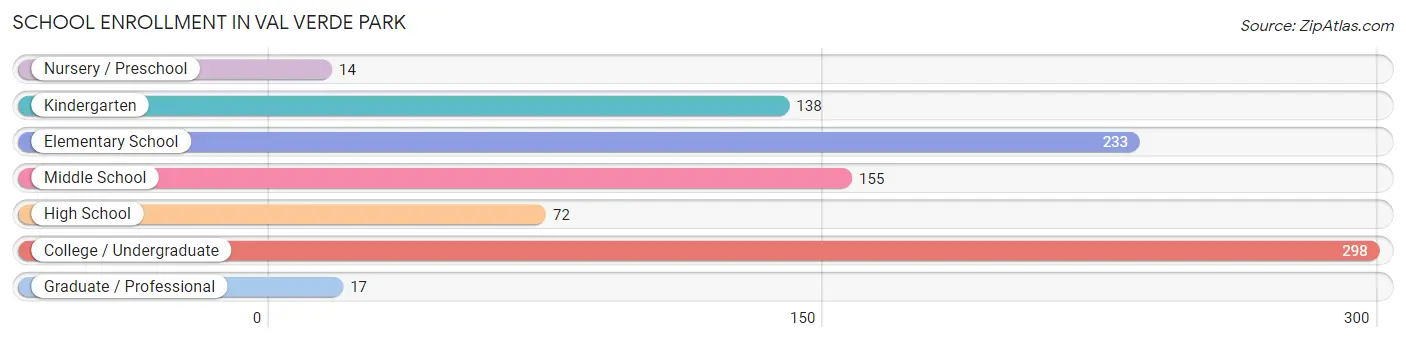
The most common levels of schooling among the 927 students in Val Verde Park are college / undergraduate (298 | 32.2%), elementary school (233 | 25.1%), and middle school (155 | 16.7%).
| School Level | # Students | % Students |
| Nursery / Preschool | 14 | 1.5% |
| Kindergarten | 138 | 14.9% |
| Elementary School | 233 | 25.1% |
| Middle School | 155 | 16.7% |
| High School | 72 | 7.8% |
| College / Undergraduate | 298 | 32.2% |
| Graduate / Professional | 17 | 1.8% |
| Total | 927 | 100.0% |
School Enrollment by Age by Funding Source in Val Verde Park
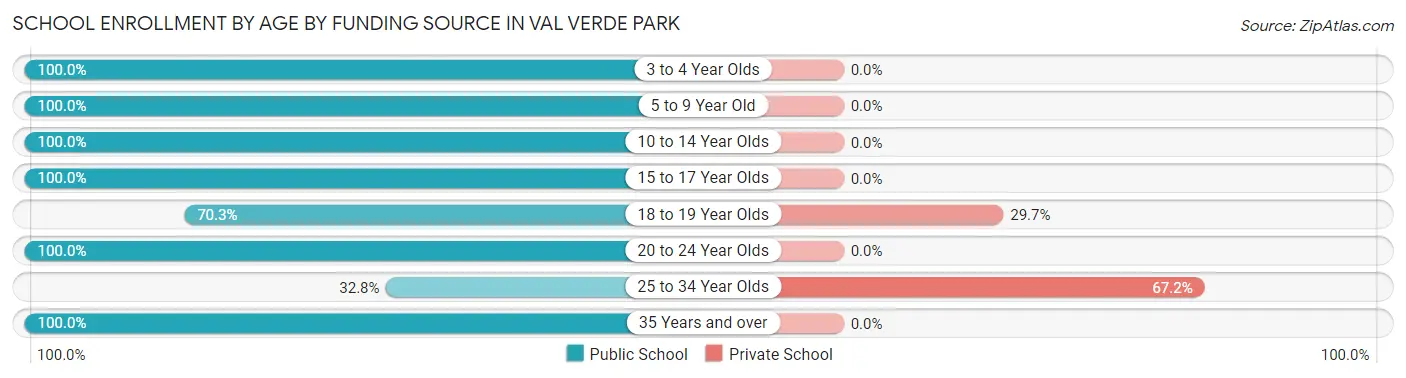
Out of a total of 927 students who are enrolled in schools in Val Verde Park, 95 (10.2%) attend a private institution, while the remaining 832 (89.8%) are enrolled in public schools. The age group of 25 to 34 year olds has the highest likelihood of being enrolled in private schools, with 84 (67.2% in the age bracket) enrolled. Conversely, the age group of 3 to 4 year olds has the lowest likelihood of being enrolled in a private school, with 14 (100.0% in the age bracket) attending a public institution.
| Age Bracket | Public School | Private School |
| 3 to 4 Year Olds | 14 (100.0%) | 0 (0.0%) |
| 5 to 9 Year Old | 340 (100.0%) | 0 (0.0%) |
| 10 to 14 Year Olds | 186 (100.0%) | 0 (0.0%) |
| 15 to 17 Year Olds | 51 (100.0%) | 0 (0.0%) |
| 18 to 19 Year Olds | 26 (70.3%) | 11 (29.7%) |
| 20 to 24 Year Olds | 100 (100.0%) | 0 (0.0%) |
| 25 to 34 Year Olds | 41 (32.8%) | 84 (67.2%) |
| 35 Years and over | 74 (100.0%) | 0 (0.0%) |
| Total | 832 (89.8%) | 95 (10.2%) |
Educational Attainment by Field of Study in Val Verde Park
Literature & languages (35 | 68.6%), psychology (8 | 15.7%), and education (8 | 15.7%) are the most common fields of study among 51 individuals in Val Verde Park who have obtained a bachelor's degree or higher.
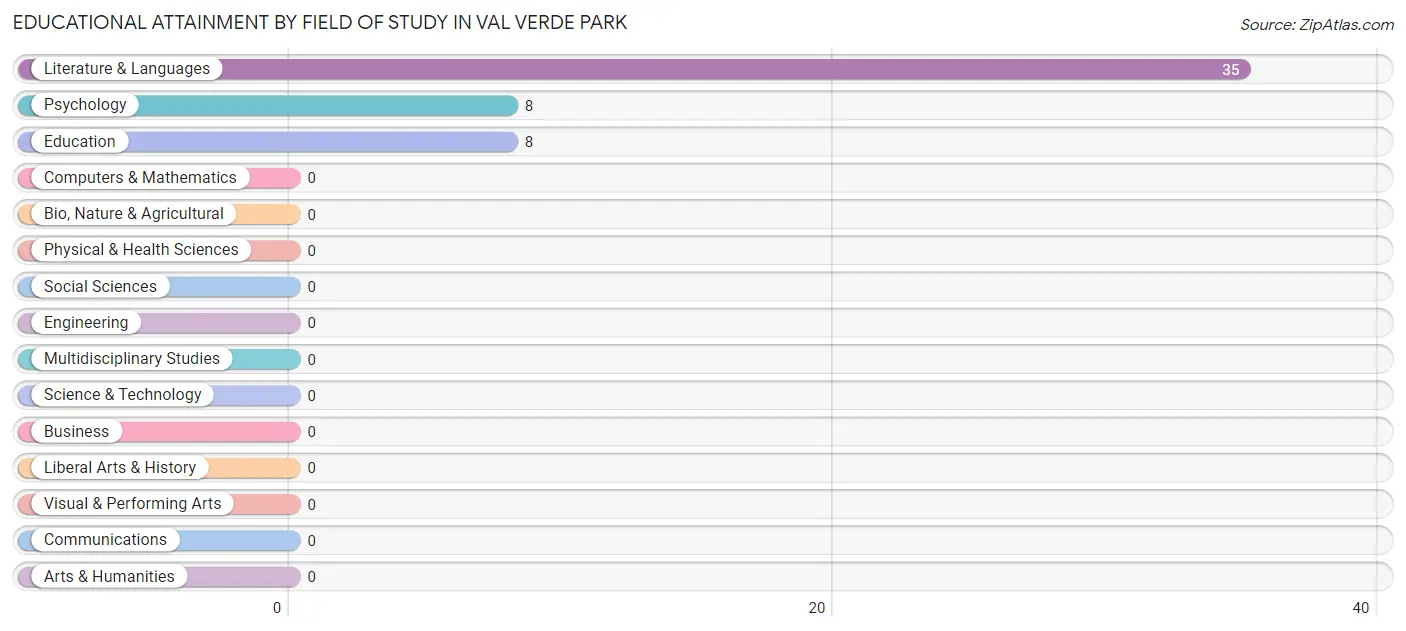
| Field of Study | # Graduates | % Graduates |
| Computers & Mathematics | 0 | 0.0% |
| Bio, Nature & Agricultural | 0 | 0.0% |
| Physical & Health Sciences | 0 | 0.0% |
| Psychology | 8 | 15.7% |
| Social Sciences | 0 | 0.0% |
| Engineering | 0 | 0.0% |
| Multidisciplinary Studies | 0 | 0.0% |
| Science & Technology | 0 | 0.0% |
| Business | 0 | 0.0% |
| Education | 8 | 15.7% |
| Literature & Languages | 35 | 68.6% |
| Liberal Arts & History | 0 | 0.0% |
| Visual & Performing Arts | 0 | 0.0% |
| Communications | 0 | 0.0% |
| Arts & Humanities | 0 | 0.0% |
| Total | 51 | 100.0% |
Transportation & Commute in Val Verde Park
Vehicle Availability by Sex in Val Verde Park
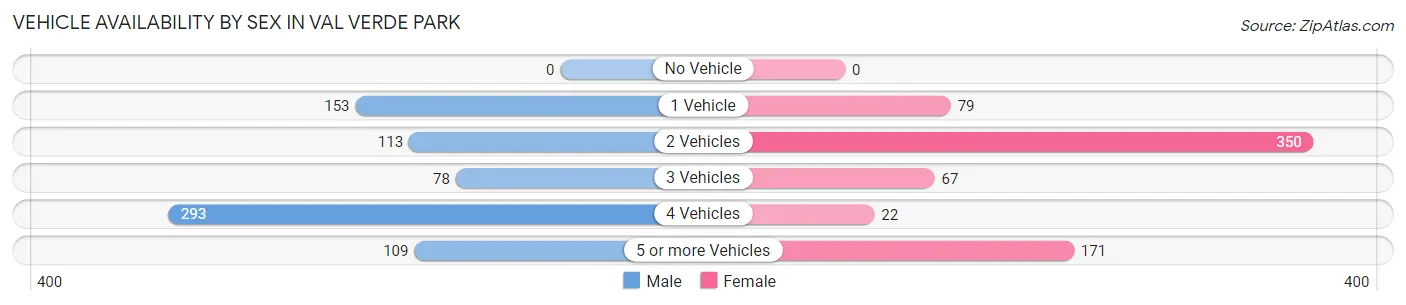
The most prevalent vehicle ownership categories in Val Verde Park are males with 4 vehicles (293, accounting for 39.3%) and females with 4 vehicles (22, making up 42.5%).
| Vehicles Available | Male | Female |
| No Vehicle | 0 (0.0%) | 0 (0.0%) |
| 1 Vehicle | 153 (20.5%) | 79 (11.5%) |
| 2 Vehicles | 113 (15.1%) | 350 (50.8%) |
| 3 Vehicles | 78 (10.5%) | 67 (9.7%) |
| 4 Vehicles | 293 (39.3%) | 22 (3.2%) |
| 5 or more Vehicles | 109 (14.6%) | 171 (24.8%) |
| Total | 746 (100.0%) | 689 (100.0%) |
Commute Time in Val Verde Park
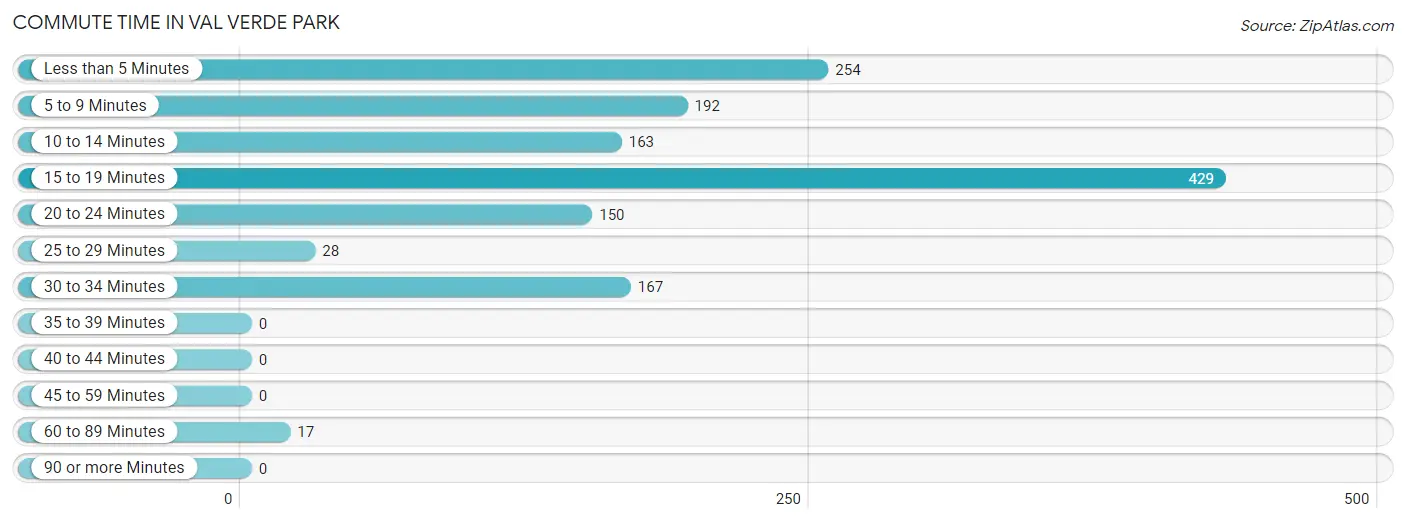
The most frequently occuring commute durations in Val Verde Park are 15 to 19 minutes (429 commuters, 30.6%), less than 5 minutes (254 commuters, 18.1%), and 5 to 9 minutes (192 commuters, 13.7%).
| Commute Time | # Commuters | % Commuters |
| Less than 5 Minutes | 254 | 18.1% |
| 5 to 9 Minutes | 192 | 13.7% |
| 10 to 14 Minutes | 163 | 11.6% |
| 15 to 19 Minutes | 429 | 30.6% |
| 20 to 24 Minutes | 150 | 10.7% |
| 25 to 29 Minutes | 28 | 2.0% |
| 30 to 34 Minutes | 167 | 11.9% |
| 35 to 39 Minutes | 0 | 0.0% |
| 40 to 44 Minutes | 0 | 0.0% |
| 45 to 59 Minutes | 0 | 0.0% |
| 60 to 89 Minutes | 17 | 1.2% |
| 90 or more Minutes | 0 | 0.0% |
Commute Time by Sex in Val Verde Park
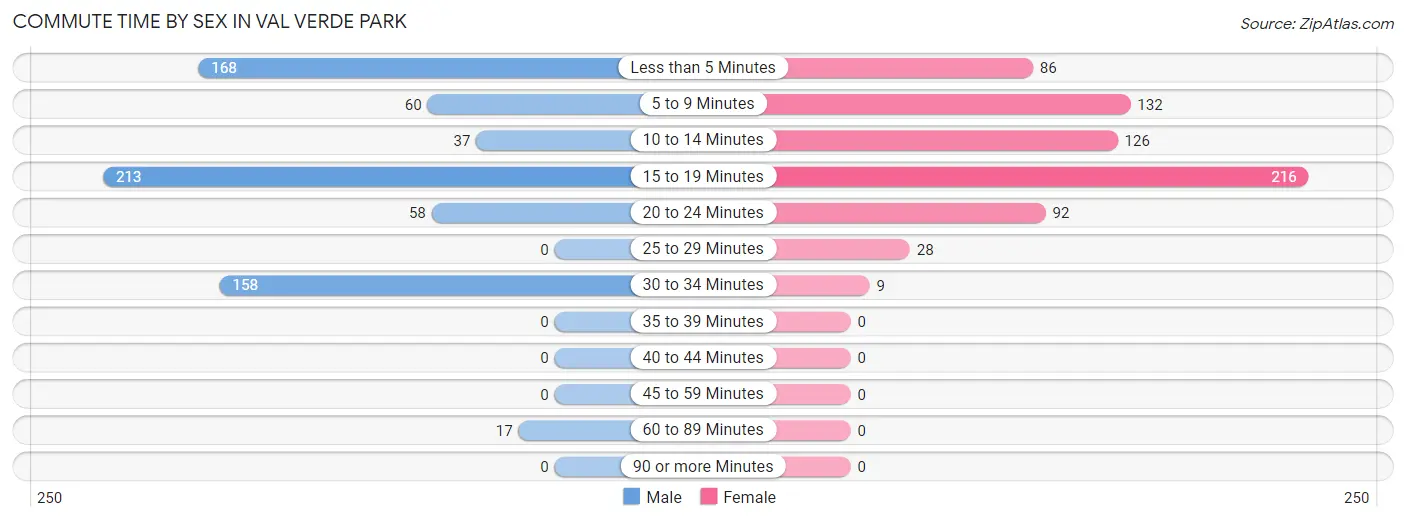
The most common commute times in Val Verde Park are 15 to 19 minutes (213 commuters, 30.0%) for males and 15 to 19 minutes (216 commuters, 31.4%) for females.
| Commute Time | Male | Female |
| Less than 5 Minutes | 168 (23.6%) | 86 (12.5%) |
| 5 to 9 Minutes | 60 (8.4%) | 132 (19.2%) |
| 10 to 14 Minutes | 37 (5.2%) | 126 (18.3%) |
| 15 to 19 Minutes | 213 (30.0%) | 216 (31.4%) |
| 20 to 24 Minutes | 58 (8.2%) | 92 (13.4%) |
| 25 to 29 Minutes | 0 (0.0%) | 28 (4.1%) |
| 30 to 34 Minutes | 158 (22.2%) | 9 (1.3%) |
| 35 to 39 Minutes | 0 (0.0%) | 0 (0.0%) |
| 40 to 44 Minutes | 0 (0.0%) | 0 (0.0%) |
| 45 to 59 Minutes | 0 (0.0%) | 0 (0.0%) |
| 60 to 89 Minutes | 17 (2.4%) | 0 (0.0%) |
| 90 or more Minutes | 0 (0.0%) | 0 (0.0%) |
Time of Departure to Work by Sex in Val Verde Park
The most frequent times of departure to work in Val Verde Park are 5:00 AM to 5:29 AM (362, 50.9%) for males and 7:00 AM to 7:29 AM (301, 43.7%) for females.
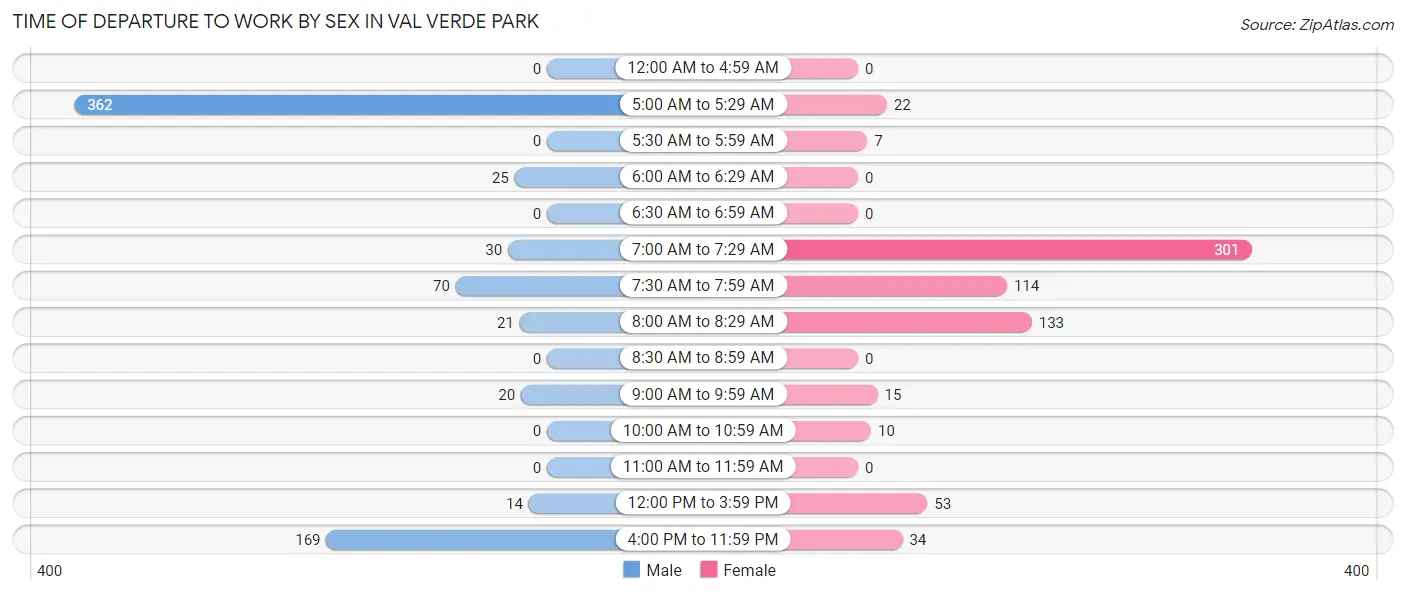
| Time of Departure | Male | Female |
| 12:00 AM to 4:59 AM | 0 (0.0%) | 0 (0.0%) |
| 5:00 AM to 5:29 AM | 362 (50.9%) | 22 (3.2%) |
| 5:30 AM to 5:59 AM | 0 (0.0%) | 7 (1.0%) |
| 6:00 AM to 6:29 AM | 25 (3.5%) | 0 (0.0%) |
| 6:30 AM to 6:59 AM | 0 (0.0%) | 0 (0.0%) |
| 7:00 AM to 7:29 AM | 30 (4.2%) | 301 (43.7%) |
| 7:30 AM to 7:59 AM | 70 (9.9%) | 114 (16.6%) |
| 8:00 AM to 8:29 AM | 21 (2.9%) | 133 (19.3%) |
| 8:30 AM to 8:59 AM | 0 (0.0%) | 0 (0.0%) |
| 9:00 AM to 9:59 AM | 20 (2.8%) | 15 (2.2%) |
| 10:00 AM to 10:59 AM | 0 (0.0%) | 10 (1.5%) |
| 11:00 AM to 11:59 AM | 0 (0.0%) | 0 (0.0%) |
| 12:00 PM to 3:59 PM | 14 (2.0%) | 53 (7.7%) |
| 4:00 PM to 11:59 PM | 169 (23.8%) | 34 (4.9%) |
| Total | 711 (100.0%) | 689 (100.0%) |
Housing Occupancy in Val Verde Park
Occupancy by Ownership in Val Verde Park
Of the total 975 dwellings in Val Verde Park, owner-occupied units account for 655 (67.2%), while renter-occupied units make up 320 (32.8%).
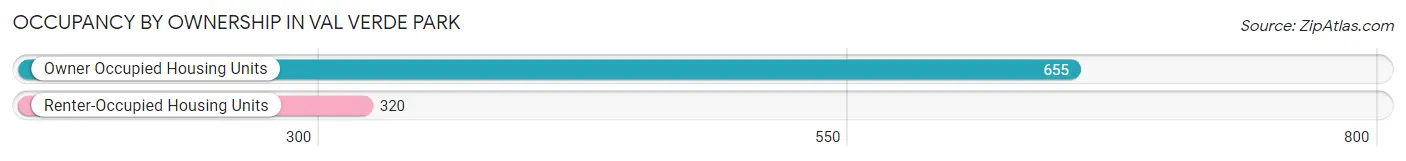
| Occupancy | # Housing Units | % Housing Units |
| Owner Occupied Housing Units | 655 | 67.2% |
| Renter-Occupied Housing Units | 320 | 32.8% |
| Total Occupied Housing Units | 975 | 100.0% |
Occupancy by Household Size in Val Verde Park
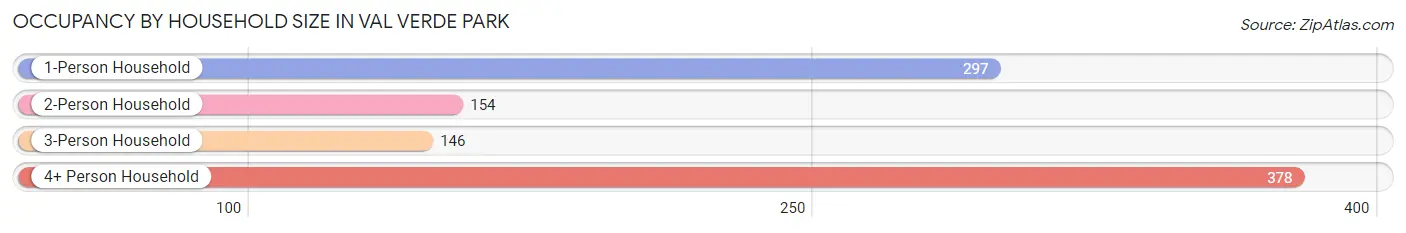
| Household Size | # Housing Units | % Housing Units |
| 1-Person Household | 297 | 30.5% |
| 2-Person Household | 154 | 15.8% |
| 3-Person Household | 146 | 15.0% |
| 4+ Person Household | 378 | 38.8% |
| Total Housing Units | 975 | 100.0% |
Occupancy by Ownership by Household Size in Val Verde Park
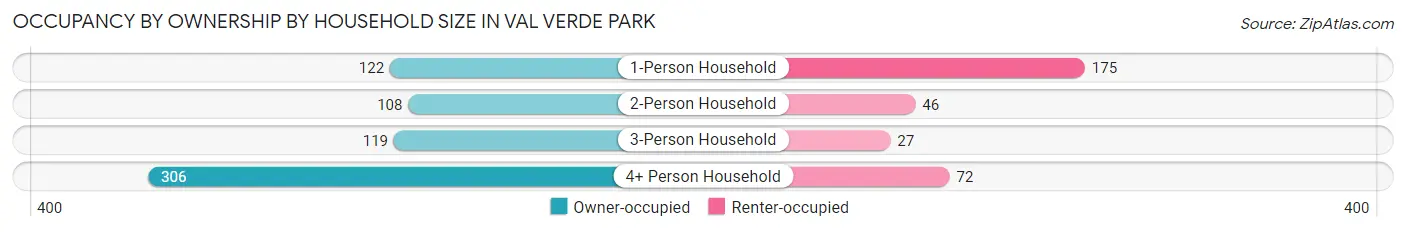
| Household Size | Owner-occupied | Renter-occupied |
| 1-Person Household | 122 (41.1%) | 175 (58.9%) |
| 2-Person Household | 108 (70.1%) | 46 (29.9%) |
| 3-Person Household | 119 (81.5%) | 27 (18.5%) |
| 4+ Person Household | 306 (80.9%) | 72 (19.1%) |
| Total Housing Units | 655 (67.2%) | 320 (32.8%) |
Occupancy by Educational Attainment in Val Verde Park
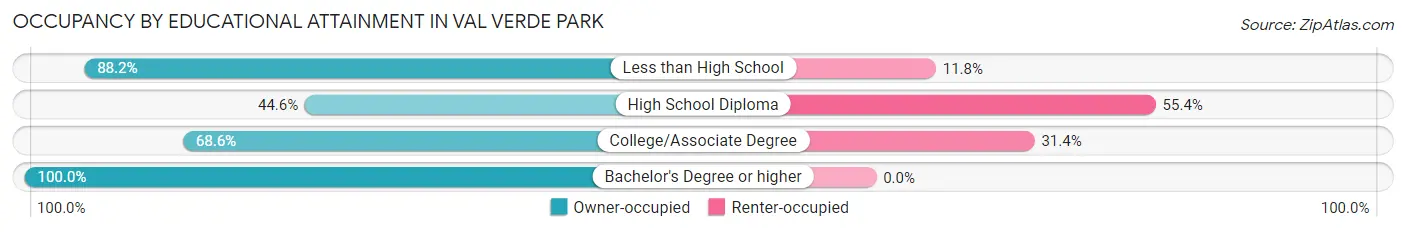
| Household Size | Owner-occupied | Renter-occupied |
| Less than High School | 298 (88.2%) | 40 (11.8%) |
| High School Diploma | 169 (44.6%) | 210 (55.4%) |
| College/Associate Degree | 153 (68.6%) | 70 (31.4%) |
| Bachelor's Degree or higher | 35 (100.0%) | 0 (0.0%) |
Occupancy by Age of Householder in Val Verde Park
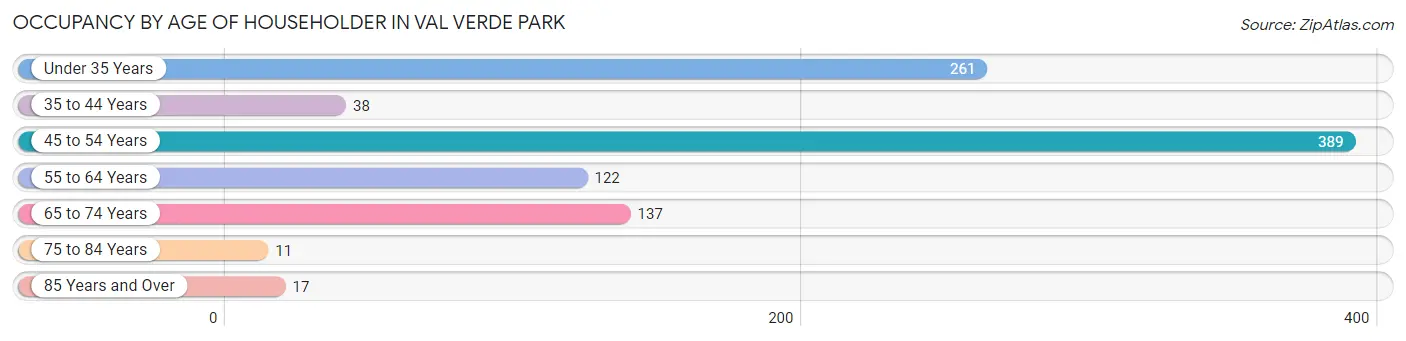
| Age Bracket | # Households | % Households |
| Under 35 Years | 261 | 26.8% |
| 35 to 44 Years | 38 | 3.9% |
| 45 to 54 Years | 389 | 39.9% |
| 55 to 64 Years | 122 | 12.5% |
| 65 to 74 Years | 137 | 14.1% |
| 75 to 84 Years | 11 | 1.1% |
| 85 Years and Over | 17 | 1.7% |
| Total | 975 | 100.0% |
Housing Finances in Val Verde Park
Median Income by Occupancy in Val Verde Park
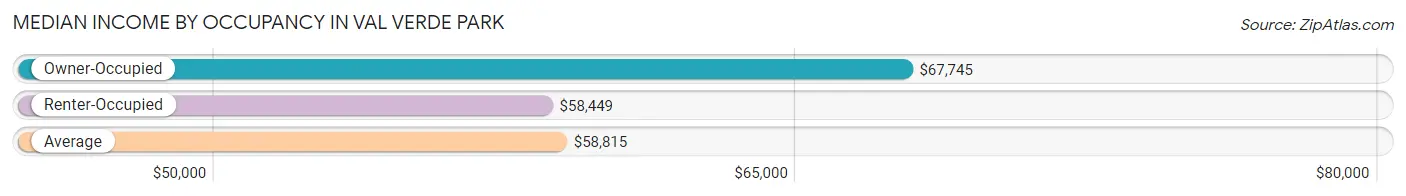
| Occupancy Type | # Households | Median Income |
| Owner-Occupied | 655 (67.2%) | $67,745 |
| Renter-Occupied | 320 (32.8%) | $58,449 |
| Average | 975 (100.0%) | $58,815 |
Occupancy by Householder Income Bracket in Val Verde Park
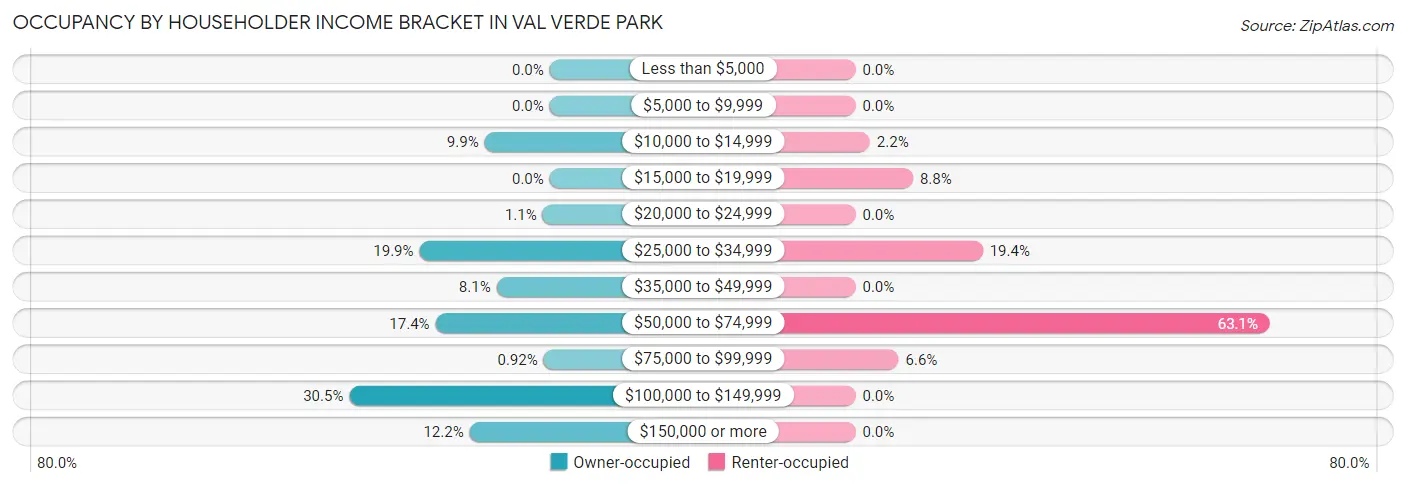
| Income Bracket | Owner-occupied | Renter-occupied |
| Less than $5,000 | 0 (0.0%) | 0 (0.0%) |
| $5,000 to $9,999 | 0 (0.0%) | 0 (0.0%) |
| $10,000 to $14,999 | 65 (9.9%) | 7 (2.2%) |
| $15,000 to $19,999 | 0 (0.0%) | 28 (8.7%) |
| $20,000 to $24,999 | 7 (1.1%) | 0 (0.0%) |
| $25,000 to $34,999 | 130 (19.9%) | 62 (19.4%) |
| $35,000 to $49,999 | 53 (8.1%) | 0 (0.0%) |
| $50,000 to $74,999 | 114 (17.4%) | 202 (63.1%) |
| $75,000 to $99,999 | 6 (0.9%) | 21 (6.6%) |
| $100,000 to $149,999 | 200 (30.5%) | 0 (0.0%) |
| $150,000 or more | 80 (12.2%) | 0 (0.0%) |
| Total | 655 (100.0%) | 320 (100.0%) |
Monthly Housing Cost Tiers in Val Verde Park
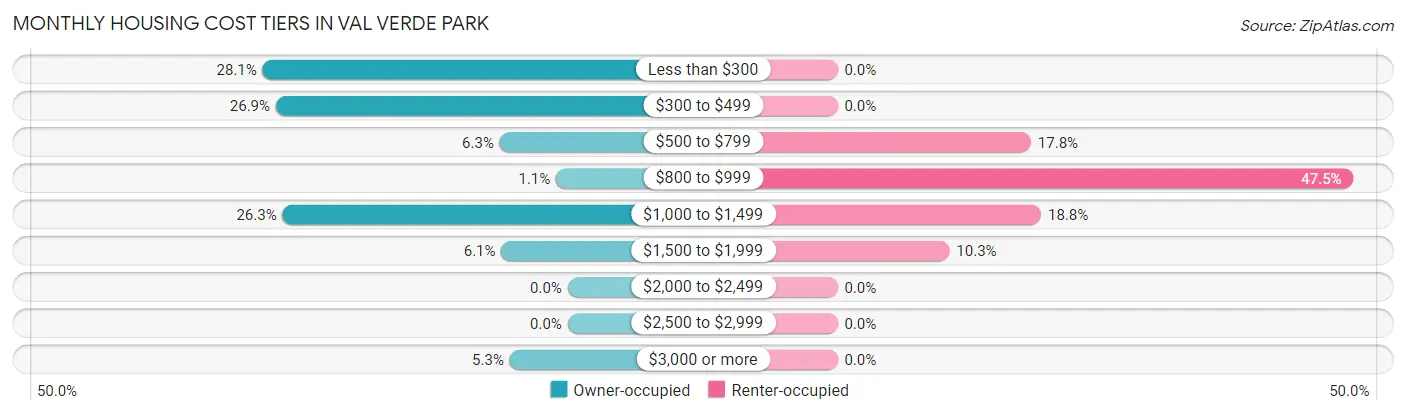
| Monthly Cost | Owner-occupied | Renter-occupied |
| Less than $300 | 184 (28.1%) | 0 (0.0%) |
| $300 to $499 | 176 (26.9%) | 0 (0.0%) |
| $500 to $799 | 41 (6.3%) | 57 (17.8%) |
| $800 to $999 | 7 (1.1%) | 152 (47.5%) |
| $1,000 to $1,499 | 172 (26.3%) | 60 (18.8%) |
| $1,500 to $1,999 | 40 (6.1%) | 33 (10.3%) |
| $2,000 to $2,499 | 0 (0.0%) | 0 (0.0%) |
| $2,500 to $2,999 | 0 (0.0%) | 0 (0.0%) |
| $3,000 or more | 35 (5.3%) | 0 (0.0%) |
| Total | 655 (100.0%) | 320 (100.0%) |
Physical Housing Characteristics in Val Verde Park
Housing Structures in Val Verde Park
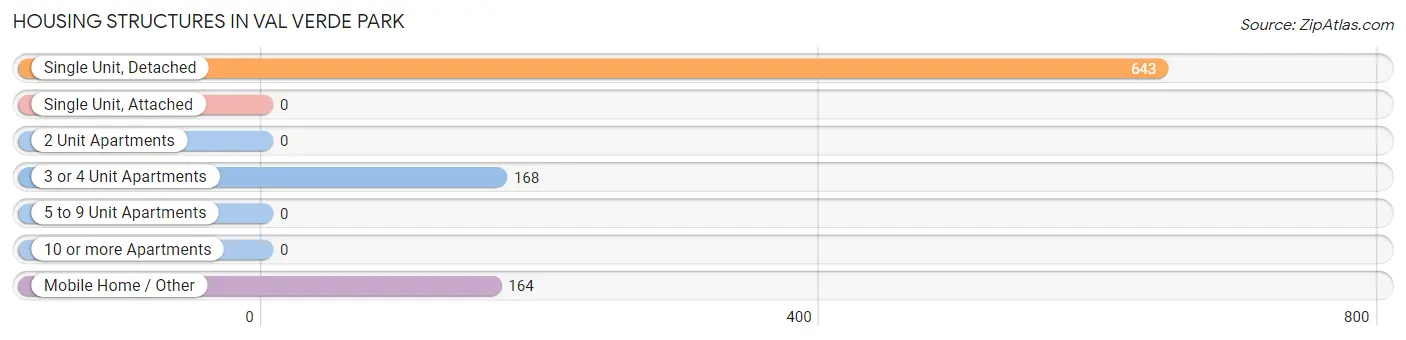
| Structure Type | # Housing Units | % Housing Units |
| Single Unit, Detached | 643 | 65.9% |
| Single Unit, Attached | 0 | 0.0% |
| 2 Unit Apartments | 0 | 0.0% |
| 3 or 4 Unit Apartments | 168 | 17.2% |
| 5 to 9 Unit Apartments | 0 | 0.0% |
| 10 or more Apartments | 0 | 0.0% |
| Mobile Home / Other | 164 | 16.8% |
| Total | 975 | 100.0% |
Housing Structures by Occupancy in Val Verde Park
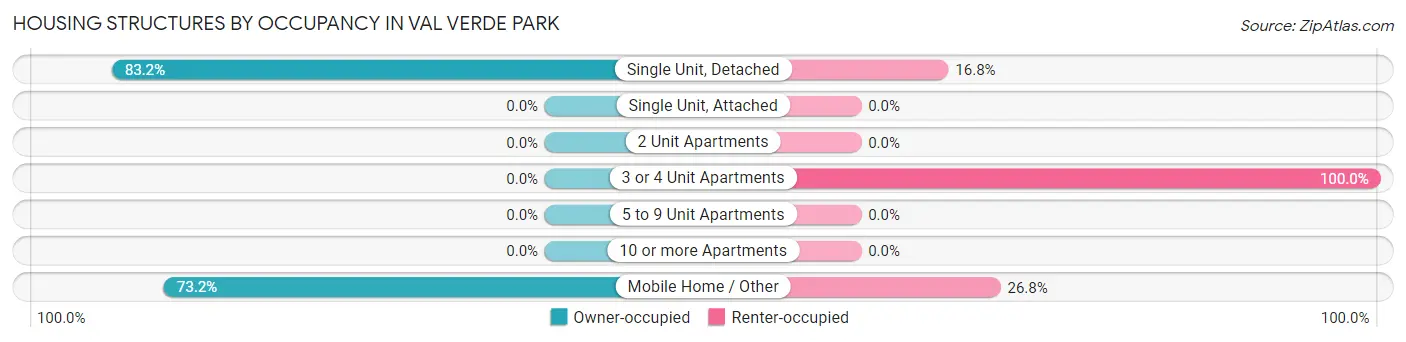
| Structure Type | Owner-occupied | Renter-occupied |
| Single Unit, Detached | 535 (83.2%) | 108 (16.8%) |
| Single Unit, Attached | 0 (0.0%) | 0 (0.0%) |
| 2 Unit Apartments | 0 (0.0%) | 0 (0.0%) |
| 3 or 4 Unit Apartments | 0 (0.0%) | 168 (100.0%) |
| 5 to 9 Unit Apartments | 0 (0.0%) | 0 (0.0%) |
| 10 or more Apartments | 0 (0.0%) | 0 (0.0%) |
| Mobile Home / Other | 120 (73.2%) | 44 (26.8%) |
| Total | 655 (67.2%) | 320 (32.8%) |
Housing Structures by Number of Rooms in Val Verde Park
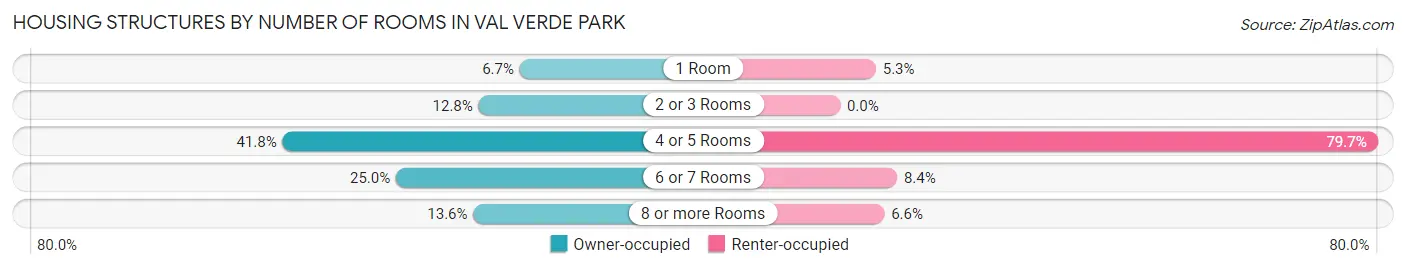
| Number of Rooms | Owner-occupied | Renter-occupied |
| 1 Room | 44 (6.7%) | 17 (5.3%) |
| 2 or 3 Rooms | 84 (12.8%) | 0 (0.0%) |
| 4 or 5 Rooms | 274 (41.8%) | 255 (79.7%) |
| 6 or 7 Rooms | 164 (25.0%) | 27 (8.4%) |
| 8 or more Rooms | 89 (13.6%) | 21 (6.6%) |
| Total | 655 (100.0%) | 320 (100.0%) |
Housing Structure by Heating Type in Val Verde Park
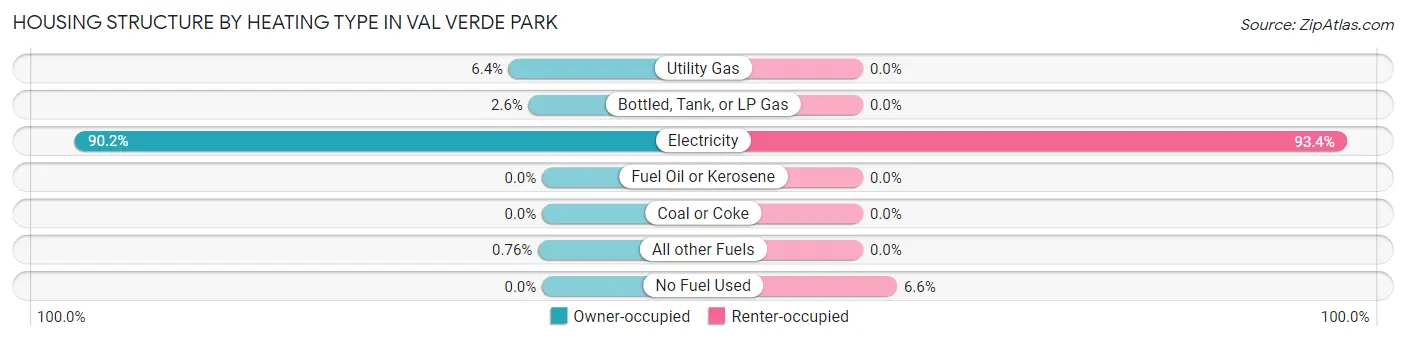
| Heating Type | Owner-occupied | Renter-occupied |
| Utility Gas | 42 (6.4%) | 0 (0.0%) |
| Bottled, Tank, or LP Gas | 17 (2.6%) | 0 (0.0%) |
| Electricity | 591 (90.2%) | 299 (93.4%) |
| Fuel Oil or Kerosene | 0 (0.0%) | 0 (0.0%) |
| Coal or Coke | 0 (0.0%) | 0 (0.0%) |
| All other Fuels | 5 (0.8%) | 0 (0.0%) |
| No Fuel Used | 0 (0.0%) | 21 (6.6%) |
| Total | 655 (100.0%) | 320 (100.0%) |
Household Vehicle Usage in Val Verde Park
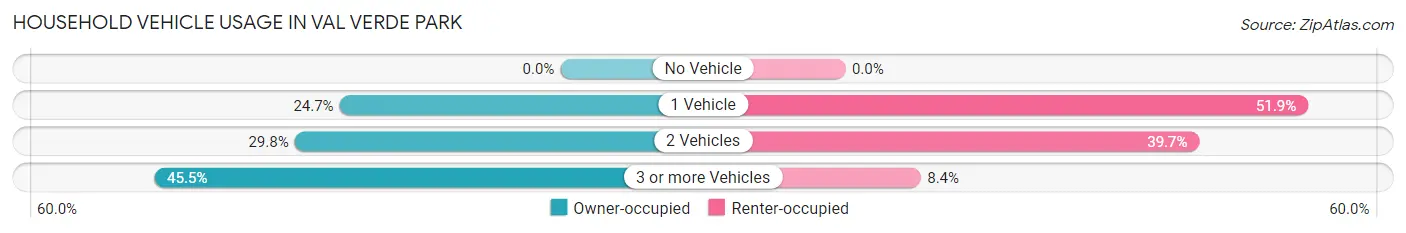
| Vehicles per Household | Owner-occupied | Renter-occupied |
| No Vehicle | 0 (0.0%) | 0 (0.0%) |
| 1 Vehicle | 162 (24.7%) | 166 (51.9%) |
| 2 Vehicles | 195 (29.8%) | 127 (39.7%) |
| 3 or more Vehicles | 298 (45.5%) | 27 (8.4%) |
| Total | 655 (100.0%) | 320 (100.0%) |
Real Estate & Mortgages in Val Verde Park
Real Estate and Mortgage Overview in Val Verde Park
| Characteristic | Without Mortgage | With Mortgage |
| Housing Units | 422 | 233 |
| Median Property Value | - | - |
| Median Household Income | $42,685 | $9 |
| Monthly Housing Costs | $341 | $35 |
| Real Estate Taxes | $748 | $0 |
Property Value by Mortgage Status in Val Verde Park
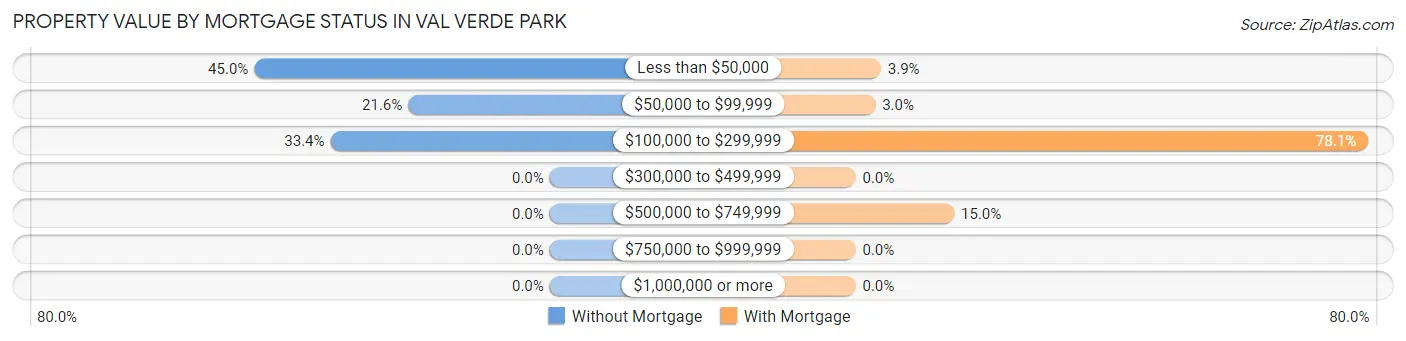
| Property Value | Without Mortgage | With Mortgage |
| Less than $50,000 | 190 (45.0%) | 9 (3.9%) |
| $50,000 to $99,999 | 91 (21.6%) | 7 (3.0%) |
| $100,000 to $299,999 | 141 (33.4%) | 182 (78.1%) |
| $300,000 to $499,999 | 0 (0.0%) | 0 (0.0%) |
| $500,000 to $749,999 | 0 (0.0%) | 35 (15.0%) |
| $750,000 to $999,999 | 0 (0.0%) | 0 (0.0%) |
| $1,000,000 or more | 0 (0.0%) | 0 (0.0%) |
| Total | 422 (100.0%) | 233 (100.0%) |
Household Income by Mortgage Status in Val Verde Park
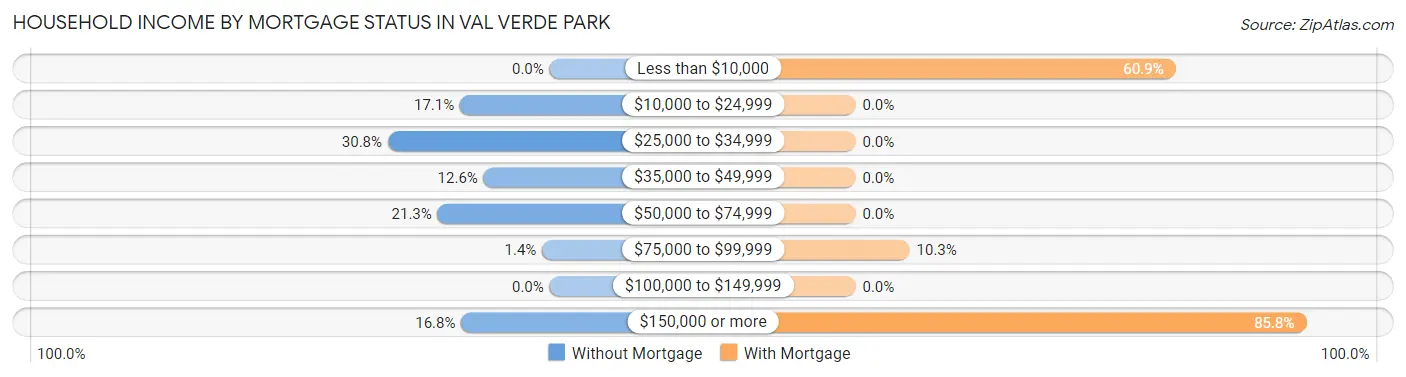
| Household Income | Without Mortgage | With Mortgage |
| Less than $10,000 | 0 (0.0%) | 142 (60.9%) |
| $10,000 to $24,999 | 72 (17.1%) | 0 (0.0%) |
| $25,000 to $34,999 | 130 (30.8%) | 0 (0.0%) |
| $35,000 to $49,999 | 53 (12.6%) | 0 (0.0%) |
| $50,000 to $74,999 | 90 (21.3%) | 0 (0.0%) |
| $75,000 to $99,999 | 6 (1.4%) | 24 (10.3%) |
| $100,000 to $149,999 | 0 (0.0%) | 0 (0.0%) |
| $150,000 or more | 71 (16.8%) | 200 (85.8%) |
| Total | 422 (100.0%) | 233 (100.0%) |
Property Value to Household Income Ratio in Val Verde Park
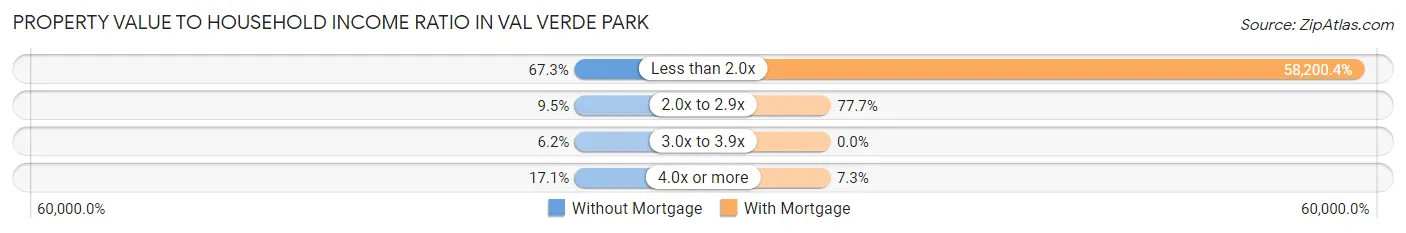
| Value-to-Income Ratio | Without Mortgage | With Mortgage |
| Less than 2.0x | 284 (67.3%) | 135,607 (58,200.4%) |
| 2.0x to 2.9x | 40 (9.5%) | 181 (77.7%) |
| 3.0x to 3.9x | 26 (6.2%) | 0 (0.0%) |
| 4.0x or more | 72 (17.1%) | 17 (7.3%) |
| Total | 422 (100.0%) | 233 (100.0%) |
Real Estate Taxes by Mortgage Status in Val Verde Park
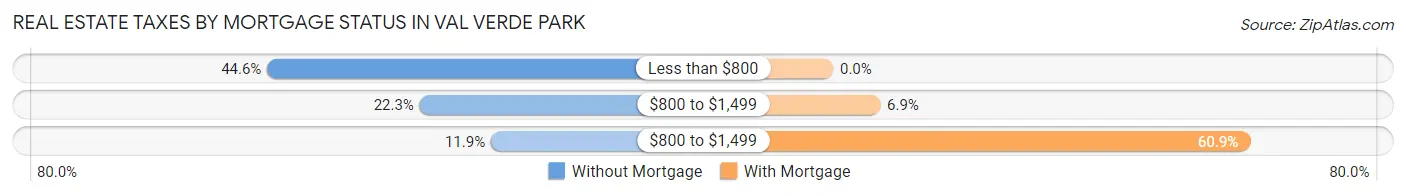
| Property Taxes | Without Mortgage | With Mortgage |
| Less than $800 | 188 (44.6%) | 0 (0.0%) |
| $800 to $1,499 | 94 (22.3%) | 16 (6.9%) |
| $800 to $1,499 | 50 (11.8%) | 142 (60.9%) |
| Total | 422 (100.0%) | 233 (100.0%) |
Health & Disability in Val Verde Park
Health Insurance Coverage by Age in Val Verde Park
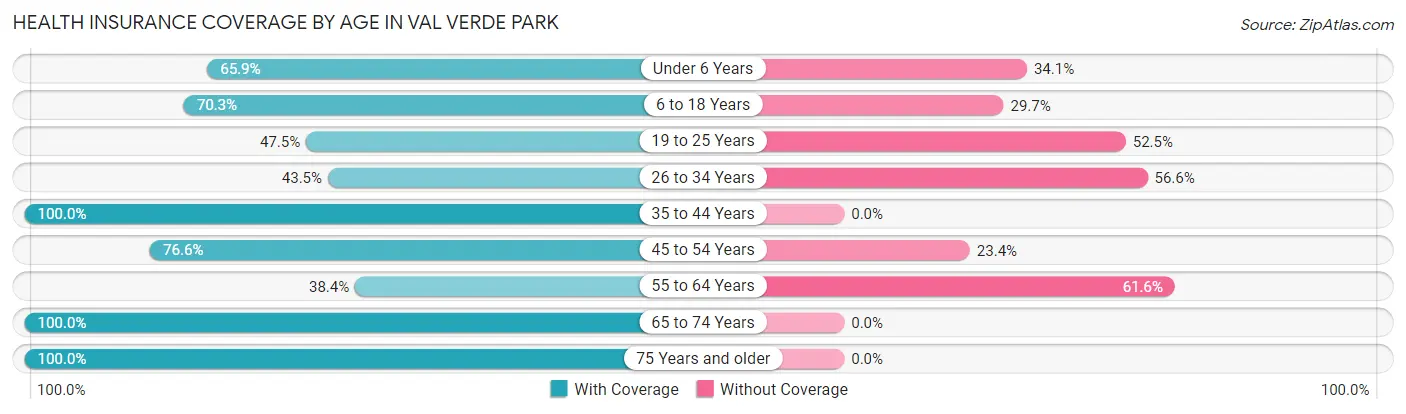
| Age Bracket | With Coverage | Without Coverage |
| Under 6 Years | 358 (65.9%) | 185 (34.1%) |
| 6 to 18 Years | 355 (70.3%) | 150 (29.7%) |
| 19 to 25 Years | 219 (47.5%) | 242 (52.5%) |
| 26 to 34 Years | 302 (43.4%) | 393 (56.6%) |
| 35 to 44 Years | 121 (100.0%) | 0 (0.0%) |
| 45 to 54 Years | 340 (76.6%) | 104 (23.4%) |
| 55 to 64 Years | 114 (38.4%) | 183 (61.6%) |
| 65 to 74 Years | 170 (100.0%) | 0 (0.0%) |
| 75 Years and older | 74 (100.0%) | 0 (0.0%) |
| Total | 2,053 (62.0%) | 1,257 (38.0%) |
Health Insurance Coverage by Citizenship Status in Val Verde Park
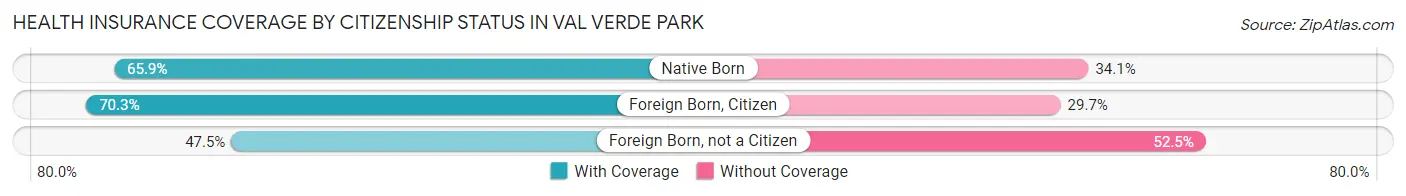
| Citizenship Status | With Coverage | Without Coverage |
| Native Born | 358 (65.9%) | 185 (34.1%) |
| Foreign Born, Citizen | 355 (70.3%) | 150 (29.7%) |
| Foreign Born, not a Citizen | 219 (47.5%) | 242 (52.5%) |
Health Insurance Coverage by Household Income in Val Verde Park
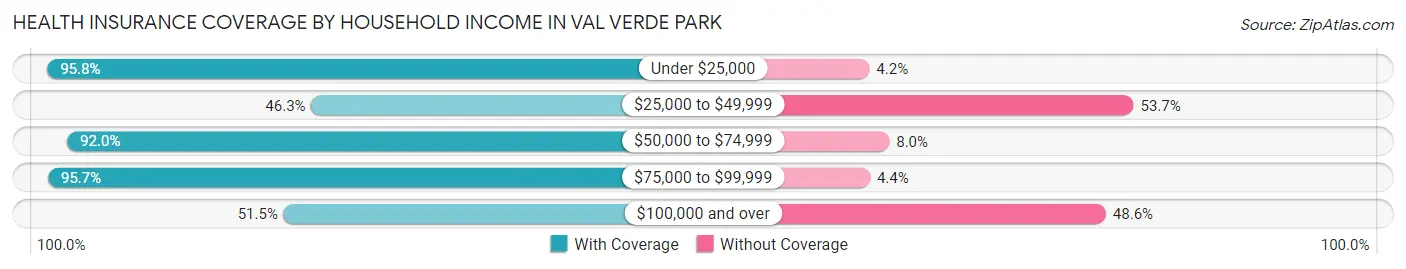
| Household Income | With Coverage | Without Coverage |
| Under $25,000 | 158 (95.8%) | 7 (4.2%) |
| $25,000 to $49,999 | 304 (46.3%) | 353 (53.7%) |
| $50,000 to $74,999 | 613 (92.0%) | 53 (8.0%) |
| $75,000 to $99,999 | 88 (95.7%) | 4 (4.3%) |
| $100,000 and over | 890 (51.4%) | 840 (48.5%) |
Public vs Private Health Insurance Coverage by Age in Val Verde Park
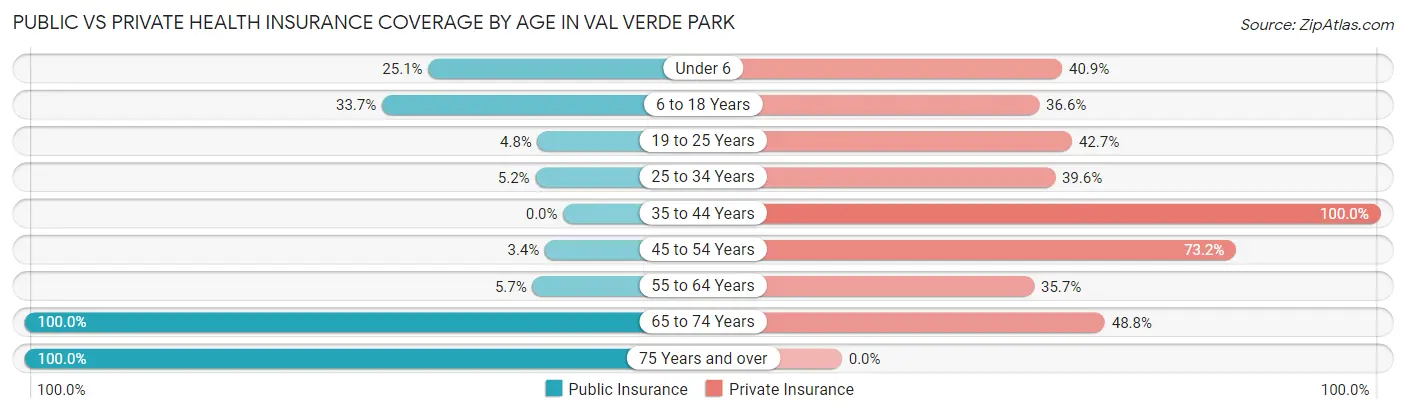
| Age Bracket | Public Insurance | Private Insurance |
| Under 6 | 136 (25.1%) | 222 (40.9%) |
| 6 to 18 Years | 170 (33.7%) | 185 (36.6%) |
| 19 to 25 Years | 22 (4.8%) | 197 (42.7%) |
| 25 to 34 Years | 36 (5.2%) | 275 (39.6%) |
| 35 to 44 Years | 0 (0.0%) | 121 (100.0%) |
| 45 to 54 Years | 15 (3.4%) | 325 (73.2%) |
| 55 to 64 Years | 17 (5.7%) | 106 (35.7%) |
| 65 to 74 Years | 170 (100.0%) | 83 (48.8%) |
| 75 Years and over | 74 (100.0%) | 0 (0.0%) |
| Total | 640 (19.3%) | 1,514 (45.7%) |
Disability Status by Sex by Age in Val Verde Park
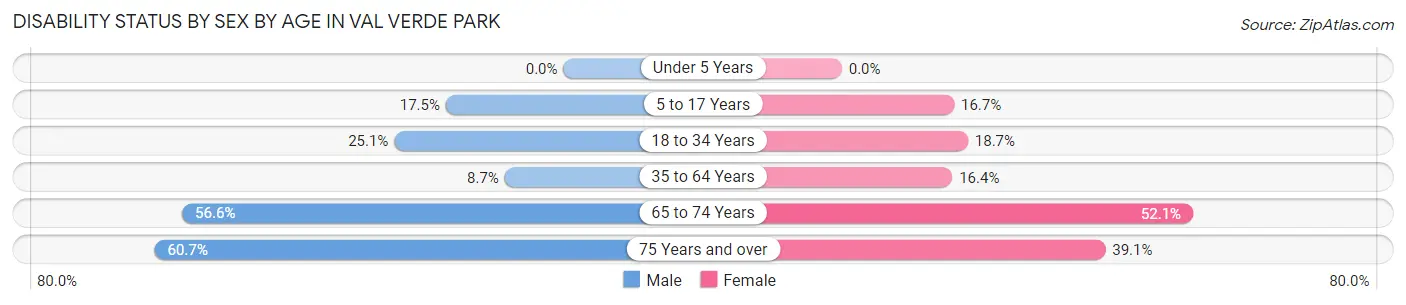
| Age Bracket | Male | Female |
| Under 5 Years | 0 (0.0%) | 0 (0.0%) |
| 5 to 17 Years | 62 (17.5%) | 37 (16.7%) |
| 18 to 34 Years | 156 (25.1%) | 105 (18.7%) |
| 35 to 64 Years | 31 (8.7%) | 83 (16.4%) |
| 65 to 74 Years | 30 (56.6%) | 61 (52.1%) |
| 75 Years and over | 17 (60.7%) | 18 (39.1%) |
Disability Class by Sex by Age in Val Verde Park
Disability Class: Hearing Difficulty
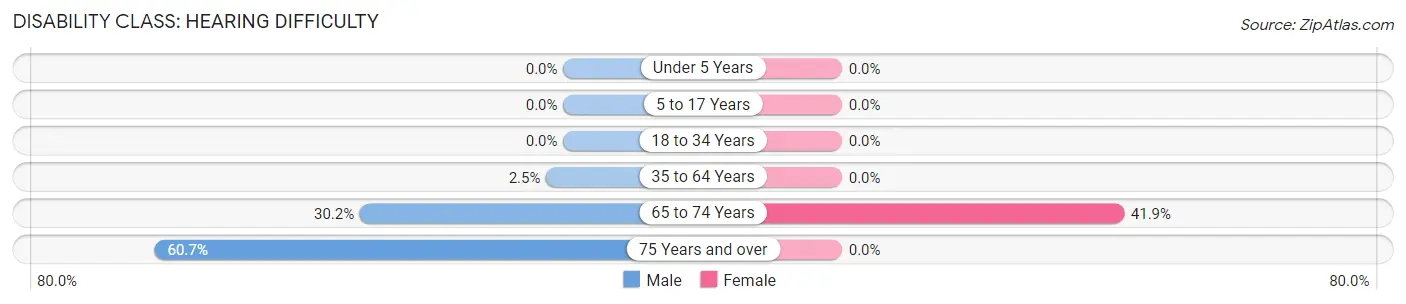
| Age Bracket | Male | Female |
| Under 5 Years | 0 (0.0%) | 0 (0.0%) |
| 5 to 17 Years | 0 (0.0%) | 0 (0.0%) |
| 18 to 34 Years | 0 (0.0%) | 0 (0.0%) |
| 35 to 64 Years | 9 (2.5%) | 0 (0.0%) |
| 65 to 74 Years | 16 (30.2%) | 49 (41.9%) |
| 75 Years and over | 17 (60.7%) | 0 (0.0%) |
Disability Class: Vision Difficulty
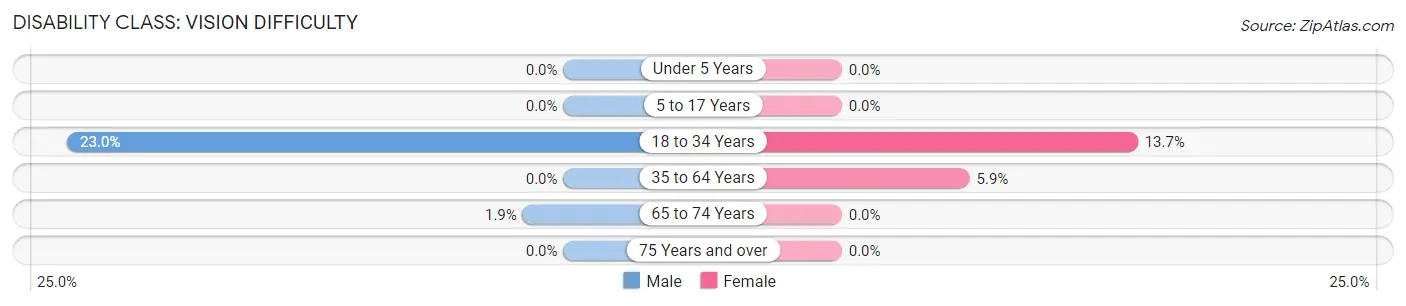
| Age Bracket | Male | Female |
| Under 5 Years | 0 (0.0%) | 0 (0.0%) |
| 5 to 17 Years | 0 (0.0%) | 0 (0.0%) |
| 18 to 34 Years | 143 (23.0%) | 77 (13.7%) |
| 35 to 64 Years | 0 (0.0%) | 30 (5.9%) |
| 65 to 74 Years | 1 (1.9%) | 0 (0.0%) |
| 75 Years and over | 0 (0.0%) | 0 (0.0%) |
Disability Class: Cognitive Difficulty
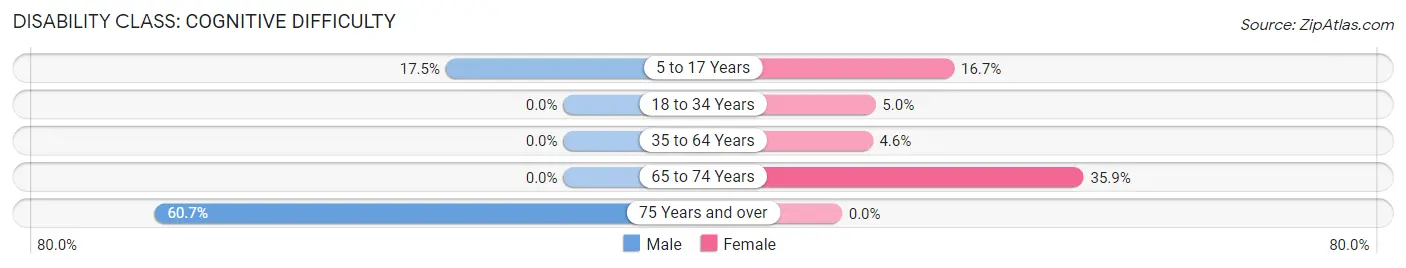
| Age Bracket | Male | Female |
| 5 to 17 Years | 62 (17.5%) | 37 (16.7%) |
| 18 to 34 Years | 0 (0.0%) | 28 (5.0%) |
| 35 to 64 Years | 0 (0.0%) | 23 (4.5%) |
| 65 to 74 Years | 0 (0.0%) | 42 (35.9%) |
| 75 Years and over | 17 (60.7%) | 0 (0.0%) |
Disability Class: Ambulatory Difficulty
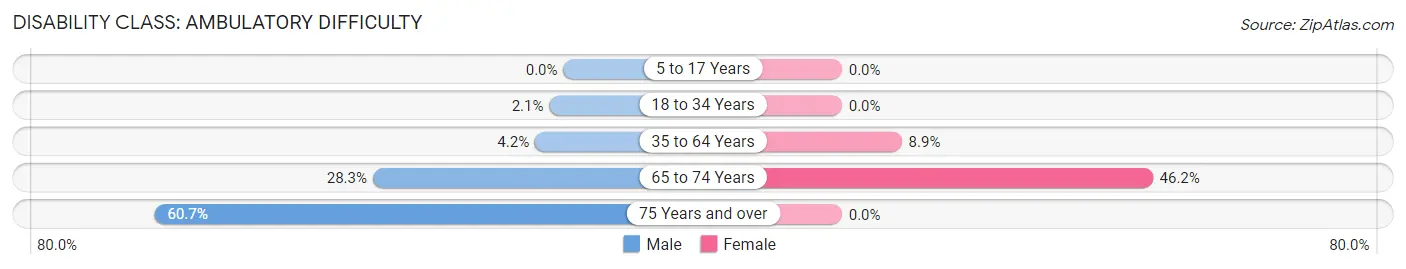
| Age Bracket | Male | Female |
| 5 to 17 Years | 0 (0.0%) | 0 (0.0%) |
| 18 to 34 Years | 13 (2.1%) | 0 (0.0%) |
| 35 to 64 Years | 15 (4.2%) | 45 (8.9%) |
| 65 to 74 Years | 15 (28.3%) | 54 (46.2%) |
| 75 Years and over | 17 (60.7%) | 0 (0.0%) |
Disability Class: Self-Care Difficulty
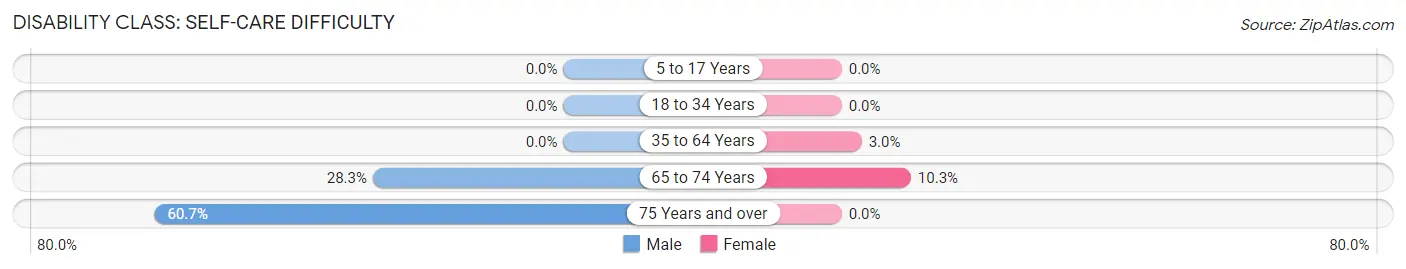
| Age Bracket | Male | Female |
| 5 to 17 Years | 0 (0.0%) | 0 (0.0%) |
| 18 to 34 Years | 0 (0.0%) | 0 (0.0%) |
| 35 to 64 Years | 0 (0.0%) | 15 (3.0%) |
| 65 to 74 Years | 15 (28.3%) | 12 (10.3%) |
| 75 Years and over | 17 (60.7%) | 0 (0.0%) |
Technology Access in Val Verde Park
Computing Device Access in Val Verde Park
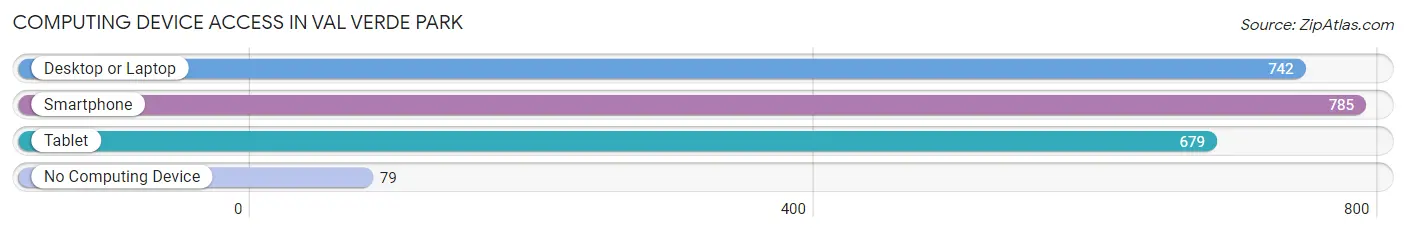
| Device Type | # Households | % Households |
| Desktop or Laptop | 742 | 76.1% |
| Smartphone | 785 | 80.5% |
| Tablet | 679 | 69.6% |
| No Computing Device | 79 | 8.1% |
| Total | 975 | 100.0% |
Internet Access in Val Verde Park
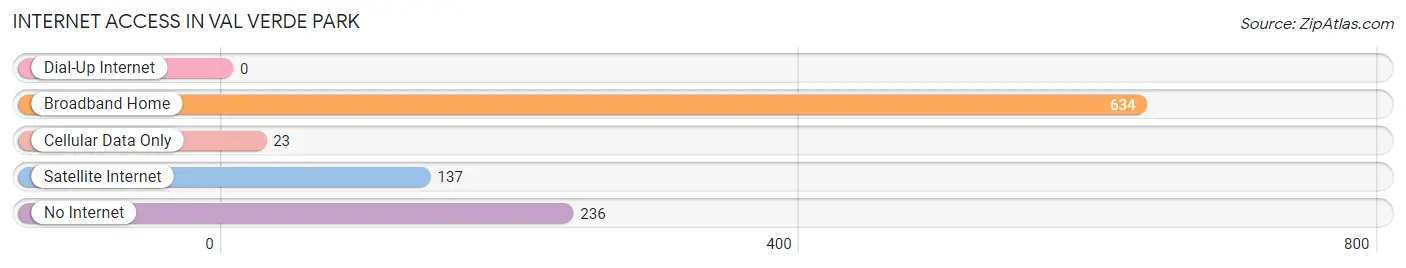
| Internet Type | # Households | % Households |
| Dial-Up Internet | 0 | 0.0% |
| Broadband Home | 634 | 65.0% |
| Cellular Data Only | 23 | 2.4% |
| Satellite Internet | 137 | 14.1% |
| No Internet | 236 | 24.2% |
| Total | 975 | 100.0% |
Val Verde Park Summary
Verde Park, Texas is a small town located in the southeastern corner of the state, just outside of San Antonio. It is a rural community with a population of just over 1,000 people. The town is known for its beautiful scenery, with rolling hills, lush vegetation, and a variety of wildlife.
History
Verde Park was founded in 1876 by a group of settlers from the nearby town of San Antonio. The settlers were looking for a place to settle and start a new life, and they found it in Verde Park. The town was named after the nearby Verde River, which runs through the area.
The town quickly grew and prospered, and by the early 1900s, it had become a thriving community. The town was home to a variety of businesses, including a general store, a blacksmith, a livery stable, and a hotel. The town also had a school, a post office, and a church.
In the early 1900s, the town was also home to a large number of Mexican immigrants, who had come to the area to work in the local farms and ranches. The town was also home to a large number of German immigrants, who had come to the area to work in the local mines.
Geography
Verde Park is located in the southeastern corner of Texas, just outside of San Antonio. The town is situated in a valley, surrounded by rolling hills and lush vegetation. The town is located near the Verde River, which runs through the area.
The town is located in an area of Texas known as the Hill Country, which is known for its beautiful scenery and wildlife. The area is also home to a variety of wildlife, including deer, wild turkeys, and a variety of birds.
Economy
Verde Park is a small, rural community, and the economy is largely based on agriculture and ranching. The town is home to a variety of farms and ranches, which produce a variety of crops, including corn, wheat, and hay. The town is also home to a number of small businesses, including a general store, a blacksmith, and a livery stable.
The town is also home to a number of tourist attractions, including a museum, a golf course, and a variety of outdoor activities. The town is also home to a number of wineries, which produce a variety of wines.
Demographics
As of the 2010 census, the population of Verde Park was 1,072. The town is predominantly white, with a small Hispanic population. The median household income in the town is $45,000, and the median home value is $125,000. The town is home to a variety of religious denominations, including Catholic, Baptist, and Methodist.
Common Questions
What is Per Capita Income in Val Verde Park?
Per Capita income in Val Verde Park is $22,364.
What is the Median Family Income in Val Verde Park?
Median Family Income in Val Verde Park is $56,284.
What is the Median Household income in Val Verde Park?
Median Household Income in Val Verde Park is $58,815.
What is Inequality or Gini Index in Val Verde Park?
Inequality or Gini Index in Val Verde Park is 0.39.
What is the Total Population of Val Verde Park?
Total Population of Val Verde Park is 3,319.
What is the Total Male Population of Val Verde Park?
Total Male Population of Val Verde Park is 1,582.
What is the Total Female Population of Val Verde Park?
Total Female Population of Val Verde Park is 1,737.
What is the Ratio of Males per 100 Females in Val Verde Park?
There are 91.08 Males per 100 Females in Val Verde Park.
What is the Ratio of Females per 100 Males in Val Verde Park?
There are 109.80 Females per 100 Males in Val Verde Park.
What is the Median Population Age in Val Verde Park?
Median Population Age in Val Verde Park is 28.1 Years.
What is the Average Family Size in Val Verde Park
Average Family Size in Val Verde Park is 4.4 People.
What is the Average Household Size in Val Verde Park
Average Household Size in Val Verde Park is 3.4 People.
How Large is the Labor Force in Val Verde Park?
There are 1,620 People in the Labor Forcein in Val Verde Park.
What is the Percentage of People in the Labor Force in Val Verde Park?
69.7% of People are in the Labor Force in Val Verde Park.
What is the Unemployment Rate in Val Verde Park?
Unemployment Rate in Val Verde Park is 1.8%.