Tullahassee, OK Map & Demographics
Tullahassee Map
Tullahassee Overview
$34,752
PER CAPITA INCOME
$108,788
AVG FAMILY INCOME
$108,182
AVG HOUSEHOLD INCOME
94.4%
WAGE / INCOME GAP [ % ]
5.6¢/ $1
WAGE / INCOME GAP [ $ ]
0.19
INEQUALITY / GINI INDEX
121
TOTAL POPULATION
50
MALE POPULATION
71
FEMALE POPULATION
70.42
MALES / 100 FEMALES
142.00
FEMALES / 100 MALES
57.2
MEDIAN AGE
1.9
AVG FAMILY SIZE
2.0
AVG HOUSEHOLD SIZE
88
LABOR FORCE [ PEOPLE ]
75.2%
PERCENT IN LABOR FORCE
Tullahassee Area Codes
Income in Tullahassee
Income Overview in Tullahassee
Per Capita Income in Tullahassee is $34,752, while median incomes of families and households are $108,788 and $108,182 respectively.
| Characteristic | Number | Measure |
| Per Capita Income | 121 | $34,752 |
| Median Family Income | 44 | $108,788 |
| Mean Family Income | 44 | $108,248 |
| Median Household Income | 60 | $108,182 |
| Mean Household Income | 60 | $100,718 |
| Income Deficit | 44 | $0 |
| Wage / Income Gap (%) | 121 | 94.37% |
| Wage / Income Gap ($) | 121 | 5.63¢ per $1 |
| Gini / Inequality Index | 121 | 0.19 |
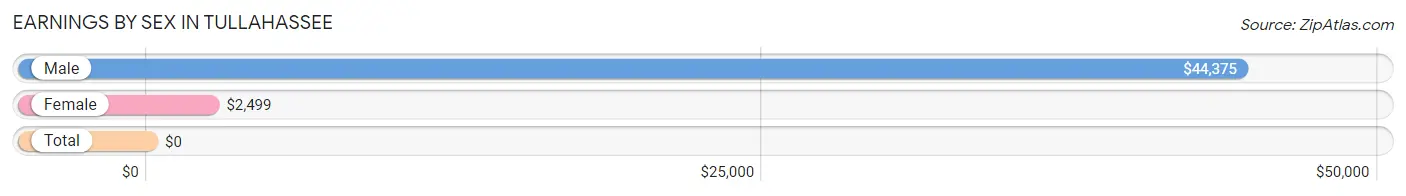
Earnings by Sex in Tullahassee
| Sex | Number | Average Earnings |
| Male | 31 (34.4%) | $44,375 |
| Female | 59 (65.6%) | $2,499 |
| Total | 90 (100.0%) | $0 |
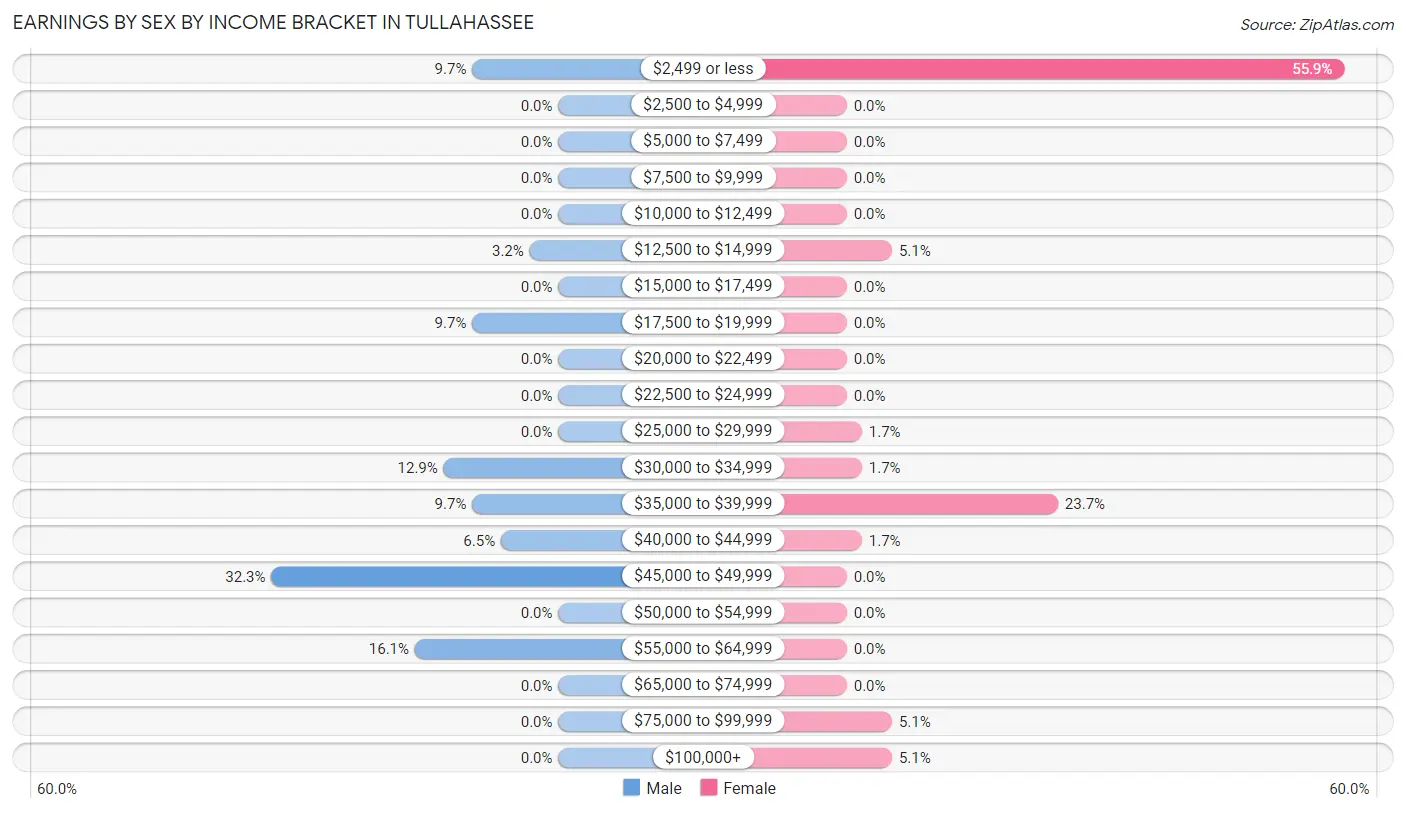
Earnings by Sex by Income Bracket in Tullahassee
The most common earnings brackets in Tullahassee are $45,000 to $49,999 for men (10 | 32.3%) and $2,499 or less for women (33 | 55.9%).
| Income | Male | Female |
| $2,499 or less | 3 (9.7%) | 33 (55.9%) |
| $2,500 to $4,999 | 0 (0.0%) | 0 (0.0%) |
| $5,000 to $7,499 | 0 (0.0%) | 0 (0.0%) |
| $7,500 to $9,999 | 0 (0.0%) | 0 (0.0%) |
| $10,000 to $12,499 | 0 (0.0%) | 0 (0.0%) |
| $12,500 to $14,999 | 1 (3.2%) | 3 (5.1%) |
| $15,000 to $17,499 | 0 (0.0%) | 0 (0.0%) |
| $17,500 to $19,999 | 3 (9.7%) | 0 (0.0%) |
| $20,000 to $22,499 | 0 (0.0%) | 0 (0.0%) |
| $22,500 to $24,999 | 0 (0.0%) | 0 (0.0%) |
| $25,000 to $29,999 | 0 (0.0%) | 1 (1.7%) |
| $30,000 to $34,999 | 4 (12.9%) | 1 (1.7%) |
| $35,000 to $39,999 | 3 (9.7%) | 14 (23.7%) |
| $40,000 to $44,999 | 2 (6.5%) | 1 (1.7%) |
| $45,000 to $49,999 | 10 (32.3%) | 0 (0.0%) |
| $50,000 to $54,999 | 0 (0.0%) | 0 (0.0%) |
| $55,000 to $64,999 | 5 (16.1%) | 0 (0.0%) |
| $65,000 to $74,999 | 0 (0.0%) | 0 (0.0%) |
| $75,000 to $99,999 | 0 (0.0%) | 3 (5.1%) |
| $100,000+ | 0 (0.0%) | 3 (5.1%) |
| Total | 31 (100.0%) | 59 (100.0%) |
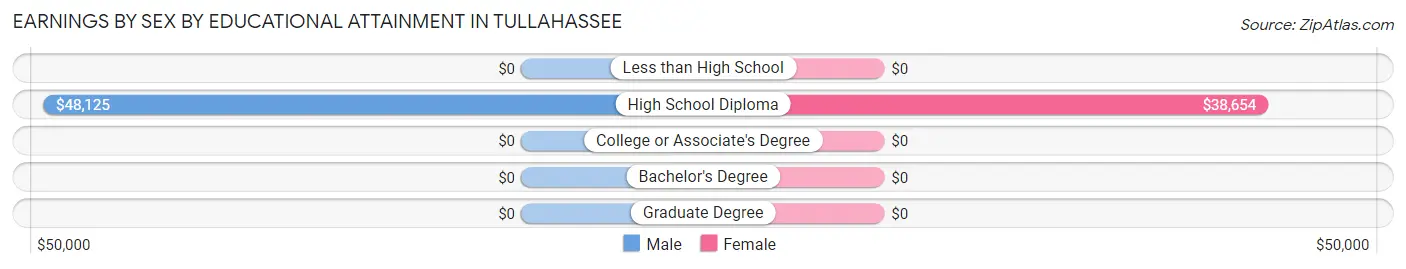
Earnings by Sex by Educational Attainment in Tullahassee
Average earnings in Tullahassee are $46,250 for men and $2,499 for women, a difference of 94.6%. Men with an educational attainment of high school diploma enjoy the highest average annual earnings of $48,125, while those with high school diploma education earn the least with $48,125. Women with an educational attainment of high school diploma earn the most with the average annual earnings of $38,654, while those with high school diploma education have the smallest earnings of $38,654.
| Educational Attainment | Male Income | Female Income |
| Less than High School | - | - |
| High School Diploma | $48,125 | $38,654 |
| College or Associate's Degree | - | - |
| Bachelor's Degree | - | - |
| Graduate Degree | - | - |
| Total | $46,250 | $2,499 |
Family Income in Tullahassee
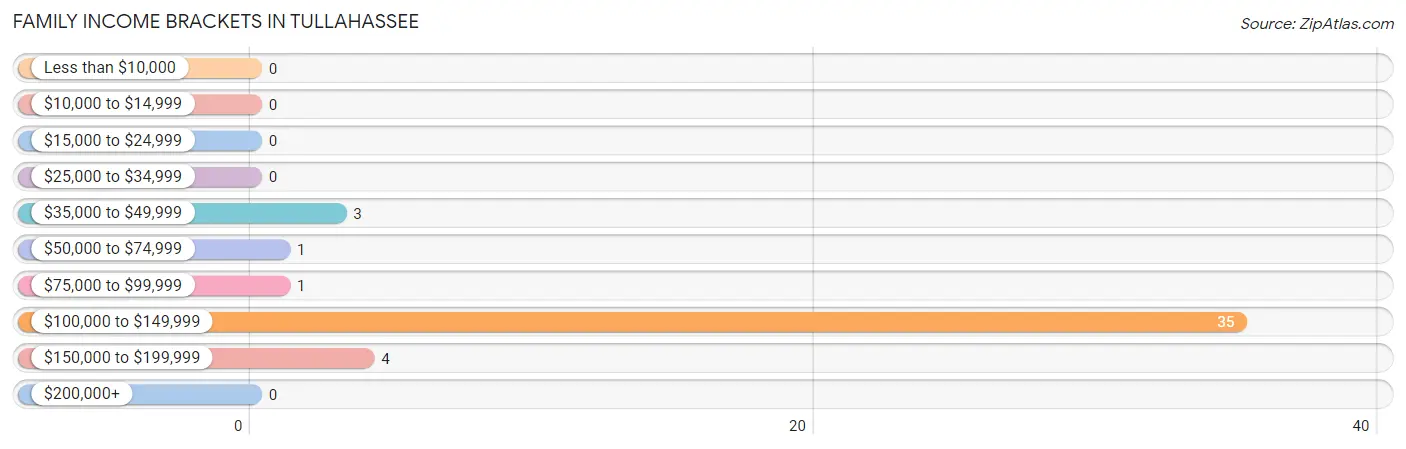
Family Income Brackets in Tullahassee
According to the Tullahassee family income data, there are 35 families falling into the $100,000 to $149,999 income range, which is the most common income bracket and makes up 79.5% of all families.
| Income Bracket | # Families | % Families |
| Less than $10,000 | 0 | 0.0% |
| $10,000 to $14,999 | 0 | 0.0% |
| $15,000 to $24,999 | 0 | 0.0% |
| $25,000 to $34,999 | 0 | 0.0% |
| $35,000 to $49,999 | 3 | 6.8% |
| $50,000 to $74,999 | 1 | 2.3% |
| $75,000 to $99,999 | 1 | 2.3% |
| $100,000 to $149,999 | 35 | 79.5% |
| $150,000 to $199,999 | 4 | 9.1% |
| $200,000+ | 0 | 0.0% |
Family Income by Famaliy Size in Tullahassee
| Income Bracket | # Families | Median Income |
| 2-Person Families | 5 (11.4%) | $0 |
| 3-Person Families | 2 (4.5%) | $0 |
| 4-Person Families | 35 (79.5%) | $0 |
| 5-Person Families | 1 (2.3%) | $0 |
| 6-Person Families | 1 (2.3%) | $0 |
| 7+ Person Families | 0 (0.0%) | $0 |
| Total | 44 (100.0%) | $108,788 |
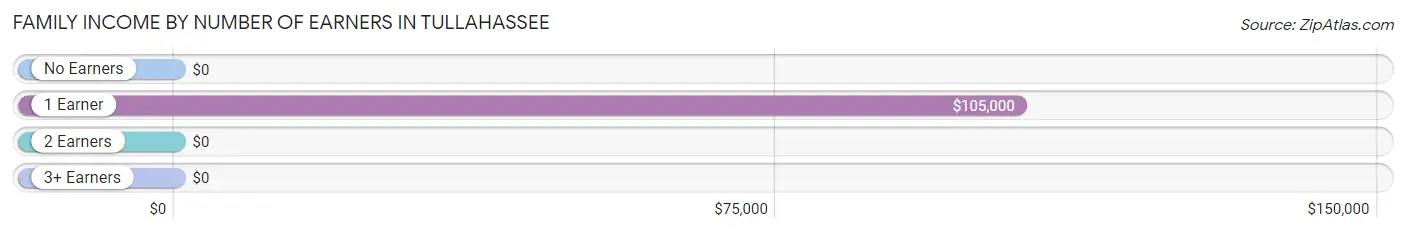
Family Income by Number of Earners in Tullahassee
| Number of Earners | # Families | Median Income |
| No Earners | 3 (6.8%) | $0 |
| 1 Earner | 4 (9.1%) | $105,000 |
| 2 Earners | 3 (6.8%) | $0 |
| 3+ Earners | 34 (77.3%) | $0 |
| Total | 44 (100.0%) | $108,788 |
Household Income in Tullahassee
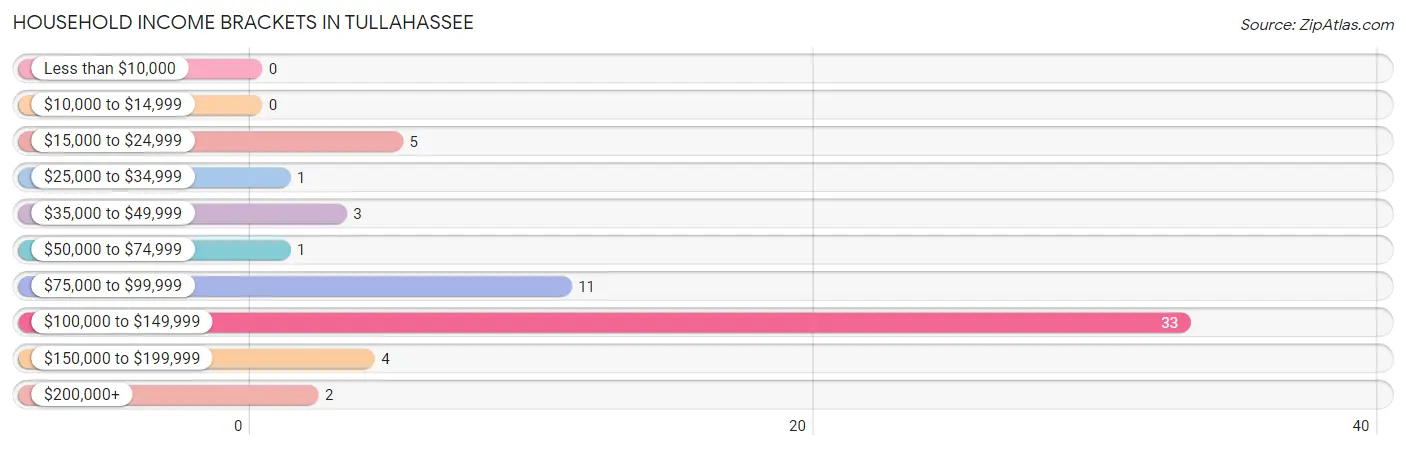
Household Income Brackets in Tullahassee
With 33 households falling in the category, the $100,000 to $149,999 income range is the most frequent in Tullahassee, accounting for 55.0% of all households.
| Income Bracket | # Households | % Households |
| Less than $10,000 | 0 | 0.0% |
| $10,000 to $14,999 | 0 | 0.0% |
| $15,000 to $24,999 | 5 | 8.3% |
| $25,000 to $34,999 | 1 | 1.7% |
| $35,000 to $49,999 | 3 | 5.0% |
| $50,000 to $74,999 | 1 | 1.7% |
| $75,000 to $99,999 | 11 | 18.3% |
| $100,000 to $149,999 | 33 | 55.0% |
| $150,000 to $199,999 | 4 | 6.7% |
| $200,000+ | 2 | 3.3% |
Household Income by Householder Age in Tullahassee
The median household income in Tullahassee is $108,182, with the highest median household income of $108,636 found in the 65+ years age bracket for the primary householder. A total of 40 households (66.7%) fall into this category.
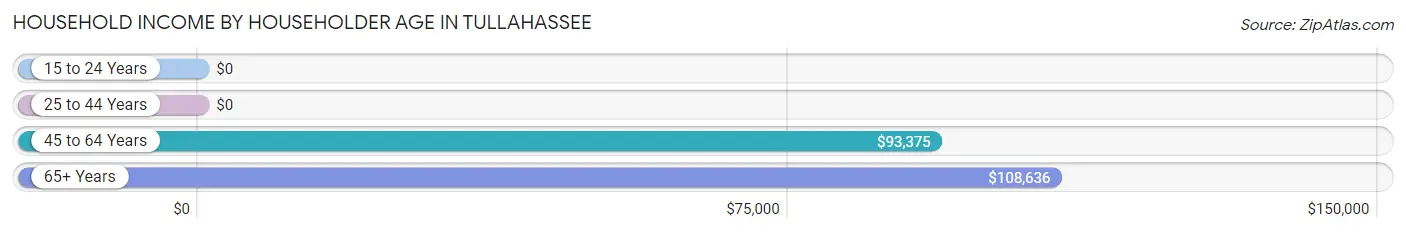
| Income Bracket | # Households | Median Income |
| 15 to 24 Years | 0 (0.0%) | $0 |
| 25 to 44 Years | 1 (1.7%) | $0 |
| 45 to 64 Years | 19 (31.7%) | $93,375 |
| 65+ Years | 40 (66.7%) | $108,636 |
| Total | 60 (100.0%) | $108,182 |
Poverty in Tullahassee
Income Below Poverty by Sex and Age in Tullahassee
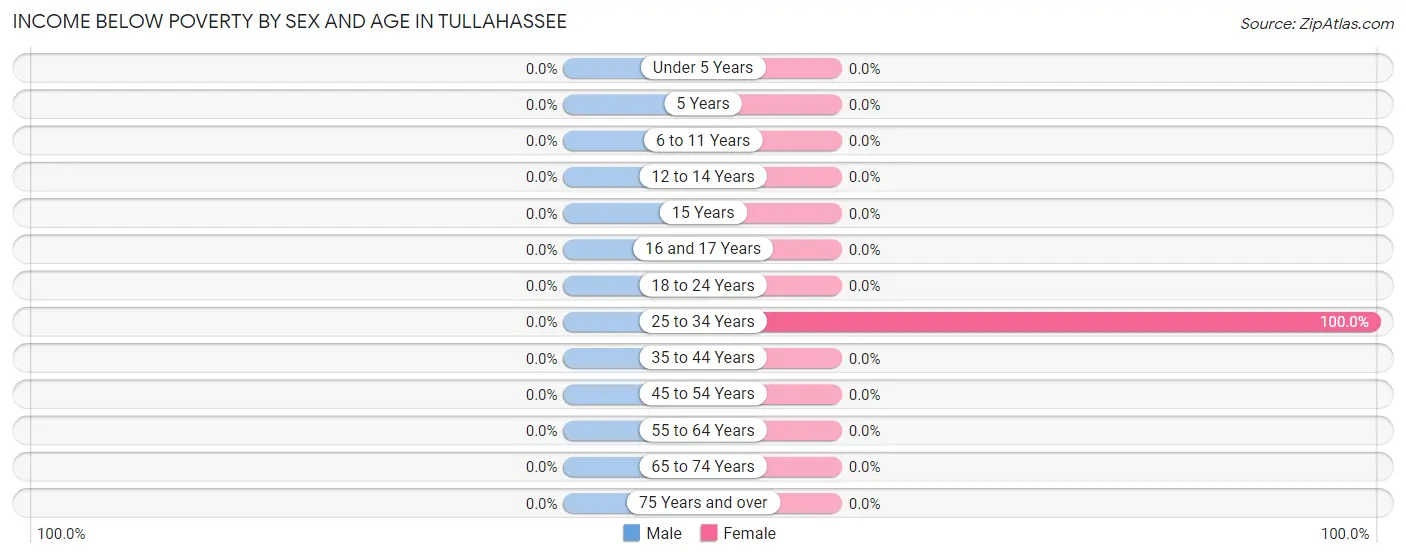
| Age Bracket | Male | Female |
| Under 5 Years | 0 (0.0%) | 0 (0.0%) |
| 5 Years | 0 (0.0%) | 0 (0.0%) |
| 6 to 11 Years | 0 (0.0%) | 0 (0.0%) |
| 12 to 14 Years | 0 (0.0%) | 0 (0.0%) |
| 15 Years | 0 (0.0%) | 0 (0.0%) |
| 16 and 17 Years | 0 (0.0%) | 0 (0.0%) |
| 18 to 24 Years | 0 (0.0%) | 0 (0.0%) |
| 25 to 34 Years | 0 (0.0%) | 3 (100.0%) |
| 35 to 44 Years | 0 (0.0%) | 0 (0.0%) |
| 45 to 54 Years | 0 (0.0%) | 0 (0.0%) |
| 55 to 64 Years | 0 (0.0%) | 0 (0.0%) |
| 65 to 74 Years | 0 (0.0%) | 0 (0.0%) |
| 75 Years and over | 0 (0.0%) | 0 (0.0%) |
| Total | 0 (0.0%) | 3 (4.2%) |
Income Above Poverty by Sex and Age in Tullahassee
According to the poverty statistics in Tullahassee, males aged 6 to 11 years and females aged 6 to 11 years are the age groups that are most secure financially, with 100.0% of males and 100.0% of females in these age groups living above the poverty line.
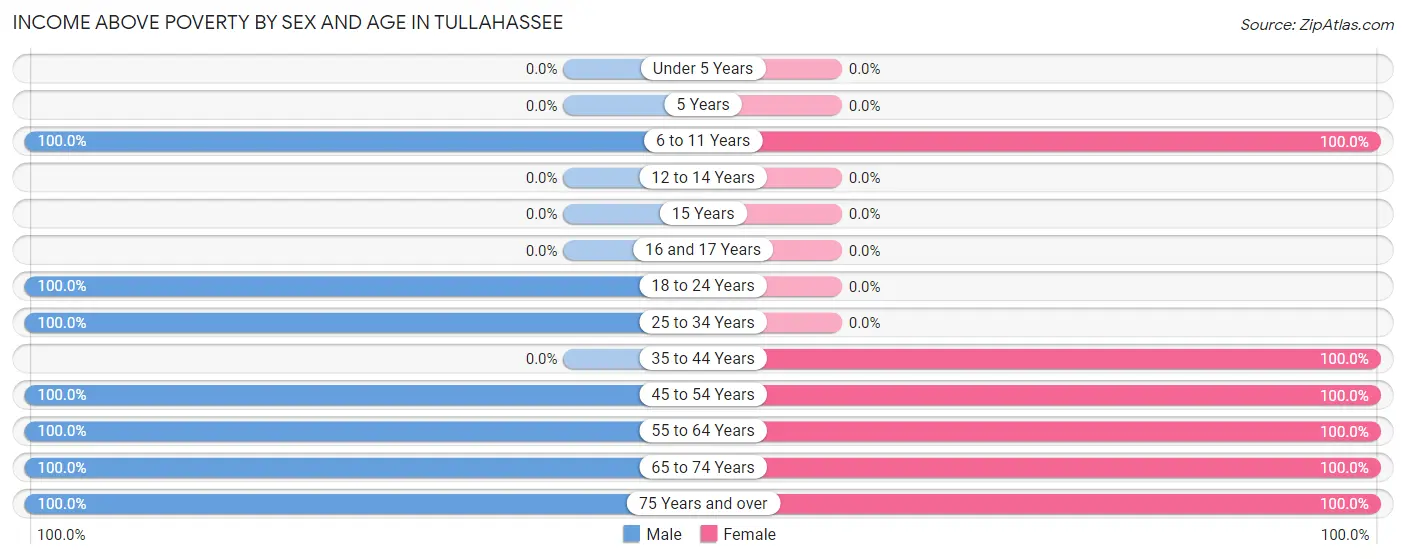
| Age Bracket | Male | Female |
| Under 5 Years | 0 (0.0%) | 0 (0.0%) |
| 5 Years | 0 (0.0%) | 0 (0.0%) |
| 6 to 11 Years | 2 (100.0%) | 2 (100.0%) |
| 12 to 14 Years | 0 (0.0%) | 0 (0.0%) |
| 15 Years | 0 (0.0%) | 0 (0.0%) |
| 16 and 17 Years | 0 (0.0%) | 0 (0.0%) |
| 18 to 24 Years | 4 (100.0%) | 0 (0.0%) |
| 25 to 34 Years | 5 (100.0%) | 0 (0.0%) |
| 35 to 44 Years | 0 (0.0%) | 17 (100.0%) |
| 45 to 54 Years | 22 (100.0%) | 4 (100.0%) |
| 55 to 64 Years | 9 (100.0%) | 4 (100.0%) |
| 65 to 74 Years | 2 (100.0%) | 7 (100.0%) |
| 75 Years and over | 6 (100.0%) | 34 (100.0%) |
| Total | 50 (100.0%) | 68 (95.8%) |
Income Below Poverty Among Married-Couple Families in Tullahassee
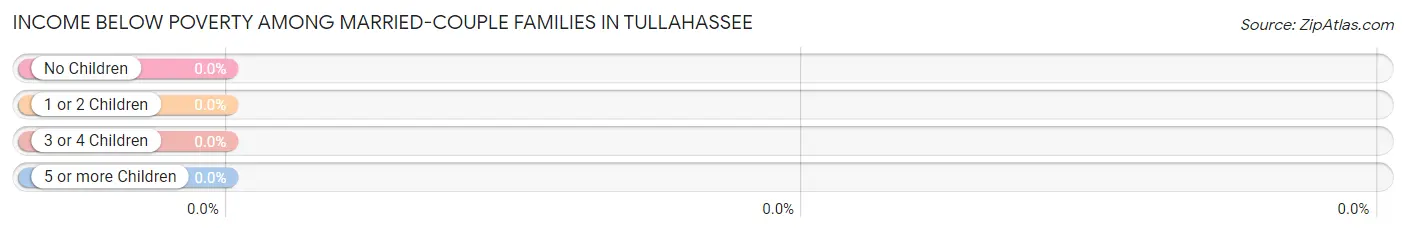
| Children | Above Poverty | Below Poverty |
| No Children | 6 (100.0%) | 0 (0.0%) |
| 1 or 2 Children | 0 (0.0%) | 0 (0.0%) |
| 3 or 4 Children | 0 (0.0%) | 0 (0.0%) |
| 5 or more Children | 0 (0.0%) | 0 (0.0%) |
| Total | 6 (100.0%) | 0 (0.0%) |
Income Below Poverty Among Single-Parent Households in Tullahassee
| Children | Single Father | Single Mother |
| No Children | 0 (0.0%) | 0 (0.0%) |
| 1 or 2 Children | 0 (0.0%) | 0 (0.0%) |
| 3 or 4 Children | 0 (0.0%) | 0 (0.0%) |
| 5 or more Children | 0 (0.0%) | 0 (0.0%) |
| Total | 0 (0.0%) | 0 (0.0%) |
Income Below Poverty Among Married-Couple vs Single-Parent Households in Tullahassee
| Children | Married-Couple Families | Single-Parent Households |
| No Children | 0 (0.0%) | 0 (0.0%) |
| 1 or 2 Children | 0 (0.0%) | 0 (0.0%) |
| 3 or 4 Children | 0 (0.0%) | 0 (0.0%) |
| 5 or more Children | 0 (0.0%) | 0 (0.0%) |
| Total | 0 (0.0%) | 0 (0.0%) |
Race in Tullahassee
The most populous races in Tullahassee are Black / African American (88 | 72.7%), White / Caucasian (15 | 12.4%), and Two or more Races (12 | 9.9%).
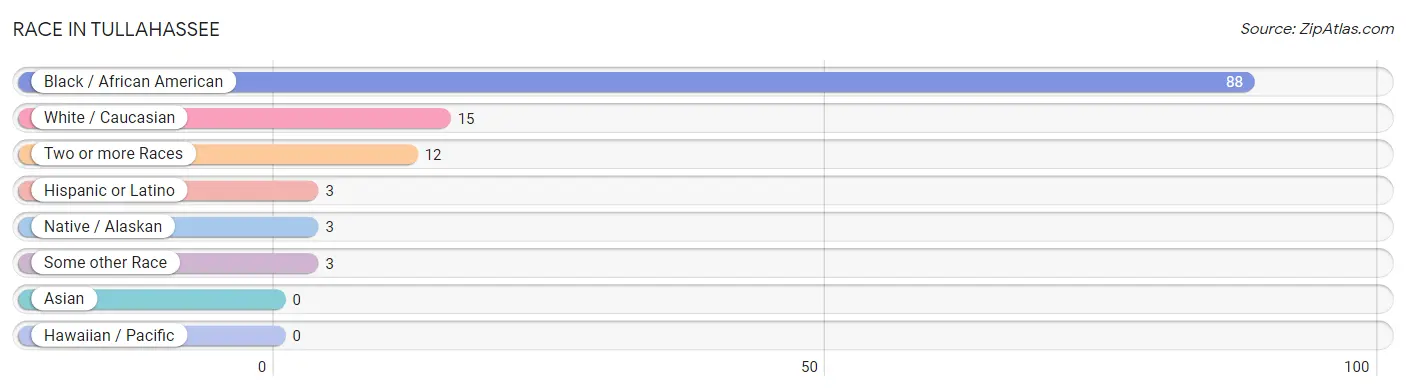
| Race | # Population | % Population |
| Asian | 0 | 0.0% |
| Black / African American | 88 | 72.7% |
| Hawaiian / Pacific | 0 | 0.0% |
| Hispanic or Latino | 3 | 2.5% |
| Native / Alaskan | 3 | 2.5% |
| White / Caucasian | 15 | 12.4% |
| Two or more Races | 12 | 9.9% |
| Some other Race | 3 | 2.5% |
| Total | 121 | 100.0% |
Ancestry in Tullahassee
The most populous ancestries reported in Tullahassee are Cherokee (12 | 9.9%), African (8 | 6.6%), German (8 | 6.6%), Subsaharan African (8 | 6.6%), and Irish (4 | 3.3%), together accounting for 33.1% of all Tullahassee residents.
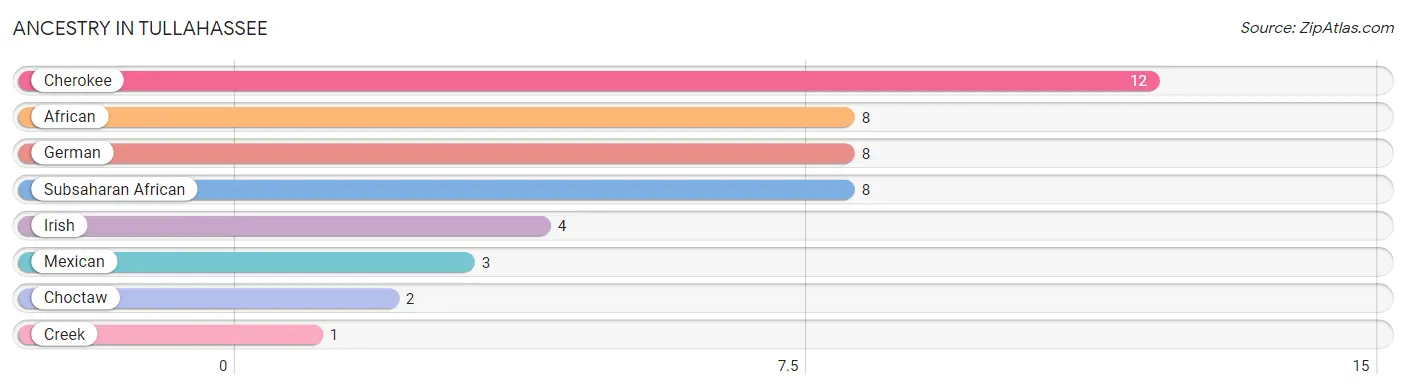
| Ancestry | # Population | % Population |
| African | 8 | 6.6% |
| Cherokee | 12 | 9.9% |
| Choctaw | 2 | 1.7% |
| Creek | 1 | 0.8% |
| German | 8 | 6.6% |
| Irish | 4 | 3.3% |
| Mexican | 3 | 2.5% |
| Subsaharan African | 8 | 6.6% | View All 8 Rows |
Immigrants in Tullahassee
The most numerous immigrant groups reported in Tullahassee came from Central America (3 | 2.5%), Latin America (3 | 2.5%), and Mexico (3 | 2.5%), together accounting for 7.4% of all Tullahassee residents.
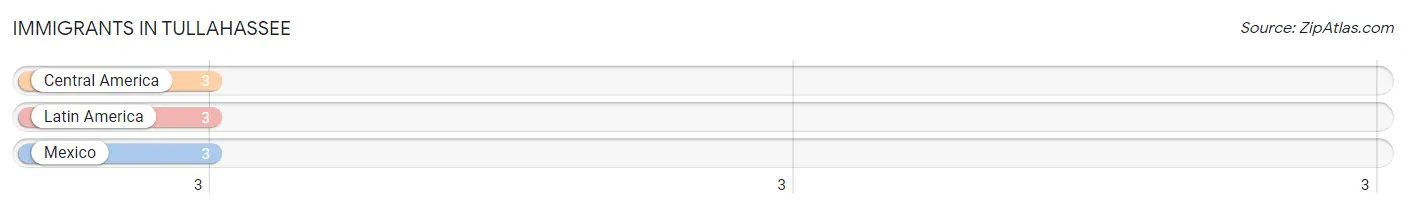
| Immigration Origin | # Population | % Population |
| Central America | 3 | 2.5% |
| Latin America | 3 | 2.5% |
| Mexico | 3 | 2.5% | View All 3 Rows |
Sex and Age in Tullahassee
Sex and Age in Tullahassee
The most populous age groups in Tullahassee are 50 to 54 Years (18 | 36.0%) for men and 75 to 79 Years (33 | 46.5%) for women.
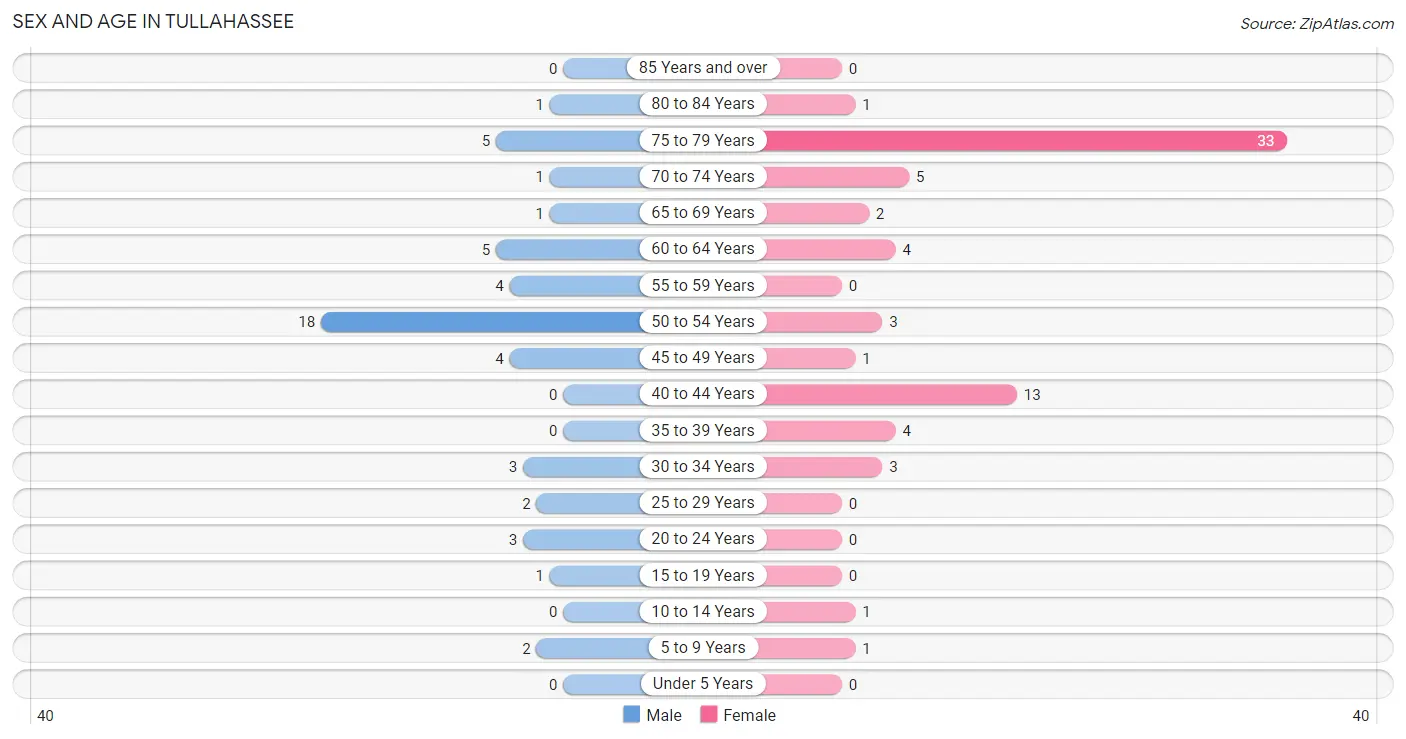
| Age Bracket | Male | Female |
| Under 5 Years | 0 (0.0%) | 0 (0.0%) |
| 5 to 9 Years | 2 (4.0%) | 1 (1.4%) |
| 10 to 14 Years | 0 (0.0%) | 1 (1.4%) |
| 15 to 19 Years | 1 (2.0%) | 0 (0.0%) |
| 20 to 24 Years | 3 (6.0%) | 0 (0.0%) |
| 25 to 29 Years | 2 (4.0%) | 0 (0.0%) |
| 30 to 34 Years | 3 (6.0%) | 3 (4.2%) |
| 35 to 39 Years | 0 (0.0%) | 4 (5.6%) |
| 40 to 44 Years | 0 (0.0%) | 13 (18.3%) |
| 45 to 49 Years | 4 (8.0%) | 1 (1.4%) |
| 50 to 54 Years | 18 (36.0%) | 3 (4.2%) |
| 55 to 59 Years | 4 (8.0%) | 0 (0.0%) |
| 60 to 64 Years | 5 (10.0%) | 4 (5.6%) |
| 65 to 69 Years | 1 (2.0%) | 2 (2.8%) |
| 70 to 74 Years | 1 (2.0%) | 5 (7.0%) |
| 75 to 79 Years | 5 (10.0%) | 33 (46.5%) |
| 80 to 84 Years | 1 (2.0%) | 1 (1.4%) |
| 85 Years and over | 0 (0.0%) | 0 (0.0%) |
| Total | 50 (100.0%) | 71 (100.0%) |
Families and Households in Tullahassee
Median Family Size in Tullahassee
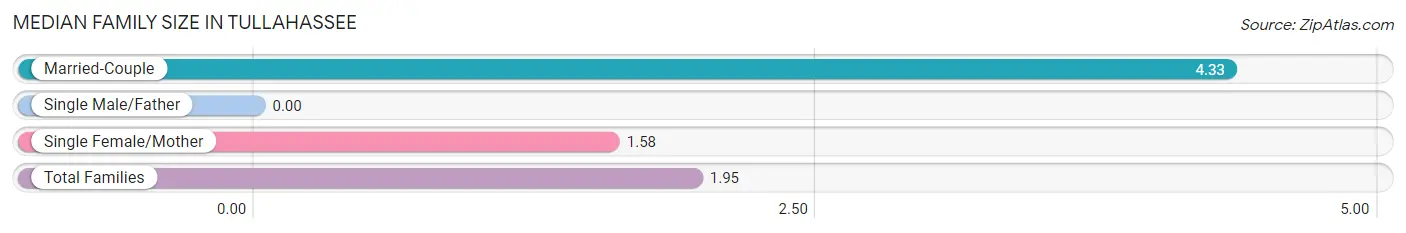
| Family Type | # Families | Family Size |
| Married-Couple | 6 (13.6%) | 4.33 |
| Single Male/Father | 0 (0.0%) | - |
| Single Female/Mother | 38 (86.4%) | 1.58 |
| Total Families | 44 (100.0%) | 1.95 |
Median Household Size in Tullahassee
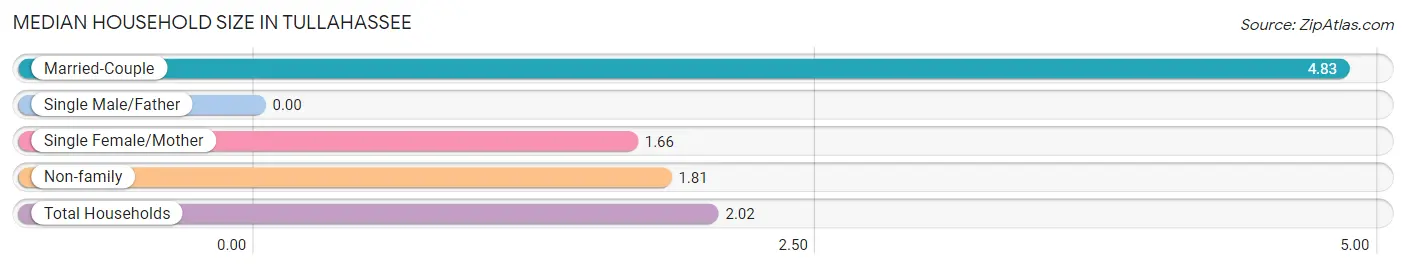
| Household Type | # Households | Household Size |
| Married-Couple | 6 (10.0%) | 4.83 |
| Single Male/Father | 0 (0.0%) | - |
| Single Female/Mother | 38 (63.3%) | 1.66 |
| Non-family | 16 (26.7%) | 1.81 |
| Total Households | 60 (100.0%) | 2.02 |
Household Size by Marriage Status in Tullahassee
Out of a total of 60 households in Tullahassee, 44 (73.3%) are family households, while 16 (26.7%) are nonfamily households. The most numerous type of family households are 4-person households, comprising 35, and the most common type of nonfamily households are 2-person households, comprising 10.
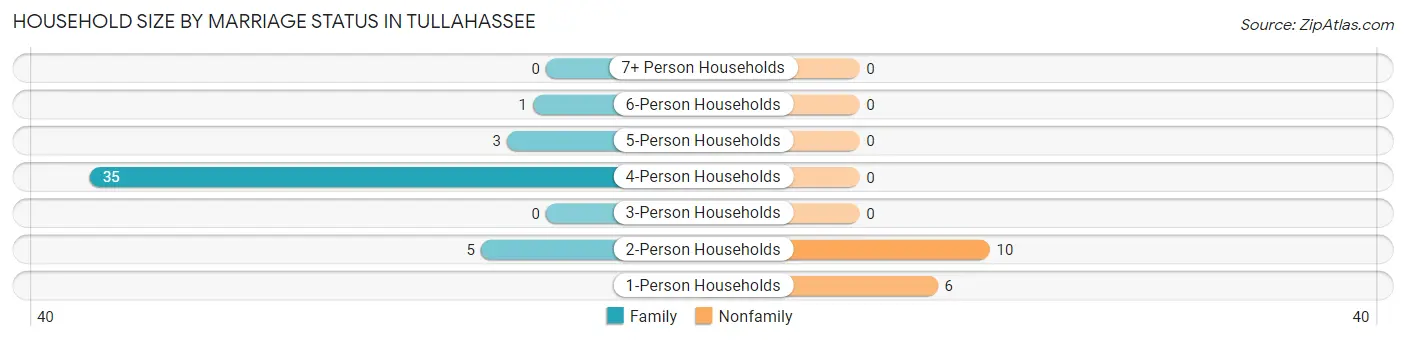
| Household Size | Family Households | Nonfamily Households |
| 1-Person Households | - | 6 (10.0%) |
| 2-Person Households | 5 (8.3%) | 10 (16.7%) |
| 3-Person Households | 0 (0.0%) | 0 (0.0%) |
| 4-Person Households | 35 (58.3%) | 0 (0.0%) |
| 5-Person Households | 3 (5.0%) | 0 (0.0%) |
| 6-Person Households | 1 (1.7%) | 0 (0.0%) |
| 7+ Person Households | 0 (0.0%) | 0 (0.0%) |
| Total | 44 (73.3%) | 16 (26.7%) |
Female Fertility in Tullahassee
Fertility by Age in Tullahassee
| Age Bracket | Women with Births | Births / 1,000 Women |
| 15 to 19 years | 0 (0.0%) | 0.0 |
| 20 to 34 years | 0 (0.0%) | 0.0 |
| 35 to 50 years | 0 (0.0%) | 0.0 |
| Total | 0 (0.0%) | 0.0 |
Fertility by Age by Marriage Status in Tullahassee
| Age Bracket | Married | Unmarried |
| 15 to 19 years | 0 (0.0%) | 0 (0.0%) |
| 20 to 34 years | 0 (0.0%) | 0 (0.0%) |
| 35 to 50 years | 0 (0.0%) | 0 (0.0%) |
| Total | 0 (0.0%) | 0 (0.0%) |
Fertility by Education in Tullahassee
| Educational Attainment | Women with Births | Births / 1,000 Women |
| Less than High School | 0 (0.0%) | 0.0 |
| High School Diploma | 0 (0.0%) | 0.0 |
| College or Associate's Degree | 0 (0.0%) | 0.0 |
| Bachelor's Degree | 0 (0.0%) | 0.0 |
| Graduate Degree | 0 (0.0%) | 0.0 |
| Total | 0 (0.0%) | 0.0 |
Fertility by Education by Marriage Status in Tullahassee
| Educational Attainment | Married | Unmarried |
| Less than High School | 0 (0.0%) | 0 (0.0%) |
| High School Diploma | 0 (0.0%) | 0 (0.0%) |
| College or Associate's Degree | 0 (0.0%) | 0 (0.0%) |
| Bachelor's Degree | 0 (0.0%) | 0 (0.0%) |
| Graduate Degree | 0 (0.0%) | 0 (0.0%) |
| Total | 0 (0.0%) | 0 (0.0%) |
Employment Characteristics in Tullahassee
Employment by Class of Employer in Tullahassee
Among the 88 employed individuals in Tullahassee, private company employees (79 | 89.8%), not-for-profit organizations (3 | 3.4%), and federal government employees (3 | 3.4%) make up the most common classes of employment.
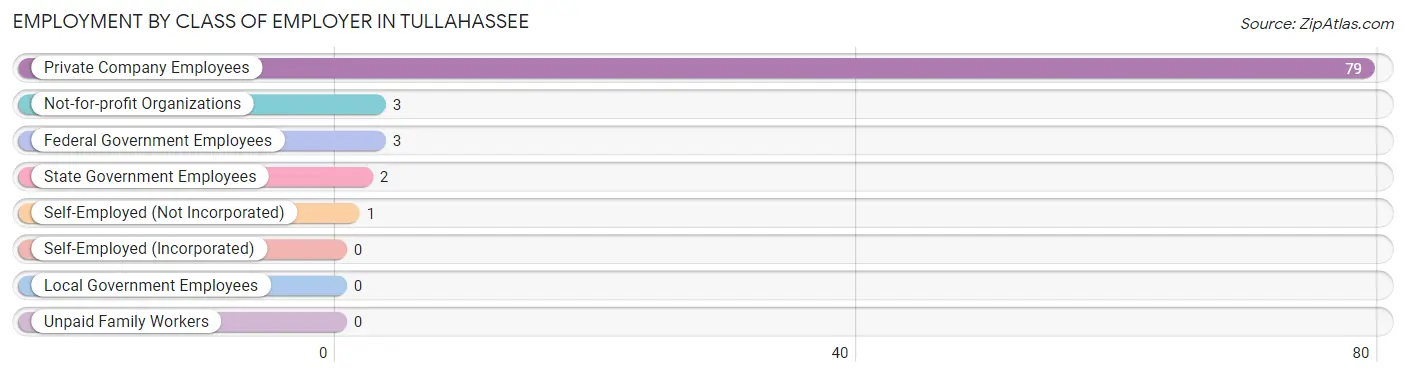
| Employer Class | # Employees | % Employees |
| Private Company Employees | 79 | 89.8% |
| Self-Employed (Incorporated) | 0 | 0.0% |
| Self-Employed (Not Incorporated) | 1 | 1.1% |
| Not-for-profit Organizations | 3 | 3.4% |
| Local Government Employees | 0 | 0.0% |
| State Government Employees | 2 | 2.3% |
| Federal Government Employees | 3 | 3.4% |
| Unpaid Family Workers | 0 | 0.0% |
| Total | 88 | 100.0% |
Employment Status by Age in Tullahassee
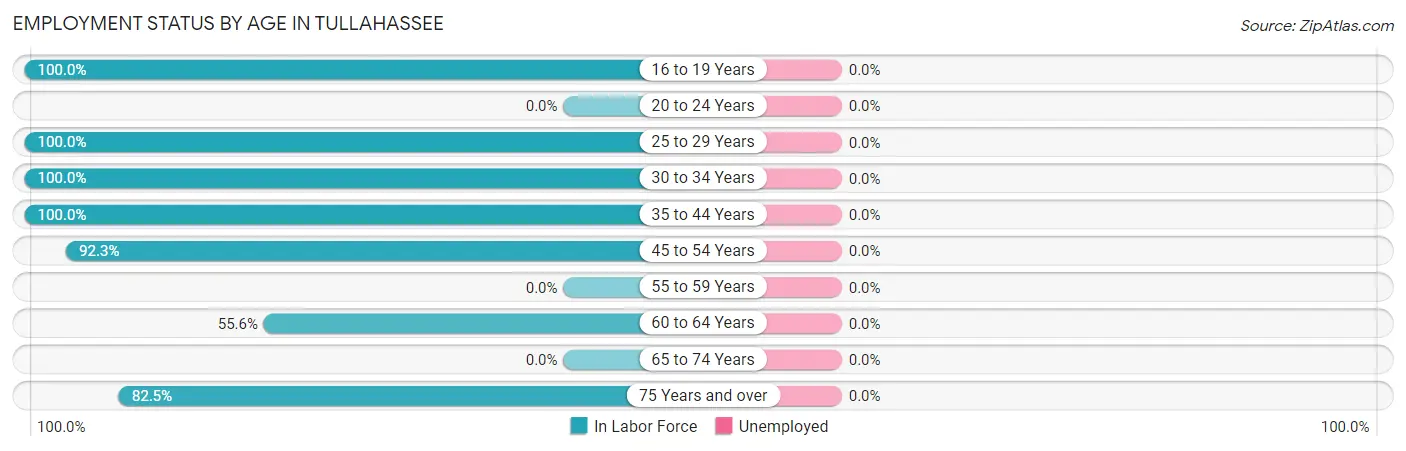
| Age Bracket | In Labor Force | Unemployed |
| 16 to 19 Years | 1 (100.0%) | 0 (0.0%) |
| 20 to 24 Years | 0 (0.0%) | 0 (0.0%) |
| 25 to 29 Years | 2 (100.0%) | 0 (0.0%) |
| 30 to 34 Years | 6 (100.0%) | 0 (0.0%) |
| 35 to 44 Years | 17 (100.0%) | 0 (0.0%) |
| 45 to 54 Years | 24 (92.3%) | 0 (0.0%) |
| 55 to 59 Years | 0 (0.0%) | 0 (0.0%) |
| 60 to 64 Years | 5 (55.6%) | 0 (0.0%) |
| 65 to 74 Years | 0 (0.0%) | 0 (0.0%) |
| 75 Years and over | 33 (82.5%) | 0 (0.0%) |
| Total | 88 (75.2%) | 0 (0.0%) |
Employment Status by Educational Attainment in Tullahassee
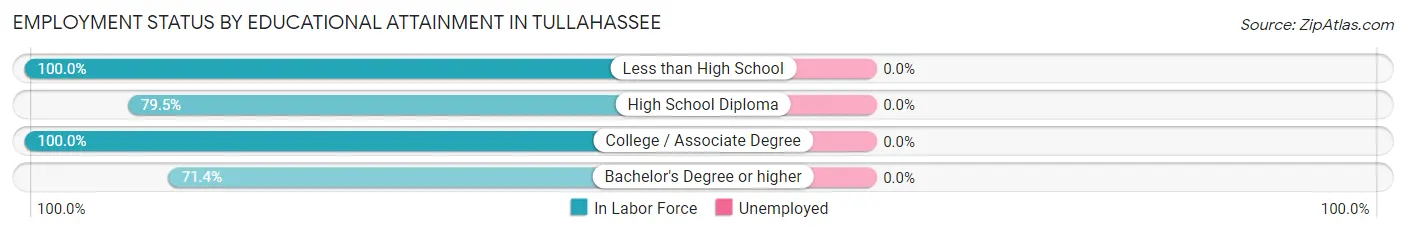
| Educational Attainment | In Labor Force | Unemployed |
| Less than High School | 3 (100.0%) | 0 (0.0%) |
| High School Diploma | 31 (79.5%) | 0 (0.0%) |
| College / Associate Degree | 15 (100.0%) | 0 (0.0%) |
| Bachelor's Degree or higher | 5 (71.4%) | 0 (0.0%) |
| Total | 54 (84.4%) | 0 (0.0%) |
Employment Occupations by Sex in Tullahassee
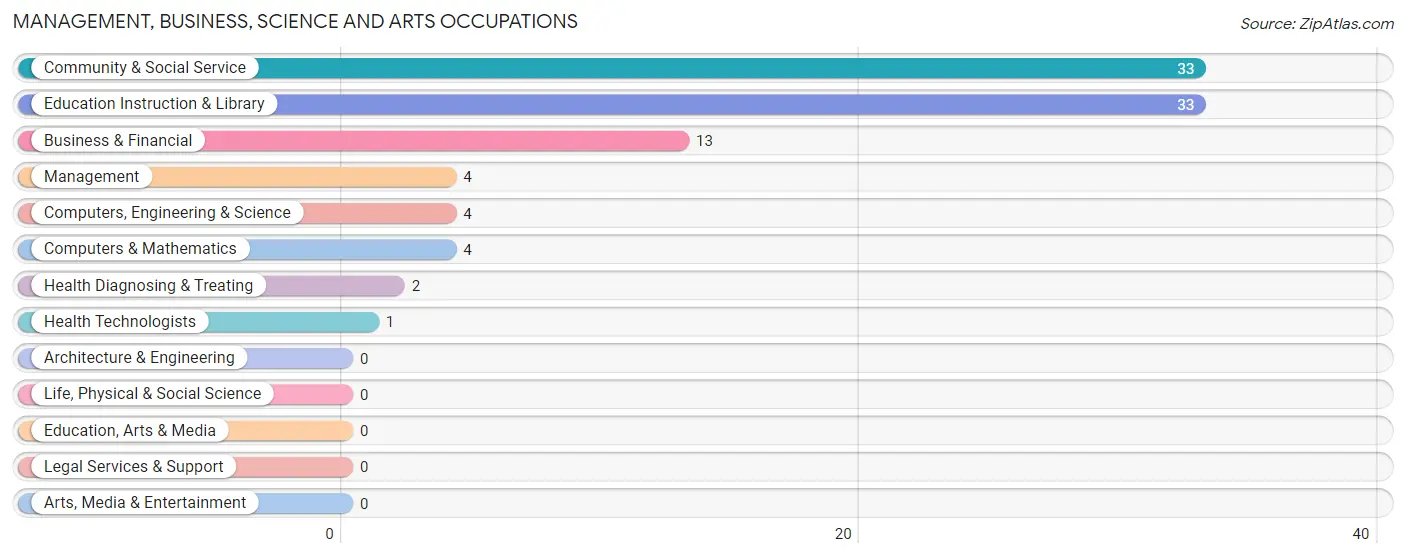
Management, Business, Science and Arts Occupations
The most common Management, Business, Science and Arts occupations in Tullahassee are Community & Social Service (33 | 37.5%), Education Instruction & Library (33 | 37.5%), Business & Financial (13 | 14.8%), Management (4 | 4.5%), and Computers, Engineering & Science (4 | 4.5%).
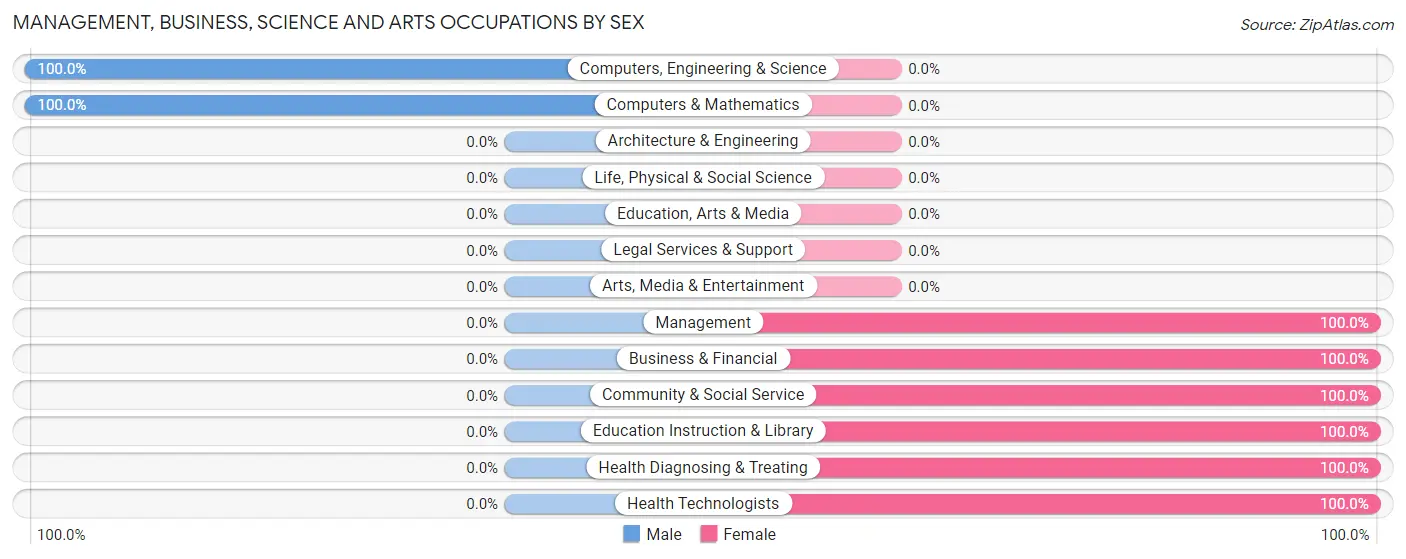
Management, Business, Science and Arts Occupations by Sex
Within the Management, Business, Science and Arts occupations in Tullahassee, the most male-oriented occupations are Computers, Engineering & Science (100.0%), and Computers & Mathematics (100.0%), while the most female-oriented occupations are Management (100.0%), Business & Financial (100.0%), and Community & Social Service (100.0%).
| Occupation | Male | Female |
| Management | 0 (0.0%) | 4 (100.0%) |
| Business & Financial | 0 (0.0%) | 13 (100.0%) |
| Computers, Engineering & Science | 4 (100.0%) | 0 (0.0%) |
| Computers & Mathematics | 4 (100.0%) | 0 (0.0%) |
| Architecture & Engineering | 0 (0.0%) | 0 (0.0%) |
| Life, Physical & Social Science | 0 (0.0%) | 0 (0.0%) |
| Community & Social Service | 0 (0.0%) | 33 (100.0%) |
| Education, Arts & Media | 0 (0.0%) | 0 (0.0%) |
| Legal Services & Support | 0 (0.0%) | 0 (0.0%) |
| Education Instruction & Library | 0 (0.0%) | 33 (100.0%) |
| Arts, Media & Entertainment | 0 (0.0%) | 0 (0.0%) |
| Health Diagnosing & Treating | 0 (0.0%) | 2 (100.0%) |
| Health Technologists | 0 (0.0%) | 1 (100.0%) |
| Total (Category) | 4 (7.1%) | 52 (92.9%) |
| Total (Overall) | 31 (35.2%) | 57 (64.8%) |
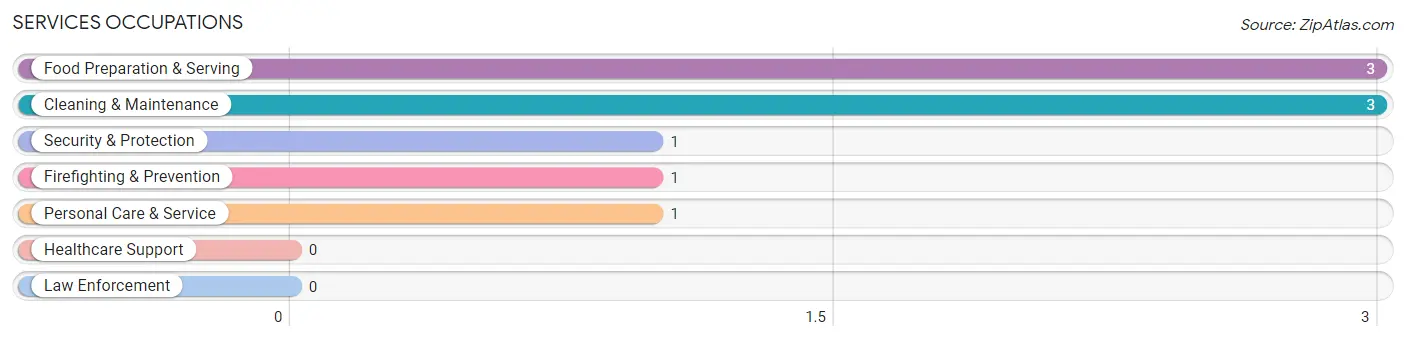
Services Occupations
The most common Services occupations in Tullahassee are Food Preparation & Serving (3 | 3.4%), Cleaning & Maintenance (3 | 3.4%), Security & Protection (1 | 1.1%), Firefighting & Prevention (1 | 1.1%), and Personal Care & Service (1 | 1.1%).
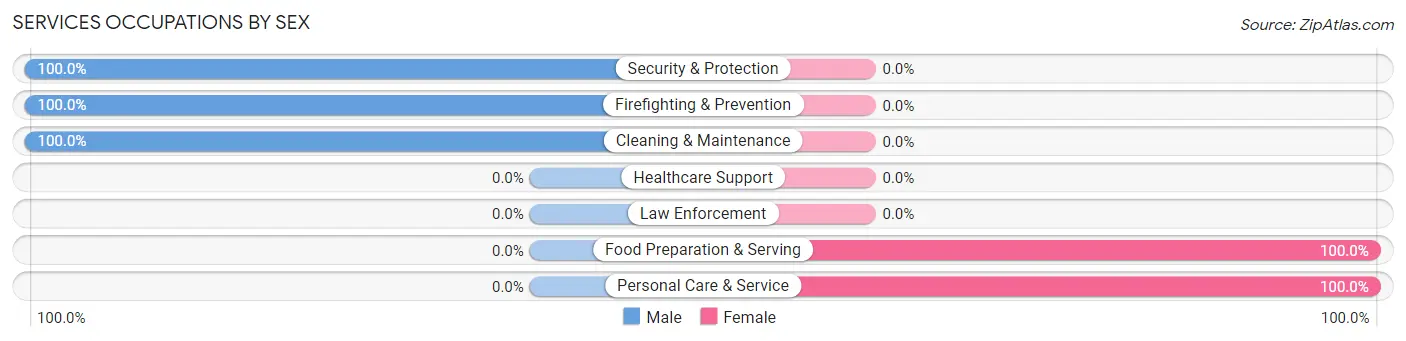
Services Occupations by Sex
Within the Services occupations in Tullahassee, the most male-oriented occupations are Security & Protection (100.0%), Firefighting & Prevention (100.0%), and Cleaning & Maintenance (100.0%), while the most female-oriented occupations are Food Preparation & Serving (100.0%), and Personal Care & Service (100.0%).
| Occupation | Male | Female |
| Healthcare Support | 0 (0.0%) | 0 (0.0%) |
| Security & Protection | 1 (100.0%) | 0 (0.0%) |
| Firefighting & Prevention | 1 (100.0%) | 0 (0.0%) |
| Law Enforcement | 0 (0.0%) | 0 (0.0%) |
| Food Preparation & Serving | 0 (0.0%) | 3 (100.0%) |
| Cleaning & Maintenance | 3 (100.0%) | 0 (0.0%) |
| Personal Care & Service | 0 (0.0%) | 1 (100.0%) |
| Total (Category) | 4 (50.0%) | 4 (50.0%) |
| Total (Overall) | 31 (35.2%) | 57 (64.8%) |
Sales and Office Occupations
Sales and Office Occupations by Sex
| Occupation | Male | Female |
| Sales & Related | 0 (0.0%) | 0 (0.0%) |
| Office & Administration | 0 (0.0%) | 0 (0.0%) |
| Total (Category) | 0 (0.0%) | 0 (0.0%) |
| Total (Overall) | 31 (35.2%) | 57 (64.8%) |
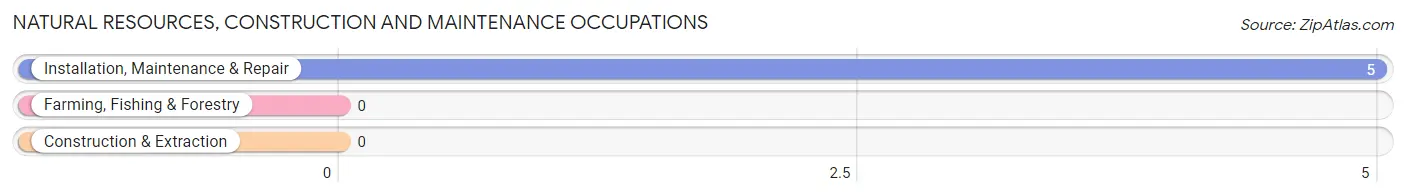
Natural Resources, Construction and Maintenance Occupations
The most common Natural Resources, Construction and Maintenance occupations in Tullahassee are , and Installation, Maintenance & Repair (5 | 5.7%).
Natural Resources, Construction and Maintenance Occupations by Sex
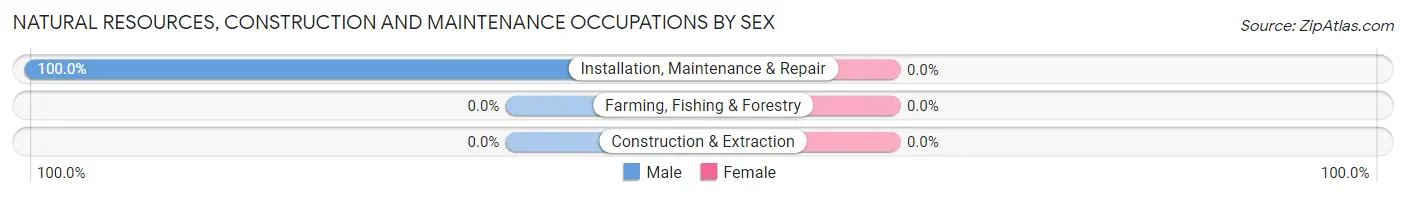
| Occupation | Male | Female |
| Farming, Fishing & Forestry | 0 (0.0%) | 0 (0.0%) |
| Construction & Extraction | 0 (0.0%) | 0 (0.0%) |
| Installation, Maintenance & Repair | 5 (100.0%) | 0 (0.0%) |
| Total (Category) | 5 (100.0%) | 0 (0.0%) |
| Total (Overall) | 31 (35.2%) | 57 (64.8%) |
Production, Transportation and Moving Occupations
The most common Production, Transportation and Moving occupations in Tullahassee are Material Moving (15 | 17.1%), and Production (4 | 4.5%).
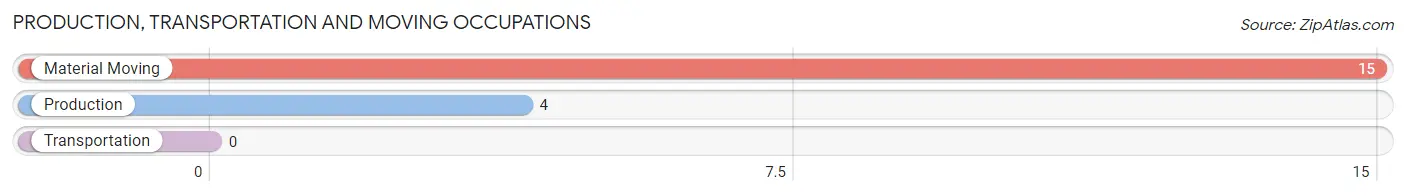
Production, Transportation and Moving Occupations by Sex
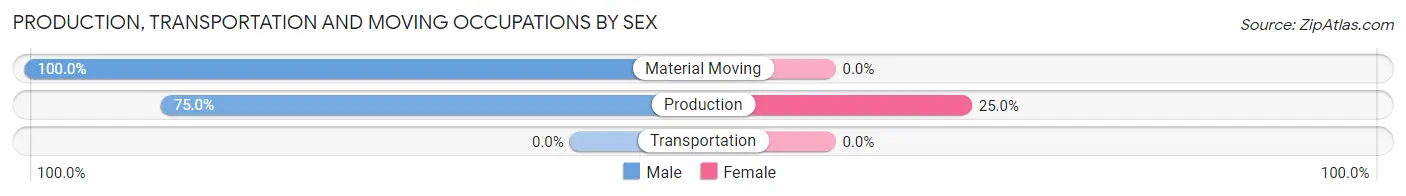
| Occupation | Male | Female |
| Production | 3 (75.0%) | 1 (25.0%) |
| Transportation | 0 (0.0%) | 0 (0.0%) |
| Material Moving | 15 (100.0%) | 0 (0.0%) |
| Total (Category) | 18 (94.7%) | 1 (5.3%) |
| Total (Overall) | 31 (35.2%) | 57 (64.8%) |
Employment Industries by Sex in Tullahassee
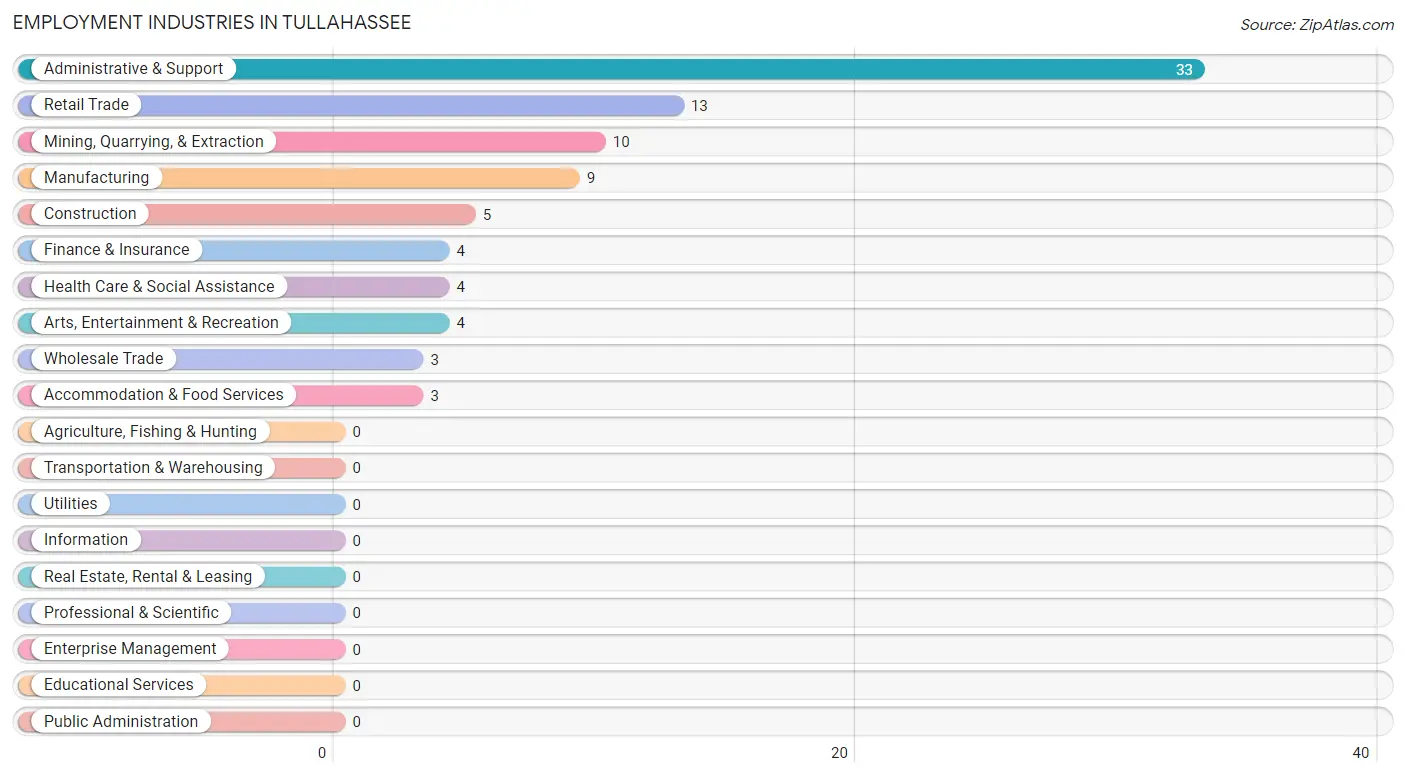
Employment Industries in Tullahassee
The major employment industries in Tullahassee include Administrative & Support (33 | 37.5%), Retail Trade (13 | 14.8%), Mining, Quarrying, & Extraction (10 | 11.4%), Manufacturing (9 | 10.2%), and Construction (5 | 5.7%).
Employment Industries by Sex in Tullahassee
The Tullahassee industries that see more men than women are Mining, Quarrying, & Extraction (100.0%), Construction (100.0%), and Finance & Insurance (100.0%), whereas the industries that tend to have a higher number of women are Wholesale Trade (100.0%), Retail Trade (100.0%), and Administrative & Support (100.0%).
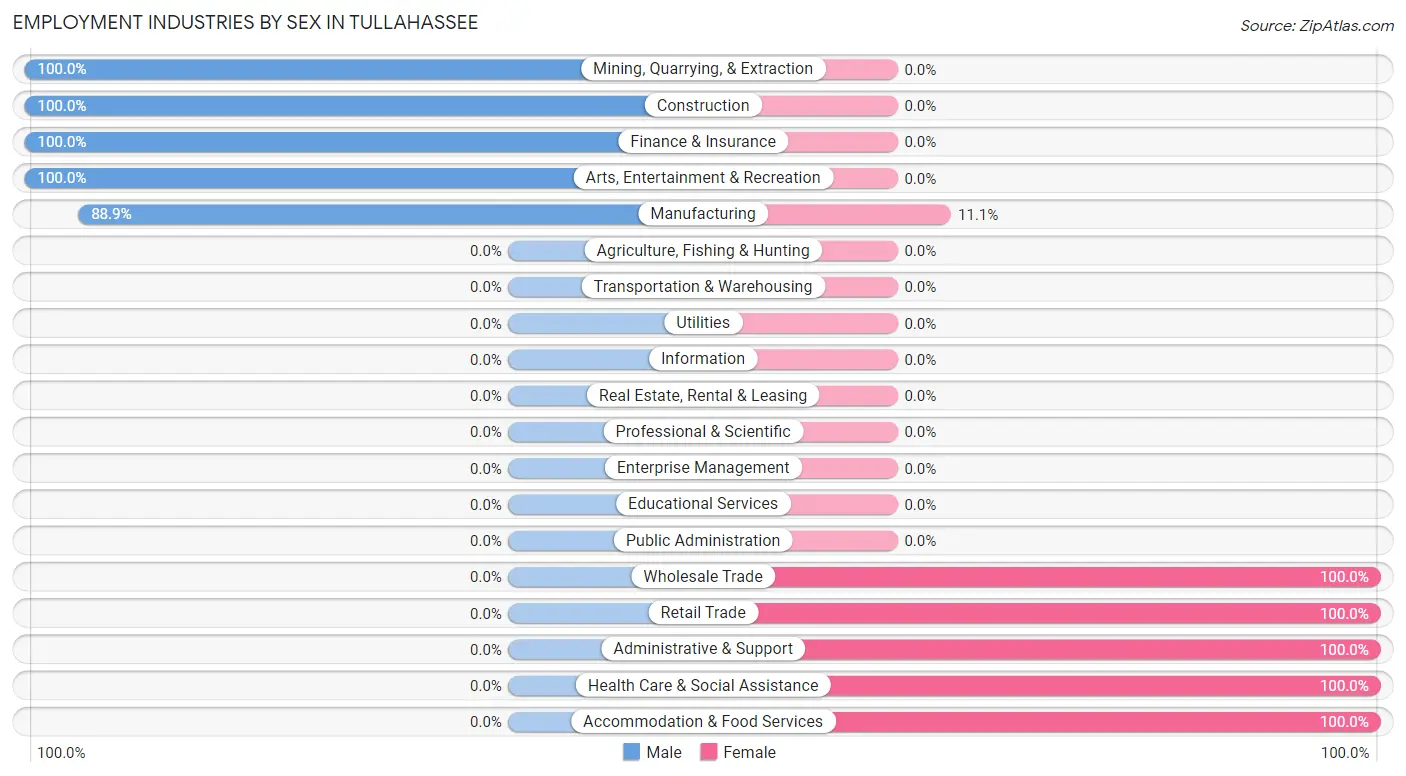
| Industry | Male | Female |
| Agriculture, Fishing & Hunting | 0 (0.0%) | 0 (0.0%) |
| Mining, Quarrying, & Extraction | 10 (100.0%) | 0 (0.0%) |
| Construction | 5 (100.0%) | 0 (0.0%) |
| Manufacturing | 8 (88.9%) | 1 (11.1%) |
| Wholesale Trade | 0 (0.0%) | 3 (100.0%) |
| Retail Trade | 0 (0.0%) | 13 (100.0%) |
| Transportation & Warehousing | 0 (0.0%) | 0 (0.0%) |
| Utilities | 0 (0.0%) | 0 (0.0%) |
| Information | 0 (0.0%) | 0 (0.0%) |
| Finance & Insurance | 4 (100.0%) | 0 (0.0%) |
| Real Estate, Rental & Leasing | 0 (0.0%) | 0 (0.0%) |
| Professional & Scientific | 0 (0.0%) | 0 (0.0%) |
| Enterprise Management | 0 (0.0%) | 0 (0.0%) |
| Administrative & Support | 0 (0.0%) | 33 (100.0%) |
| Educational Services | 0 (0.0%) | 0 (0.0%) |
| Health Care & Social Assistance | 0 (0.0%) | 4 (100.0%) |
| Arts, Entertainment & Recreation | 4 (100.0%) | 0 (0.0%) |
| Accommodation & Food Services | 0 (0.0%) | 3 (100.0%) |
| Public Administration | 0 (0.0%) | 0 (0.0%) |
| Total | 31 (35.2%) | 57 (64.8%) |
Education in Tullahassee
School Enrollment in Tullahassee
The most common levels of schooling among the 6 students in Tullahassee are elementary school (4 | 66.7%), and college / undergraduate (2 | 33.3%).
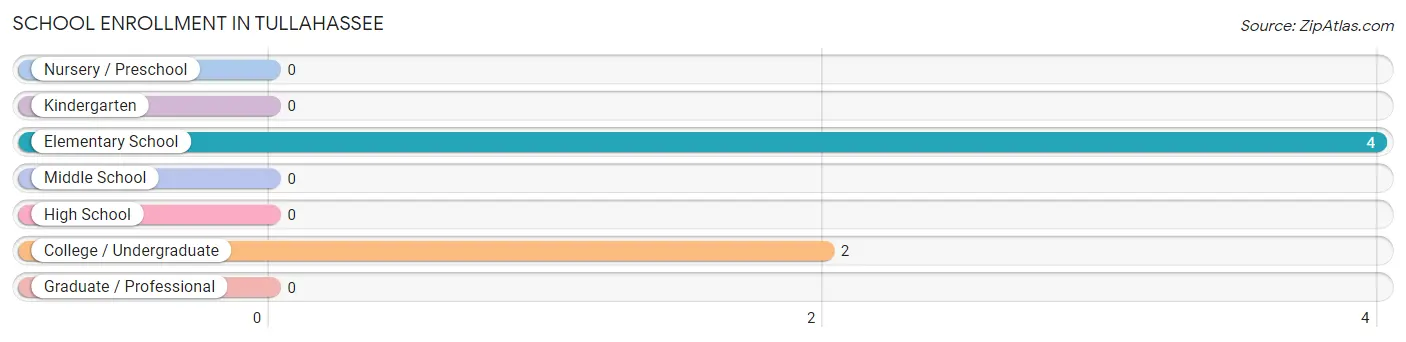
| School Level | # Students | % Students |
| Nursery / Preschool | 0 | 0.0% |
| Kindergarten | 0 | 0.0% |
| Elementary School | 4 | 66.7% |
| Middle School | 0 | 0.0% |
| High School | 0 | 0.0% |
| College / Undergraduate | 2 | 33.3% |
| Graduate / Professional | 0 | 0.0% |
| Total | 6 | 100.0% |
School Enrollment by Age by Funding Source in Tullahassee
Out of a total of 6 students who are enrolled in schools in Tullahassee, 1 (16.7%) attend a private institution, while the remaining 5 (83.3%) are enrolled in public schools. The age group of 5 to 9 year old has the highest likelihood of being enrolled in private schools, with 1 (33.3% in the age bracket) enrolled. Conversely, the age group of 10 to 14 year olds has the lowest likelihood of being enrolled in a private school, with 1 (100.0% in the age bracket) attending a public institution.
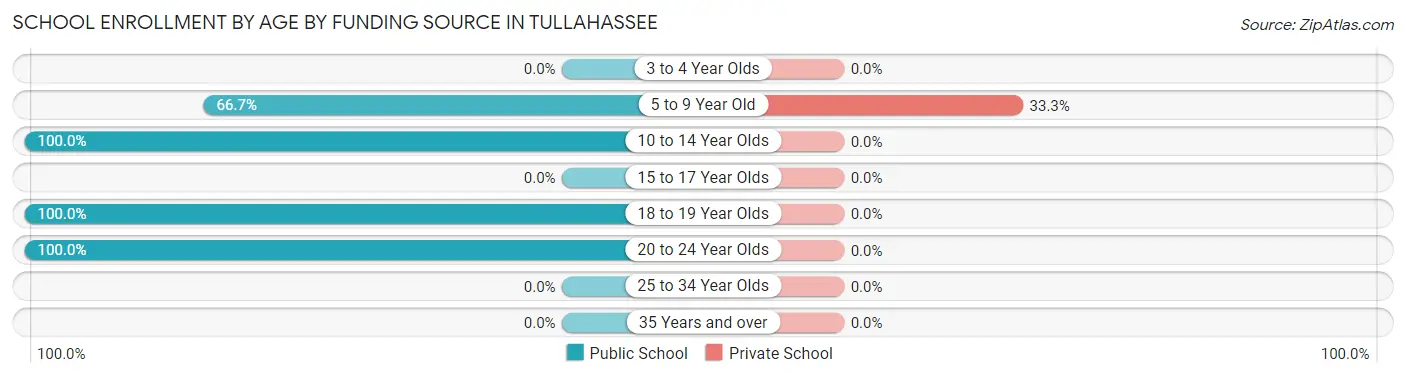
| Age Bracket | Public School | Private School |
| 3 to 4 Year Olds | 0 (0.0%) | 0 (0.0%) |
| 5 to 9 Year Old | 2 (66.7%) | 1 (33.3%) |
| 10 to 14 Year Olds | 1 (100.0%) | 0 (0.0%) |
| 15 to 17 Year Olds | 0 (0.0%) | 0 (0.0%) |
| 18 to 19 Year Olds | 1 (100.0%) | 0 (0.0%) |
| 20 to 24 Year Olds | 1 (100.0%) | 0 (0.0%) |
| 25 to 34 Year Olds | 0 (0.0%) | 0 (0.0%) |
| 35 Years and over | 0 (0.0%) | 0 (0.0%) |
| Total | 5 (83.3%) | 1 (16.7%) |
Educational Attainment by Field of Study in Tullahassee
Science & technology (7 | 63.6%), and arts & humanities (4 | 36.4%) are the most common fields of study among 11 individuals in Tullahassee who have obtained a bachelor's degree or higher.
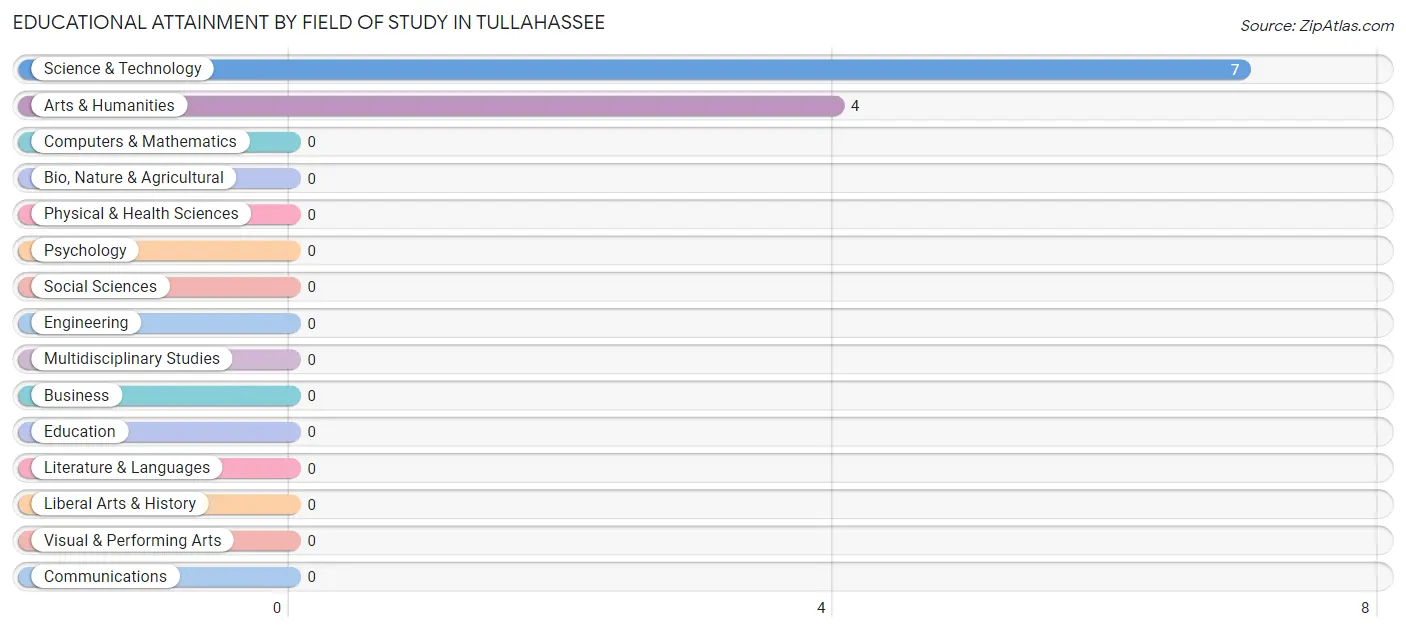
| Field of Study | # Graduates | % Graduates |
| Computers & Mathematics | 0 | 0.0% |
| Bio, Nature & Agricultural | 0 | 0.0% |
| Physical & Health Sciences | 0 | 0.0% |
| Psychology | 0 | 0.0% |
| Social Sciences | 0 | 0.0% |
| Engineering | 0 | 0.0% |
| Multidisciplinary Studies | 0 | 0.0% |
| Science & Technology | 7 | 63.6% |
| Business | 0 | 0.0% |
| Education | 0 | 0.0% |
| Literature & Languages | 0 | 0.0% |
| Liberal Arts & History | 0 | 0.0% |
| Visual & Performing Arts | 0 | 0.0% |
| Communications | 0 | 0.0% |
| Arts & Humanities | 4 | 36.4% |
| Total | 11 | 100.0% |
Transportation & Commute in Tullahassee
Vehicle Availability by Sex in Tullahassee
The most prevalent vehicle ownership categories in Tullahassee are males with 2 vehicles (18, accounting for 58.1%) and females with 2 vehicles (15, making up 31.6%).
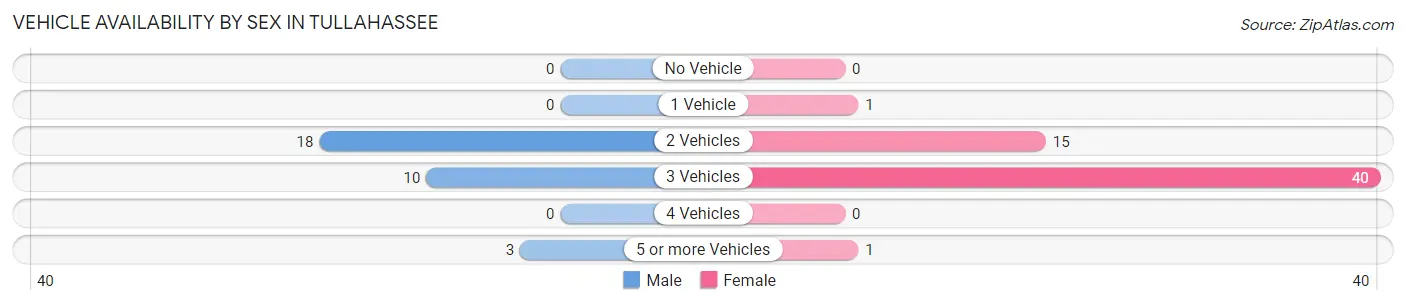
| Vehicles Available | Male | Female |
| No Vehicle | 0 (0.0%) | 0 (0.0%) |
| 1 Vehicle | 0 (0.0%) | 1 (1.8%) |
| 2 Vehicles | 18 (58.1%) | 15 (26.3%) |
| 3 Vehicles | 10 (32.3%) | 40 (70.2%) |
| 4 Vehicles | 0 (0.0%) | 0 (0.0%) |
| 5 or more Vehicles | 3 (9.7%) | 1 (1.8%) |
| Total | 31 (100.0%) | 57 (100.0%) |
Commute Time in Tullahassee
The most frequently occuring commute durations in Tullahassee are 25 to 29 minutes (33 commuters, 37.5%), 20 to 24 minutes (22 commuters, 25.0%), and 45 to 59 minutes (14 commuters, 15.9%).
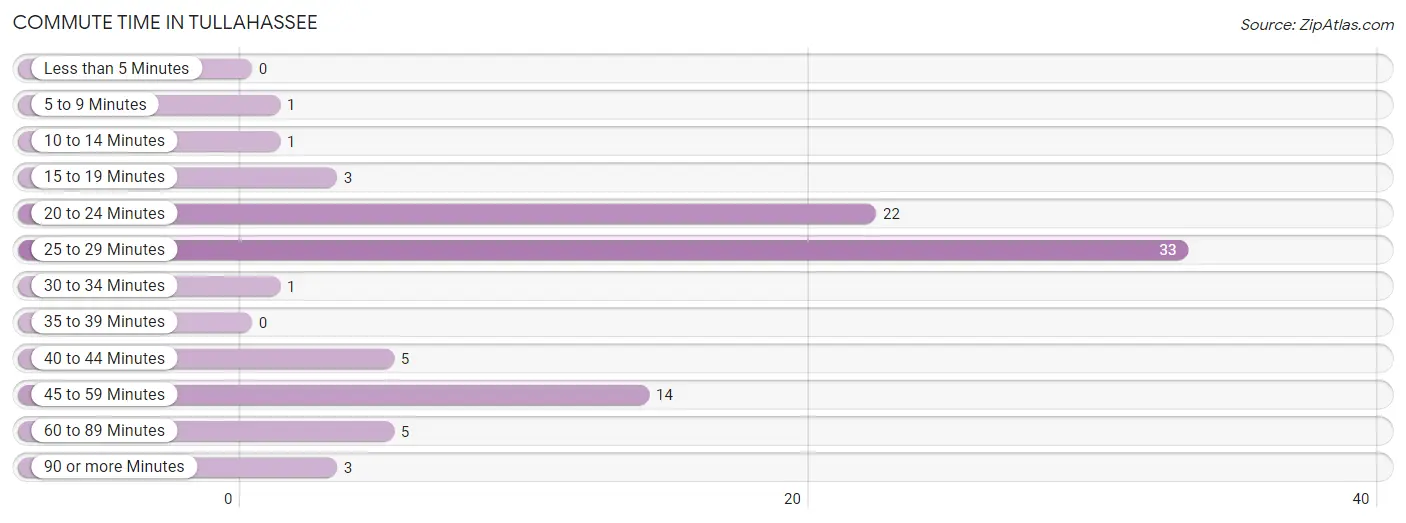
| Commute Time | # Commuters | % Commuters |
| Less than 5 Minutes | 0 | 0.0% |
| 5 to 9 Minutes | 1 | 1.1% |
| 10 to 14 Minutes | 1 | 1.1% |
| 15 to 19 Minutes | 3 | 3.4% |
| 20 to 24 Minutes | 22 | 25.0% |
| 25 to 29 Minutes | 33 | 37.5% |
| 30 to 34 Minutes | 1 | 1.1% |
| 35 to 39 Minutes | 0 | 0.0% |
| 40 to 44 Minutes | 5 | 5.7% |
| 45 to 59 Minutes | 14 | 15.9% |
| 60 to 89 Minutes | 5 | 5.7% |
| 90 or more Minutes | 3 | 3.4% |
Commute Time by Sex in Tullahassee
The most common commute times in Tullahassee are 45 to 59 minutes (14 commuters, 45.2%) for males and 25 to 29 minutes (33 commuters, 57.9%) for females.
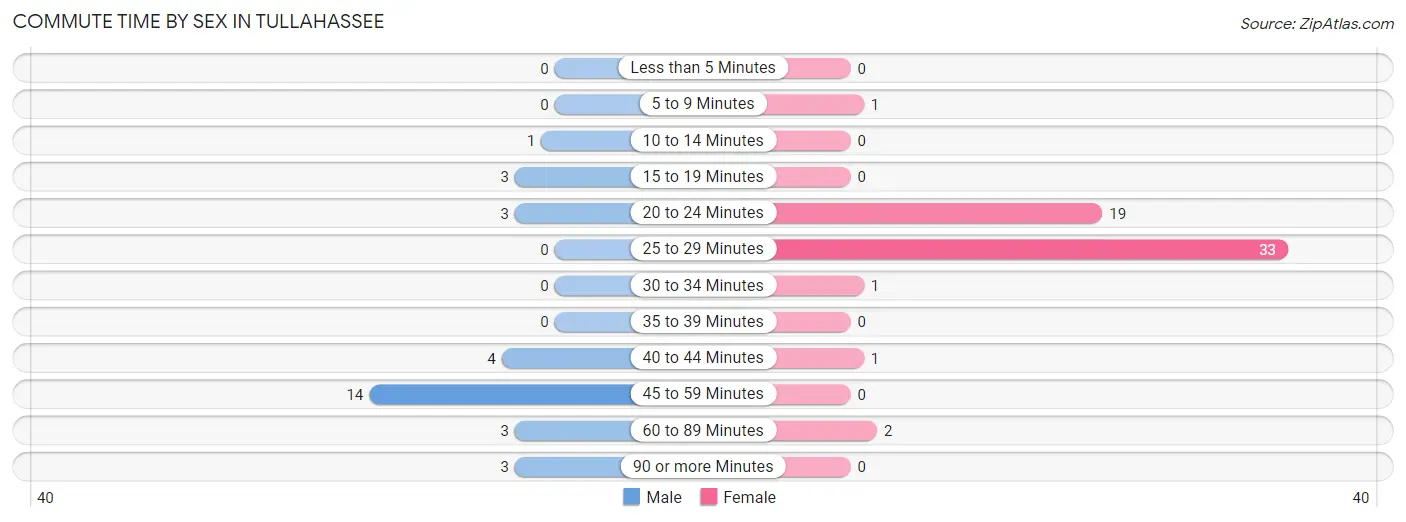
| Commute Time | Male | Female |
| Less than 5 Minutes | 0 (0.0%) | 0 (0.0%) |
| 5 to 9 Minutes | 0 (0.0%) | 1 (1.8%) |
| 10 to 14 Minutes | 1 (3.2%) | 0 (0.0%) |
| 15 to 19 Minutes | 3 (9.7%) | 0 (0.0%) |
| 20 to 24 Minutes | 3 (9.7%) | 19 (33.3%) |
| 25 to 29 Minutes | 0 (0.0%) | 33 (57.9%) |
| 30 to 34 Minutes | 0 (0.0%) | 1 (1.8%) |
| 35 to 39 Minutes | 0 (0.0%) | 0 (0.0%) |
| 40 to 44 Minutes | 4 (12.9%) | 1 (1.8%) |
| 45 to 59 Minutes | 14 (45.2%) | 0 (0.0%) |
| 60 to 89 Minutes | 3 (9.7%) | 2 (3.5%) |
| 90 or more Minutes | 3 (9.7%) | 0 (0.0%) |
Time of Departure to Work by Sex in Tullahassee
The most frequent times of departure to work in Tullahassee are 12:00 AM to 4:59 AM (14, 45.2%) for males and 12:00 AM to 4:59 AM (34, 59.7%) for females.
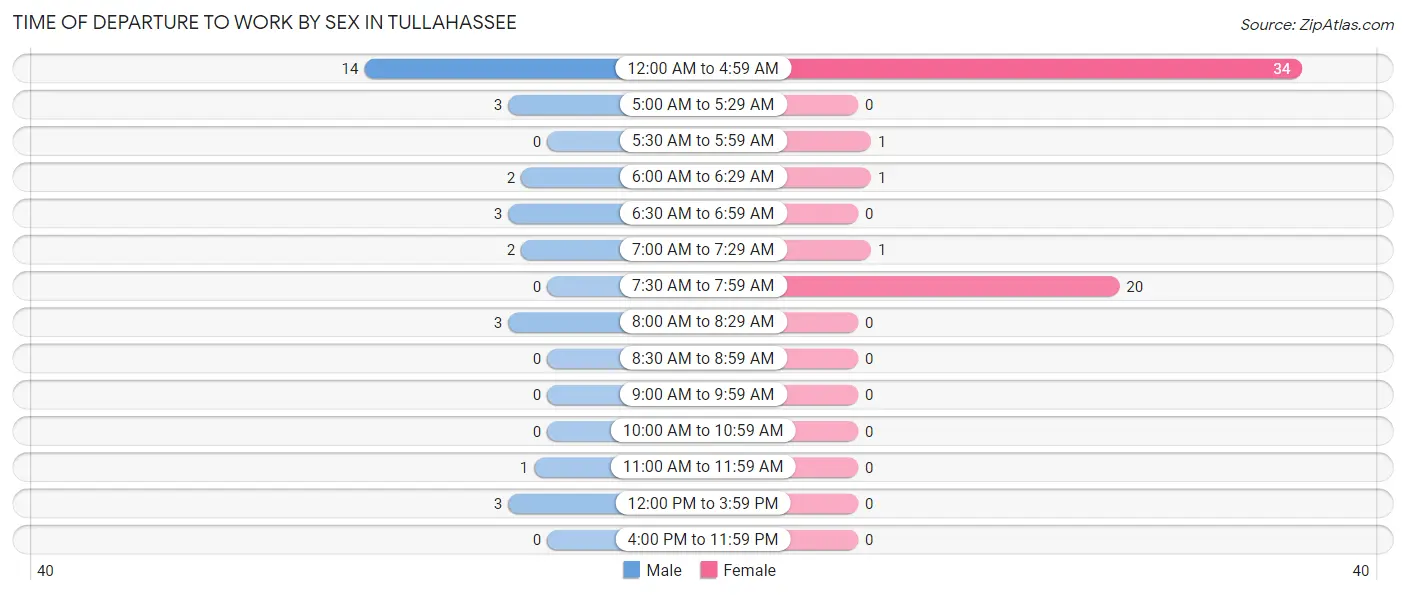
| Time of Departure | Male | Female |
| 12:00 AM to 4:59 AM | 14 (45.2%) | 34 (59.7%) |
| 5:00 AM to 5:29 AM | 3 (9.7%) | 0 (0.0%) |
| 5:30 AM to 5:59 AM | 0 (0.0%) | 1 (1.8%) |
| 6:00 AM to 6:29 AM | 2 (6.5%) | 1 (1.8%) |
| 6:30 AM to 6:59 AM | 3 (9.7%) | 0 (0.0%) |
| 7:00 AM to 7:29 AM | 2 (6.5%) | 1 (1.8%) |
| 7:30 AM to 7:59 AM | 0 (0.0%) | 20 (35.1%) |
| 8:00 AM to 8:29 AM | 3 (9.7%) | 0 (0.0%) |
| 8:30 AM to 8:59 AM | 0 (0.0%) | 0 (0.0%) |
| 9:00 AM to 9:59 AM | 0 (0.0%) | 0 (0.0%) |
| 10:00 AM to 10:59 AM | 0 (0.0%) | 0 (0.0%) |
| 11:00 AM to 11:59 AM | 1 (3.2%) | 0 (0.0%) |
| 12:00 PM to 3:59 PM | 3 (9.7%) | 0 (0.0%) |
| 4:00 PM to 11:59 PM | 0 (0.0%) | 0 (0.0%) |
| Total | 31 (100.0%) | 57 (100.0%) |
Housing Occupancy in Tullahassee
Occupancy by Ownership in Tullahassee
Of the total 60 dwellings in Tullahassee, owner-occupied units account for 20 (33.3%), while renter-occupied units make up 40 (66.7%).
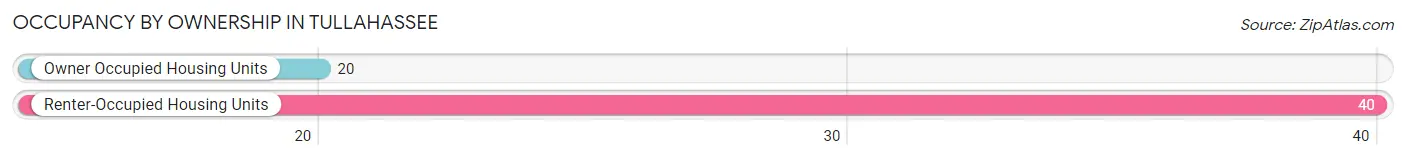
| Occupancy | # Housing Units | % Housing Units |
| Owner Occupied Housing Units | 20 | 33.3% |
| Renter-Occupied Housing Units | 40 | 66.7% |
| Total Occupied Housing Units | 60 | 100.0% |
Occupancy by Household Size in Tullahassee
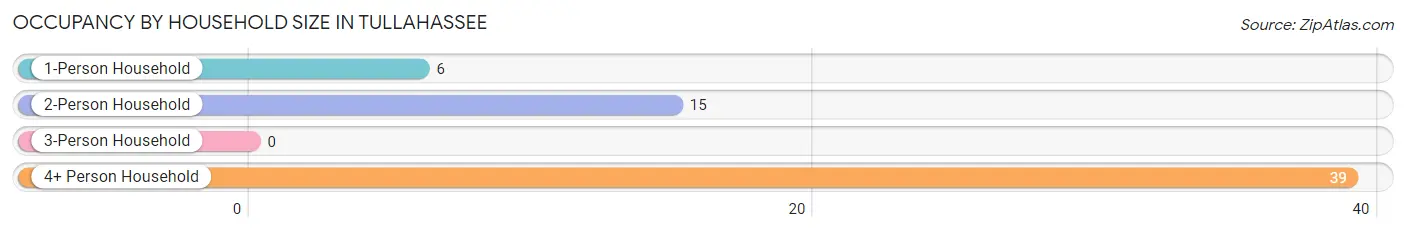
| Household Size | # Housing Units | % Housing Units |
| 1-Person Household | 6 | 10.0% |
| 2-Person Household | 15 | 25.0% |
| 3-Person Household | 0 | 0.0% |
| 4+ Person Household | 39 | 65.0% |
| Total Housing Units | 60 | 100.0% |
Occupancy by Ownership by Household Size in Tullahassee
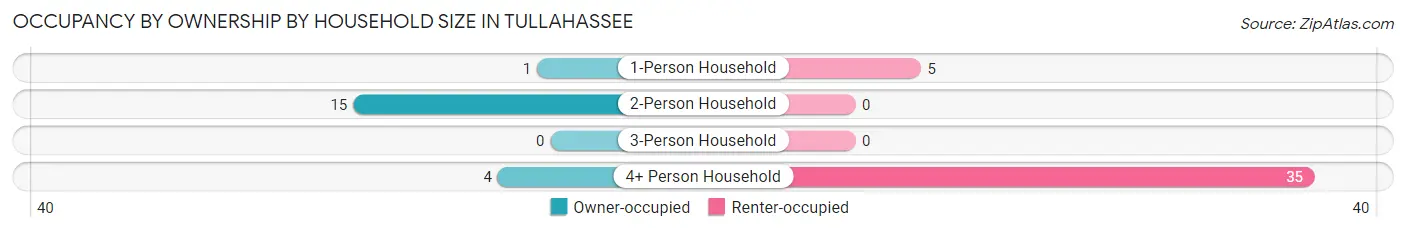
| Household Size | Owner-occupied | Renter-occupied |
| 1-Person Household | 1 (16.7%) | 5 (83.3%) |
| 2-Person Household | 15 (100.0%) | 0 (0.0%) |
| 3-Person Household | 0 (0.0%) | 0 (0.0%) |
| 4+ Person Household | 4 (10.3%) | 35 (89.7%) |
| Total Housing Units | 20 (33.3%) | 40 (66.7%) |
Occupancy by Educational Attainment in Tullahassee
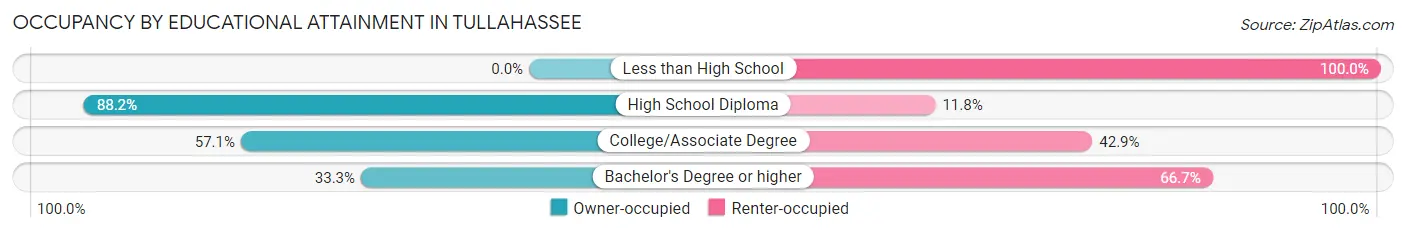
| Household Size | Owner-occupied | Renter-occupied |
| Less than High School | 0 (0.0%) | 33 (100.0%) |
| High School Diploma | 15 (88.2%) | 2 (11.8%) |
| College/Associate Degree | 4 (57.1%) | 3 (42.9%) |
| Bachelor's Degree or higher | 1 (33.3%) | 2 (66.7%) |
Occupancy by Age of Householder in Tullahassee
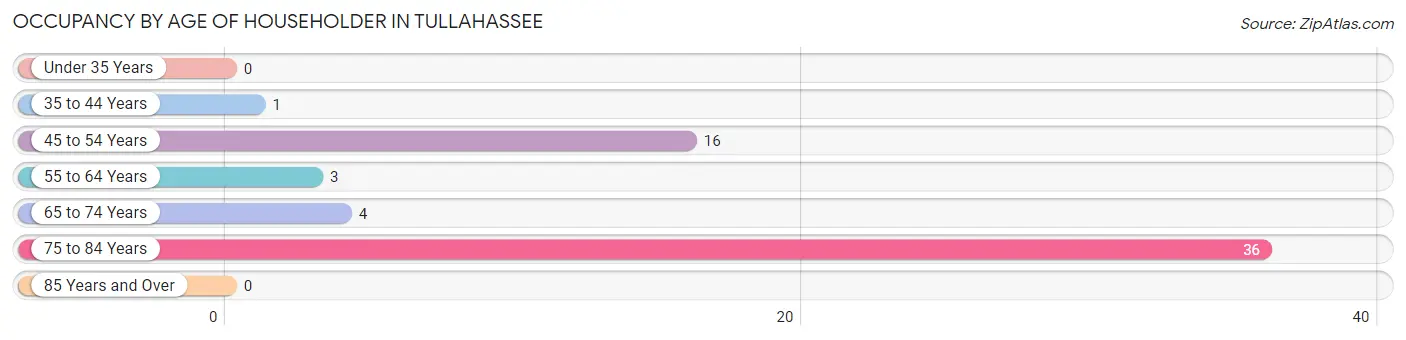
| Age Bracket | # Households | % Households |
| Under 35 Years | 0 | 0.0% |
| 35 to 44 Years | 1 | 1.7% |
| 45 to 54 Years | 16 | 26.7% |
| 55 to 64 Years | 3 | 5.0% |
| 65 to 74 Years | 4 | 6.7% |
| 75 to 84 Years | 36 | 60.0% |
| 85 Years and Over | 0 | 0.0% |
| Total | 60 | 100.0% |
Housing Finances in Tullahassee
Median Income by Occupancy in Tullahassee
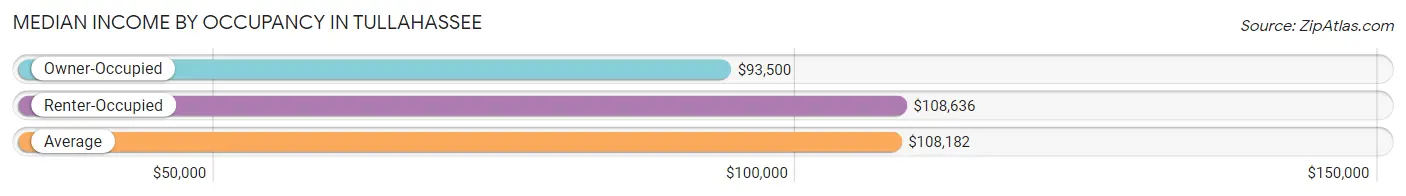
| Occupancy Type | # Households | Median Income |
| Owner-Occupied | 20 (33.3%) | $93,500 |
| Renter-Occupied | 40 (66.7%) | $108,636 |
| Average | 60 (100.0%) | $108,182 |
Occupancy by Householder Income Bracket in Tullahassee
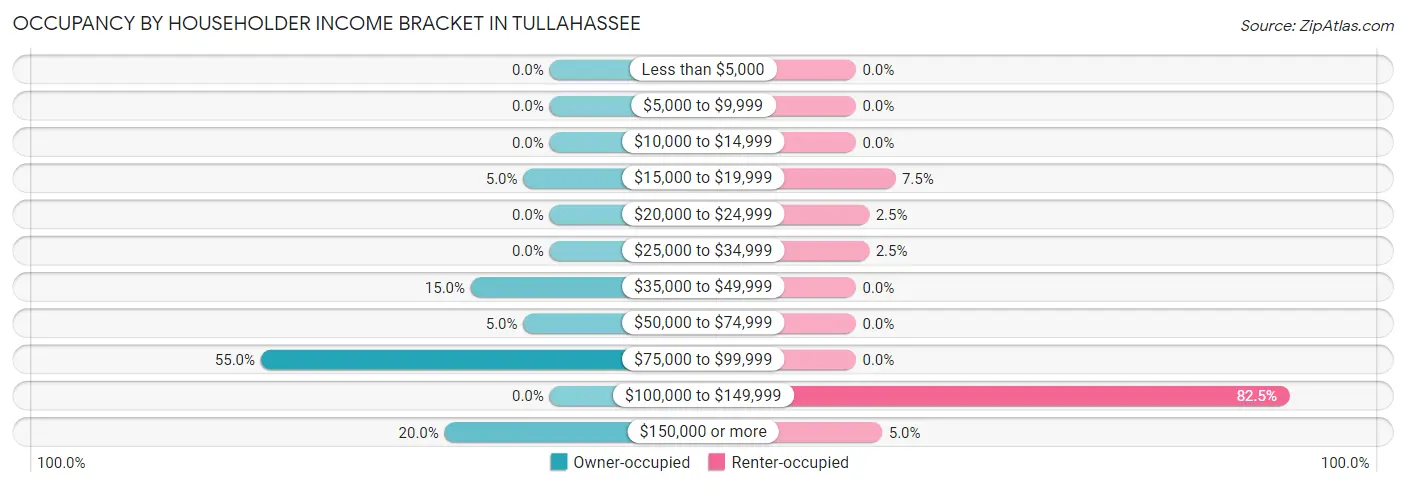
| Income Bracket | Owner-occupied | Renter-occupied |
| Less than $5,000 | 0 (0.0%) | 0 (0.0%) |
| $5,000 to $9,999 | 0 (0.0%) | 0 (0.0%) |
| $10,000 to $14,999 | 0 (0.0%) | 0 (0.0%) |
| $15,000 to $19,999 | 1 (5.0%) | 3 (7.5%) |
| $20,000 to $24,999 | 0 (0.0%) | 1 (2.5%) |
| $25,000 to $34,999 | 0 (0.0%) | 1 (2.5%) |
| $35,000 to $49,999 | 3 (15.0%) | 0 (0.0%) |
| $50,000 to $74,999 | 1 (5.0%) | 0 (0.0%) |
| $75,000 to $99,999 | 11 (55.0%) | 0 (0.0%) |
| $100,000 to $149,999 | 0 (0.0%) | 33 (82.5%) |
| $150,000 or more | 4 (20.0%) | 2 (5.0%) |
| Total | 20 (100.0%) | 40 (100.0%) |
Monthly Housing Cost Tiers in Tullahassee
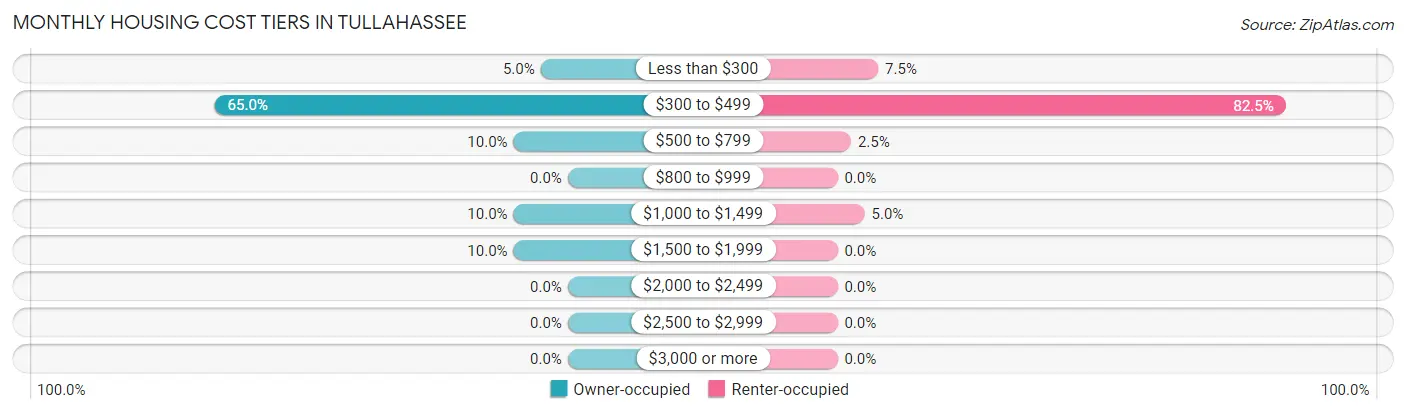
| Monthly Cost | Owner-occupied | Renter-occupied |
| Less than $300 | 1 (5.0%) | 3 (7.5%) |
| $300 to $499 | 13 (65.0%) | 33 (82.5%) |
| $500 to $799 | 2 (10.0%) | 1 (2.5%) |
| $800 to $999 | 0 (0.0%) | 0 (0.0%) |
| $1,000 to $1,499 | 2 (10.0%) | 2 (5.0%) |
| $1,500 to $1,999 | 2 (10.0%) | 0 (0.0%) |
| $2,000 to $2,499 | 0 (0.0%) | 0 (0.0%) |
| $2,500 to $2,999 | 0 (0.0%) | 0 (0.0%) |
| $3,000 or more | 0 (0.0%) | 0 (0.0%) |
| Total | 20 (100.0%) | 40 (100.0%) |
Physical Housing Characteristics in Tullahassee
Housing Structures in Tullahassee
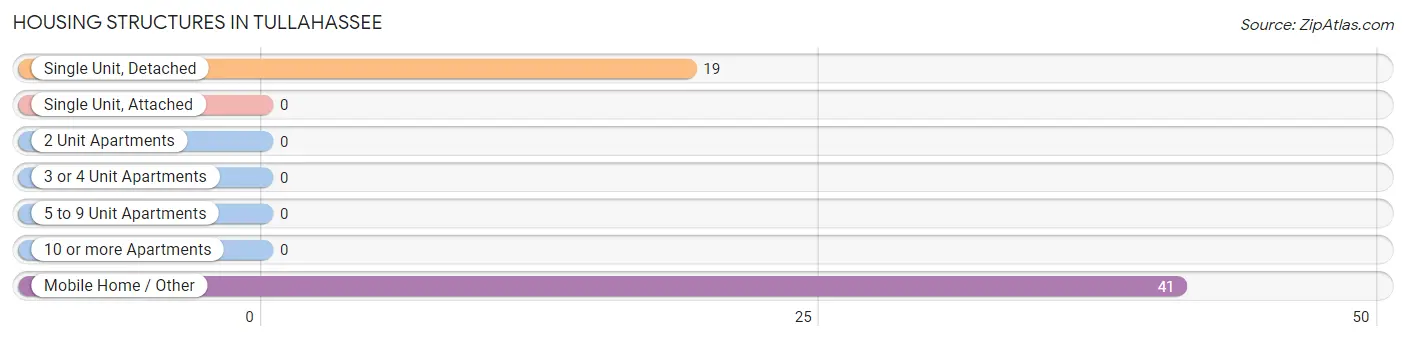
| Structure Type | # Housing Units | % Housing Units |
| Single Unit, Detached | 19 | 31.7% |
| Single Unit, Attached | 0 | 0.0% |
| 2 Unit Apartments | 0 | 0.0% |
| 3 or 4 Unit Apartments | 0 | 0.0% |
| 5 to 9 Unit Apartments | 0 | 0.0% |
| 10 or more Apartments | 0 | 0.0% |
| Mobile Home / Other | 41 | 68.3% |
| Total | 60 | 100.0% |
Housing Structures by Occupancy in Tullahassee
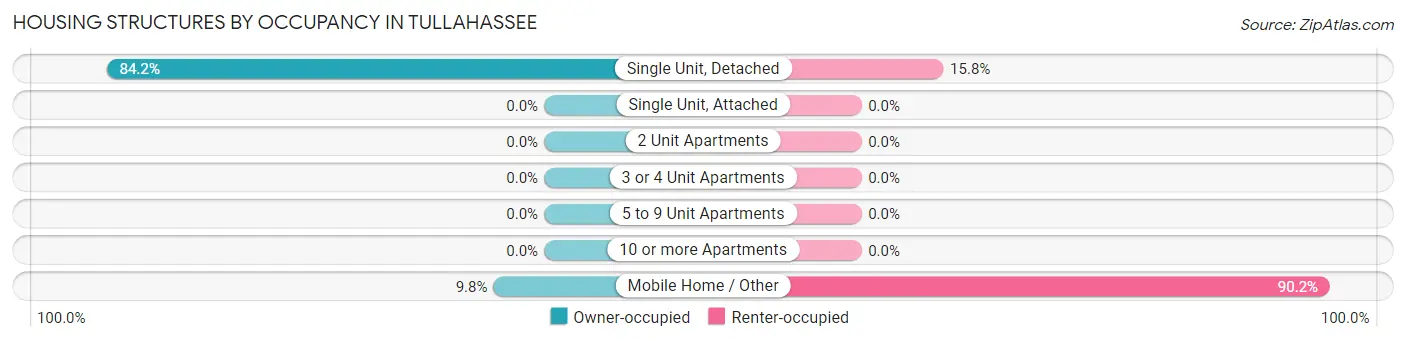
| Structure Type | Owner-occupied | Renter-occupied |
| Single Unit, Detached | 16 (84.2%) | 3 (15.8%) |
| Single Unit, Attached | 0 (0.0%) | 0 (0.0%) |
| 2 Unit Apartments | 0 (0.0%) | 0 (0.0%) |
| 3 or 4 Unit Apartments | 0 (0.0%) | 0 (0.0%) |
| 5 to 9 Unit Apartments | 0 (0.0%) | 0 (0.0%) |
| 10 or more Apartments | 0 (0.0%) | 0 (0.0%) |
| Mobile Home / Other | 4 (9.8%) | 37 (90.2%) |
| Total | 20 (33.3%) | 40 (66.7%) |
Housing Structures by Number of Rooms in Tullahassee
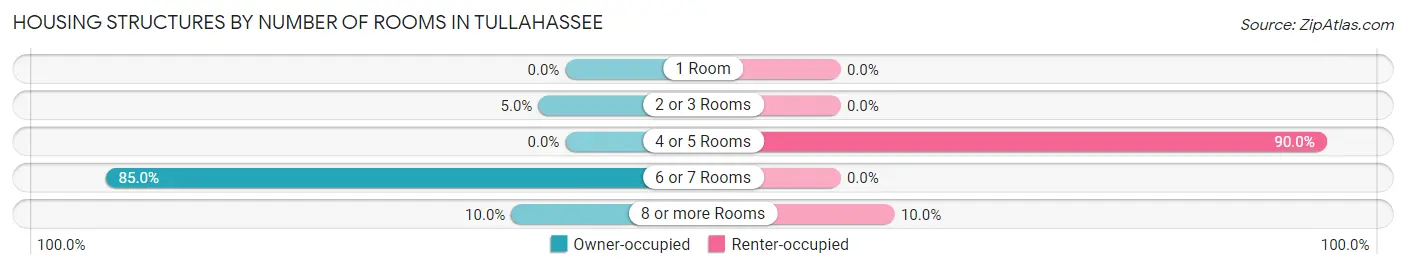
| Number of Rooms | Owner-occupied | Renter-occupied |
| 1 Room | 0 (0.0%) | 0 (0.0%) |
| 2 or 3 Rooms | 1 (5.0%) | 0 (0.0%) |
| 4 or 5 Rooms | 0 (0.0%) | 36 (90.0%) |
| 6 or 7 Rooms | 17 (85.0%) | 0 (0.0%) |
| 8 or more Rooms | 2 (10.0%) | 4 (10.0%) |
| Total | 20 (100.0%) | 40 (100.0%) |
Housing Structure by Heating Type in Tullahassee
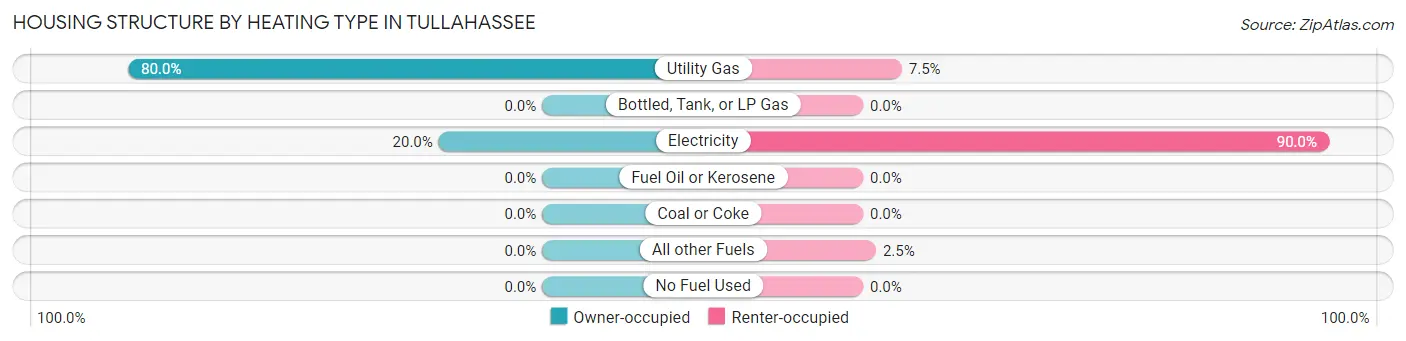
| Heating Type | Owner-occupied | Renter-occupied |
| Utility Gas | 16 (80.0%) | 3 (7.5%) |
| Bottled, Tank, or LP Gas | 0 (0.0%) | 0 (0.0%) |
| Electricity | 4 (20.0%) | 36 (90.0%) |
| Fuel Oil or Kerosene | 0 (0.0%) | 0 (0.0%) |
| Coal or Coke | 0 (0.0%) | 0 (0.0%) |
| All other Fuels | 0 (0.0%) | 1 (2.5%) |
| No Fuel Used | 0 (0.0%) | 0 (0.0%) |
| Total | 20 (100.0%) | 40 (100.0%) |
Household Vehicle Usage in Tullahassee
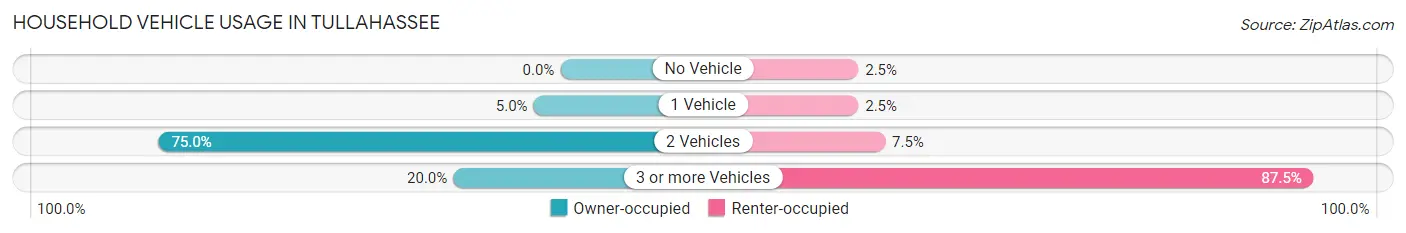
| Vehicles per Household | Owner-occupied | Renter-occupied |
| No Vehicle | 0 (0.0%) | 1 (2.5%) |
| 1 Vehicle | 1 (5.0%) | 1 (2.5%) |
| 2 Vehicles | 15 (75.0%) | 3 (7.5%) |
| 3 or more Vehicles | 4 (20.0%) | 35 (87.5%) |
| Total | 20 (100.0%) | 40 (100.0%) |
Real Estate & Mortgages in Tullahassee
Real Estate and Mortgage Overview in Tullahassee
| Characteristic | Without Mortgage | With Mortgage |
| Housing Units | 18 | 2 |
| Median Property Value | $215,000 | $0 |
| Median Household Income | $93,750 | $0 |
| Monthly Housing Costs | $340 | $0 |
| Real Estate Taxes | $199 | $0 |
Property Value by Mortgage Status in Tullahassee
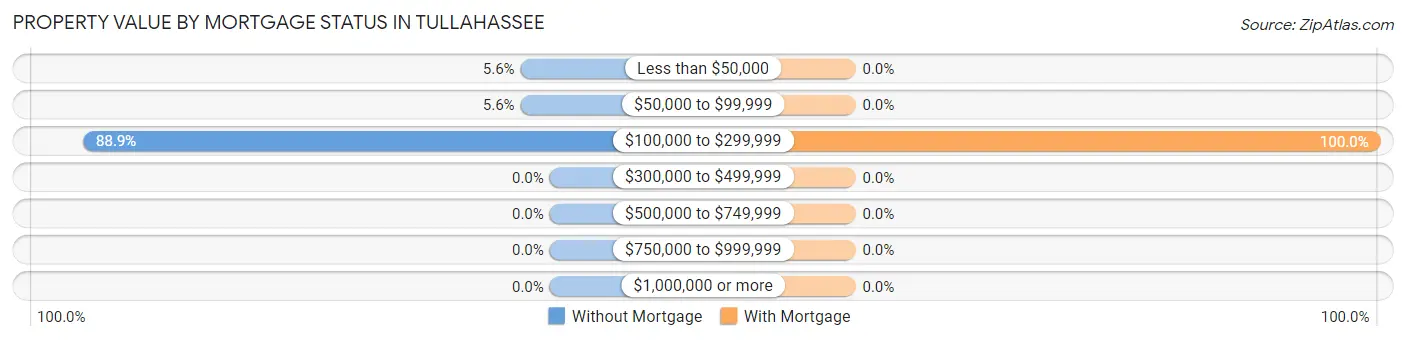
| Property Value | Without Mortgage | With Mortgage |
| Less than $50,000 | 1 (5.6%) | 0 (0.0%) |
| $50,000 to $99,999 | 1 (5.6%) | 0 (0.0%) |
| $100,000 to $299,999 | 16 (88.9%) | 2 (100.0%) |
| $300,000 to $499,999 | 0 (0.0%) | 0 (0.0%) |
| $500,000 to $749,999 | 0 (0.0%) | 0 (0.0%) |
| $750,000 to $999,999 | 0 (0.0%) | 0 (0.0%) |
| $1,000,000 or more | 0 (0.0%) | 0 (0.0%) |
| Total | 18 (100.0%) | 2 (100.0%) |
Household Income by Mortgage Status in Tullahassee
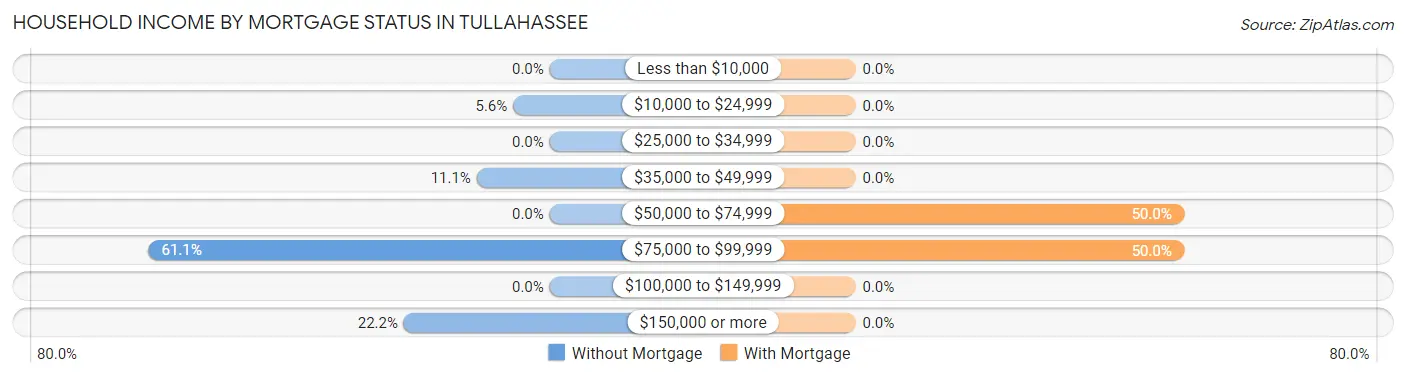
| Household Income | Without Mortgage | With Mortgage |
| Less than $10,000 | 0 (0.0%) | 0 (0.0%) |
| $10,000 to $24,999 | 1 (5.6%) | 0 (0.0%) |
| $25,000 to $34,999 | 0 (0.0%) | 0 (0.0%) |
| $35,000 to $49,999 | 2 (11.1%) | 0 (0.0%) |
| $50,000 to $74,999 | 0 (0.0%) | 1 (50.0%) |
| $75,000 to $99,999 | 11 (61.1%) | 1 (50.0%) |
| $100,000 to $149,999 | 0 (0.0%) | 0 (0.0%) |
| $150,000 or more | 4 (22.2%) | 0 (0.0%) |
| Total | 18 (100.0%) | 2 (100.0%) |
Property Value to Household Income Ratio in Tullahassee
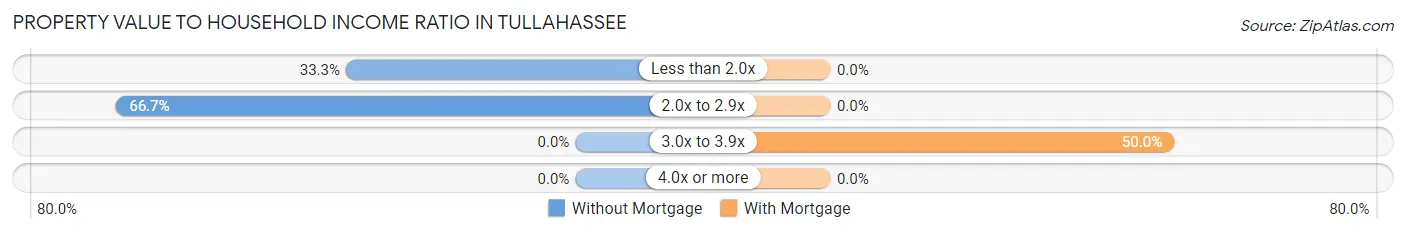
| Value-to-Income Ratio | Without Mortgage | With Mortgage |
| Less than 2.0x | 6 (33.3%) | 0 (0.0%) |
| 2.0x to 2.9x | 12 (66.7%) | 0 (0.0%) |
| 3.0x to 3.9x | 0 (0.0%) | 1 (50.0%) |
| 4.0x or more | 0 (0.0%) | 0 (0.0%) |
| Total | 18 (100.0%) | 2 (100.0%) |
Real Estate Taxes by Mortgage Status in Tullahassee
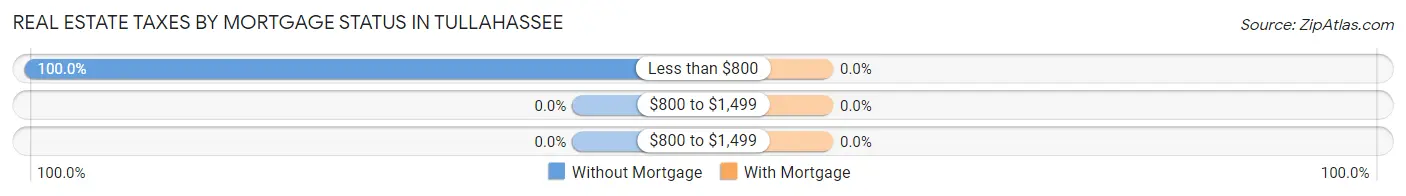
| Property Taxes | Without Mortgage | With Mortgage |
| Less than $800 | 18 (100.0%) | 0 (0.0%) |
| $800 to $1,499 | 0 (0.0%) | 0 (0.0%) |
| $800 to $1,499 | 0 (0.0%) | 0 (0.0%) |
| Total | 18 (100.0%) | 2 (100.0%) |
Health & Disability in Tullahassee
Health Insurance Coverage by Age in Tullahassee
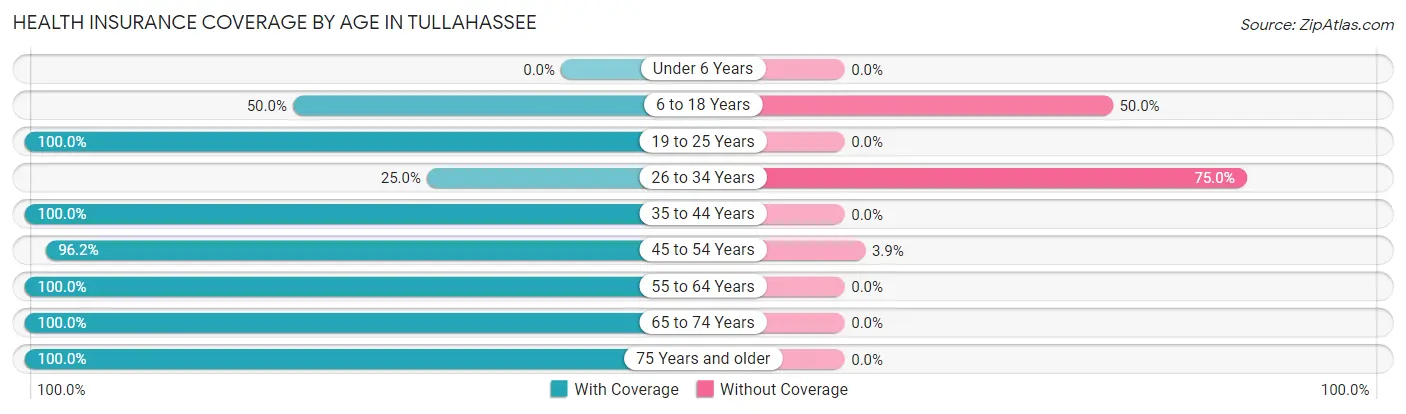
| Age Bracket | With Coverage | Without Coverage |
| Under 6 Years | 0 (0.0%) | 0 (0.0%) |
| 6 to 18 Years | 2 (50.0%) | 2 (50.0%) |
| 19 to 25 Years | 4 (100.0%) | 0 (0.0%) |
| 26 to 34 Years | 2 (25.0%) | 6 (75.0%) |
| 35 to 44 Years | 17 (100.0%) | 0 (0.0%) |
| 45 to 54 Years | 25 (96.2%) | 1 (3.8%) |
| 55 to 64 Years | 13 (100.0%) | 0 (0.0%) |
| 65 to 74 Years | 9 (100.0%) | 0 (0.0%) |
| 75 Years and older | 40 (100.0%) | 0 (0.0%) |
| Total | 112 (92.6%) | 9 (7.4%) |
Health Insurance Coverage by Citizenship Status in Tullahassee
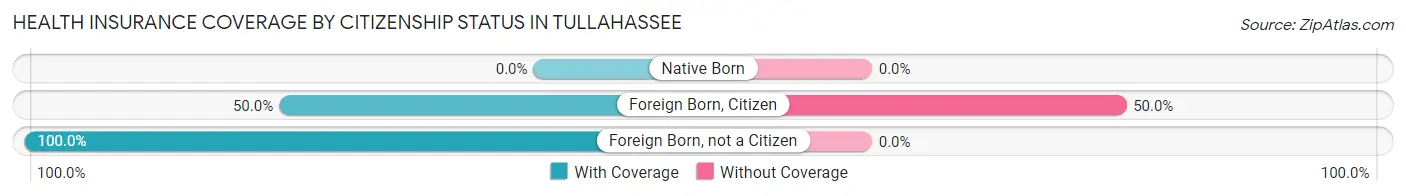
| Citizenship Status | With Coverage | Without Coverage |
| Native Born | 0 (0.0%) | 0 (0.0%) |
| Foreign Born, Citizen | 2 (50.0%) | 2 (50.0%) |
| Foreign Born, not a Citizen | 4 (100.0%) | 0 (0.0%) |
Health Insurance Coverage by Household Income in Tullahassee
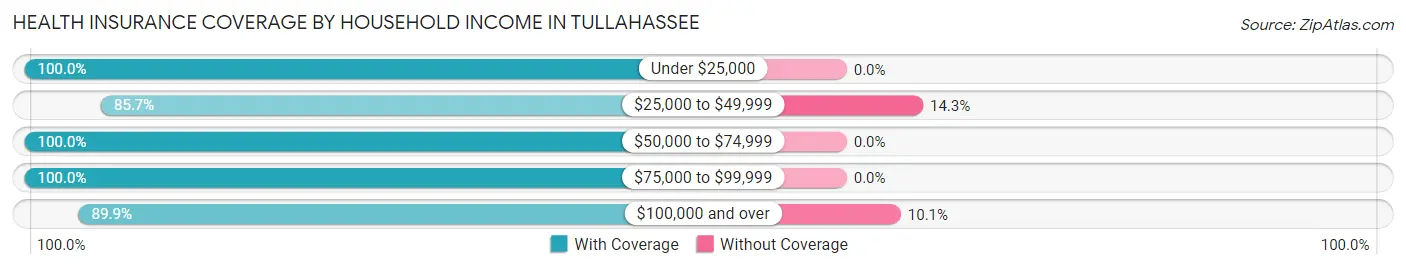
| Household Income | With Coverage | Without Coverage |
| Under $25,000 | 5 (100.0%) | 0 (0.0%) |
| $25,000 to $49,999 | 6 (85.7%) | 1 (14.3%) |
| $50,000 to $74,999 | 3 (100.0%) | 0 (0.0%) |
| $75,000 to $99,999 | 27 (100.0%) | 0 (0.0%) |
| $100,000 and over | 71 (89.9%) | 8 (10.1%) |
Public vs Private Health Insurance Coverage by Age in Tullahassee
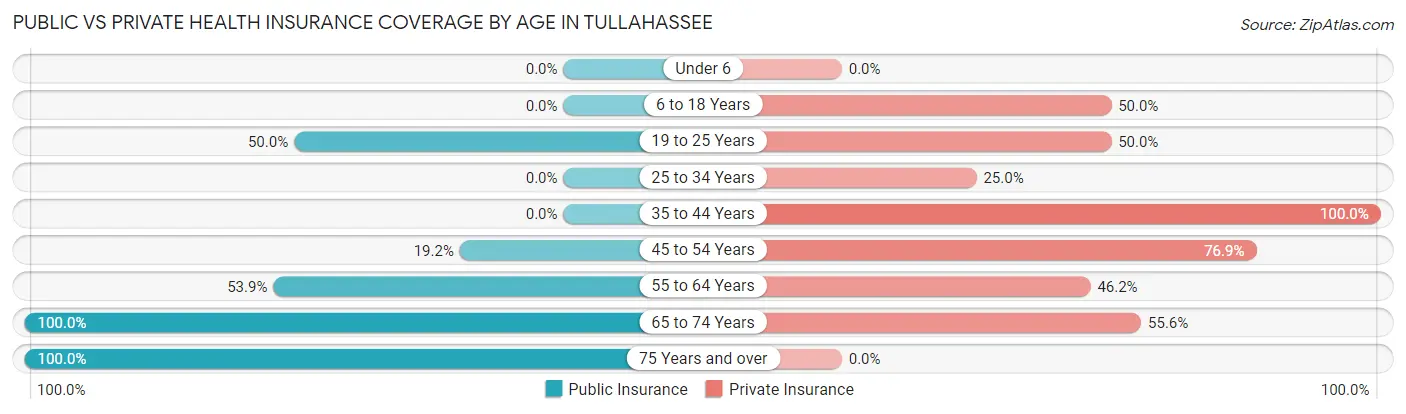
| Age Bracket | Public Insurance | Private Insurance |
| Under 6 | 0 (0.0%) | 0 (0.0%) |
| 6 to 18 Years | 0 (0.0%) | 2 (50.0%) |
| 19 to 25 Years | 2 (50.0%) | 2 (50.0%) |
| 25 to 34 Years | 0 (0.0%) | 2 (25.0%) |
| 35 to 44 Years | 0 (0.0%) | 17 (100.0%) |
| 45 to 54 Years | 5 (19.2%) | 20 (76.9%) |
| 55 to 64 Years | 7 (53.8%) | 6 (46.2%) |
| 65 to 74 Years | 9 (100.0%) | 5 (55.6%) |
| 75 Years and over | 40 (100.0%) | 0 (0.0%) |
| Total | 63 (52.1%) | 54 (44.6%) |
Disability Status by Sex by Age in Tullahassee
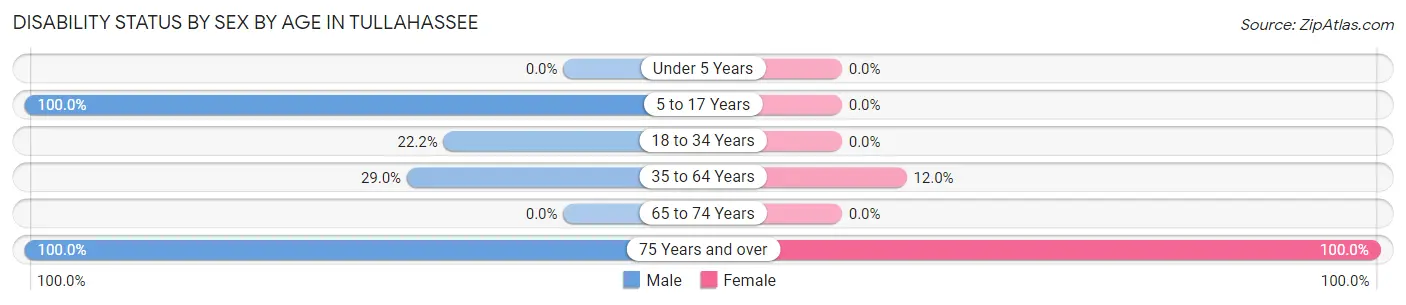
| Age Bracket | Male | Female |
| Under 5 Years | 0 (0.0%) | 0 (0.0%) |
| 5 to 17 Years | 2 (100.0%) | 0 (0.0%) |
| 18 to 34 Years | 2 (22.2%) | 0 (0.0%) |
| 35 to 64 Years | 9 (29.0%) | 3 (12.0%) |
| 65 to 74 Years | 0 (0.0%) | 0 (0.0%) |
| 75 Years and over | 6 (100.0%) | 34 (100.0%) |
Disability Class by Sex by Age in Tullahassee
Disability Class: Hearing Difficulty
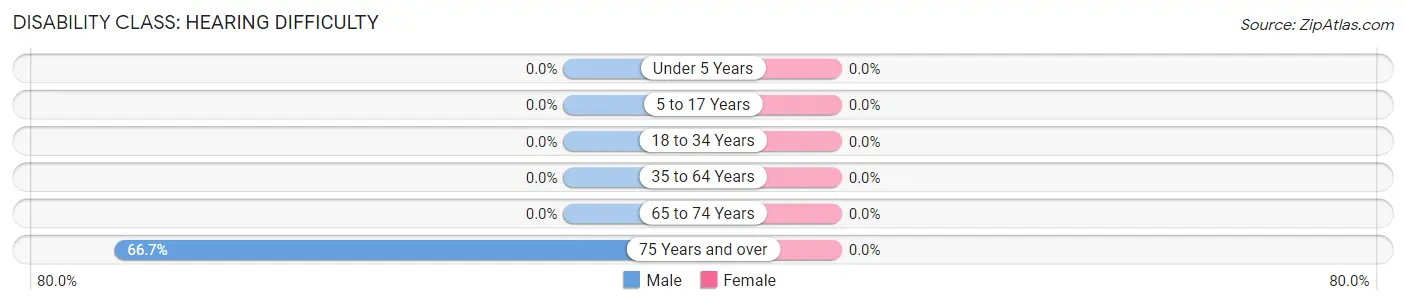
| Age Bracket | Male | Female |
| Under 5 Years | 0 (0.0%) | 0 (0.0%) |
| 5 to 17 Years | 0 (0.0%) | 0 (0.0%) |
| 18 to 34 Years | 0 (0.0%) | 0 (0.0%) |
| 35 to 64 Years | 0 (0.0%) | 0 (0.0%) |
| 65 to 74 Years | 0 (0.0%) | 0 (0.0%) |
| 75 Years and over | 4 (66.7%) | 0 (0.0%) |
Disability Class: Vision Difficulty
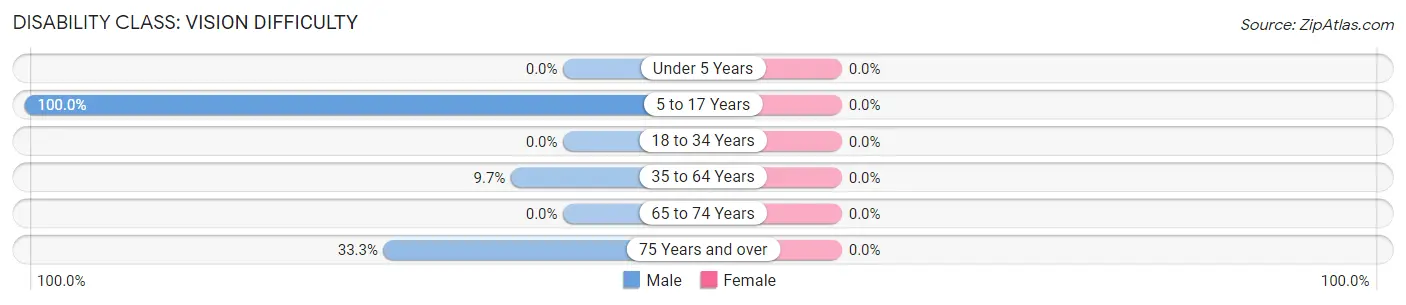
| Age Bracket | Male | Female |
| Under 5 Years | 0 (0.0%) | 0 (0.0%) |
| 5 to 17 Years | 2 (100.0%) | 0 (0.0%) |
| 18 to 34 Years | 0 (0.0%) | 0 (0.0%) |
| 35 to 64 Years | 3 (9.7%) | 0 (0.0%) |
| 65 to 74 Years | 0 (0.0%) | 0 (0.0%) |
| 75 Years and over | 2 (33.3%) | 0 (0.0%) |
Disability Class: Cognitive Difficulty
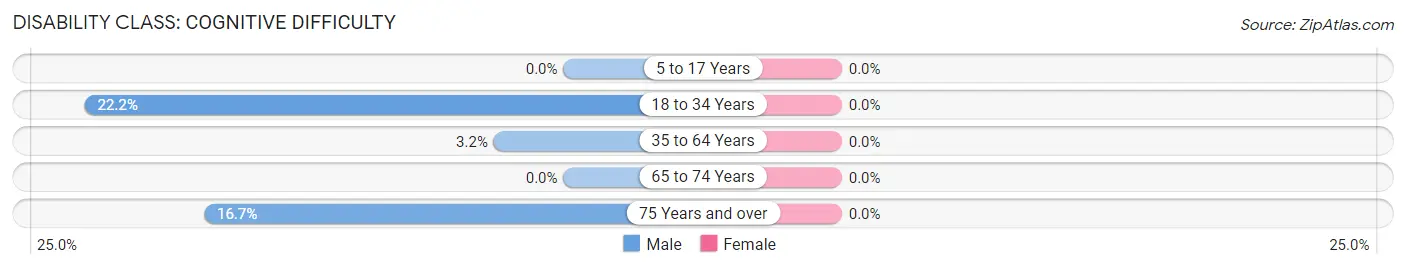
| Age Bracket | Male | Female |
| 5 to 17 Years | 0 (0.0%) | 0 (0.0%) |
| 18 to 34 Years | 2 (22.2%) | 0 (0.0%) |
| 35 to 64 Years | 1 (3.2%) | 0 (0.0%) |
| 65 to 74 Years | 0 (0.0%) | 0 (0.0%) |
| 75 Years and over | 1 (16.7%) | 0 (0.0%) |
Disability Class: Ambulatory Difficulty
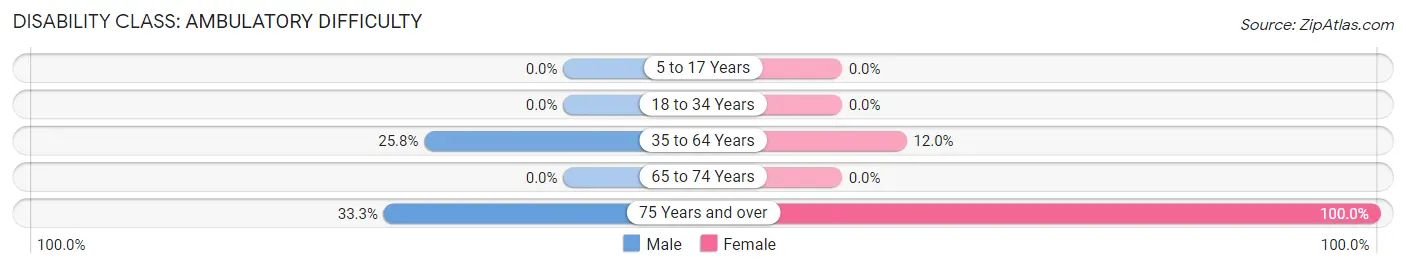
| Age Bracket | Male | Female |
| 5 to 17 Years | 0 (0.0%) | 0 (0.0%) |
| 18 to 34 Years | 0 (0.0%) | 0 (0.0%) |
| 35 to 64 Years | 8 (25.8%) | 3 (12.0%) |
| 65 to 74 Years | 0 (0.0%) | 0 (0.0%) |
| 75 Years and over | 2 (33.3%) | 34 (100.0%) |
Disability Class: Self-Care Difficulty
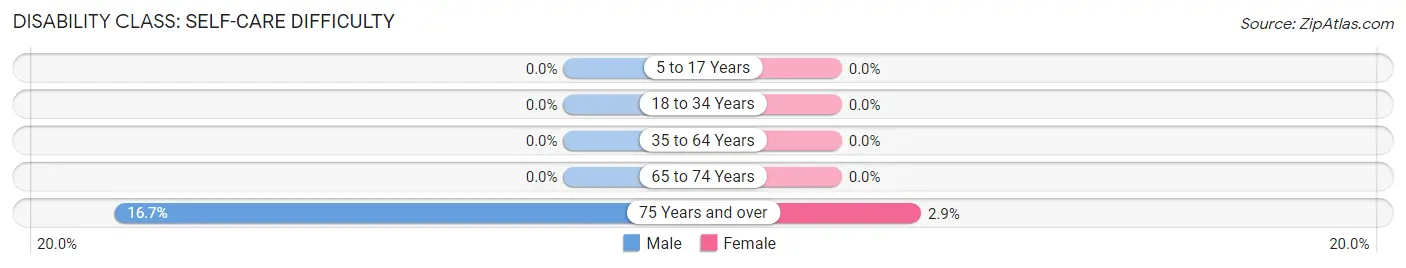
| Age Bracket | Male | Female |
| 5 to 17 Years | 0 (0.0%) | 0 (0.0%) |
| 18 to 34 Years | 0 (0.0%) | 0 (0.0%) |
| 35 to 64 Years | 0 (0.0%) | 0 (0.0%) |
| 65 to 74 Years | 0 (0.0%) | 0 (0.0%) |
| 75 Years and over | 1 (16.7%) | 1 (2.9%) |
Technology Access in Tullahassee
Computing Device Access in Tullahassee
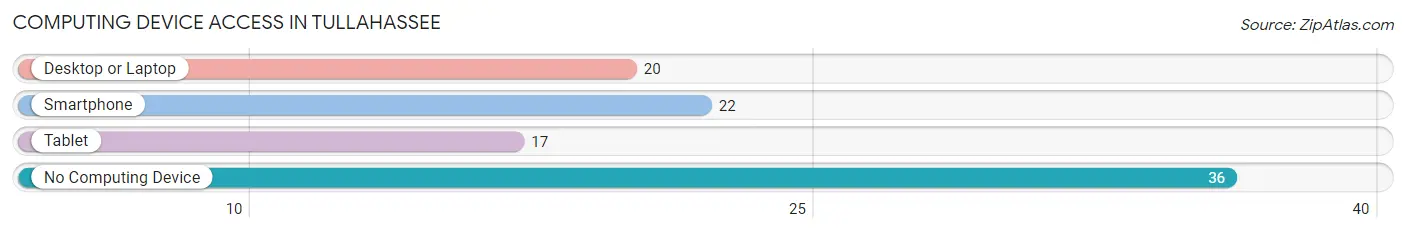
| Device Type | # Households | % Households |
| Desktop or Laptop | 20 | 33.3% |
| Smartphone | 22 | 36.7% |
| Tablet | 17 | 28.3% |
| No Computing Device | 36 | 60.0% |
| Total | 60 | 100.0% |
Internet Access in Tullahassee
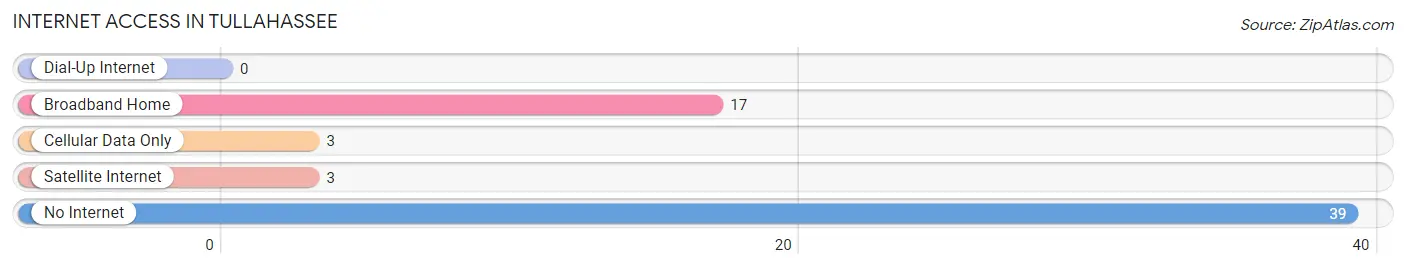
| Internet Type | # Households | % Households |
| Dial-Up Internet | 0 | 0.0% |
| Broadband Home | 17 | 28.3% |
| Cellular Data Only | 3 | 5.0% |
| Satellite Internet | 3 | 5.0% |
| No Internet | 39 | 65.0% |
| Total | 60 | 100.0% |
Tullahassee Summary
Tullahassee is a small unincorporated community located in Wagoner County, Oklahoma. It is situated on the banks of the Arkansas River, approximately 20 miles east of Tulsa. The town was founded in the late 1800s and has a population of approximately 500 people.
History
Tullahassee was founded in the late 1800s by a group of settlers from the Creek Nation. The town was named after the Creek word for “big water”, which is fitting given its location on the banks of the Arkansas River. The town was originally a trading post for the Creek Nation, and it quickly grew into a small community.
In the early 1900s, the town was home to a number of businesses, including a general store, a blacksmith shop, a cotton gin, and a grist mill. The town also had a post office, which was established in 1902.
In the 1920s, the town began to decline as the railroad bypassed it and the population began to move away. The town was nearly abandoned by the 1940s, but it was revived in the 1950s when the Arkansas River was dammed and the lake created. The lake provided a new source of recreation and tourism for the town, and it has since become a popular destination for fishing, boating, and camping.
Geography
Tullahassee is located in Wagoner County, Oklahoma, approximately 20 miles east of Tulsa. The town is situated on the banks of the Arkansas River, and it is surrounded by rolling hills and wooded areas. The town is located in the Ozark Plateau region of Oklahoma, and it is part of the Ozark Highlands.
The climate in Tullahassee is humid subtropical, with hot summers and mild winters. The average annual temperature is around 65 degrees Fahrenheit, and the average annual precipitation is around 40 inches.
Economy
The economy of Tullahassee is largely based on tourism and recreation. The town is home to a number of businesses, including a general store, a gas station, a restaurant, and a few other small businesses. The town is also home to a number of recreational activities, including fishing, boating, and camping.
The town is also home to a number of agricultural operations, including cattle and poultry farms. The town is also home to a number of manufacturing operations, including a woodworking shop and a metal fabrication shop.
Demographics
As of the 2010 census, the population of Tullahassee was 498. The racial makeup of the town was 95.2% White, 0.6% African American, 0.2% Native American, 0.2% Asian, 0.2% from other races, and 3.8% from two or more races. Hispanic or Latino of any race were 1.2% of the population.
The median income for a household in Tullahassee was $35,625, and the median income for a family was $41,250. The per capita income for the town was $17,845. About 11.2% of families and 14.2% of the population were below the poverty line, including 18.2% of those under age 18 and 8.3% of those age 65 or over.
Common Questions
What is Per Capita Income in Tullahassee?
Per Capita income in Tullahassee is $34,752.
What is the Median Family Income in Tullahassee?
Median Family Income in Tullahassee is $108,788.
What is the Median Household income in Tullahassee?
Median Household Income in Tullahassee is $108,182.
What is Income or Wage Gap in Tullahassee?
Income or Wage Gap in Tullahassee is 94.4%.
Women in Tullahassee earn 5.6 cents for every dollar earned by a man.
What is Inequality or Gini Index in Tullahassee?
Inequality or Gini Index in Tullahassee is 0.19.
What is the Total Population of Tullahassee?
Total Population of Tullahassee is 121.
What is the Total Male Population of Tullahassee?
Total Male Population of Tullahassee is 50.
What is the Total Female Population of Tullahassee?
Total Female Population of Tullahassee is 71.
What is the Ratio of Males per 100 Females in Tullahassee?
There are 70.42 Males per 100 Females in Tullahassee.
What is the Ratio of Females per 100 Males in Tullahassee?
There are 142.00 Females per 100 Males in Tullahassee.
What is the Median Population Age in Tullahassee?
Median Population Age in Tullahassee is 57.2 Years.
What is the Average Family Size in Tullahassee
Average Family Size in Tullahassee is 1.9 People.
What is the Average Household Size in Tullahassee
Average Household Size in Tullahassee is 2.0 People.
How Large is the Labor Force in Tullahassee?
There are 88 People in the Labor Forcein in Tullahassee.
What is the Percentage of People in the Labor Force in Tullahassee?
75.2% of People are in the Labor Force in Tullahassee.