North Enid, OK Map & Demographics
North Enid Map
North Enid Overview
$33,664
PER CAPITA INCOME
$85,114
AVG FAMILY INCOME
$78,636
AVG HOUSEHOLD INCOME
37.9%
WAGE / INCOME GAP [ % ]
62.1¢/ $1
WAGE / INCOME GAP [ $ ]
0.32
INEQUALITY / GINI INDEX
1,214
TOTAL POPULATION
580
MALE POPULATION
634
FEMALE POPULATION
91.48
MALES / 100 FEMALES
109.31
FEMALES / 100 MALES
43.3
MEDIAN AGE
3.9
AVG FAMILY SIZE
3.4
AVG HOUSEHOLD SIZE
528
LABOR FORCE [ PEOPLE ]
53.1%
PERCENT IN LABOR FORCE
8.8%
UNEMPLOYMENT RATE
North Enid Area Codes
Income in North Enid
Income Overview in North Enid
Per Capita Income in North Enid is $33,664, while median incomes of families and households are $85,114 and $78,636 respectively.
| Characteristic | Number | Measure |
| Per Capita Income | 1,214 | $33,664 |
| Median Family Income | 275 | $85,114 |
| Mean Family Income | 275 | $95,842 |
| Median Household Income | 354 | $78,636 |
| Mean Household Income | 354 | $86,797 |
| Income Deficit | 275 | $0 |
| Wage / Income Gap (%) | 1,214 | 37.95% |
| Wage / Income Gap ($) | 1,214 | 62.05¢ per $1 |
| Gini / Inequality Index | 1,214 | 0.32 |
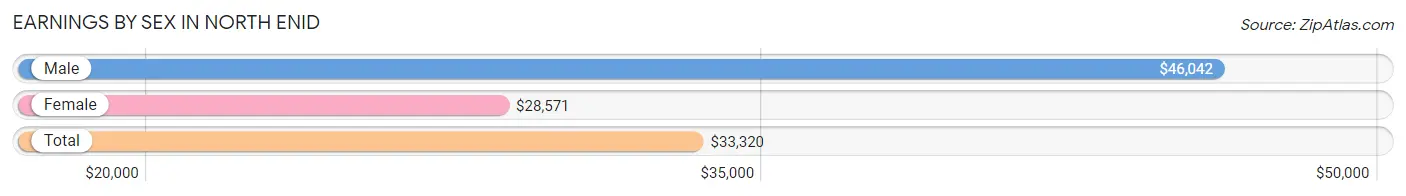
Earnings by Sex in North Enid
Average Earnings in North Enid are $33,320, $46,042 for men and $28,571 for women, a difference of 38.0%.
| Sex | Number | Average Earnings |
| Male | 297 (51.8%) | $46,042 |
| Female | 276 (48.2%) | $28,571 |
| Total | 573 (100.0%) | $33,320 |
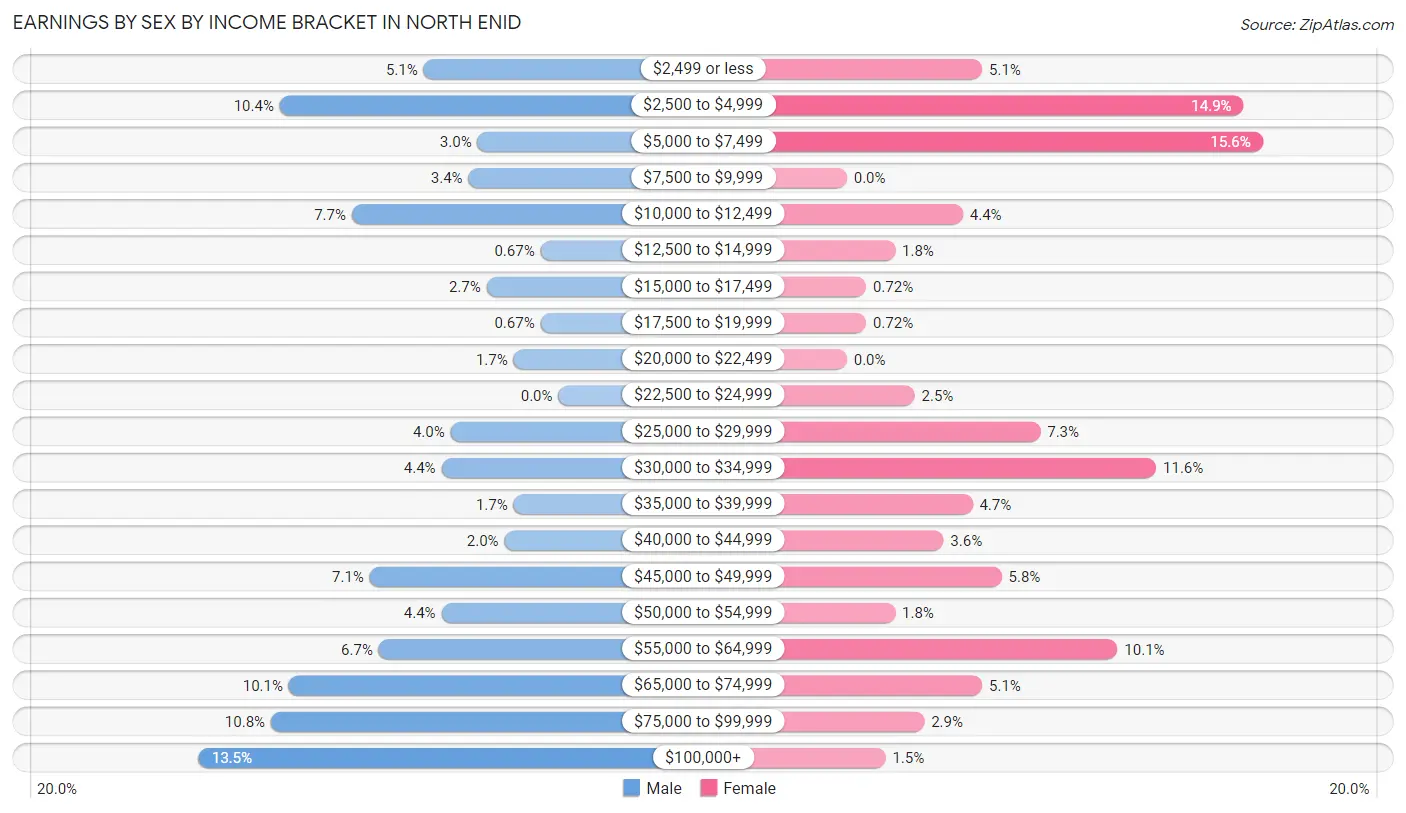
Earnings by Sex by Income Bracket in North Enid
The most common earnings brackets in North Enid are $100,000+ for men (40 | 13.5%) and $5,000 to $7,499 for women (43 | 15.6%).
| Income | Male | Female |
| $2,499 or less | 15 (5.1%) | 14 (5.1%) |
| $2,500 to $4,999 | 31 (10.4%) | 41 (14.9%) |
| $5,000 to $7,499 | 9 (3.0%) | 43 (15.6%) |
| $7,500 to $9,999 | 10 (3.4%) | 0 (0.0%) |
| $10,000 to $12,499 | 23 (7.7%) | 12 (4.3%) |
| $12,500 to $14,999 | 2 (0.7%) | 5 (1.8%) |
| $15,000 to $17,499 | 8 (2.7%) | 2 (0.7%) |
| $17,500 to $19,999 | 2 (0.7%) | 2 (0.7%) |
| $20,000 to $22,499 | 5 (1.7%) | 0 (0.0%) |
| $22,500 to $24,999 | 0 (0.0%) | 7 (2.5%) |
| $25,000 to $29,999 | 12 (4.0%) | 20 (7.2%) |
| $30,000 to $34,999 | 13 (4.4%) | 32 (11.6%) |
| $35,000 to $39,999 | 5 (1.7%) | 13 (4.7%) |
| $40,000 to $44,999 | 6 (2.0%) | 10 (3.6%) |
| $45,000 to $49,999 | 21 (7.1%) | 16 (5.8%) |
| $50,000 to $54,999 | 13 (4.4%) | 5 (1.8%) |
| $55,000 to $64,999 | 20 (6.7%) | 28 (10.1%) |
| $65,000 to $74,999 | 30 (10.1%) | 14 (5.1%) |
| $75,000 to $99,999 | 32 (10.8%) | 8 (2.9%) |
| $100,000+ | 40 (13.5%) | 4 (1.5%) |
| Total | 297 (100.0%) | 276 (100.0%) |
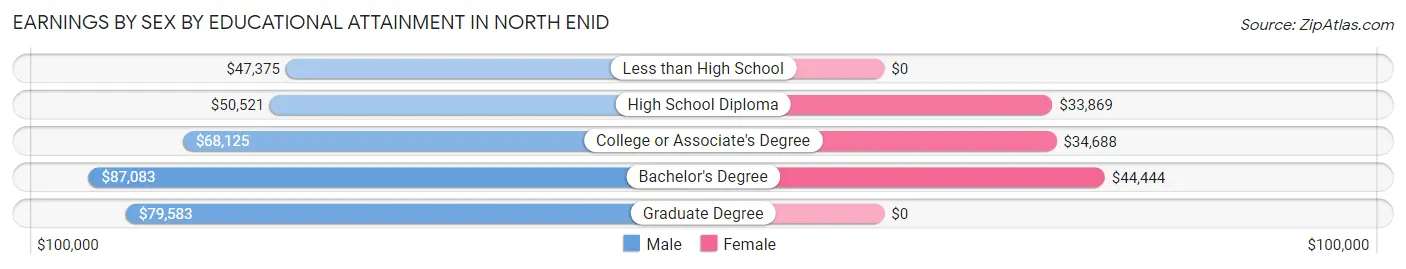
Earnings by Sex by Educational Attainment in North Enid
Average earnings in North Enid are $56,563 for men and $34,957 for women, a difference of 38.2%. Men with an educational attainment of bachelor's degree enjoy the highest average annual earnings of $87,083, while those with less than high school education earn the least with $47,375. Women with an educational attainment of bachelor's degree earn the most with the average annual earnings of $44,444, while those with high school diploma education have the smallest earnings of $33,869.
| Educational Attainment | Male Income | Female Income |
| Less than High School | $47,375 | $0 |
| High School Diploma | $50,521 | $33,869 |
| College or Associate's Degree | $68,125 | $34,688 |
| Bachelor's Degree | $87,083 | $44,444 |
| Graduate Degree | $79,583 | $0 |
| Total | $56,563 | $34,957 |
Family Income in North Enid
Family Income Brackets in North Enid
According to the North Enid family income data, there are 79 families falling into the $100,000 to $149,999 income range, which is the most common income bracket and makes up 28.7% of all families.
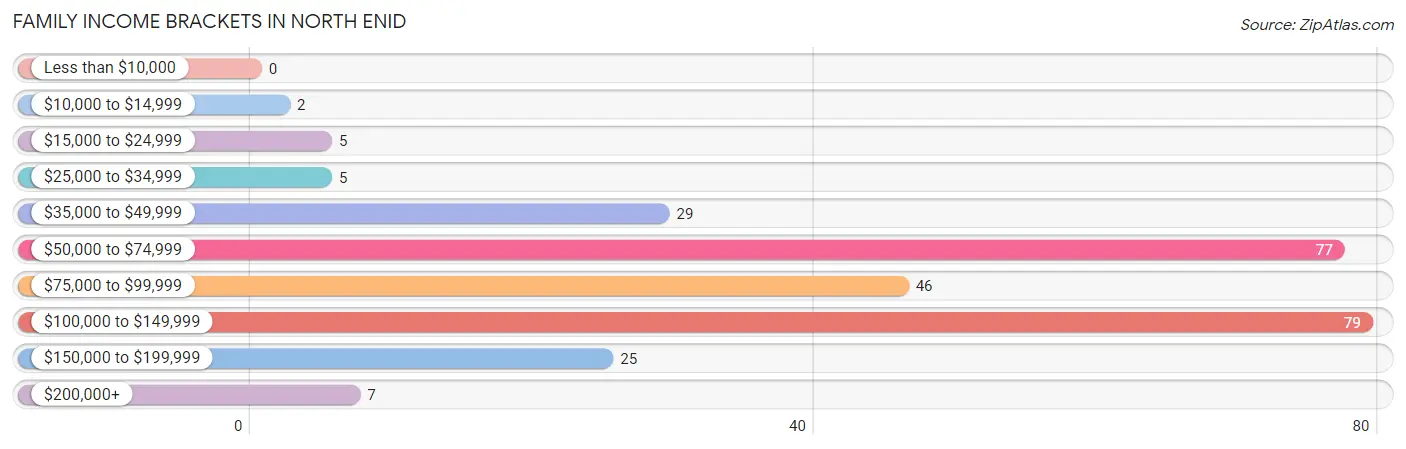
| Income Bracket | # Families | % Families |
| Less than $10,000 | 0 | 0.0% |
| $10,000 to $14,999 | 2 | 0.7% |
| $15,000 to $24,999 | 5 | 1.8% |
| $25,000 to $34,999 | 5 | 1.8% |
| $35,000 to $49,999 | 29 | 10.5% |
| $50,000 to $74,999 | 77 | 28.0% |
| $75,000 to $99,999 | 46 | 16.7% |
| $100,000 to $149,999 | 79 | 28.7% |
| $150,000 to $199,999 | 25 | 9.1% |
| $200,000+ | 7 | 2.5% |
Family Income by Famaliy Size in North Enid
5-person families (16 | 5.8%) account for the highest median family income in North Enid with $109,167 per family, while 2-person families (125 | 45.5%) have the highest median income of $41,518 per family member.
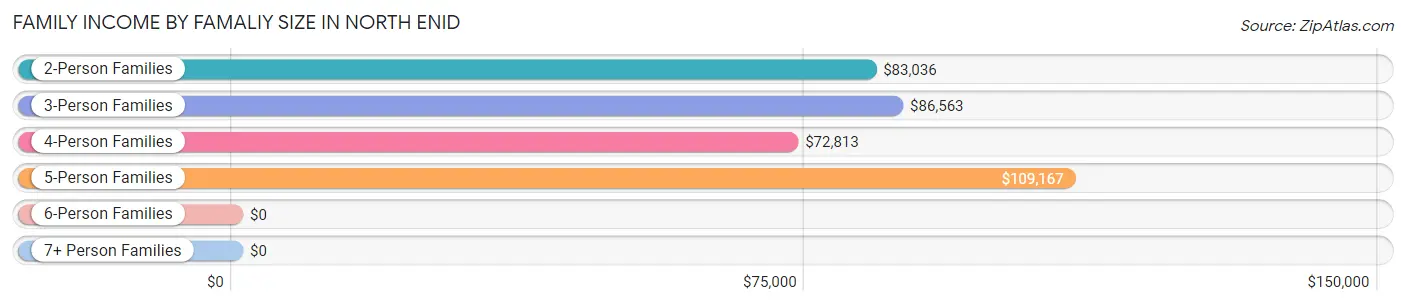
| Income Bracket | # Families | Median Income |
| 2-Person Families | 125 (45.5%) | $83,036 |
| 3-Person Families | 58 (21.1%) | $86,563 |
| 4-Person Families | 51 (18.5%) | $72,813 |
| 5-Person Families | 16 (5.8%) | $109,167 |
| 6-Person Families | 6 (2.2%) | $0 |
| 7+ Person Families | 19 (6.9%) | $0 |
| Total | 275 (100.0%) | $85,114 |
Family Income by Number of Earners in North Enid
The median family income in North Enid is $85,114, with families comprising 3+ earners (44) having the highest median family income of $131,250, while families with no earners (38) have the lowest median family income of $60,625, accounting for 16.0% and 13.8% of families, respectively.
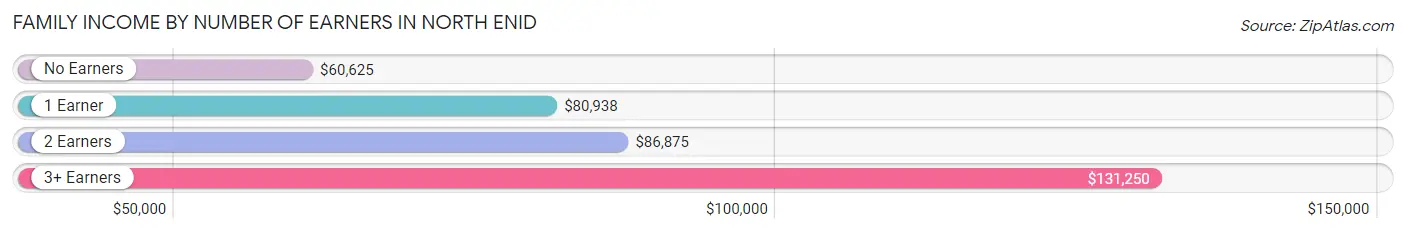
| Number of Earners | # Families | Median Income |
| No Earners | 38 (13.8%) | $60,625 |
| 1 Earner | 99 (36.0%) | $80,938 |
| 2 Earners | 94 (34.2%) | $86,875 |
| 3+ Earners | 44 (16.0%) | $131,250 |
| Total | 275 (100.0%) | $85,114 |
Household Income in North Enid
Household Income Brackets in North Enid
With 101 households falling in the category, the $100,000 to $149,999 income range is the most frequent in North Enid, accounting for 28.5% of all households. In contrast, only 5 households (1.4%) fall into the $15,000 to $24,999 income bracket, making it the least populous group.
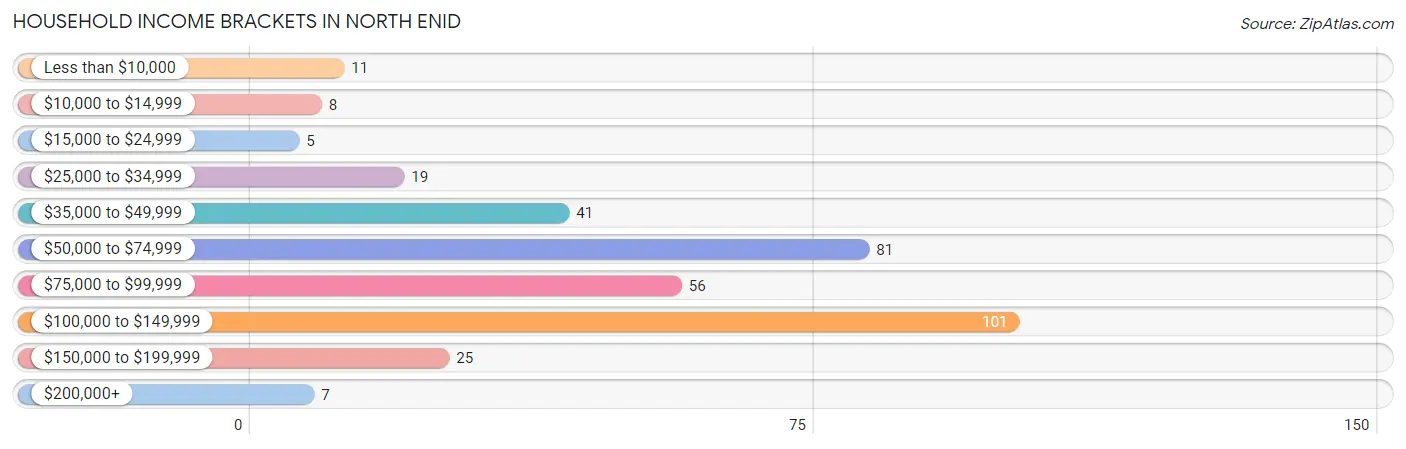
| Income Bracket | # Households | % Households |
| Less than $10,000 | 11 | 3.1% |
| $10,000 to $14,999 | 8 | 2.3% |
| $15,000 to $24,999 | 5 | 1.4% |
| $25,000 to $34,999 | 19 | 5.4% |
| $35,000 to $49,999 | 41 | 11.6% |
| $50,000 to $74,999 | 81 | 22.9% |
| $75,000 to $99,999 | 56 | 15.8% |
| $100,000 to $149,999 | 101 | 28.5% |
| $150,000 to $199,999 | 25 | 7.1% |
| $200,000+ | 7 | 2.0% |
Household Income by Householder Age in North Enid
The median household income in North Enid is $78,636, with the highest median household income of $98,958 found in the 25 to 44 years age bracket for the primary householder. A total of 111 households (31.4%) fall into this category. Meanwhile, the 15 to 24 years age bracket for the primary householder has the lowest median household income of $0, with 13 households (3.7%) in this group.
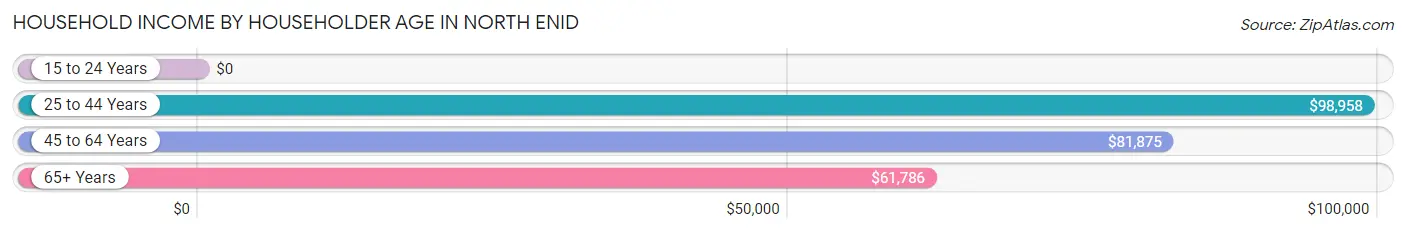
| Income Bracket | # Households | Median Income |
| 15 to 24 Years | 13 (3.7%) | $0 |
| 25 to 44 Years | 111 (31.4%) | $98,958 |
| 45 to 64 Years | 128 (36.2%) | $81,875 |
| 65+ Years | 102 (28.8%) | $61,786 |
| Total | 354 (100.0%) | $78,636 |
Poverty in North Enid
Income Below Poverty by Sex and Age in North Enid
With 6.2% poverty level for males and 2.2% for females among the residents of North Enid, 55 to 64 year old males and 5 year old females are the most vulnerable to poverty, with 9 males (25.0%) and 2 females (50.0%) in their respective age groups living below the poverty level.
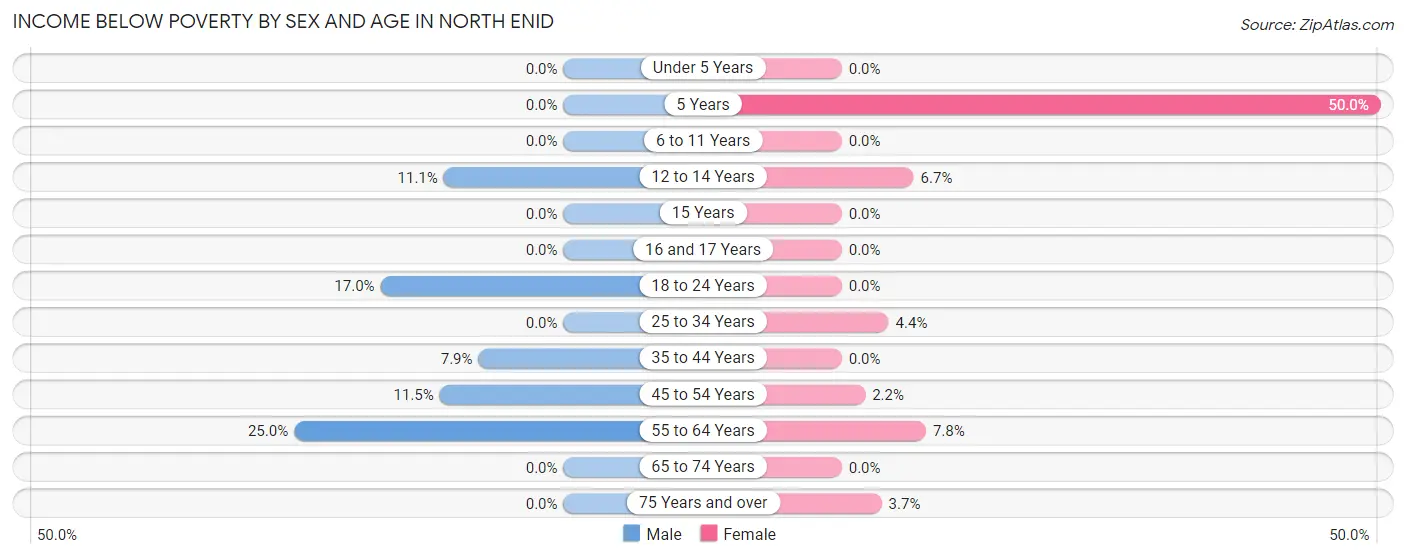
| Age Bracket | Male | Female |
| Under 5 Years | 0 (0.0%) | 0 (0.0%) |
| 5 Years | 0 (0.0%) | 2 (50.0%) |
| 6 to 11 Years | 0 (0.0%) | 0 (0.0%) |
| 12 to 14 Years | 2 (11.1%) | 2 (6.7%) |
| 15 Years | 0 (0.0%) | 0 (0.0%) |
| 16 and 17 Years | 0 (0.0%) | 0 (0.0%) |
| 18 to 24 Years | 9 (17.0%) | 0 (0.0%) |
| 25 to 34 Years | 0 (0.0%) | 2 (4.3%) |
| 35 to 44 Years | 6 (7.9%) | 0 (0.0%) |
| 45 to 54 Years | 10 (11.5%) | 1 (2.2%) |
| 55 to 64 Years | 9 (25.0%) | 5 (7.8%) |
| 65 to 74 Years | 0 (0.0%) | 0 (0.0%) |
| 75 Years and over | 0 (0.0%) | 2 (3.7%) |
| Total | 36 (6.2%) | 14 (2.2%) |
Income Above Poverty by Sex and Age in North Enid
According to the poverty statistics in North Enid, males aged under 5 years and females aged under 5 years are the age groups that are most secure financially, with 100.0% of males and 100.0% of females in these age groups living above the poverty line.
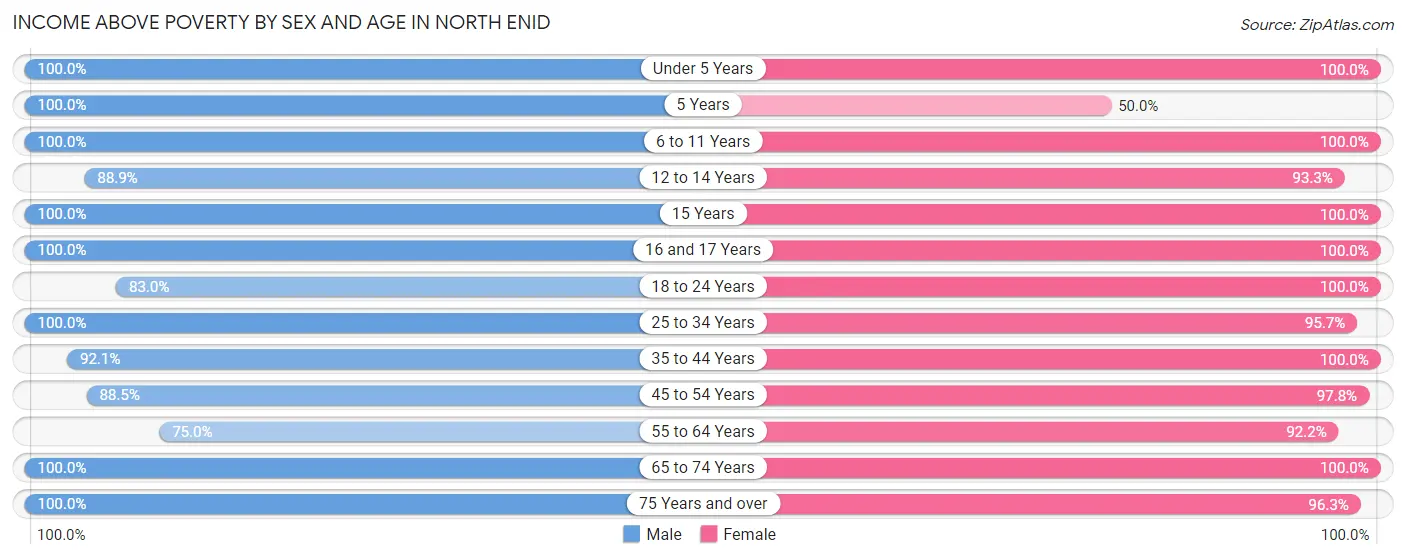
| Age Bracket | Male | Female |
| Under 5 Years | 31 (100.0%) | 6 (100.0%) |
| 5 Years | 10 (100.0%) | 2 (50.0%) |
| 6 to 11 Years | 56 (100.0%) | 49 (100.0%) |
| 12 to 14 Years | 16 (88.9%) | 28 (93.3%) |
| 15 Years | 3 (100.0%) | 5 (100.0%) |
| 16 and 17 Years | 19 (100.0%) | 32 (100.0%) |
| 18 to 24 Years | 44 (83.0%) | 60 (100.0%) |
| 25 to 34 Years | 47 (100.0%) | 44 (95.7%) |
| 35 to 44 Years | 70 (92.1%) | 94 (100.0%) |
| 45 to 54 Years | 77 (88.5%) | 45 (97.8%) |
| 55 to 64 Years | 27 (75.0%) | 59 (92.2%) |
| 65 to 74 Years | 36 (100.0%) | 137 (100.0%) |
| 75 Years and over | 108 (100.0%) | 52 (96.3%) |
| Total | 544 (93.8%) | 613 (97.8%) |
Income Below Poverty Among Married-Couple Families in North Enid
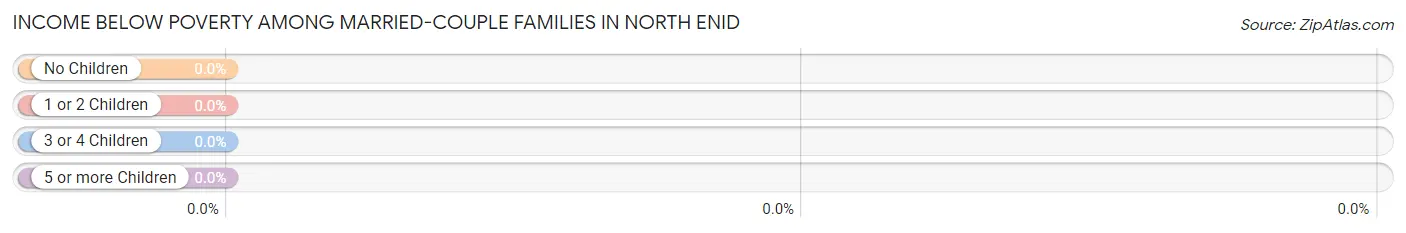
| Children | Above Poverty | Below Poverty |
| No Children | 111 (100.0%) | 0 (0.0%) |
| 1 or 2 Children | 87 (100.0%) | 0 (0.0%) |
| 3 or 4 Children | 25 (100.0%) | 0 (0.0%) |
| 5 or more Children | 0 (0.0%) | 0 (0.0%) |
| Total | 223 (100.0%) | 0 (0.0%) |
Income Below Poverty Among Single-Parent Households in North Enid
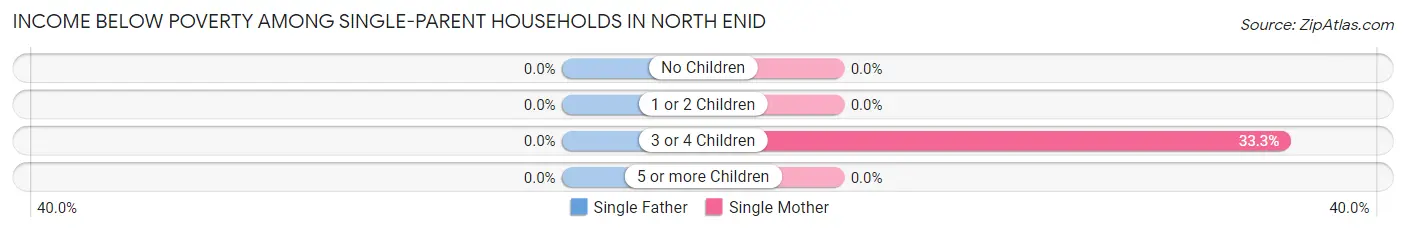
| Children | Single Father | Single Mother |
| No Children | 0 (0.0%) | 0 (0.0%) |
| 1 or 2 Children | 0 (0.0%) | 0 (0.0%) |
| 3 or 4 Children | 0 (0.0%) | 2 (33.3%) |
| 5 or more Children | 0 (0.0%) | 0 (0.0%) |
| Total | 0 (0.0%) | 2 (5.6%) |
Income Below Poverty Among Married-Couple vs Single-Parent Households in North Enid
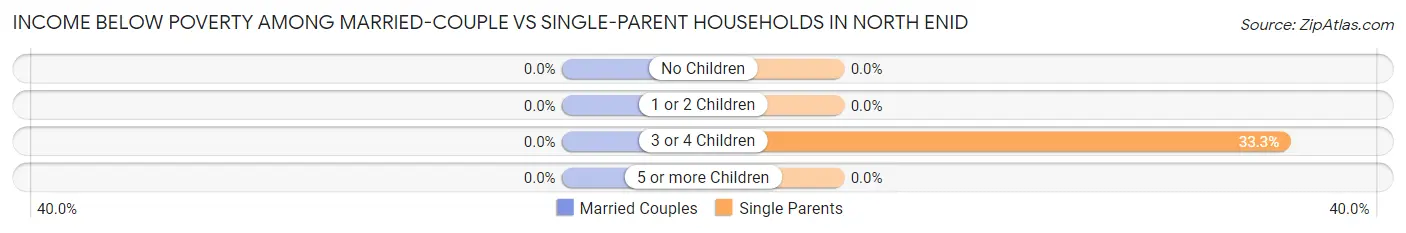
| Children | Married-Couple Families | Single-Parent Households |
| No Children | 0 (0.0%) | 0 (0.0%) |
| 1 or 2 Children | 0 (0.0%) | 0 (0.0%) |
| 3 or 4 Children | 0 (0.0%) | 2 (33.3%) |
| 5 or more Children | 0 (0.0%) | 0 (0.0%) |
| Total | 0 (0.0%) | 2 (3.8%) |
Race in North Enid
The most populous races in North Enid are White / Caucasian (980 | 80.7%), Hawaiian / Pacific (127 | 10.5%), and Two or more Races (94 | 7.7%).
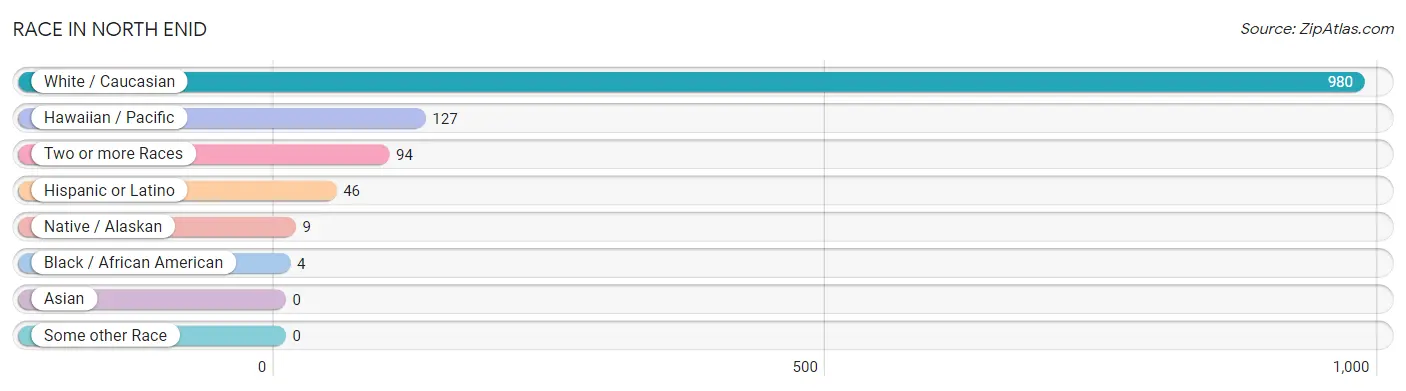
| Race | # Population | % Population |
| Asian | 0 | 0.0% |
| Black / African American | 4 | 0.3% |
| Hawaiian / Pacific | 127 | 10.5% |
| Hispanic or Latino | 46 | 3.8% |
| Native / Alaskan | 9 | 0.7% |
| White / Caucasian | 980 | 80.7% |
| Two or more Races | 94 | 7.7% |
| Some other Race | 0 | 0.0% |
| Total | 1,214 | 100.0% |
Ancestry in North Enid
The most populous ancestries reported in North Enid are German (288 | 23.7%), Irish (254 | 20.9%), Fijian (127 | 10.5%), English (90 | 7.4%), and American (67 | 5.5%), together accounting for 68.0% of all North Enid residents.
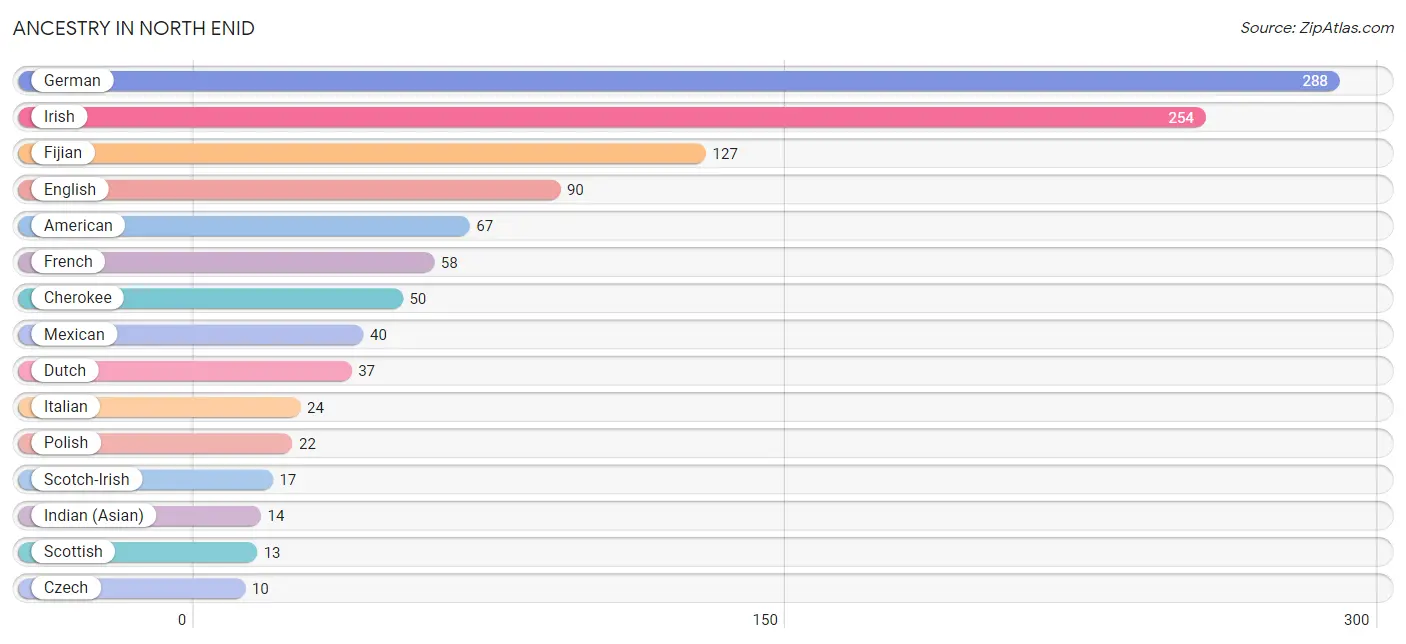
| Ancestry | # Population | % Population |
| American | 67 | 5.5% |
| Bangladeshi | 6 | 0.5% |
| British | 4 | 0.3% |
| Cherokee | 50 | 4.1% |
| Chippewa | 2 | 0.2% |
| Choctaw | 5 | 0.4% |
| Czech | 10 | 0.8% |
| Dutch | 37 | 3.0% |
| Eastern European | 2 | 0.2% |
| English | 90 | 7.4% |
| European | 2 | 0.2% |
| Fijian | 127 | 10.5% |
| French | 58 | 4.8% |
| German | 288 | 23.7% |
| Greek | 4 | 0.3% |
| Indian (Asian) | 14 | 1.1% |
| Irish | 254 | 20.9% |
| Iroquois | 4 | 0.3% |
| Italian | 24 | 2.0% |
| Mexican | 40 | 3.3% |
| Osage | 7 | 0.6% |
| Polish | 22 | 1.8% |
| Potawatomi | 4 | 0.3% |
| Russian | 5 | 0.4% |
| Scandinavian | 6 | 0.5% |
| Scotch-Irish | 17 | 1.4% |
| Scottish | 13 | 1.1% |
| Spaniard | 6 | 0.5% |
| Swedish | 8 | 0.7% |
| Thai | 6 | 0.5% |
| Ukrainian | 2 | 0.2% | View All 31 Rows |
Immigrants in North Enid
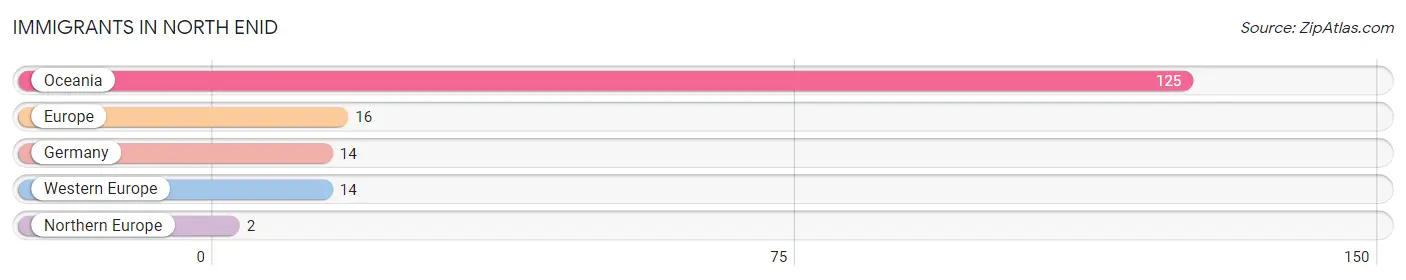
The most numerous immigrant groups reported in North Enid came from Oceania (125 | 10.3%), Europe (16 | 1.3%), Germany (14 | 1.1%), Western Europe (14 | 1.1%), and Northern Europe (2 | 0.2%), together accounting for 14.1% of all North Enid residents.
| Immigration Origin | # Population | % Population |
| Europe | 16 | 1.3% |
| Germany | 14 | 1.1% |
| Northern Europe | 2 | 0.2% |
| Oceania | 125 | 10.3% |
| Western Europe | 14 | 1.1% | View All 5 Rows |
Sex and Age in North Enid
Sex and Age in North Enid
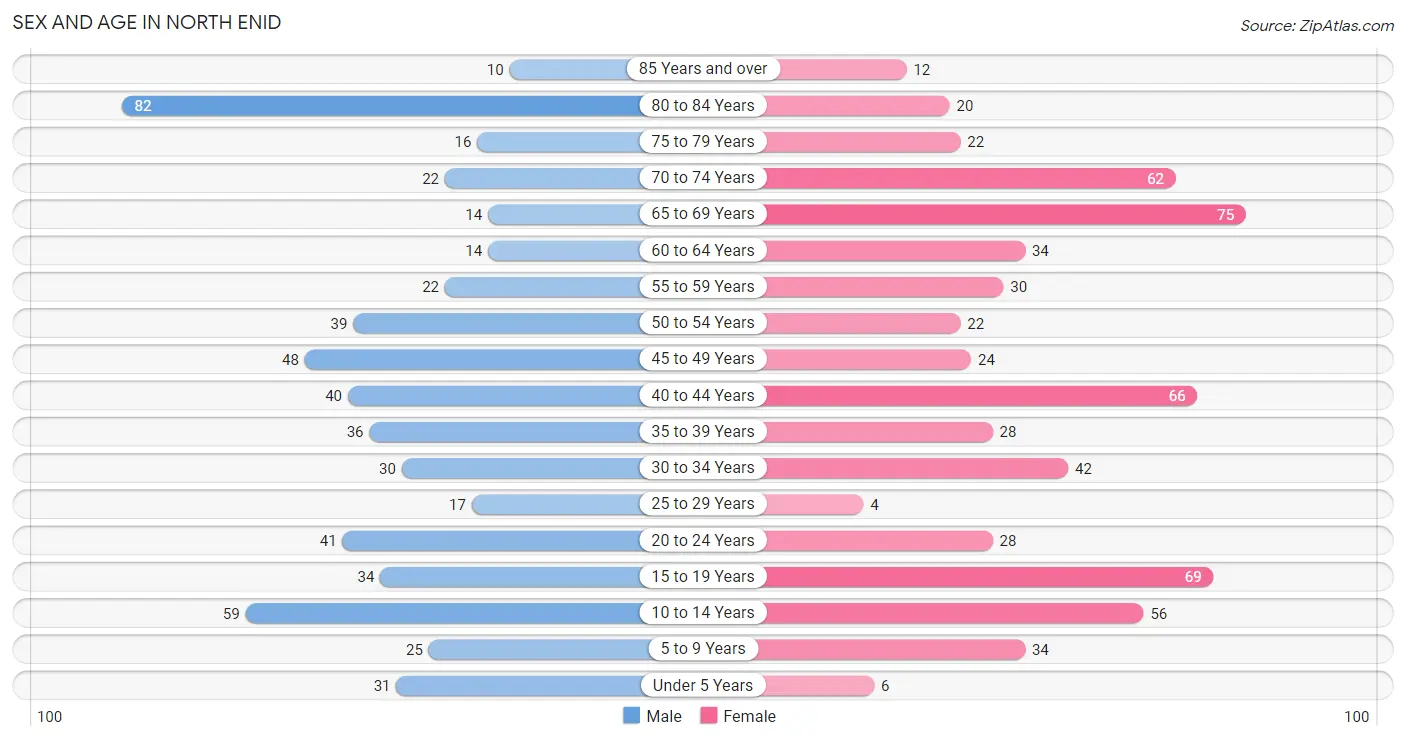
The most populous age groups in North Enid are 80 to 84 Years (82 | 14.1%) for men and 65 to 69 Years (75 | 11.8%) for women.
| Age Bracket | Male | Female |
| Under 5 Years | 31 (5.3%) | 6 (0.9%) |
| 5 to 9 Years | 25 (4.3%) | 34 (5.4%) |
| 10 to 14 Years | 59 (10.2%) | 56 (8.8%) |
| 15 to 19 Years | 34 (5.9%) | 69 (10.9%) |
| 20 to 24 Years | 41 (7.1%) | 28 (4.4%) |
| 25 to 29 Years | 17 (2.9%) | 4 (0.6%) |
| 30 to 34 Years | 30 (5.2%) | 42 (6.6%) |
| 35 to 39 Years | 36 (6.2%) | 28 (4.4%) |
| 40 to 44 Years | 40 (6.9%) | 66 (10.4%) |
| 45 to 49 Years | 48 (8.3%) | 24 (3.8%) |
| 50 to 54 Years | 39 (6.7%) | 22 (3.5%) |
| 55 to 59 Years | 22 (3.8%) | 30 (4.7%) |
| 60 to 64 Years | 14 (2.4%) | 34 (5.4%) |
| 65 to 69 Years | 14 (2.4%) | 75 (11.8%) |
| 70 to 74 Years | 22 (3.8%) | 62 (9.8%) |
| 75 to 79 Years | 16 (2.8%) | 22 (3.5%) |
| 80 to 84 Years | 82 (14.1%) | 20 (3.2%) |
| 85 Years and over | 10 (1.7%) | 12 (1.9%) |
| Total | 580 (100.0%) | 634 (100.0%) |
Families and Households in North Enid
Median Family Size in North Enid
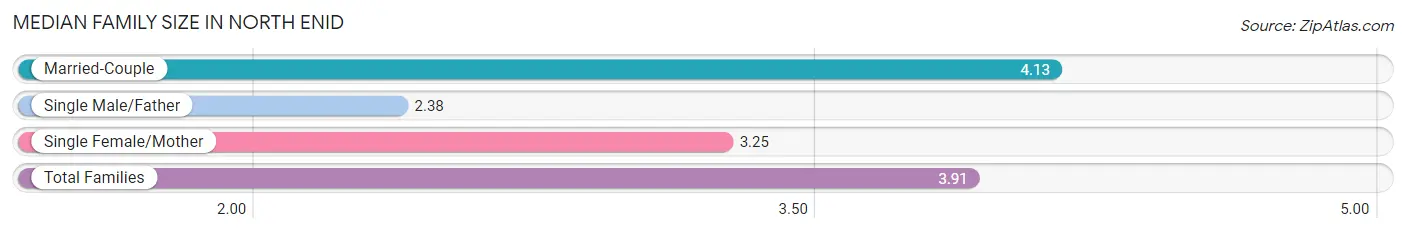
The median family size in North Enid is 3.91 persons per family, with married-couple families (223 | 81.1%) accounting for the largest median family size of 4.13 persons per family. On the other hand, single male/father families (16 | 5.8%) represent the smallest median family size with 2.38 persons per family.
| Family Type | # Families | Family Size |
| Married-Couple | 223 (81.1%) | 4.13 |
| Single Male/Father | 16 (5.8%) | 2.38 |
| Single Female/Mother | 36 (13.1%) | 3.25 |
| Total Families | 275 (100.0%) | 3.91 |
Median Household Size in North Enid
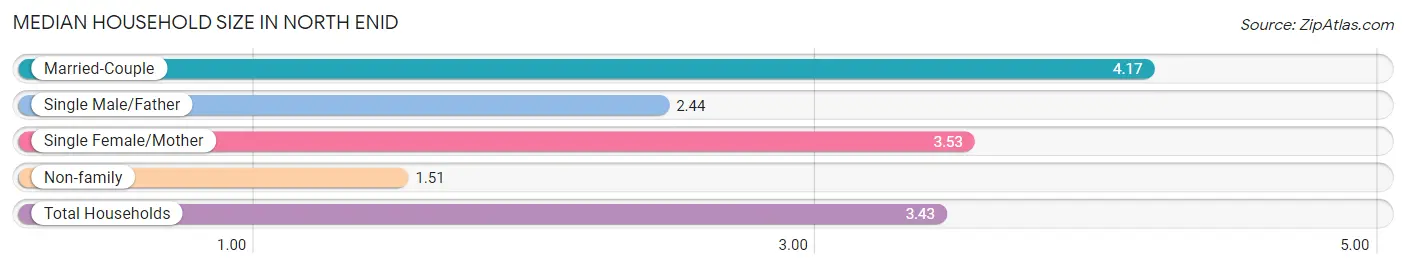
The median household size in North Enid is 3.43 persons per household, with married-couple households (223 | 63.0%) accounting for the largest median household size of 4.17 persons per household. non-family households (79 | 22.3%) represent the smallest median household size with 1.51 persons per household.
| Household Type | # Households | Household Size |
| Married-Couple | 223 (63.0%) | 4.17 |
| Single Male/Father | 16 (4.5%) | 2.44 |
| Single Female/Mother | 36 (10.2%) | 3.53 |
| Non-family | 79 (22.3%) | 1.51 |
| Total Households | 354 (100.0%) | 3.43 |
Household Size by Marriage Status in North Enid
Out of a total of 354 households in North Enid, 275 (77.7%) are family households, while 79 (22.3%) are nonfamily households. The most numerous type of family households are 2-person households, comprising 125, and the most common type of nonfamily households are 1-person households, comprising 61.
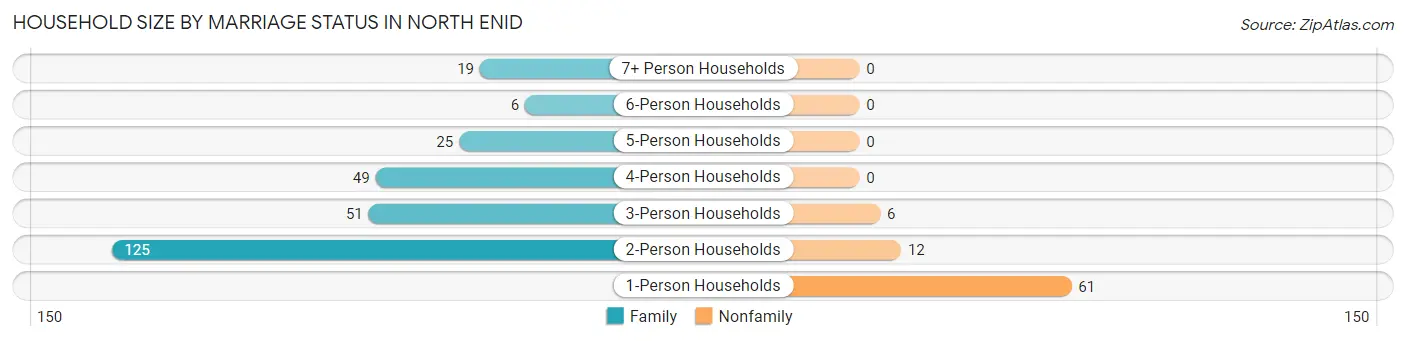
| Household Size | Family Households | Nonfamily Households |
| 1-Person Households | - | 61 (17.2%) |
| 2-Person Households | 125 (35.3%) | 12 (3.4%) |
| 3-Person Households | 51 (14.4%) | 6 (1.7%) |
| 4-Person Households | 49 (13.8%) | 0 (0.0%) |
| 5-Person Households | 25 (7.1%) | 0 (0.0%) |
| 6-Person Households | 6 (1.7%) | 0 (0.0%) |
| 7+ Person Households | 19 (5.4%) | 0 (0.0%) |
| Total | 275 (77.7%) | 79 (22.3%) |
Female Fertility in North Enid
Fertility by Age in North Enid
Average fertility rate in North Enid is 110.0 births per 1,000 women. Women in the age bracket of 20 to 34 years have the highest fertility rate with 297.0 births per 1,000 women. Women in the age bracket of 20 to 34 years acount for 75.9% of all women with births.
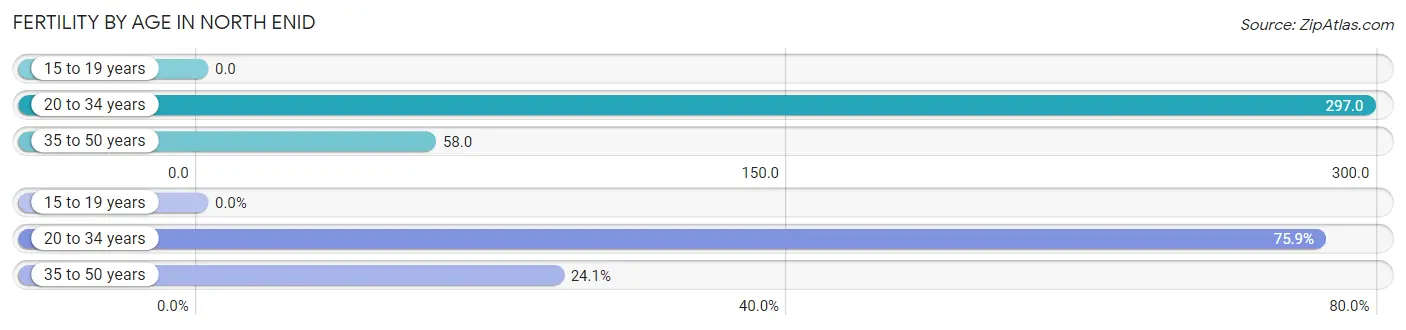
| Age Bracket | Women with Births | Births / 1,000 Women |
| 15 to 19 years | 0 (0.0%) | 0.0 |
| 20 to 34 years | 22 (75.9%) | 297.0 |
| 35 to 50 years | 7 (24.1%) | 58.0 |
| Total | 29 (100.0%) | 110.0 |
Fertility by Age by Marriage Status in North Enid
27.6% of women with births (29) in North Enid are married. The highest percentage of unmarried women with births falls into 20 to 34 years age bracket with 95.5% of them unmarried at the time of birth, while the lowest percentage of unmarried women with births belong to 35 to 50 years age bracket with 0.0% of them unmarried.
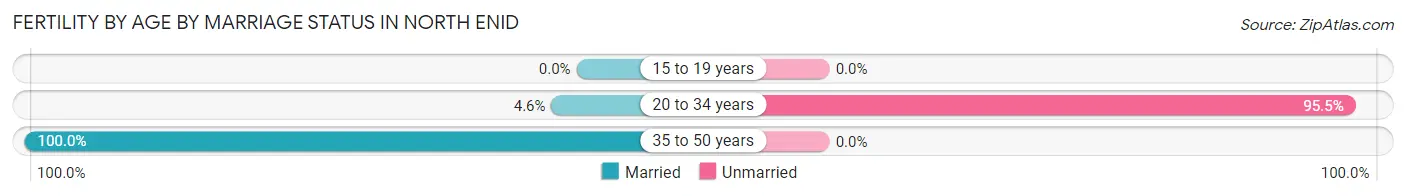
| Age Bracket | Married | Unmarried |
| 15 to 19 years | 0 (0.0%) | 0 (0.0%) |
| 20 to 34 years | 1 (4.5%) | 21 (95.5%) |
| 35 to 50 years | 7 (100.0%) | 0 (0.0%) |
| Total | 8 (27.6%) | 21 (72.4%) |
Fertility by Education in North Enid
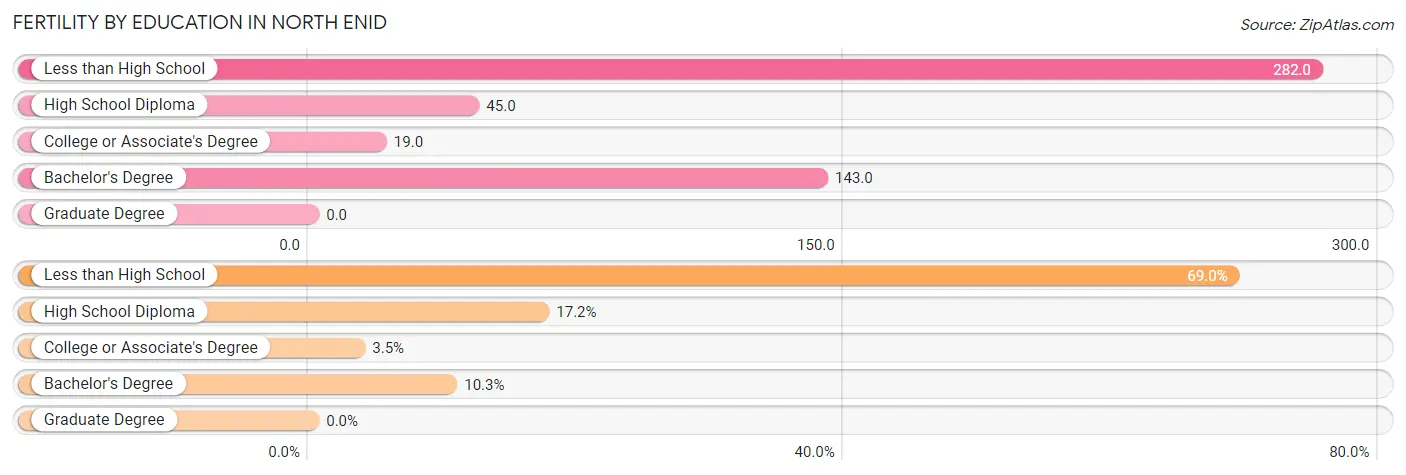
| Educational Attainment | Women with Births | Births / 1,000 Women |
| Less than High School | 20 (69.0%) | 282.0 |
| High School Diploma | 5 (17.2%) | 45.0 |
| College or Associate's Degree | 1 (3.5%) | 19.0 |
| Bachelor's Degree | 3 (10.3%) | 143.0 |
| Graduate Degree | 0 (0.0%) | 0.0 |
| Total | 29 (100.0%) | 110.0 |
Fertility by Education by Marriage Status in North Enid
72.4% of women with births in North Enid are unmarried. Women with the educational attainment of high school diploma are most likely to be married with 100.0% of them married at childbirth, while women with the educational attainment of less than high school are least likely to be married with 100.0% of them unmarried at childbirth.
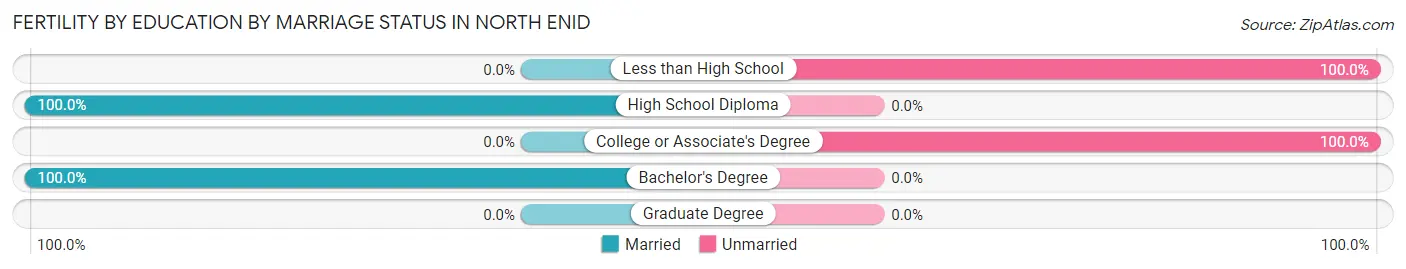
| Educational Attainment | Married | Unmarried |
| Less than High School | 0 (0.0%) | 20 (100.0%) |
| High School Diploma | 5 (100.0%) | 0 (0.0%) |
| College or Associate's Degree | 0 (0.0%) | 1 (100.0%) |
| Bachelor's Degree | 3 (100.0%) | 0 (0.0%) |
| Graduate Degree | 0 (0.0%) | 0 (0.0%) |
| Total | 8 (27.6%) | 21 (72.4%) |
Employment Characteristics in North Enid
Employment by Class of Employer in North Enid
Among the 458 employed individuals in North Enid, private company employees (312 | 68.1%), self-employed (not incorporated) (51 | 11.1%), and federal government employees (26 | 5.7%) make up the most common classes of employment.
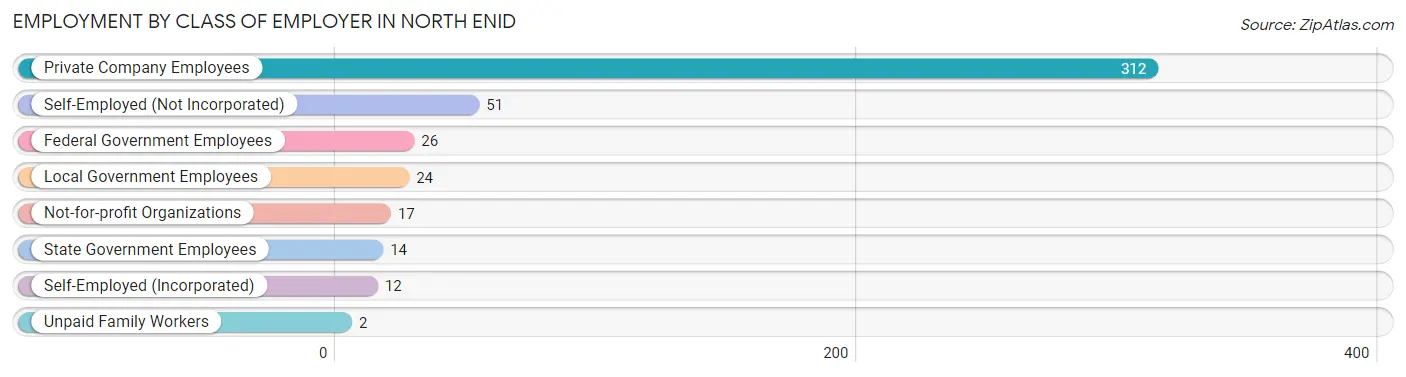
| Employer Class | # Employees | % Employees |
| Private Company Employees | 312 | 68.1% |
| Self-Employed (Incorporated) | 12 | 2.6% |
| Self-Employed (Not Incorporated) | 51 | 11.1% |
| Not-for-profit Organizations | 17 | 3.7% |
| Local Government Employees | 24 | 5.2% |
| State Government Employees | 14 | 3.1% |
| Federal Government Employees | 26 | 5.7% |
| Unpaid Family Workers | 2 | 0.4% |
| Total | 458 | 100.0% |
Employment Status by Age in North Enid
According to the labor force statistics for North Enid, out of the total population over 16 years of age (995), 53.1% or 528 individuals are in the labor force, with 8.8% or 46 of them unemployed. The age group with the highest labor force participation rate is 35 to 44 years, with 87.1% or 148 individuals in the labor force. Within the labor force, the 20 to 24 years age range has the highest percentage of unemployed individuals, with 63.0% or 29 of them being unemployed.
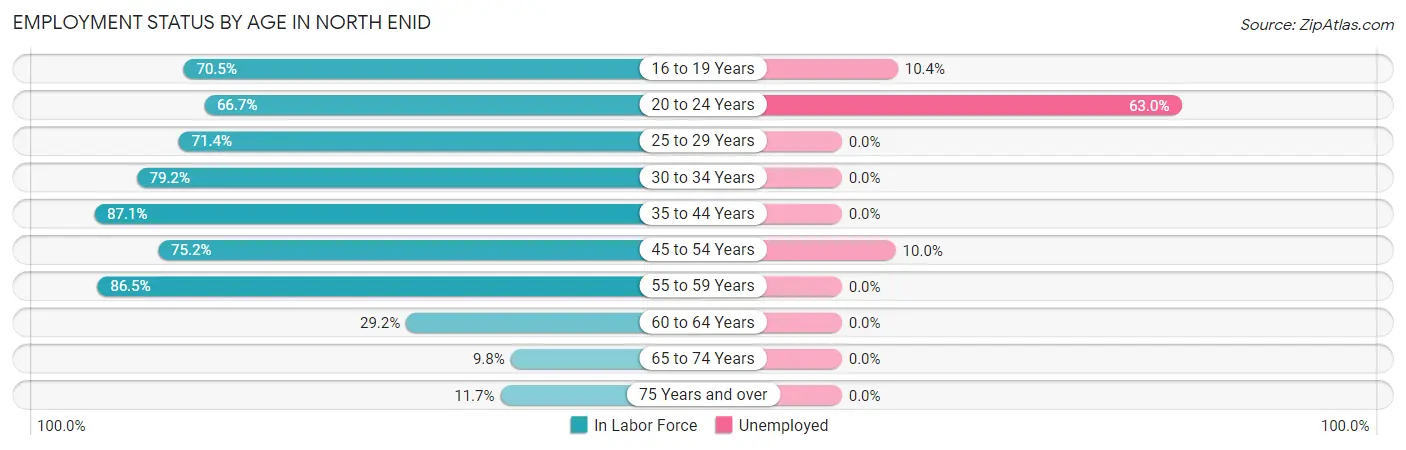
| Age Bracket | In Labor Force | Unemployed |
| 16 to 19 Years | 67 (70.5%) | 7 (10.4%) |
| 20 to 24 Years | 46 (66.7%) | 29 (63.0%) |
| 25 to 29 Years | 15 (71.4%) | 0 (0.0%) |
| 30 to 34 Years | 57 (79.2%) | 0 (0.0%) |
| 35 to 44 Years | 148 (87.1%) | 0 (0.0%) |
| 45 to 54 Years | 100 (75.2%) | 10 (10.0%) |
| 55 to 59 Years | 45 (86.5%) | 0 (0.0%) |
| 60 to 64 Years | 14 (29.2%) | 0 (0.0%) |
| 65 to 74 Years | 17 (9.8%) | 0 (0.0%) |
| 75 Years and over | 19 (11.7%) | 0 (0.0%) |
| Total | 528 (53.1%) | 46 (8.8%) |
Employment Status by Educational Attainment in North Enid
According to labor force statistics for North Enid, 76.4% of individuals (379) out of the total population between 25 and 64 years of age (496) are in the labor force, with 2.7% or 10 of them being unemployed. The group with the highest labor force participation rate are those with the educational attainment of less than high school, with 88.0% or 22 individuals in the labor force. Within the labor force, individuals with high school diploma education have the highest percentage of unemployment, with 6.1% or 10 of them being unemployed.
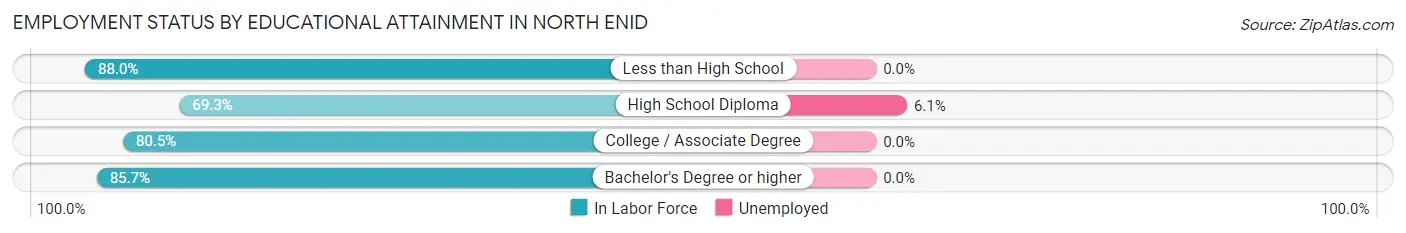
| Educational Attainment | In Labor Force | Unemployed |
| Less than High School | 22 (88.0%) | 0 (0.0%) |
| High School Diploma | 165 (69.3%) | 15 (6.1%) |
| College / Associate Degree | 120 (80.5%) | 0 (0.0%) |
| Bachelor's Degree or higher | 72 (85.7%) | 0 (0.0%) |
| Total | 379 (76.4%) | 13 (2.7%) |
Employment Occupations by Sex in North Enid
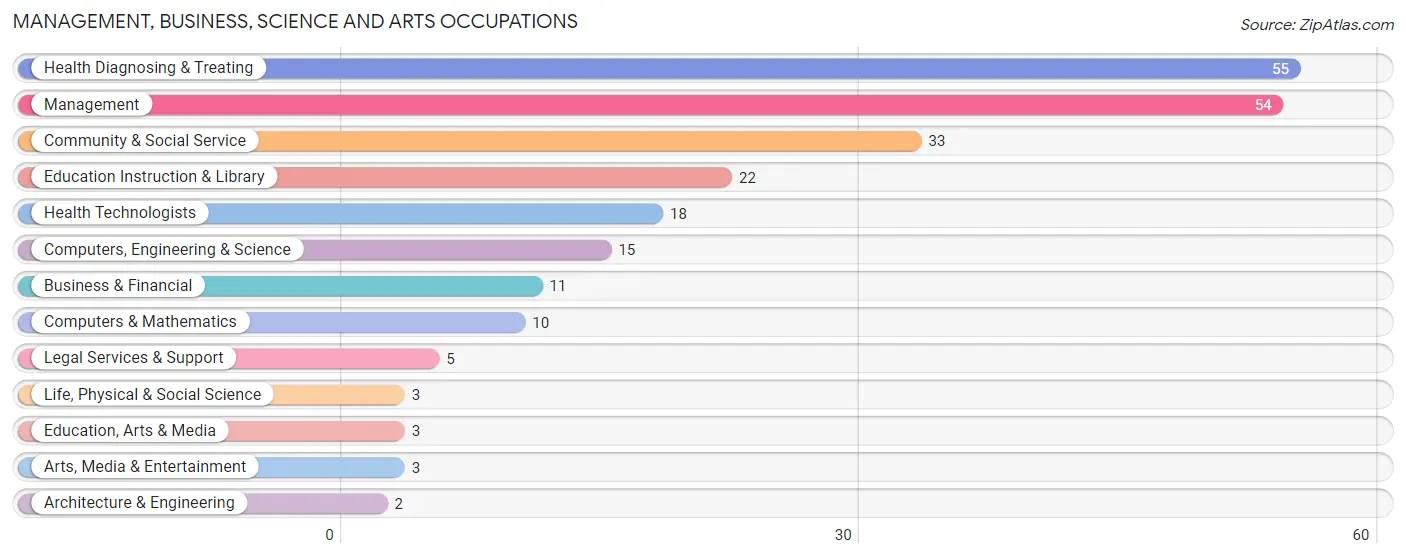
Management, Business, Science and Arts Occupations
The most common Management, Business, Science and Arts occupations in North Enid are Health Diagnosing & Treating (55 | 11.6%), Management (54 | 11.4%), Community & Social Service (33 | 7.0%), Education Instruction & Library (22 | 4.6%), and Health Technologists (18 | 3.8%).
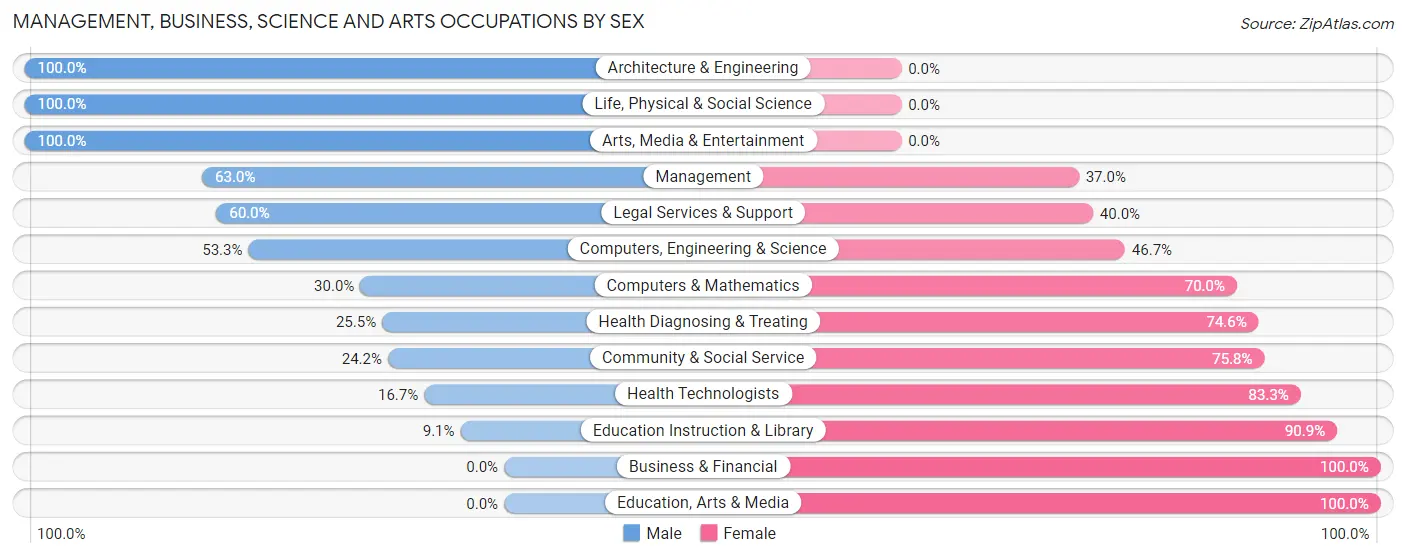
Management, Business, Science and Arts Occupations by Sex
Within the Management, Business, Science and Arts occupations in North Enid, the most male-oriented occupations are Architecture & Engineering (100.0%), Life, Physical & Social Science (100.0%), and Arts, Media & Entertainment (100.0%), while the most female-oriented occupations are Business & Financial (100.0%), Education, Arts & Media (100.0%), and Education Instruction & Library (90.9%).
| Occupation | Male | Female |
| Management | 34 (63.0%) | 20 (37.0%) |
| Business & Financial | 0 (0.0%) | 11 (100.0%) |
| Computers, Engineering & Science | 8 (53.3%) | 7 (46.7%) |
| Computers & Mathematics | 3 (30.0%) | 7 (70.0%) |
| Architecture & Engineering | 2 (100.0%) | 0 (0.0%) |
| Life, Physical & Social Science | 3 (100.0%) | 0 (0.0%) |
| Community & Social Service | 8 (24.2%) | 25 (75.8%) |
| Education, Arts & Media | 0 (0.0%) | 3 (100.0%) |
| Legal Services & Support | 3 (60.0%) | 2 (40.0%) |
| Education Instruction & Library | 2 (9.1%) | 20 (90.9%) |
| Arts, Media & Entertainment | 3 (100.0%) | 0 (0.0%) |
| Health Diagnosing & Treating | 14 (25.5%) | 41 (74.6%) |
| Health Technologists | 3 (16.7%) | 15 (83.3%) |
| Total (Category) | 64 (38.1%) | 104 (61.9%) |
| Total (Overall) | 244 (51.4%) | 231 (48.6%) |
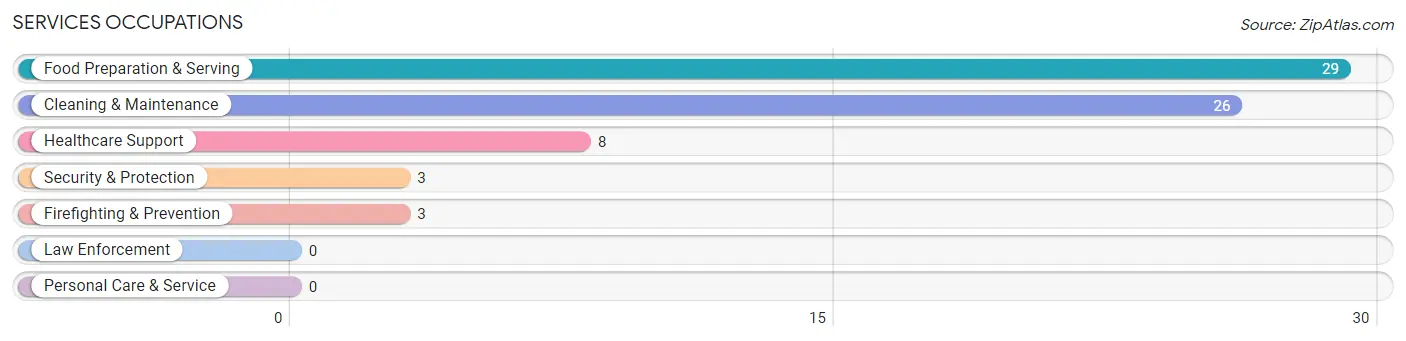
Services Occupations
The most common Services occupations in North Enid are Food Preparation & Serving (29 | 6.1%), Cleaning & Maintenance (26 | 5.5%), Healthcare Support (8 | 1.7%), Security & Protection (3 | 0.6%), and Firefighting & Prevention (3 | 0.6%).
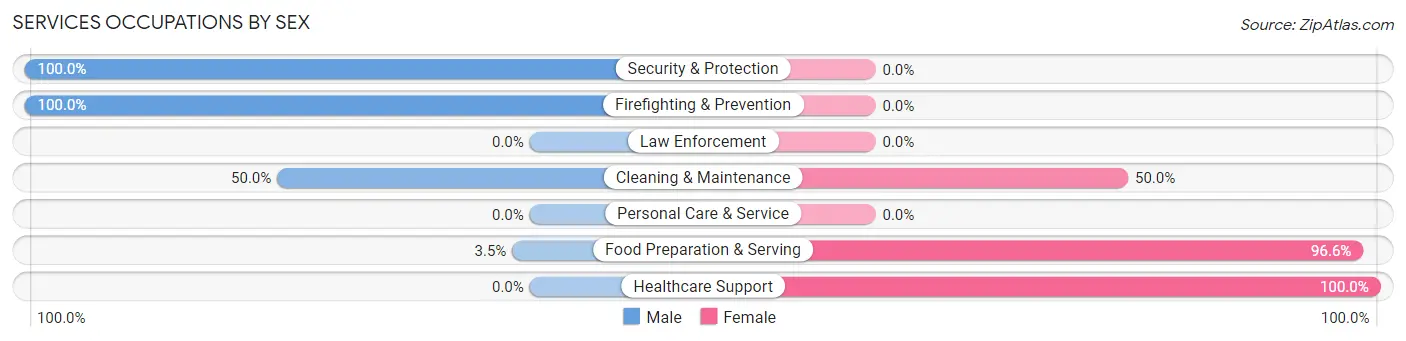
Services Occupations by Sex
Within the Services occupations in North Enid, the most male-oriented occupations are Security & Protection (100.0%), Firefighting & Prevention (100.0%), and Cleaning & Maintenance (50.0%), while the most female-oriented occupations are Healthcare Support (100.0%), Food Preparation & Serving (96.6%), and Cleaning & Maintenance (50.0%).
| Occupation | Male | Female |
| Healthcare Support | 0 (0.0%) | 8 (100.0%) |
| Security & Protection | 3 (100.0%) | 0 (0.0%) |
| Firefighting & Prevention | 3 (100.0%) | 0 (0.0%) |
| Law Enforcement | 0 (0.0%) | 0 (0.0%) |
| Food Preparation & Serving | 1 (3.5%) | 28 (96.6%) |
| Cleaning & Maintenance | 13 (50.0%) | 13 (50.0%) |
| Personal Care & Service | 0 (0.0%) | 0 (0.0%) |
| Total (Category) | 17 (25.8%) | 49 (74.2%) |
| Total (Overall) | 244 (51.4%) | 231 (48.6%) |
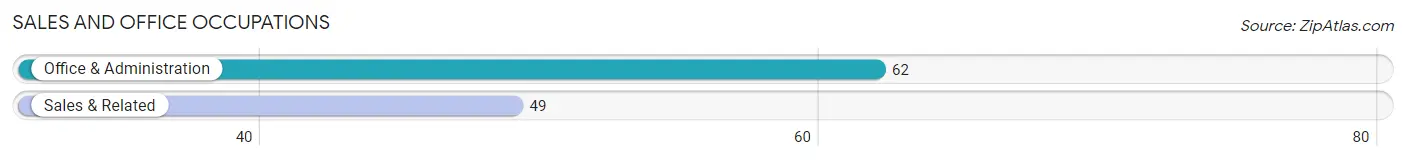
Sales and Office Occupations
The most common Sales and Office occupations in North Enid are Office & Administration (62 | 13.1%), and Sales & Related (49 | 10.3%).
Sales and Office Occupations by Sex
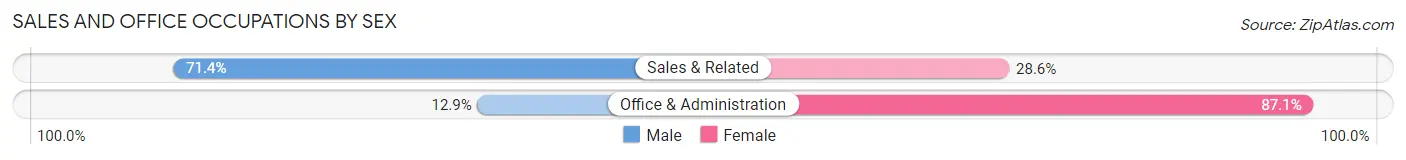
| Occupation | Male | Female |
| Sales & Related | 35 (71.4%) | 14 (28.6%) |
| Office & Administration | 8 (12.9%) | 54 (87.1%) |
| Total (Category) | 43 (38.7%) | 68 (61.3%) |
| Total (Overall) | 244 (51.4%) | 231 (48.6%) |
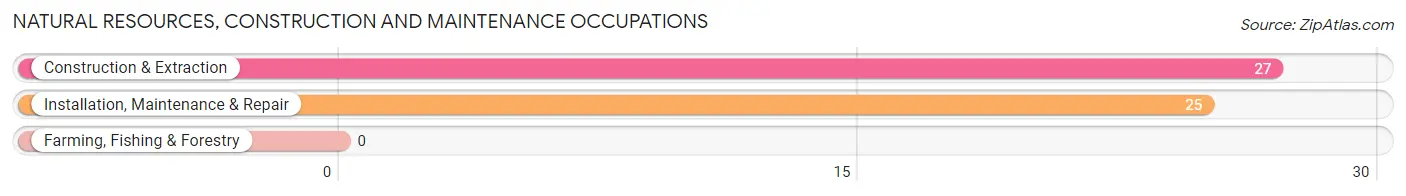
Natural Resources, Construction and Maintenance Occupations
The most common Natural Resources, Construction and Maintenance occupations in North Enid are Construction & Extraction (27 | 5.7%), and Installation, Maintenance & Repair (25 | 5.3%).
Natural Resources, Construction and Maintenance Occupations by Sex
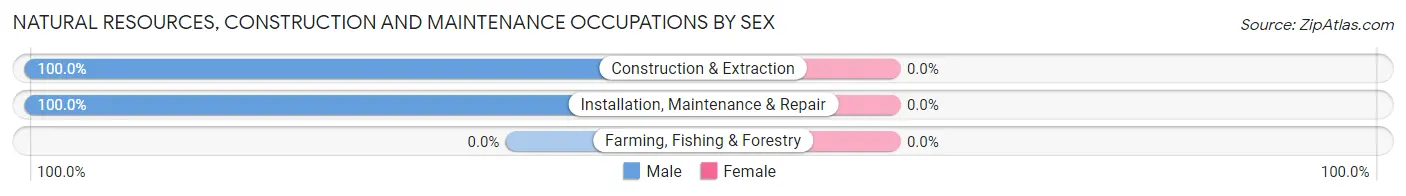
| Occupation | Male | Female |
| Farming, Fishing & Forestry | 0 (0.0%) | 0 (0.0%) |
| Construction & Extraction | 27 (100.0%) | 0 (0.0%) |
| Installation, Maintenance & Repair | 25 (100.0%) | 0 (0.0%) |
| Total (Category) | 52 (100.0%) | 0 (0.0%) |
| Total (Overall) | 244 (51.4%) | 231 (48.6%) |
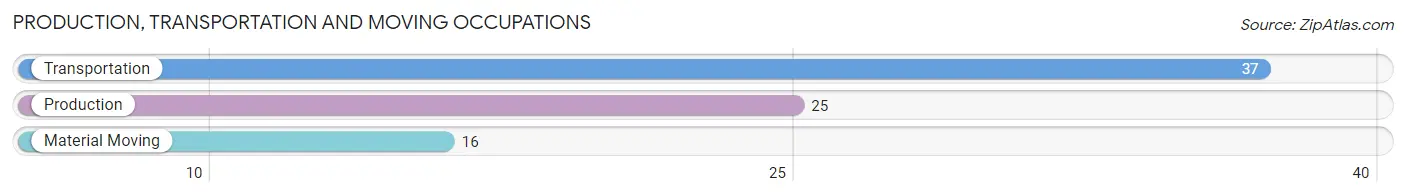
Production, Transportation and Moving Occupations
The most common Production, Transportation and Moving occupations in North Enid are Transportation (37 | 7.8%), Production (25 | 5.3%), and Material Moving (16 | 3.4%).
Production, Transportation and Moving Occupations by Sex
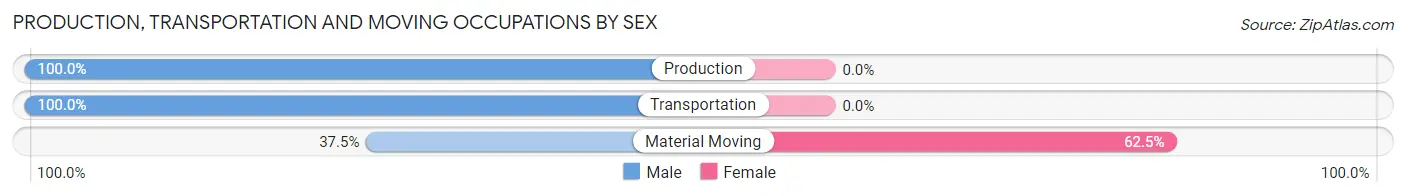
| Occupation | Male | Female |
| Production | 25 (100.0%) | 0 (0.0%) |
| Transportation | 37 (100.0%) | 0 (0.0%) |
| Material Moving | 6 (37.5%) | 10 (62.5%) |
| Total (Category) | 68 (87.2%) | 10 (12.8%) |
| Total (Overall) | 244 (51.4%) | 231 (48.6%) |
Employment Industries by Sex in North Enid
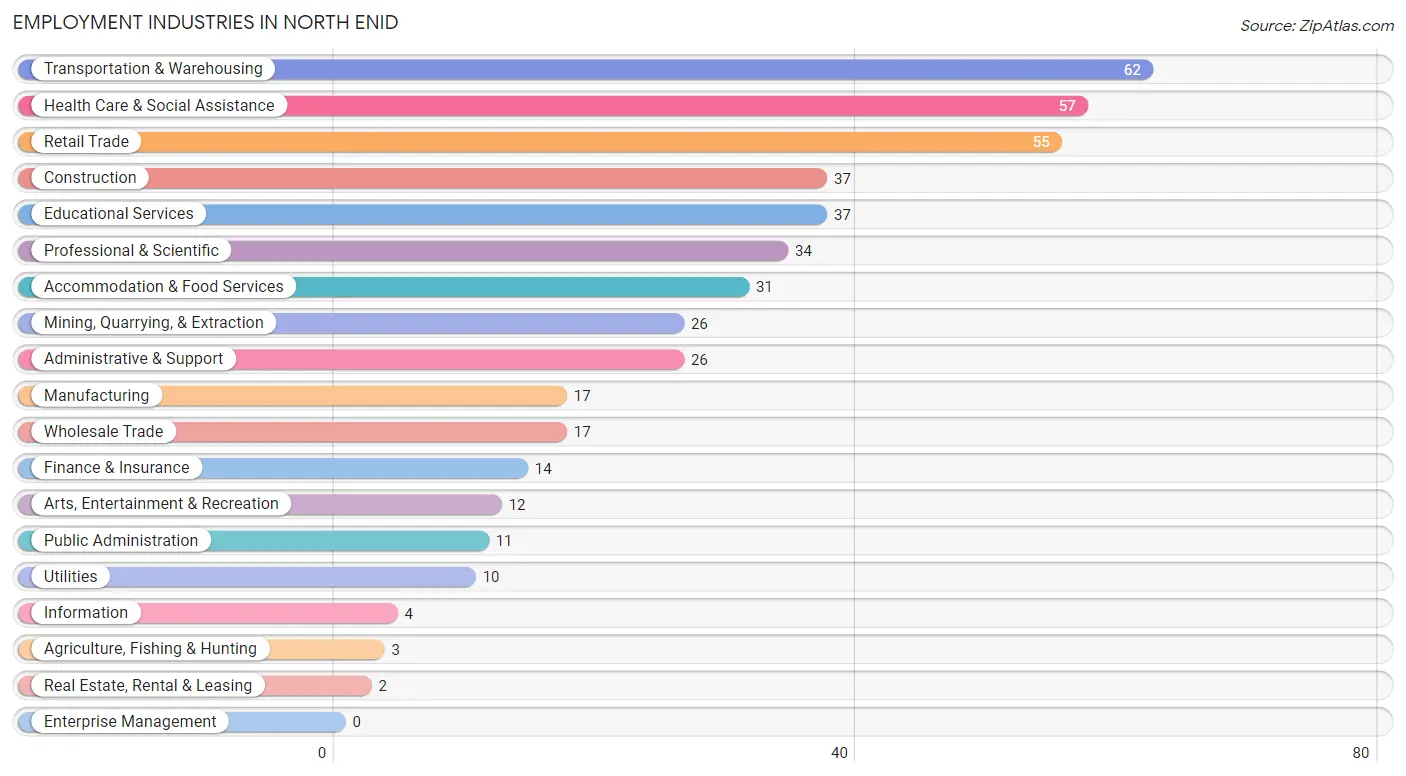
Employment Industries in North Enid
The major employment industries in North Enid include Transportation & Warehousing (62 | 13.1%), Health Care & Social Assistance (57 | 12.0%), Retail Trade (55 | 11.6%), Construction (37 | 7.8%), and Educational Services (37 | 7.8%).
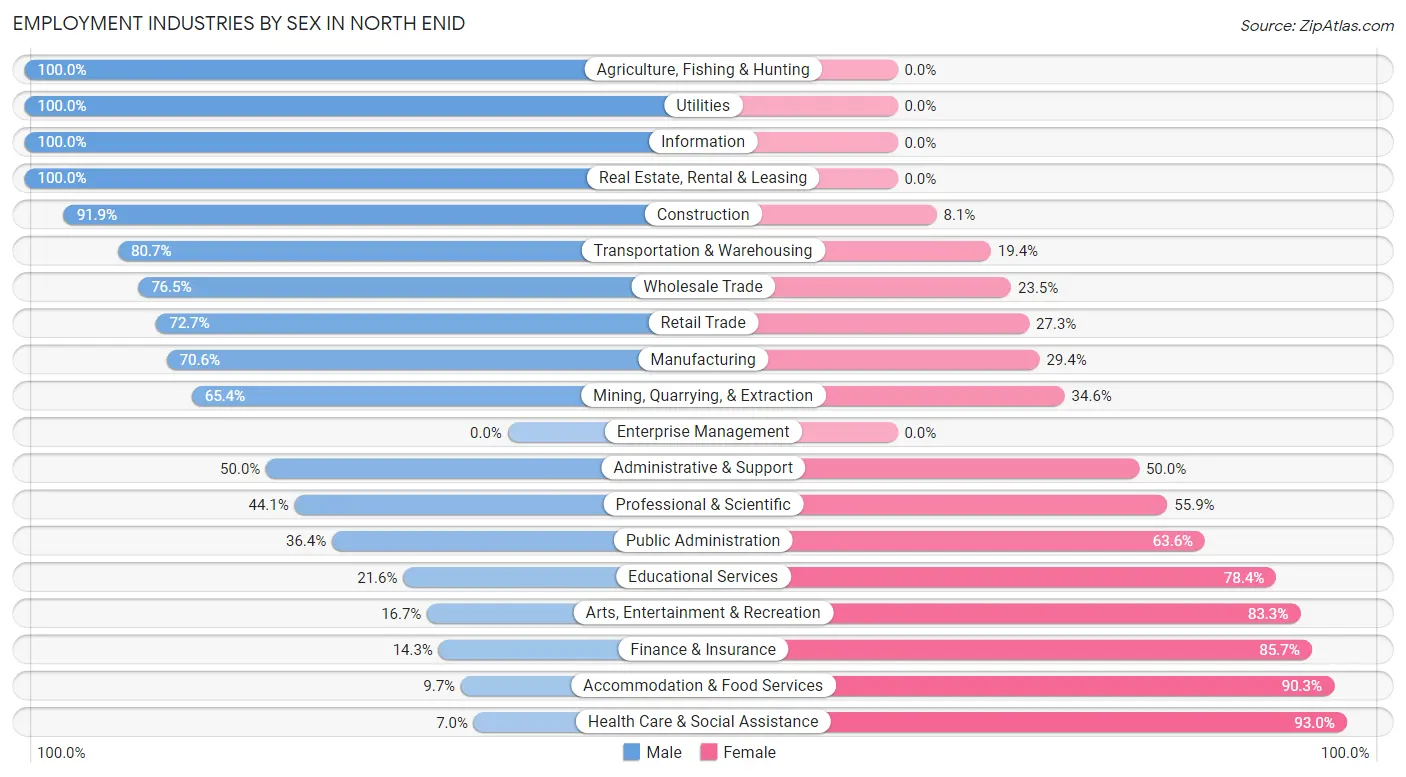
Employment Industries by Sex in North Enid
The North Enid industries that see more men than women are Agriculture, Fishing & Hunting (100.0%), Utilities (100.0%), and Information (100.0%), whereas the industries that tend to have a higher number of women are Health Care & Social Assistance (93.0%), Accommodation & Food Services (90.3%), and Finance & Insurance (85.7%).
| Industry | Male | Female |
| Agriculture, Fishing & Hunting | 3 (100.0%) | 0 (0.0%) |
| Mining, Quarrying, & Extraction | 17 (65.4%) | 9 (34.6%) |
| Construction | 34 (91.9%) | 3 (8.1%) |
| Manufacturing | 12 (70.6%) | 5 (29.4%) |
| Wholesale Trade | 13 (76.5%) | 4 (23.5%) |
| Retail Trade | 40 (72.7%) | 15 (27.3%) |
| Transportation & Warehousing | 50 (80.6%) | 12 (19.4%) |
| Utilities | 10 (100.0%) | 0 (0.0%) |
| Information | 4 (100.0%) | 0 (0.0%) |
| Finance & Insurance | 2 (14.3%) | 12 (85.7%) |
| Real Estate, Rental & Leasing | 2 (100.0%) | 0 (0.0%) |
| Professional & Scientific | 15 (44.1%) | 19 (55.9%) |
| Enterprise Management | 0 (0.0%) | 0 (0.0%) |
| Administrative & Support | 13 (50.0%) | 13 (50.0%) |
| Educational Services | 8 (21.6%) | 29 (78.4%) |
| Health Care & Social Assistance | 4 (7.0%) | 53 (93.0%) |
| Arts, Entertainment & Recreation | 2 (16.7%) | 10 (83.3%) |
| Accommodation & Food Services | 3 (9.7%) | 28 (90.3%) |
| Public Administration | 4 (36.4%) | 7 (63.6%) |
| Total | 244 (51.4%) | 231 (48.6%) |
Education in North Enid
School Enrollment in North Enid
The most common levels of schooling among the 262 students in North Enid are middle school (88 | 33.6%), high school (72 | 27.5%), and elementary school (48 | 18.3%).
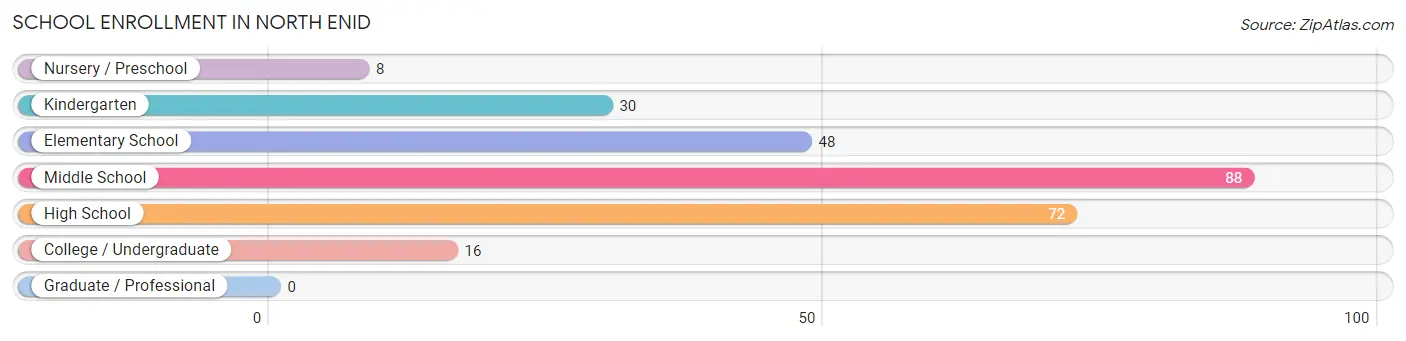
| School Level | # Students | % Students |
| Nursery / Preschool | 8 | 3.0% |
| Kindergarten | 30 | 11.5% |
| Elementary School | 48 | 18.3% |
| Middle School | 88 | 33.6% |
| High School | 72 | 27.5% |
| College / Undergraduate | 16 | 6.1% |
| Graduate / Professional | 0 | 0.0% |
| Total | 262 | 100.0% |
School Enrollment by Age by Funding Source in North Enid
Out of a total of 262 students who are enrolled in schools in North Enid, 2 (0.8%) attend a private institution, while the remaining 260 (99.2%) are enrolled in public schools. The age group of 3 to 4 year olds has the highest likelihood of being enrolled in private schools, with 1 (25.0% in the age bracket) enrolled. Conversely, the age group of 10 to 14 year olds has the lowest likelihood of being enrolled in a private school, with 113 (100.0% in the age bracket) attending a public institution.
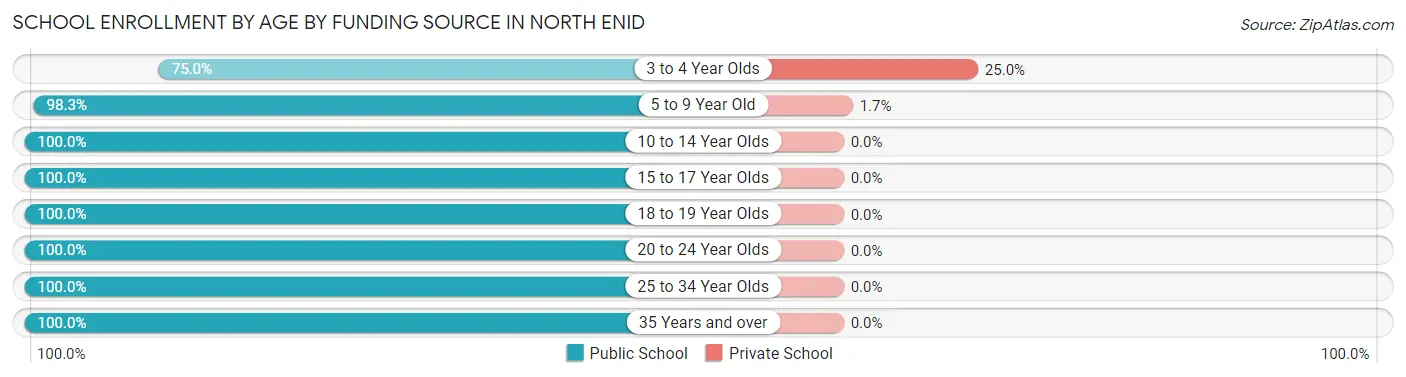
| Age Bracket | Public School | Private School |
| 3 to 4 Year Olds | 3 (75.0%) | 1 (25.0%) |
| 5 to 9 Year Old | 58 (98.3%) | 1 (1.7%) |
| 10 to 14 Year Olds | 113 (100.0%) | 0 (0.0%) |
| 15 to 17 Year Olds | 59 (100.0%) | 0 (0.0%) |
| 18 to 19 Year Olds | 11 (100.0%) | 0 (0.0%) |
| 20 to 24 Year Olds | 4 (100.0%) | 0 (0.0%) |
| 25 to 34 Year Olds | 4 (100.0%) | 0 (0.0%) |
| 35 Years and over | 8 (100.0%) | 0 (0.0%) |
| Total | 260 (99.2%) | 2 (0.8%) |
Educational Attainment by Field of Study in North Enid
Business (33 | 28.2%), education (16 | 13.7%), computers & mathematics (15 | 12.8%), science & technology (12 | 10.3%), and social sciences (8 | 6.8%) are the most common fields of study among 117 individuals in North Enid who have obtained a bachelor's degree or higher.
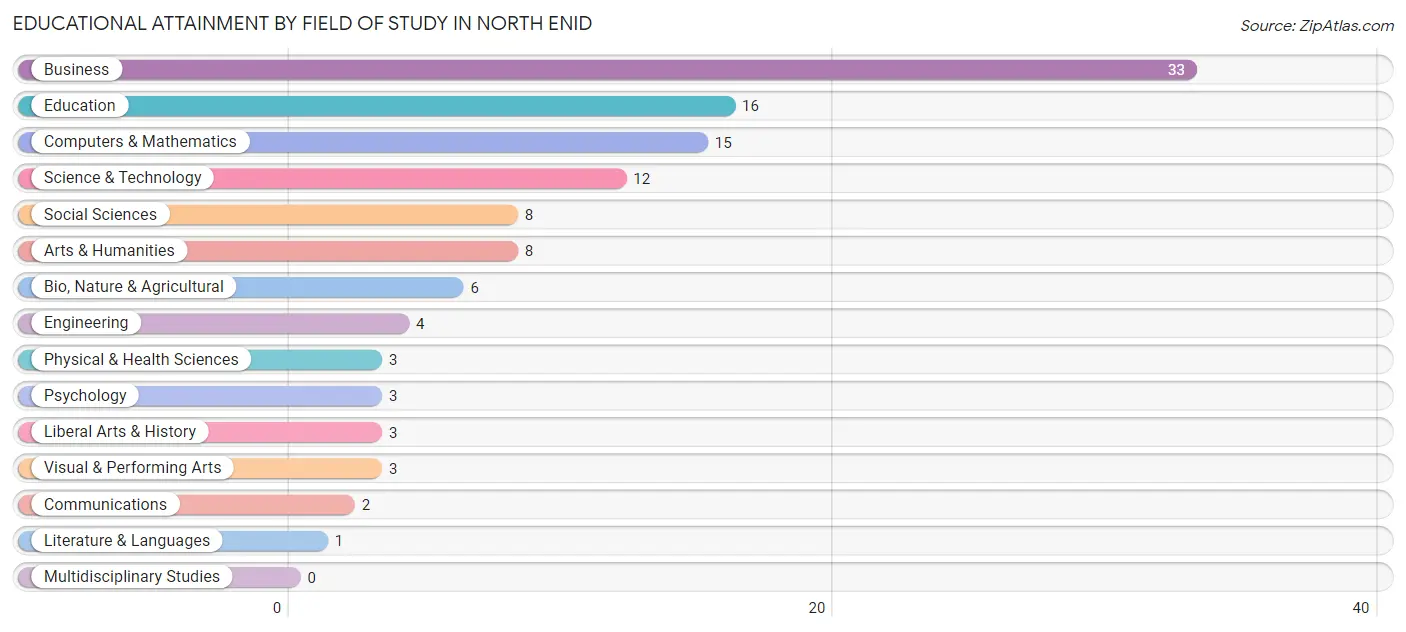
| Field of Study | # Graduates | % Graduates |
| Computers & Mathematics | 15 | 12.8% |
| Bio, Nature & Agricultural | 6 | 5.1% |
| Physical & Health Sciences | 3 | 2.6% |
| Psychology | 3 | 2.6% |
| Social Sciences | 8 | 6.8% |
| Engineering | 4 | 3.4% |
| Multidisciplinary Studies | 0 | 0.0% |
| Science & Technology | 12 | 10.3% |
| Business | 33 | 28.2% |
| Education | 16 | 13.7% |
| Literature & Languages | 1 | 0.9% |
| Liberal Arts & History | 3 | 2.6% |
| Visual & Performing Arts | 3 | 2.6% |
| Communications | 2 | 1.7% |
| Arts & Humanities | 8 | 6.8% |
| Total | 117 | 100.0% |
Transportation & Commute in North Enid
Vehicle Availability by Sex in North Enid
The most prevalent vehicle ownership categories in North Enid are males with 2 vehicles (108, accounting for 43.4%) and females with 2 vehicles (84, making up 51.7%).
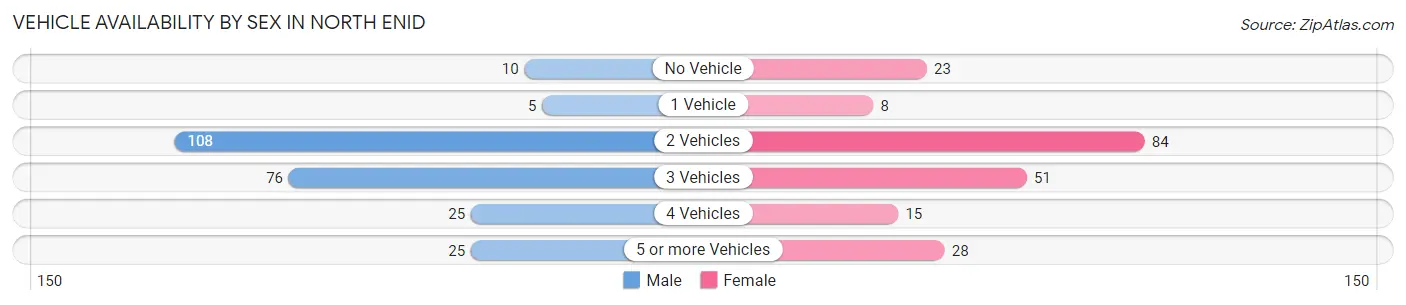
| Vehicles Available | Male | Female |
| No Vehicle | 10 (4.0%) | 23 (11.0%) |
| 1 Vehicle | 5 (2.0%) | 8 (3.8%) |
| 2 Vehicles | 108 (43.4%) | 84 (40.2%) |
| 3 Vehicles | 76 (30.5%) | 51 (24.4%) |
| 4 Vehicles | 25 (10.0%) | 15 (7.2%) |
| 5 or more Vehicles | 25 (10.0%) | 28 (13.4%) |
| Total | 249 (100.0%) | 209 (100.0%) |
Commute Time in North Enid
The most frequently occuring commute durations in North Enid are 10 to 14 minutes (115 commuters, 26.4%), 5 to 9 minutes (109 commuters, 25.0%), and 15 to 19 minutes (91 commuters, 20.9%).
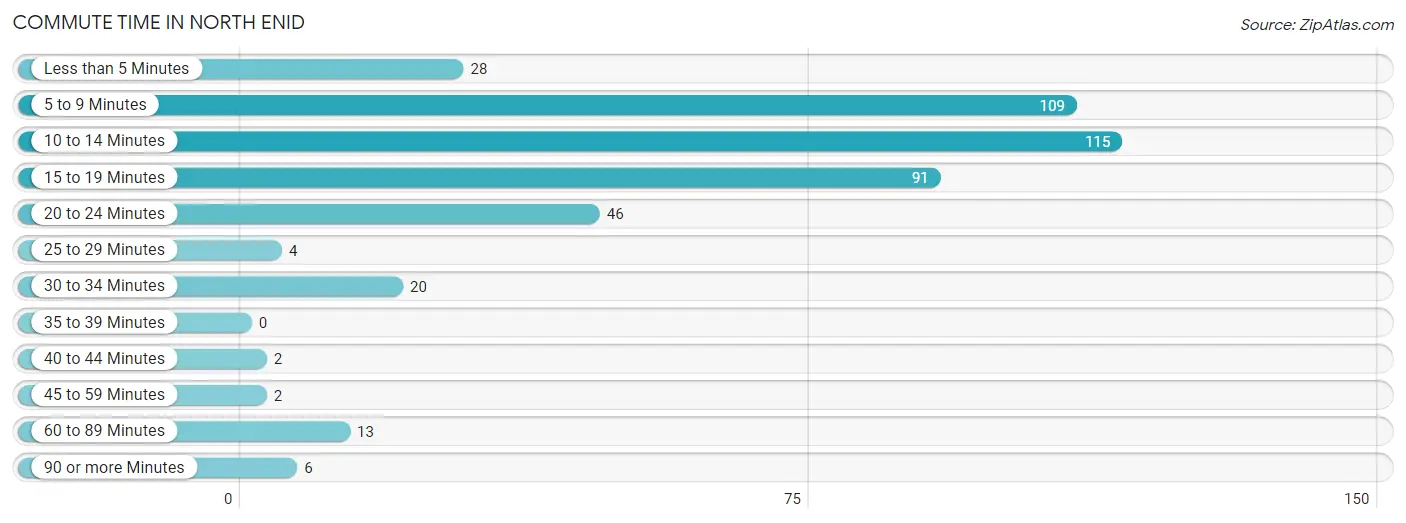
| Commute Time | # Commuters | % Commuters |
| Less than 5 Minutes | 28 | 6.4% |
| 5 to 9 Minutes | 109 | 25.0% |
| 10 to 14 Minutes | 115 | 26.4% |
| 15 to 19 Minutes | 91 | 20.9% |
| 20 to 24 Minutes | 46 | 10.5% |
| 25 to 29 Minutes | 4 | 0.9% |
| 30 to 34 Minutes | 20 | 4.6% |
| 35 to 39 Minutes | 0 | 0.0% |
| 40 to 44 Minutes | 2 | 0.5% |
| 45 to 59 Minutes | 2 | 0.5% |
| 60 to 89 Minutes | 13 | 3.0% |
| 90 or more Minutes | 6 | 1.4% |
Commute Time by Sex in North Enid
The most common commute times in North Enid are 10 to 14 minutes (56 commuters, 23.1%) for males and 10 to 14 minutes (59 commuters, 30.4%) for females.
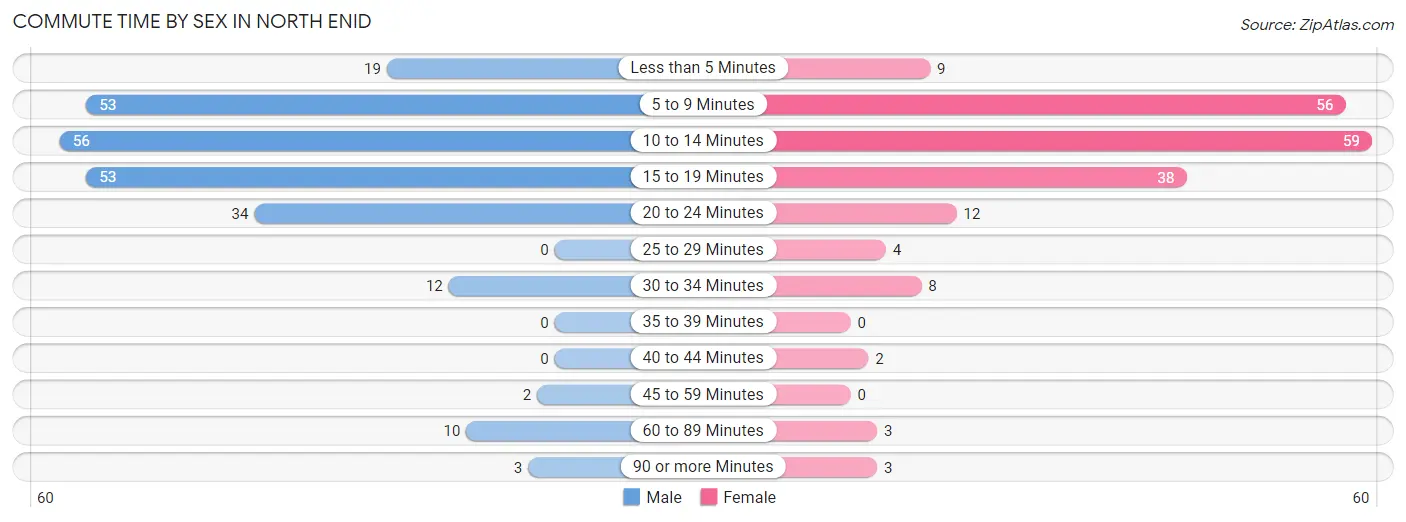
| Commute Time | Male | Female |
| Less than 5 Minutes | 19 (7.9%) | 9 (4.6%) |
| 5 to 9 Minutes | 53 (21.9%) | 56 (28.9%) |
| 10 to 14 Minutes | 56 (23.1%) | 59 (30.4%) |
| 15 to 19 Minutes | 53 (21.9%) | 38 (19.6%) |
| 20 to 24 Minutes | 34 (14.1%) | 12 (6.2%) |
| 25 to 29 Minutes | 0 (0.0%) | 4 (2.1%) |
| 30 to 34 Minutes | 12 (5.0%) | 8 (4.1%) |
| 35 to 39 Minutes | 0 (0.0%) | 0 (0.0%) |
| 40 to 44 Minutes | 0 (0.0%) | 2 (1.0%) |
| 45 to 59 Minutes | 2 (0.8%) | 0 (0.0%) |
| 60 to 89 Minutes | 10 (4.1%) | 3 (1.5%) |
| 90 or more Minutes | 3 (1.2%) | 3 (1.5%) |
Time of Departure to Work by Sex in North Enid
The most frequent times of departure to work in North Enid are 8:00 AM to 8:29 AM (52, 21.5%) for males and 7:30 AM to 7:59 AM (35, 18.0%) for females.
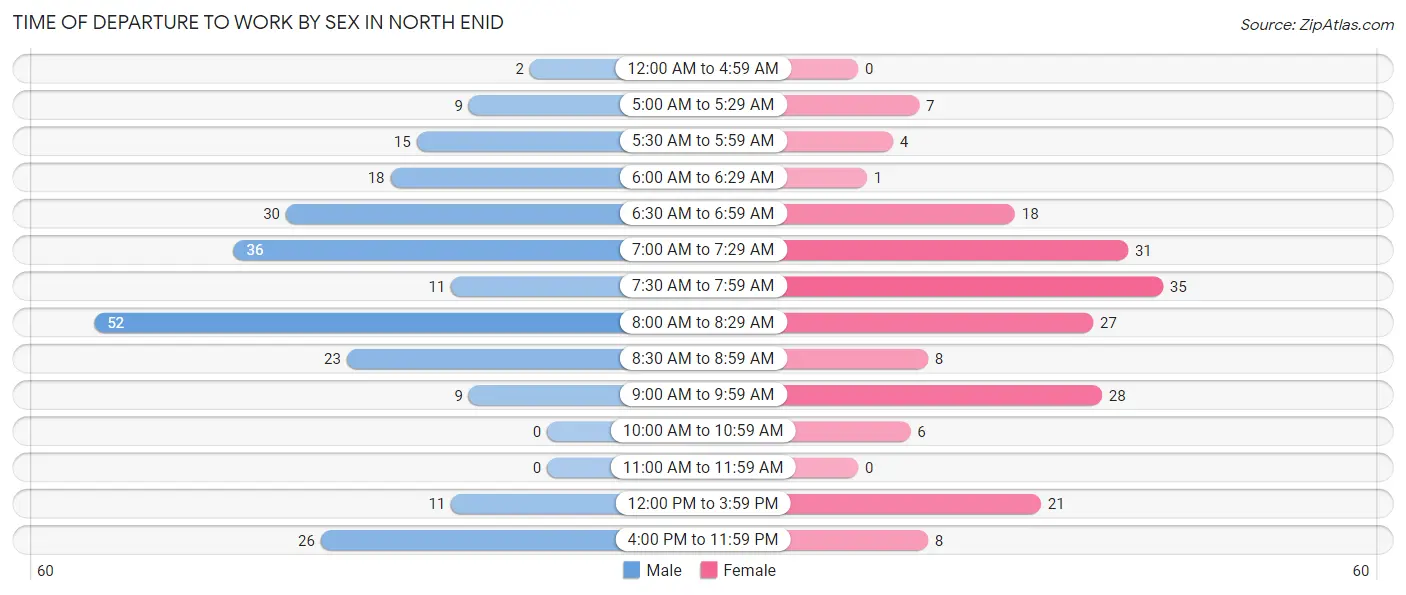
| Time of Departure | Male | Female |
| 12:00 AM to 4:59 AM | 2 (0.8%) | 0 (0.0%) |
| 5:00 AM to 5:29 AM | 9 (3.7%) | 7 (3.6%) |
| 5:30 AM to 5:59 AM | 15 (6.2%) | 4 (2.1%) |
| 6:00 AM to 6:29 AM | 18 (7.4%) | 1 (0.5%) |
| 6:30 AM to 6:59 AM | 30 (12.4%) | 18 (9.3%) |
| 7:00 AM to 7:29 AM | 36 (14.9%) | 31 (16.0%) |
| 7:30 AM to 7:59 AM | 11 (4.5%) | 35 (18.0%) |
| 8:00 AM to 8:29 AM | 52 (21.5%) | 27 (13.9%) |
| 8:30 AM to 8:59 AM | 23 (9.5%) | 8 (4.1%) |
| 9:00 AM to 9:59 AM | 9 (3.7%) | 28 (14.4%) |
| 10:00 AM to 10:59 AM | 0 (0.0%) | 6 (3.1%) |
| 11:00 AM to 11:59 AM | 0 (0.0%) | 0 (0.0%) |
| 12:00 PM to 3:59 PM | 11 (4.5%) | 21 (10.8%) |
| 4:00 PM to 11:59 PM | 26 (10.7%) | 8 (4.1%) |
| Total | 242 (100.0%) | 194 (100.0%) |
Housing Occupancy in North Enid
Occupancy by Ownership in North Enid
Of the total 354 dwellings in North Enid, owner-occupied units account for 326 (92.1%), while renter-occupied units make up 28 (7.9%).
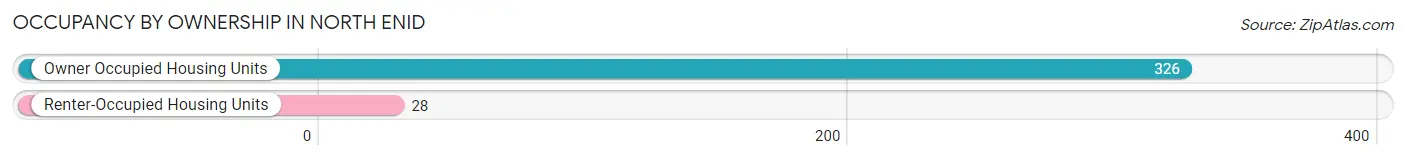
| Occupancy | # Housing Units | % Housing Units |
| Owner Occupied Housing Units | 326 | 92.1% |
| Renter-Occupied Housing Units | 28 | 7.9% |
| Total Occupied Housing Units | 354 | 100.0% |
Occupancy by Household Size in North Enid
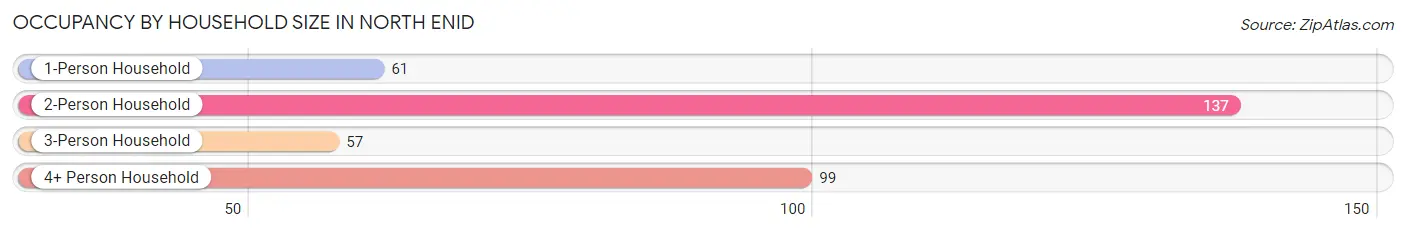
| Household Size | # Housing Units | % Housing Units |
| 1-Person Household | 61 | 17.2% |
| 2-Person Household | 137 | 38.7% |
| 3-Person Household | 57 | 16.1% |
| 4+ Person Household | 99 | 28.0% |
| Total Housing Units | 354 | 100.0% |
Occupancy by Ownership by Household Size in North Enid
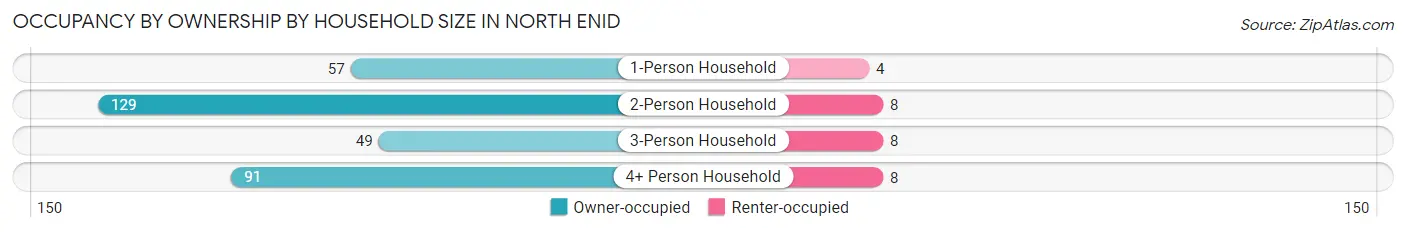
| Household Size | Owner-occupied | Renter-occupied |
| 1-Person Household | 57 (93.4%) | 4 (6.6%) |
| 2-Person Household | 129 (94.2%) | 8 (5.8%) |
| 3-Person Household | 49 (86.0%) | 8 (14.0%) |
| 4+ Person Household | 91 (91.9%) | 8 (8.1%) |
| Total Housing Units | 326 (92.1%) | 28 (7.9%) |
Occupancy by Educational Attainment in North Enid
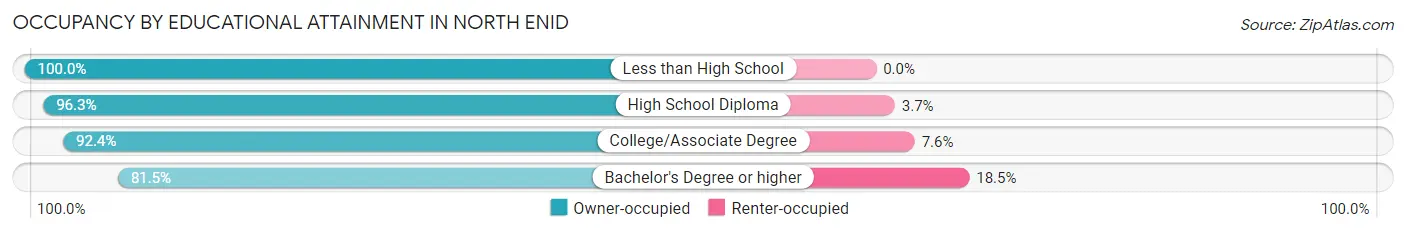
| Household Size | Owner-occupied | Renter-occupied |
| Less than High School | 10 (100.0%) | 0 (0.0%) |
| High School Diploma | 130 (96.3%) | 5 (3.7%) |
| College/Associate Degree | 133 (92.4%) | 11 (7.6%) |
| Bachelor's Degree or higher | 53 (81.5%) | 12 (18.5%) |
Occupancy by Age of Householder in North Enid
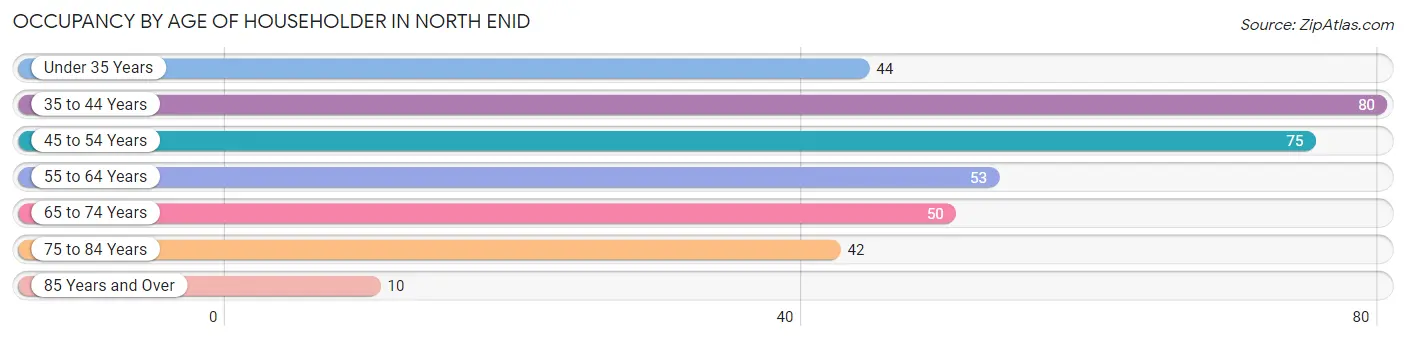
| Age Bracket | # Households | % Households |
| Under 35 Years | 44 | 12.4% |
| 35 to 44 Years | 80 | 22.6% |
| 45 to 54 Years | 75 | 21.2% |
| 55 to 64 Years | 53 | 15.0% |
| 65 to 74 Years | 50 | 14.1% |
| 75 to 84 Years | 42 | 11.9% |
| 85 Years and Over | 10 | 2.8% |
| Total | 354 | 100.0% |
Housing Finances in North Enid
Median Income by Occupancy in North Enid
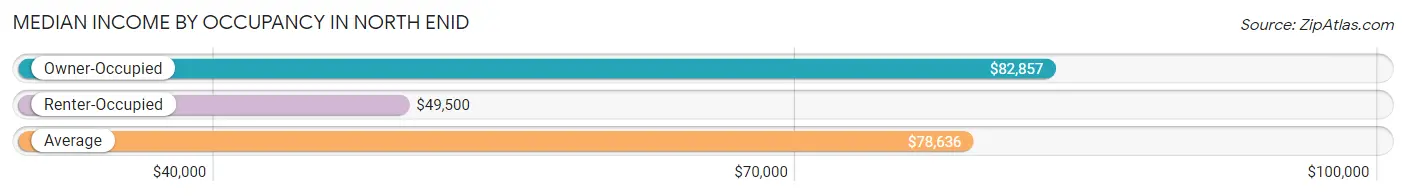
| Occupancy Type | # Households | Median Income |
| Owner-Occupied | 326 (92.1%) | $82,857 |
| Renter-Occupied | 28 (7.9%) | $49,500 |
| Average | 354 (100.0%) | $78,636 |
Occupancy by Householder Income Bracket in North Enid
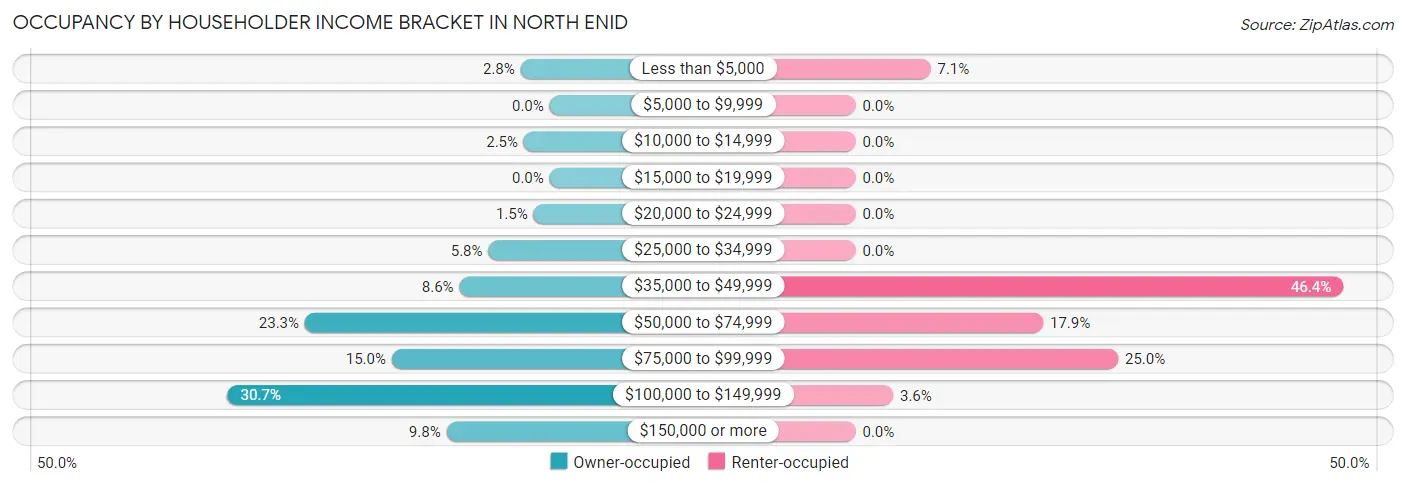
| Income Bracket | Owner-occupied | Renter-occupied |
| Less than $5,000 | 9 (2.8%) | 2 (7.1%) |
| $5,000 to $9,999 | 0 (0.0%) | 0 (0.0%) |
| $10,000 to $14,999 | 8 (2.5%) | 0 (0.0%) |
| $15,000 to $19,999 | 0 (0.0%) | 0 (0.0%) |
| $20,000 to $24,999 | 5 (1.5%) | 0 (0.0%) |
| $25,000 to $34,999 | 19 (5.8%) | 0 (0.0%) |
| $35,000 to $49,999 | 28 (8.6%) | 13 (46.4%) |
| $50,000 to $74,999 | 76 (23.3%) | 5 (17.9%) |
| $75,000 to $99,999 | 49 (15.0%) | 7 (25.0%) |
| $100,000 to $149,999 | 100 (30.7%) | 1 (3.6%) |
| $150,000 or more | 32 (9.8%) | 0 (0.0%) |
| Total | 326 (100.0%) | 28 (100.0%) |
Monthly Housing Cost Tiers in North Enid
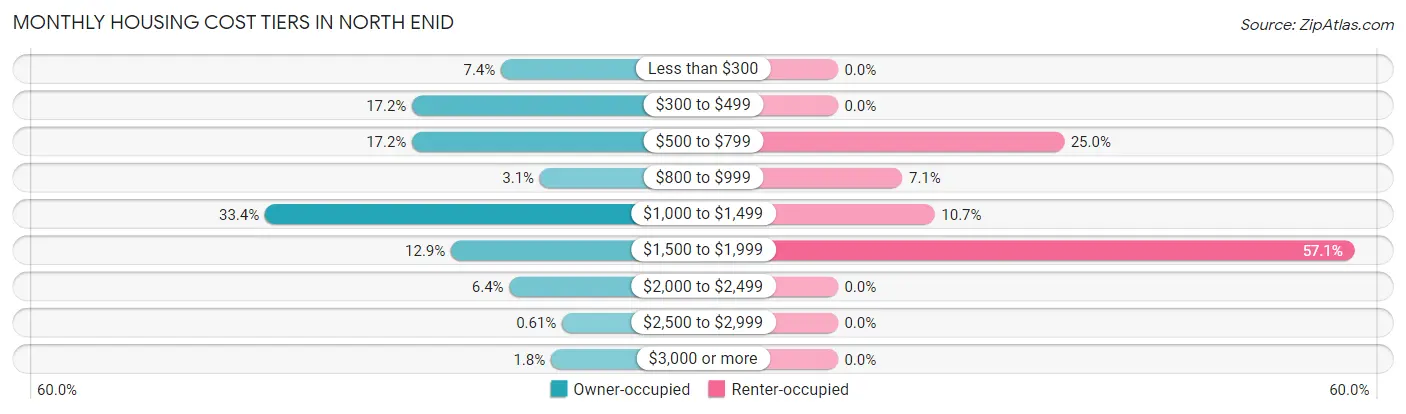
| Monthly Cost | Owner-occupied | Renter-occupied |
| Less than $300 | 24 (7.4%) | 0 (0.0%) |
| $300 to $499 | 56 (17.2%) | 0 (0.0%) |
| $500 to $799 | 56 (17.2%) | 7 (25.0%) |
| $800 to $999 | 10 (3.1%) | 2 (7.1%) |
| $1,000 to $1,499 | 109 (33.4%) | 3 (10.7%) |
| $1,500 to $1,999 | 42 (12.9%) | 16 (57.1%) |
| $2,000 to $2,499 | 21 (6.4%) | 0 (0.0%) |
| $2,500 to $2,999 | 2 (0.6%) | 0 (0.0%) |
| $3,000 or more | 6 (1.8%) | 0 (0.0%) |
| Total | 326 (100.0%) | 28 (100.0%) |
Physical Housing Characteristics in North Enid
Housing Structures in North Enid
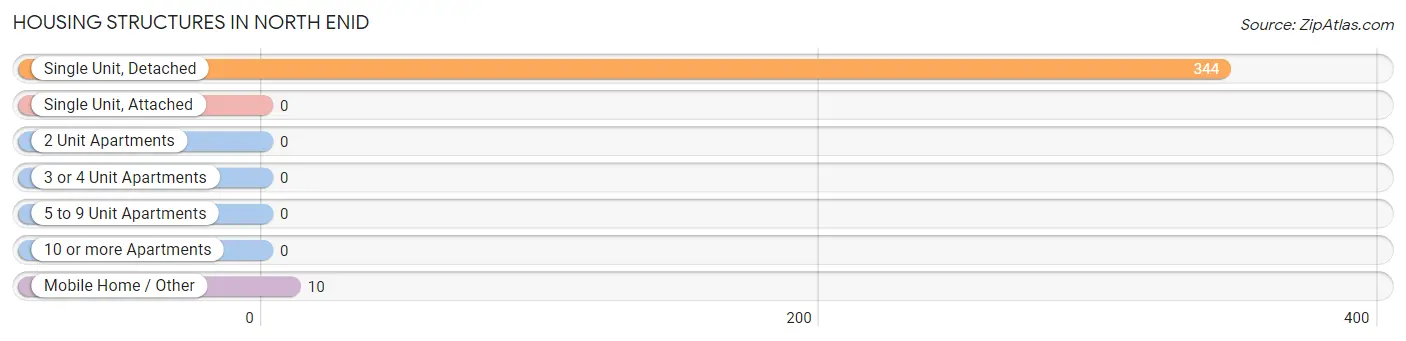
| Structure Type | # Housing Units | % Housing Units |
| Single Unit, Detached | 344 | 97.2% |
| Single Unit, Attached | 0 | 0.0% |
| 2 Unit Apartments | 0 | 0.0% |
| 3 or 4 Unit Apartments | 0 | 0.0% |
| 5 to 9 Unit Apartments | 0 | 0.0% |
| 10 or more Apartments | 0 | 0.0% |
| Mobile Home / Other | 10 | 2.8% |
| Total | 354 | 100.0% |
Housing Structures by Occupancy in North Enid
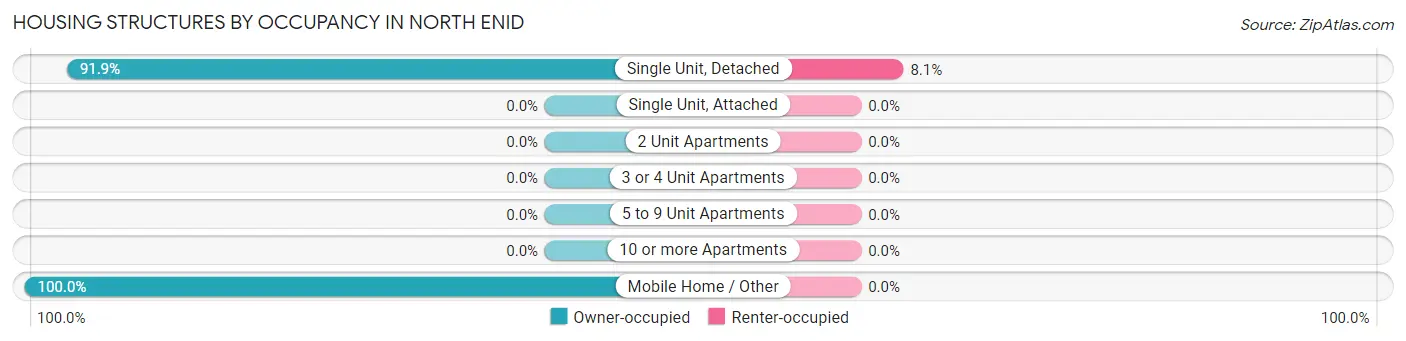
| Structure Type | Owner-occupied | Renter-occupied |
| Single Unit, Detached | 316 (91.9%) | 28 (8.1%) |
| Single Unit, Attached | 0 (0.0%) | 0 (0.0%) |
| 2 Unit Apartments | 0 (0.0%) | 0 (0.0%) |
| 3 or 4 Unit Apartments | 0 (0.0%) | 0 (0.0%) |
| 5 to 9 Unit Apartments | 0 (0.0%) | 0 (0.0%) |
| 10 or more Apartments | 0 (0.0%) | 0 (0.0%) |
| Mobile Home / Other | 10 (100.0%) | 0 (0.0%) |
| Total | 326 (92.1%) | 28 (7.9%) |
Housing Structures by Number of Rooms in North Enid
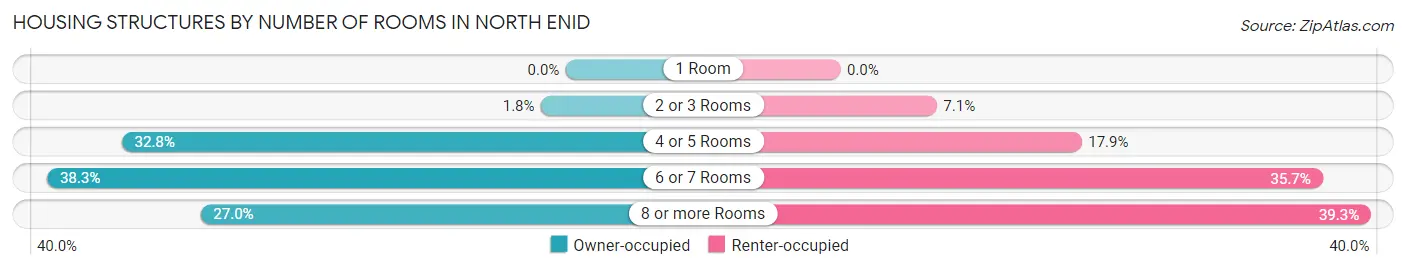
| Number of Rooms | Owner-occupied | Renter-occupied |
| 1 Room | 0 (0.0%) | 0 (0.0%) |
| 2 or 3 Rooms | 6 (1.8%) | 2 (7.1%) |
| 4 or 5 Rooms | 107 (32.8%) | 5 (17.9%) |
| 6 or 7 Rooms | 125 (38.3%) | 10 (35.7%) |
| 8 or more Rooms | 88 (27.0%) | 11 (39.3%) |
| Total | 326 (100.0%) | 28 (100.0%) |
Housing Structure by Heating Type in North Enid
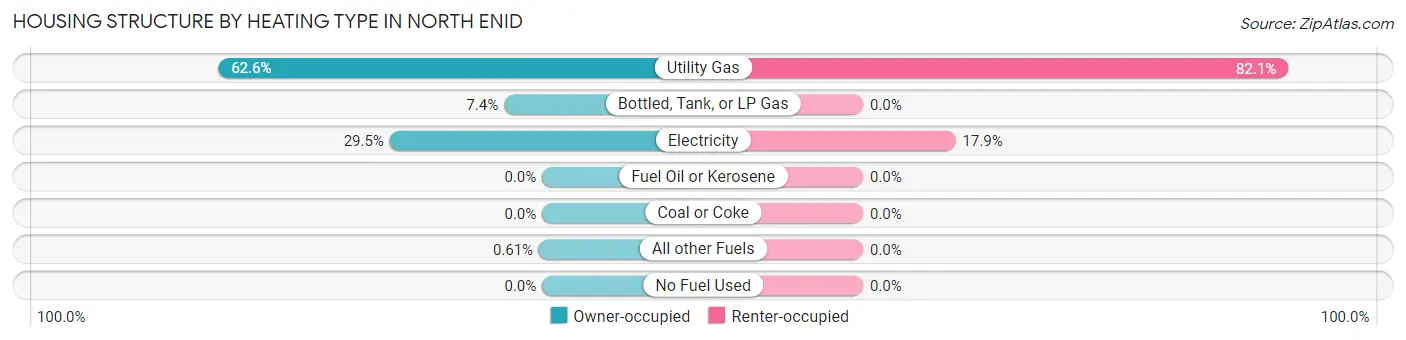
| Heating Type | Owner-occupied | Renter-occupied |
| Utility Gas | 204 (62.6%) | 23 (82.1%) |
| Bottled, Tank, or LP Gas | 24 (7.4%) | 0 (0.0%) |
| Electricity | 96 (29.4%) | 5 (17.9%) |
| Fuel Oil or Kerosene | 0 (0.0%) | 0 (0.0%) |
| Coal or Coke | 0 (0.0%) | 0 (0.0%) |
| All other Fuels | 2 (0.6%) | 0 (0.0%) |
| No Fuel Used | 0 (0.0%) | 0 (0.0%) |
| Total | 326 (100.0%) | 28 (100.0%) |
Household Vehicle Usage in North Enid
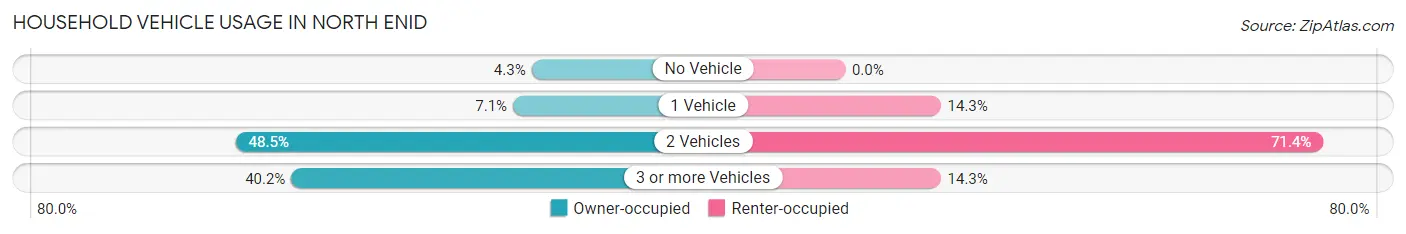
| Vehicles per Household | Owner-occupied | Renter-occupied |
| No Vehicle | 14 (4.3%) | 0 (0.0%) |
| 1 Vehicle | 23 (7.1%) | 4 (14.3%) |
| 2 Vehicles | 158 (48.5%) | 20 (71.4%) |
| 3 or more Vehicles | 131 (40.2%) | 4 (14.3%) |
| Total | 326 (100.0%) | 28 (100.0%) |
Real Estate & Mortgages in North Enid
Real Estate and Mortgage Overview in North Enid
| Characteristic | Without Mortgage | With Mortgage |
| Housing Units | 135 | 191 |
| Median Property Value | $177,200 | $181,900 |
| Median Household Income | $64,688 | $29 |
| Monthly Housing Costs | $448 | $6 |
| Real Estate Taxes | $1,237 | $16 |
Property Value by Mortgage Status in North Enid
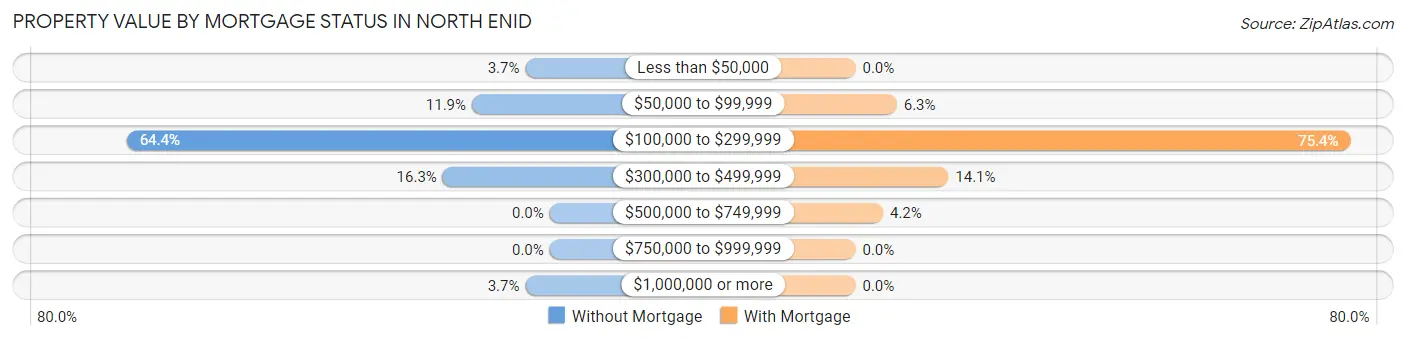
| Property Value | Without Mortgage | With Mortgage |
| Less than $50,000 | 5 (3.7%) | 0 (0.0%) |
| $50,000 to $99,999 | 16 (11.8%) | 12 (6.3%) |
| $100,000 to $299,999 | 87 (64.4%) | 144 (75.4%) |
| $300,000 to $499,999 | 22 (16.3%) | 27 (14.1%) |
| $500,000 to $749,999 | 0 (0.0%) | 8 (4.2%) |
| $750,000 to $999,999 | 0 (0.0%) | 0 (0.0%) |
| $1,000,000 or more | 5 (3.7%) | 0 (0.0%) |
| Total | 135 (100.0%) | 191 (100.0%) |
Household Income by Mortgage Status in North Enid
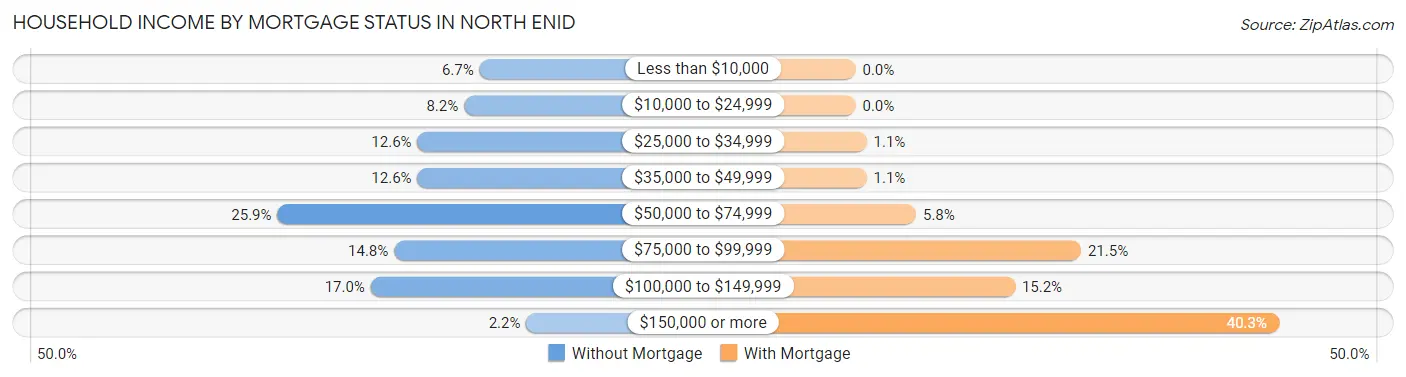
| Household Income | Without Mortgage | With Mortgage |
| Less than $10,000 | 9 (6.7%) | 0 (0.0%) |
| $10,000 to $24,999 | 11 (8.2%) | 0 (0.0%) |
| $25,000 to $34,999 | 17 (12.6%) | 2 (1.1%) |
| $35,000 to $49,999 | 17 (12.6%) | 2 (1.1%) |
| $50,000 to $74,999 | 35 (25.9%) | 11 (5.8%) |
| $75,000 to $99,999 | 20 (14.8%) | 41 (21.5%) |
| $100,000 to $149,999 | 23 (17.0%) | 29 (15.2%) |
| $150,000 or more | 3 (2.2%) | 77 (40.3%) |
| Total | 135 (100.0%) | 191 (100.0%) |
Property Value to Household Income Ratio in North Enid
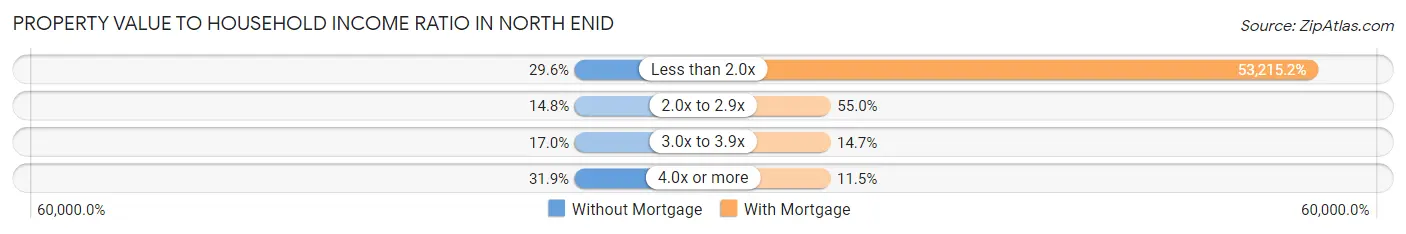
| Value-to-Income Ratio | Without Mortgage | With Mortgage |
| Less than 2.0x | 40 (29.6%) | 101,641 (53,215.2%) |
| 2.0x to 2.9x | 20 (14.8%) | 105 (55.0%) |
| 3.0x to 3.9x | 23 (17.0%) | 28 (14.7%) |
| 4.0x or more | 43 (31.9%) | 22 (11.5%) |
| Total | 135 (100.0%) | 191 (100.0%) |
Real Estate Taxes by Mortgage Status in North Enid
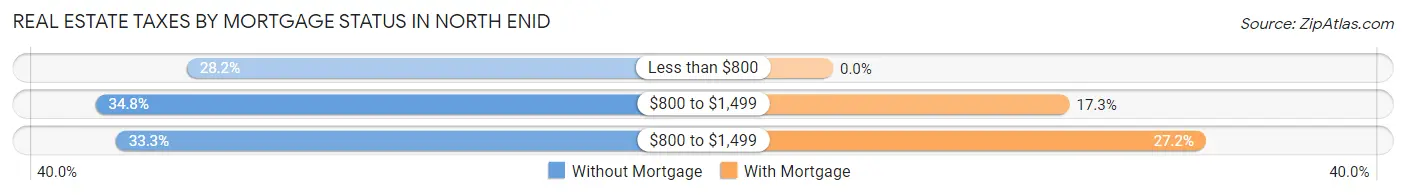
| Property Taxes | Without Mortgage | With Mortgage |
| Less than $800 | 38 (28.1%) | 0 (0.0%) |
| $800 to $1,499 | 47 (34.8%) | 33 (17.3%) |
| $800 to $1,499 | 45 (33.3%) | 52 (27.2%) |
| Total | 135 (100.0%) | 191 (100.0%) |
Health & Disability in North Enid
Health Insurance Coverage by Age in North Enid
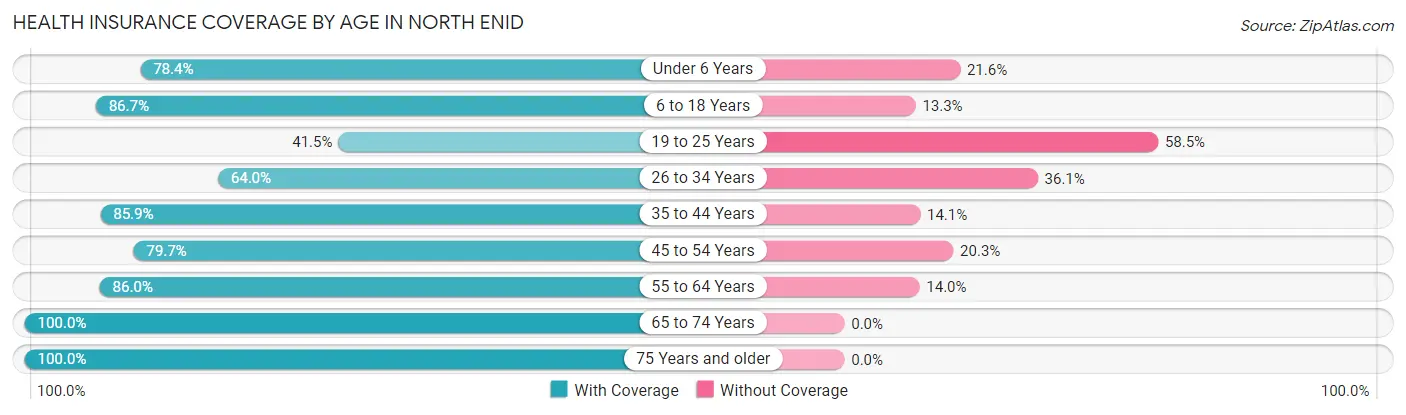
| Age Bracket | With Coverage | Without Coverage |
| Under 6 Years | 40 (78.4%) | 11 (21.6%) |
| 6 to 18 Years | 196 (86.7%) | 30 (13.3%) |
| 19 to 25 Years | 44 (41.5%) | 62 (58.5%) |
| 26 to 34 Years | 55 (63.9%) | 31 (36.0%) |
| 35 to 44 Years | 146 (85.9%) | 24 (14.1%) |
| 45 to 54 Years | 106 (79.7%) | 27 (20.3%) |
| 55 to 64 Years | 86 (86.0%) | 14 (14.0%) |
| 65 to 74 Years | 173 (100.0%) | 0 (0.0%) |
| 75 Years and older | 162 (100.0%) | 0 (0.0%) |
| Total | 1,008 (83.5%) | 199 (16.5%) |
Health Insurance Coverage by Citizenship Status in North Enid
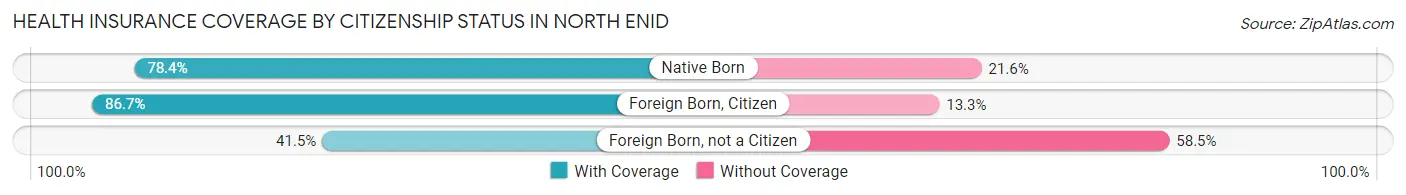
| Citizenship Status | With Coverage | Without Coverage |
| Native Born | 40 (78.4%) | 11 (21.6%) |
| Foreign Born, Citizen | 196 (86.7%) | 30 (13.3%) |
| Foreign Born, not a Citizen | 44 (41.5%) | 62 (58.5%) |
Health Insurance Coverage by Household Income in North Enid
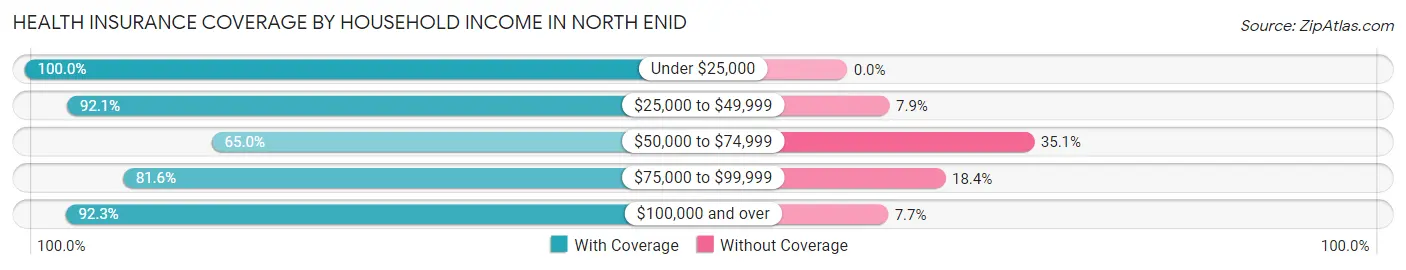
| Household Income | With Coverage | Without Coverage |
| Under $25,000 | 28 (100.0%) | 0 (0.0%) |
| $25,000 to $49,999 | 186 (92.1%) | 16 (7.9%) |
| $50,000 to $74,999 | 215 (64.9%) | 116 (35.0%) |
| $75,000 to $99,999 | 133 (81.6%) | 30 (18.4%) |
| $100,000 and over | 446 (92.3%) | 37 (7.7%) |
Public vs Private Health Insurance Coverage by Age in North Enid
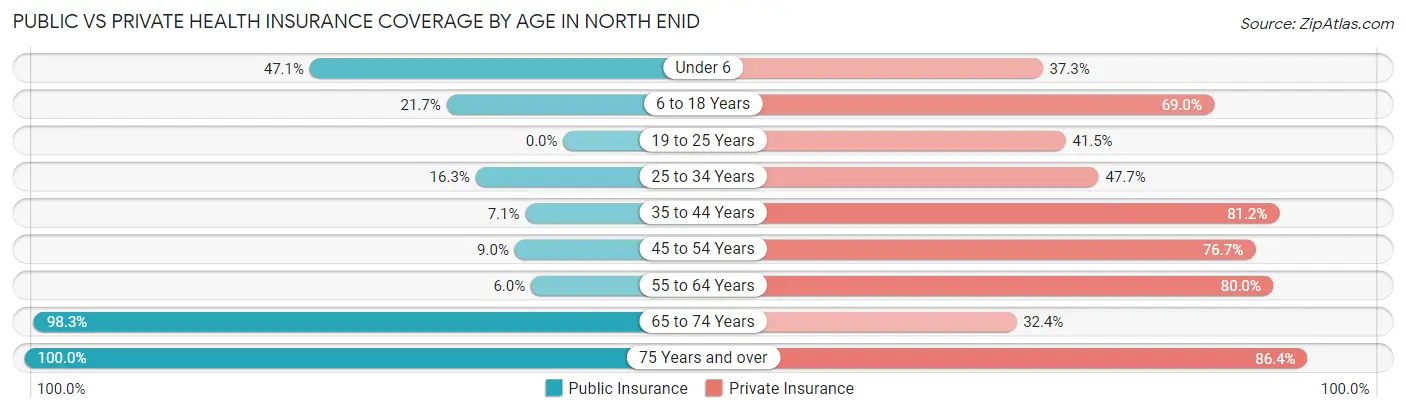
| Age Bracket | Public Insurance | Private Insurance |
| Under 6 | 24 (47.1%) | 19 (37.2%) |
| 6 to 18 Years | 49 (21.7%) | 156 (69.0%) |
| 19 to 25 Years | 0 (0.0%) | 44 (41.5%) |
| 25 to 34 Years | 14 (16.3%) | 41 (47.7%) |
| 35 to 44 Years | 12 (7.1%) | 138 (81.2%) |
| 45 to 54 Years | 12 (9.0%) | 102 (76.7%) |
| 55 to 64 Years | 6 (6.0%) | 80 (80.0%) |
| 65 to 74 Years | 170 (98.3%) | 56 (32.4%) |
| 75 Years and over | 162 (100.0%) | 140 (86.4%) |
| Total | 449 (37.2%) | 776 (64.3%) |
Disability Status by Sex by Age in North Enid
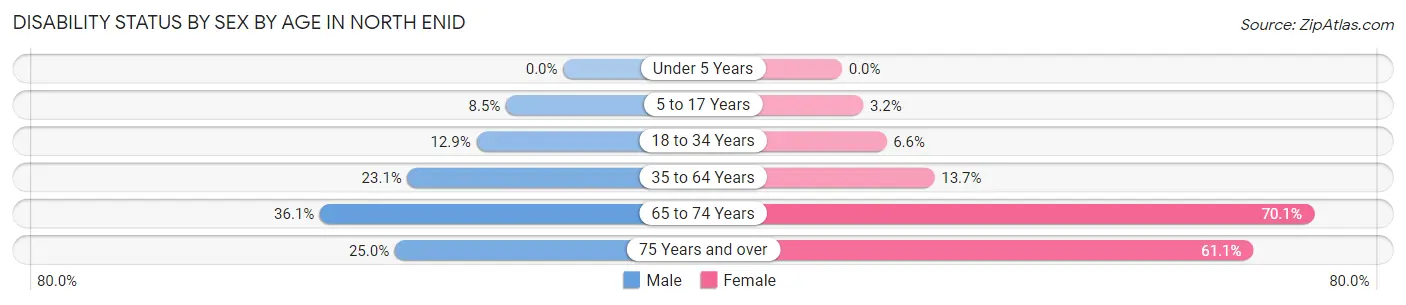
| Age Bracket | Male | Female |
| Under 5 Years | 0 (0.0%) | 0 (0.0%) |
| 5 to 17 Years | 9 (8.5%) | 4 (3.2%) |
| 18 to 34 Years | 12 (12.9%) | 7 (6.6%) |
| 35 to 64 Years | 46 (23.1%) | 28 (13.7%) |
| 65 to 74 Years | 13 (36.1%) | 96 (70.1%) |
| 75 Years and over | 27 (25.0%) | 33 (61.1%) |
Disability Class by Sex by Age in North Enid
Disability Class: Hearing Difficulty
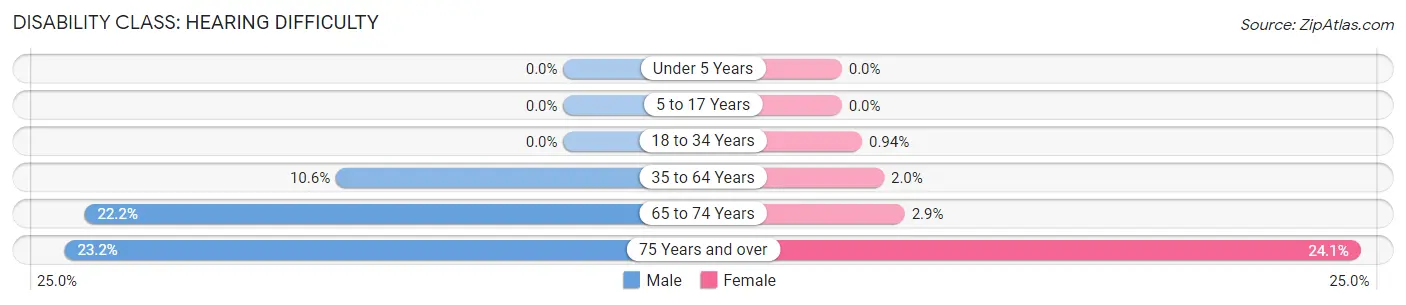
| Age Bracket | Male | Female |
| Under 5 Years | 0 (0.0%) | 0 (0.0%) |
| 5 to 17 Years | 0 (0.0%) | 0 (0.0%) |
| 18 to 34 Years | 0 (0.0%) | 1 (0.9%) |
| 35 to 64 Years | 21 (10.5%) | 4 (2.0%) |
| 65 to 74 Years | 8 (22.2%) | 4 (2.9%) |
| 75 Years and over | 25 (23.2%) | 13 (24.1%) |
Disability Class: Vision Difficulty
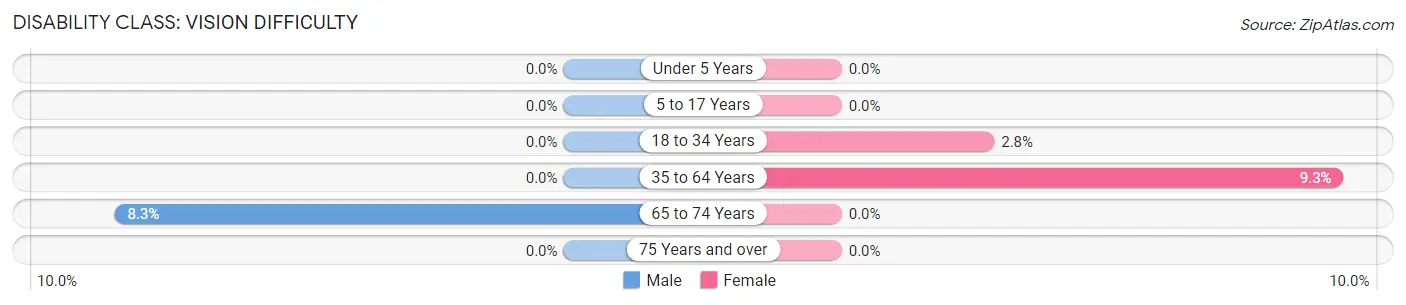
| Age Bracket | Male | Female |
| Under 5 Years | 0 (0.0%) | 0 (0.0%) |
| 5 to 17 Years | 0 (0.0%) | 0 (0.0%) |
| 18 to 34 Years | 0 (0.0%) | 3 (2.8%) |
| 35 to 64 Years | 0 (0.0%) | 19 (9.3%) |
| 65 to 74 Years | 3 (8.3%) | 0 (0.0%) |
| 75 Years and over | 0 (0.0%) | 0 (0.0%) |
Disability Class: Cognitive Difficulty
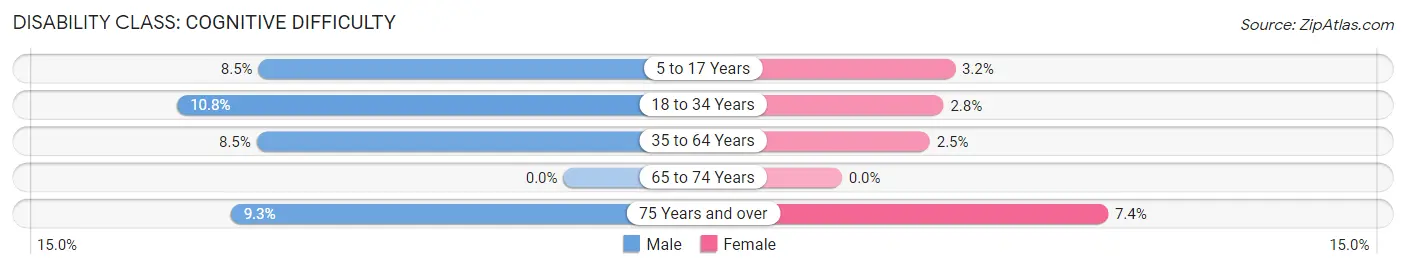
| Age Bracket | Male | Female |
| 5 to 17 Years | 9 (8.5%) | 4 (3.2%) |
| 18 to 34 Years | 10 (10.7%) | 3 (2.8%) |
| 35 to 64 Years | 17 (8.5%) | 5 (2.5%) |
| 65 to 74 Years | 0 (0.0%) | 0 (0.0%) |
| 75 Years and over | 10 (9.3%) | 4 (7.4%) |
Disability Class: Ambulatory Difficulty
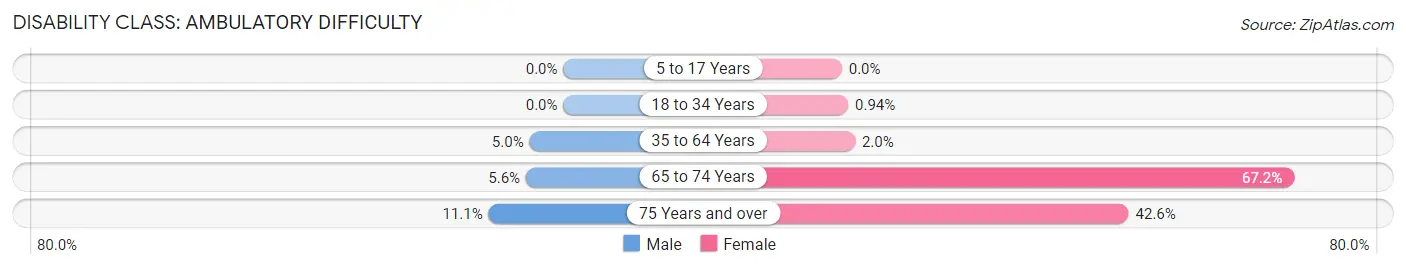
| Age Bracket | Male | Female |
| 5 to 17 Years | 0 (0.0%) | 0 (0.0%) |
| 18 to 34 Years | 0 (0.0%) | 1 (0.9%) |
| 35 to 64 Years | 10 (5.0%) | 4 (2.0%) |
| 65 to 74 Years | 2 (5.6%) | 92 (67.1%) |
| 75 Years and over | 12 (11.1%) | 23 (42.6%) |
Disability Class: Self-Care Difficulty
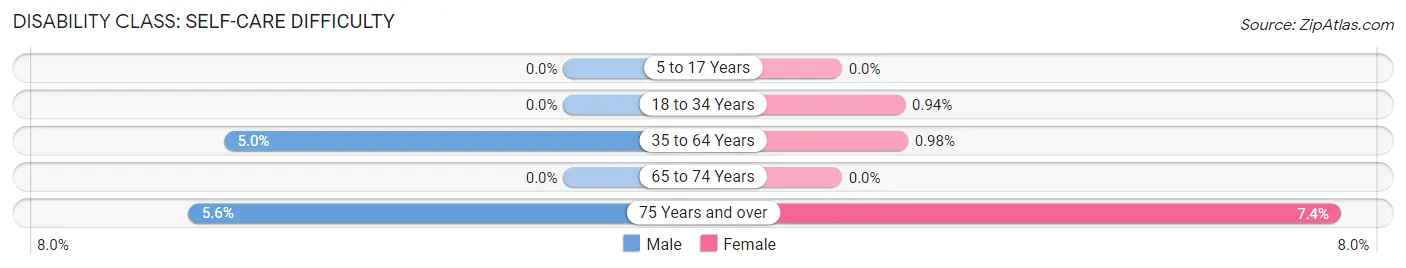
| Age Bracket | Male | Female |
| 5 to 17 Years | 0 (0.0%) | 0 (0.0%) |
| 18 to 34 Years | 0 (0.0%) | 1 (0.9%) |
| 35 to 64 Years | 10 (5.0%) | 2 (1.0%) |
| 65 to 74 Years | 0 (0.0%) | 0 (0.0%) |
| 75 Years and over | 6 (5.6%) | 4 (7.4%) |
Technology Access in North Enid
Computing Device Access in North Enid
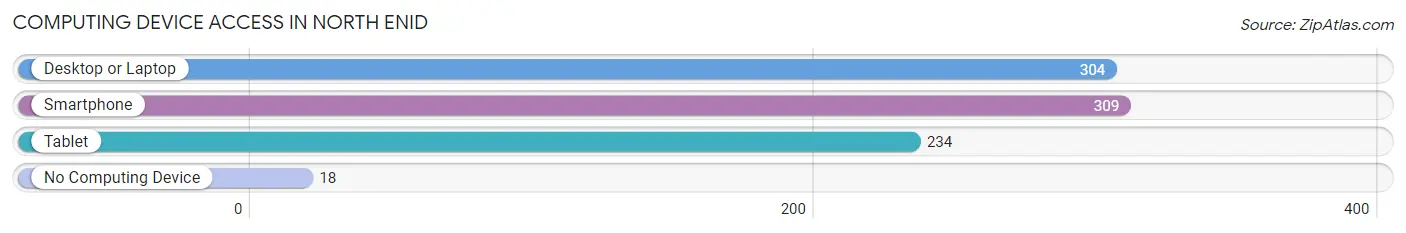
| Device Type | # Households | % Households |
| Desktop or Laptop | 304 | 85.9% |
| Smartphone | 309 | 87.3% |
| Tablet | 234 | 66.1% |
| No Computing Device | 18 | 5.1% |
| Total | 354 | 100.0% |
Internet Access in North Enid
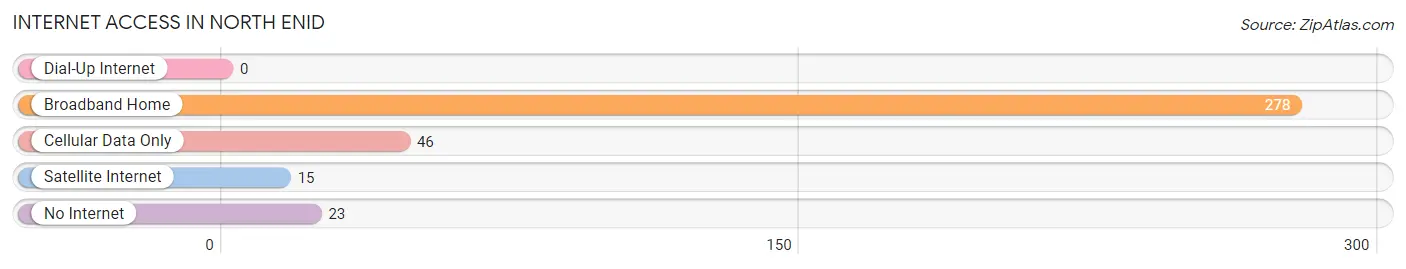
| Internet Type | # Households | % Households |
| Dial-Up Internet | 0 | 0.0% |
| Broadband Home | 278 | 78.5% |
| Cellular Data Only | 46 | 13.0% |
| Satellite Internet | 15 | 4.2% |
| No Internet | 23 | 6.5% |
| Total | 354 | 100.0% |
North Enid Summary
North Enid is a city located in Garfield County, Oklahoma. It is situated in the northern part of the state, approximately 30 miles north of the city of Enid. The city has a population of approximately 4,000 people and is part of the Enid Metropolitan Statistical Area.
History
North Enid was founded in 1892 by the Santa Fe Railroad. The town was originally named “Enid Junction” due to its location at the junction of two railroads. The town was later renamed “North Enid” in order to differentiate it from the larger city of Enid.
The city was incorporated in 1901 and has since grown to become a thriving community. North Enid is home to a variety of businesses, including a number of manufacturing plants, a hospital, and a variety of retail stores.
Geography
North Enid is located in the northern part of Oklahoma, approximately 30 miles north of the city of Enid. The city is situated in the rolling hills of the Osage Plains, which are part of the larger Great Plains region. The city is located at an elevation of 1,068 feet above sea level.
The climate in North Enid is characterized by hot summers and cold winters. The average high temperature in the summer months is around 90 degrees Fahrenheit, while the average low temperature in the winter months is around 20 degrees Fahrenheit.
Economy
North Enid’s economy is largely based on manufacturing and retail. The city is home to a number of manufacturing plants, including a plant that produces plastic products and a plant that produces metal products. The city is also home to a variety of retail stores, including a Walmart Supercenter, a Lowe’s Home Improvement store, and a variety of other stores.
The city is also home to a number of healthcare facilities, including a hospital and a number of medical clinics. The city is also home to a number of educational institutions, including a community college and a number of public and private schools.
Demographics
As of the 2010 census, the population of North Enid was 4,000. The racial makeup of the city was 87.3% White, 8.2% African American, 0.7% Native American, 0.3% Asian, 0.1% Pacific Islander, and 3.4% from other races. The median household income in the city was $37,917, and the median family income was $45,917.
Conclusion
North Enid is a city located in Garfield County, Oklahoma. It is situated in the northern part of the state, approximately 30 miles north of the city of Enid. The city has a population of approximately 4,000 people and is part of the Enid Metropolitan Statistical Area. The city’s economy is largely based on manufacturing and retail, and it is home to a number of healthcare facilities, educational institutions, and other businesses. The racial makeup of the city is predominantly White, with a small percentage of African American, Native American, Asian, and Pacific Islander residents.
Common Questions
What is Per Capita Income in North Enid?
Per Capita income in North Enid is $33,664.
What is the Median Family Income in North Enid?
Median Family Income in North Enid is $85,114.
What is the Median Household income in North Enid?
Median Household Income in North Enid is $78,636.
What is Income or Wage Gap in North Enid?
Income or Wage Gap in North Enid is 37.9%.
Women in North Enid earn 62.1 cents for every dollar earned by a man.
What is Inequality or Gini Index in North Enid?
Inequality or Gini Index in North Enid is 0.32.
What is the Total Population of North Enid?
Total Population of North Enid is 1,214.
What is the Total Male Population of North Enid?
Total Male Population of North Enid is 580.
What is the Total Female Population of North Enid?
Total Female Population of North Enid is 634.
What is the Ratio of Males per 100 Females in North Enid?
There are 91.48 Males per 100 Females in North Enid.
What is the Ratio of Females per 100 Males in North Enid?
There are 109.31 Females per 100 Males in North Enid.
What is the Median Population Age in North Enid?
Median Population Age in North Enid is 43.3 Years.
What is the Average Family Size in North Enid
Average Family Size in North Enid is 3.9 People.
What is the Average Household Size in North Enid
Average Household Size in North Enid is 3.4 People.
How Large is the Labor Force in North Enid?
There are 528 People in the Labor Forcein in North Enid.
What is the Percentage of People in the Labor Force in North Enid?
53.1% of People are in the Labor Force in North Enid.
What is the Unemployment Rate in North Enid?
Unemployment Rate in North Enid is 8.8%.