Granite, OK Map & Demographics
Granite Map
Granite Overview
$15,644
PER CAPITA INCOME
$81,429
AVG FAMILY INCOME
$56,500
AVG HOUSEHOLD INCOME
3.9%
WAGE / INCOME GAP [ % ]
96.1¢/ $1
WAGE / INCOME GAP [ $ ]
0.44
INEQUALITY / GINI INDEX
1,473
TOTAL POPULATION
1,152
MALE POPULATION
321
FEMALE POPULATION
358.88
MALES / 100 FEMALES
27.86
FEMALES / 100 MALES
41.2
MEDIAN AGE
2.5
AVG FAMILY SIZE
1.9
AVG HOUSEHOLD SIZE
299
LABOR FORCE [ PEOPLE ]
21.7%
PERCENT IN LABOR FORCE
0.7%
UNEMPLOYMENT RATE
Granite Zip Codes
Granite Area Codes
Income in Granite
Income Overview in Granite
Per Capita Income in Granite is $15,644, while median incomes of families and households are $81,429 and $56,500 respectively.
| Characteristic | Number | Measure |
| Per Capita Income | 1,473 | $15,644 |
| Median Family Income | 172 | $81,429 |
| Mean Family Income | 172 | $101,001 |
| Median Household Income | 340 | $56,500 |
| Mean Household Income | 340 | $67,946 |
| Income Deficit | 172 | $0 |
| Wage / Income Gap (%) | 1,473 | 3.87% |
| Wage / Income Gap ($) | 1,473 | 96.13¢ per $1 |
| Gini / Inequality Index | 1,473 | 0.44 |
Earnings by Sex in Granite
Average Earnings in Granite are $31,602, $30,750 for men and $31,989 for women, a difference of 3.9%.
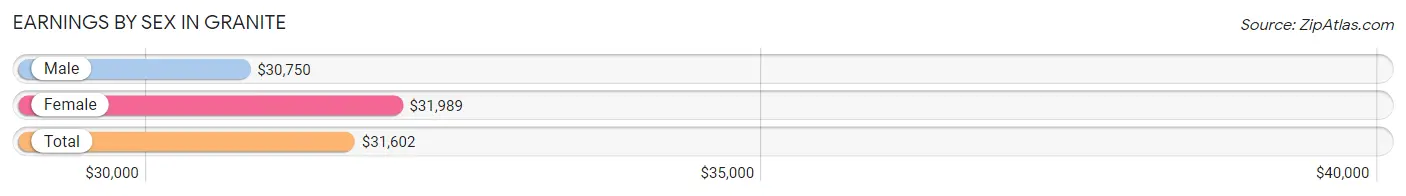
| Sex | Number | Average Earnings |
| Male | 280 (63.2%) | $30,750 |
| Female | 163 (36.8%) | $31,989 |
| Total | 443 (100.0%) | $31,602 |
Earnings by Sex by Income Bracket in Granite
The most common earnings brackets in Granite are $2,500 to $4,999 for men (49 | 17.5%) and $30,000 to $34,999 for women (26 | 16.0%).
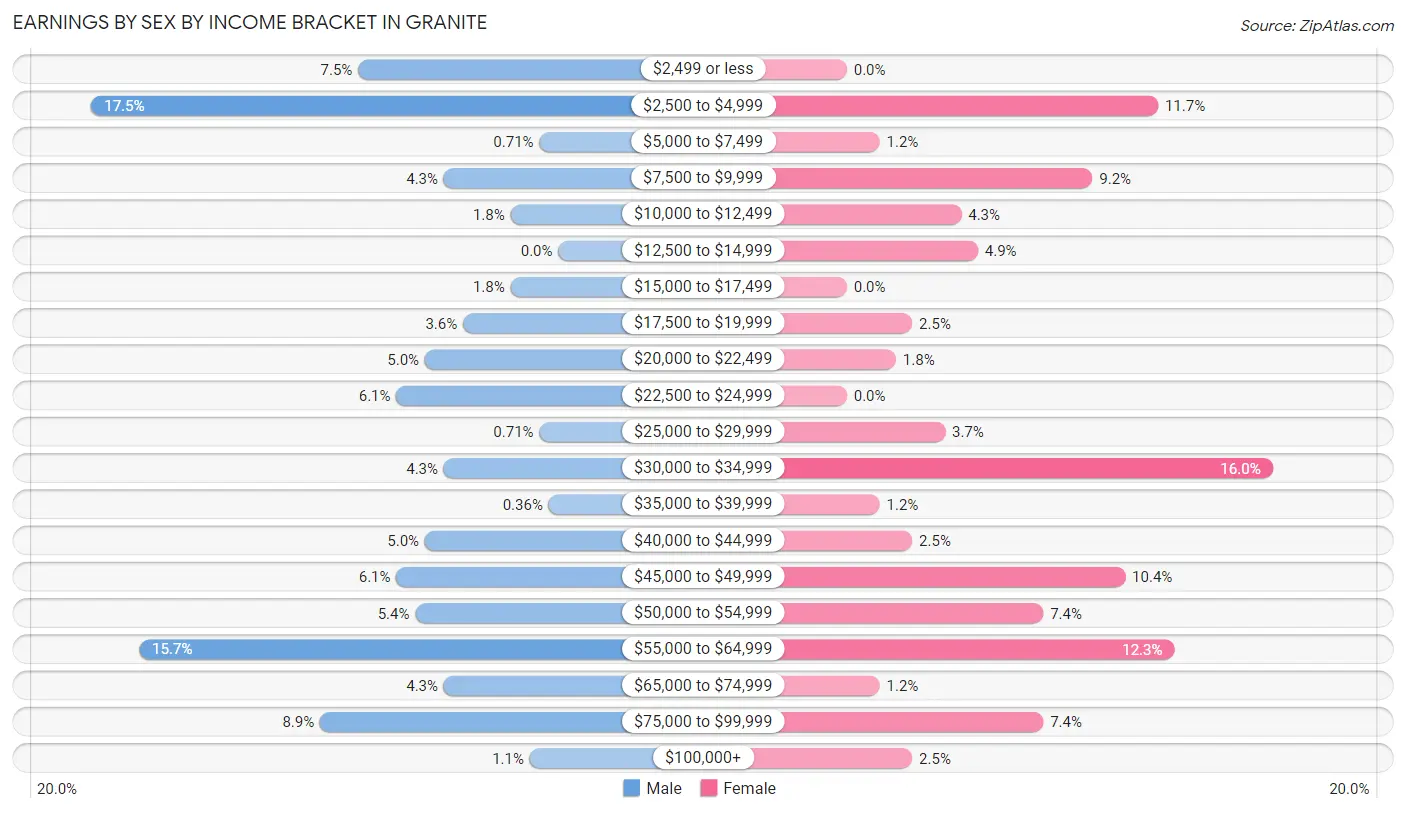
| Income | Male | Female |
| $2,499 or less | 21 (7.5%) | 0 (0.0%) |
| $2,500 to $4,999 | 49 (17.5%) | 19 (11.7%) |
| $5,000 to $7,499 | 2 (0.7%) | 2 (1.2%) |
| $7,500 to $9,999 | 12 (4.3%) | 15 (9.2%) |
| $10,000 to $12,499 | 5 (1.8%) | 7 (4.3%) |
| $12,500 to $14,999 | 0 (0.0%) | 8 (4.9%) |
| $15,000 to $17,499 | 5 (1.8%) | 0 (0.0%) |
| $17,500 to $19,999 | 10 (3.6%) | 4 (2.5%) |
| $20,000 to $22,499 | 14 (5.0%) | 3 (1.8%) |
| $22,500 to $24,999 | 17 (6.1%) | 0 (0.0%) |
| $25,000 to $29,999 | 2 (0.7%) | 6 (3.7%) |
| $30,000 to $34,999 | 12 (4.3%) | 26 (16.0%) |
| $35,000 to $39,999 | 1 (0.4%) | 2 (1.2%) |
| $40,000 to $44,999 | 14 (5.0%) | 4 (2.5%) |
| $45,000 to $49,999 | 17 (6.1%) | 17 (10.4%) |
| $50,000 to $54,999 | 15 (5.4%) | 12 (7.4%) |
| $55,000 to $64,999 | 44 (15.7%) | 20 (12.3%) |
| $65,000 to $74,999 | 12 (4.3%) | 2 (1.2%) |
| $75,000 to $99,999 | 25 (8.9%) | 12 (7.4%) |
| $100,000+ | 3 (1.1%) | 4 (2.5%) |
| Total | 280 (100.0%) | 163 (100.0%) |
Earnings by Sex by Educational Attainment in Granite
Average earnings in Granite are $38,750 for men and $45,294 for women, a difference of 14.4%. Men with an educational attainment of bachelor's degree enjoy the highest average annual earnings of $56,833, while those with bachelor's degree education earn the least with $56,833. Women with an educational attainment of bachelor's degree earn the most with the average annual earnings of $56,875, while those with less than high school education have the smallest earnings of $20,833.
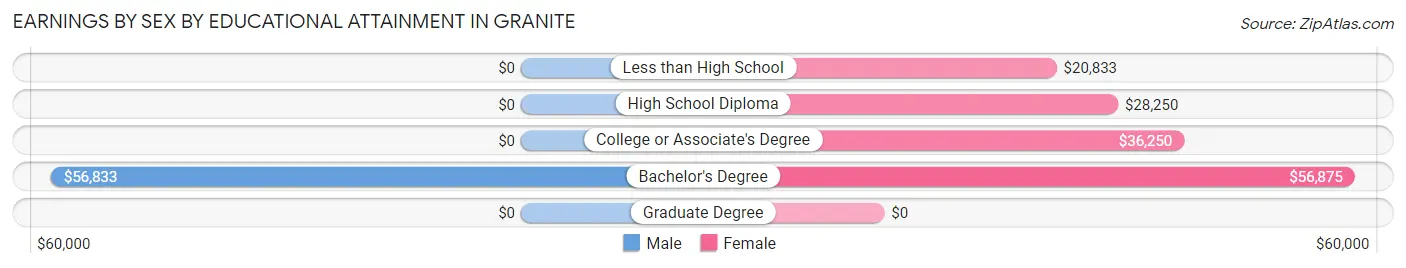
| Educational Attainment | Male Income | Female Income |
| Less than High School | - | - |
| High School Diploma | - | - |
| College or Associate's Degree | - | - |
| Bachelor's Degree | $56,833 | $56,875 |
| Graduate Degree | - | - |
| Total | $38,750 | $45,294 |
Family Income in Granite
Family Income Brackets in Granite
According to the Granite family income data, there are 47 families falling into the $50,000 to $74,999 income range, which is the most common income bracket and makes up 27.3% of all families.
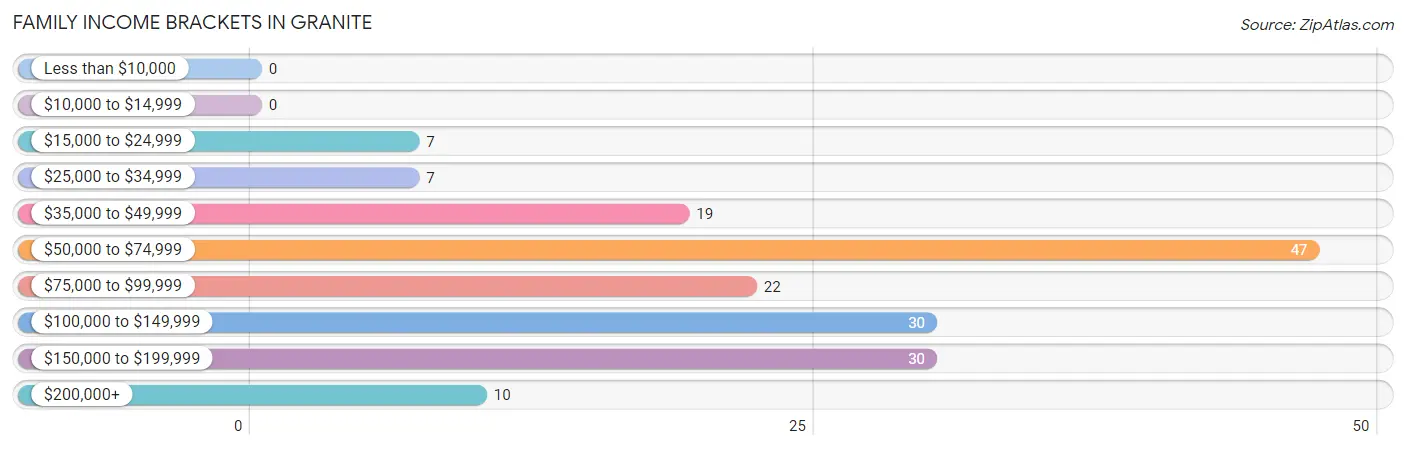
| Income Bracket | # Families | % Families |
| Less than $10,000 | 0 | 0.0% |
| $10,000 to $14,999 | 0 | 0.0% |
| $15,000 to $24,999 | 7 | 4.1% |
| $25,000 to $34,999 | 7 | 4.1% |
| $35,000 to $49,999 | 19 | 11.0% |
| $50,000 to $74,999 | 47 | 27.3% |
| $75,000 to $99,999 | 22 | 12.8% |
| $100,000 to $149,999 | 30 | 17.4% |
| $150,000 to $199,999 | 30 | 17.4% |
| $200,000+ | 10 | 5.8% |
Family Income by Famaliy Size in Granite
3-person families (25 | 14.5%) account for the highest median family income in Granite with $170,938 per family, while 3-person families (25 | 14.5%) have the highest median income of $56,979 per family member.
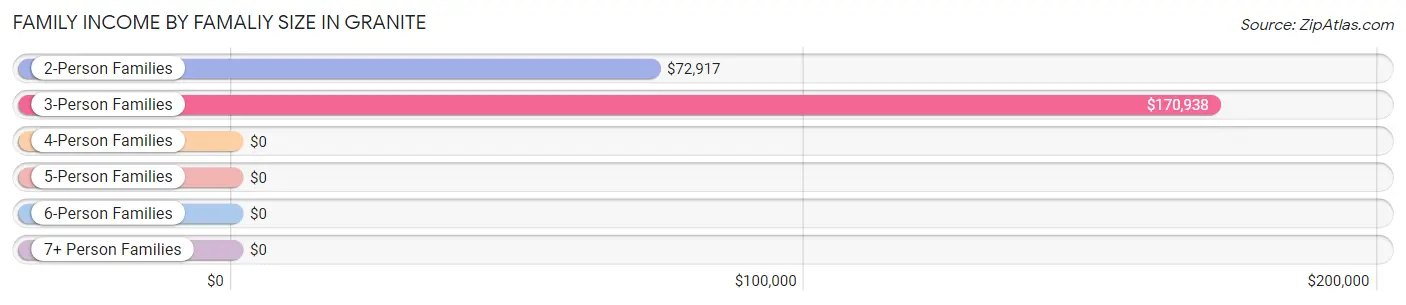
| Income Bracket | # Families | Median Income |
| 2-Person Families | 98 (57.0%) | $72,917 |
| 3-Person Families | 25 (14.5%) | $170,938 |
| 4-Person Families | 46 (26.7%) | $0 |
| 5-Person Families | 3 (1.7%) | $0 |
| 6-Person Families | 0 (0.0%) | $0 |
| 7+ Person Families | 0 (0.0%) | $0 |
| Total | 172 (100.0%) | $81,429 |
Family Income by Number of Earners in Granite
The median family income in Granite is $81,429, with families comprising 3+ earners (41) having the highest median family income of $164,792, while families with 1 earner (73) have the lowest median family income of $59,688, accounting for 23.8% and 42.4% of families, respectively.

| Number of Earners | # Families | Median Income |
| No Earners | 27 (15.7%) | $68,625 |
| 1 Earner | 73 (42.4%) | $59,688 |
| 2 Earners | 31 (18.0%) | $84,821 |
| 3+ Earners | 41 (23.8%) | $164,792 |
| Total | 172 (100.0%) | $81,429 |
Household Income in Granite
Household Income Brackets in Granite
With 94 households falling in the category, the $50,000 to $74,999 income range is the most frequent in Granite, accounting for 27.7% of all households. In contrast, only 2 households (0.6%) fall into the less than $10,000 income bracket, making it the least populous group.
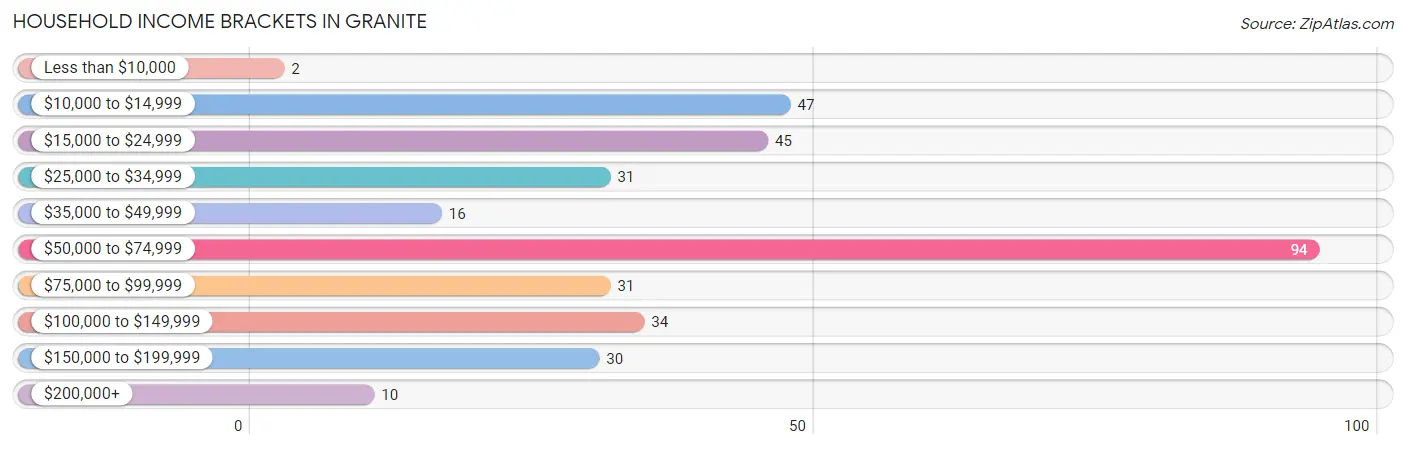
| Income Bracket | # Households | % Households |
| Less than $10,000 | 2 | 0.6% |
| $10,000 to $14,999 | 47 | 13.8% |
| $15,000 to $24,999 | 45 | 13.2% |
| $25,000 to $34,999 | 31 | 9.1% |
| $35,000 to $49,999 | 16 | 4.7% |
| $50,000 to $74,999 | 94 | 27.6% |
| $75,000 to $99,999 | 31 | 9.1% |
| $100,000 to $149,999 | 34 | 10.0% |
| $150,000 to $199,999 | 30 | 8.8% |
| $200,000+ | 10 | 2.9% |
Household Income by Householder Age in Granite
The median household income in Granite is $56,500, with the highest median household income of $59,000 found in the 45 to 64 years age bracket for the primary householder. A total of 116 households (34.1%) fall into this category.
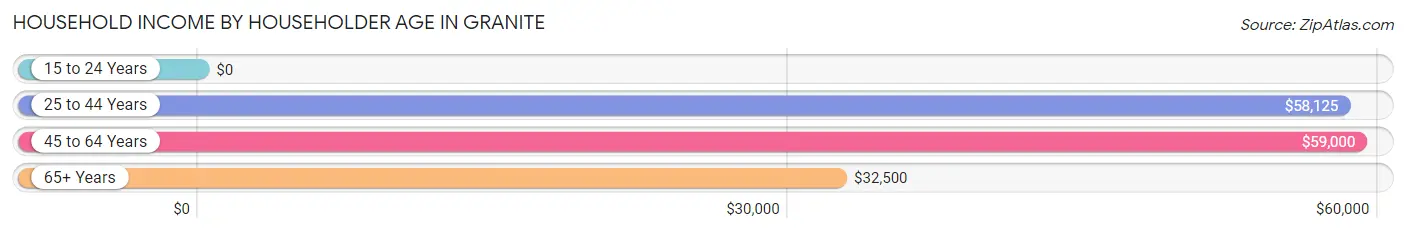
| Income Bracket | # Households | Median Income |
| 15 to 24 Years | 0 (0.0%) | $0 |
| 25 to 44 Years | 104 (30.6%) | $58,125 |
| 45 to 64 Years | 116 (34.1%) | $59,000 |
| 65+ Years | 120 (35.3%) | $32,500 |
| Total | 340 (100.0%) | $56,500 |
Poverty in Granite
Income Below Poverty by Sex and Age in Granite
With 7.3% poverty level for males and 22.1% for females among the residents of Granite, under 5 year old males and 18 to 24 year old females are the most vulnerable to poverty, with 5 males (35.7%) and 19 females (57.6%) in their respective age groups living below the poverty level.
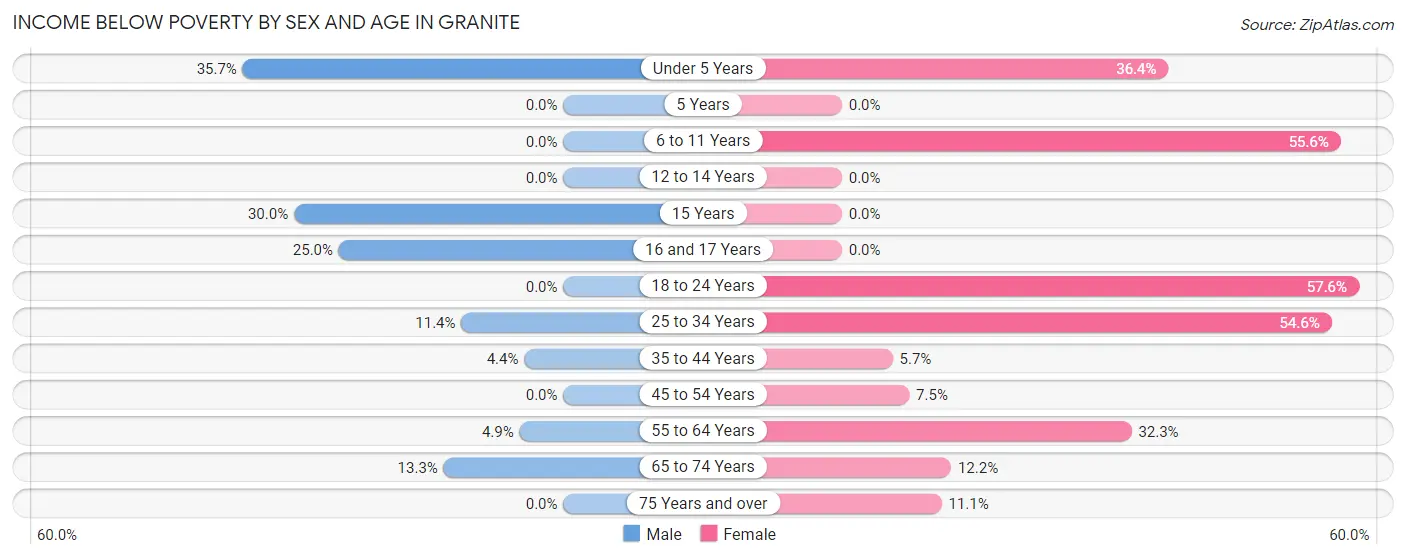
| Age Bracket | Male | Female |
| Under 5 Years | 5 (35.7%) | 4 (36.4%) |
| 5 Years | 0 (0.0%) | 0 (0.0%) |
| 6 to 11 Years | 0 (0.0%) | 5 (55.6%) |
| 12 to 14 Years | 0 (0.0%) | 0 (0.0%) |
| 15 Years | 3 (30.0%) | 0 (0.0%) |
| 16 and 17 Years | 1 (25.0%) | 0 (0.0%) |
| 18 to 24 Years | 0 (0.0%) | 19 (57.6%) |
| 25 to 34 Years | 5 (11.4%) | 6 (54.5%) |
| 35 to 44 Years | 1 (4.3%) | 3 (5.7%) |
| 45 to 54 Years | 0 (0.0%) | 3 (7.5%) |
| 55 to 64 Years | 2 (4.9%) | 20 (32.3%) |
| 65 to 74 Years | 6 (13.3%) | 9 (12.2%) |
| 75 Years and over | 0 (0.0%) | 2 (11.1%) |
| Total | 23 (7.3%) | 71 (22.1%) |
Income Above Poverty by Sex and Age in Granite
According to the poverty statistics in Granite, males aged 5 years and females aged 12 to 14 years are the age groups that are most secure financially, with 100.0% of males and 100.0% of females in these age groups living above the poverty line.
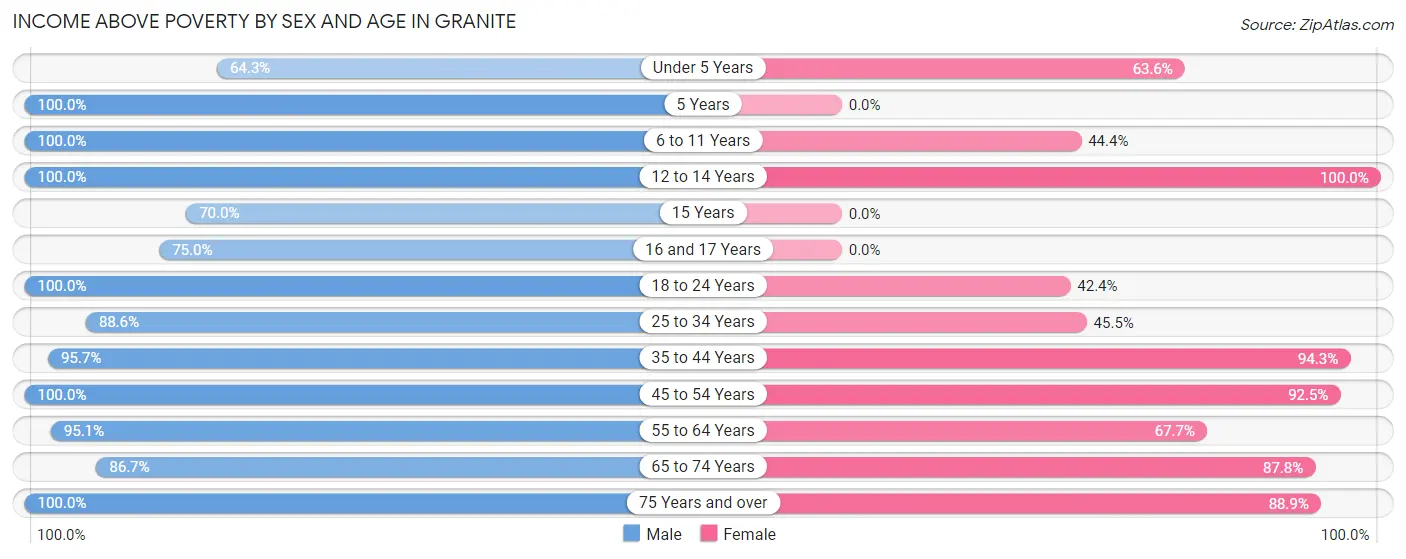
| Age Bracket | Male | Female |
| Under 5 Years | 9 (64.3%) | 7 (63.6%) |
| 5 Years | 3 (100.0%) | 0 (0.0%) |
| 6 to 11 Years | 17 (100.0%) | 4 (44.4%) |
| 12 to 14 Years | 23 (100.0%) | 10 (100.0%) |
| 15 Years | 7 (70.0%) | 0 (0.0%) |
| 16 and 17 Years | 3 (75.0%) | 0 (0.0%) |
| 18 to 24 Years | 21 (100.0%) | 14 (42.4%) |
| 25 to 34 Years | 39 (88.6%) | 5 (45.5%) |
| 35 to 44 Years | 22 (95.7%) | 50 (94.3%) |
| 45 to 54 Years | 40 (100.0%) | 37 (92.5%) |
| 55 to 64 Years | 39 (95.1%) | 42 (67.7%) |
| 65 to 74 Years | 39 (86.7%) | 65 (87.8%) |
| 75 Years and over | 31 (100.0%) | 16 (88.9%) |
| Total | 293 (92.7%) | 250 (77.9%) |
Income Below Poverty Among Married-Couple Families in Granite
The poverty statistics for married-couple families in Granite show that 1.5% or 2 of the total 129 families live below the poverty line. Families with 1 or 2 children have the highest poverty rate of 22.2%, comprising of 2 families. On the other hand, families with no children have the lowest poverty rate of 0.0%, which includes 0 families.
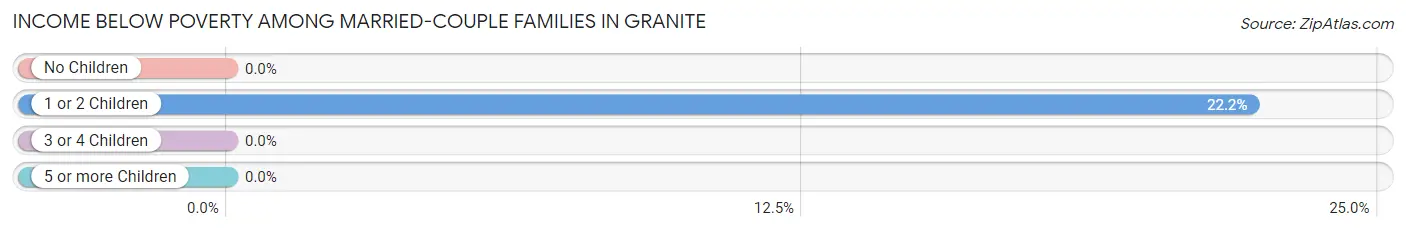
| Children | Above Poverty | Below Poverty |
| No Children | 117 (100.0%) | 0 (0.0%) |
| 1 or 2 Children | 7 (77.8%) | 2 (22.2%) |
| 3 or 4 Children | 3 (100.0%) | 0 (0.0%) |
| 5 or more Children | 0 (0.0%) | 0 (0.0%) |
| Total | 127 (98.5%) | 2 (1.5%) |
Income Below Poverty Among Single-Parent Households in Granite
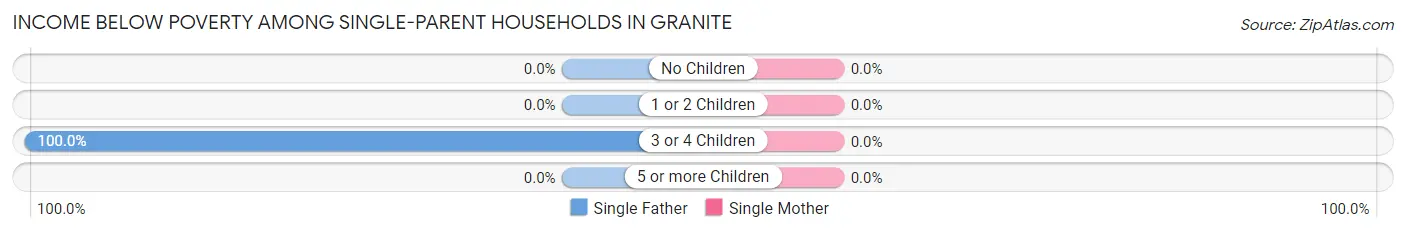
| Children | Single Father | Single Mother |
| No Children | 0 (0.0%) | 0 (0.0%) |
| 1 or 2 Children | 0 (0.0%) | 0 (0.0%) |
| 3 or 4 Children | 5 (100.0%) | 0 (0.0%) |
| 5 or more Children | 0 (0.0%) | 0 (0.0%) |
| Total | 5 (27.8%) | 0 (0.0%) |
Income Below Poverty Among Married-Couple vs Single-Parent Households in Granite
The poverty data for Granite shows that 2 of the married-couple family households (1.5%) and 5 of the single-parent households (11.6%) are living below the poverty level. Within the married-couple family households, those with 1 or 2 children have the highest poverty rate, with 2 households (22.2%) falling below the poverty line. Among the single-parent households, those with 3 or 4 children have the highest poverty rate, with 5 household (100.0%) living below poverty.
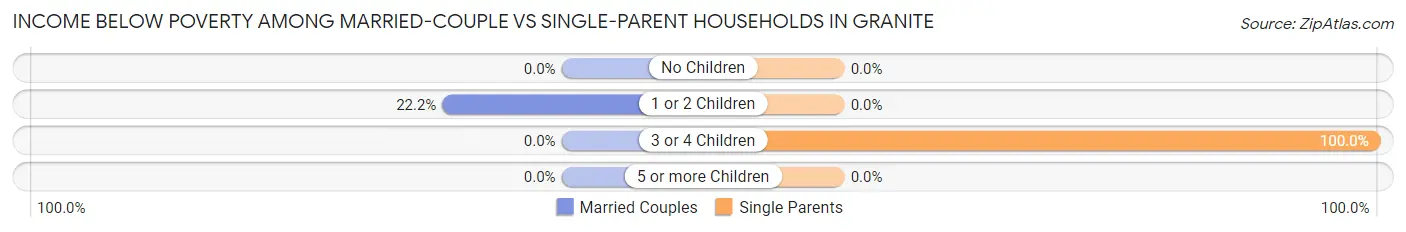
| Children | Married-Couple Families | Single-Parent Households |
| No Children | 0 (0.0%) | 0 (0.0%) |
| 1 or 2 Children | 2 (22.2%) | 0 (0.0%) |
| 3 or 4 Children | 0 (0.0%) | 5 (100.0%) |
| 5 or more Children | 0 (0.0%) | 0 (0.0%) |
| Total | 2 (1.5%) | 5 (11.6%) |
Race in Granite
The most populous races in Granite are White / Caucasian (947 | 64.3%), Black / African American (190 | 12.9%), and Two or more Races (175 | 11.9%).
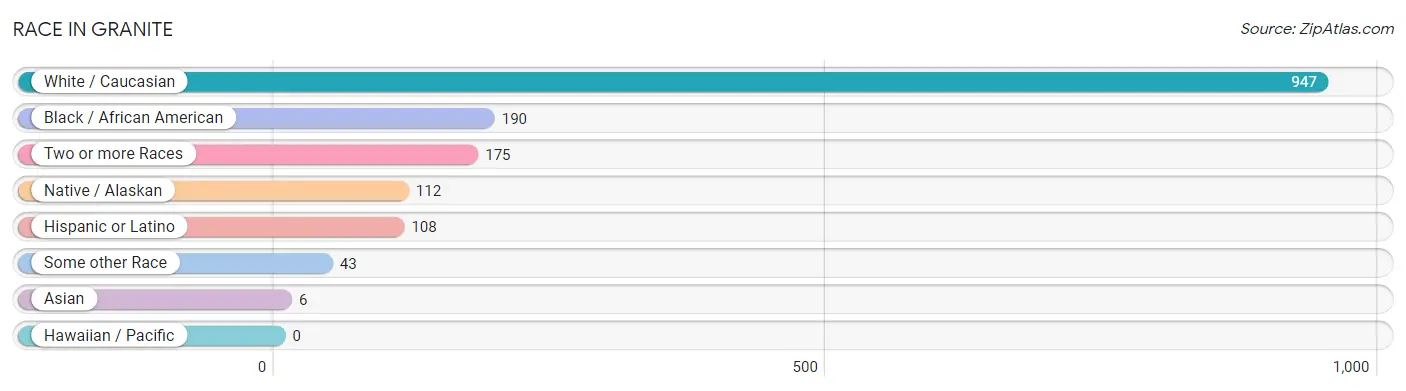
| Race | # Population | % Population |
| Asian | 6 | 0.4% |
| Black / African American | 190 | 12.9% |
| Hawaiian / Pacific | 0 | 0.0% |
| Hispanic or Latino | 108 | 7.3% |
| Native / Alaskan | 112 | 7.6% |
| White / Caucasian | 947 | 64.3% |
| Two or more Races | 175 | 11.9% |
| Some other Race | 43 | 2.9% |
| Total | 1,473 | 100.0% |
Ancestry in Granite
The most populous ancestries reported in Granite are German (205 | 13.9%), American (167 | 11.3%), Irish (133 | 9.0%), Mexican (74 | 5.0%), and English (55 | 3.7%), together accounting for 43.0% of all Granite residents.
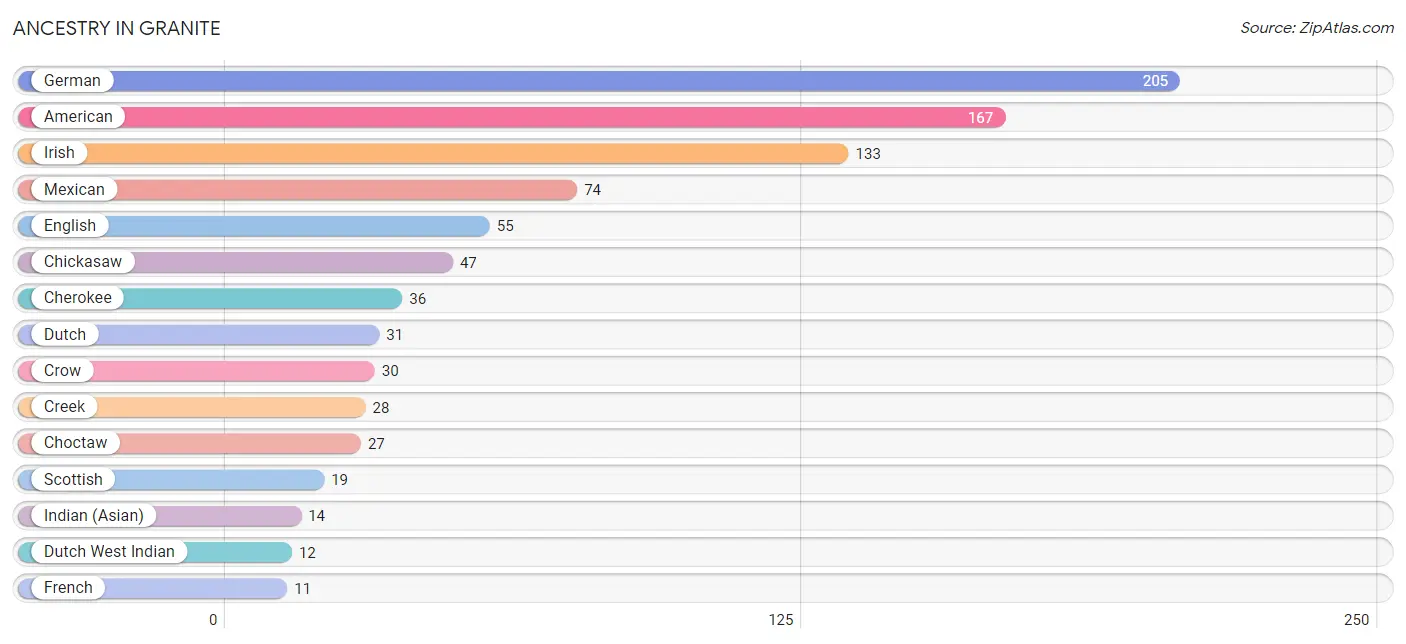
| Ancestry | # Population | % Population |
| African | 4 | 0.3% |
| Aleut | 7 | 0.5% |
| American | 167 | 11.3% |
| Apache | 5 | 0.3% |
| Austrian | 3 | 0.2% |
| Cherokee | 36 | 2.4% |
| Chickasaw | 47 | 3.2% |
| Choctaw | 27 | 1.8% |
| Comanche | 10 | 0.7% |
| Creek | 28 | 1.9% |
| Crow | 30 | 2.0% |
| Danish | 4 | 0.3% |
| Delaware | 8 | 0.5% |
| Dutch | 31 | 2.1% |
| Dutch West Indian | 12 | 0.8% |
| Eastern European | 4 | 0.3% |
| English | 55 | 3.7% |
| French | 11 | 0.7% |
| German | 205 | 13.9% |
| Indian (Asian) | 14 | 0.9% |
| Irish | 133 | 9.0% |
| Italian | 2 | 0.1% |
| Kiowa | 4 | 0.3% |
| Korean | 6 | 0.4% |
| Mexican | 74 | 5.0% |
| Mexican American Indian | 3 | 0.2% |
| Norwegian | 2 | 0.1% |
| Puerto Rican | 9 | 0.6% |
| Scotch-Irish | 8 | 0.5% |
| Scottish | 19 | 1.3% |
| Spaniard | 9 | 0.6% |
| Spanish | 2 | 0.1% |
| Subsaharan African | 4 | 0.3% |
| Swedish | 4 | 0.3% | View All 34 Rows |
Immigrants in Granite
The most numerous immigrant groups reported in Granite came from Central America (33 | 2.2%), Latin America (33 | 2.2%), Mexico (33 | 2.2%), Asia (6 | 0.4%), and Philippines (6 | 0.4%), together accounting for 7.5% of all Granite residents.
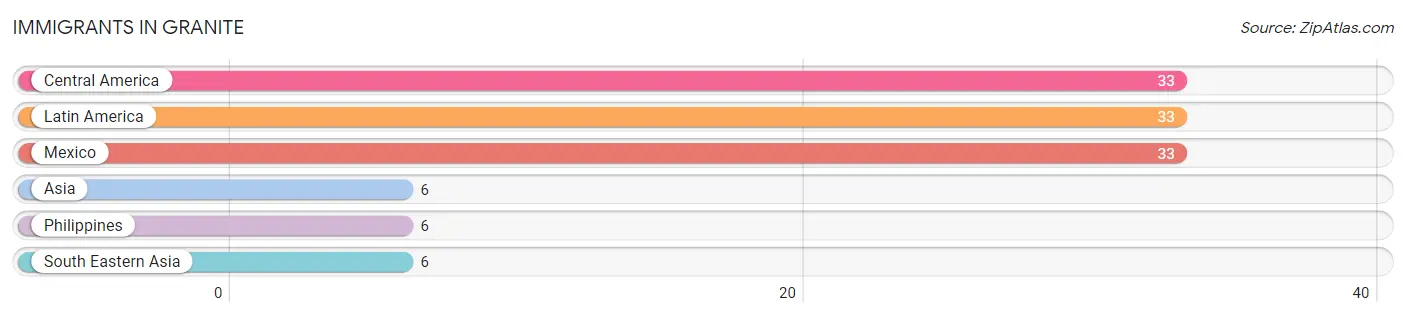
| Immigration Origin | # Population | % Population |
| Asia | 6 | 0.4% |
| Central America | 33 | 2.2% |
| Latin America | 33 | 2.2% |
| Mexico | 33 | 2.2% |
| Philippines | 6 | 0.4% |
| South Eastern Asia | 6 | 0.4% | View All 6 Rows |
Sex and Age in Granite
Sex and Age in Granite
The most populous age groups in Granite are 25 to 29 Years (220 | 19.1%) for men and 65 to 69 Years (41 | 12.8%) for women.
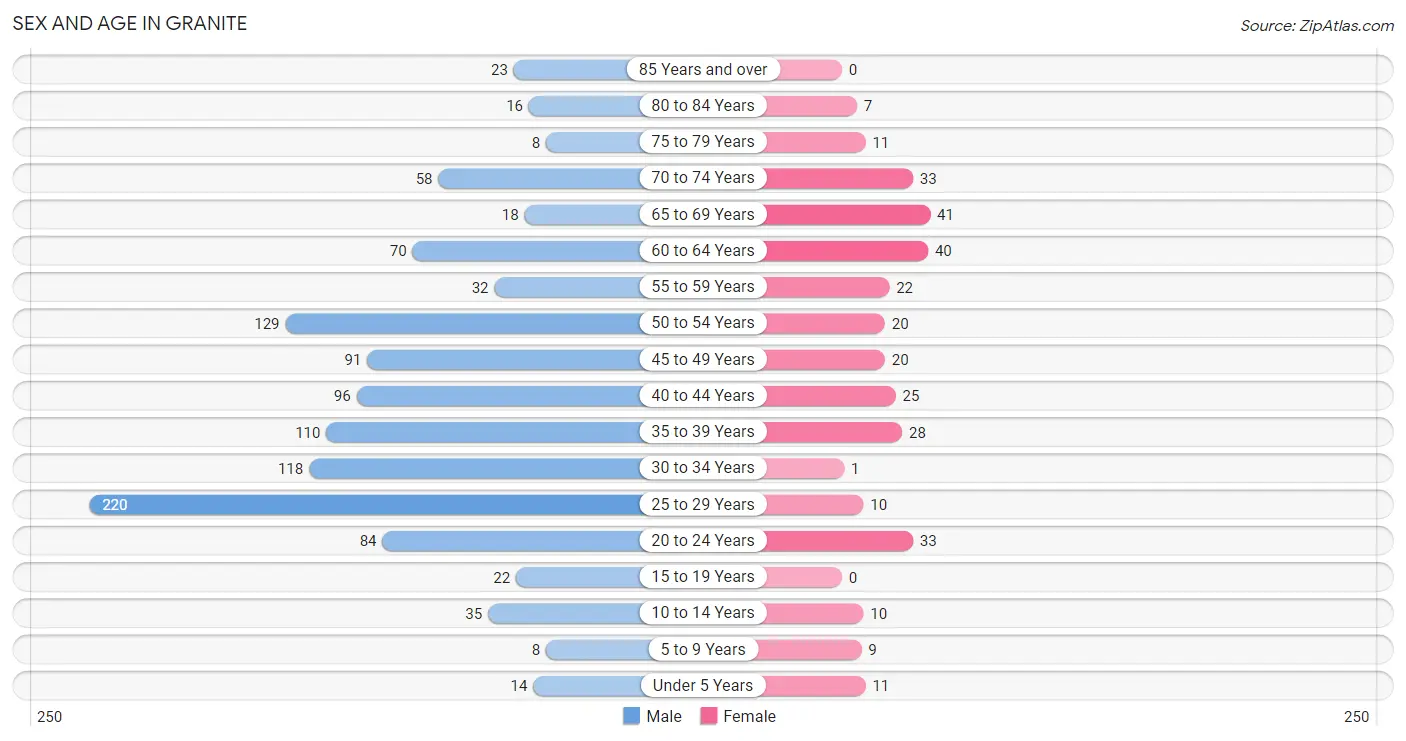
| Age Bracket | Male | Female |
| Under 5 Years | 14 (1.2%) | 11 (3.4%) |
| 5 to 9 Years | 8 (0.7%) | 9 (2.8%) |
| 10 to 14 Years | 35 (3.0%) | 10 (3.1%) |
| 15 to 19 Years | 22 (1.9%) | 0 (0.0%) |
| 20 to 24 Years | 84 (7.3%) | 33 (10.3%) |
| 25 to 29 Years | 220 (19.1%) | 10 (3.1%) |
| 30 to 34 Years | 118 (10.2%) | 1 (0.3%) |
| 35 to 39 Years | 110 (9.6%) | 28 (8.7%) |
| 40 to 44 Years | 96 (8.3%) | 25 (7.8%) |
| 45 to 49 Years | 91 (7.9%) | 20 (6.2%) |
| 50 to 54 Years | 129 (11.2%) | 20 (6.2%) |
| 55 to 59 Years | 32 (2.8%) | 22 (6.9%) |
| 60 to 64 Years | 70 (6.1%) | 40 (12.5%) |
| 65 to 69 Years | 18 (1.6%) | 41 (12.8%) |
| 70 to 74 Years | 58 (5.0%) | 33 (10.3%) |
| 75 to 79 Years | 8 (0.7%) | 11 (3.4%) |
| 80 to 84 Years | 16 (1.4%) | 7 (2.2%) |
| 85 Years and over | 23 (2.0%) | 0 (0.0%) |
| Total | 1,152 (100.0%) | 321 (100.0%) |
Families and Households in Granite
Median Family Size in Granite
The median family size in Granite is 2.54 persons per family, with single female/mother families (25 | 14.5%) accounting for the largest median family size of 2.88 persons per family. On the other hand, single male/father families (18 | 10.5%) represent the smallest median family size with 2.44 persons per family.
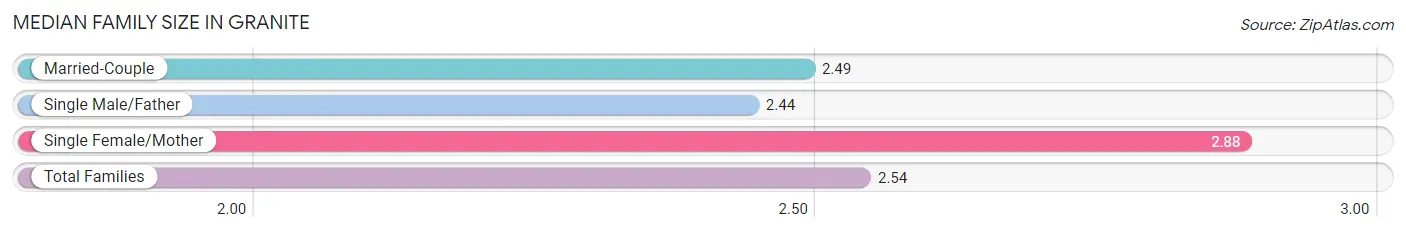
| Family Type | # Families | Family Size |
| Married-Couple | 129 (75.0%) | 2.49 |
| Single Male/Father | 18 (10.5%) | 2.44 |
| Single Female/Mother | 25 (14.5%) | 2.88 |
| Total Families | 172 (100.0%) | 2.54 |
Median Household Size in Granite
The median household size in Granite is 1.87 persons per household, with single male/father households (18 | 5.3%) accounting for the largest median household size of 3.94 persons per household. non-family households (168 | 49.4%) represent the smallest median household size with 1.03 persons per household.
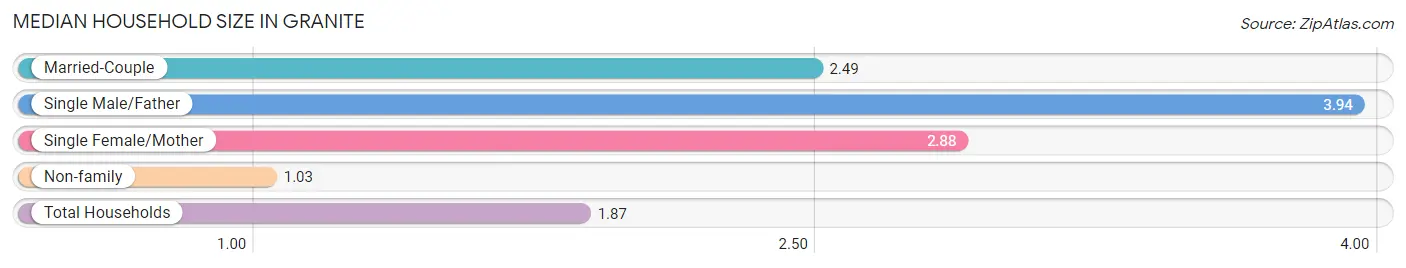
| Household Type | # Households | Household Size |
| Married-Couple | 129 (37.9%) | 2.49 |
| Single Male/Father | 18 (5.3%) | 3.94 |
| Single Female/Mother | 25 (7.3%) | 2.88 |
| Non-family | 168 (49.4%) | 1.03 |
| Total Households | 340 (100.0%) | 1.87 |
Household Size by Marriage Status in Granite
Out of a total of 340 households in Granite, 172 (50.6%) are family households, while 168 (49.4%) are nonfamily households. The most numerous type of family households are 2-person households, comprising 93, and the most common type of nonfamily households are 1-person households, comprising 166.
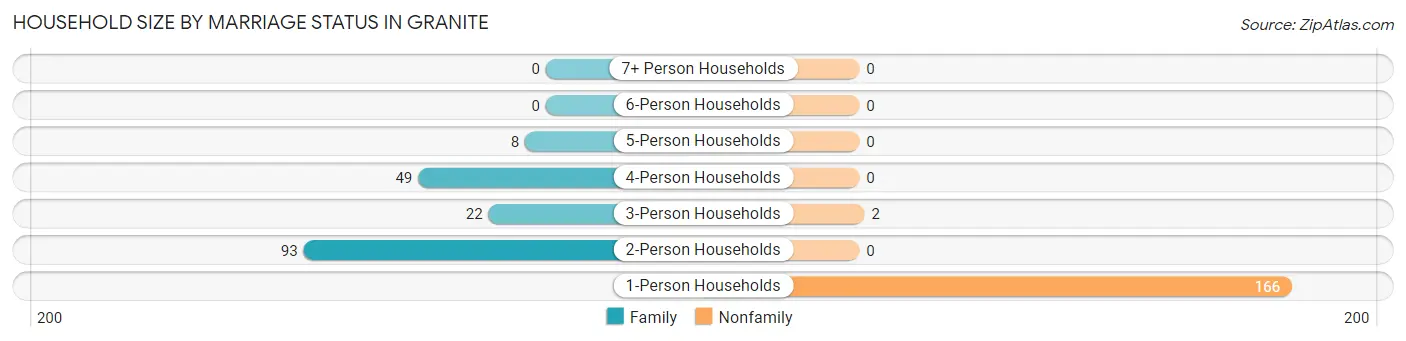
| Household Size | Family Households | Nonfamily Households |
| 1-Person Households | - | 166 (48.8%) |
| 2-Person Households | 93 (27.4%) | 0 (0.0%) |
| 3-Person Households | 22 (6.5%) | 2 (0.6%) |
| 4-Person Households | 49 (14.4%) | 0 (0.0%) |
| 5-Person Households | 8 (2.4%) | 0 (0.0%) |
| 6-Person Households | 0 (0.0%) | 0 (0.0%) |
| 7+ Person Households | 0 (0.0%) | 0 (0.0%) |
| Total | 172 (50.6%) | 168 (49.4%) |
Female Fertility in Granite
Fertility by Age in Granite
Average fertility rate in Granite is 162.0 births per 1,000 women. Women in the age bracket of 20 to 34 years have the highest fertility rate with 432.0 births per 1,000 women. Women in the age bracket of 20 to 34 years acount for 100.0% of all women with births.
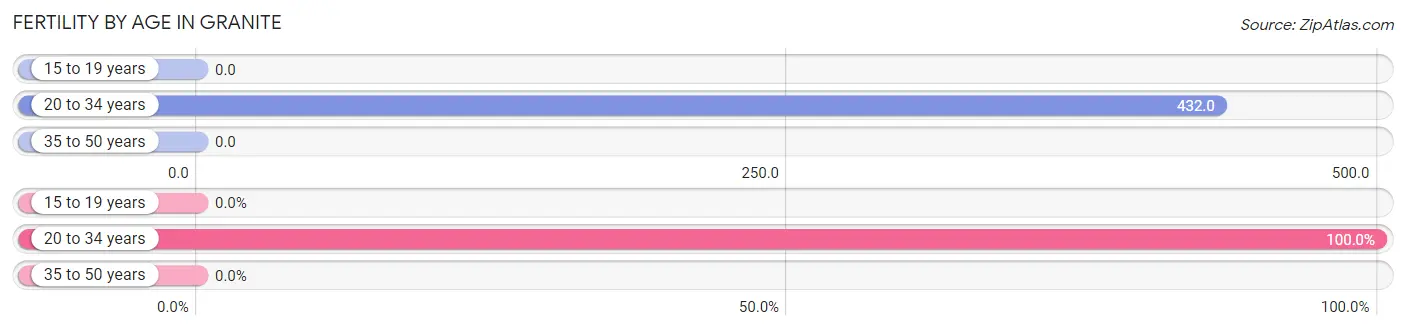
| Age Bracket | Women with Births | Births / 1,000 Women |
| 15 to 19 years | 0 (0.0%) | 0.0 |
| 20 to 34 years | 19 (100.0%) | 432.0 |
| 35 to 50 years | 0 (0.0%) | 0.0 |
| Total | 19 (100.0%) | 162.0 |
Fertility by Age by Marriage Status in Granite
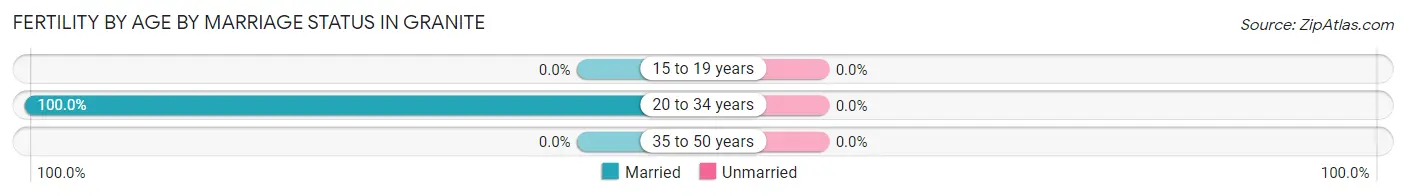
| Age Bracket | Married | Unmarried |
| 15 to 19 years | 0 (0.0%) | 0 (0.0%) |
| 20 to 34 years | 19 (100.0%) | 0 (0.0%) |
| 35 to 50 years | 0 (0.0%) | 0 (0.0%) |
| Total | 19 (100.0%) | 0 (0.0%) |
Fertility by Education in Granite
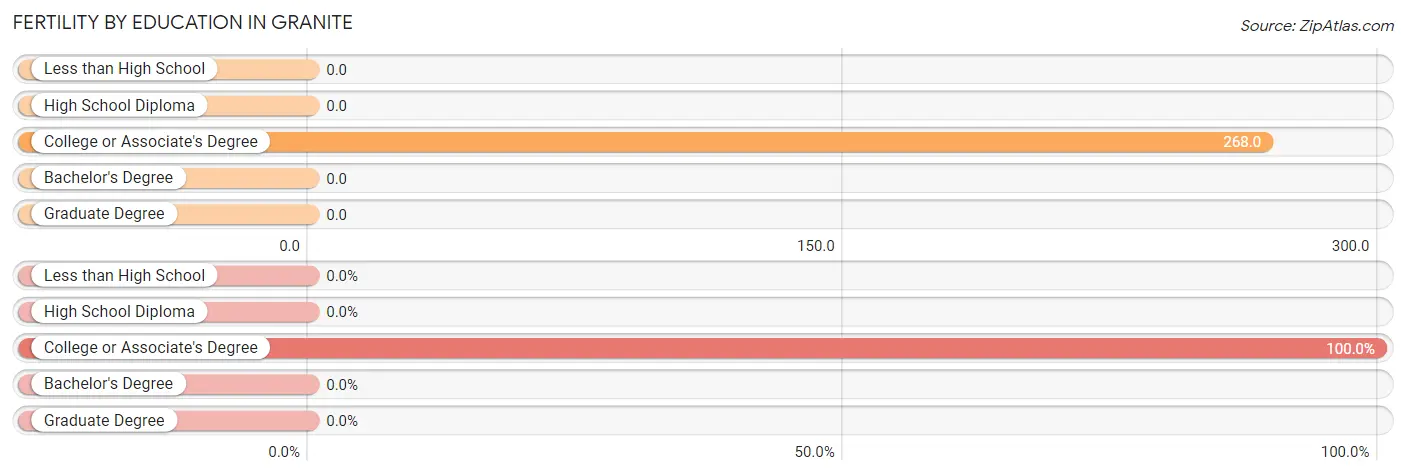
| Educational Attainment | Women with Births | Births / 1,000 Women |
| Less than High School | 0 (0.0%) | 0.0 |
| High School Diploma | 0 (0.0%) | 0.0 |
| College or Associate's Degree | 19 (100.0%) | 268.0 |
| Bachelor's Degree | 0 (0.0%) | 0.0 |
| Graduate Degree | 0 (0.0%) | 0.0 |
| Total | 19 (100.0%) | 162.0 |
Fertility by Education by Marriage Status in Granite
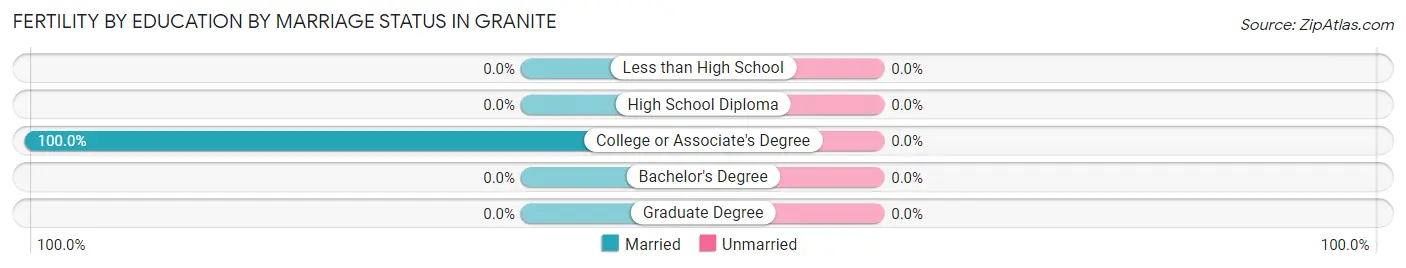
| Educational Attainment | Married | Unmarried |
| Less than High School | 0 (0.0%) | 0 (0.0%) |
| High School Diploma | 0 (0.0%) | 0 (0.0%) |
| College or Associate's Degree | 19 (100.0%) | 0 (0.0%) |
| Bachelor's Degree | 0 (0.0%) | 0 (0.0%) |
| Graduate Degree | 0 (0.0%) | 0 (0.0%) |
| Total | 19 (100.0%) | 0 (0.0%) |
Employment Characteristics in Granite
Employment by Class of Employer in Granite
Among the 297 employed individuals in Granite, private company employees (145 | 48.8%), local government employees (59 | 19.9%), and state government employees (56 | 18.9%) make up the most common classes of employment.
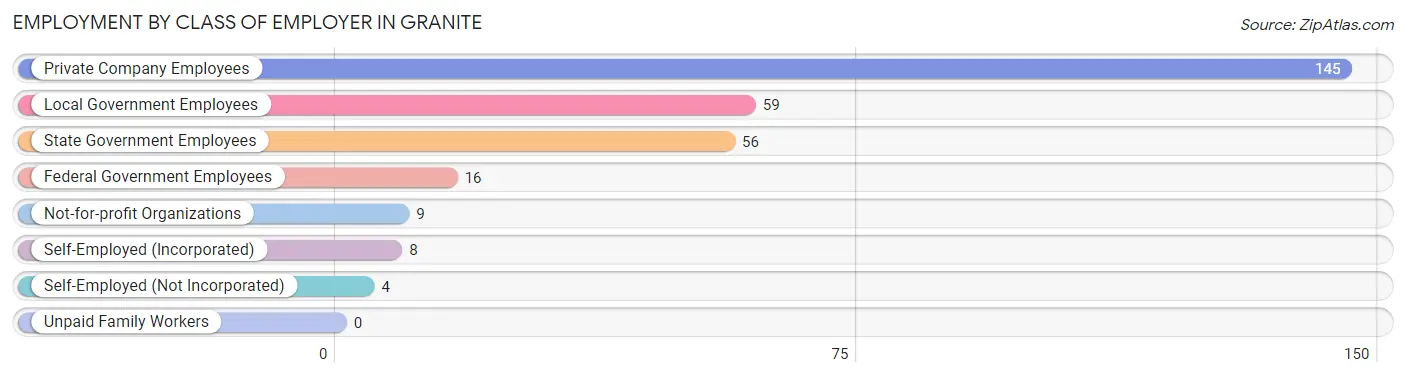
| Employer Class | # Employees | % Employees |
| Private Company Employees | 145 | 48.8% |
| Self-Employed (Incorporated) | 8 | 2.7% |
| Self-Employed (Not Incorporated) | 4 | 1.3% |
| Not-for-profit Organizations | 9 | 3.0% |
| Local Government Employees | 59 | 19.9% |
| State Government Employees | 56 | 18.9% |
| Federal Government Employees | 16 | 5.4% |
| Unpaid Family Workers | 0 | 0.0% |
| Total | 297 | 100.0% |
Employment Status by Age in Granite
According to the labor force statistics for Granite, out of the total population over 16 years of age (1,376), 21.7% or 299 individuals are in the labor force, with 0.7% or 2 of them unemployed. The age group with the highest labor force participation rate is 60 to 64 years, with 39.1% or 43 individuals in the labor force. Within the labor force, the 55 to 59 years age range has the highest percentage of unemployed individuals, with 11.1% or 2 of them being unemployed.
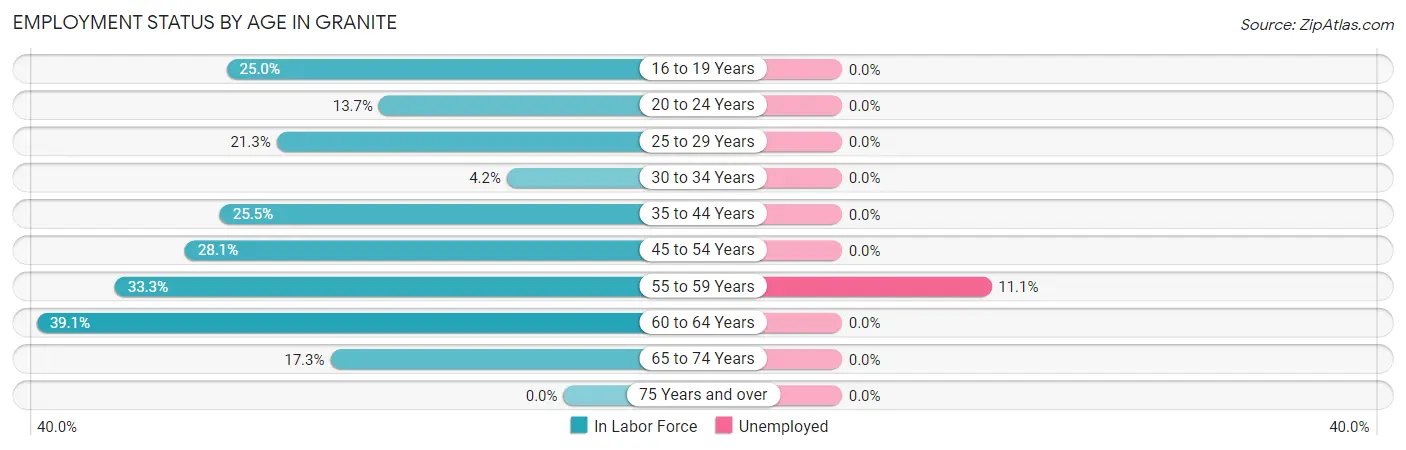
| Age Bracket | In Labor Force | Unemployed |
| 16 to 19 Years | 3 (25.0%) | 0 (0.0%) |
| 20 to 24 Years | 16 (13.7%) | 0 (0.0%) |
| 25 to 29 Years | 49 (21.3%) | 0 (0.0%) |
| 30 to 34 Years | 5 (4.2%) | 0 (0.0%) |
| 35 to 44 Years | 66 (25.5%) | 0 (0.0%) |
| 45 to 54 Years | 73 (28.1%) | 0 (0.0%) |
| 55 to 59 Years | 18 (33.3%) | 2 (11.1%) |
| 60 to 64 Years | 43 (39.1%) | 0 (0.0%) |
| 65 to 74 Years | 26 (17.3%) | 0 (0.0%) |
| 75 Years and over | 0 (0.0%) | 0 (0.0%) |
| Total | 299 (21.7%) | 2 (0.7%) |
Employment Status by Educational Attainment in Granite
According to labor force statistics for Granite, 24.6% of individuals (254) out of the total population between 25 and 64 years of age (1,032) are in the labor force, with 0.8% or 2 of them being unemployed. The group with the highest labor force participation rate are those with the educational attainment of bachelor's degree or higher, with 94.4% or 101 individuals in the labor force. Within the labor force, individuals with less than high school education have the highest percentage of unemployment, with 15.4% or 2 of them being unemployed.
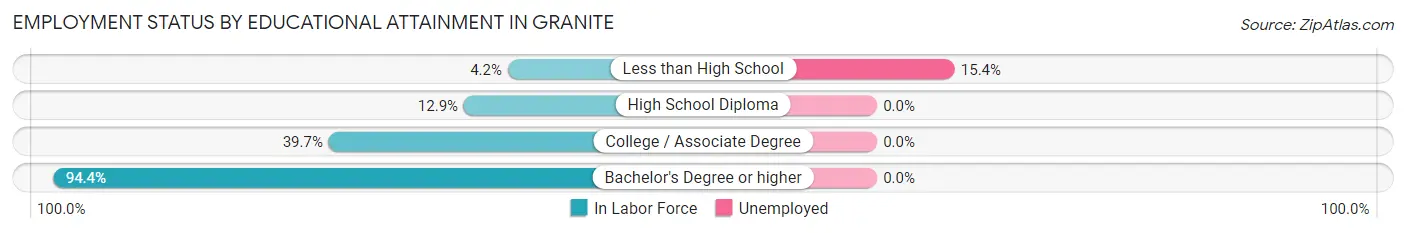
| Educational Attainment | In Labor Force | Unemployed |
| Less than High School | 13 (4.2%) | 47 (15.4%) |
| High School Diploma | 51 (12.9%) | 0 (0.0%) |
| College / Associate Degree | 89 (39.7%) | 0 (0.0%) |
| Bachelor's Degree or higher | 101 (94.4%) | 0 (0.0%) |
| Total | 254 (24.6%) | 8 (0.8%) |
Employment Occupations by Sex in Granite
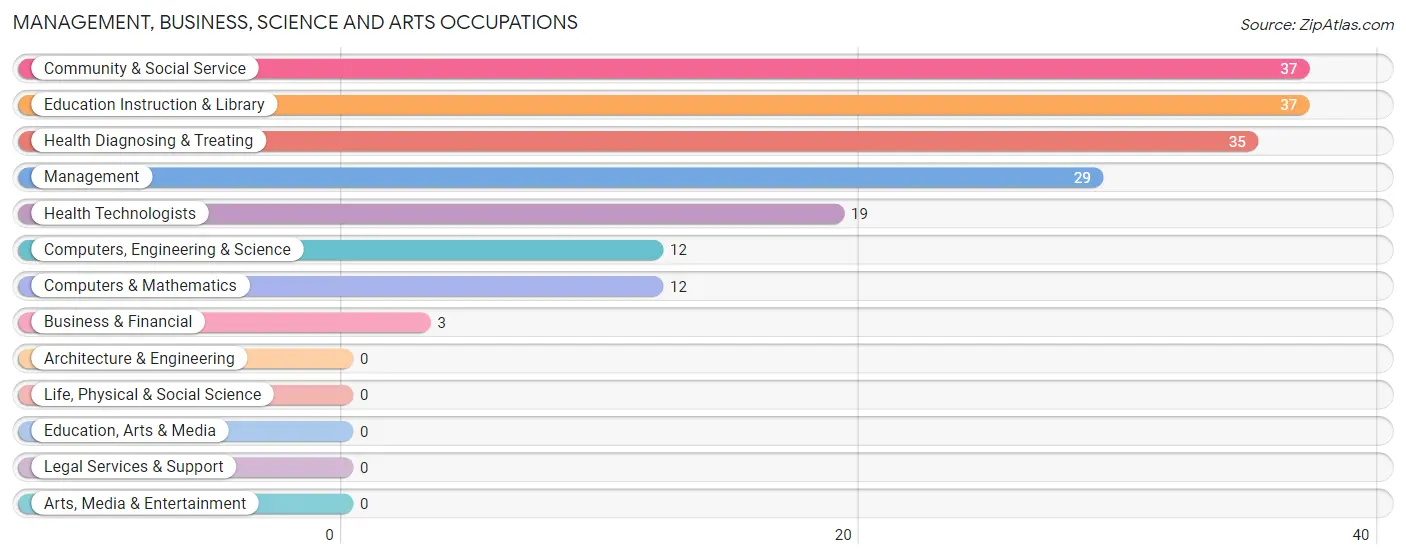
Management, Business, Science and Arts Occupations
The most common Management, Business, Science and Arts occupations in Granite are Community & Social Service (37 | 12.6%), Education Instruction & Library (37 | 12.6%), Health Diagnosing & Treating (35 | 11.9%), Management (29 | 9.9%), and Health Technologists (19 | 6.5%).
Management, Business, Science and Arts Occupations by Sex
Within the Management, Business, Science and Arts occupations in Granite, the most male-oriented occupations are Community & Social Service (81.1%), Education Instruction & Library (81.1%), and Management (75.9%), while the most female-oriented occupations are Business & Financial (100.0%), Computers, Engineering & Science (100.0%), and Computers & Mathematics (100.0%).
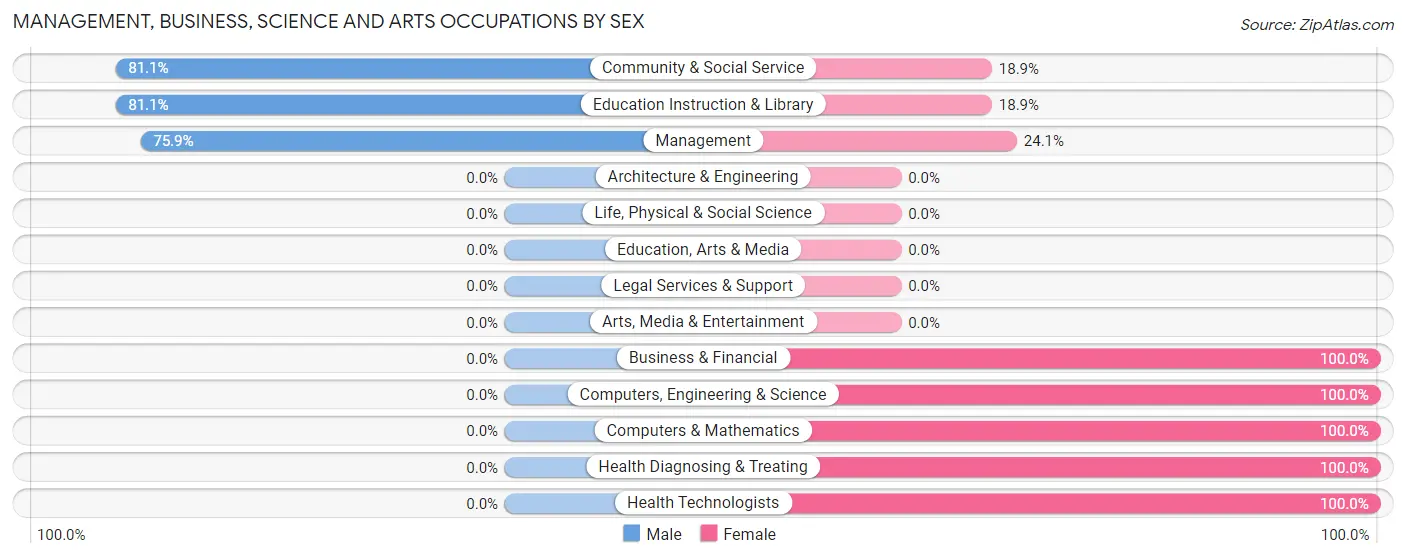
| Occupation | Male | Female |
| Management | 22 (75.9%) | 7 (24.1%) |
| Business & Financial | 0 (0.0%) | 3 (100.0%) |
| Computers, Engineering & Science | 0 (0.0%) | 12 (100.0%) |
| Computers & Mathematics | 0 (0.0%) | 12 (100.0%) |
| Architecture & Engineering | 0 (0.0%) | 0 (0.0%) |
| Life, Physical & Social Science | 0 (0.0%) | 0 (0.0%) |
| Community & Social Service | 30 (81.1%) | 7 (18.9%) |
| Education, Arts & Media | 0 (0.0%) | 0 (0.0%) |
| Legal Services & Support | 0 (0.0%) | 0 (0.0%) |
| Education Instruction & Library | 30 (81.1%) | 7 (18.9%) |
| Arts, Media & Entertainment | 0 (0.0%) | 0 (0.0%) |
| Health Diagnosing & Treating | 0 (0.0%) | 35 (100.0%) |
| Health Technologists | 0 (0.0%) | 19 (100.0%) |
| Total (Category) | 52 (44.8%) | 64 (55.2%) |
| Total (Overall) | 150 (51.0%) | 144 (49.0%) |
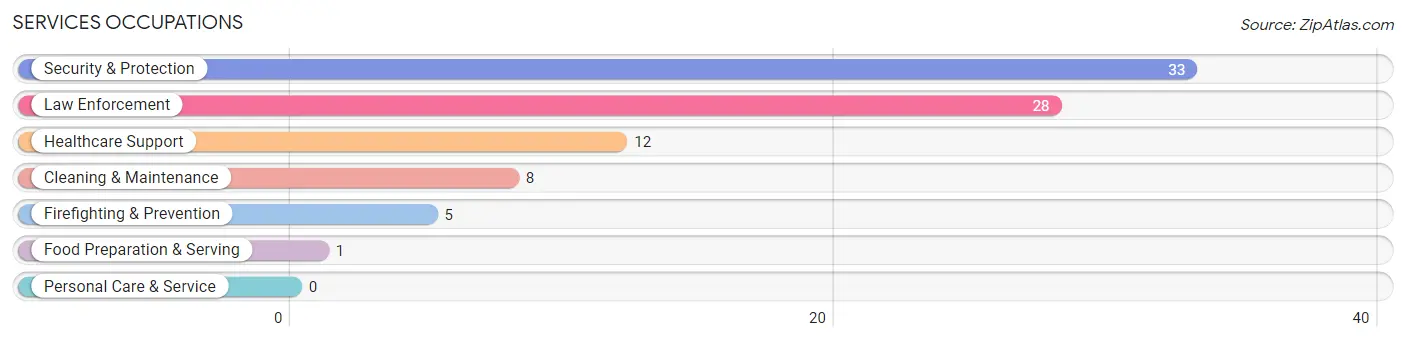
Services Occupations
The most common Services occupations in Granite are Security & Protection (33 | 11.2%), Law Enforcement (28 | 9.5%), Healthcare Support (12 | 4.1%), Cleaning & Maintenance (8 | 2.7%), and Firefighting & Prevention (5 | 1.7%).
Services Occupations by Sex
Within the Services occupations in Granite, the most male-oriented occupations are Firefighting & Prevention (100.0%), Security & Protection (97.0%), and Law Enforcement (96.4%), while the most female-oriented occupations are Food Preparation & Serving (100.0%), Cleaning & Maintenance (37.5%), and Healthcare Support (25.0%).
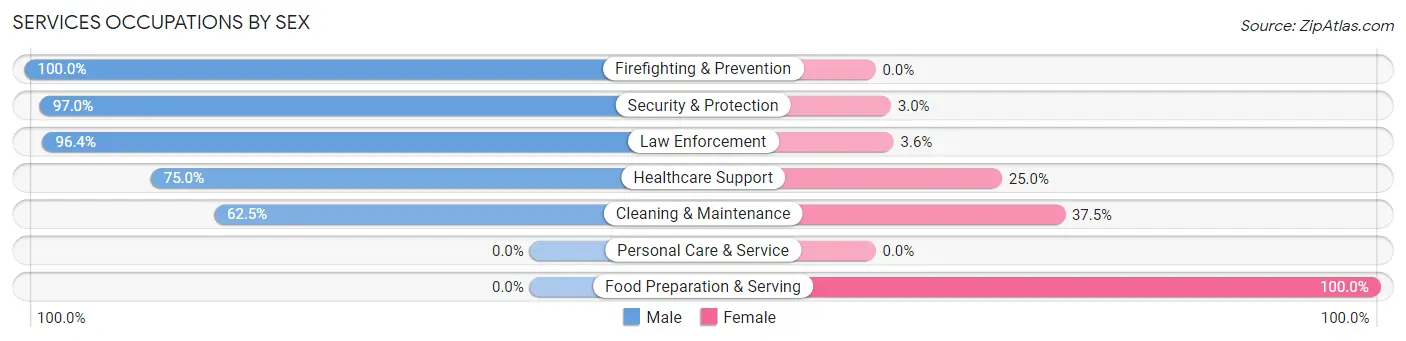
| Occupation | Male | Female |
| Healthcare Support | 9 (75.0%) | 3 (25.0%) |
| Security & Protection | 32 (97.0%) | 1 (3.0%) |
| Firefighting & Prevention | 5 (100.0%) | 0 (0.0%) |
| Law Enforcement | 27 (96.4%) | 1 (3.6%) |
| Food Preparation & Serving | 0 (0.0%) | 1 (100.0%) |
| Cleaning & Maintenance | 5 (62.5%) | 3 (37.5%) |
| Personal Care & Service | 0 (0.0%) | 0 (0.0%) |
| Total (Category) | 46 (85.2%) | 8 (14.8%) |
| Total (Overall) | 150 (51.0%) | 144 (49.0%) |
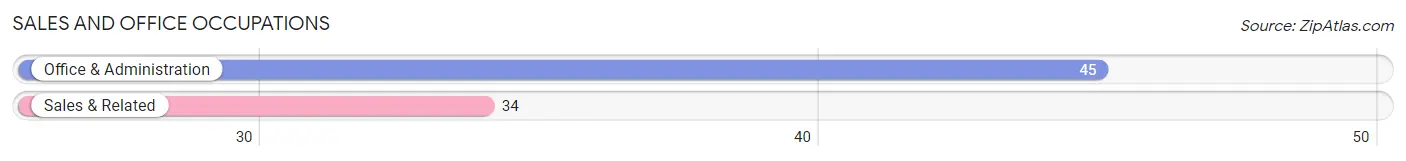
Sales and Office Occupations
The most common Sales and Office occupations in Granite are Office & Administration (45 | 15.3%), and Sales & Related (34 | 11.6%).
Sales and Office Occupations by Sex
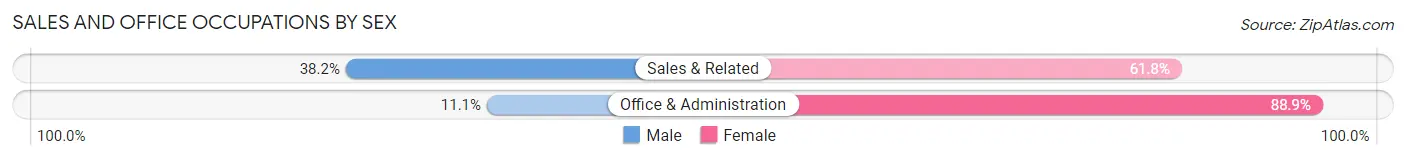
| Occupation | Male | Female |
| Sales & Related | 13 (38.2%) | 21 (61.8%) |
| Office & Administration | 5 (11.1%) | 40 (88.9%) |
| Total (Category) | 18 (22.8%) | 61 (77.2%) |
| Total (Overall) | 150 (51.0%) | 144 (49.0%) |
Natural Resources, Construction and Maintenance Occupations
The most common Natural Resources, Construction and Maintenance occupations in Granite are Installation, Maintenance & Repair (11 | 3.7%), and Construction & Extraction (4 | 1.4%).
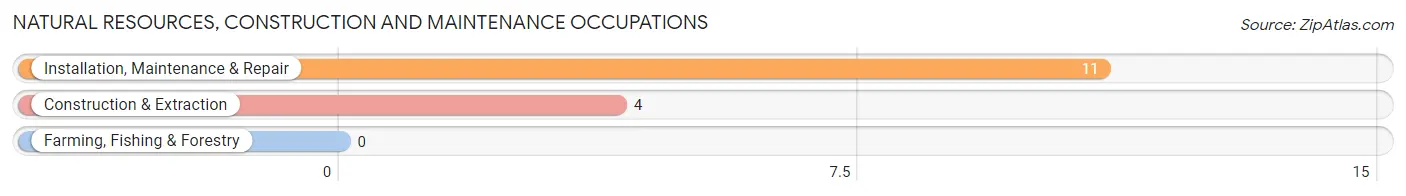
Natural Resources, Construction and Maintenance Occupations by Sex
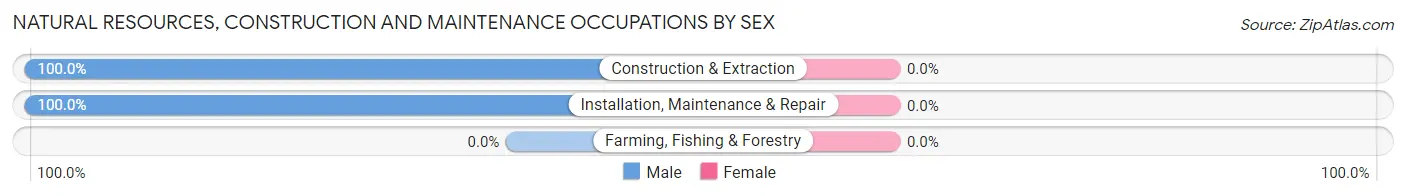
| Occupation | Male | Female |
| Farming, Fishing & Forestry | 0 (0.0%) | 0 (0.0%) |
| Construction & Extraction | 4 (100.0%) | 0 (0.0%) |
| Installation, Maintenance & Repair | 11 (100.0%) | 0 (0.0%) |
| Total (Category) | 15 (100.0%) | 0 (0.0%) |
| Total (Overall) | 150 (51.0%) | 144 (49.0%) |
Production, Transportation and Moving Occupations
The most common Production, Transportation and Moving occupations in Granite are Production (11 | 3.7%), Material Moving (11 | 3.7%), and Transportation (8 | 2.7%).
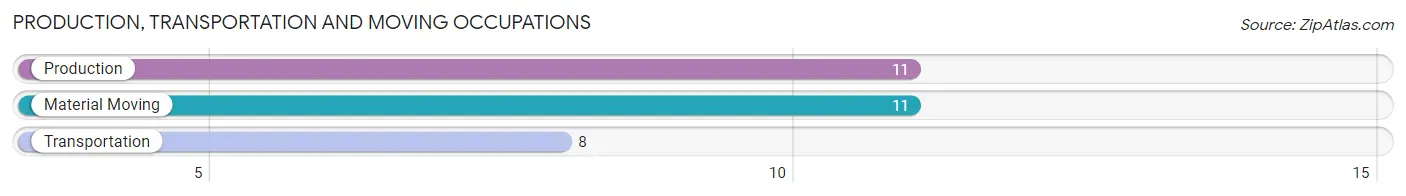
Production, Transportation and Moving Occupations by Sex
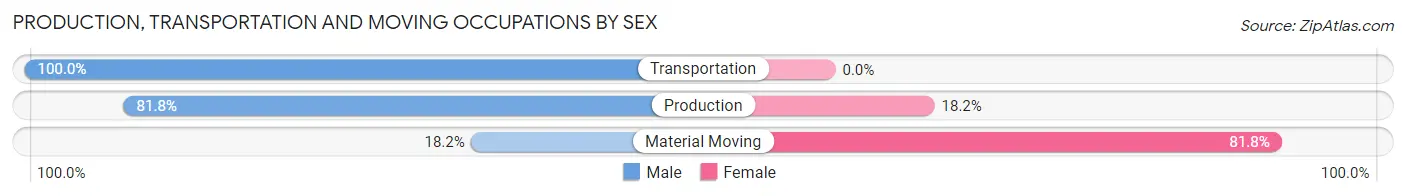
| Occupation | Male | Female |
| Production | 9 (81.8%) | 2 (18.2%) |
| Transportation | 8 (100.0%) | 0 (0.0%) |
| Material Moving | 2 (18.2%) | 9 (81.8%) |
| Total (Category) | 19 (63.3%) | 11 (36.7%) |
| Total (Overall) | 150 (51.0%) | 144 (49.0%) |
Employment Industries by Sex in Granite
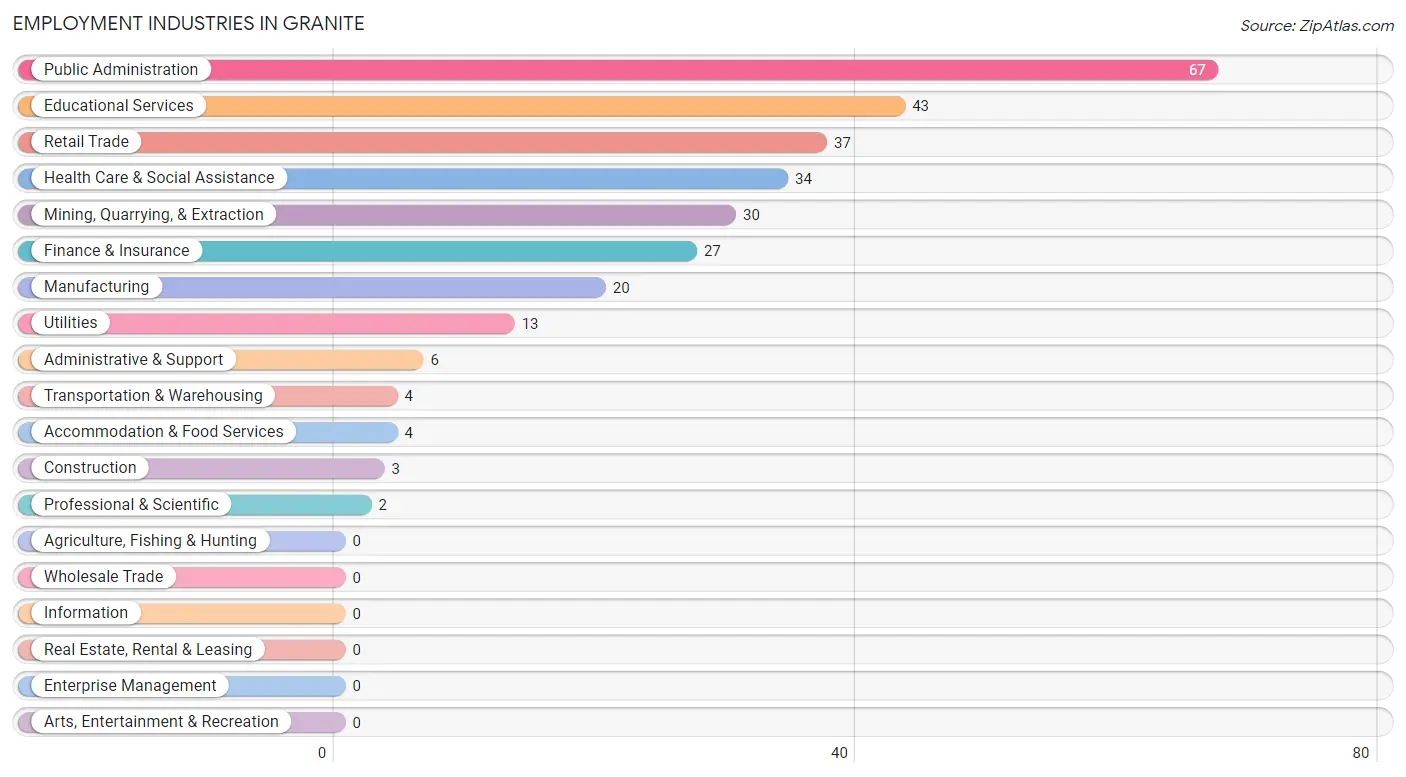
Employment Industries in Granite
The major employment industries in Granite include Public Administration (67 | 22.8%), Educational Services (43 | 14.6%), Retail Trade (37 | 12.6%), Health Care & Social Assistance (34 | 11.6%), and Mining, Quarrying, & Extraction (30 | 10.2%).
Employment Industries by Sex in Granite
The Granite industries that see more men than women are Mining, Quarrying, & Extraction (100.0%), Construction (100.0%), and Utilities (100.0%), whereas the industries that tend to have a higher number of women are Transportation & Warehousing (100.0%), Professional & Scientific (100.0%), and Administrative & Support (100.0%).
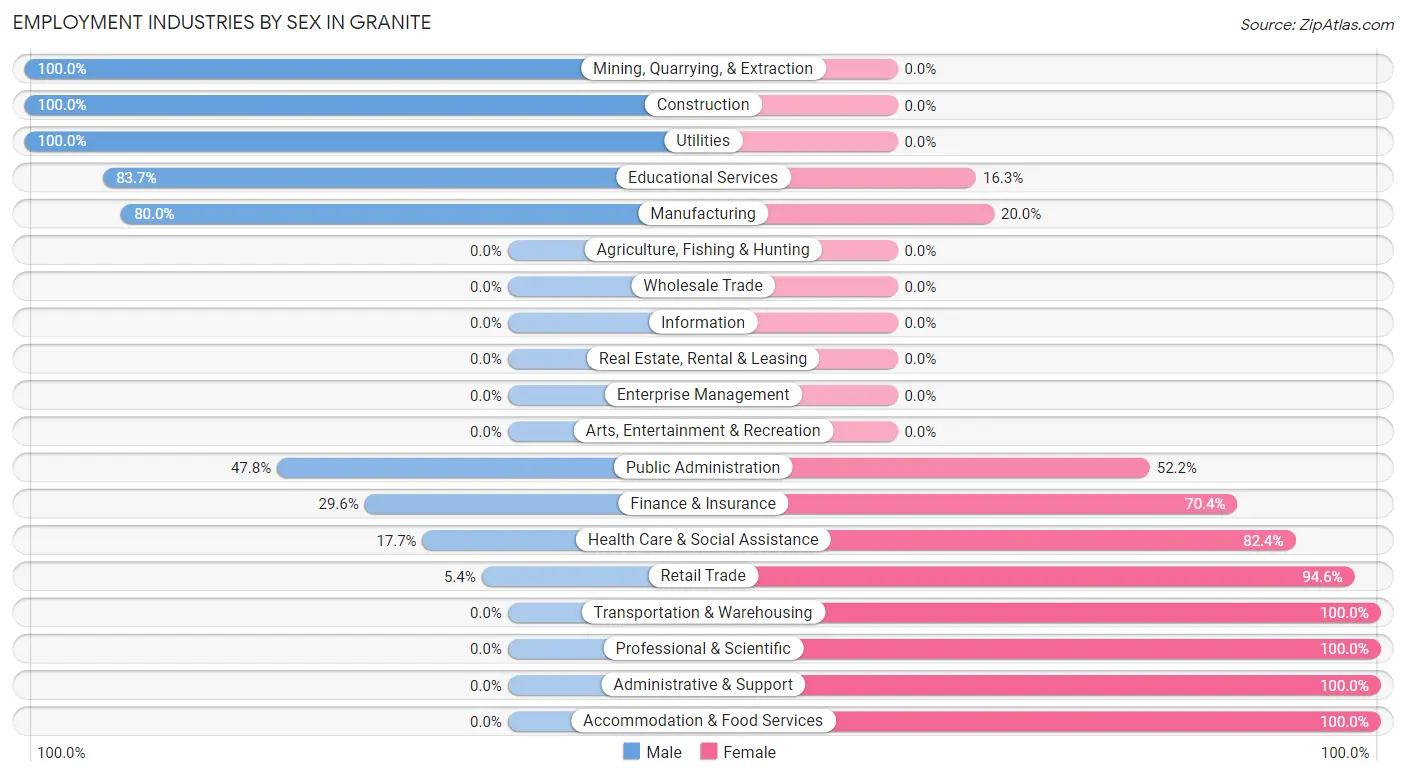
| Industry | Male | Female |
| Agriculture, Fishing & Hunting | 0 (0.0%) | 0 (0.0%) |
| Mining, Quarrying, & Extraction | 30 (100.0%) | 0 (0.0%) |
| Construction | 3 (100.0%) | 0 (0.0%) |
| Manufacturing | 16 (80.0%) | 4 (20.0%) |
| Wholesale Trade | 0 (0.0%) | 0 (0.0%) |
| Retail Trade | 2 (5.4%) | 35 (94.6%) |
| Transportation & Warehousing | 0 (0.0%) | 4 (100.0%) |
| Utilities | 13 (100.0%) | 0 (0.0%) |
| Information | 0 (0.0%) | 0 (0.0%) |
| Finance & Insurance | 8 (29.6%) | 19 (70.4%) |
| Real Estate, Rental & Leasing | 0 (0.0%) | 0 (0.0%) |
| Professional & Scientific | 0 (0.0%) | 2 (100.0%) |
| Enterprise Management | 0 (0.0%) | 0 (0.0%) |
| Administrative & Support | 0 (0.0%) | 6 (100.0%) |
| Educational Services | 36 (83.7%) | 7 (16.3%) |
| Health Care & Social Assistance | 6 (17.6%) | 28 (82.4%) |
| Arts, Entertainment & Recreation | 0 (0.0%) | 0 (0.0%) |
| Accommodation & Food Services | 0 (0.0%) | 4 (100.0%) |
| Public Administration | 32 (47.8%) | 35 (52.2%) |
| Total | 150 (51.0%) | 144 (49.0%) |
Education in Granite
School Enrollment in Granite
The most common levels of schooling among the 152 students in Granite are middle school (46 | 30.3%), high school (46 | 30.3%), and college / undergraduate (42 | 27.6%).
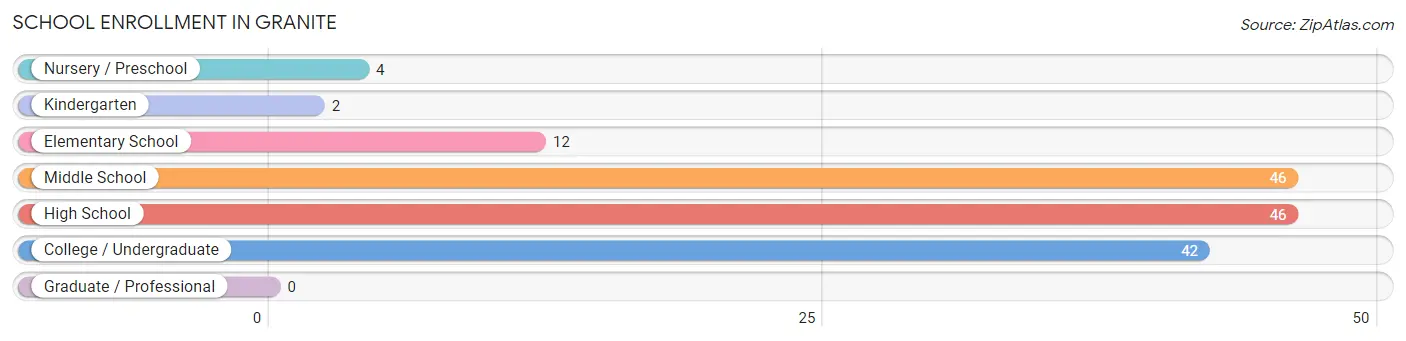
| School Level | # Students | % Students |
| Nursery / Preschool | 4 | 2.6% |
| Kindergarten | 2 | 1.3% |
| Elementary School | 12 | 7.9% |
| Middle School | 46 | 30.3% |
| High School | 46 | 30.3% |
| College / Undergraduate | 42 | 27.6% |
| Graduate / Professional | 0 | 0.0% |
| Total | 152 | 100.0% |
School Enrollment by Age by Funding Source in Granite
Out of a total of 152 students who are enrolled in schools in Granite, 28 (18.4%) attend a private institution, while the remaining 124 (81.6%) are enrolled in public schools. The age group of 35 years and over has the highest likelihood of being enrolled in private schools, with 19 (82.6% in the age bracket) enrolled. Conversely, the age group of 3 to 4 year olds has the lowest likelihood of being enrolled in a private school, with 4 (100.0% in the age bracket) attending a public institution.
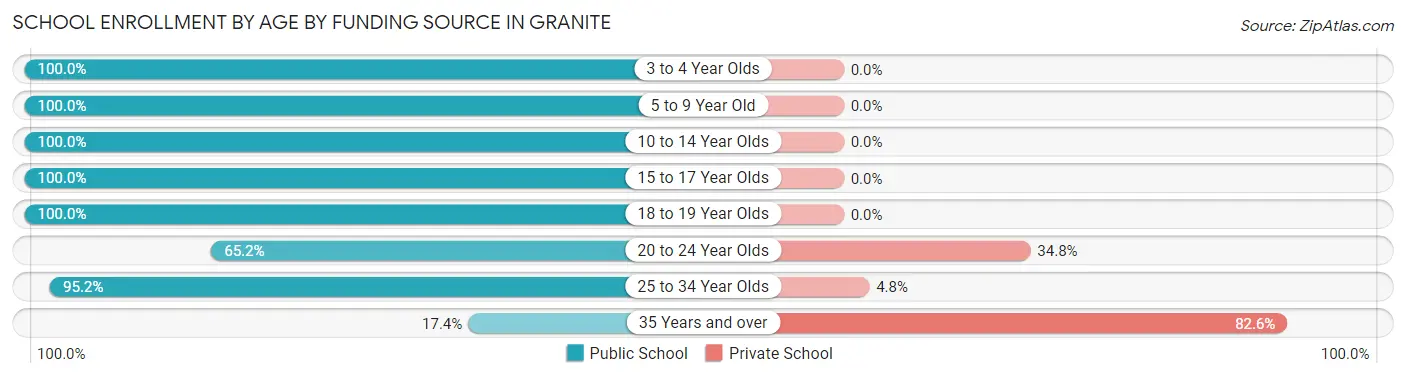
| Age Bracket | Public School | Private School |
| 3 to 4 Year Olds | 4 (100.0%) | 0 (0.0%) |
| 5 to 9 Year Old | 14 (100.0%) | 0 (0.0%) |
| 10 to 14 Year Olds | 45 (100.0%) | 0 (0.0%) |
| 15 to 17 Year Olds | 14 (100.0%) | 0 (0.0%) |
| 18 to 19 Year Olds | 8 (100.0%) | 0 (0.0%) |
| 20 to 24 Year Olds | 15 (65.2%) | 8 (34.8%) |
| 25 to 34 Year Olds | 20 (95.2%) | 1 (4.8%) |
| 35 Years and over | 4 (17.4%) | 19 (82.6%) |
| Total | 124 (81.6%) | 28 (18.4%) |
Educational Attainment by Field of Study in Granite
Education (72 | 52.5%), science & technology (20 | 14.6%), physical & health sciences (18 | 13.1%), psychology (8 | 5.8%), and business (7 | 5.1%) are the most common fields of study among 137 individuals in Granite who have obtained a bachelor's degree or higher.
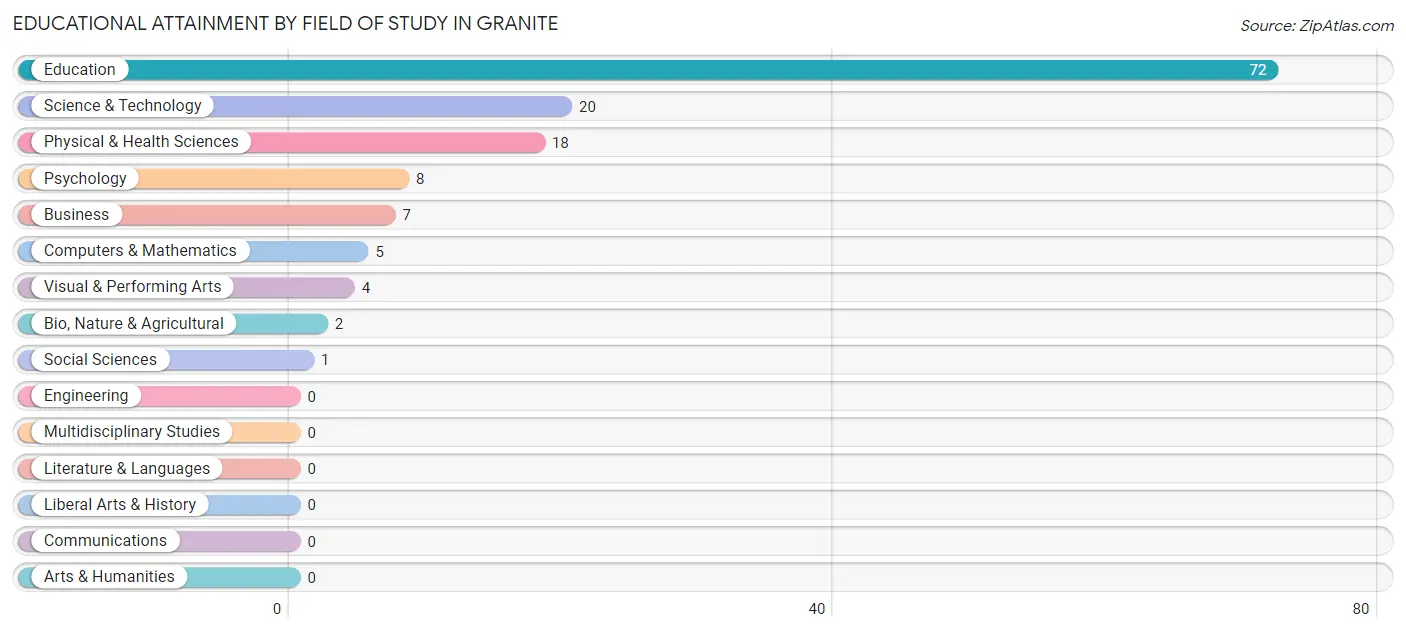
| Field of Study | # Graduates | % Graduates |
| Computers & Mathematics | 5 | 3.6% |
| Bio, Nature & Agricultural | 2 | 1.5% |
| Physical & Health Sciences | 18 | 13.1% |
| Psychology | 8 | 5.8% |
| Social Sciences | 1 | 0.7% |
| Engineering | 0 | 0.0% |
| Multidisciplinary Studies | 0 | 0.0% |
| Science & Technology | 20 | 14.6% |
| Business | 7 | 5.1% |
| Education | 72 | 52.5% |
| Literature & Languages | 0 | 0.0% |
| Liberal Arts & History | 0 | 0.0% |
| Visual & Performing Arts | 4 | 2.9% |
| Communications | 0 | 0.0% |
| Arts & Humanities | 0 | 0.0% |
| Total | 137 | 100.0% |
Transportation & Commute in Granite
Vehicle Availability by Sex in Granite
The most prevalent vehicle ownership categories in Granite are males with 3 vehicles (52, accounting for 34.0%) and females with 3 vehicles (30, making up 36.1%).
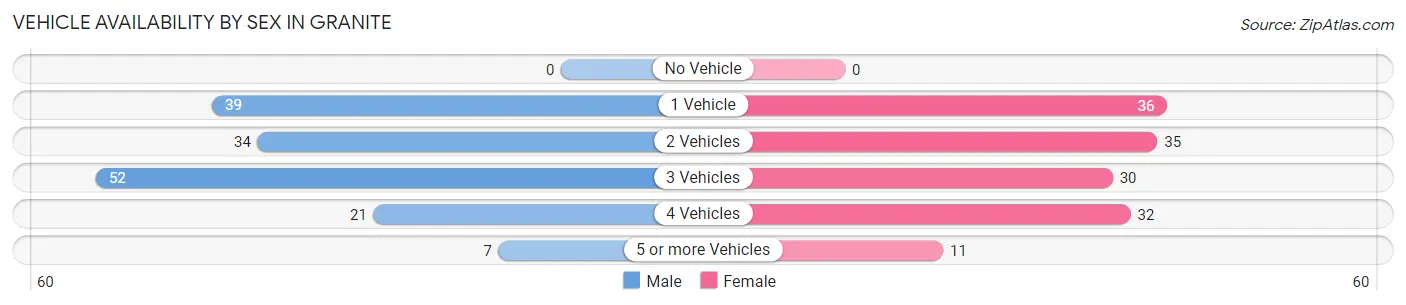
| Vehicles Available | Male | Female |
| No Vehicle | 0 (0.0%) | 0 (0.0%) |
| 1 Vehicle | 39 (25.5%) | 36 (25.0%) |
| 2 Vehicles | 34 (22.2%) | 35 (24.3%) |
| 3 Vehicles | 52 (34.0%) | 30 (20.8%) |
| 4 Vehicles | 21 (13.7%) | 32 (22.2%) |
| 5 or more Vehicles | 7 (4.6%) | 11 (7.6%) |
| Total | 153 (100.0%) | 144 (100.0%) |
Commute Time in Granite
The most frequently occuring commute durations in Granite are less than 5 minutes (74 commuters, 25.3%), 30 to 34 minutes (69 commuters, 23.6%), and 40 to 44 minutes (39 commuters, 13.4%).
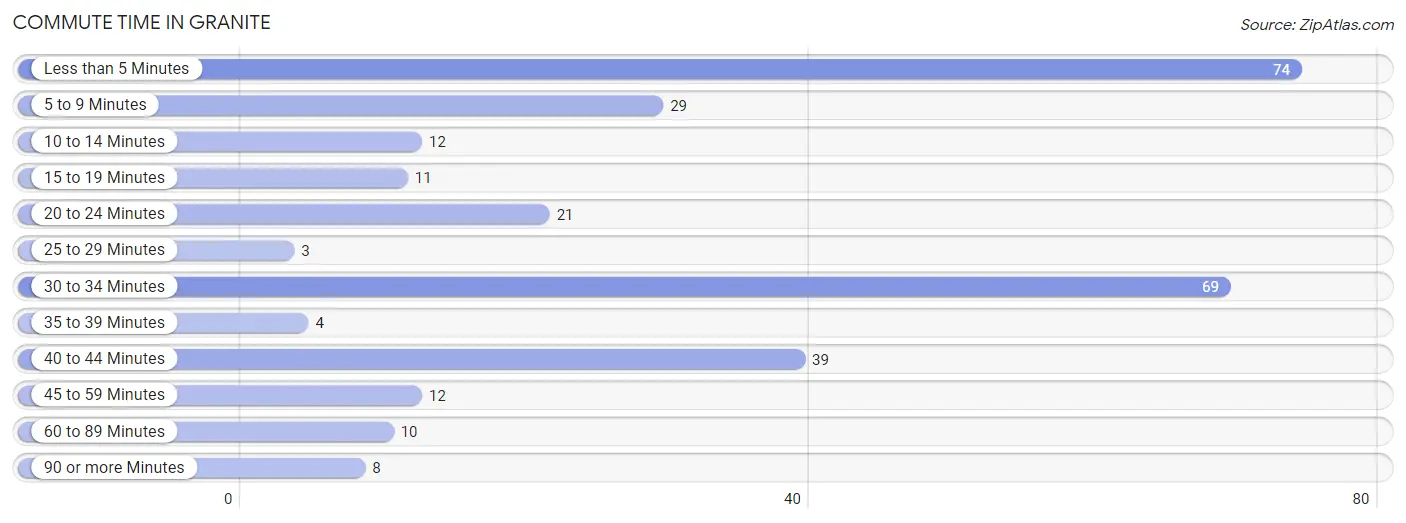
| Commute Time | # Commuters | % Commuters |
| Less than 5 Minutes | 74 | 25.3% |
| 5 to 9 Minutes | 29 | 9.9% |
| 10 to 14 Minutes | 12 | 4.1% |
| 15 to 19 Minutes | 11 | 3.8% |
| 20 to 24 Minutes | 21 | 7.2% |
| 25 to 29 Minutes | 3 | 1.0% |
| 30 to 34 Minutes | 69 | 23.6% |
| 35 to 39 Minutes | 4 | 1.4% |
| 40 to 44 Minutes | 39 | 13.4% |
| 45 to 59 Minutes | 12 | 4.1% |
| 60 to 89 Minutes | 10 | 3.4% |
| 90 or more Minutes | 8 | 2.7% |
Commute Time by Sex in Granite
The most common commute times in Granite are less than 5 minutes (52 commuters, 34.7%) for males and 30 to 34 minutes (41 commuters, 28.9%) for females.
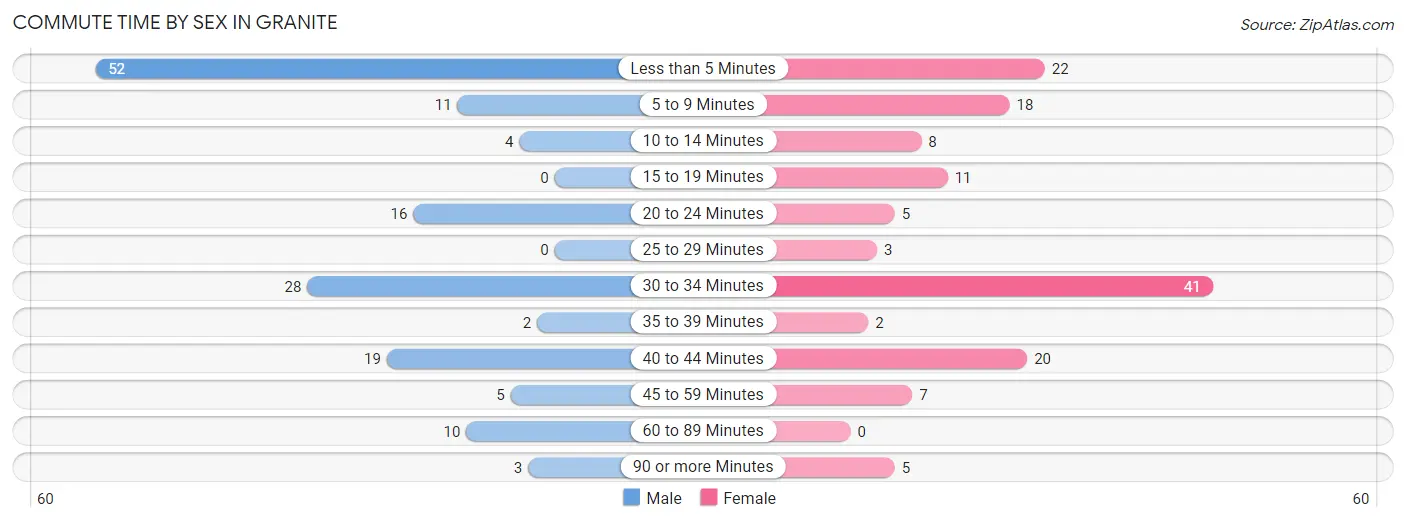
| Commute Time | Male | Female |
| Less than 5 Minutes | 52 (34.7%) | 22 (15.5%) |
| 5 to 9 Minutes | 11 (7.3%) | 18 (12.7%) |
| 10 to 14 Minutes | 4 (2.7%) | 8 (5.6%) |
| 15 to 19 Minutes | 0 (0.0%) | 11 (7.7%) |
| 20 to 24 Minutes | 16 (10.7%) | 5 (3.5%) |
| 25 to 29 Minutes | 0 (0.0%) | 3 (2.1%) |
| 30 to 34 Minutes | 28 (18.7%) | 41 (28.9%) |
| 35 to 39 Minutes | 2 (1.3%) | 2 (1.4%) |
| 40 to 44 Minutes | 19 (12.7%) | 20 (14.1%) |
| 45 to 59 Minutes | 5 (3.3%) | 7 (4.9%) |
| 60 to 89 Minutes | 10 (6.7%) | 0 (0.0%) |
| 90 or more Minutes | 3 (2.0%) | 5 (3.5%) |
Time of Departure to Work by Sex in Granite
The most frequent times of departure to work in Granite are 7:00 AM to 7:29 AM (41, 27.3%) for males and 7:00 AM to 7:29 AM (48, 33.8%) for females.
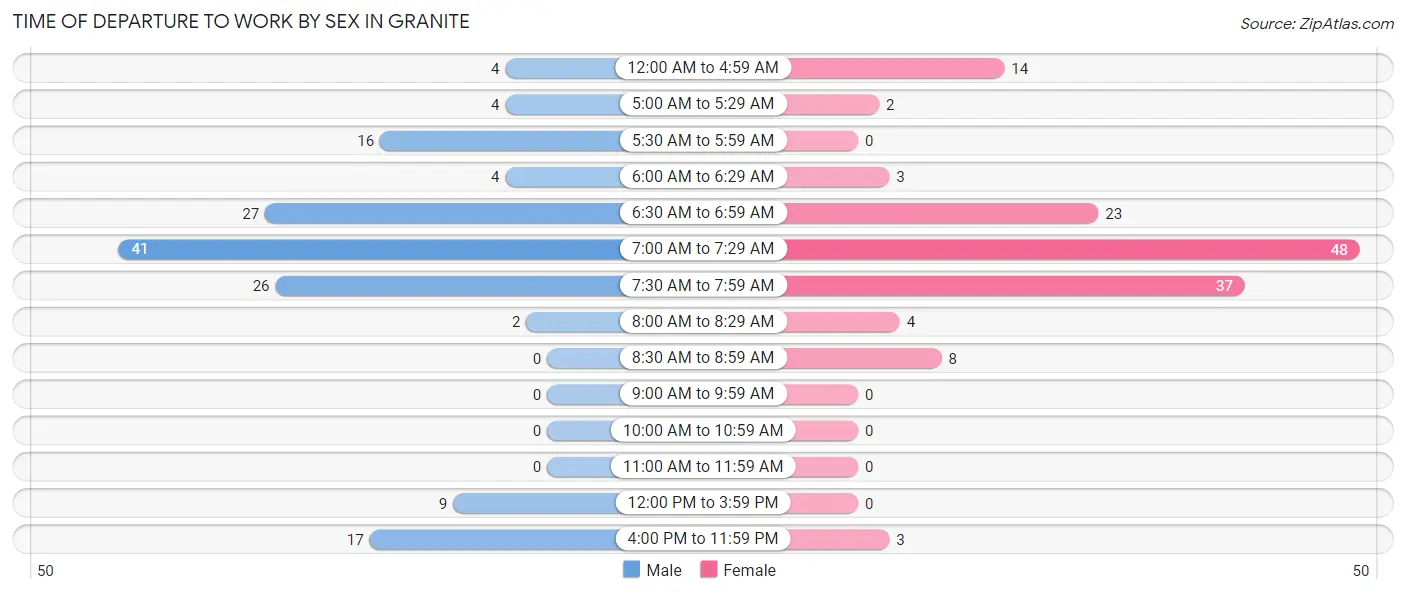
| Time of Departure | Male | Female |
| 12:00 AM to 4:59 AM | 4 (2.7%) | 14 (9.9%) |
| 5:00 AM to 5:29 AM | 4 (2.7%) | 2 (1.4%) |
| 5:30 AM to 5:59 AM | 16 (10.7%) | 0 (0.0%) |
| 6:00 AM to 6:29 AM | 4 (2.7%) | 3 (2.1%) |
| 6:30 AM to 6:59 AM | 27 (18.0%) | 23 (16.2%) |
| 7:00 AM to 7:29 AM | 41 (27.3%) | 48 (33.8%) |
| 7:30 AM to 7:59 AM | 26 (17.3%) | 37 (26.1%) |
| 8:00 AM to 8:29 AM | 2 (1.3%) | 4 (2.8%) |
| 8:30 AM to 8:59 AM | 0 (0.0%) | 8 (5.6%) |
| 9:00 AM to 9:59 AM | 0 (0.0%) | 0 (0.0%) |
| 10:00 AM to 10:59 AM | 0 (0.0%) | 0 (0.0%) |
| 11:00 AM to 11:59 AM | 0 (0.0%) | 0 (0.0%) |
| 12:00 PM to 3:59 PM | 9 (6.0%) | 0 (0.0%) |
| 4:00 PM to 11:59 PM | 17 (11.3%) | 3 (2.1%) |
| Total | 150 (100.0%) | 142 (100.0%) |
Housing Occupancy in Granite
Occupancy by Ownership in Granite
Of the total 340 dwellings in Granite, owner-occupied units account for 261 (76.8%), while renter-occupied units make up 79 (23.2%).
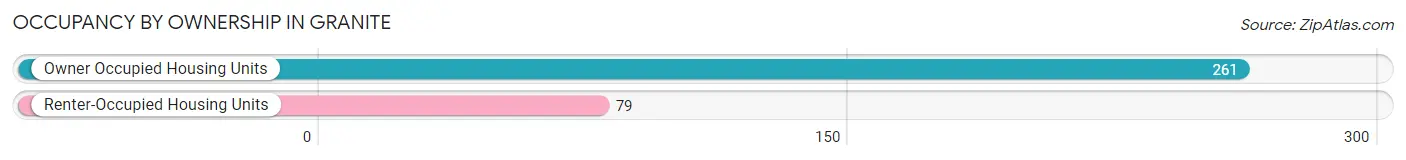
| Occupancy | # Housing Units | % Housing Units |
| Owner Occupied Housing Units | 261 | 76.8% |
| Renter-Occupied Housing Units | 79 | 23.2% |
| Total Occupied Housing Units | 340 | 100.0% |
Occupancy by Household Size in Granite
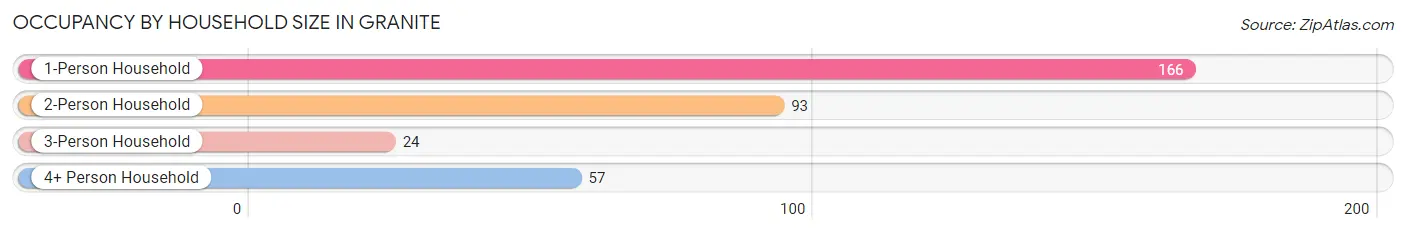
| Household Size | # Housing Units | % Housing Units |
| 1-Person Household | 166 | 48.8% |
| 2-Person Household | 93 | 27.4% |
| 3-Person Household | 24 | 7.1% |
| 4+ Person Household | 57 | 16.8% |
| Total Housing Units | 340 | 100.0% |
Occupancy by Ownership by Household Size in Granite
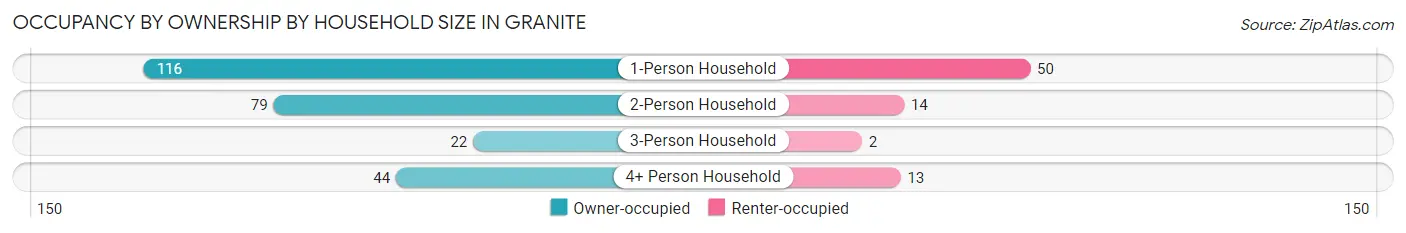
| Household Size | Owner-occupied | Renter-occupied |
| 1-Person Household | 116 (69.9%) | 50 (30.1%) |
| 2-Person Household | 79 (85.0%) | 14 (15.0%) |
| 3-Person Household | 22 (91.7%) | 2 (8.3%) |
| 4+ Person Household | 44 (77.2%) | 13 (22.8%) |
| Total Housing Units | 261 (76.8%) | 79 (23.2%) |
Occupancy by Educational Attainment in Granite
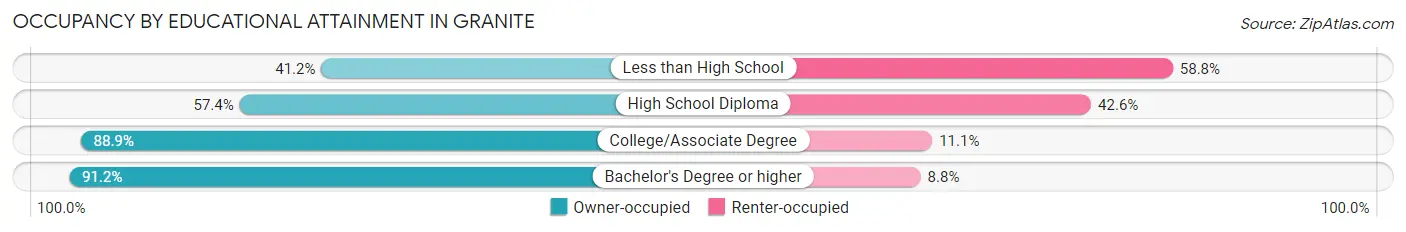
| Household Size | Owner-occupied | Renter-occupied |
| Less than High School | 21 (41.2%) | 30 (58.8%) |
| High School Diploma | 35 (57.4%) | 26 (42.6%) |
| College/Associate Degree | 112 (88.9%) | 14 (11.1%) |
| Bachelor's Degree or higher | 93 (91.2%) | 9 (8.8%) |
Occupancy by Age of Householder in Granite
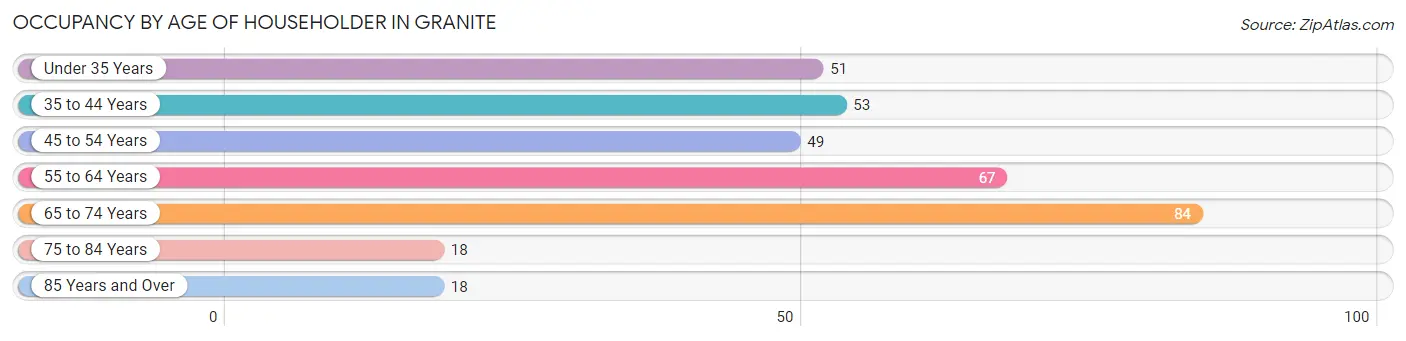
| Age Bracket | # Households | % Households |
| Under 35 Years | 51 | 15.0% |
| 35 to 44 Years | 53 | 15.6% |
| 45 to 54 Years | 49 | 14.4% |
| 55 to 64 Years | 67 | 19.7% |
| 65 to 74 Years | 84 | 24.7% |
| 75 to 84 Years | 18 | 5.3% |
| 85 Years and Over | 18 | 5.3% |
| Total | 340 | 100.0% |
Housing Finances in Granite
Median Income by Occupancy in Granite
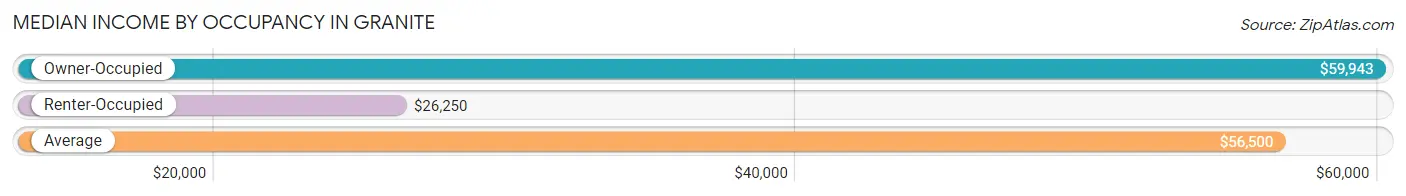
| Occupancy Type | # Households | Median Income |
| Owner-Occupied | 261 (76.8%) | $59,943 |
| Renter-Occupied | 79 (23.2%) | $26,250 |
| Average | 340 (100.0%) | $56,500 |
Occupancy by Householder Income Bracket in Granite
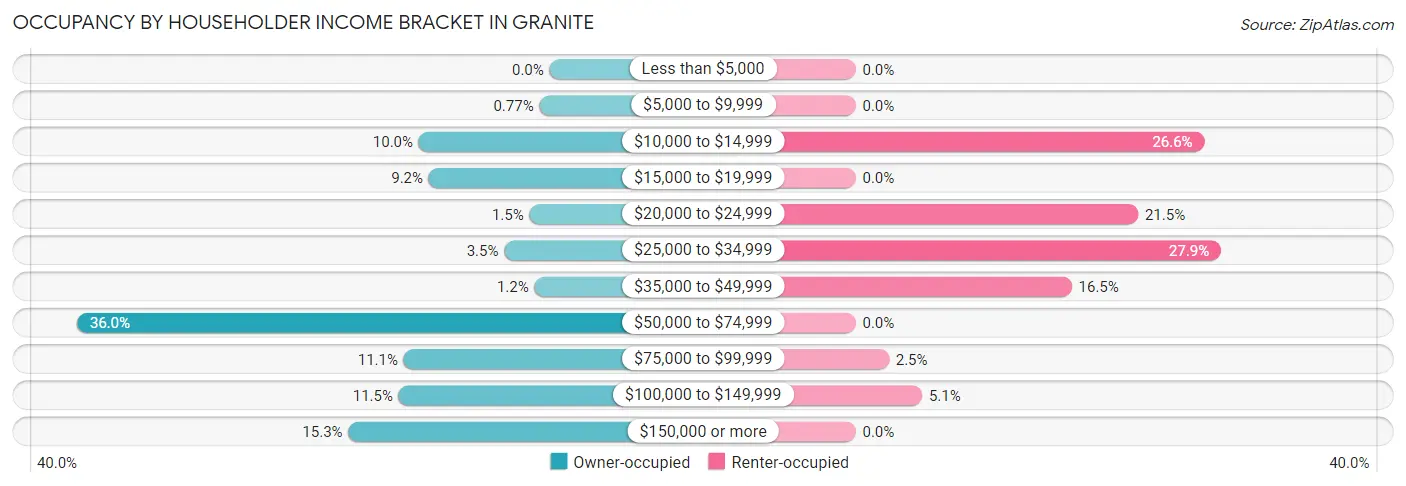
| Income Bracket | Owner-occupied | Renter-occupied |
| Less than $5,000 | 0 (0.0%) | 0 (0.0%) |
| $5,000 to $9,999 | 2 (0.8%) | 0 (0.0%) |
| $10,000 to $14,999 | 26 (10.0%) | 21 (26.6%) |
| $15,000 to $19,999 | 24 (9.2%) | 0 (0.0%) |
| $20,000 to $24,999 | 4 (1.5%) | 17 (21.5%) |
| $25,000 to $34,999 | 9 (3.5%) | 22 (27.9%) |
| $35,000 to $49,999 | 3 (1.1%) | 13 (16.5%) |
| $50,000 to $74,999 | 94 (36.0%) | 0 (0.0%) |
| $75,000 to $99,999 | 29 (11.1%) | 2 (2.5%) |
| $100,000 to $149,999 | 30 (11.5%) | 4 (5.1%) |
| $150,000 or more | 40 (15.3%) | 0 (0.0%) |
| Total | 261 (100.0%) | 79 (100.0%) |
Monthly Housing Cost Tiers in Granite
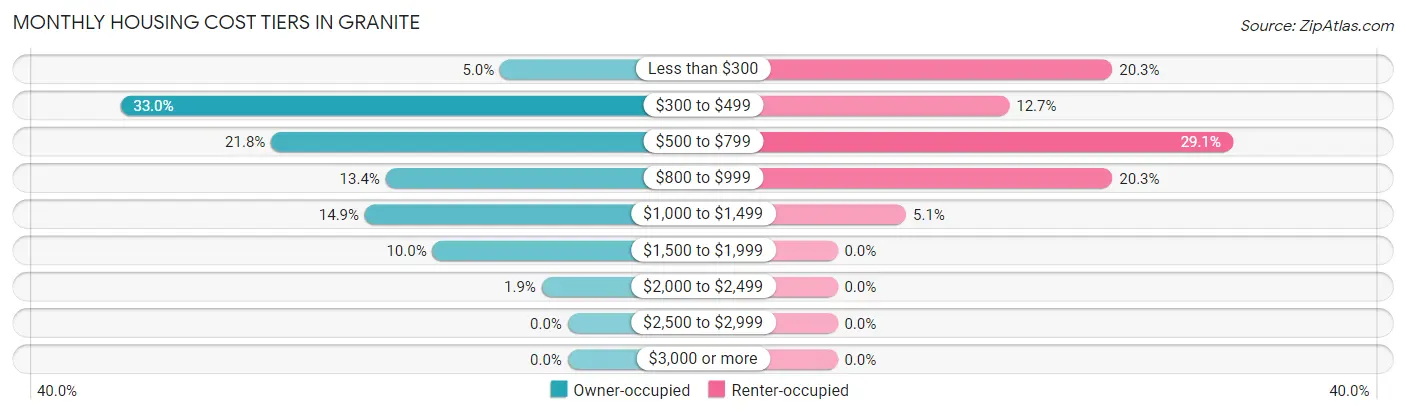
| Monthly Cost | Owner-occupied | Renter-occupied |
| Less than $300 | 13 (5.0%) | 16 (20.3%) |
| $300 to $499 | 86 (33.0%) | 10 (12.7%) |
| $500 to $799 | 57 (21.8%) | 23 (29.1%) |
| $800 to $999 | 35 (13.4%) | 16 (20.3%) |
| $1,000 to $1,499 | 39 (14.9%) | 4 (5.1%) |
| $1,500 to $1,999 | 26 (10.0%) | 0 (0.0%) |
| $2,000 to $2,499 | 5 (1.9%) | 0 (0.0%) |
| $2,500 to $2,999 | 0 (0.0%) | 0 (0.0%) |
| $3,000 or more | 0 (0.0%) | 0 (0.0%) |
| Total | 261 (100.0%) | 79 (100.0%) |
Physical Housing Characteristics in Granite
Housing Structures in Granite
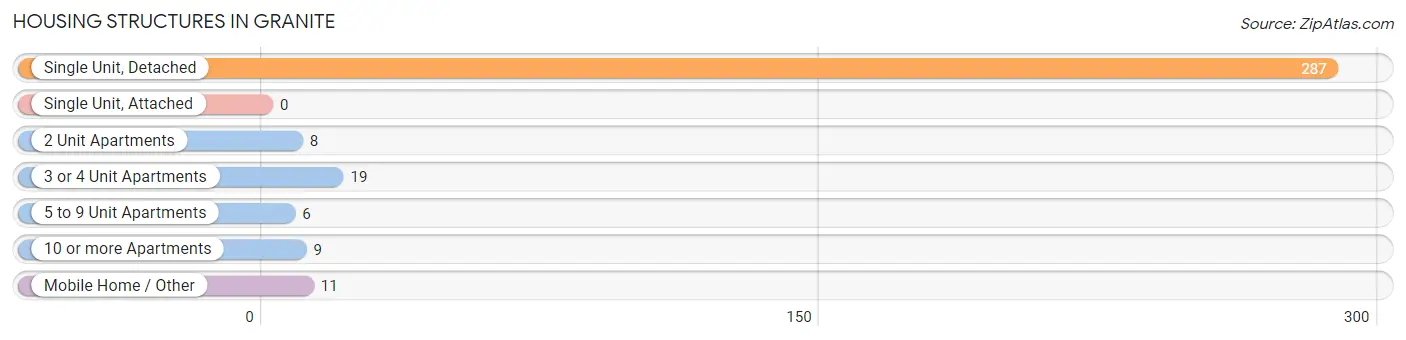
| Structure Type | # Housing Units | % Housing Units |
| Single Unit, Detached | 287 | 84.4% |
| Single Unit, Attached | 0 | 0.0% |
| 2 Unit Apartments | 8 | 2.4% |
| 3 or 4 Unit Apartments | 19 | 5.6% |
| 5 to 9 Unit Apartments | 6 | 1.8% |
| 10 or more Apartments | 9 | 2.6% |
| Mobile Home / Other | 11 | 3.2% |
| Total | 340 | 100.0% |
Housing Structures by Occupancy in Granite
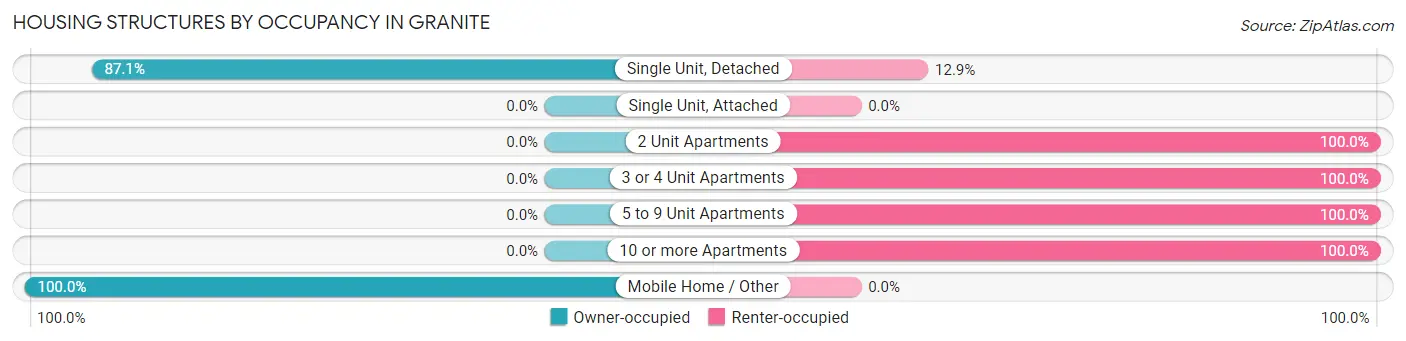
| Structure Type | Owner-occupied | Renter-occupied |
| Single Unit, Detached | 250 (87.1%) | 37 (12.9%) |
| Single Unit, Attached | 0 (0.0%) | 0 (0.0%) |
| 2 Unit Apartments | 0 (0.0%) | 8 (100.0%) |
| 3 or 4 Unit Apartments | 0 (0.0%) | 19 (100.0%) |
| 5 to 9 Unit Apartments | 0 (0.0%) | 6 (100.0%) |
| 10 or more Apartments | 0 (0.0%) | 9 (100.0%) |
| Mobile Home / Other | 11 (100.0%) | 0 (0.0%) |
| Total | 261 (76.8%) | 79 (23.2%) |
Housing Structures by Number of Rooms in Granite
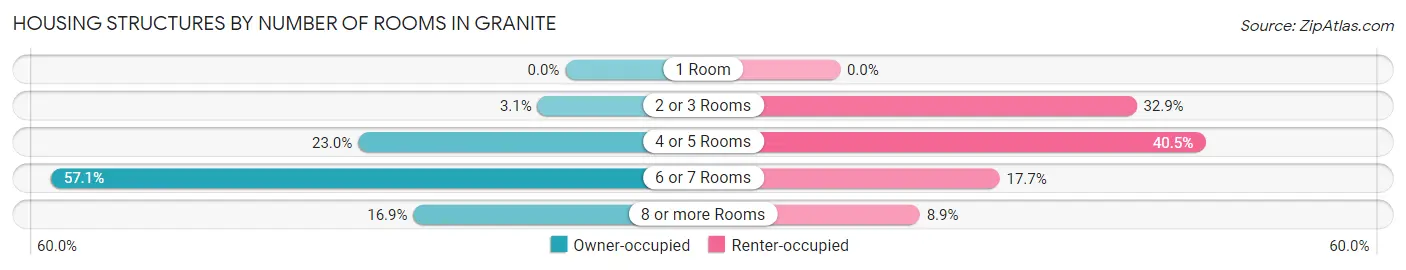
| Number of Rooms | Owner-occupied | Renter-occupied |
| 1 Room | 0 (0.0%) | 0 (0.0%) |
| 2 or 3 Rooms | 8 (3.1%) | 26 (32.9%) |
| 4 or 5 Rooms | 60 (23.0%) | 32 (40.5%) |
| 6 or 7 Rooms | 149 (57.1%) | 14 (17.7%) |
| 8 or more Rooms | 44 (16.9%) | 7 (8.9%) |
| Total | 261 (100.0%) | 79 (100.0%) |
Housing Structure by Heating Type in Granite
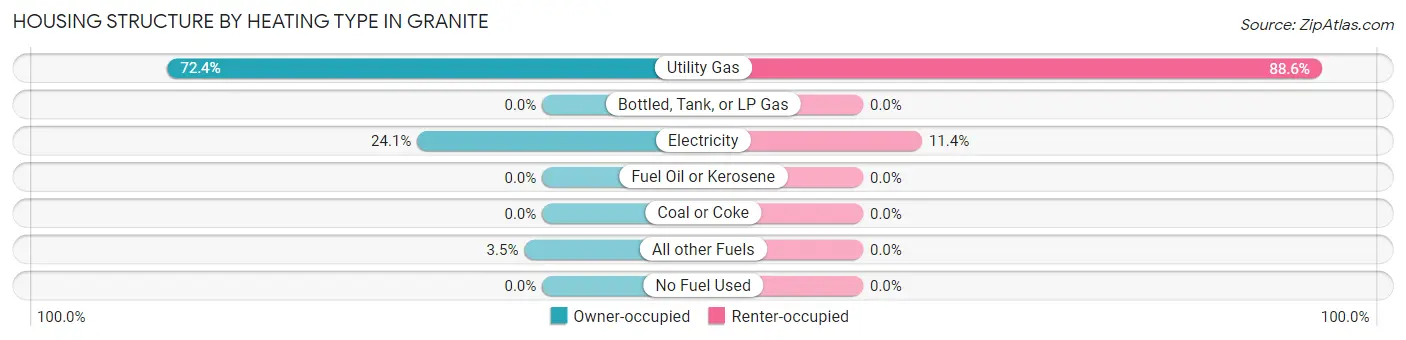
| Heating Type | Owner-occupied | Renter-occupied |
| Utility Gas | 189 (72.4%) | 70 (88.6%) |
| Bottled, Tank, or LP Gas | 0 (0.0%) | 0 (0.0%) |
| Electricity | 63 (24.1%) | 9 (11.4%) |
| Fuel Oil or Kerosene | 0 (0.0%) | 0 (0.0%) |
| Coal or Coke | 0 (0.0%) | 0 (0.0%) |
| All other Fuels | 9 (3.5%) | 0 (0.0%) |
| No Fuel Used | 0 (0.0%) | 0 (0.0%) |
| Total | 261 (100.0%) | 79 (100.0%) |
Household Vehicle Usage in Granite
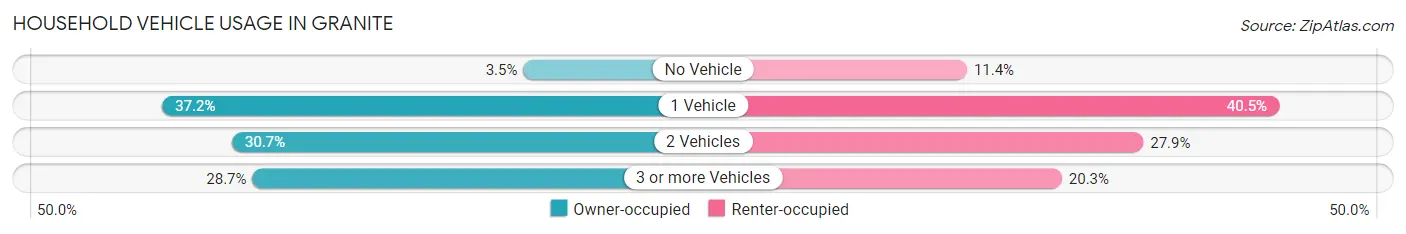
| Vehicles per Household | Owner-occupied | Renter-occupied |
| No Vehicle | 9 (3.5%) | 9 (11.4%) |
| 1 Vehicle | 97 (37.2%) | 32 (40.5%) |
| 2 Vehicles | 80 (30.6%) | 22 (27.9%) |
| 3 or more Vehicles | 75 (28.7%) | 16 (20.3%) |
| Total | 261 (100.0%) | 79 (100.0%) |
Real Estate & Mortgages in Granite
Real Estate and Mortgage Overview in Granite
| Characteristic | Without Mortgage | With Mortgage |
| Housing Units | 143 | 118 |
| Median Property Value | $76,100 | $107,900 |
| Median Household Income | $58,375 | $35 |
| Monthly Housing Costs | $443 | $0 |
| Real Estate Taxes | $480 | $32 |
Property Value by Mortgage Status in Granite
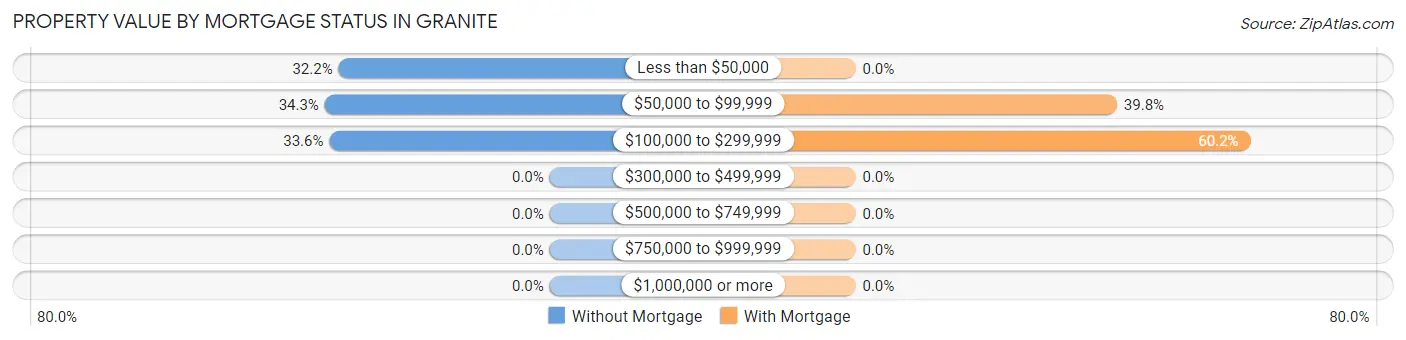
| Property Value | Without Mortgage | With Mortgage |
| Less than $50,000 | 46 (32.2%) | 0 (0.0%) |
| $50,000 to $99,999 | 49 (34.3%) | 47 (39.8%) |
| $100,000 to $299,999 | 48 (33.6%) | 71 (60.2%) |
| $300,000 to $499,999 | 0 (0.0%) | 0 (0.0%) |
| $500,000 to $749,999 | 0 (0.0%) | 0 (0.0%) |
| $750,000 to $999,999 | 0 (0.0%) | 0 (0.0%) |
| $1,000,000 or more | 0 (0.0%) | 0 (0.0%) |
| Total | 143 (100.0%) | 118 (100.0%) |
Household Income by Mortgage Status in Granite
| Household Income | Without Mortgage | With Mortgage |
| Less than $10,000 | 2 (1.4%) | 0 (0.0%) |
| $10,000 to $24,999 | 45 (31.5%) | 0 (0.0%) |
| $25,000 to $34,999 | 9 (6.3%) | 9 (7.6%) |
| $35,000 to $49,999 | 1 (0.7%) | 0 (0.0%) |
| $50,000 to $74,999 | 45 (31.5%) | 2 (1.7%) |
| $75,000 to $99,999 | 22 (15.4%) | 49 (41.5%) |
| $100,000 to $149,999 | 14 (9.8%) | 7 (5.9%) |
| $150,000 or more | 5 (3.5%) | 16 (13.6%) |
| Total | 143 (100.0%) | 118 (100.0%) |
Property Value to Household Income Ratio in Granite
| Value-to-Income Ratio | Without Mortgage | With Mortgage |
| Less than 2.0x | 68 (47.5%) | 69,375 (58,792.4%) |
| 2.0x to 2.9x | 54 (37.8%) | 66 (55.9%) |
| 3.0x to 3.9x | 4 (2.8%) | 43 (36.4%) |
| 4.0x or more | 17 (11.9%) | 0 (0.0%) |
| Total | 143 (100.0%) | 118 (100.0%) |
Real Estate Taxes by Mortgage Status in Granite
| Property Taxes | Without Mortgage | With Mortgage |
| Less than $800 | 100 (69.9%) | 0 (0.0%) |
| $800 to $1,499 | 32 (22.4%) | 48 (40.7%) |
| $800 to $1,499 | 0 (0.0%) | 3 (2.5%) |
| Total | 143 (100.0%) | 118 (100.0%) |
Health & Disability in Granite
Health Insurance Coverage by Age in Granite
| Age Bracket | With Coverage | Without Coverage |
| Under 6 Years | 28 (100.0%) | 0 (0.0%) |
| 6 to 18 Years | 81 (100.0%) | 0 (0.0%) |
| 19 to 25 Years | 76 (100.0%) | 0 (0.0%) |
| 26 to 34 Years | 22 (100.0%) | 0 (0.0%) |
| 35 to 44 Years | 71 (93.4%) | 5 (6.6%) |
| 45 to 54 Years | 76 (95.0%) | 4 (5.0%) |
| 55 to 64 Years | 102 (99.0%) | 1 (1.0%) |
| 65 to 74 Years | 119 (100.0%) | 0 (0.0%) |
| 75 Years and older | 49 (100.0%) | 0 (0.0%) |
| Total | 624 (98.4%) | 10 (1.6%) |
Health Insurance Coverage by Citizenship Status in Granite
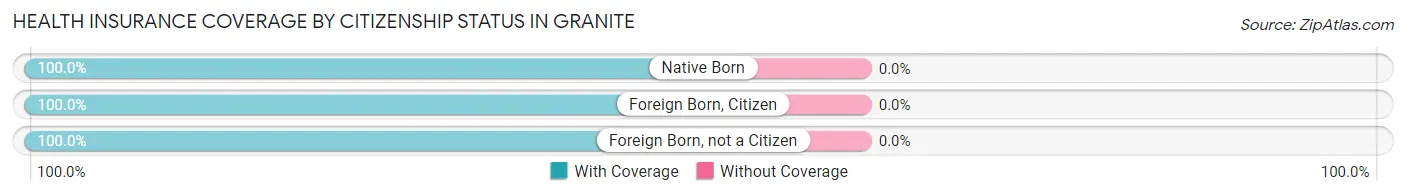
| Citizenship Status | With Coverage | Without Coverage |
| Native Born | 28 (100.0%) | 0 (0.0%) |
| Foreign Born, Citizen | 81 (100.0%) | 0 (0.0%) |
| Foreign Born, not a Citizen | 76 (100.0%) | 0 (0.0%) |
Health Insurance Coverage by Household Income in Granite
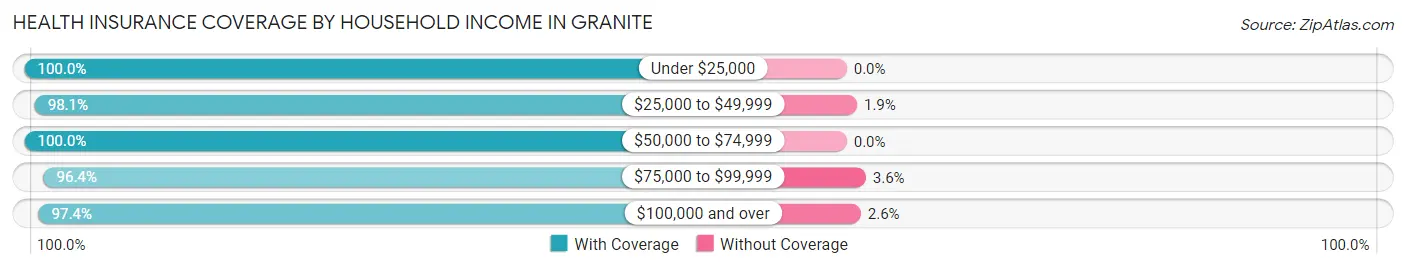
| Household Income | With Coverage | Without Coverage |
| Under $25,000 | 101 (100.0%) | 0 (0.0%) |
| $25,000 to $49,999 | 102 (98.1%) | 2 (1.9%) |
| $50,000 to $74,999 | 165 (100.0%) | 0 (0.0%) |
| $75,000 to $99,999 | 108 (96.4%) | 4 (3.6%) |
| $100,000 and over | 148 (97.4%) | 4 (2.6%) |
Public vs Private Health Insurance Coverage by Age in Granite
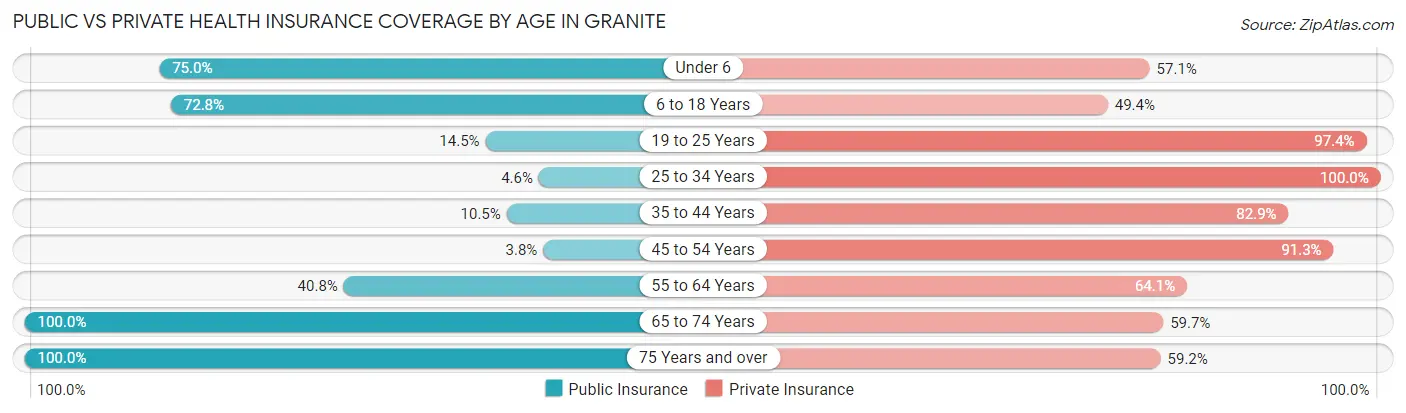
| Age Bracket | Public Insurance | Private Insurance |
| Under 6 | 21 (75.0%) | 16 (57.1%) |
| 6 to 18 Years | 59 (72.8%) | 40 (49.4%) |
| 19 to 25 Years | 11 (14.5%) | 74 (97.4%) |
| 25 to 34 Years | 1 (4.5%) | 22 (100.0%) |
| 35 to 44 Years | 8 (10.5%) | 63 (82.9%) |
| 45 to 54 Years | 3 (3.7%) | 73 (91.2%) |
| 55 to 64 Years | 42 (40.8%) | 66 (64.1%) |
| 65 to 74 Years | 119 (100.0%) | 71 (59.7%) |
| 75 Years and over | 49 (100.0%) | 29 (59.2%) |
| Total | 313 (49.4%) | 454 (71.6%) |
Disability Status by Sex by Age in Granite
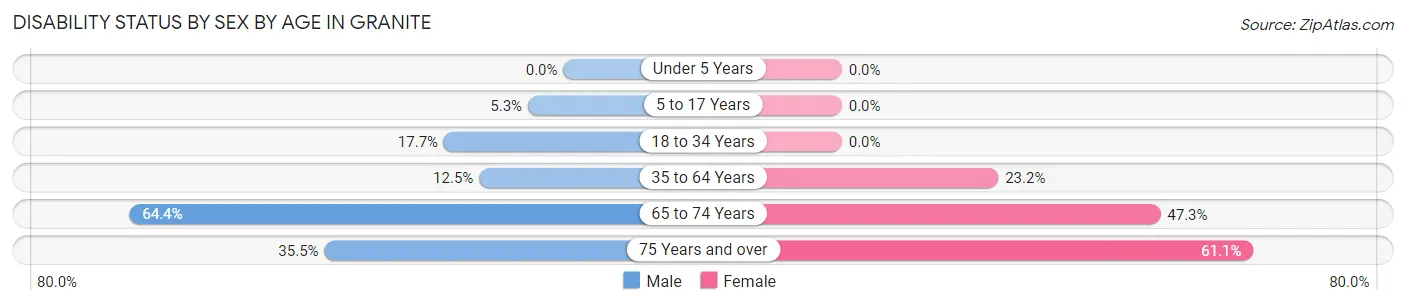
| Age Bracket | Male | Female |
| Under 5 Years | 0 (0.0%) | 0 (0.0%) |
| 5 to 17 Years | 3 (5.3%) | 0 (0.0%) |
| 18 to 34 Years | 11 (17.7%) | 0 (0.0%) |
| 35 to 64 Years | 13 (12.5%) | 36 (23.2%) |
| 65 to 74 Years | 29 (64.4%) | 35 (47.3%) |
| 75 Years and over | 11 (35.5%) | 11 (61.1%) |
Disability Class by Sex by Age in Granite
Disability Class: Hearing Difficulty
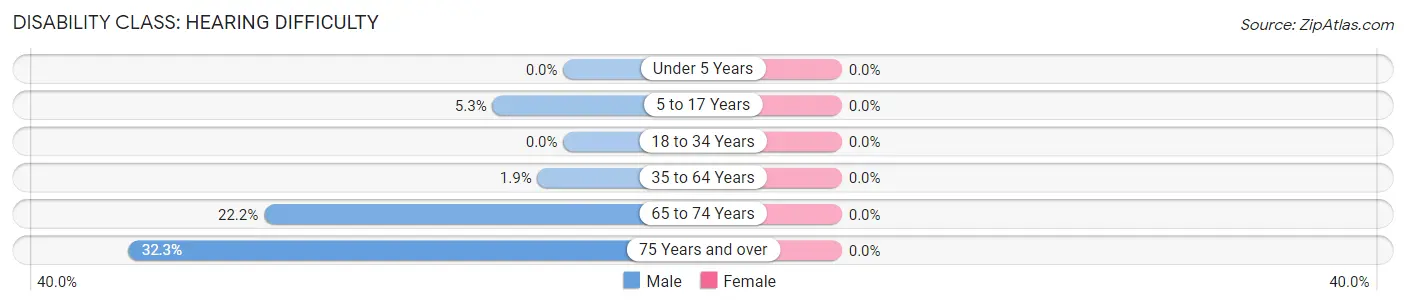
| Age Bracket | Male | Female |
| Under 5 Years | 0 (0.0%) | 0 (0.0%) |
| 5 to 17 Years | 3 (5.3%) | 0 (0.0%) |
| 18 to 34 Years | 0 (0.0%) | 0 (0.0%) |
| 35 to 64 Years | 2 (1.9%) | 0 (0.0%) |
| 65 to 74 Years | 10 (22.2%) | 0 (0.0%) |
| 75 Years and over | 10 (32.3%) | 0 (0.0%) |
Disability Class: Vision Difficulty
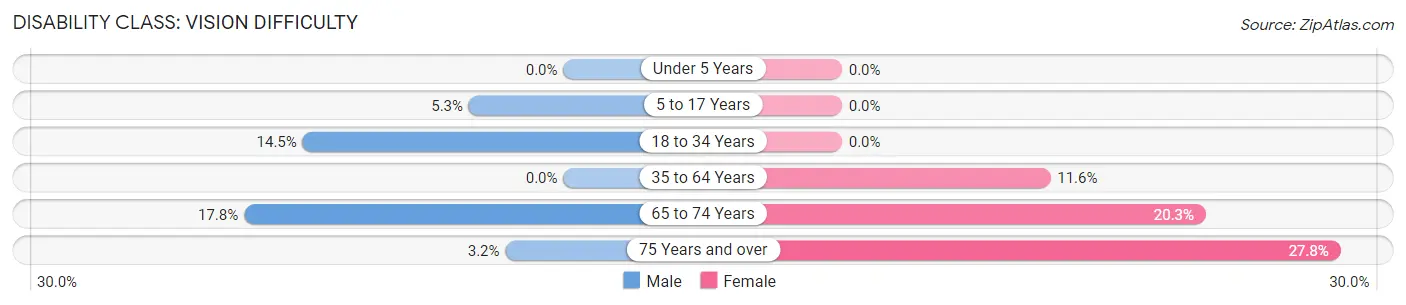
| Age Bracket | Male | Female |
| Under 5 Years | 0 (0.0%) | 0 (0.0%) |
| 5 to 17 Years | 3 (5.3%) | 0 (0.0%) |
| 18 to 34 Years | 9 (14.5%) | 0 (0.0%) |
| 35 to 64 Years | 0 (0.0%) | 18 (11.6%) |
| 65 to 74 Years | 8 (17.8%) | 15 (20.3%) |
| 75 Years and over | 1 (3.2%) | 5 (27.8%) |
Disability Class: Cognitive Difficulty
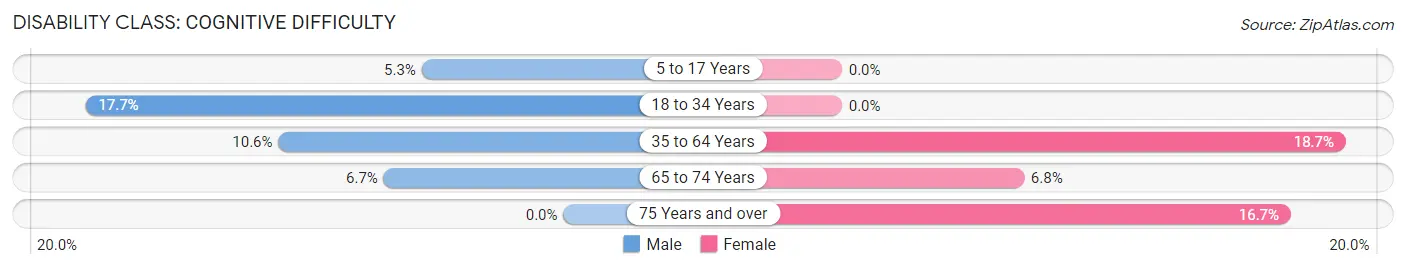
| Age Bracket | Male | Female |
| 5 to 17 Years | 3 (5.3%) | 0 (0.0%) |
| 18 to 34 Years | 11 (17.7%) | 0 (0.0%) |
| 35 to 64 Years | 11 (10.6%) | 29 (18.7%) |
| 65 to 74 Years | 3 (6.7%) | 5 (6.8%) |
| 75 Years and over | 0 (0.0%) | 3 (16.7%) |
Disability Class: Ambulatory Difficulty
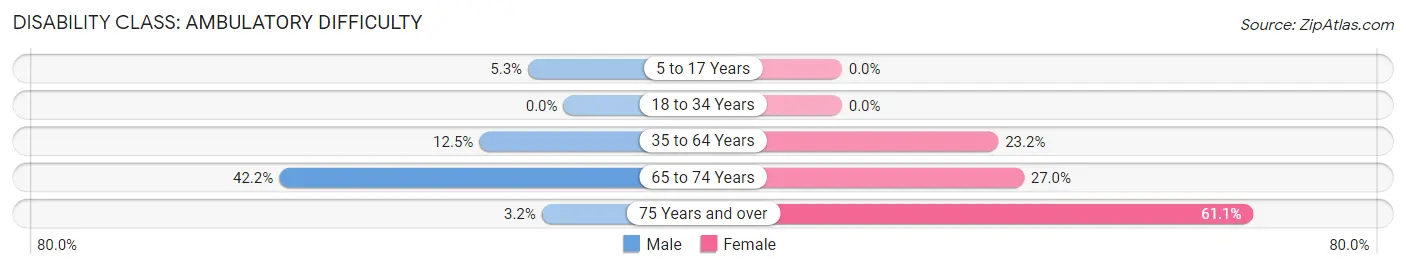
| Age Bracket | Male | Female |
| 5 to 17 Years | 3 (5.3%) | 0 (0.0%) |
| 18 to 34 Years | 0 (0.0%) | 0 (0.0%) |
| 35 to 64 Years | 13 (12.5%) | 36 (23.2%) |
| 65 to 74 Years | 19 (42.2%) | 20 (27.0%) |
| 75 Years and over | 1 (3.2%) | 11 (61.1%) |
Disability Class: Self-Care Difficulty
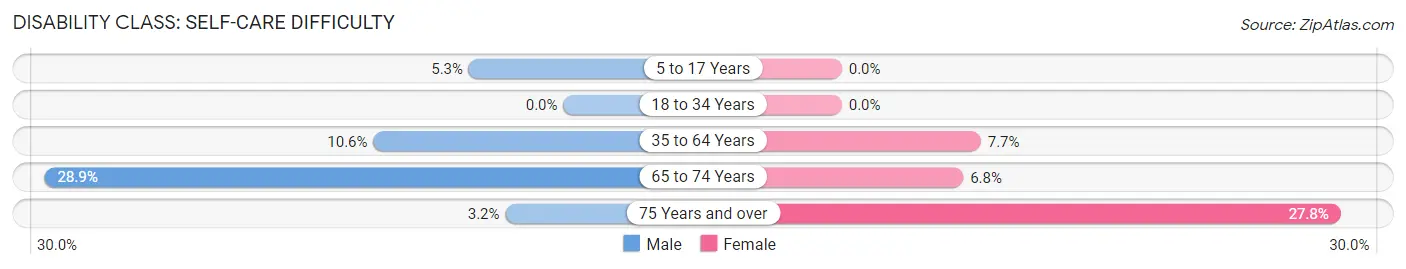
| Age Bracket | Male | Female |
| 5 to 17 Years | 3 (5.3%) | 0 (0.0%) |
| 18 to 34 Years | 0 (0.0%) | 0 (0.0%) |
| 35 to 64 Years | 11 (10.6%) | 12 (7.7%) |
| 65 to 74 Years | 13 (28.9%) | 5 (6.8%) |
| 75 Years and over | 1 (3.2%) | 5 (27.8%) |
Technology Access in Granite
Computing Device Access in Granite
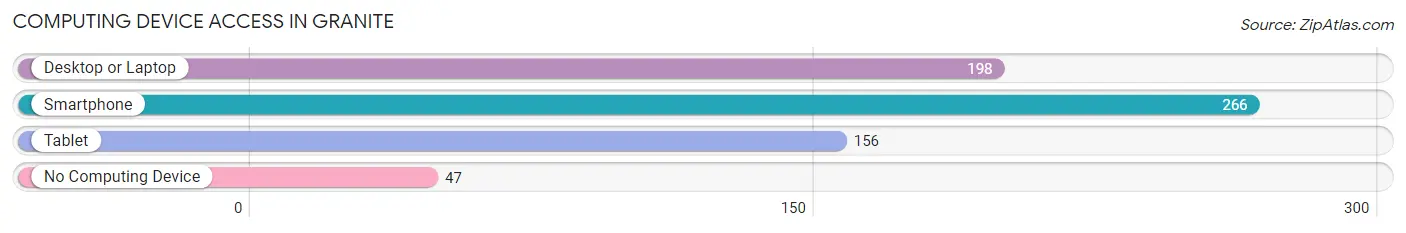
| Device Type | # Households | % Households |
| Desktop or Laptop | 198 | 58.2% |
| Smartphone | 266 | 78.2% |
| Tablet | 156 | 45.9% |
| No Computing Device | 47 | 13.8% |
| Total | 340 | 100.0% |
Internet Access in Granite
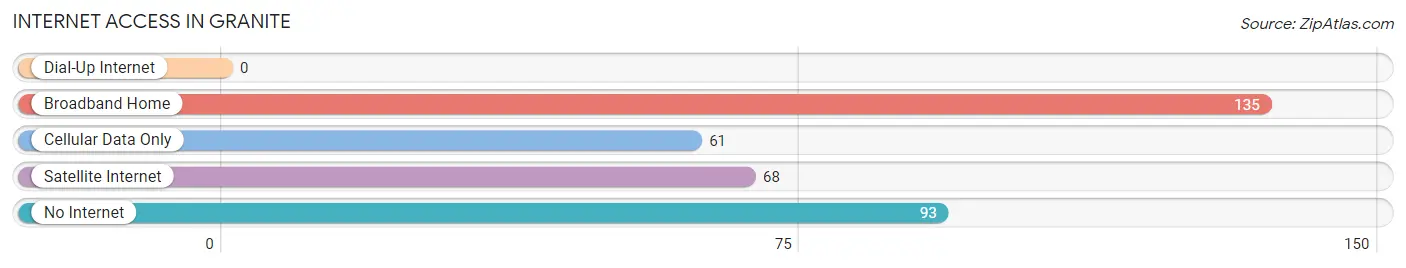
| Internet Type | # Households | % Households |
| Dial-Up Internet | 0 | 0.0% |
| Broadband Home | 135 | 39.7% |
| Cellular Data Only | 61 | 17.9% |
| Satellite Internet | 68 | 20.0% |
| No Internet | 93 | 27.4% |
| Total | 340 | 100.0% |
Granite Summary
Granite, Oklahoma is a small town located in Greer County, Oklahoma. It is situated in the southwestern part of the state, approximately 20 miles east of the Texas border. The town was founded in 1891 and was named after the granite rock formations that are found in the area. As of the 2010 census, the population of Granite was 545.
Geography
Granite is located in the southwestern part of Oklahoma, in Greer County. It is situated at the intersection of U.S. Highway 70 and State Highway 6. The town is located approximately 20 miles east of the Texas border and is about 100 miles northwest of Oklahoma City. The terrain around Granite is mostly flat, with some rolling hills. The town is situated on the western edge of the Red River Valley, which is a major agricultural region in Oklahoma.
The climate in Granite is semi-arid, with hot summers and mild winters. The average annual temperature is around 64°F, with an average high of 90°F in the summer and an average low of 37°F in the winter. The average annual precipitation is around 28 inches.
Economy
Granite’s economy is largely based on agriculture. The town is located in the Red River Valley, which is a major agricultural region in Oklahoma. The main crops grown in the area are cotton, wheat, corn, and sorghum. The town also has a few small businesses, including a grocery store, a hardware store, and a few restaurants.
Demographics
As of the 2010 census, the population of Granite was 545. The racial makeup of the town was 95.3% White, 0.2% African American, 0.7% Native American, 0.2% Asian, 0.2% from other races, and 3.4% from two or more races. Hispanic or Latino of any race were 1.3% of the population.
The median income for a household in Granite was $30,000, and the median income for a family was $35,000. The per capita income for the town was $14,000. About 17.5% of the population was below the poverty line.
History
Granite was founded in 1891 and was named after the granite rock formations that are found in the area. The town was originally a farming community, and the main crops grown in the area were cotton, wheat, corn, and sorghum.
In the early 1900s, Granite was a stop on the Fort Worth and Denver Railway. The railway brought new businesses and people to the town, and it also helped to increase the population.
In the 1920s, Granite was a popular tourist destination. The town was known for its natural beauty and its mineral springs. The mineral springs were believed to have healing properties, and people from all over the country would come to Granite to take advantage of them.
In the 1950s, Granite began to decline. The railway was abandoned, and many of the businesses in town closed. The population of the town decreased, and by the 1970s, Granite was a small, quiet town.
Today, Granite is still a small town, but it has seen a resurgence in recent years. The town has become a popular tourist destination, and it is home to several small businesses. The population of Granite has been slowly increasing, and the town is now home to around 545 people.
Common Questions
What is Per Capita Income in Granite?
Per Capita income in Granite is $15,644.
What is the Median Family Income in Granite?
Median Family Income in Granite is $81,429.
What is the Median Household income in Granite?
Median Household Income in Granite is $56,500.
What is Income or Wage Gap in Granite?
Income or Wage Gap in Granite is 3.9%.
Women in Granite earn 96.1 cents for every dollar earned by a man.
What is Inequality or Gini Index in Granite?
Inequality or Gini Index in Granite is 0.44.
What is the Total Population of Granite?
Total Population of Granite is 1,473.
What is the Total Male Population of Granite?
Total Male Population of Granite is 1,152.
What is the Total Female Population of Granite?
Total Female Population of Granite is 321.
What is the Ratio of Males per 100 Females in Granite?
There are 358.88 Males per 100 Females in Granite.
What is the Ratio of Females per 100 Males in Granite?
There are 27.86 Females per 100 Males in Granite.
What is the Median Population Age in Granite?
Median Population Age in Granite is 41.2 Years.
What is the Average Family Size in Granite
Average Family Size in Granite is 2.5 People.
What is the Average Household Size in Granite
Average Household Size in Granite is 1.9 People.
How Large is the Labor Force in Granite?
There are 299 People in the Labor Forcein in Granite.
What is the Percentage of People in the Labor Force in Granite?
21.7% of People are in the Labor Force in Granite.
What is the Unemployment Rate in Granite?
Unemployment Rate in Granite is 0.7%.