Walters, OK Map & Demographics
Walters Map
Walters Overview
$25,175
PER CAPITA INCOME
$77,639
AVG FAMILY INCOME
$50,284
AVG HOUSEHOLD INCOME
4.1%
WAGE / INCOME GAP [ % ]
95.9¢/ $1
WAGE / INCOME GAP [ $ ]
$11,094
FAMILY INCOME DEFICIT
0.45
INEQUALITY / GINI INDEX
2,281
TOTAL POPULATION
1,081
MALE POPULATION
1,200
FEMALE POPULATION
90.08
MALES / 100 FEMALES
111.01
FEMALES / 100 MALES
40.5
MEDIAN AGE
3.4
AVG FAMILY SIZE
2.6
AVG HOUSEHOLD SIZE
1,003
LABOR FORCE [ PEOPLE ]
56.1%
PERCENT IN LABOR FORCE
2.3%
UNEMPLOYMENT RATE
Walters Zip Codes
Walters Area Codes
Income in Walters
Income Overview in Walters
Per Capita Income in Walters is $25,175, while median incomes of families and households are $77,639 and $50,284 respectively.
| Characteristic | Number | Measure |
| Per Capita Income | 2,281 | $25,175 |
| Median Family Income | 504 | $77,639 |
| Mean Family Income | 504 | $75,264 |
| Median Household Income | 838 | $50,284 |
| Mean Household Income | 838 | $61,120 |
| Income Deficit | 504 | $11,094 |
| Wage / Income Gap (%) | 2,281 | 4.08% |
| Wage / Income Gap ($) | 2,281 | 95.92¢ per $1 |
| Gini / Inequality Index | 2,281 | 0.45 |
Earnings by Sex in Walters
Average Earnings in Walters are $36,220, $37,232 for men and $35,714 for women, a difference of 4.1%.
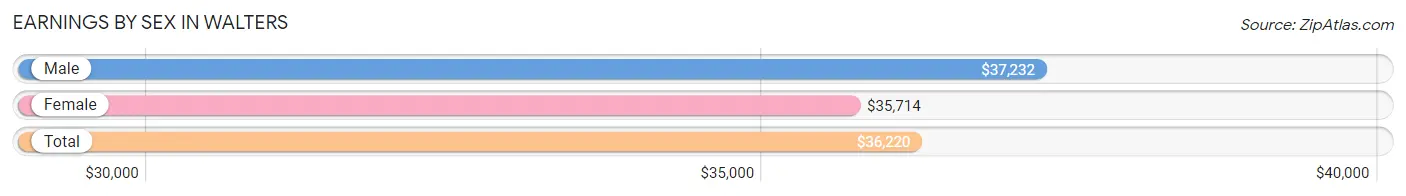
| Sex | Number | Average Earnings |
| Male | 529 (48.8%) | $37,232 |
| Female | 556 (51.2%) | $35,714 |
| Total | 1,085 (100.0%) | $36,220 |
Earnings by Sex by Income Bracket in Walters
The most common earnings brackets in Walters are $7,500 to $9,999 for men (58 | 11.0%) and $35,000 to $39,999 for women (110 | 19.8%).
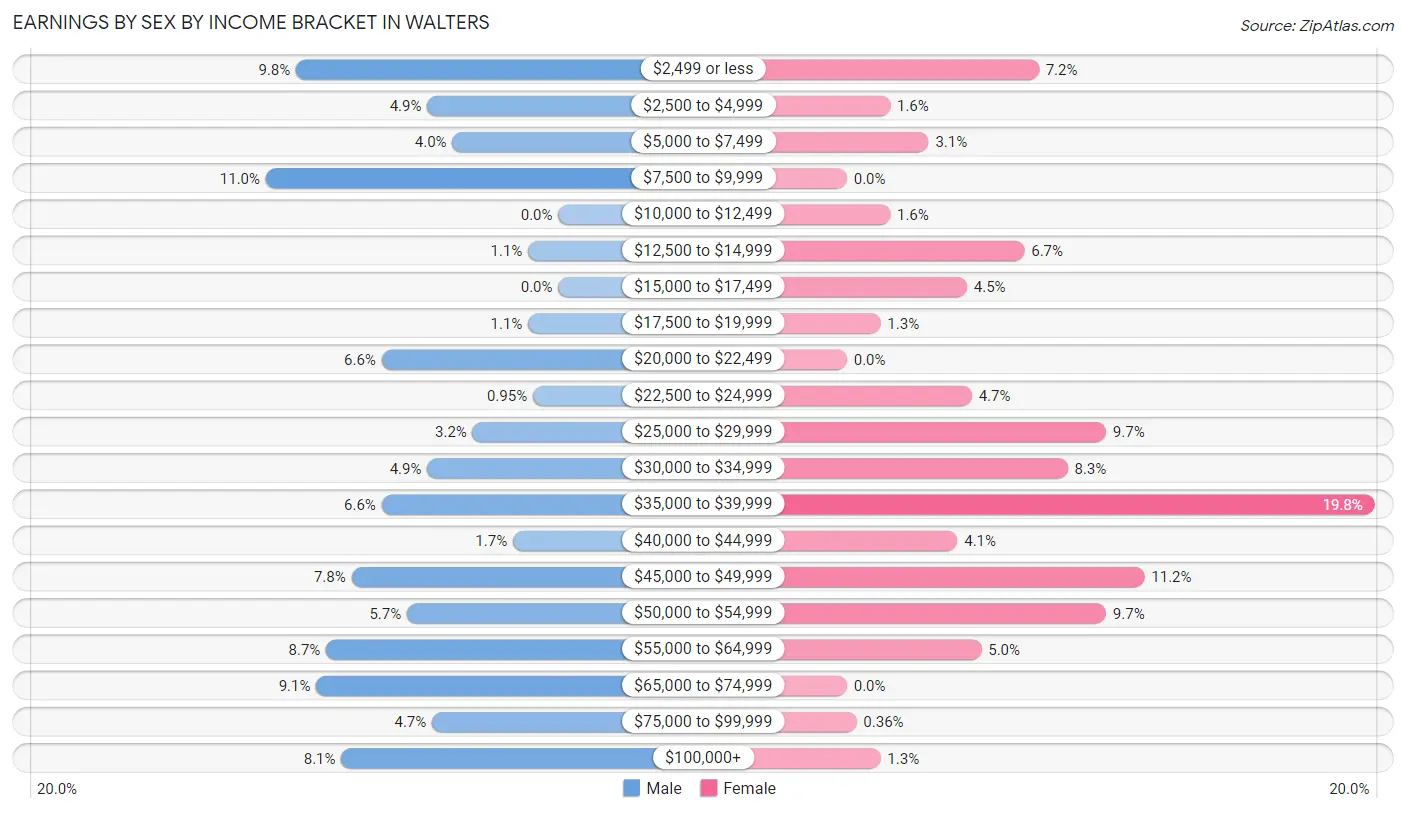
| Income | Male | Female |
| $2,499 or less | 52 (9.8%) | 40 (7.2%) |
| $2,500 to $4,999 | 26 (4.9%) | 9 (1.6%) |
| $5,000 to $7,499 | 21 (4.0%) | 17 (3.1%) |
| $7,500 to $9,999 | 58 (11.0%) | 0 (0.0%) |
| $10,000 to $12,499 | 0 (0.0%) | 9 (1.6%) |
| $12,500 to $14,999 | 6 (1.1%) | 37 (6.7%) |
| $15,000 to $17,499 | 0 (0.0%) | 25 (4.5%) |
| $17,500 to $19,999 | 6 (1.1%) | 7 (1.3%) |
| $20,000 to $22,499 | 35 (6.6%) | 0 (0.0%) |
| $22,500 to $24,999 | 5 (0.9%) | 26 (4.7%) |
| $25,000 to $29,999 | 17 (3.2%) | 54 (9.7%) |
| $30,000 to $34,999 | 26 (4.9%) | 46 (8.3%) |
| $35,000 to $39,999 | 35 (6.6%) | 110 (19.8%) |
| $40,000 to $44,999 | 9 (1.7%) | 23 (4.1%) |
| $45,000 to $49,999 | 41 (7.7%) | 62 (11.2%) |
| $50,000 to $54,999 | 30 (5.7%) | 54 (9.7%) |
| $55,000 to $64,999 | 46 (8.7%) | 28 (5.0%) |
| $65,000 to $74,999 | 48 (9.1%) | 0 (0.0%) |
| $75,000 to $99,999 | 25 (4.7%) | 2 (0.4%) |
| $100,000+ | 43 (8.1%) | 7 (1.3%) |
| Total | 529 (100.0%) | 556 (100.0%) |
Earnings by Sex by Educational Attainment in Walters
Average earnings in Walters are $41,563 for men and $37,546 for women, a difference of 9.7%. Men with an educational attainment of bachelor's degree enjoy the highest average annual earnings of $68,472, while those with less than high school education earn the least with $21,927. Women with an educational attainment of graduate degree earn the most with the average annual earnings of $43,500, while those with bachelor's degree education have the smallest earnings of $26,364.
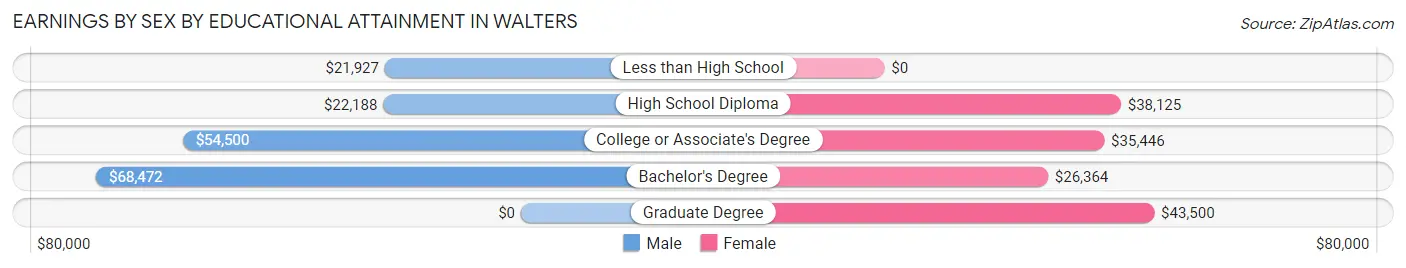
| Educational Attainment | Male Income | Female Income |
| Less than High School | $21,927 | $0 |
| High School Diploma | $22,188 | $38,125 |
| College or Associate's Degree | $54,500 | $35,446 |
| Bachelor's Degree | $68,472 | $26,364 |
| Graduate Degree | - | - |
| Total | $41,563 | $37,546 |
Family Income in Walters
Family Income Brackets in Walters
According to the Walters family income data, there are 131 families falling into the $100,000 to $149,999 income range, which is the most common income bracket and makes up 26.0% of all families. Conversely, the $150,000 to $199,999 income bracket is the least frequent group with only 14 families (2.8%) belonging to this category.
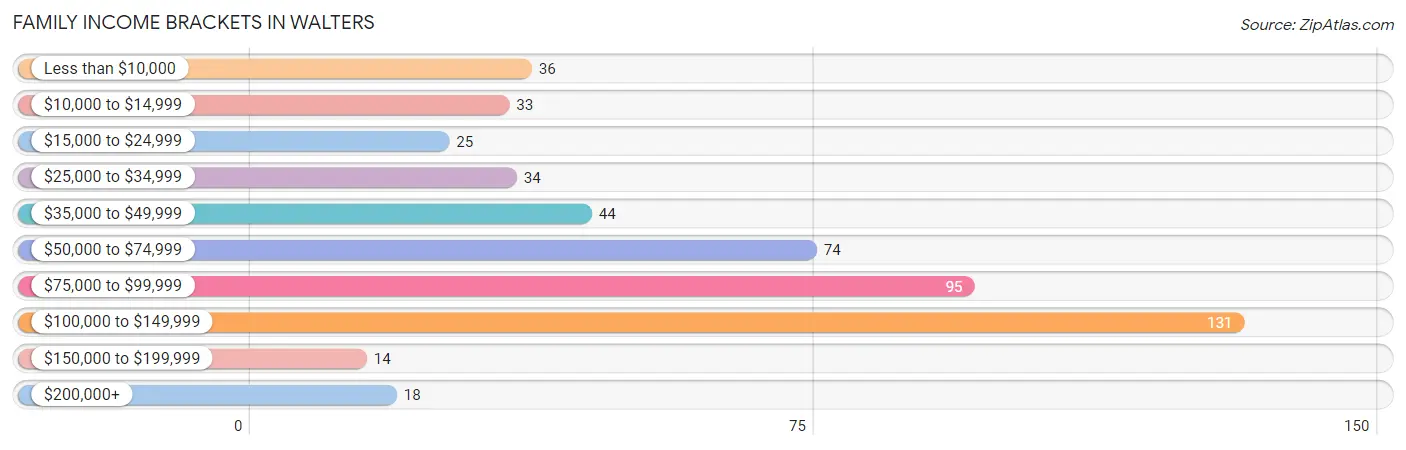
| Income Bracket | # Families | % Families |
| Less than $10,000 | 36 | 7.1% |
| $10,000 to $14,999 | 33 | 6.5% |
| $15,000 to $24,999 | 25 | 5.0% |
| $25,000 to $34,999 | 34 | 6.7% |
| $35,000 to $49,999 | 44 | 8.7% |
| $50,000 to $74,999 | 74 | 14.7% |
| $75,000 to $99,999 | 95 | 18.8% |
| $100,000 to $149,999 | 131 | 26.0% |
| $150,000 to $199,999 | 14 | 2.8% |
| $200,000+ | 18 | 3.6% |
Family Income by Famaliy Size in Walters
4-person families (101 | 20.0%) account for the highest median family income in Walters with $82,232 per family, while 2-person families (278 | 55.2%) have the highest median income of $40,250 per family member.
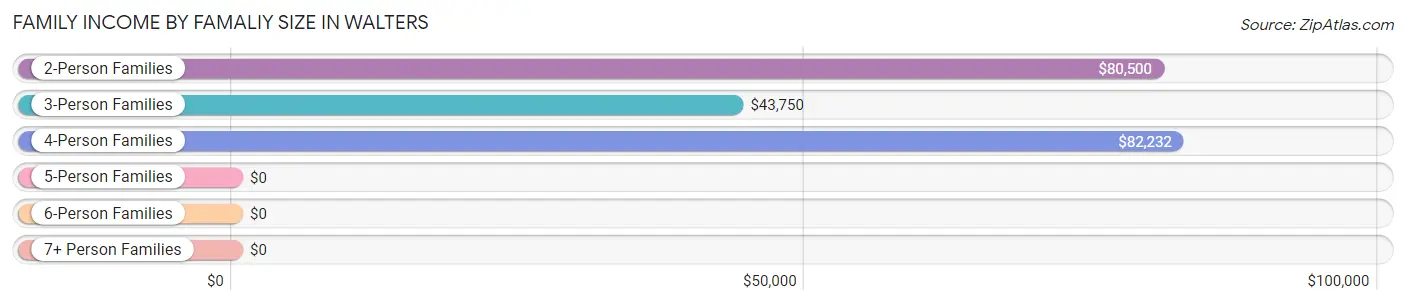
| Income Bracket | # Families | Median Income |
| 2-Person Families | 278 (55.2%) | $80,500 |
| 3-Person Families | 107 (21.2%) | $43,750 |
| 4-Person Families | 101 (20.0%) | $82,232 |
| 5-Person Families | 13 (2.6%) | $0 |
| 6-Person Families | 2 (0.4%) | $0 |
| 7+ Person Families | 3 (0.6%) | $0 |
| Total | 504 (100.0%) | $77,639 |
Family Income by Number of Earners in Walters
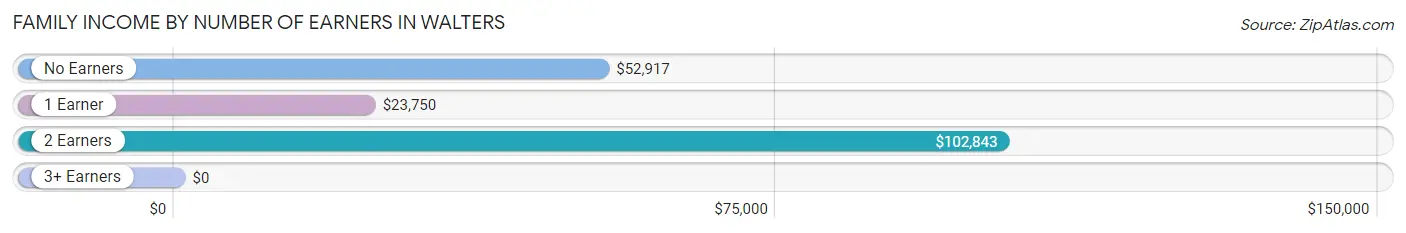
| Number of Earners | # Families | Median Income |
| No Earners | 76 (15.1%) | $52,917 |
| 1 Earner | 129 (25.6%) | $23,750 |
| 2 Earners | 286 (56.8%) | $102,843 |
| 3+ Earners | 13 (2.6%) | $0 |
| Total | 504 (100.0%) | $77,639 |
Household Income in Walters
Household Income Brackets in Walters
With 149 households falling in the category, the $100,000 to $149,999 income range is the most frequent in Walters, accounting for 17.8% of all households. In contrast, only 16 households (1.9%) fall into the $150,000 to $199,999 income bracket, making it the least populous group.
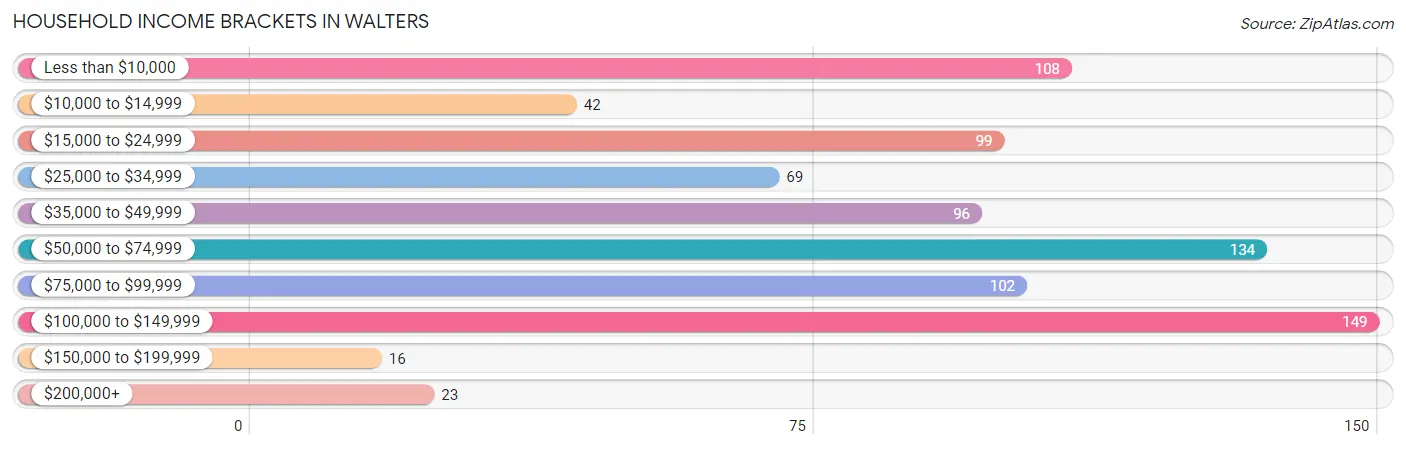
| Income Bracket | # Households | % Households |
| Less than $10,000 | 108 | 12.9% |
| $10,000 to $14,999 | 42 | 5.0% |
| $15,000 to $24,999 | 99 | 11.8% |
| $25,000 to $34,999 | 69 | 8.2% |
| $35,000 to $49,999 | 96 | 11.5% |
| $50,000 to $74,999 | 134 | 16.0% |
| $75,000 to $99,999 | 102 | 12.2% |
| $100,000 to $149,999 | 149 | 17.8% |
| $150,000 to $199,999 | 16 | 1.9% |
| $200,000+ | 23 | 2.7% |
Household Income by Householder Age in Walters
The median household income in Walters is $50,284, with the highest median household income of $60,625 found in the 45 to 64 years age bracket for the primary householder. A total of 353 households (42.1%) fall into this category. Meanwhile, the 15 to 24 years age bracket for the primary householder has the lowest median household income of $16,875, with 50 households (6.0%) in this group.
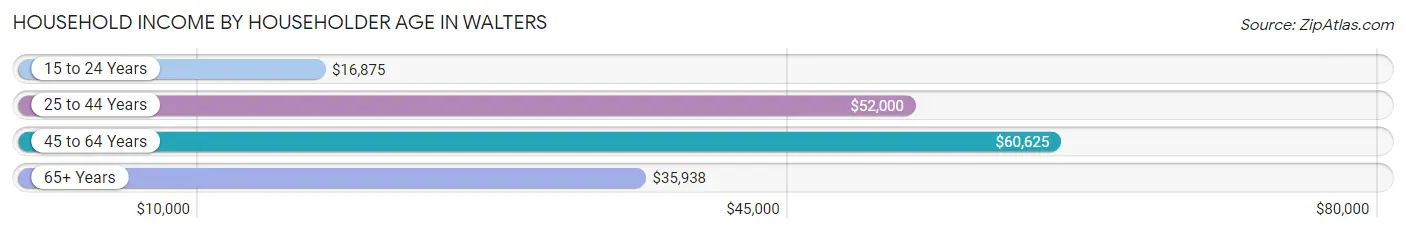
| Income Bracket | # Households | Median Income |
| 15 to 24 Years | 50 (6.0%) | $16,875 |
| 25 to 44 Years | 204 (24.3%) | $52,000 |
| 45 to 64 Years | 353 (42.1%) | $60,625 |
| 65+ Years | 231 (27.6%) | $35,938 |
| Total | 838 (100.0%) | $50,284 |
Poverty in Walters
Income Below Poverty by Sex and Age in Walters
With 28.3% poverty level for males and 30.1% for females among the residents of Walters, 16 and 17 year old males and 5 year old females are the most vulnerable to poverty, with 50 males (80.6%) and 14 females (77.8%) in their respective age groups living below the poverty level.
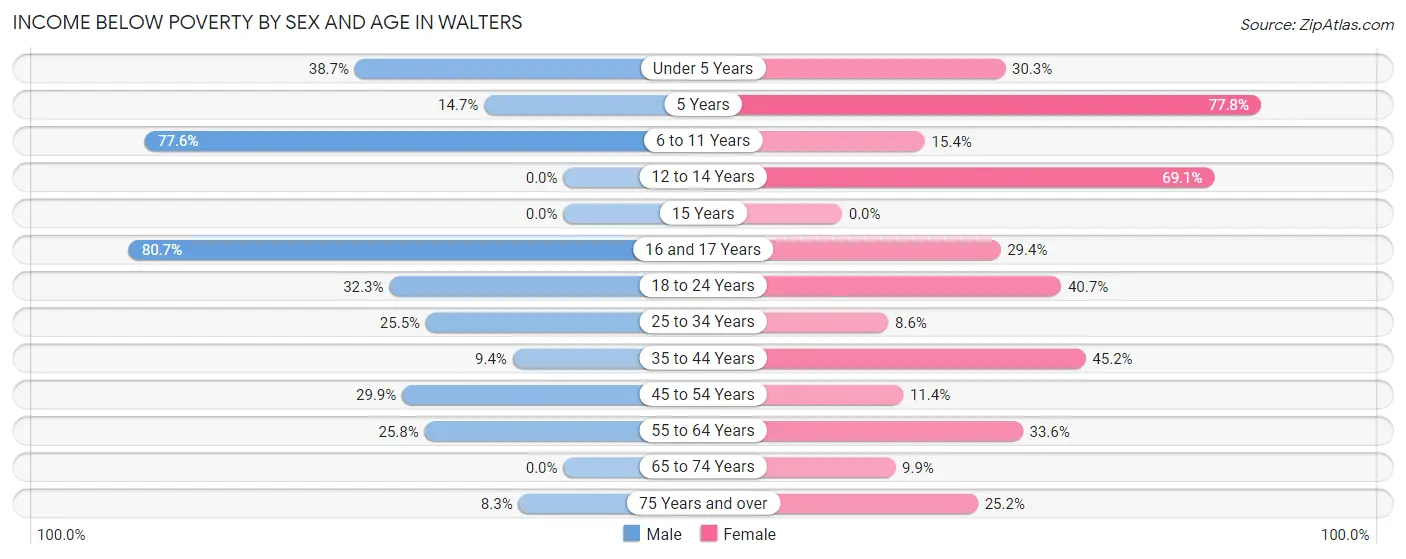
| Age Bracket | Male | Female |
| Under 5 Years | 36 (38.7%) | 20 (30.3%) |
| 5 Years | 5 (14.7%) | 14 (77.8%) |
| 6 to 11 Years | 59 (77.6%) | 8 (15.4%) |
| 12 to 14 Years | 0 (0.0%) | 56 (69.1%) |
| 15 Years | 0 (0.0%) | 0 (0.0%) |
| 16 and 17 Years | 50 (80.6%) | 5 (29.4%) |
| 18 to 24 Years | 32 (32.3%) | 24 (40.7%) |
| 25 to 34 Years | 25 (25.5%) | 11 (8.6%) |
| 35 to 44 Years | 11 (9.4%) | 71 (45.2%) |
| 45 to 54 Years | 41 (29.9%) | 10 (11.4%) |
| 55 to 64 Years | 25 (25.8%) | 103 (33.6%) |
| 65 to 74 Years | 0 (0.0%) | 10 (9.9%) |
| 75 Years and over | 4 (8.3%) | 27 (25.2%) |
| Total | 288 (28.3%) | 359 (30.1%) |
Income Above Poverty by Sex and Age in Walters
According to the poverty statistics in Walters, males aged 12 to 14 years and females aged 15 years are the age groups that are most secure financially, with 100.0% of males and 100.0% of females in these age groups living above the poverty line.
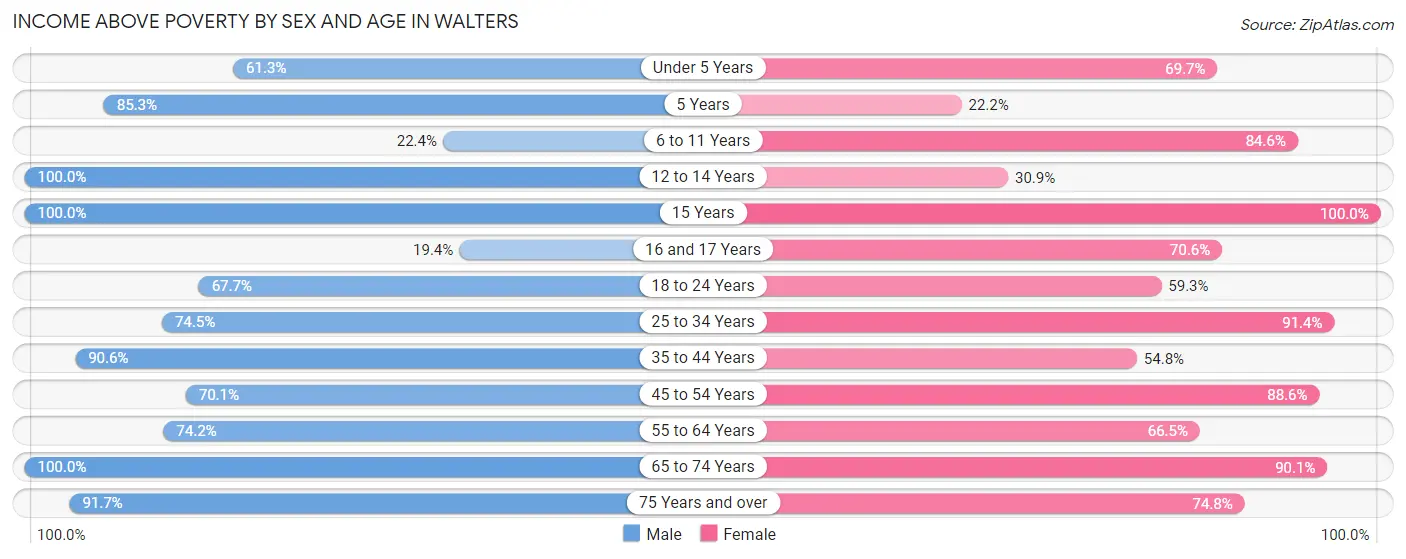
| Age Bracket | Male | Female |
| Under 5 Years | 57 (61.3%) | 46 (69.7%) |
| 5 Years | 29 (85.3%) | 4 (22.2%) |
| 6 to 11 Years | 17 (22.4%) | 44 (84.6%) |
| 12 to 14 Years | 47 (100.0%) | 25 (30.9%) |
| 15 Years | 14 (100.0%) | 12 (100.0%) |
| 16 and 17 Years | 12 (19.4%) | 12 (70.6%) |
| 18 to 24 Years | 67 (67.7%) | 35 (59.3%) |
| 25 to 34 Years | 73 (74.5%) | 117 (91.4%) |
| 35 to 44 Years | 106 (90.6%) | 86 (54.8%) |
| 45 to 54 Years | 96 (70.1%) | 78 (88.6%) |
| 55 to 64 Years | 72 (74.2%) | 204 (66.4%) |
| 65 to 74 Years | 94 (100.0%) | 91 (90.1%) |
| 75 Years and over | 44 (91.7%) | 80 (74.8%) |
| Total | 728 (71.7%) | 834 (69.9%) |
Income Below Poverty Among Married-Couple Families in Walters
The poverty statistics for married-couple families in Walters show that 6.8% or 24 of the total 352 families live below the poverty line. Families with 5 or more children have the highest poverty rate of 100.0%, comprising of 3 families. On the other hand, families with 3 or 4 children have the lowest poverty rate of 0.0%, which includes 0 families.
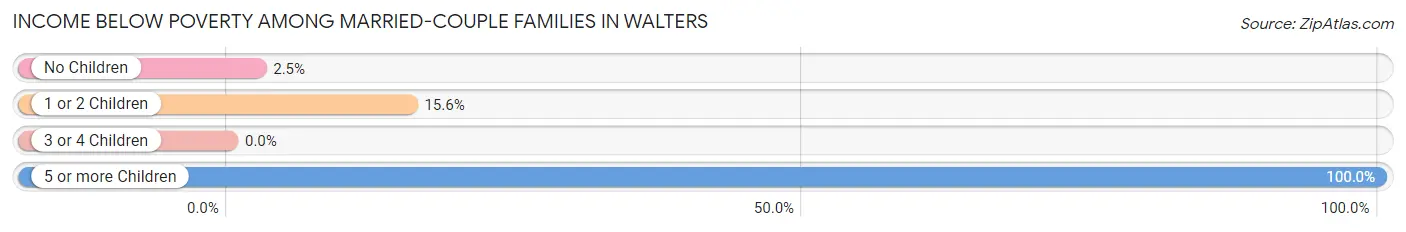
| Children | Above Poverty | Below Poverty |
| No Children | 238 (97.5%) | 6 (2.5%) |
| 1 or 2 Children | 81 (84.4%) | 15 (15.6%) |
| 3 or 4 Children | 9 (100.0%) | 0 (0.0%) |
| 5 or more Children | 0 (0.0%) | 3 (100.0%) |
| Total | 328 (93.2%) | 24 (6.8%) |
Income Below Poverty Among Single-Parent Households in Walters
According to the poverty data in Walters, 64.1% or 25 single-father households and 44.3% or 50 single-mother households are living below the poverty line. Among single-father households, those with 3 or 4 children have the highest poverty rate, with 10 households (100.0%) experiencing poverty. Likewise, among single-mother households, those with 3 or 4 children have the highest poverty rate, with 5 households (100.0%) falling below the poverty line.
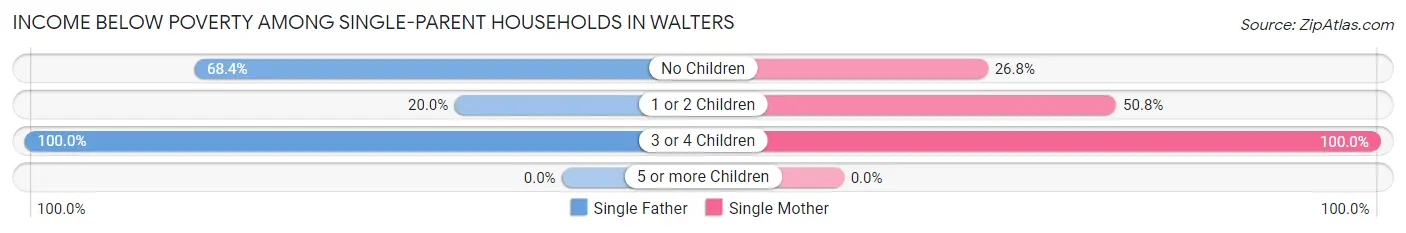
| Children | Single Father | Single Mother |
| No Children | 13 (68.4%) | 11 (26.8%) |
| 1 or 2 Children | 2 (20.0%) | 34 (50.7%) |
| 3 or 4 Children | 10 (100.0%) | 5 (100.0%) |
| 5 or more Children | 0 (0.0%) | 0 (0.0%) |
| Total | 25 (64.1%) | 50 (44.3%) |
Income Below Poverty Among Married-Couple vs Single-Parent Households in Walters
The poverty data for Walters shows that 24 of the married-couple family households (6.8%) and 75 of the single-parent households (49.3%) are living below the poverty level. Within the married-couple family households, those with 5 or more children have the highest poverty rate, with 3 households (100.0%) falling below the poverty line. Among the single-parent households, those with 3 or 4 children have the highest poverty rate, with 15 household (100.0%) living below poverty.
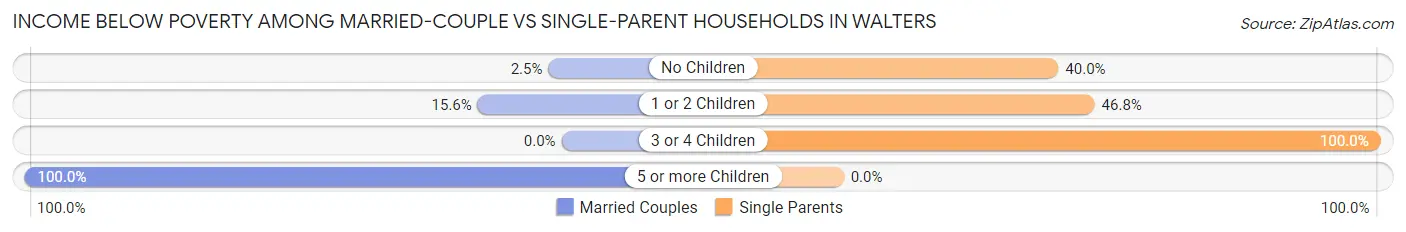
| Children | Married-Couple Families | Single-Parent Households |
| No Children | 6 (2.5%) | 24 (40.0%) |
| 1 or 2 Children | 15 (15.6%) | 36 (46.8%) |
| 3 or 4 Children | 0 (0.0%) | 15 (100.0%) |
| 5 or more Children | 3 (100.0%) | 0 (0.0%) |
| Total | 24 (6.8%) | 75 (49.3%) |
Race in Walters
The most populous races in Walters are White / Caucasian (1,598 | 70.1%), Native / Alaskan (317 | 13.9%), and Two or more Races (208 | 9.1%).
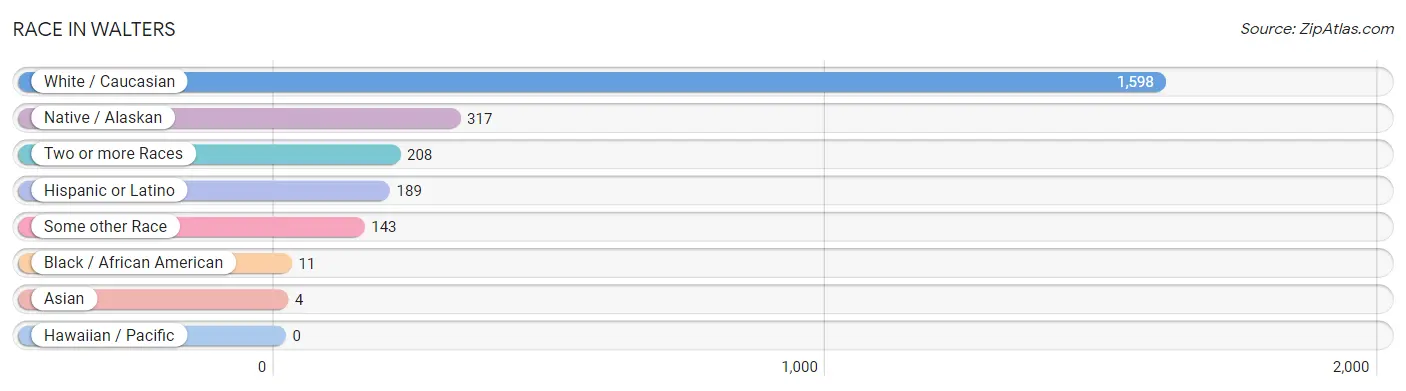
| Race | # Population | % Population |
| Asian | 4 | 0.2% |
| Black / African American | 11 | 0.5% |
| Hawaiian / Pacific | 0 | 0.0% |
| Hispanic or Latino | 189 | 8.3% |
| Native / Alaskan | 317 | 13.9% |
| White / Caucasian | 1,598 | 70.1% |
| Two or more Races | 208 | 9.1% |
| Some other Race | 143 | 6.3% |
| Total | 2,281 | 100.0% |
Ancestry in Walters
The most populous ancestries reported in Walters are German (287 | 12.6%), Irish (269 | 11.8%), American (268 | 11.7%), English (198 | 8.7%), and Mexican (157 | 6.9%), together accounting for 51.7% of all Walters residents.
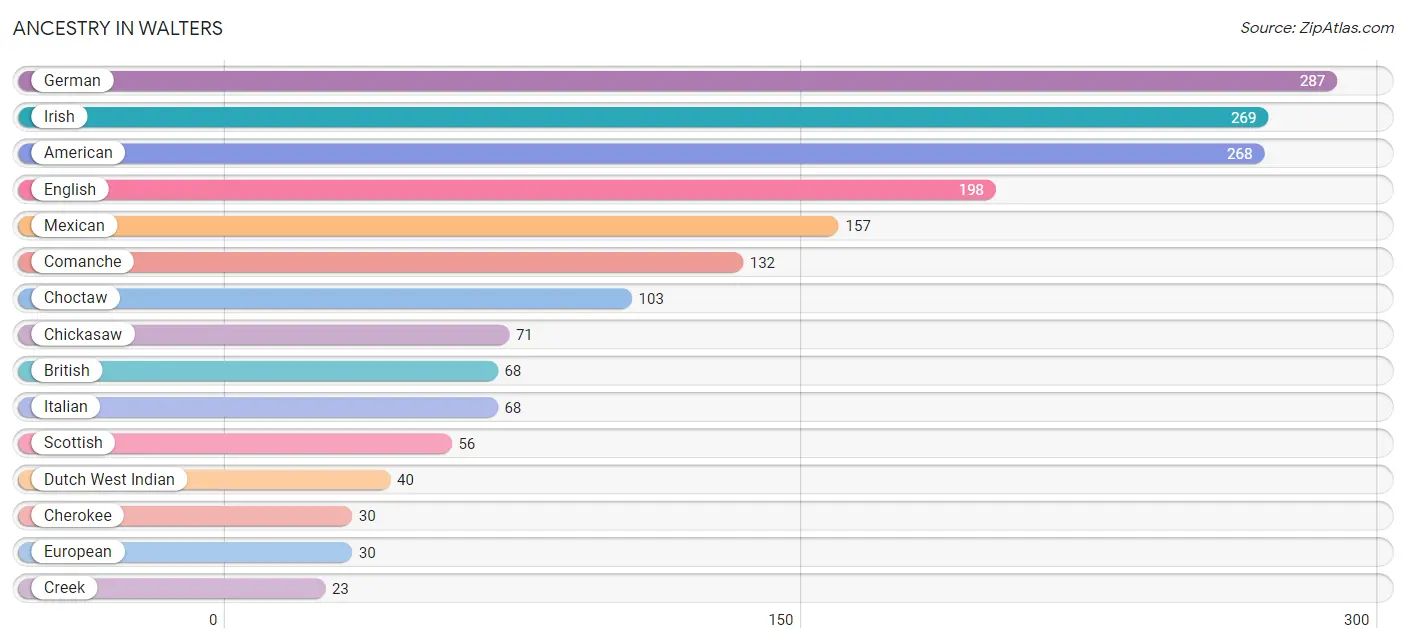
| Ancestry | # Population | % Population |
| American | 268 | 11.7% |
| Austrian | 6 | 0.3% |
| Belgian | 4 | 0.2% |
| British | 68 | 3.0% |
| Burmese | 9 | 0.4% |
| Cherokee | 30 | 1.3% |
| Chickasaw | 71 | 3.1% |
| Choctaw | 103 | 4.5% |
| Comanche | 132 | 5.8% |
| Creek | 23 | 1.0% |
| Czech | 19 | 0.8% |
| Czechoslovakian | 2 | 0.1% |
| Dutch | 22 | 1.0% |
| Dutch West Indian | 40 | 1.8% |
| Eastern European | 13 | 0.6% |
| English | 198 | 8.7% |
| European | 30 | 1.3% |
| French | 5 | 0.2% |
| French Canadian | 20 | 0.9% |
| German | 287 | 12.6% |
| Indian (Asian) | 5 | 0.2% |
| Iranian | 13 | 0.6% |
| Irish | 269 | 11.8% |
| Iroquois | 2 | 0.1% |
| Italian | 68 | 3.0% |
| Kiowa | 11 | 0.5% |
| Mexican | 157 | 6.9% |
| Native Hawaiian | 5 | 0.2% |
| Polish | 5 | 0.2% |
| Puerto Rican | 9 | 0.4% |
| Samoan | 4 | 0.2% |
| Scandinavian | 2 | 0.1% |
| Scottish | 56 | 2.5% |
| Seminole | 12 | 0.5% |
| Spaniard | 12 | 0.5% |
| Swiss | 5 | 0.2% | View All 36 Rows |
Immigrants in Walters
The most numerous immigrant groups reported in Walters came from Central America (8 | 0.4%), Latin America (8 | 0.4%), Mexico (8 | 0.4%), Asia (4 | 0.2%), and Eastern Asia (4 | 0.2%), together accounting for 1.4% of all Walters residents.
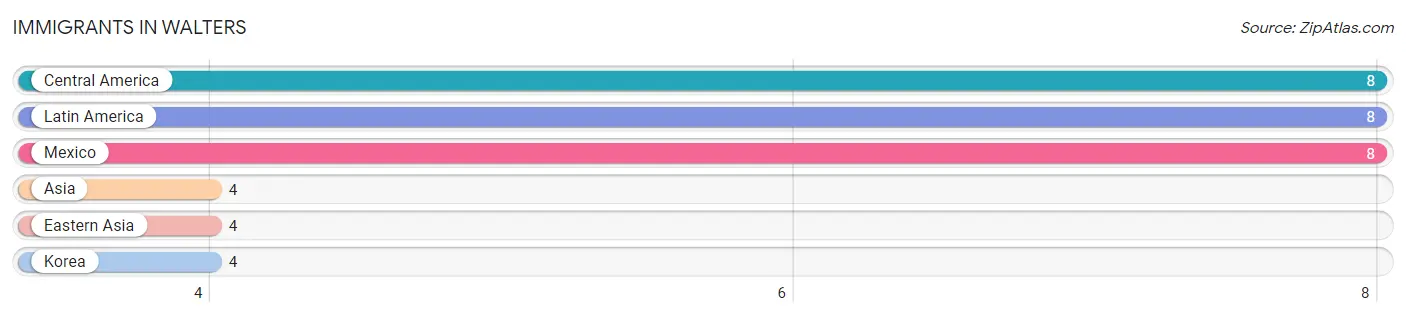
| Immigration Origin | # Population | % Population |
| Asia | 4 | 0.2% |
| Central America | 8 | 0.4% |
| Eastern Asia | 4 | 0.2% |
| Korea | 4 | 0.2% |
| Latin America | 8 | 0.4% |
| Mexico | 8 | 0.4% | View All 6 Rows |
Sex and Age in Walters
Sex and Age in Walters
The most populous age groups in Walters are 10 to 14 Years (107 | 9.9%) for men and 55 to 59 Years (204 | 17.0%) for women.
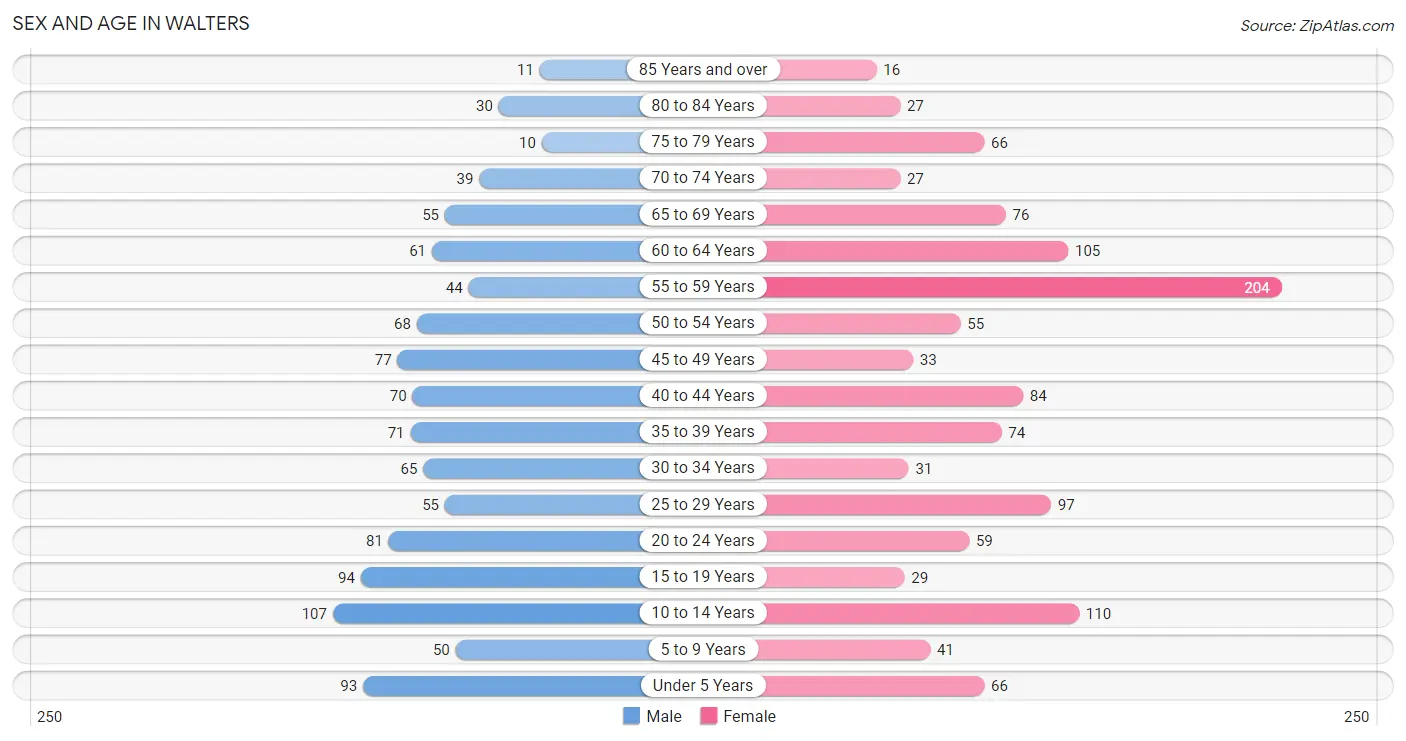
| Age Bracket | Male | Female |
| Under 5 Years | 93 (8.6%) | 66 (5.5%) |
| 5 to 9 Years | 50 (4.6%) | 41 (3.4%) |
| 10 to 14 Years | 107 (9.9%) | 110 (9.2%) |
| 15 to 19 Years | 94 (8.7%) | 29 (2.4%) |
| 20 to 24 Years | 81 (7.5%) | 59 (4.9%) |
| 25 to 29 Years | 55 (5.1%) | 97 (8.1%) |
| 30 to 34 Years | 65 (6.0%) | 31 (2.6%) |
| 35 to 39 Years | 71 (6.6%) | 74 (6.2%) |
| 40 to 44 Years | 70 (6.5%) | 84 (7.0%) |
| 45 to 49 Years | 77 (7.1%) | 33 (2.8%) |
| 50 to 54 Years | 68 (6.3%) | 55 (4.6%) |
| 55 to 59 Years | 44 (4.1%) | 204 (17.0%) |
| 60 to 64 Years | 61 (5.6%) | 105 (8.7%) |
| 65 to 69 Years | 55 (5.1%) | 76 (6.3%) |
| 70 to 74 Years | 39 (3.6%) | 27 (2.2%) |
| 75 to 79 Years | 10 (0.9%) | 66 (5.5%) |
| 80 to 84 Years | 30 (2.8%) | 27 (2.2%) |
| 85 Years and over | 11 (1.0%) | 16 (1.3%) |
| Total | 1,081 (100.0%) | 1,200 (100.0%) |
Families and Households in Walters
Median Family Size in Walters
The median family size in Walters is 3.37 persons per family, with single male/father families (39 | 7.7%) accounting for the largest median family size of 4.97 persons per family. On the other hand, married-couple families (352 | 69.8%) represent the smallest median family size with 3.04 persons per family.
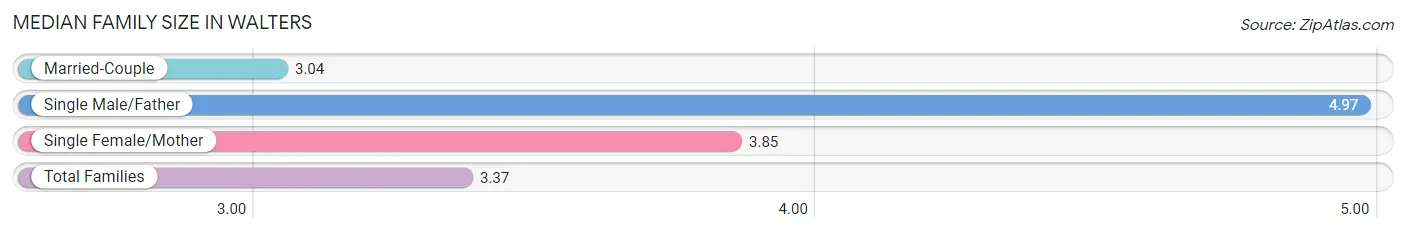
| Family Type | # Families | Family Size |
| Married-Couple | 352 (69.8%) | 3.04 |
| Single Male/Father | 39 (7.7%) | 4.97 |
| Single Female/Mother | 113 (22.4%) | 3.85 |
| Total Families | 504 (100.0%) | 3.37 |
Median Household Size in Walters
The median household size in Walters is 2.64 persons per household, with single male/father households (39 | 4.6%) accounting for the largest median household size of 5.64 persons per household. non-family households (334 | 39.9%) represent the smallest median household size with 1.16 persons per household.
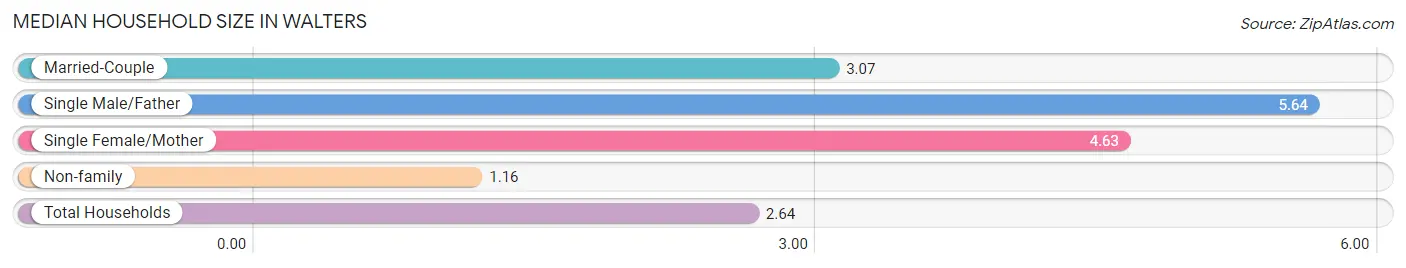
| Household Type | # Households | Household Size |
| Married-Couple | 352 (42.0%) | 3.07 |
| Single Male/Father | 39 (4.6%) | 5.64 |
| Single Female/Mother | 113 (13.5%) | 4.63 |
| Non-family | 334 (39.9%) | 1.16 |
| Total Households | 838 (100.0%) | 2.64 |
Household Size by Marriage Status in Walters
Out of a total of 838 households in Walters, 504 (60.1%) are family households, while 334 (39.9%) are nonfamily households. The most numerous type of family households are 2-person households, comprising 266, and the most common type of nonfamily households are 1-person households, comprising 294.
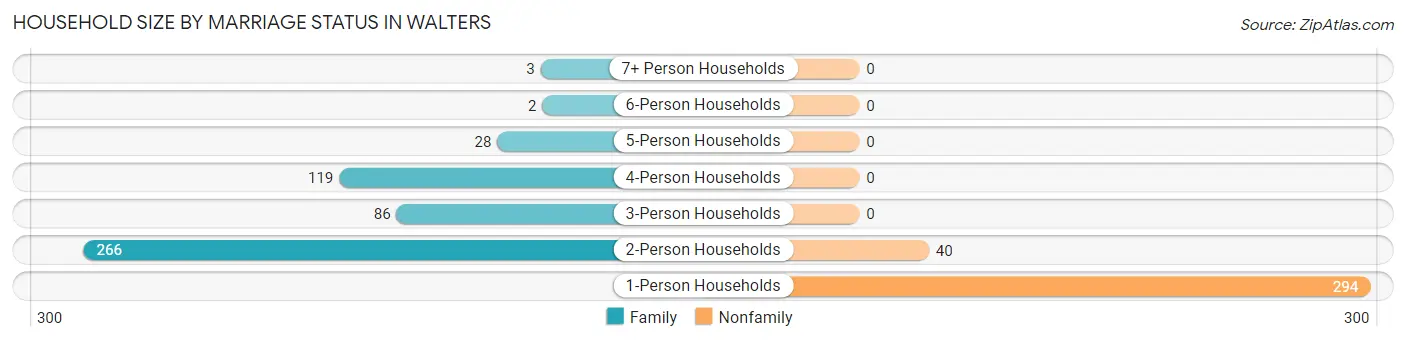
| Household Size | Family Households | Nonfamily Households |
| 1-Person Households | - | 294 (35.1%) |
| 2-Person Households | 266 (31.7%) | 40 (4.8%) |
| 3-Person Households | 86 (10.3%) | 0 (0.0%) |
| 4-Person Households | 119 (14.2%) | 0 (0.0%) |
| 5-Person Households | 28 (3.3%) | 0 (0.0%) |
| 6-Person Households | 2 (0.2%) | 0 (0.0%) |
| 7+ Person Households | 3 (0.4%) | 0 (0.0%) |
| Total | 504 (60.1%) | 334 (39.9%) |
Female Fertility in Walters
Fertility by Age in Walters
Average fertility rate in Walters is 26.0 births per 1,000 women. Women in the age bracket of 20 to 34 years have the highest fertility rate with 43.0 births per 1,000 women. Women in the age bracket of 20 to 34 years acount for 72.7% of all women with births.
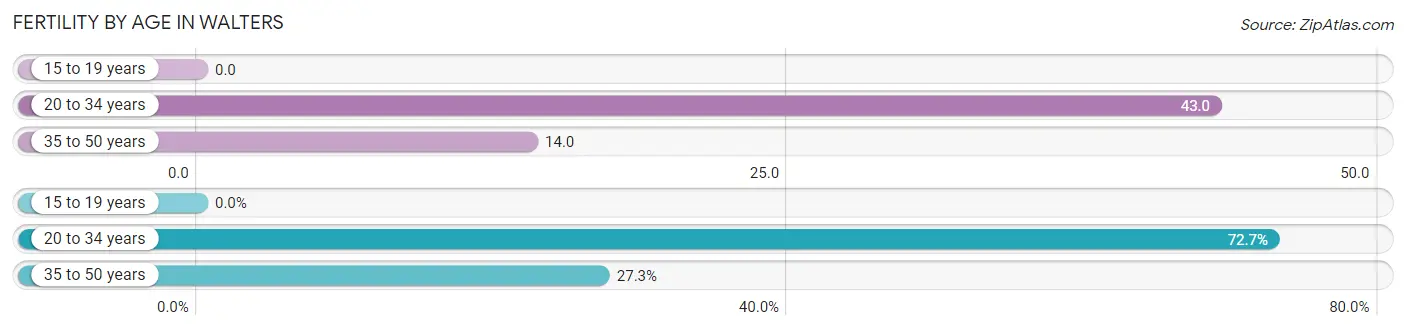
| Age Bracket | Women with Births | Births / 1,000 Women |
| 15 to 19 years | 0 (0.0%) | 0.0 |
| 20 to 34 years | 8 (72.7%) | 43.0 |
| 35 to 50 years | 3 (27.3%) | 14.0 |
| Total | 11 (100.0%) | 26.0 |
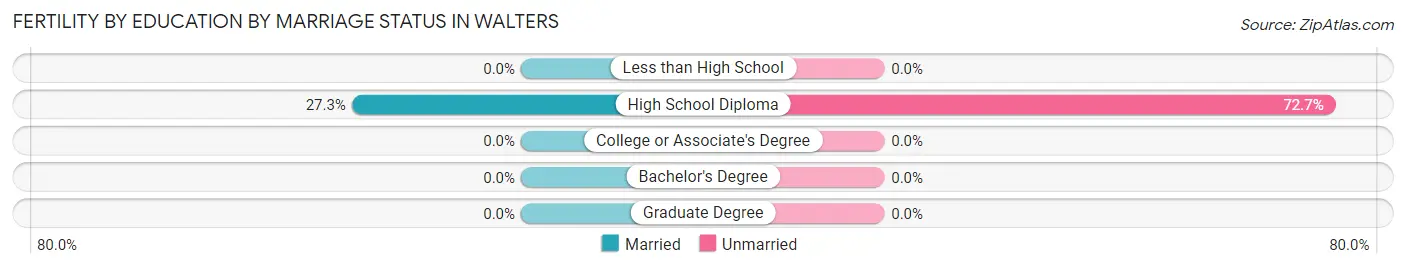
Fertility by Age by Marriage Status in Walters
27.3% of women with births (11) in Walters are married. The highest percentage of unmarried women with births falls into 20 to 34 years age bracket with 100.0% of them unmarried at the time of birth, while the lowest percentage of unmarried women with births belong to 35 to 50 years age bracket with 0.0% of them unmarried.
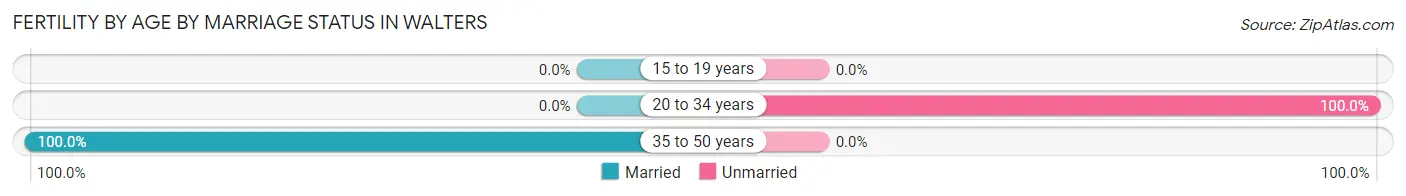
| Age Bracket | Married | Unmarried |
| 15 to 19 years | 0 (0.0%) | 0 (0.0%) |
| 20 to 34 years | 0 (0.0%) | 8 (100.0%) |
| 35 to 50 years | 3 (100.0%) | 0 (0.0%) |
| Total | 3 (27.3%) | 8 (72.7%) |
Fertility by Education in Walters
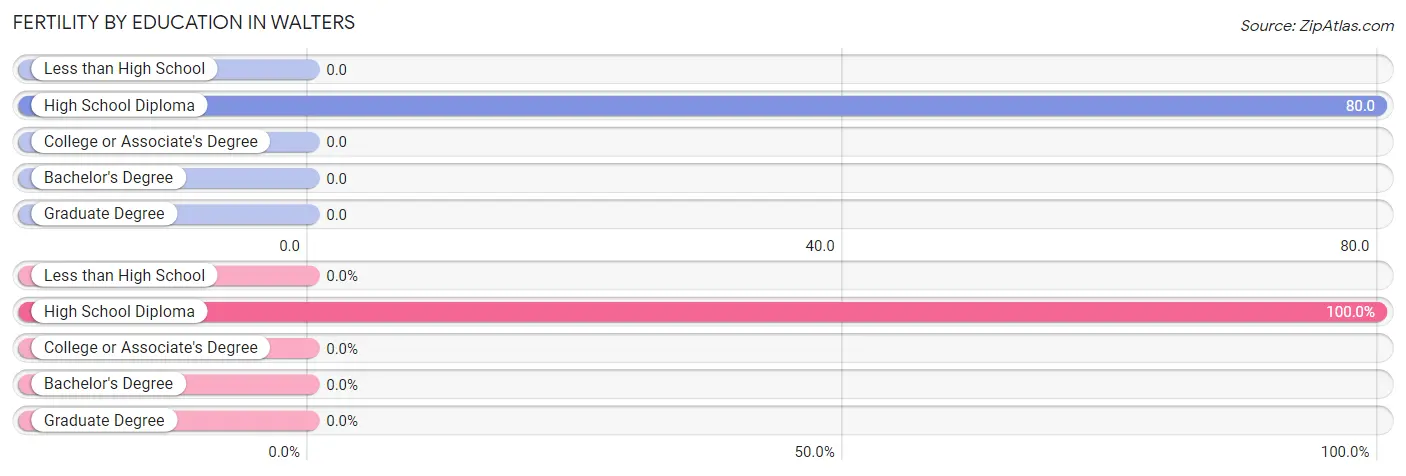
| Educational Attainment | Women with Births | Births / 1,000 Women |
| Less than High School | 0 (0.0%) | 0.0 |
| High School Diploma | 11 (100.0%) | 80.0 |
| College or Associate's Degree | 0 (0.0%) | 0.0 |
| Bachelor's Degree | 0 (0.0%) | 0.0 |
| Graduate Degree | 0 (0.0%) | 0.0 |
| Total | 11 (100.0%) | 26.0 |
Fertility by Education by Marriage Status in Walters
72.7% of women with births in Walters are unmarried. Women with the educational attainment of high school diploma are most likely to be married with 27.3% of them married at childbirth, while women with the educational attainment of high school diploma are least likely to be married with 72.7% of them unmarried at childbirth.
| Educational Attainment | Married | Unmarried |
| Less than High School | 0 (0.0%) | 0 (0.0%) |
| High School Diploma | 3 (27.3%) | 8 (72.7%) |
| College or Associate's Degree | 0 (0.0%) | 0 (0.0%) |
| Bachelor's Degree | 0 (0.0%) | 0 (0.0%) |
| Graduate Degree | 0 (0.0%) | 0 (0.0%) |
| Total | 3 (27.3%) | 8 (72.7%) |
Employment Characteristics in Walters
Employment by Class of Employer in Walters
Among the 963 employed individuals in Walters, private company employees (623 | 64.7%), state government employees (107 | 11.1%), and self-employed (not incorporated) (75 | 7.8%) make up the most common classes of employment.
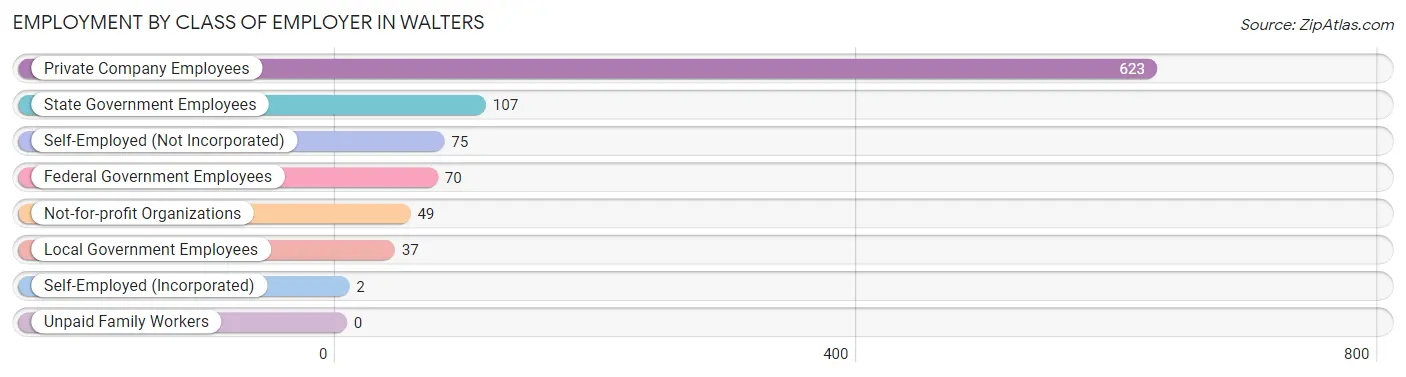
| Employer Class | # Employees | % Employees |
| Private Company Employees | 623 | 64.7% |
| Self-Employed (Incorporated) | 2 | 0.2% |
| Self-Employed (Not Incorporated) | 75 | 7.8% |
| Not-for-profit Organizations | 49 | 5.1% |
| Local Government Employees | 37 | 3.8% |
| State Government Employees | 107 | 11.1% |
| Federal Government Employees | 70 | 7.3% |
| Unpaid Family Workers | 0 | 0.0% |
| Total | 963 | 100.0% |
Employment Status by Age in Walters
According to the labor force statistics for Walters, out of the total population over 16 years of age (1,788), 56.1% or 1,003 individuals are in the labor force, with 2.3% or 23 of them unemployed. The age group with the highest labor force participation rate is 30 to 34 years, with 81.3% or 78 individuals in the labor force. Within the labor force, the 16 to 19 years age range has the highest percentage of unemployed individuals, with 15.4% or 2 of them being unemployed.
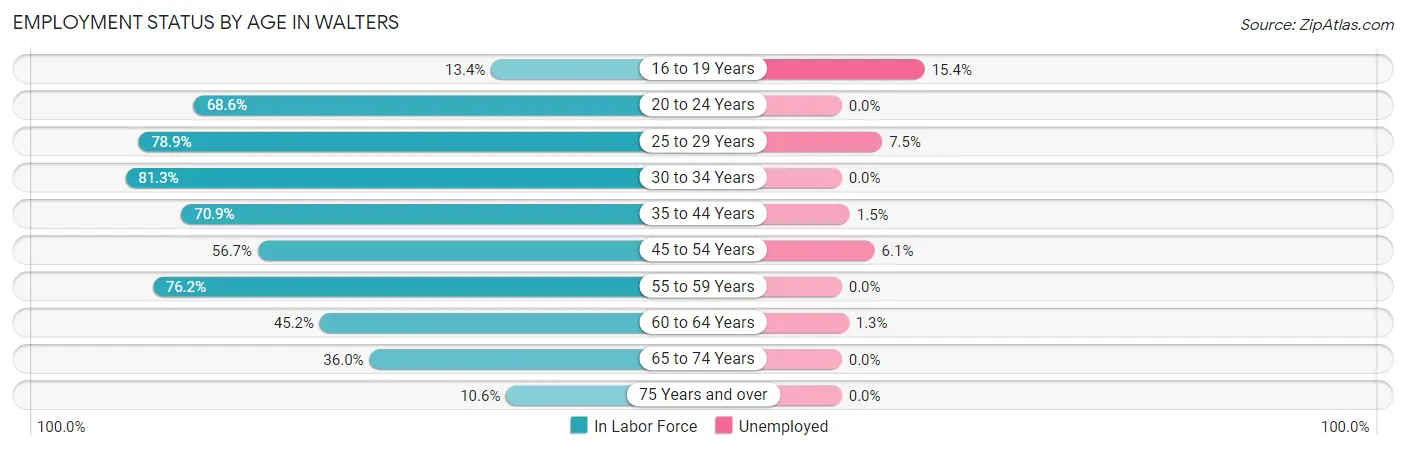
| Age Bracket | In Labor Force | Unemployed |
| 16 to 19 Years | 13 (13.4%) | 2 (15.4%) |
| 20 to 24 Years | 96 (68.6%) | 0 (0.0%) |
| 25 to 29 Years | 120 (78.9%) | 9 (7.5%) |
| 30 to 34 Years | 78 (81.3%) | 0 (0.0%) |
| 35 to 44 Years | 212 (70.9%) | 3 (1.5%) |
| 45 to 54 Years | 132 (56.7%) | 8 (6.1%) |
| 55 to 59 Years | 189 (76.2%) | 0 (0.0%) |
| 60 to 64 Years | 75 (45.2%) | 1 (1.3%) |
| 65 to 74 Years | 71 (36.0%) | 0 (0.0%) |
| 75 Years and over | 17 (10.6%) | 0 (0.0%) |
| Total | 1,003 (56.1%) | 23 (2.3%) |
Employment Status by Educational Attainment in Walters
According to labor force statistics for Walters, 67.5% of individuals (806) out of the total population between 25 and 64 years of age (1,194) are in the labor force, with 2.6% or 21 of them being unemployed. The group with the highest labor force participation rate are those with the educational attainment of bachelor's degree or higher, with 89.7% or 140 individuals in the labor force. Within the labor force, individuals with less than high school education have the highest percentage of unemployment, with 16.4% or 9 of them being unemployed.
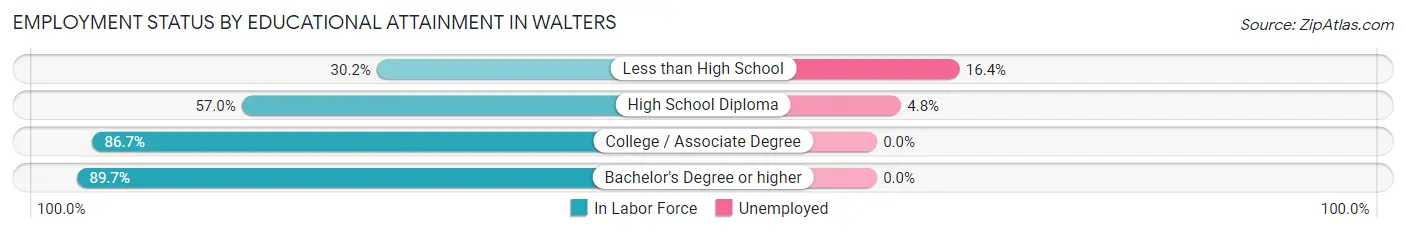
| Educational Attainment | In Labor Force | Unemployed |
| Less than High School | 55 (30.2%) | 30 (16.4%) |
| High School Diploma | 252 (57.0%) | 21 (4.8%) |
| College / Associate Degree | 359 (86.7%) | 0 (0.0%) |
| Bachelor's Degree or higher | 140 (89.7%) | 0 (0.0%) |
| Total | 806 (67.5%) | 31 (2.6%) |
Employment Occupations by Sex in Walters
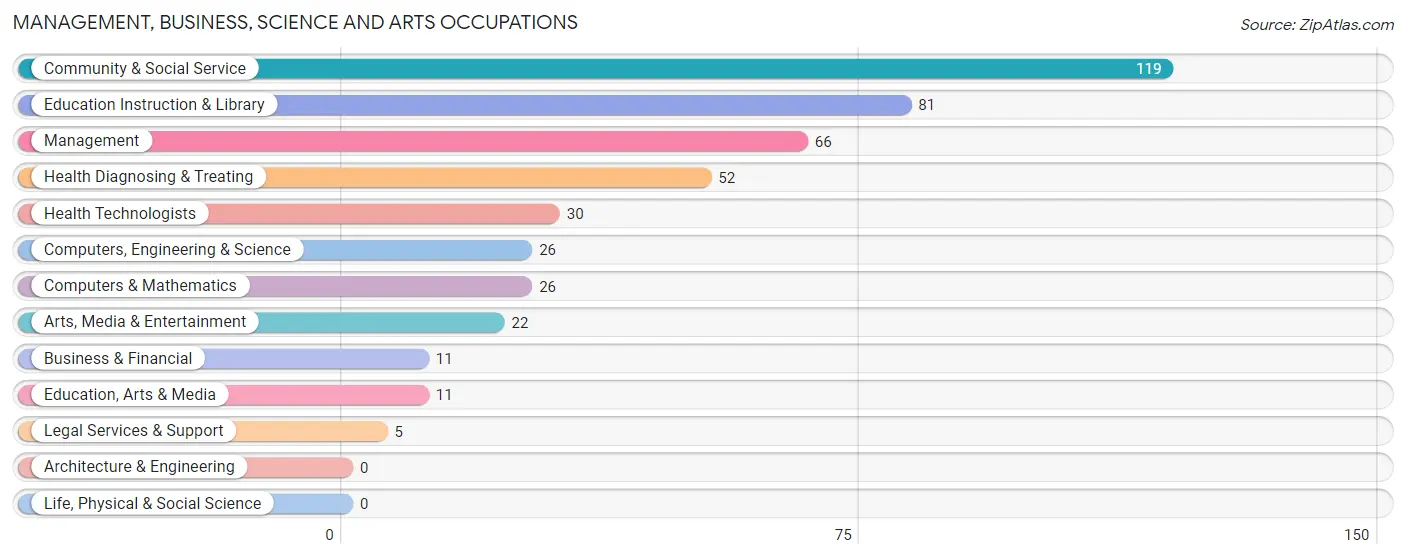
Management, Business, Science and Arts Occupations
The most common Management, Business, Science and Arts occupations in Walters are Community & Social Service (119 | 12.2%), Education Instruction & Library (81 | 8.3%), Management (66 | 6.8%), Health Diagnosing & Treating (52 | 5.3%), and Health Technologists (30 | 3.1%).
Management, Business, Science and Arts Occupations by Sex
Within the Management, Business, Science and Arts occupations in Walters, the most male-oriented occupations are Business & Financial (100.0%), Education, Arts & Media (100.0%), and Arts, Media & Entertainment (100.0%), while the most female-oriented occupations are Legal Services & Support (100.0%), Education Instruction & Library (100.0%), and Health Technologists (100.0%).
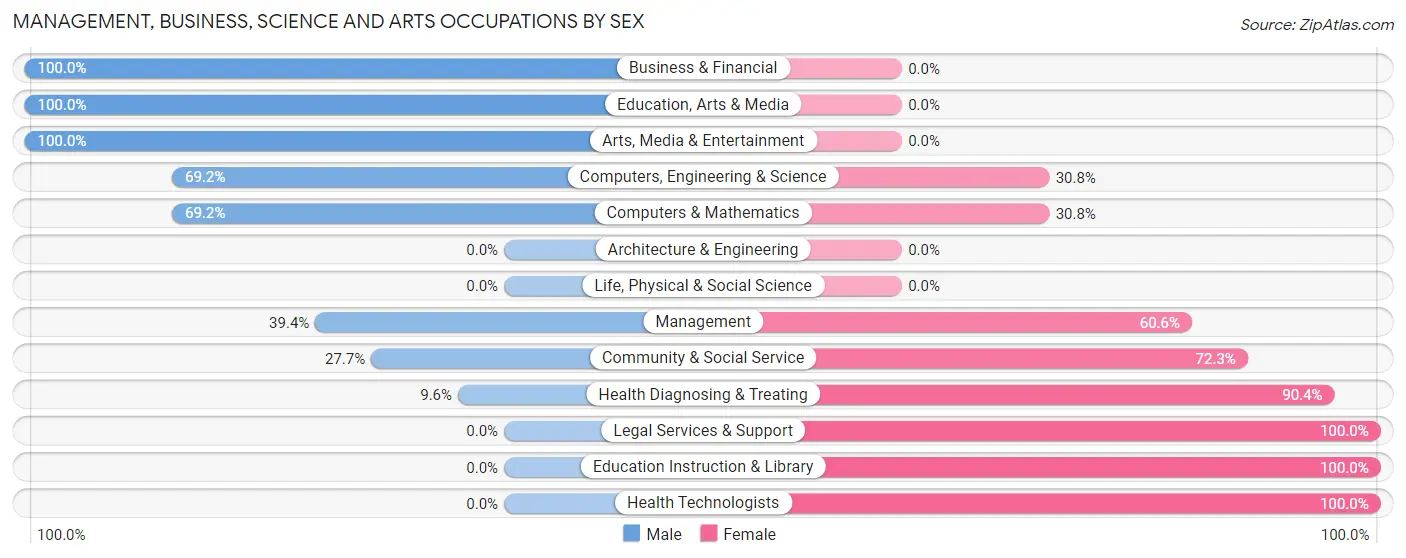
| Occupation | Male | Female |
| Management | 26 (39.4%) | 40 (60.6%) |
| Business & Financial | 11 (100.0%) | 0 (0.0%) |
| Computers, Engineering & Science | 18 (69.2%) | 8 (30.8%) |
| Computers & Mathematics | 18 (69.2%) | 8 (30.8%) |
| Architecture & Engineering | 0 (0.0%) | 0 (0.0%) |
| Life, Physical & Social Science | 0 (0.0%) | 0 (0.0%) |
| Community & Social Service | 33 (27.7%) | 86 (72.3%) |
| Education, Arts & Media | 11 (100.0%) | 0 (0.0%) |
| Legal Services & Support | 0 (0.0%) | 5 (100.0%) |
| Education Instruction & Library | 0 (0.0%) | 81 (100.0%) |
| Arts, Media & Entertainment | 22 (100.0%) | 0 (0.0%) |
| Health Diagnosing & Treating | 5 (9.6%) | 47 (90.4%) |
| Health Technologists | 0 (0.0%) | 30 (100.0%) |
| Total (Category) | 93 (33.9%) | 181 (66.1%) |
| Total (Overall) | 458 (47.0%) | 516 (53.0%) |
Services Occupations
The most common Services occupations in Walters are Food Preparation & Serving (71 | 7.3%), Security & Protection (30 | 3.1%), Healthcare Support (18 | 1.8%), Firefighting & Prevention (18 | 1.8%), and Cleaning & Maintenance (16 | 1.6%).

Services Occupations by Sex
Within the Services occupations in Walters, the most male-oriented occupations are Security & Protection (100.0%), Firefighting & Prevention (100.0%), and Law Enforcement (100.0%), while the most female-oriented occupations are Healthcare Support (100.0%), Personal Care & Service (100.0%), and Food Preparation & Serving (88.7%).
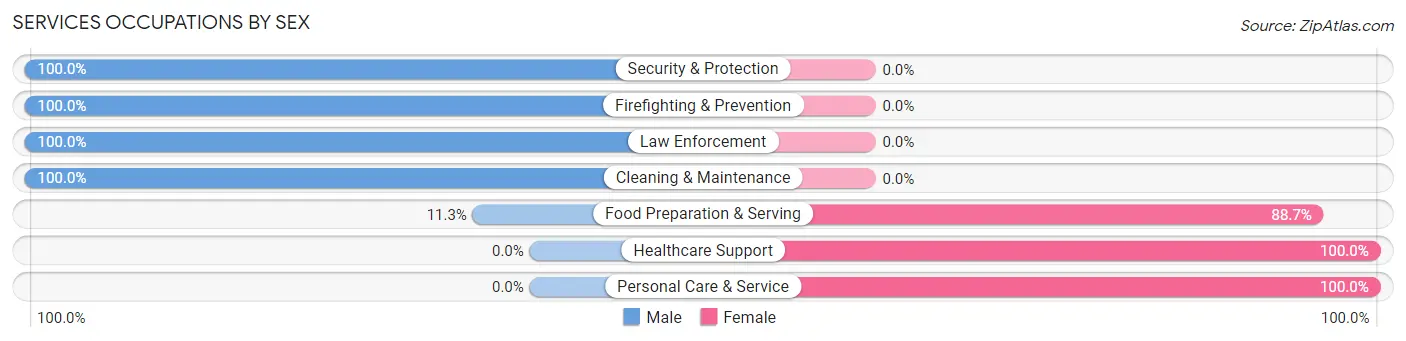
| Occupation | Male | Female |
| Healthcare Support | 0 (0.0%) | 18 (100.0%) |
| Security & Protection | 30 (100.0%) | 0 (0.0%) |
| Firefighting & Prevention | 18 (100.0%) | 0 (0.0%) |
| Law Enforcement | 12 (100.0%) | 0 (0.0%) |
| Food Preparation & Serving | 8 (11.3%) | 63 (88.7%) |
| Cleaning & Maintenance | 16 (100.0%) | 0 (0.0%) |
| Personal Care & Service | 0 (0.0%) | 10 (100.0%) |
| Total (Category) | 54 (37.2%) | 91 (62.8%) |
| Total (Overall) | 458 (47.0%) | 516 (53.0%) |
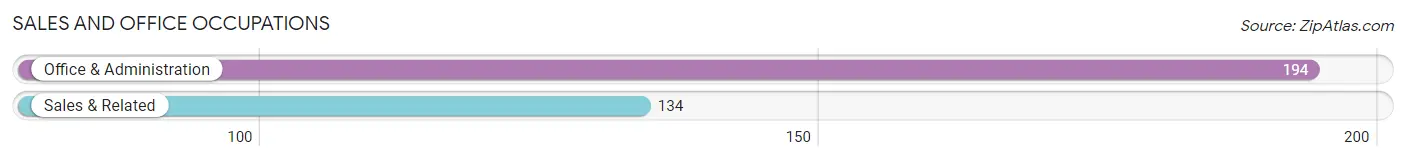
Sales and Office Occupations
The most common Sales and Office occupations in Walters are Office & Administration (194 | 19.9%), and Sales & Related (134 | 13.8%).
Sales and Office Occupations by Sex
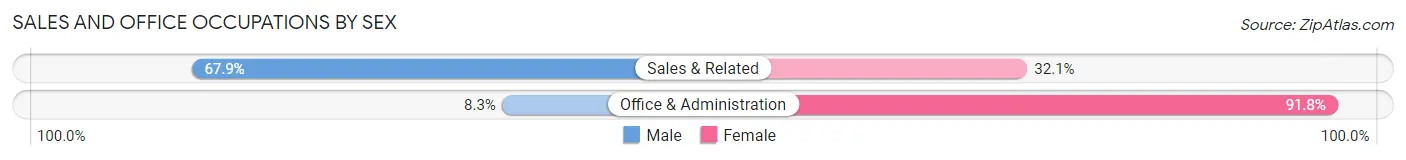
| Occupation | Male | Female |
| Sales & Related | 91 (67.9%) | 43 (32.1%) |
| Office & Administration | 16 (8.3%) | 178 (91.7%) |
| Total (Category) | 107 (32.6%) | 221 (67.4%) |
| Total (Overall) | 458 (47.0%) | 516 (53.0%) |
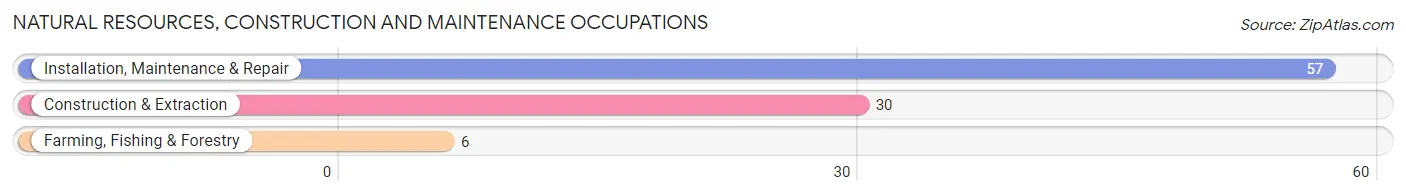
Natural Resources, Construction and Maintenance Occupations
The most common Natural Resources, Construction and Maintenance occupations in Walters are Installation, Maintenance & Repair (57 | 5.9%), Construction & Extraction (30 | 3.1%), and Farming, Fishing & Forestry (6 | 0.6%).
Natural Resources, Construction and Maintenance Occupations by Sex
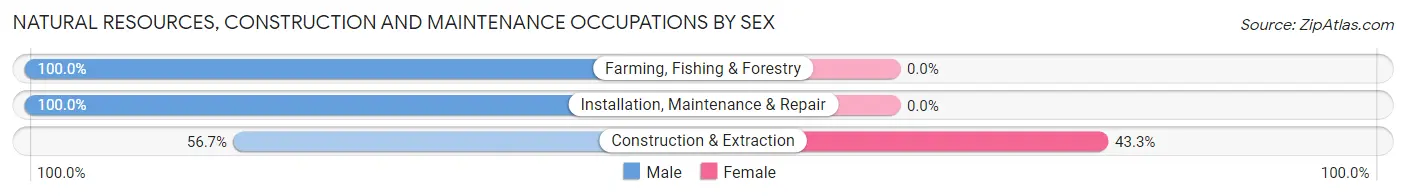
| Occupation | Male | Female |
| Farming, Fishing & Forestry | 6 (100.0%) | 0 (0.0%) |
| Construction & Extraction | 17 (56.7%) | 13 (43.3%) |
| Installation, Maintenance & Repair | 57 (100.0%) | 0 (0.0%) |
| Total (Category) | 80 (86.0%) | 13 (14.0%) |
| Total (Overall) | 458 (47.0%) | 516 (53.0%) |
Production, Transportation and Moving Occupations
The most common Production, Transportation and Moving occupations in Walters are Production (99 | 10.2%), Material Moving (21 | 2.2%), and Transportation (14 | 1.4%).
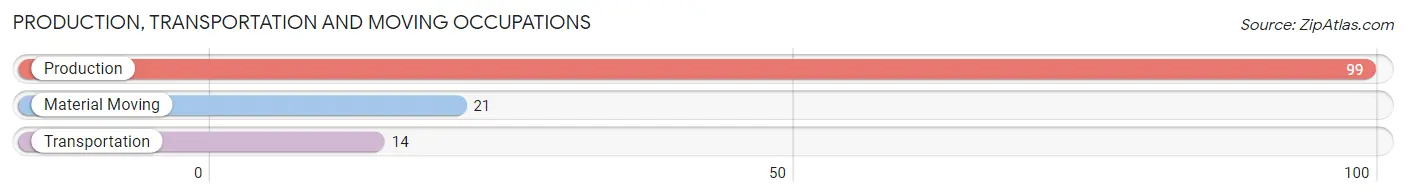
Production, Transportation and Moving Occupations by Sex
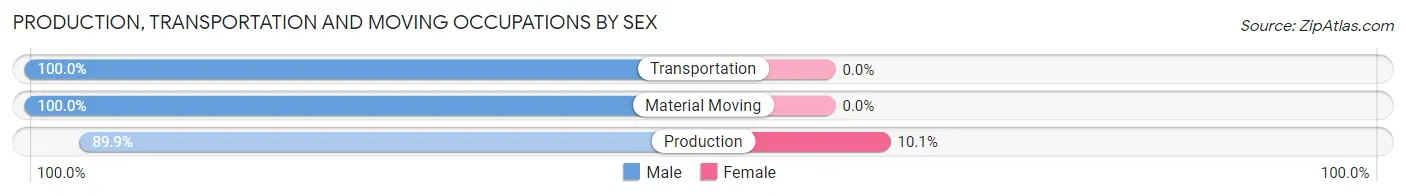
| Occupation | Male | Female |
| Production | 89 (89.9%) | 10 (10.1%) |
| Transportation | 14 (100.0%) | 0 (0.0%) |
| Material Moving | 21 (100.0%) | 0 (0.0%) |
| Total (Category) | 124 (92.5%) | 10 (7.5%) |
| Total (Overall) | 458 (47.0%) | 516 (53.0%) |
Employment Industries by Sex in Walters
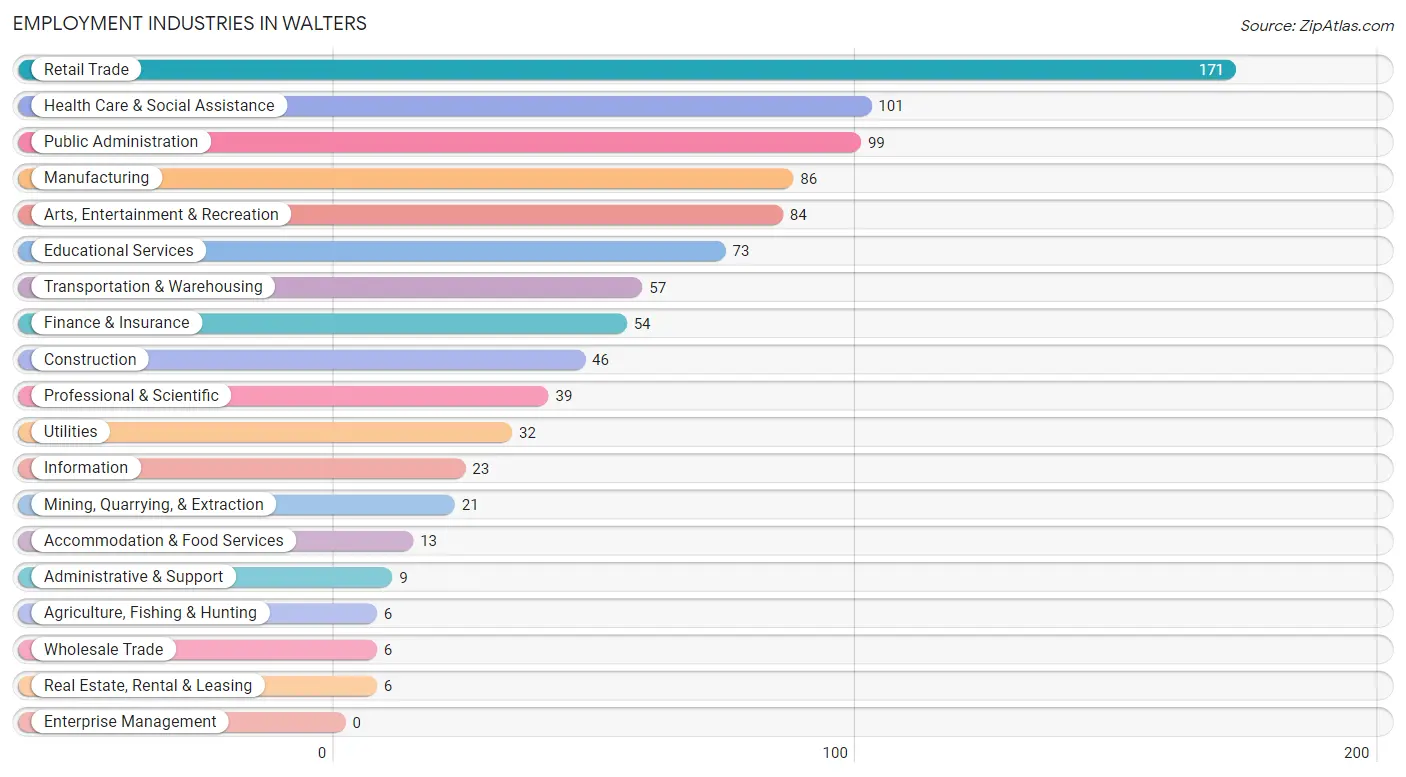
Employment Industries in Walters
The major employment industries in Walters include Retail Trade (171 | 17.6%), Health Care & Social Assistance (101 | 10.4%), Public Administration (99 | 10.2%), Manufacturing (86 | 8.8%), and Arts, Entertainment & Recreation (84 | 8.6%).
Employment Industries by Sex in Walters
The Walters industries that see more men than women are Agriculture, Fishing & Hunting (100.0%), Mining, Quarrying, & Extraction (100.0%), and Wholesale Trade (100.0%), whereas the industries that tend to have a higher number of women are Finance & Insurance (100.0%), Educational Services (100.0%), and Professional & Scientific (89.7%).
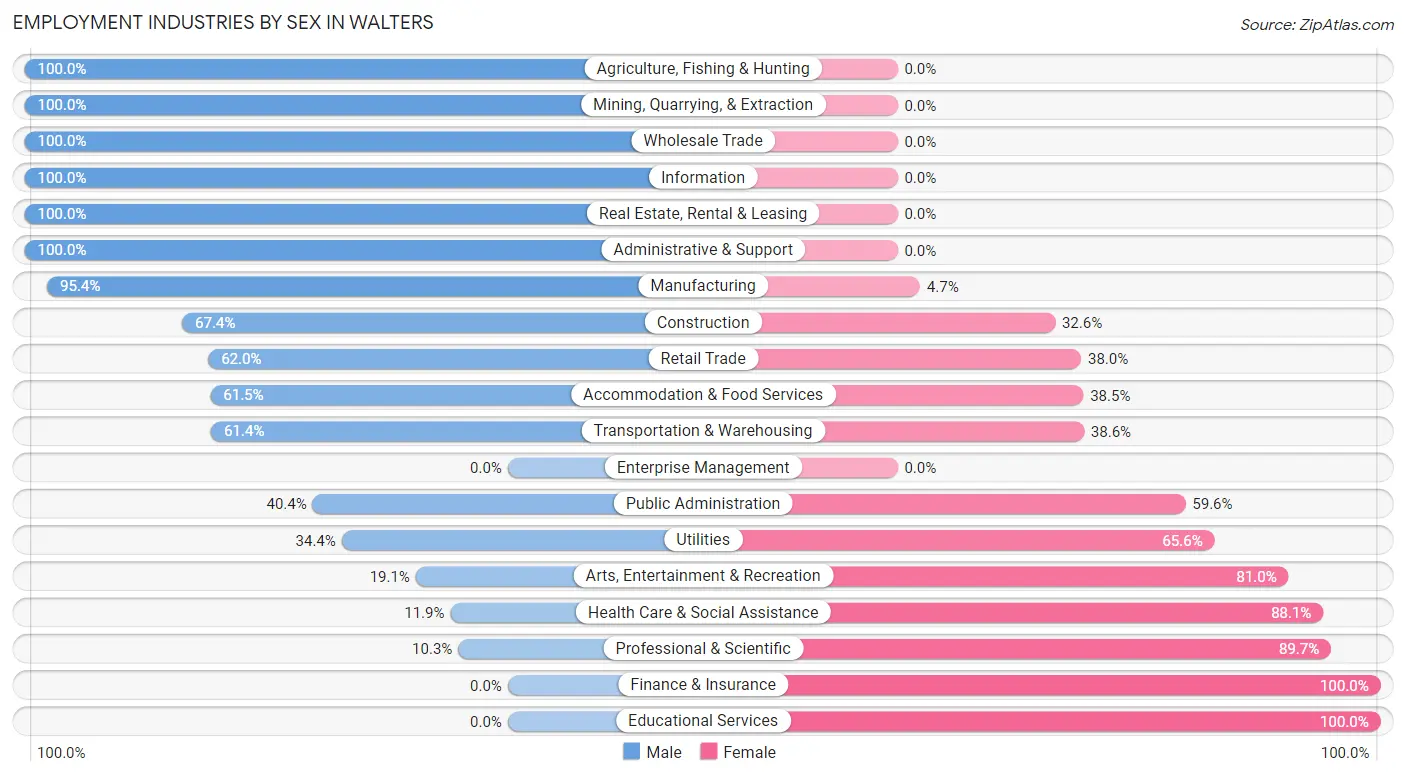
| Industry | Male | Female |
| Agriculture, Fishing & Hunting | 6 (100.0%) | 0 (0.0%) |
| Mining, Quarrying, & Extraction | 21 (100.0%) | 0 (0.0%) |
| Construction | 31 (67.4%) | 15 (32.6%) |
| Manufacturing | 82 (95.4%) | 4 (4.6%) |
| Wholesale Trade | 6 (100.0%) | 0 (0.0%) |
| Retail Trade | 106 (62.0%) | 65 (38.0%) |
| Transportation & Warehousing | 35 (61.4%) | 22 (38.6%) |
| Utilities | 11 (34.4%) | 21 (65.6%) |
| Information | 23 (100.0%) | 0 (0.0%) |
| Finance & Insurance | 0 (0.0%) | 54 (100.0%) |
| Real Estate, Rental & Leasing | 6 (100.0%) | 0 (0.0%) |
| Professional & Scientific | 4 (10.3%) | 35 (89.7%) |
| Enterprise Management | 0 (0.0%) | 0 (0.0%) |
| Administrative & Support | 9 (100.0%) | 0 (0.0%) |
| Educational Services | 0 (0.0%) | 73 (100.0%) |
| Health Care & Social Assistance | 12 (11.9%) | 89 (88.1%) |
| Arts, Entertainment & Recreation | 16 (19.1%) | 68 (80.9%) |
| Accommodation & Food Services | 8 (61.5%) | 5 (38.5%) |
| Public Administration | 40 (40.4%) | 59 (59.6%) |
| Total | 458 (47.0%) | 516 (53.0%) |
Education in Walters
School Enrollment in Walters
The most common levels of schooling among the 498 students in Walters are middle school (227 | 45.6%), high school (105 | 21.1%), and nursery / preschool (98 | 19.7%).
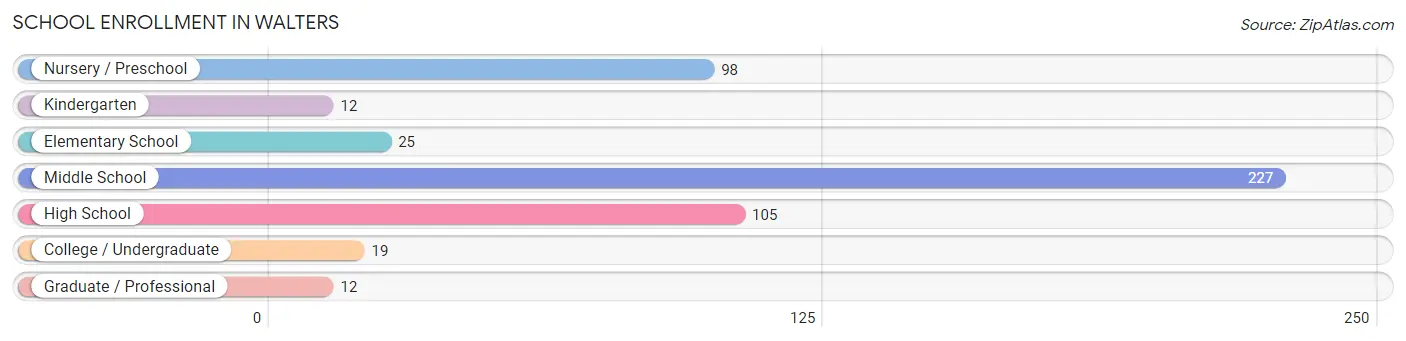
| School Level | # Students | % Students |
| Nursery / Preschool | 98 | 19.7% |
| Kindergarten | 12 | 2.4% |
| Elementary School | 25 | 5.0% |
| Middle School | 227 | 45.6% |
| High School | 105 | 21.1% |
| College / Undergraduate | 19 | 3.8% |
| Graduate / Professional | 12 | 2.4% |
| Total | 498 | 100.0% |
School Enrollment by Age by Funding Source in Walters
Out of a total of 498 students who are enrolled in schools in Walters, 32 (6.4%) attend a private institution, while the remaining 466 (93.6%) are enrolled in public schools. The age group of 25 to 34 year olds has the highest likelihood of being enrolled in private schools, with 8 (100.0% in the age bracket) enrolled. Conversely, the age group of 3 to 4 year olds has the lowest likelihood of being enrolled in a private school, with 42 (100.0% in the age bracket) attending a public institution.
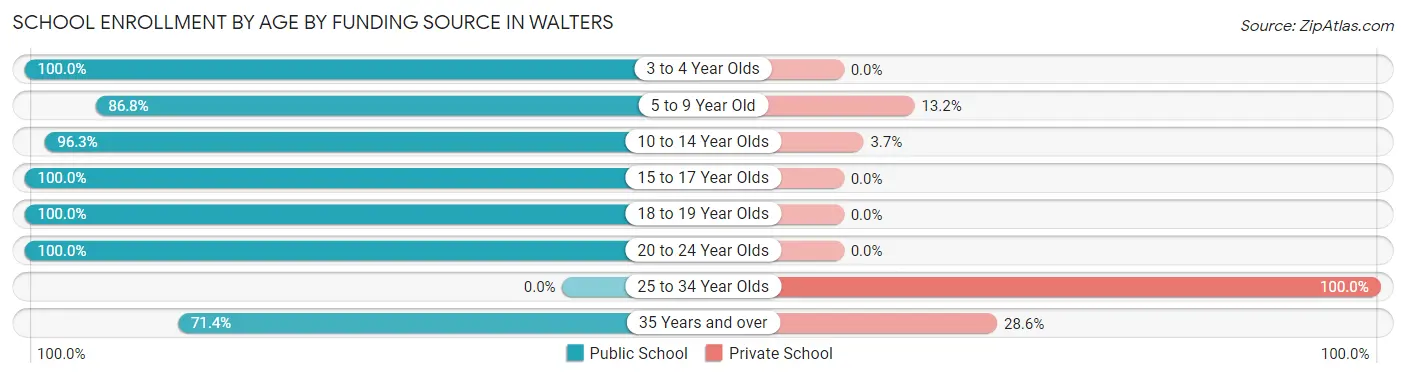
| Age Bracket | Public School | Private School |
| 3 to 4 Year Olds | 42 (100.0%) | 0 (0.0%) |
| 5 to 9 Year Old | 79 (86.8%) | 12 (13.2%) |
| 10 to 14 Year Olds | 209 (96.3%) | 8 (3.7%) |
| 15 to 17 Year Olds | 105 (100.0%) | 0 (0.0%) |
| 18 to 19 Year Olds | 14 (100.0%) | 0 (0.0%) |
| 20 to 24 Year Olds | 7 (100.0%) | 0 (0.0%) |
| 25 to 34 Year Olds | 0 (0.0%) | 8 (100.0%) |
| 35 Years and over | 10 (71.4%) | 4 (28.6%) |
| Total | 466 (93.6%) | 32 (6.4%) |
Educational Attainment by Field of Study in Walters
Education (68 | 29.1%), liberal arts & history (61 | 26.1%), business (42 | 17.9%), communications (27 | 11.5%), and science & technology (11 | 4.7%) are the most common fields of study among 234 individuals in Walters who have obtained a bachelor's degree or higher.
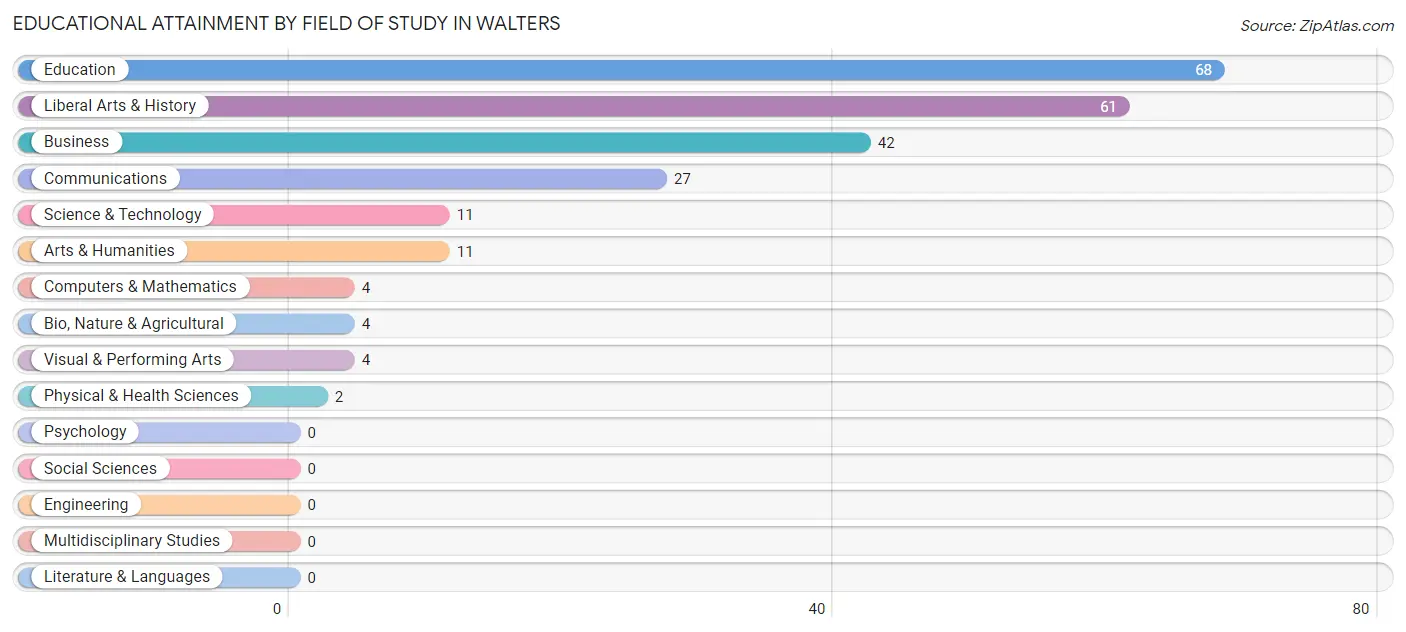
| Field of Study | # Graduates | % Graduates |
| Computers & Mathematics | 4 | 1.7% |
| Bio, Nature & Agricultural | 4 | 1.7% |
| Physical & Health Sciences | 2 | 0.9% |
| Psychology | 0 | 0.0% |
| Social Sciences | 0 | 0.0% |
| Engineering | 0 | 0.0% |
| Multidisciplinary Studies | 0 | 0.0% |
| Science & Technology | 11 | 4.7% |
| Business | 42 | 17.9% |
| Education | 68 | 29.1% |
| Literature & Languages | 0 | 0.0% |
| Liberal Arts & History | 61 | 26.1% |
| Visual & Performing Arts | 4 | 1.7% |
| Communications | 27 | 11.5% |
| Arts & Humanities | 11 | 4.7% |
| Total | 234 | 100.0% |
Transportation & Commute in Walters
Vehicle Availability by Sex in Walters
The most prevalent vehicle ownership categories in Walters are males with 2 vehicles (133, accounting for 29.7%) and females with 2 vehicles (223, making up 25.8%).
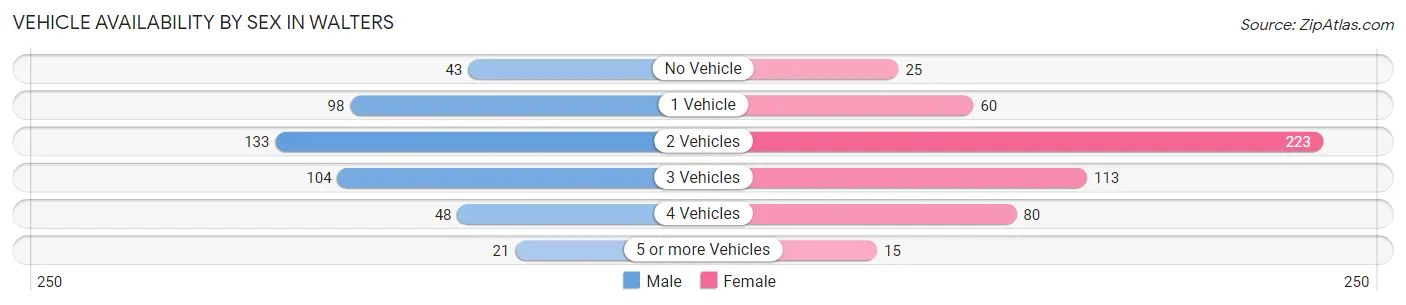
| Vehicles Available | Male | Female |
| No Vehicle | 43 (9.6%) | 25 (4.8%) |
| 1 Vehicle | 98 (21.9%) | 60 (11.6%) |
| 2 Vehicles | 133 (29.7%) | 223 (43.2%) |
| 3 Vehicles | 104 (23.3%) | 113 (21.9%) |
| 4 Vehicles | 48 (10.7%) | 80 (15.5%) |
| 5 or more Vehicles | 21 (4.7%) | 15 (2.9%) |
| Total | 447 (100.0%) | 516 (100.0%) |
Commute Time in Walters
The most frequently occuring commute durations in Walters are 30 to 34 minutes (241 commuters, 26.2%), less than 5 minutes (229 commuters, 24.9%), and 5 to 9 minutes (127 commuters, 13.8%).
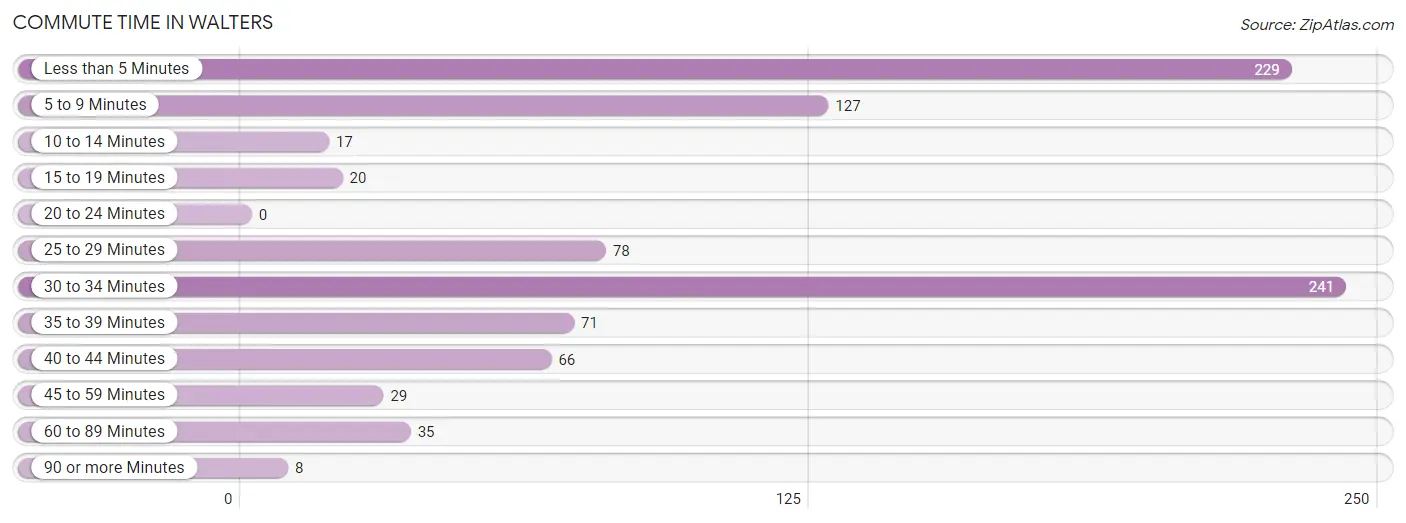
| Commute Time | # Commuters | % Commuters |
| Less than 5 Minutes | 229 | 24.9% |
| 5 to 9 Minutes | 127 | 13.8% |
| 10 to 14 Minutes | 17 | 1.8% |
| 15 to 19 Minutes | 20 | 2.2% |
| 20 to 24 Minutes | 0 | 0.0% |
| 25 to 29 Minutes | 78 | 8.5% |
| 30 to 34 Minutes | 241 | 26.2% |
| 35 to 39 Minutes | 71 | 7.7% |
| 40 to 44 Minutes | 66 | 7.2% |
| 45 to 59 Minutes | 29 | 3.2% |
| 60 to 89 Minutes | 35 | 3.8% |
| 90 or more Minutes | 8 | 0.9% |
Commute Time by Sex in Walters
The most common commute times in Walters are 30 to 34 minutes (128 commuters, 30.3%) for males and less than 5 minutes (156 commuters, 31.3%) for females.
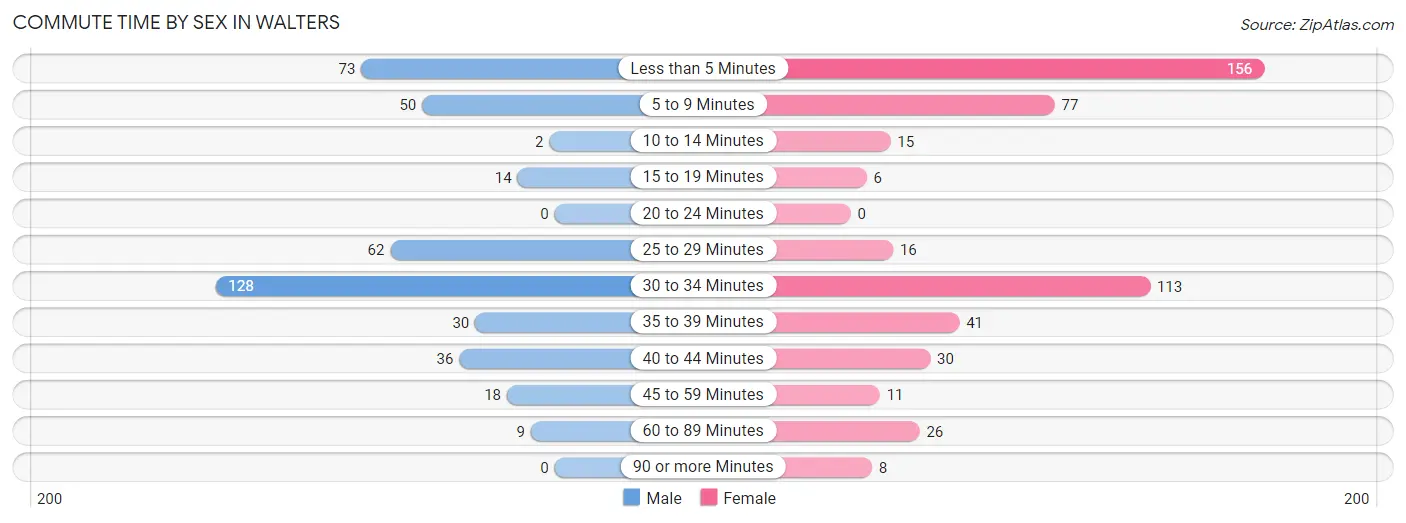
| Commute Time | Male | Female |
| Less than 5 Minutes | 73 (17.3%) | 156 (31.3%) |
| 5 to 9 Minutes | 50 (11.8%) | 77 (15.4%) |
| 10 to 14 Minutes | 2 (0.5%) | 15 (3.0%) |
| 15 to 19 Minutes | 14 (3.3%) | 6 (1.2%) |
| 20 to 24 Minutes | 0 (0.0%) | 0 (0.0%) |
| 25 to 29 Minutes | 62 (14.7%) | 16 (3.2%) |
| 30 to 34 Minutes | 128 (30.3%) | 113 (22.7%) |
| 35 to 39 Minutes | 30 (7.1%) | 41 (8.2%) |
| 40 to 44 Minutes | 36 (8.5%) | 30 (6.0%) |
| 45 to 59 Minutes | 18 (4.3%) | 11 (2.2%) |
| 60 to 89 Minutes | 9 (2.1%) | 26 (5.2%) |
| 90 or more Minutes | 0 (0.0%) | 8 (1.6%) |
Time of Departure to Work by Sex in Walters
The most frequent times of departure to work in Walters are 12:00 PM to 3:59 PM (84, 19.9%) for males and 7:30 AM to 7:59 AM (170, 34.1%) for females.
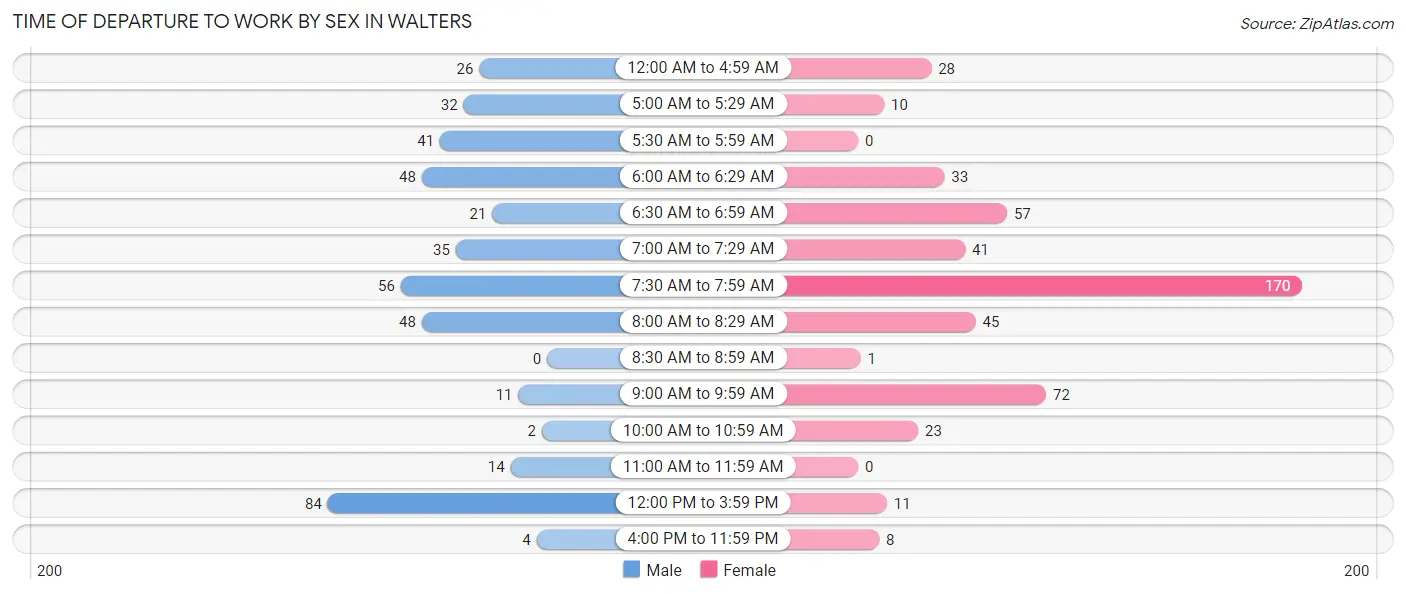
| Time of Departure | Male | Female |
| 12:00 AM to 4:59 AM | 26 (6.2%) | 28 (5.6%) |
| 5:00 AM to 5:29 AM | 32 (7.6%) | 10 (2.0%) |
| 5:30 AM to 5:59 AM | 41 (9.7%) | 0 (0.0%) |
| 6:00 AM to 6:29 AM | 48 (11.4%) | 33 (6.6%) |
| 6:30 AM to 6:59 AM | 21 (5.0%) | 57 (11.4%) |
| 7:00 AM to 7:29 AM | 35 (8.3%) | 41 (8.2%) |
| 7:30 AM to 7:59 AM | 56 (13.3%) | 170 (34.1%) |
| 8:00 AM to 8:29 AM | 48 (11.4%) | 45 (9.0%) |
| 8:30 AM to 8:59 AM | 0 (0.0%) | 1 (0.2%) |
| 9:00 AM to 9:59 AM | 11 (2.6%) | 72 (14.4%) |
| 10:00 AM to 10:59 AM | 2 (0.5%) | 23 (4.6%) |
| 11:00 AM to 11:59 AM | 14 (3.3%) | 0 (0.0%) |
| 12:00 PM to 3:59 PM | 84 (19.9%) | 11 (2.2%) |
| 4:00 PM to 11:59 PM | 4 (0.9%) | 8 (1.6%) |
| Total | 422 (100.0%) | 499 (100.0%) |
Housing Occupancy in Walters
Occupancy by Ownership in Walters
Of the total 838 dwellings in Walters, owner-occupied units account for 585 (69.8%), while renter-occupied units make up 253 (30.2%).
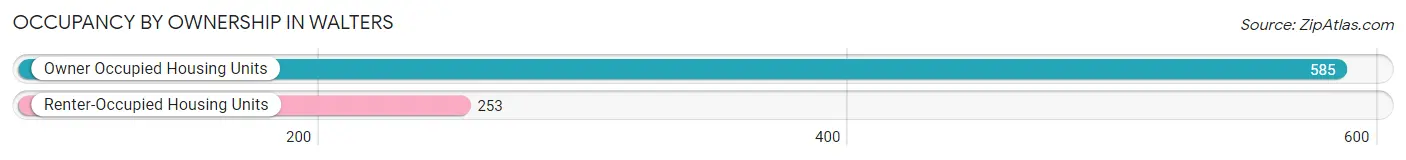
| Occupancy | # Housing Units | % Housing Units |
| Owner Occupied Housing Units | 585 | 69.8% |
| Renter-Occupied Housing Units | 253 | 30.2% |
| Total Occupied Housing Units | 838 | 100.0% |
Occupancy by Household Size in Walters
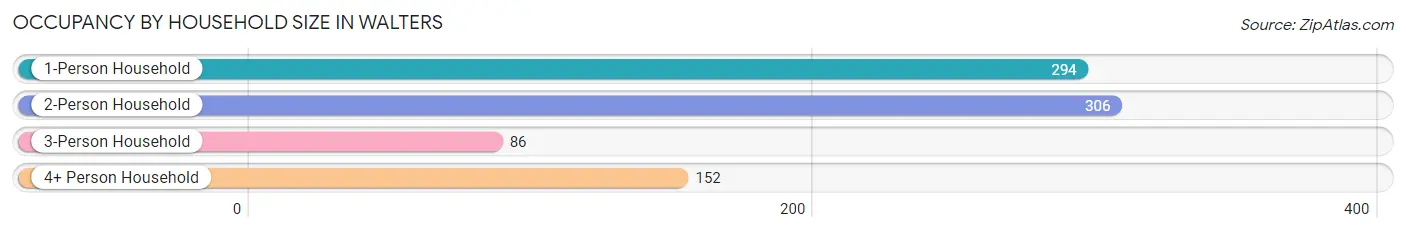
| Household Size | # Housing Units | % Housing Units |
| 1-Person Household | 294 | 35.1% |
| 2-Person Household | 306 | 36.5% |
| 3-Person Household | 86 | 10.3% |
| 4+ Person Household | 152 | 18.1% |
| Total Housing Units | 838 | 100.0% |
Occupancy by Ownership by Household Size in Walters
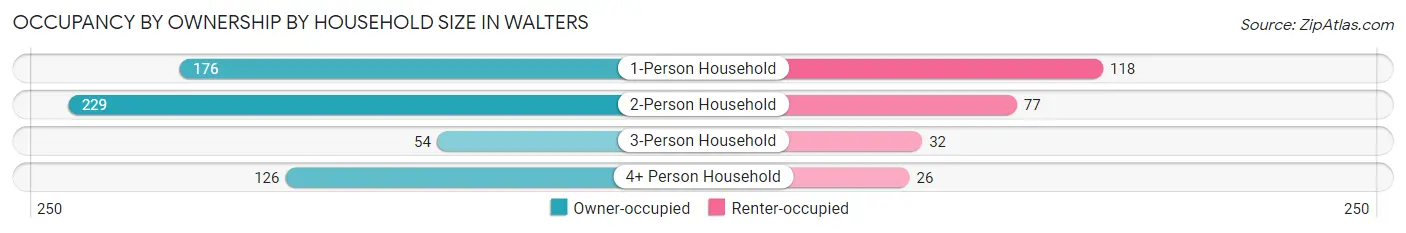
| Household Size | Owner-occupied | Renter-occupied |
| 1-Person Household | 176 (59.9%) | 118 (40.1%) |
| 2-Person Household | 229 (74.8%) | 77 (25.2%) |
| 3-Person Household | 54 (62.8%) | 32 (37.2%) |
| 4+ Person Household | 126 (82.9%) | 26 (17.1%) |
| Total Housing Units | 585 (69.8%) | 253 (30.2%) |
Occupancy by Educational Attainment in Walters
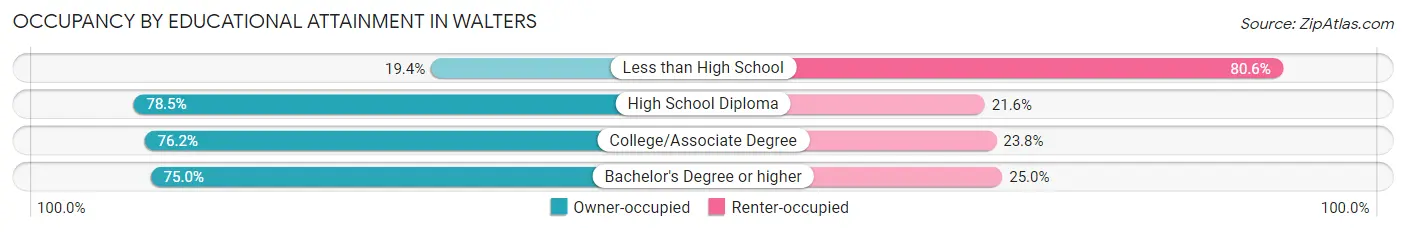
| Household Size | Owner-occupied | Renter-occupied |
| Less than High School | 20 (19.4%) | 83 (80.6%) |
| High School Diploma | 233 (78.4%) | 64 (21.5%) |
| College/Associate Degree | 224 (76.2%) | 70 (23.8%) |
| Bachelor's Degree or higher | 108 (75.0%) | 36 (25.0%) |
Occupancy by Age of Householder in Walters
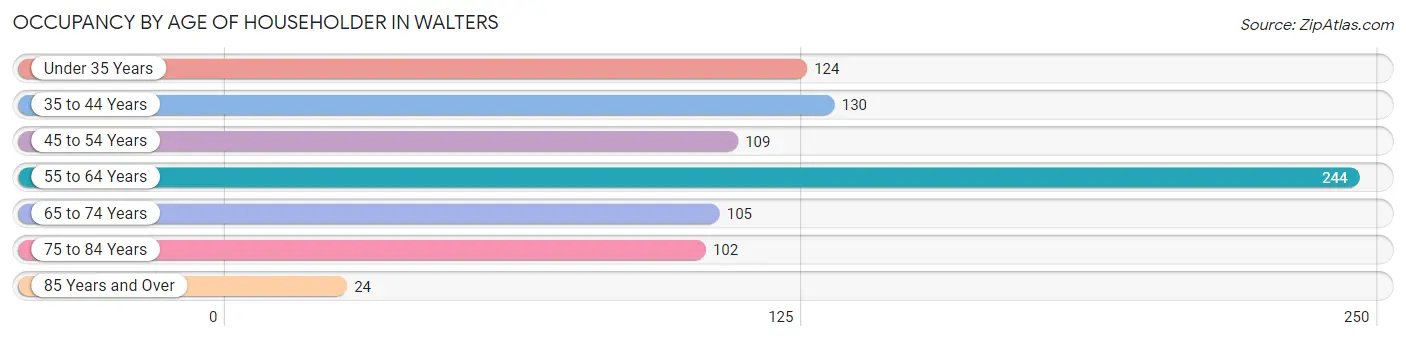
| Age Bracket | # Households | % Households |
| Under 35 Years | 124 | 14.8% |
| 35 to 44 Years | 130 | 15.5% |
| 45 to 54 Years | 109 | 13.0% |
| 55 to 64 Years | 244 | 29.1% |
| 65 to 74 Years | 105 | 12.5% |
| 75 to 84 Years | 102 | 12.2% |
| 85 Years and Over | 24 | 2.9% |
| Total | 838 | 100.0% |
Housing Finances in Walters
Median Income by Occupancy in Walters
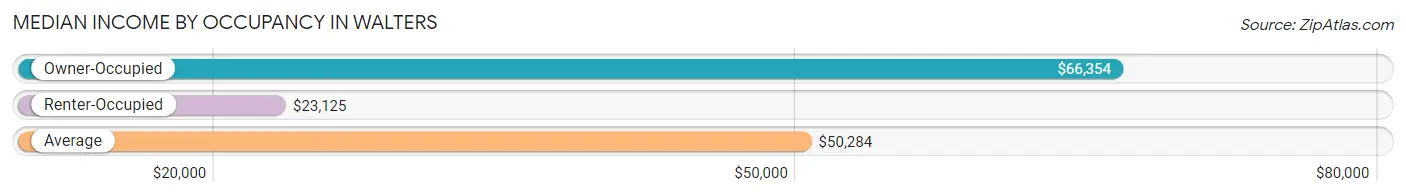
| Occupancy Type | # Households | Median Income |
| Owner-Occupied | 585 (69.8%) | $66,354 |
| Renter-Occupied | 253 (30.2%) | $23,125 |
| Average | 838 (100.0%) | $50,284 |
Occupancy by Householder Income Bracket in Walters
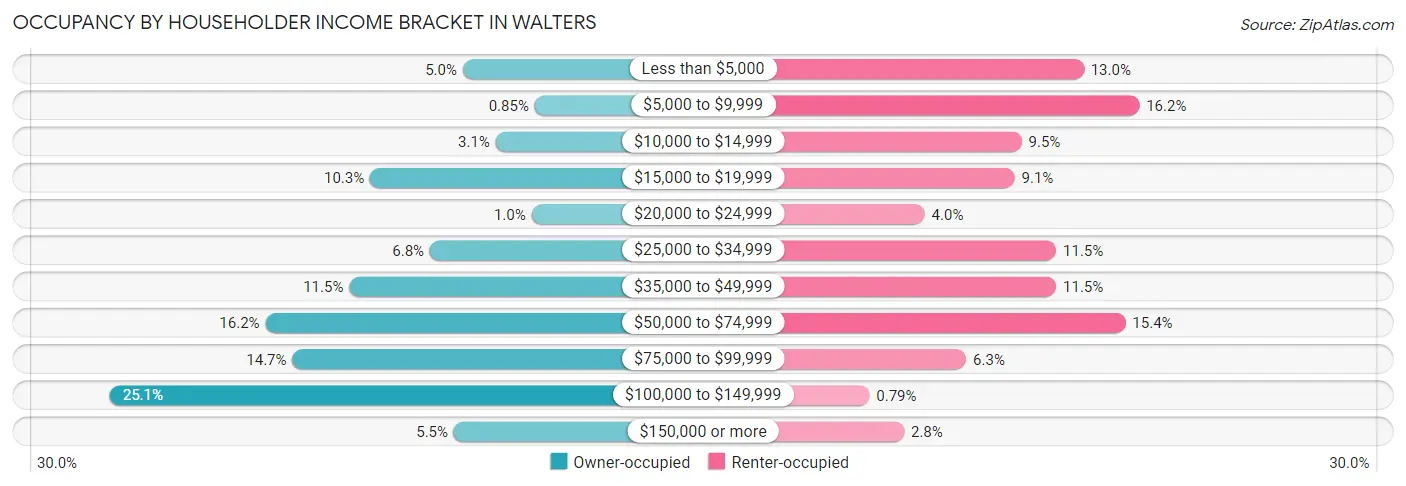
| Income Bracket | Owner-occupied | Renter-occupied |
| Less than $5,000 | 29 (5.0%) | 33 (13.0%) |
| $5,000 to $9,999 | 5 (0.9%) | 41 (16.2%) |
| $10,000 to $14,999 | 18 (3.1%) | 24 (9.5%) |
| $15,000 to $19,999 | 60 (10.3%) | 23 (9.1%) |
| $20,000 to $24,999 | 6 (1.0%) | 10 (4.0%) |
| $25,000 to $34,999 | 40 (6.8%) | 29 (11.5%) |
| $35,000 to $49,999 | 67 (11.5%) | 29 (11.5%) |
| $50,000 to $74,999 | 95 (16.2%) | 39 (15.4%) |
| $75,000 to $99,999 | 86 (14.7%) | 16 (6.3%) |
| $100,000 to $149,999 | 147 (25.1%) | 2 (0.8%) |
| $150,000 or more | 32 (5.5%) | 7 (2.8%) |
| Total | 585 (100.0%) | 253 (100.0%) |
Monthly Housing Cost Tiers in Walters
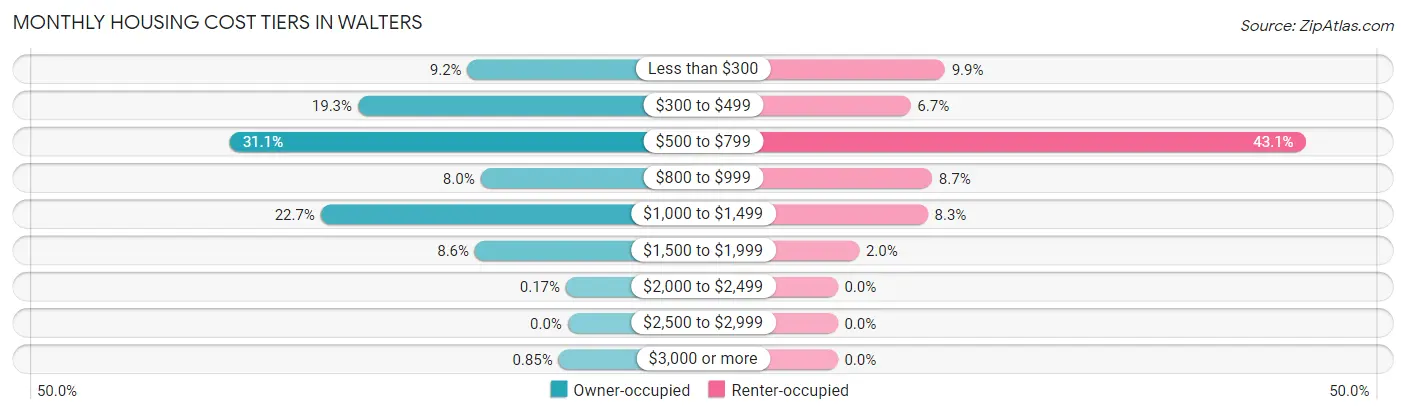
| Monthly Cost | Owner-occupied | Renter-occupied |
| Less than $300 | 54 (9.2%) | 25 (9.9%) |
| $300 to $499 | 113 (19.3%) | 17 (6.7%) |
| $500 to $799 | 182 (31.1%) | 109 (43.1%) |
| $800 to $999 | 47 (8.0%) | 22 (8.7%) |
| $1,000 to $1,499 | 133 (22.7%) | 21 (8.3%) |
| $1,500 to $1,999 | 50 (8.6%) | 5 (2.0%) |
| $2,000 to $2,499 | 1 (0.2%) | 0 (0.0%) |
| $2,500 to $2,999 | 0 (0.0%) | 0 (0.0%) |
| $3,000 or more | 5 (0.9%) | 0 (0.0%) |
| Total | 585 (100.0%) | 253 (100.0%) |
Physical Housing Characteristics in Walters
Housing Structures in Walters
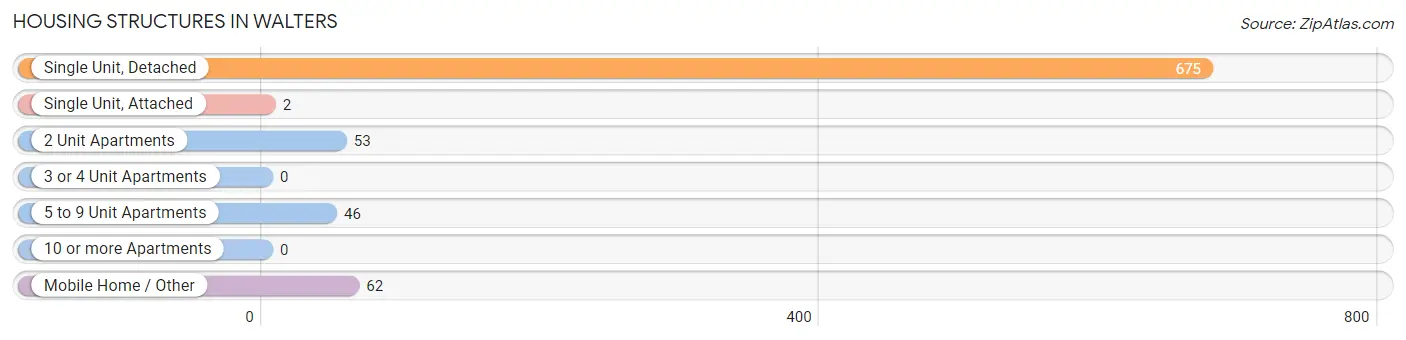
| Structure Type | # Housing Units | % Housing Units |
| Single Unit, Detached | 675 | 80.5% |
| Single Unit, Attached | 2 | 0.2% |
| 2 Unit Apartments | 53 | 6.3% |
| 3 or 4 Unit Apartments | 0 | 0.0% |
| 5 to 9 Unit Apartments | 46 | 5.5% |
| 10 or more Apartments | 0 | 0.0% |
| Mobile Home / Other | 62 | 7.4% |
| Total | 838 | 100.0% |
Housing Structures by Occupancy in Walters
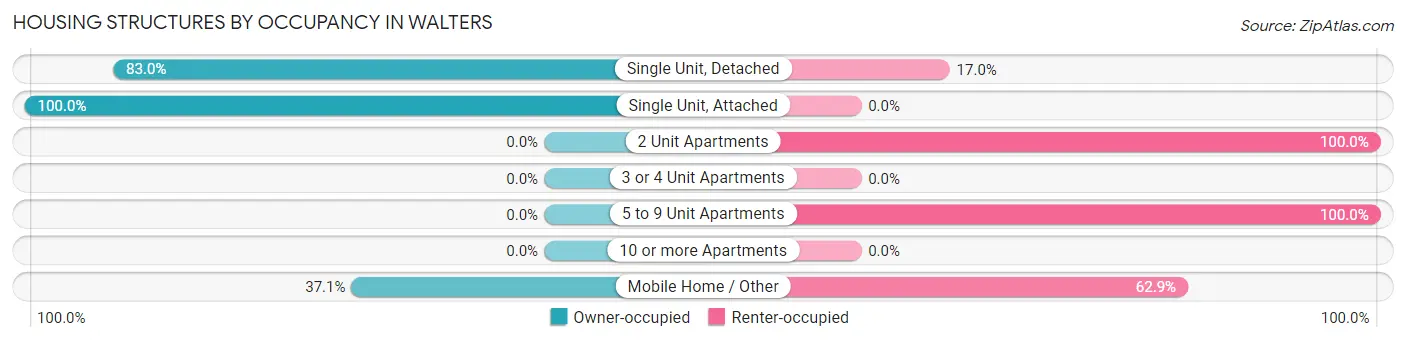
| Structure Type | Owner-occupied | Renter-occupied |
| Single Unit, Detached | 560 (83.0%) | 115 (17.0%) |
| Single Unit, Attached | 2 (100.0%) | 0 (0.0%) |
| 2 Unit Apartments | 0 (0.0%) | 53 (100.0%) |
| 3 or 4 Unit Apartments | 0 (0.0%) | 0 (0.0%) |
| 5 to 9 Unit Apartments | 0 (0.0%) | 46 (100.0%) |
| 10 or more Apartments | 0 (0.0%) | 0 (0.0%) |
| Mobile Home / Other | 23 (37.1%) | 39 (62.9%) |
| Total | 585 (69.8%) | 253 (30.2%) |
Housing Structures by Number of Rooms in Walters
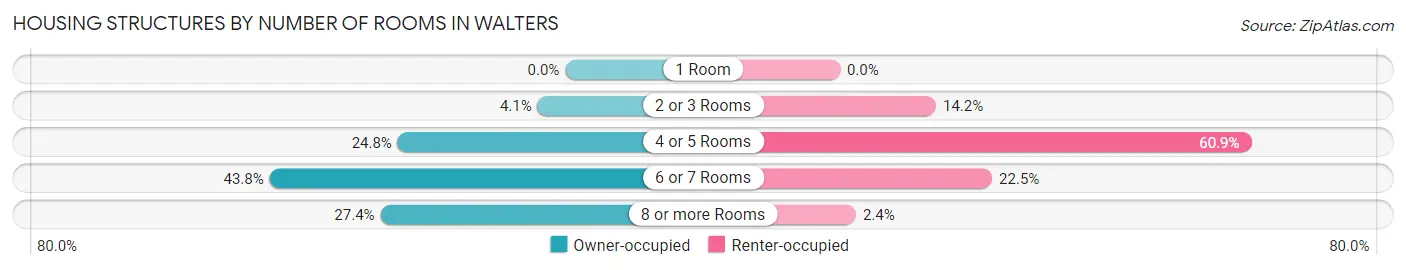
| Number of Rooms | Owner-occupied | Renter-occupied |
| 1 Room | 0 (0.0%) | 0 (0.0%) |
| 2 or 3 Rooms | 24 (4.1%) | 36 (14.2%) |
| 4 or 5 Rooms | 145 (24.8%) | 154 (60.9%) |
| 6 or 7 Rooms | 256 (43.8%) | 57 (22.5%) |
| 8 or more Rooms | 160 (27.4%) | 6 (2.4%) |
| Total | 585 (100.0%) | 253 (100.0%) |
Housing Structure by Heating Type in Walters
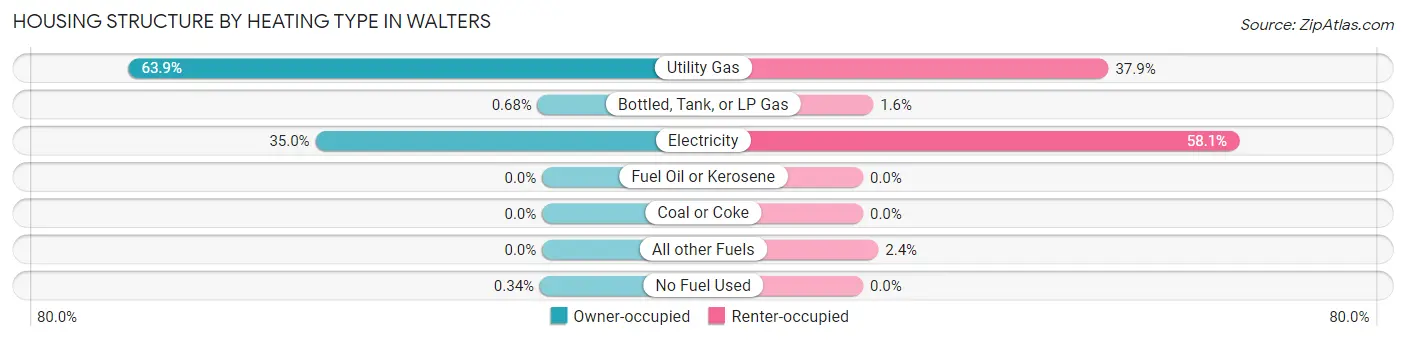
| Heating Type | Owner-occupied | Renter-occupied |
| Utility Gas | 374 (63.9%) | 96 (37.9%) |
| Bottled, Tank, or LP Gas | 4 (0.7%) | 4 (1.6%) |
| Electricity | 205 (35.0%) | 147 (58.1%) |
| Fuel Oil or Kerosene | 0 (0.0%) | 0 (0.0%) |
| Coal or Coke | 0 (0.0%) | 0 (0.0%) |
| All other Fuels | 0 (0.0%) | 6 (2.4%) |
| No Fuel Used | 2 (0.3%) | 0 (0.0%) |
| Total | 585 (100.0%) | 253 (100.0%) |
Household Vehicle Usage in Walters
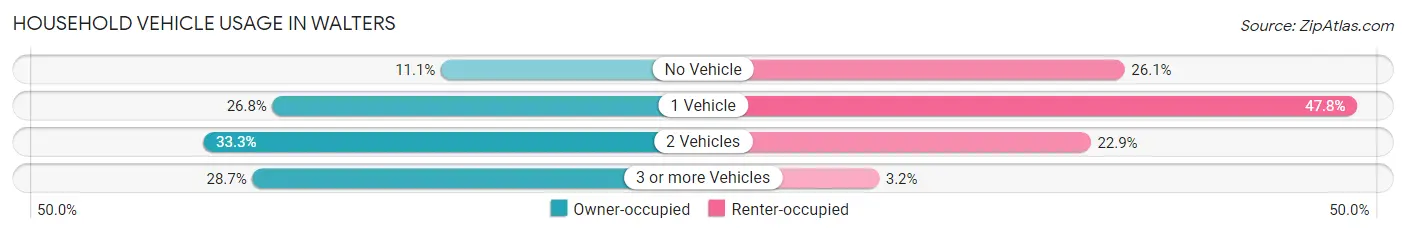
| Vehicles per Household | Owner-occupied | Renter-occupied |
| No Vehicle | 65 (11.1%) | 66 (26.1%) |
| 1 Vehicle | 157 (26.8%) | 121 (47.8%) |
| 2 Vehicles | 195 (33.3%) | 58 (22.9%) |
| 3 or more Vehicles | 168 (28.7%) | 8 (3.2%) |
| Total | 585 (100.0%) | 253 (100.0%) |
Real Estate & Mortgages in Walters
Real Estate and Mortgage Overview in Walters
| Characteristic | Without Mortgage | With Mortgage |
| Housing Units | 298 | 287 |
| Median Property Value | $94,300 | $116,900 |
| Median Household Income | $44,583 | $7 |
| Monthly Housing Costs | $440 | $0 |
| Real Estate Taxes | $621 | $30 |
Property Value by Mortgage Status in Walters
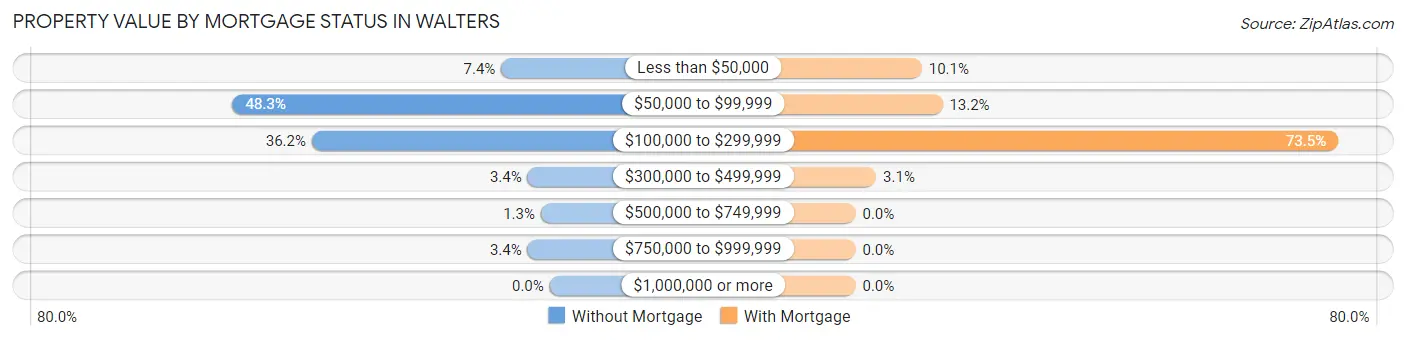
| Property Value | Without Mortgage | With Mortgage |
| Less than $50,000 | 22 (7.4%) | 29 (10.1%) |
| $50,000 to $99,999 | 144 (48.3%) | 38 (13.2%) |
| $100,000 to $299,999 | 108 (36.2%) | 211 (73.5%) |
| $300,000 to $499,999 | 10 (3.4%) | 9 (3.1%) |
| $500,000 to $749,999 | 4 (1.3%) | 0 (0.0%) |
| $750,000 to $999,999 | 10 (3.4%) | 0 (0.0%) |
| $1,000,000 or more | 0 (0.0%) | 0 (0.0%) |
| Total | 298 (100.0%) | 287 (100.0%) |
Household Income by Mortgage Status in Walters
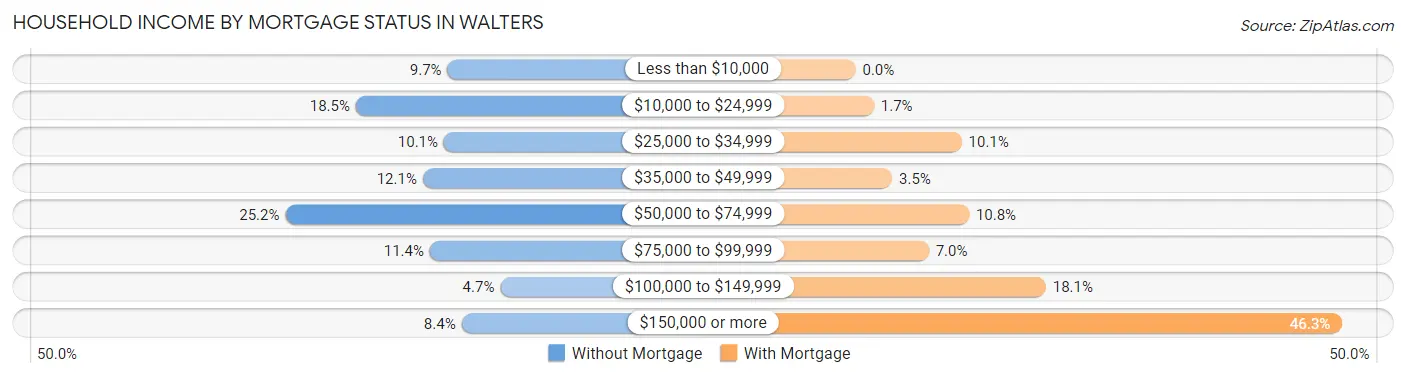
| Household Income | Without Mortgage | With Mortgage |
| Less than $10,000 | 29 (9.7%) | 0 (0.0%) |
| $10,000 to $24,999 | 55 (18.5%) | 5 (1.7%) |
| $25,000 to $34,999 | 30 (10.1%) | 29 (10.1%) |
| $35,000 to $49,999 | 36 (12.1%) | 10 (3.5%) |
| $50,000 to $74,999 | 75 (25.2%) | 31 (10.8%) |
| $75,000 to $99,999 | 34 (11.4%) | 20 (7.0%) |
| $100,000 to $149,999 | 14 (4.7%) | 52 (18.1%) |
| $150,000 or more | 25 (8.4%) | 133 (46.3%) |
| Total | 298 (100.0%) | 287 (100.0%) |
Property Value to Household Income Ratio in Walters
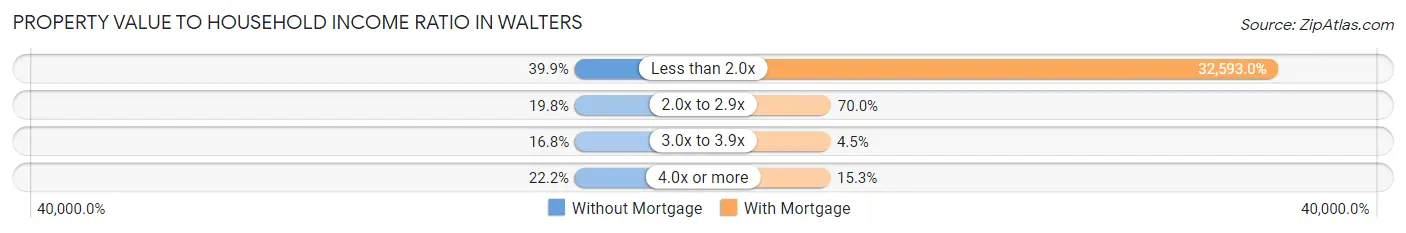
| Value-to-Income Ratio | Without Mortgage | With Mortgage |
| Less than 2.0x | 119 (39.9%) | 93,542 (32,593.0%) |
| 2.0x to 2.9x | 59 (19.8%) | 201 (70.0%) |
| 3.0x to 3.9x | 50 (16.8%) | 13 (4.5%) |
| 4.0x or more | 66 (22.2%) | 44 (15.3%) |
| Total | 298 (100.0%) | 287 (100.0%) |
Real Estate Taxes by Mortgage Status in Walters
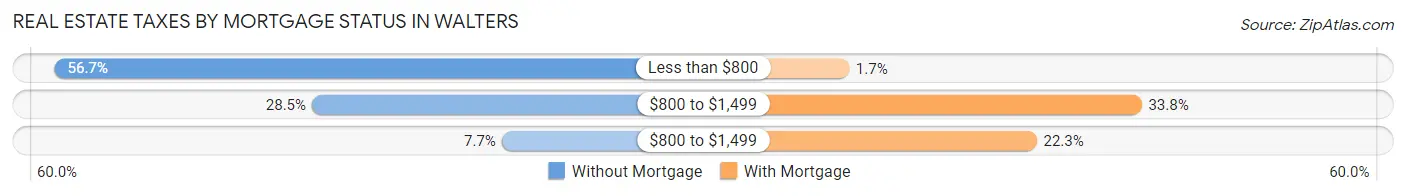
| Property Taxes | Without Mortgage | With Mortgage |
| Less than $800 | 169 (56.7%) | 5 (1.7%) |
| $800 to $1,499 | 85 (28.5%) | 97 (33.8%) |
| $800 to $1,499 | 23 (7.7%) | 64 (22.3%) |
| Total | 298 (100.0%) | 287 (100.0%) |
Health & Disability in Walters
Health Insurance Coverage by Age in Walters
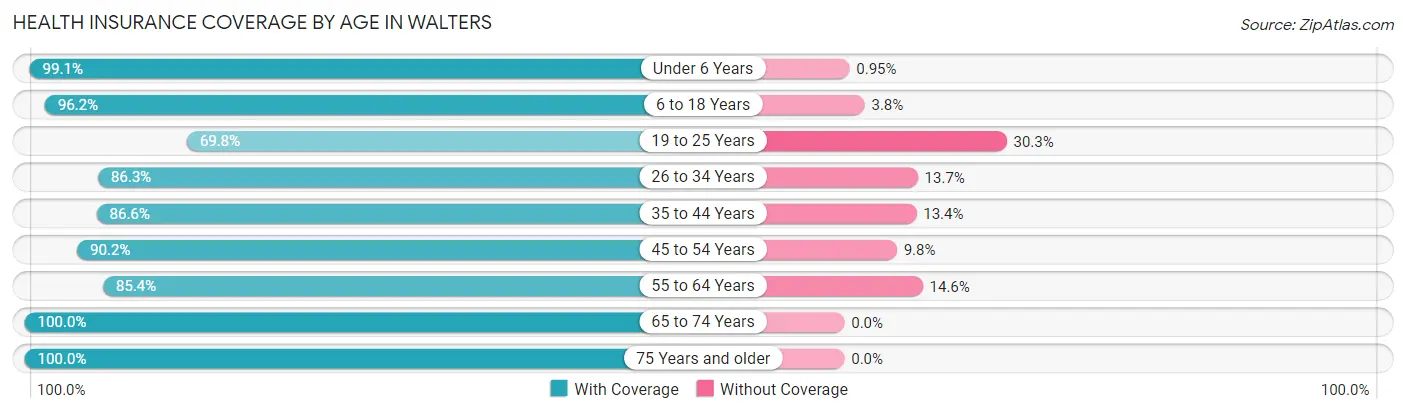
| Age Bracket | With Coverage | Without Coverage |
| Under 6 Years | 209 (99.1%) | 2 (0.9%) |
| 6 to 18 Years | 357 (96.2%) | 14 (3.8%) |
| 19 to 25 Years | 113 (69.8%) | 49 (30.2%) |
| 26 to 34 Years | 183 (86.3%) | 29 (13.7%) |
| 35 to 44 Years | 232 (86.6%) | 36 (13.4%) |
| 45 to 54 Years | 203 (90.2%) | 22 (9.8%) |
| 55 to 64 Years | 345 (85.4%) | 59 (14.6%) |
| 65 to 74 Years | 195 (100.0%) | 0 (0.0%) |
| 75 Years and older | 155 (100.0%) | 0 (0.0%) |
| Total | 1,992 (90.4%) | 211 (9.6%) |
Health Insurance Coverage by Citizenship Status in Walters
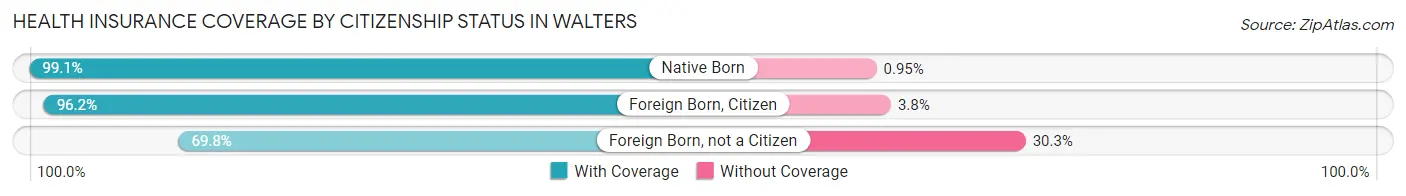
| Citizenship Status | With Coverage | Without Coverage |
| Native Born | 209 (99.1%) | 2 (0.9%) |
| Foreign Born, Citizen | 357 (96.2%) | 14 (3.8%) |
| Foreign Born, not a Citizen | 113 (69.8%) | 49 (30.2%) |
Health Insurance Coverage by Household Income in Walters
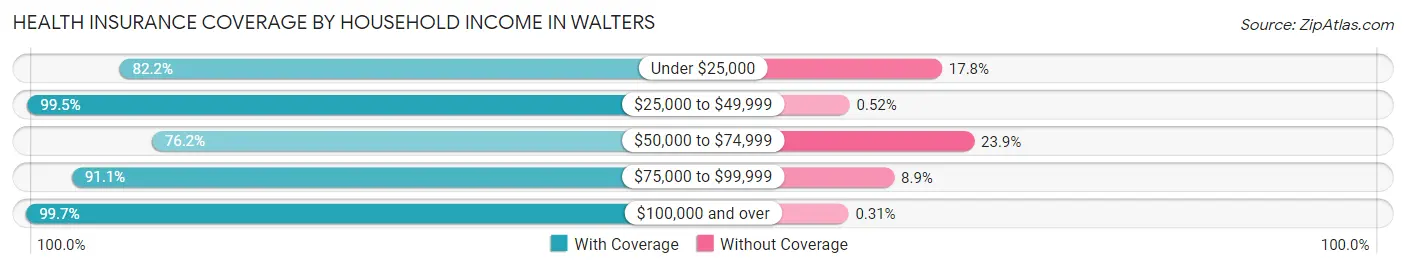
| Household Income | With Coverage | Without Coverage |
| Under $25,000 | 457 (82.2%) | 99 (17.8%) |
| $25,000 to $49,999 | 380 (99.5%) | 2 (0.5%) |
| $50,000 to $74,999 | 265 (76.1%) | 83 (23.8%) |
| $75,000 to $99,999 | 257 (91.1%) | 25 (8.9%) |
| $100,000 and over | 633 (99.7%) | 2 (0.3%) |
Public vs Private Health Insurance Coverage by Age in Walters
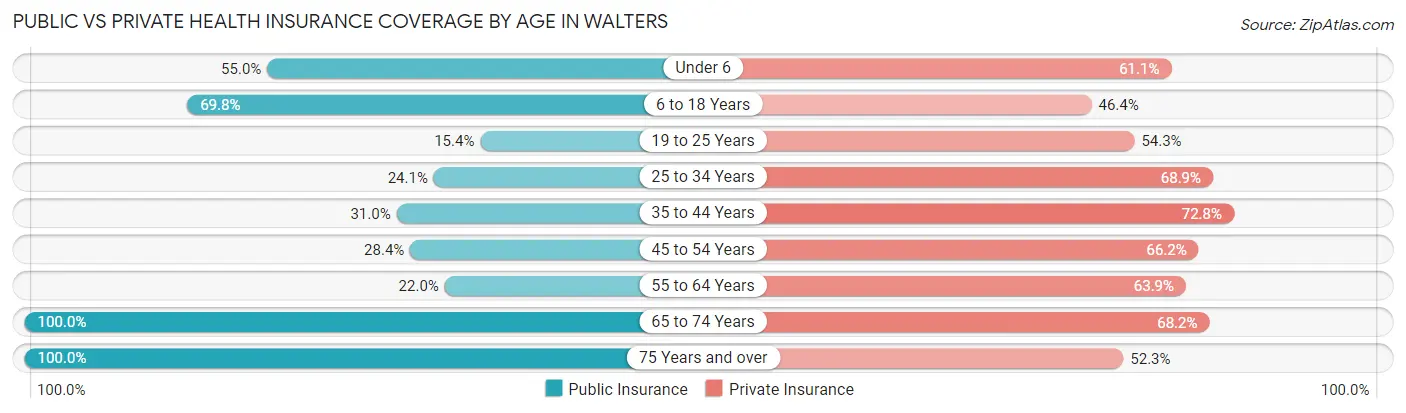
| Age Bracket | Public Insurance | Private Insurance |
| Under 6 | 116 (55.0%) | 129 (61.1%) |
| 6 to 18 Years | 259 (69.8%) | 172 (46.4%) |
| 19 to 25 Years | 25 (15.4%) | 88 (54.3%) |
| 25 to 34 Years | 51 (24.1%) | 146 (68.9%) |
| 35 to 44 Years | 83 (31.0%) | 195 (72.8%) |
| 45 to 54 Years | 64 (28.4%) | 149 (66.2%) |
| 55 to 64 Years | 89 (22.0%) | 258 (63.9%) |
| 65 to 74 Years | 195 (100.0%) | 133 (68.2%) |
| 75 Years and over | 155 (100.0%) | 81 (52.3%) |
| Total | 1,037 (47.1%) | 1,351 (61.3%) |
Disability Status by Sex by Age in Walters
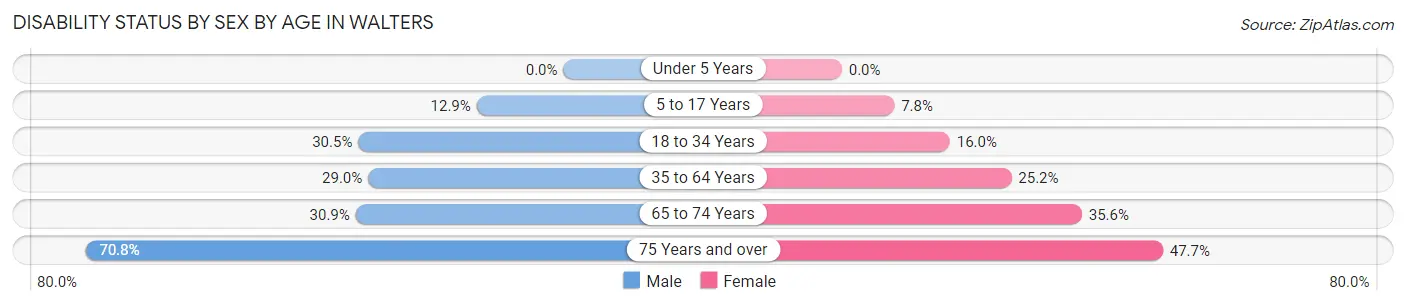
| Age Bracket | Male | Female |
| Under 5 Years | 0 (0.0%) | 0 (0.0%) |
| 5 to 17 Years | 30 (12.9%) | 14 (7.8%) |
| 18 to 34 Years | 60 (30.5%) | 30 (16.0%) |
| 35 to 64 Years | 100 (29.0%) | 139 (25.2%) |
| 65 to 74 Years | 29 (30.8%) | 36 (35.6%) |
| 75 Years and over | 34 (70.8%) | 51 (47.7%) |
Disability Class by Sex by Age in Walters
Disability Class: Hearing Difficulty
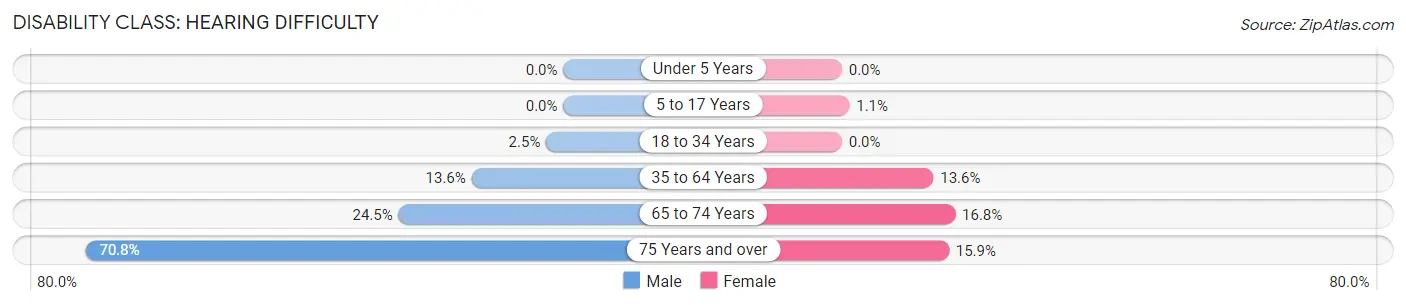
| Age Bracket | Male | Female |
| Under 5 Years | 0 (0.0%) | 0 (0.0%) |
| 5 to 17 Years | 0 (0.0%) | 2 (1.1%) |
| 18 to 34 Years | 5 (2.5%) | 0 (0.0%) |
| 35 to 64 Years | 47 (13.6%) | 75 (13.6%) |
| 65 to 74 Years | 23 (24.5%) | 17 (16.8%) |
| 75 Years and over | 34 (70.8%) | 17 (15.9%) |
Disability Class: Vision Difficulty
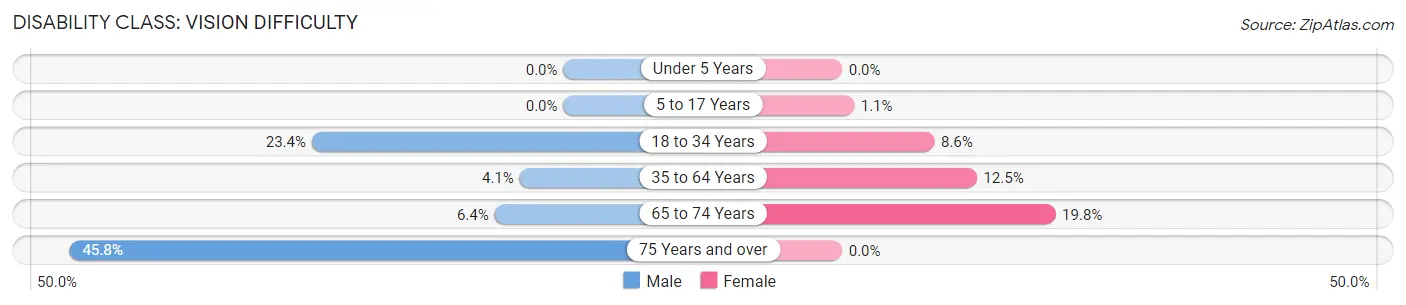
| Age Bracket | Male | Female |
| Under 5 Years | 0 (0.0%) | 0 (0.0%) |
| 5 to 17 Years | 0 (0.0%) | 2 (1.1%) |
| 18 to 34 Years | 46 (23.4%) | 16 (8.6%) |
| 35 to 64 Years | 14 (4.1%) | 69 (12.5%) |
| 65 to 74 Years | 6 (6.4%) | 20 (19.8%) |
| 75 Years and over | 22 (45.8%) | 0 (0.0%) |
Disability Class: Cognitive Difficulty
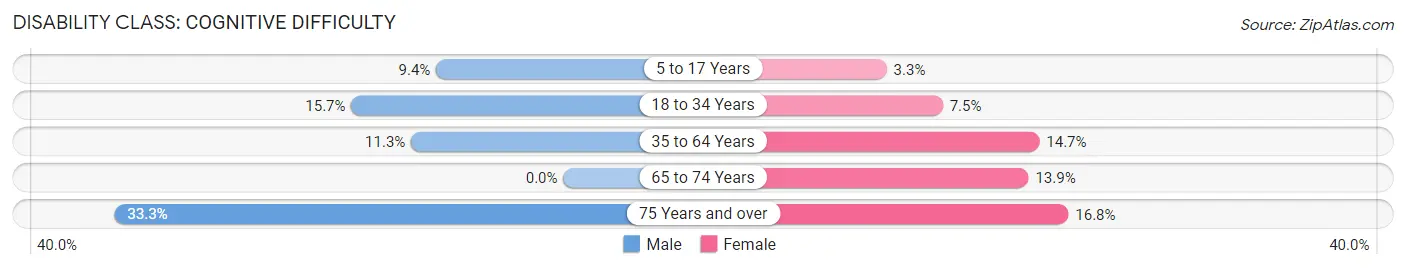
| Age Bracket | Male | Female |
| 5 to 17 Years | 22 (9.4%) | 6 (3.3%) |
| 18 to 34 Years | 31 (15.7%) | 14 (7.5%) |
| 35 to 64 Years | 39 (11.3%) | 81 (14.7%) |
| 65 to 74 Years | 0 (0.0%) | 14 (13.9%) |
| 75 Years and over | 16 (33.3%) | 18 (16.8%) |
Disability Class: Ambulatory Difficulty
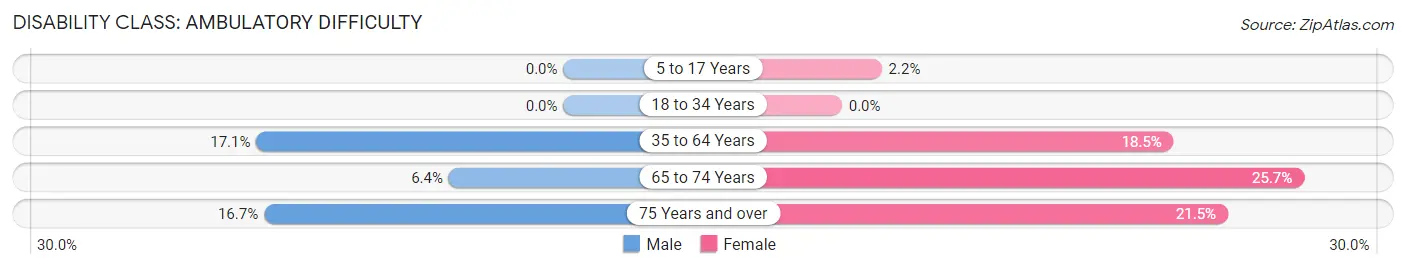
| Age Bracket | Male | Female |
| 5 to 17 Years | 0 (0.0%) | 4 (2.2%) |
| 18 to 34 Years | 0 (0.0%) | 0 (0.0%) |
| 35 to 64 Years | 59 (17.1%) | 102 (18.5%) |
| 65 to 74 Years | 6 (6.4%) | 26 (25.7%) |
| 75 Years and over | 8 (16.7%) | 23 (21.5%) |
Disability Class: Self-Care Difficulty
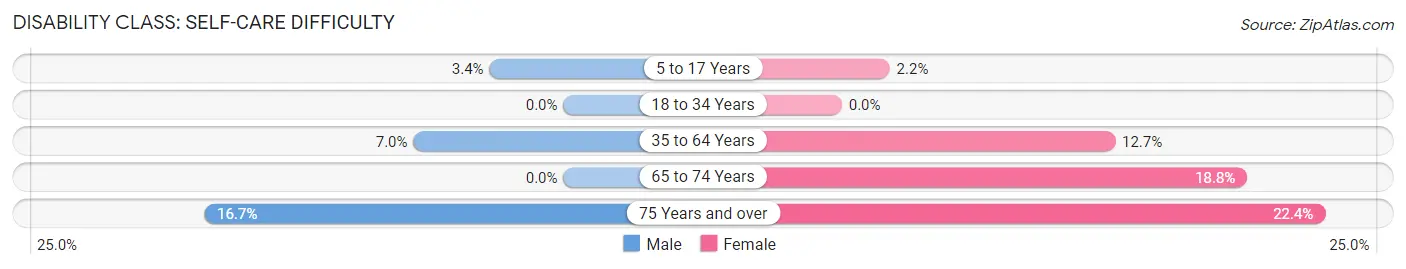
| Age Bracket | Male | Female |
| 5 to 17 Years | 8 (3.4%) | 4 (2.2%) |
| 18 to 34 Years | 0 (0.0%) | 0 (0.0%) |
| 35 to 64 Years | 24 (7.0%) | 70 (12.7%) |
| 65 to 74 Years | 0 (0.0%) | 19 (18.8%) |
| 75 Years and over | 8 (16.7%) | 24 (22.4%) |
Technology Access in Walters
Computing Device Access in Walters
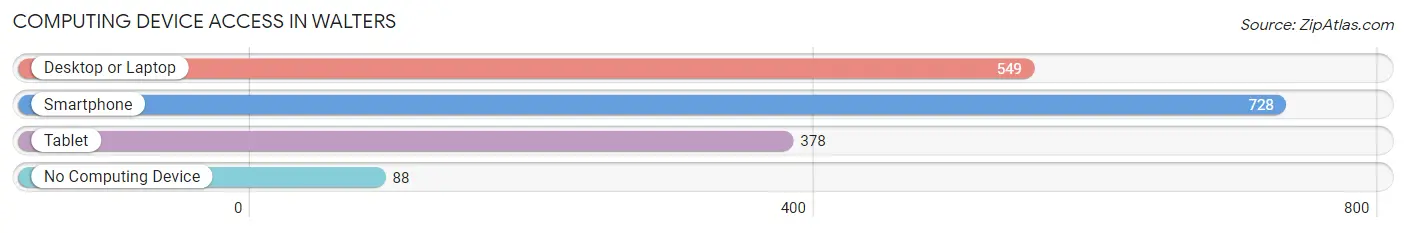
| Device Type | # Households | % Households |
| Desktop or Laptop | 549 | 65.5% |
| Smartphone | 728 | 86.9% |
| Tablet | 378 | 45.1% |
| No Computing Device | 88 | 10.5% |
| Total | 838 | 100.0% |
Internet Access in Walters
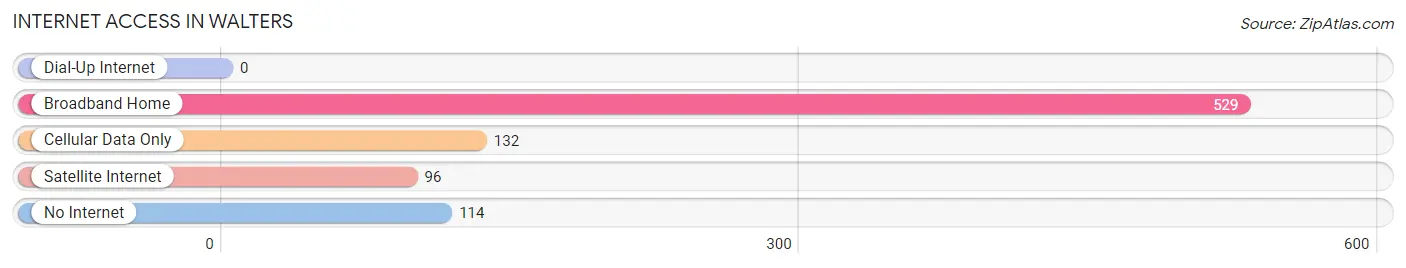
| Internet Type | # Households | % Households |
| Dial-Up Internet | 0 | 0.0% |
| Broadband Home | 529 | 63.1% |
| Cellular Data Only | 132 | 15.8% |
| Satellite Internet | 96 | 11.5% |
| No Internet | 114 | 13.6% |
| Total | 838 | 100.0% |
Walters Summary
Walters is a city located in Cotton County, Oklahoma. It is situated in the southwestern part of the state, approximately 80 miles northwest of Oklahoma City. The city was founded in 1901 and has a population of 2,845 as of the 2010 census.
History
Walters was founded in 1901 by the Walters brothers, who were looking to establish a trading post in the area. The town was named after the brothers and was incorporated in 1907. The town grew quickly, and by 1910, it had a population of over 500.
The town was a major stop on the Rock Island Railroad, and it was also a major center for cotton production. The town was also home to a number of businesses, including a bank, a hotel, a newspaper, and a movie theater.
In the 1920s, the town experienced a period of growth and prosperity. The population increased to over 1,000, and the town was home to a number of businesses, including a cotton gin, a flour mill, and a cottonseed oil mill.
The Great Depression hit Walters hard, and the population declined to just over 500 by 1940. The town experienced a resurgence in the 1950s, and the population increased to over 1,000 again.
Geography
Walters is located in southwestern Oklahoma, approximately 80 miles northwest of Oklahoma City. The city is situated in the Red River Valley, and it is surrounded by rolling hills and prairies. The city is located at the intersection of U.S. Highway 62 and State Highway 5.
The climate in Walters is characterized by hot, humid summers and mild winters. The average annual temperature is around 65 degrees Fahrenheit, and the average annual precipitation is around 35 inches.
Economy
The economy of Walters is largely based on agriculture. The town is home to a number of farms, and the surrounding area is known for its production of cotton, wheat, and other crops.
The town is also home to a number of businesses, including a bank, a hotel, a newspaper, and a movie theater. The town is also home to a number of manufacturing companies, including a cotton gin, a flour mill, and a cottonseed oil mill.
Demographics
As of the 2010 census, the population of Walters was 2,845. The racial makeup of the town was 79.3% White, 15.2% Native American, 0.7% Asian, 0.2% African American, and 4.6% from other races.
The median household income in Walters was $31,250, and the median family income was $37,500. The per capita income was $15,945. The town had a poverty rate of 22.3%.
Conclusion
Walters is a small city located in Cotton County, Oklahoma. It was founded in 1901 and has a population of 2,845 as of the 2010 census. The town is largely based on agriculture, and it is home to a number of businesses, including a bank, a hotel, a newspaper, and a movie theater. The town also has a number of manufacturing companies, including a cotton gin, a flour mill, and a cottonseed oil mill. The median household income in Walters was $31,250, and the median family income was $37,500. The per capita income was $15,945. The town had a poverty rate of 22.3%.
Common Questions
What is Per Capita Income in Walters?
Per Capita income in Walters is $25,175.
What is the Median Family Income in Walters?
Median Family Income in Walters is $77,639.
What is the Median Household income in Walters?
Median Household Income in Walters is $50,284.
What is Income or Wage Gap in Walters?
Income or Wage Gap in Walters is 4.1%.
Women in Walters earn 95.9 cents for every dollar earned by a man.
What is Family Income Deficit in Walters?
Family Income Deficit in Walters is $11,094.
Families that are below poverty line in Walters earn $11,094 less on average than the poverty threshold level.
What is Inequality or Gini Index in Walters?
Inequality or Gini Index in Walters is 0.45.
What is the Total Population of Walters?
Total Population of Walters is 2,281.
What is the Total Male Population of Walters?
Total Male Population of Walters is 1,081.
What is the Total Female Population of Walters?
Total Female Population of Walters is 1,200.
What is the Ratio of Males per 100 Females in Walters?
There are 90.08 Males per 100 Females in Walters.
What is the Ratio of Females per 100 Males in Walters?
There are 111.01 Females per 100 Males in Walters.
What is the Median Population Age in Walters?
Median Population Age in Walters is 40.5 Years.
What is the Average Family Size in Walters
Average Family Size in Walters is 3.4 People.
What is the Average Household Size in Walters
Average Household Size in Walters is 2.6 People.
How Large is the Labor Force in Walters?
There are 1,003 People in the Labor Forcein in Walters.
What is the Percentage of People in the Labor Force in Walters?
56.1% of People are in the Labor Force in Walters.
What is the Unemployment Rate in Walters?
Unemployment Rate in Walters is 2.3%.