Avant, OK Map & Demographics
Avant Map
Avant Overview
$19,437
PER CAPITA INCOME
$49,000
AVG FAMILY INCOME
$48,250
AVG HOUSEHOLD INCOME
48.4%
WAGE / INCOME GAP [ % ]
51.6¢/ $1
WAGE / INCOME GAP [ $ ]
0.32
INEQUALITY / GINI INDEX
239
TOTAL POPULATION
126
MALE POPULATION
113
FEMALE POPULATION
111.50
MALES / 100 FEMALES
89.68
FEMALES / 100 MALES
35.8
MEDIAN AGE
3.3
AVG FAMILY SIZE
2.7
AVG HOUSEHOLD SIZE
94
LABOR FORCE [ PEOPLE ]
52.2%
PERCENT IN LABOR FORCE
2.1%
UNEMPLOYMENT RATE
Avant Zip Codes
Avant Area Codes
Income in Avant
Income Overview in Avant
Per Capita Income in Avant is $19,437, while median incomes of families and households are $49,000 and $48,250 respectively.
| Characteristic | Number | Measure |
| Per Capita Income | 239 | $19,437 |
| Median Family Income | 62 | $49,000 |
| Mean Family Income | 62 | $54,553 |
| Median Household Income | 89 | $48,250 |
| Mean Household Income | 89 | $49,352 |
| Income Deficit | 62 | $0 |
| Wage / Income Gap (%) | 239 | 48.37% |
| Wage / Income Gap ($) | 239 | 51.63¢ per $1 |
| Gini / Inequality Index | 239 | 0.32 |
Earnings by Sex in Avant
Average Earnings in Avant are $34,000, $46,000 for men and $23,750 for women, a difference of 48.4%.
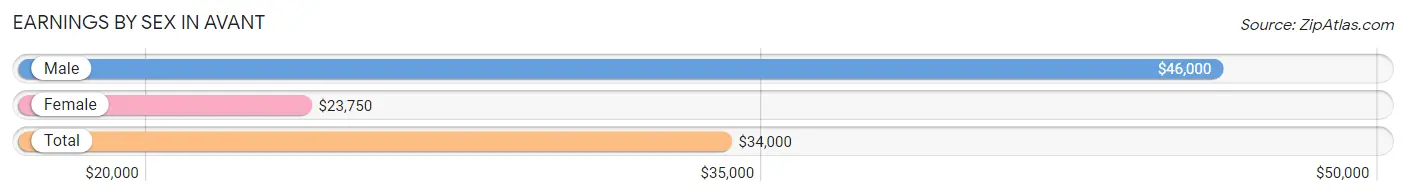
| Sex | Number | Average Earnings |
| Male | 46 (46.9%) | $46,000 |
| Female | 52 (53.1%) | $23,750 |
| Total | 98 (100.0%) | $34,000 |
Earnings by Sex by Income Bracket in Avant
The most common earnings brackets in Avant are $40,000 to $44,999 for men (8 | 17.4%) and $30,000 to $34,999 for women (11 | 21.1%).
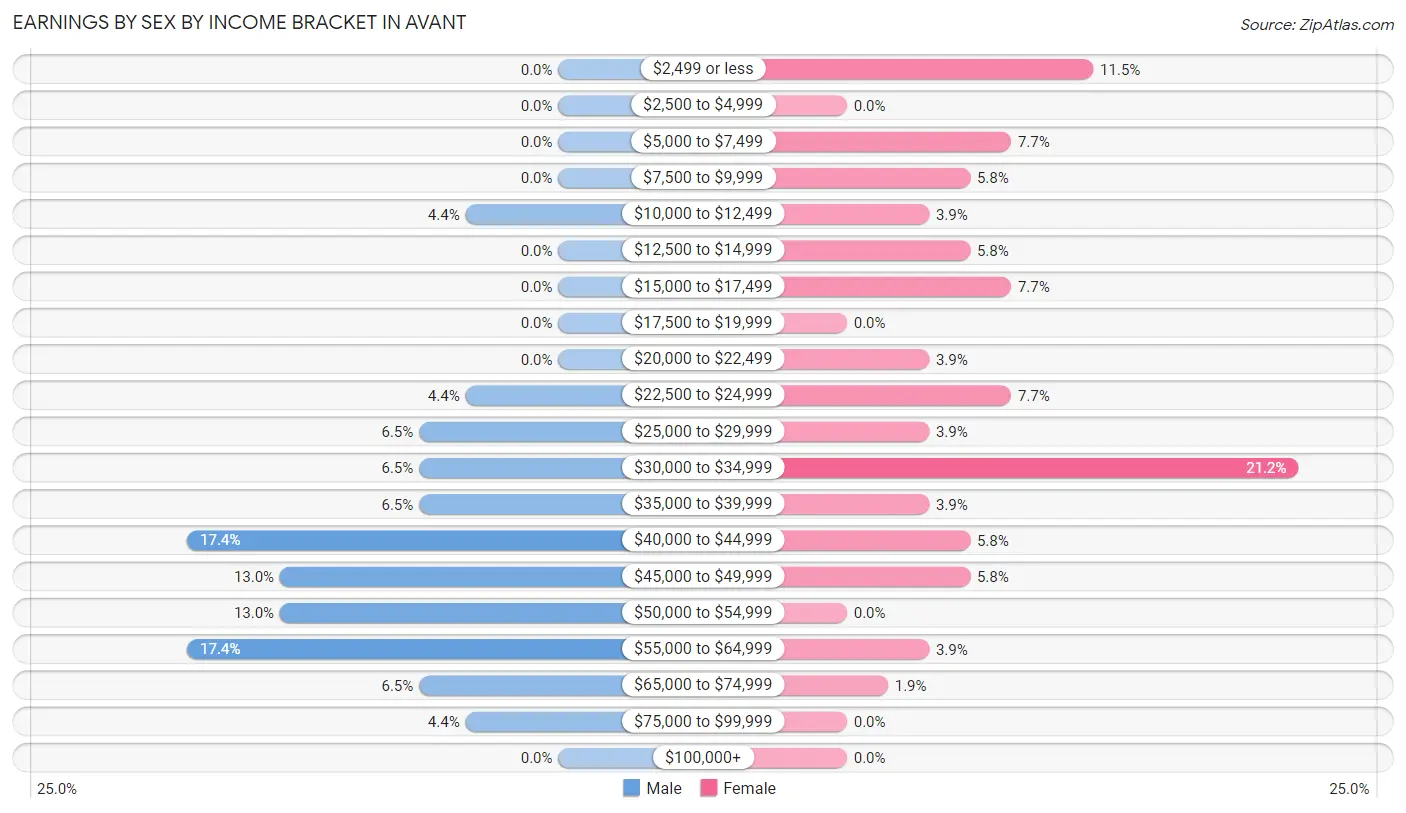
| Income | Male | Female |
| $2,499 or less | 0 (0.0%) | 6 (11.5%) |
| $2,500 to $4,999 | 0 (0.0%) | 0 (0.0%) |
| $5,000 to $7,499 | 0 (0.0%) | 4 (7.7%) |
| $7,500 to $9,999 | 0 (0.0%) | 3 (5.8%) |
| $10,000 to $12,499 | 2 (4.3%) | 2 (3.8%) |
| $12,500 to $14,999 | 0 (0.0%) | 3 (5.8%) |
| $15,000 to $17,499 | 0 (0.0%) | 4 (7.7%) |
| $17,500 to $19,999 | 0 (0.0%) | 0 (0.0%) |
| $20,000 to $22,499 | 0 (0.0%) | 2 (3.8%) |
| $22,500 to $24,999 | 2 (4.3%) | 4 (7.7%) |
| $25,000 to $29,999 | 3 (6.5%) | 2 (3.8%) |
| $30,000 to $34,999 | 3 (6.5%) | 11 (21.1%) |
| $35,000 to $39,999 | 3 (6.5%) | 2 (3.8%) |
| $40,000 to $44,999 | 8 (17.4%) | 3 (5.8%) |
| $45,000 to $49,999 | 6 (13.0%) | 3 (5.8%) |
| $50,000 to $54,999 | 6 (13.0%) | 0 (0.0%) |
| $55,000 to $64,999 | 8 (17.4%) | 2 (3.8%) |
| $65,000 to $74,999 | 3 (6.5%) | 1 (1.9%) |
| $75,000 to $99,999 | 2 (4.3%) | 0 (0.0%) |
| $100,000+ | 0 (0.0%) | 0 (0.0%) |
| Total | 46 (100.0%) | 52 (100.0%) |
Earnings by Sex by Educational Attainment in Avant
Average earnings in Avant are $46,000 for men and $21,250 for women, a difference of 53.8%. Men with an educational attainment of less than high school enjoy the highest average annual earnings of $52,500, while those with college or associate's degree education earn the least with $43,438. Women with an educational attainment of college or associate's degree earn the most with the average annual earnings of $27,500, while those with college or associate's degree education have the smallest earnings of $27,500.
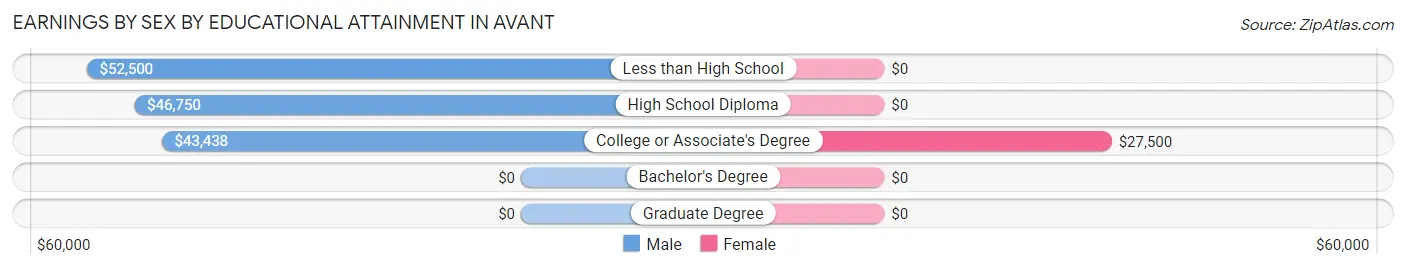
| Educational Attainment | Male Income | Female Income |
| Less than High School | $52,500 | $0 |
| High School Diploma | $46,750 | $0 |
| College or Associate's Degree | $43,438 | $27,500 |
| Bachelor's Degree | - | - |
| Graduate Degree | - | - |
| Total | $46,000 | $21,250 |
Family Income in Avant
Family Income Brackets in Avant
According to the Avant family income data, there are 18 families falling into the $35,000 to $49,999 income range, which is the most common income bracket and makes up 29.0% of all families.
| Income Bracket | # Families | % Families |
| Less than $10,000 | 2 | 3.2% |
| $10,000 to $14,999 | 2 | 3.2% |
| $15,000 to $24,999 | 4 | 6.5% |
| $25,000 to $34,999 | 7 | 11.3% |
| $35,000 to $49,999 | 18 | 29.0% |
| $50,000 to $74,999 | 14 | 22.6% |
| $75,000 to $99,999 | 10 | 16.1% |
| $100,000 to $149,999 | 5 | 8.1% |
| $150,000 to $199,999 | 0 | 0.0% |
| $200,000+ | 0 | 0.0% |
Family Income by Famaliy Size in Avant
4-person families (8 | 12.9%) account for the highest median family income in Avant with $63,750 per family, while 2-person families (25 | 40.3%) have the highest median income of $20,625 per family member.
| Income Bracket | # Families | Median Income |
| 2-Person Families | 25 (40.3%) | $41,250 |
| 3-Person Families | 20 (32.3%) | $56,875 |
| 4-Person Families | 8 (12.9%) | $63,750 |
| 5-Person Families | 3 (4.8%) | $0 |
| 6-Person Families | 2 (3.2%) | $0 |
| 7+ Person Families | 4 (6.5%) | $0 |
| Total | 62 (100.0%) | $49,000 |
Family Income by Number of Earners in Avant
| Number of Earners | # Families | Median Income |
| No Earners | 16 (25.8%) | $35,000 |
| 1 Earner | 16 (25.8%) | $43,750 |
| 2 Earners | 29 (46.8%) | $64,583 |
| 3+ Earners | 1 (1.6%) | $0 |
| Total | 62 (100.0%) | $49,000 |
Household Income in Avant
Household Income Brackets in Avant
With 26 households falling in the category, the $50,000 to $74,999 income range is the most frequent in Avant, accounting for 29.2% of all households.
| Income Bracket | # Households | % Households |
| Less than $10,000 | 4 | 4.5% |
| $10,000 to $14,999 | 7 | 7.9% |
| $15,000 to $24,999 | 6 | 6.7% |
| $25,000 to $34,999 | 13 | 14.6% |
| $35,000 to $49,999 | 18 | 20.2% |
| $50,000 to $74,999 | 26 | 29.2% |
| $75,000 to $99,999 | 10 | 11.2% |
| $100,000 to $149,999 | 5 | 5.6% |
| $150,000 to $199,999 | 0 | 0.0% |
| $200,000+ | 0 | 0.0% |
Household Income by Householder Age in Avant
The median household income in Avant is $48,250, with the highest median household income of $56,250 found in the 25 to 44 years age bracket for the primary householder. A total of 28 households (31.5%) fall into this category. Meanwhile, the 15 to 24 years age bracket for the primary householder has the lowest median household income of $0, with 3 households (3.4%) in this group.
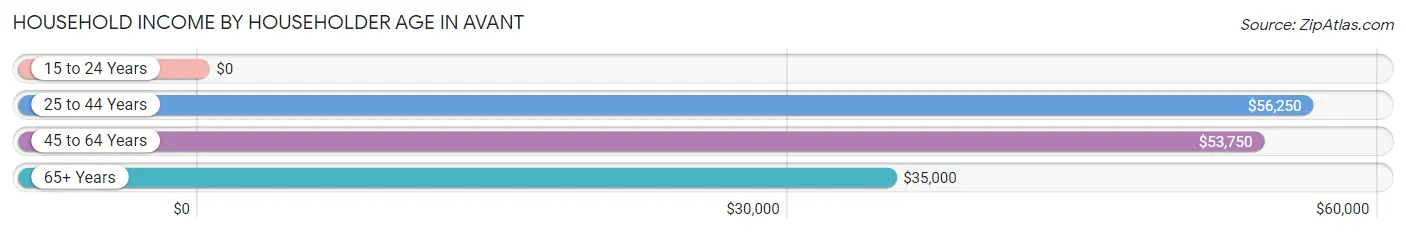
| Income Bracket | # Households | Median Income |
| 15 to 24 Years | 3 (3.4%) | $0 |
| 25 to 44 Years | 28 (31.5%) | $56,250 |
| 45 to 64 Years | 32 (36.0%) | $53,750 |
| 65+ Years | 26 (29.2%) | $35,000 |
| Total | 89 (100.0%) | $48,250 |
Poverty in Avant
Income Below Poverty by Sex and Age in Avant
With 23.0% poverty level for males and 15.3% for females among the residents of Avant, 15 year old males and 5 year old females are the most vulnerable to poverty, with 2 males (100.0%) and 2 females (100.0%) in their respective age groups living below the poverty level.
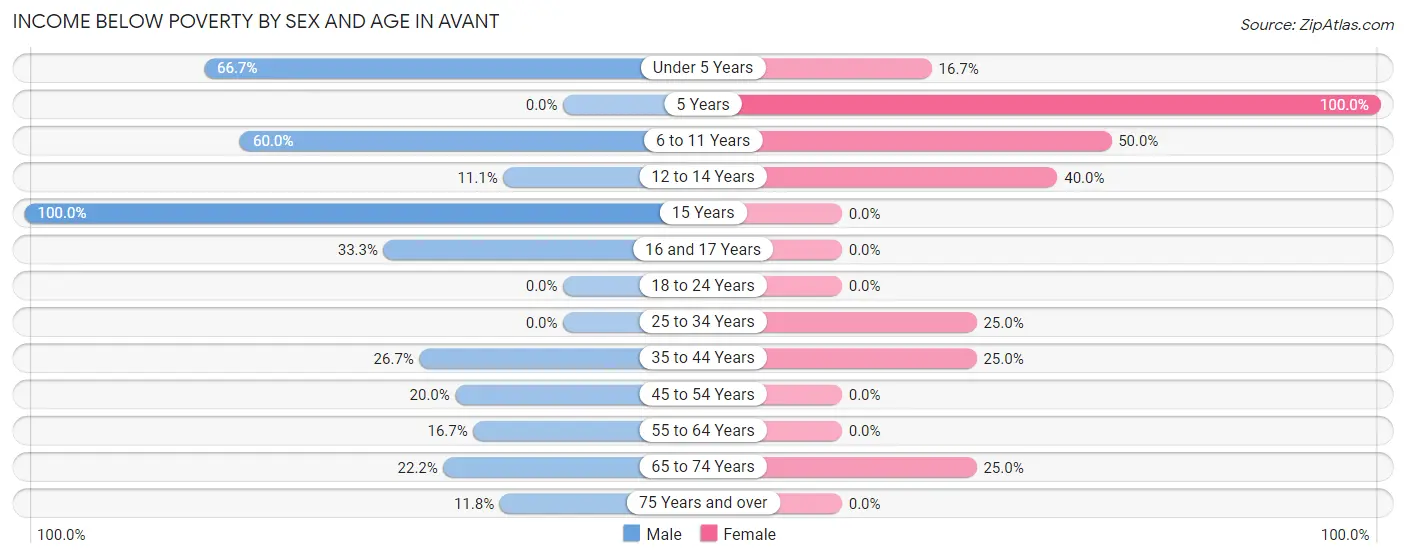
| Age Bracket | Male | Female |
| Under 5 Years | 2 (66.7%) | 2 (16.7%) |
| 5 Years | 0 (0.0%) | 2 (100.0%) |
| 6 to 11 Years | 9 (60.0%) | 2 (50.0%) |
| 12 to 14 Years | 1 (11.1%) | 2 (40.0%) |
| 15 Years | 2 (100.0%) | 0 (0.0%) |
| 16 and 17 Years | 3 (33.3%) | 0 (0.0%) |
| 18 to 24 Years | 0 (0.0%) | 0 (0.0%) |
| 25 to 34 Years | 0 (0.0%) | 3 (25.0%) |
| 35 to 44 Years | 4 (26.7%) | 4 (25.0%) |
| 45 to 54 Years | 2 (20.0%) | 0 (0.0%) |
| 55 to 64 Years | 2 (16.7%) | 0 (0.0%) |
| 65 to 74 Years | 2 (22.2%) | 2 (25.0%) |
| 75 Years and over | 2 (11.8%) | 0 (0.0%) |
| Total | 29 (23.0%) | 17 (15.3%) |
Income Above Poverty by Sex and Age in Avant
According to the poverty statistics in Avant, males aged 5 years and females aged 15 years are the age groups that are most secure financially, with 100.0% of males and 100.0% of females in these age groups living above the poverty line.
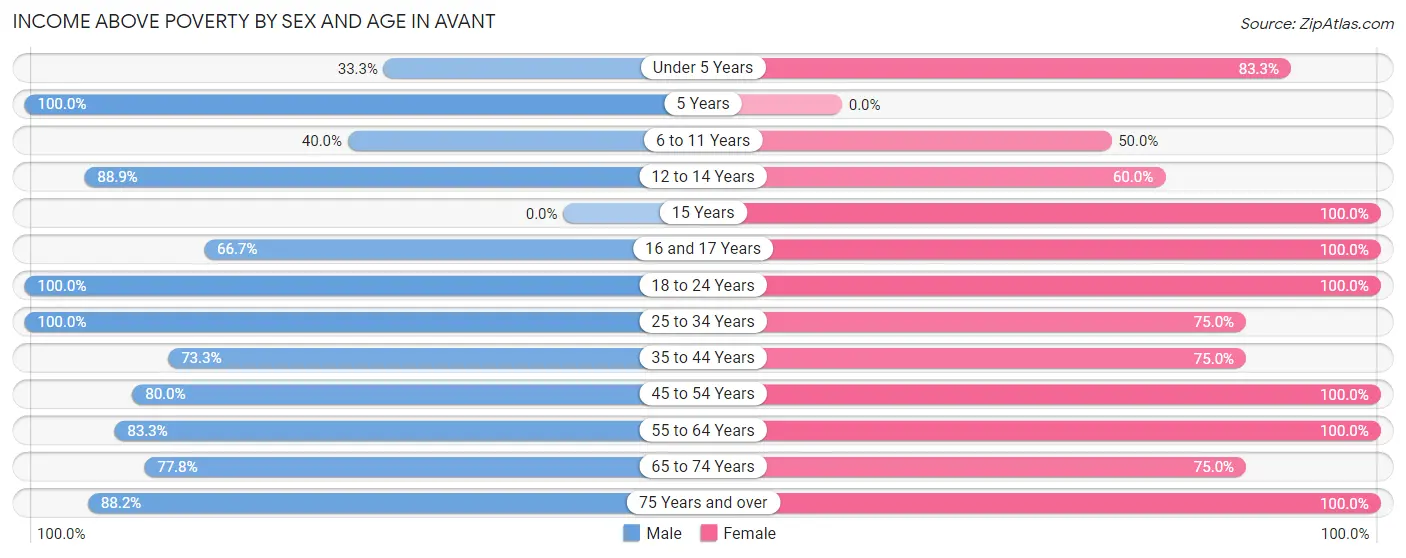
| Age Bracket | Male | Female |
| Under 5 Years | 1 (33.3%) | 10 (83.3%) |
| 5 Years | 3 (100.0%) | 0 (0.0%) |
| 6 to 11 Years | 6 (40.0%) | 2 (50.0%) |
| 12 to 14 Years | 8 (88.9%) | 3 (60.0%) |
| 15 Years | 0 (0.0%) | 2 (100.0%) |
| 16 and 17 Years | 6 (66.7%) | 1 (100.0%) |
| 18 to 24 Years | 3 (100.0%) | 12 (100.0%) |
| 25 to 34 Years | 19 (100.0%) | 9 (75.0%) |
| 35 to 44 Years | 11 (73.3%) | 12 (75.0%) |
| 45 to 54 Years | 8 (80.0%) | 11 (100.0%) |
| 55 to 64 Years | 10 (83.3%) | 14 (100.0%) |
| 65 to 74 Years | 7 (77.8%) | 6 (75.0%) |
| 75 Years and over | 15 (88.2%) | 12 (100.0%) |
| Total | 97 (77.0%) | 94 (84.7%) |
Income Below Poverty Among Married-Couple Families in Avant
The poverty statistics for married-couple families in Avant show that 6.1% or 3 of the total 49 families live below the poverty line. Families with 5 or more children have the highest poverty rate of 100.0%, comprising of 2 families. On the other hand, families with no children have the lowest poverty rate of 0.0%, which includes 0 families.
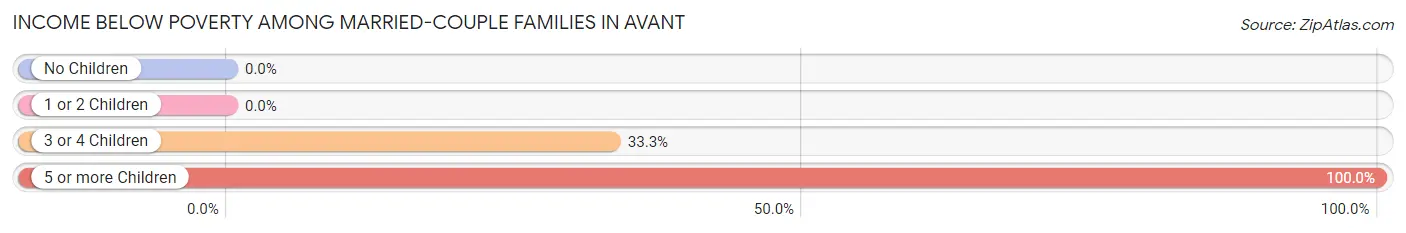
| Children | Above Poverty | Below Poverty |
| No Children | 29 (100.0%) | 0 (0.0%) |
| 1 or 2 Children | 15 (100.0%) | 0 (0.0%) |
| 3 or 4 Children | 2 (66.7%) | 1 (33.3%) |
| 5 or more Children | 0 (0.0%) | 2 (100.0%) |
| Total | 46 (93.9%) | 3 (6.1%) |
Income Below Poverty Among Single-Parent Households in Avant
According to the poverty data in Avant, 40.0% or 2 single-father households and 37.5% or 3 single-mother households are living below the poverty line. Among single-father households, those with 1 or 2 children have the highest poverty rate, with 2 households (40.0%) experiencing poverty. Likewise, among single-mother households, those with 3 or 4 children have the highest poverty rate, with 1 households (100.0%) falling below the poverty line.
| Children | Single Father | Single Mother |
| No Children | 0 (0.0%) | 0 (0.0%) |
| 1 or 2 Children | 2 (40.0%) | 0 (0.0%) |
| 3 or 4 Children | 0 (0.0%) | 1 (100.0%) |
| 5 or more Children | 0 (0.0%) | 2 (100.0%) |
| Total | 2 (40.0%) | 3 (37.5%) |
Income Below Poverty Among Married-Couple vs Single-Parent Households in Avant
The poverty data for Avant shows that 3 of the married-couple family households (6.1%) and 5 of the single-parent households (38.5%) are living below the poverty level. Within the married-couple family households, those with 5 or more children have the highest poverty rate, with 2 households (100.0%) falling below the poverty line. Among the single-parent households, those with 3 or 4 children have the highest poverty rate, with 1 household (100.0%) living below poverty.
| Children | Married-Couple Families | Single-Parent Households |
| No Children | 0 (0.0%) | 0 (0.0%) |
| 1 or 2 Children | 0 (0.0%) | 2 (25.0%) |
| 3 or 4 Children | 1 (33.3%) | 1 (100.0%) |
| 5 or more Children | 2 (100.0%) | 2 (100.0%) |
| Total | 3 (6.1%) | 5 (38.5%) |
Race in Avant
The most populous races in Avant are White / Caucasian (150 | 62.8%), Two or more Races (54 | 22.6%), and Native / Alaskan (35 | 14.6%).
| Race | # Population | % Population |
| Asian | 0 | 0.0% |
| Black / African American | 0 | 0.0% |
| Hawaiian / Pacific | 0 | 0.0% |
| Hispanic or Latino | 2 | 0.8% |
| Native / Alaskan | 35 | 14.6% |
| White / Caucasian | 150 | 62.8% |
| Two or more Races | 54 | 22.6% |
| Some other Race | 0 | 0.0% |
| Total | 239 | 100.0% |
Ancestry in Avant
The most populous ancestries reported in Avant are Cherokee (60 | 25.1%), German (52 | 21.8%), Irish (48 | 20.1%), English (17 | 7.1%), and American (13 | 5.4%), together accounting for 79.5% of all Avant residents.
| Ancestry | # Population | % Population |
| American | 13 | 5.4% |
| Cherokee | 60 | 25.1% |
| Choctaw | 6 | 2.5% |
| Creek | 6 | 2.5% |
| Delaware | 3 | 1.3% |
| Dutch | 3 | 1.3% |
| English | 17 | 7.1% |
| European | 10 | 4.2% |
| French Canadian | 11 | 4.6% |
| German | 52 | 21.8% |
| Hungarian | 2 | 0.8% |
| Irish | 48 | 20.1% |
| Italian | 2 | 0.8% |
| Mexican | 2 | 0.8% |
| Norwegian | 2 | 0.8% |
| Osage | 11 | 4.6% |
| Polish | 2 | 0.8% |
| Potawatomi | 2 | 0.8% |
| Pueblo | 3 | 1.3% |
| Scandinavian | 4 | 1.7% |
| Scottish | 3 | 1.3% |
| Swedish | 6 | 2.5% |
| Welsh | 6 | 2.5% | View All 23 Rows |
Immigrants in Avant

| Immigration Origin | # Population | % Population | View All 0 Rows |
Sex and Age in Avant
Sex and Age in Avant
The most populous age groups in Avant are 10 to 14 Years (16 | 12.7%) for men and Under 5 Years (14 | 12.4%) for women.
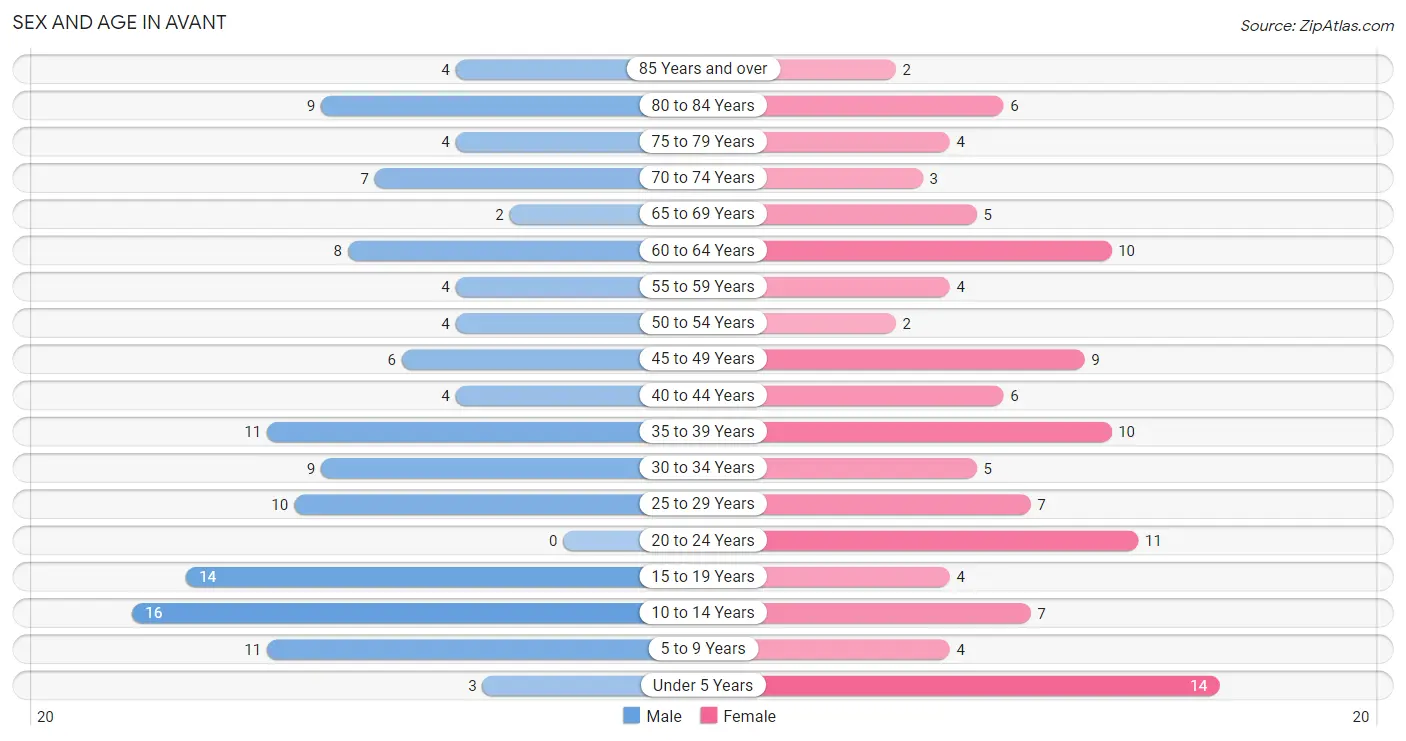
| Age Bracket | Male | Female |
| Under 5 Years | 3 (2.4%) | 14 (12.4%) |
| 5 to 9 Years | 11 (8.7%) | 4 (3.5%) |
| 10 to 14 Years | 16 (12.7%) | 7 (6.2%) |
| 15 to 19 Years | 14 (11.1%) | 4 (3.5%) |
| 20 to 24 Years | 0 (0.0%) | 11 (9.7%) |
| 25 to 29 Years | 10 (7.9%) | 7 (6.2%) |
| 30 to 34 Years | 9 (7.1%) | 5 (4.4%) |
| 35 to 39 Years | 11 (8.7%) | 10 (8.8%) |
| 40 to 44 Years | 4 (3.2%) | 6 (5.3%) |
| 45 to 49 Years | 6 (4.8%) | 9 (8.0%) |
| 50 to 54 Years | 4 (3.2%) | 2 (1.8%) |
| 55 to 59 Years | 4 (3.2%) | 4 (3.5%) |
| 60 to 64 Years | 8 (6.4%) | 10 (8.8%) |
| 65 to 69 Years | 2 (1.6%) | 5 (4.4%) |
| 70 to 74 Years | 7 (5.6%) | 3 (2.6%) |
| 75 to 79 Years | 4 (3.2%) | 4 (3.5%) |
| 80 to 84 Years | 9 (7.1%) | 6 (5.3%) |
| 85 Years and over | 4 (3.2%) | 2 (1.8%) |
| Total | 126 (100.0%) | 113 (100.0%) |
Families and Households in Avant
Median Family Size in Avant
The median family size in Avant is 3.32 persons per family, with single female/mother families (8 | 12.9%) accounting for the largest median family size of 3.75 persons per family. On the other hand, married-couple families (49 | 79.0%) represent the smallest median family size with 3.24 persons per family.
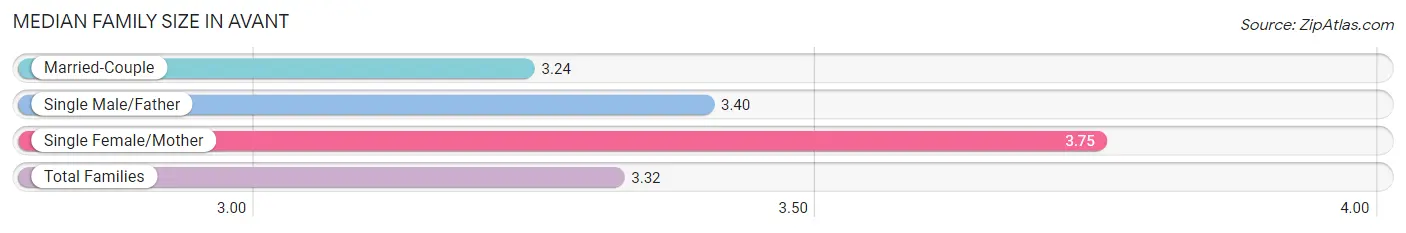
| Family Type | # Families | Family Size |
| Married-Couple | 49 (79.0%) | 3.24 |
| Single Male/Father | 5 (8.1%) | 3.40 |
| Single Female/Mother | 8 (12.9%) | 3.75 |
| Total Families | 62 (100.0%) | 3.32 |
Median Household Size in Avant
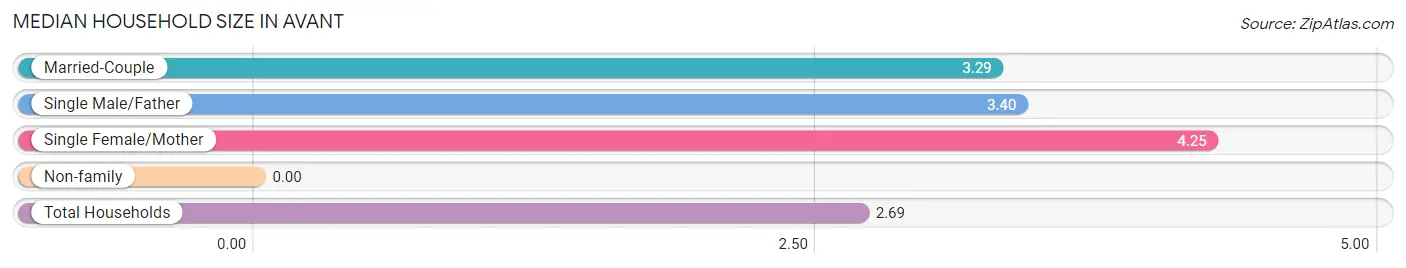
| Household Type | # Households | Household Size |
| Married-Couple | 49 (55.1%) | 3.29 |
| Single Male/Father | 5 (5.6%) | 3.40 |
| Single Female/Mother | 8 (9.0%) | 4.25 |
| Non-family | 27 (30.3%) | - |
| Total Households | 89 (100.0%) | 2.69 |
Household Size by Marriage Status in Avant
Out of a total of 89 households in Avant, 62 (69.7%) are family households, while 27 (30.3%) are nonfamily households. The most numerous type of family households are 2-person households, comprising 25, and the most common type of nonfamily households are 1-person households, comprising 27.
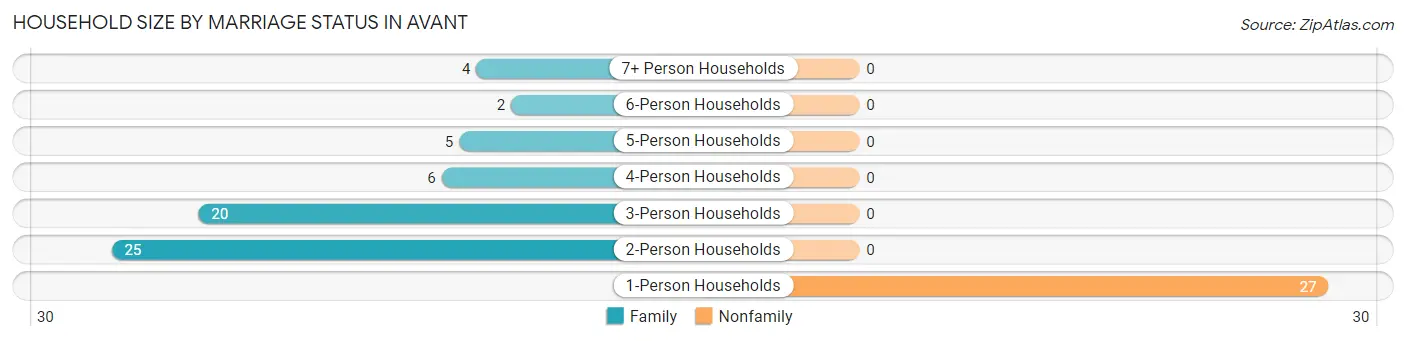
| Household Size | Family Households | Nonfamily Households |
| 1-Person Households | - | 27 (30.3%) |
| 2-Person Households | 25 (28.1%) | 0 (0.0%) |
| 3-Person Households | 20 (22.5%) | 0 (0.0%) |
| 4-Person Households | 6 (6.7%) | 0 (0.0%) |
| 5-Person Households | 5 (5.6%) | 0 (0.0%) |
| 6-Person Households | 2 (2.2%) | 0 (0.0%) |
| 7+ Person Households | 4 (4.5%) | 0 (0.0%) |
| Total | 62 (69.7%) | 27 (30.3%) |
Female Fertility in Avant
Fertility by Age in Avant
Average fertility rate in Avant is 38.0 births per 1,000 women. Women in the age bracket of 20 to 34 years have the highest fertility rate with 87.0 births per 1,000 women. Women in the age bracket of 20 to 34 years acount for 100.0% of all women with births.
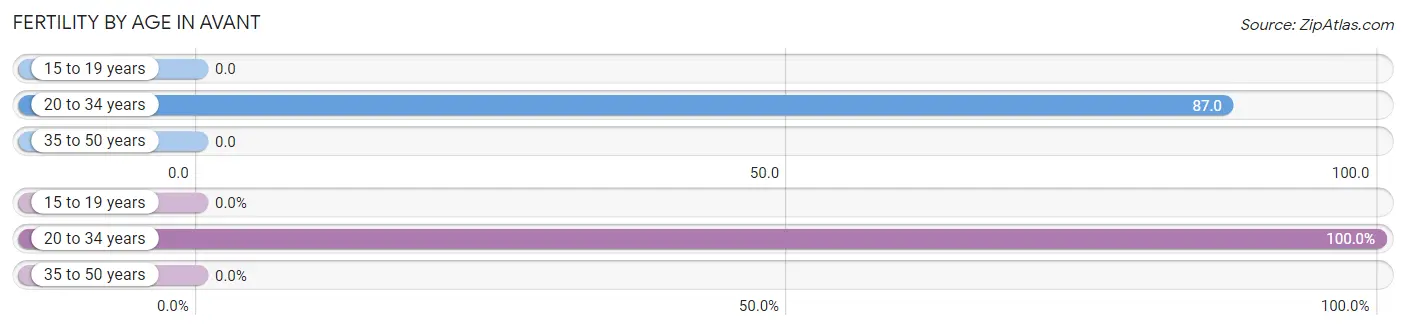
| Age Bracket | Women with Births | Births / 1,000 Women |
| 15 to 19 years | 0 (0.0%) | 0.0 |
| 20 to 34 years | 2 (100.0%) | 87.0 |
| 35 to 50 years | 0 (0.0%) | 0.0 |
| Total | 2 (100.0%) | 38.0 |
Fertility by Age by Marriage Status in Avant
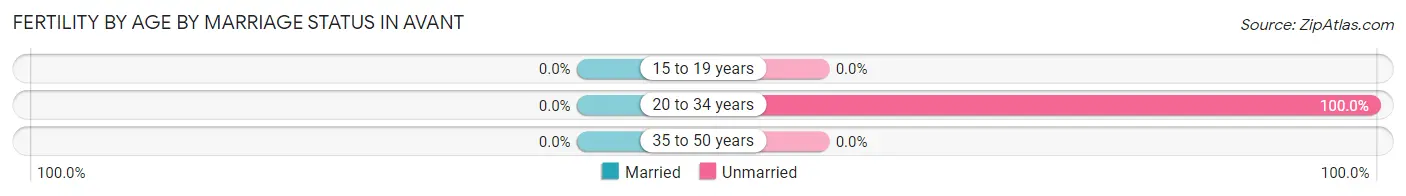
| Age Bracket | Married | Unmarried |
| 15 to 19 years | 0 (0.0%) | 0 (0.0%) |
| 20 to 34 years | 0 (0.0%) | 2 (100.0%) |
| 35 to 50 years | 0 (0.0%) | 0 (0.0%) |
| Total | 0 (0.0%) | 2 (100.0%) |
Fertility by Education in Avant
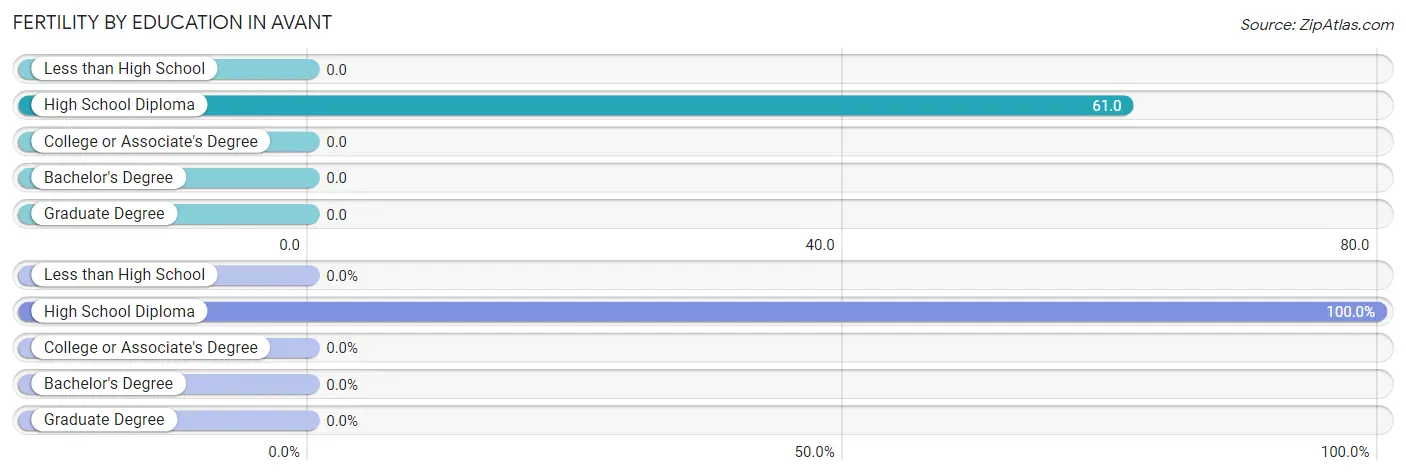
| Educational Attainment | Women with Births | Births / 1,000 Women |
| Less than High School | 0 (0.0%) | 0.0 |
| High School Diploma | 2 (100.0%) | 61.0 |
| College or Associate's Degree | 0 (0.0%) | 0.0 |
| Bachelor's Degree | 0 (0.0%) | 0.0 |
| Graduate Degree | 0 (0.0%) | 0.0 |
| Total | 2 (100.0%) | 38.0 |
Fertility by Education by Marriage Status in Avant
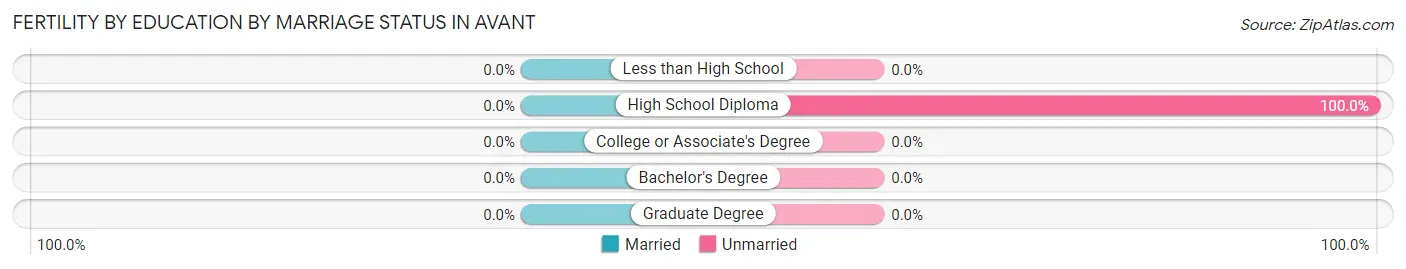
| Educational Attainment | Married | Unmarried |
| Less than High School | 0 (0.0%) | 0 (0.0%) |
| High School Diploma | 0 (0.0%) | 2 (100.0%) |
| College or Associate's Degree | 0 (0.0%) | 0 (0.0%) |
| Bachelor's Degree | 0 (0.0%) | 0 (0.0%) |
| Graduate Degree | 0 (0.0%) | 0 (0.0%) |
| Total | 0 (0.0%) | 2 (100.0%) |
Employment Characteristics in Avant
Employment by Class of Employer in Avant
Among the 92 employed individuals in Avant, private company employees (71 | 77.2%), local government employees (9 | 9.8%), and state government employees (7 | 7.6%) make up the most common classes of employment.
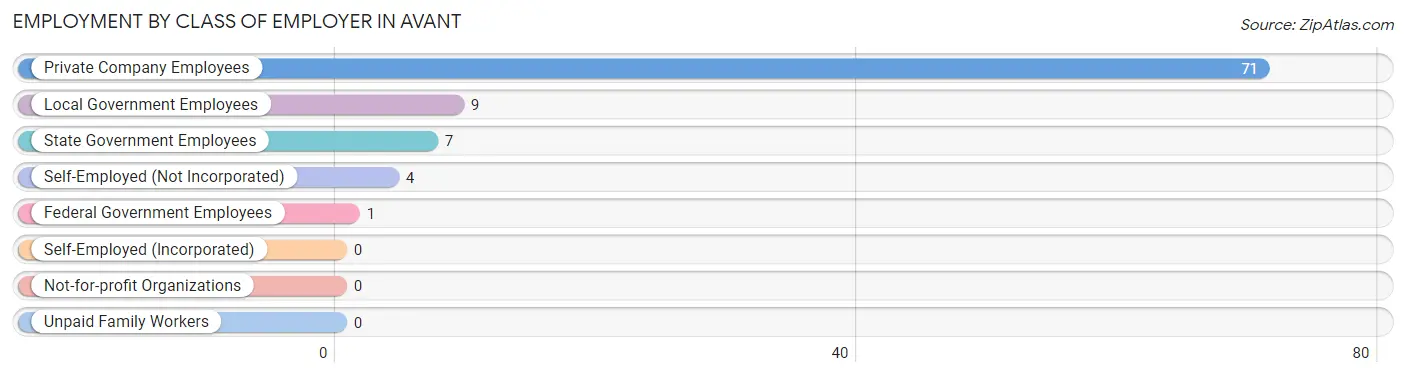
| Employer Class | # Employees | % Employees |
| Private Company Employees | 71 | 77.2% |
| Self-Employed (Incorporated) | 0 | 0.0% |
| Self-Employed (Not Incorporated) | 4 | 4.3% |
| Not-for-profit Organizations | 0 | 0.0% |
| Local Government Employees | 9 | 9.8% |
| State Government Employees | 7 | 7.6% |
| Federal Government Employees | 1 | 1.1% |
| Unpaid Family Workers | 0 | 0.0% |
| Total | 92 | 100.0% |
Employment Status by Age in Avant
According to the labor force statistics for Avant, out of the total population over 16 years of age (180), 52.2% or 94 individuals are in the labor force, with 2.1% or 2 of them unemployed. The age group with the highest labor force participation rate is 55 to 59 years, with 100.0% or 8 individuals in the labor force. Within the labor force, the 16 to 19 years age range has the highest percentage of unemployed individuals, with 100.0% or 2 of them being unemployed.
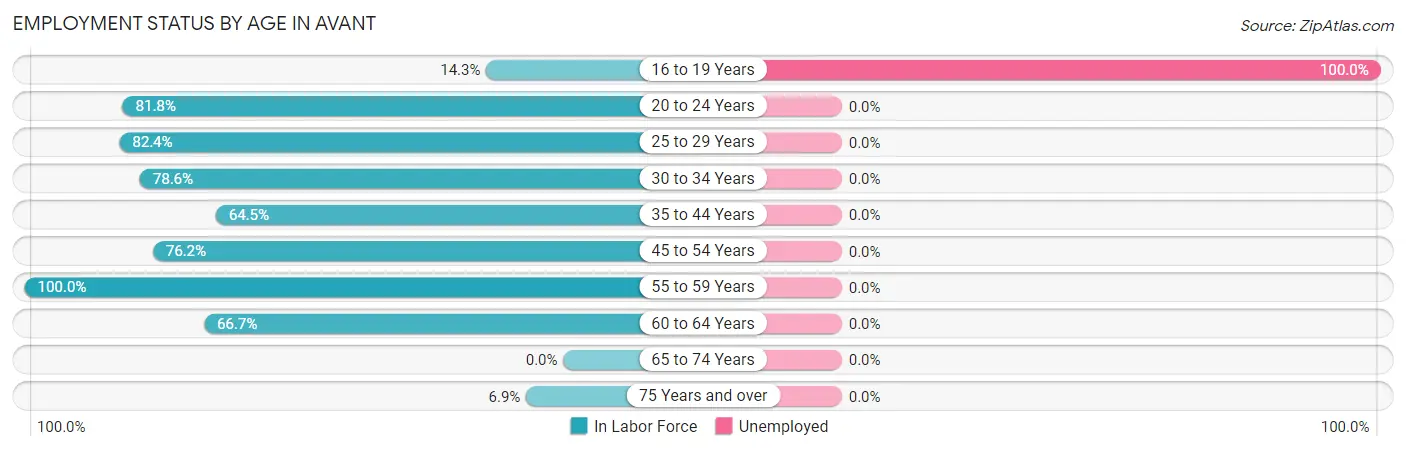
| Age Bracket | In Labor Force | Unemployed |
| 16 to 19 Years | 2 (14.3%) | 2 (100.0%) |
| 20 to 24 Years | 9 (81.8%) | 0 (0.0%) |
| 25 to 29 Years | 14 (82.4%) | 0 (0.0%) |
| 30 to 34 Years | 11 (78.6%) | 0 (0.0%) |
| 35 to 44 Years | 20 (64.5%) | 0 (0.0%) |
| 45 to 54 Years | 16 (76.2%) | 0 (0.0%) |
| 55 to 59 Years | 8 (100.0%) | 0 (0.0%) |
| 60 to 64 Years | 12 (66.7%) | 0 (0.0%) |
| 65 to 74 Years | 0 (0.0%) | 0 (0.0%) |
| 75 Years and over | 2 (6.9%) | 0 (0.0%) |
| Total | 94 (52.2%) | 2 (2.1%) |
Employment Status by Educational Attainment in Avant
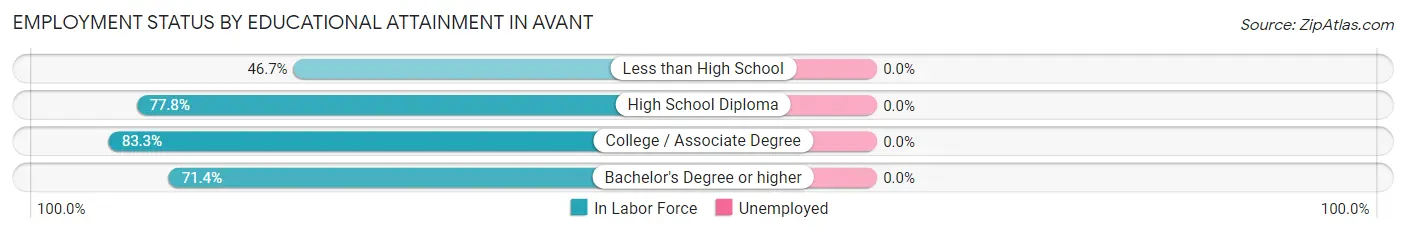
| Educational Attainment | In Labor Force | Unemployed |
| Less than High School | 7 (46.7%) | 0 (0.0%) |
| High School Diploma | 49 (77.8%) | 0 (0.0%) |
| College / Associate Degree | 20 (83.3%) | 0 (0.0%) |
| Bachelor's Degree or higher | 5 (71.4%) | 0 (0.0%) |
| Total | 81 (74.3%) | 0 (0.0%) |
Employment Occupations by Sex in Avant
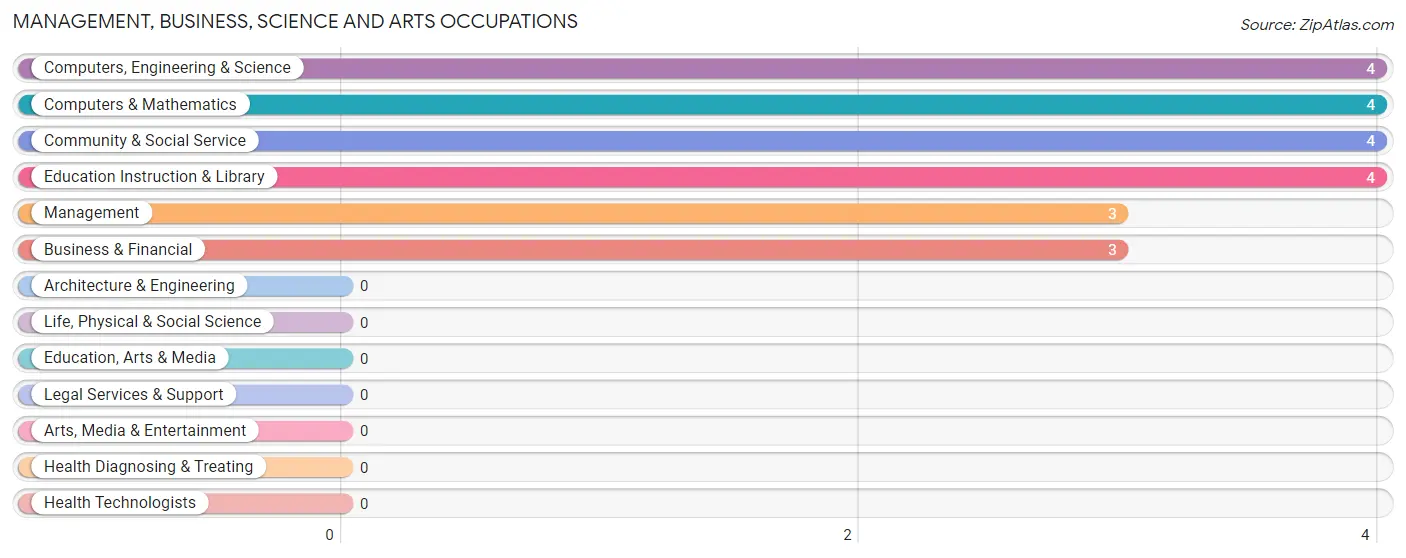
Management, Business, Science and Arts Occupations
The most common Management, Business, Science and Arts occupations in Avant are Computers, Engineering & Science (4 | 4.3%), Computers & Mathematics (4 | 4.3%), Community & Social Service (4 | 4.3%), Education Instruction & Library (4 | 4.3%), and Management (3 | 3.3%).
Management, Business, Science and Arts Occupations by Sex
Within the Management, Business, Science and Arts occupations in Avant, the most male-oriented occupations are Computers, Engineering & Science (100.0%), Computers & Mathematics (100.0%), and Management (33.3%), while the most female-oriented occupations are Business & Financial (100.0%), Community & Social Service (100.0%), and Education Instruction & Library (100.0%).
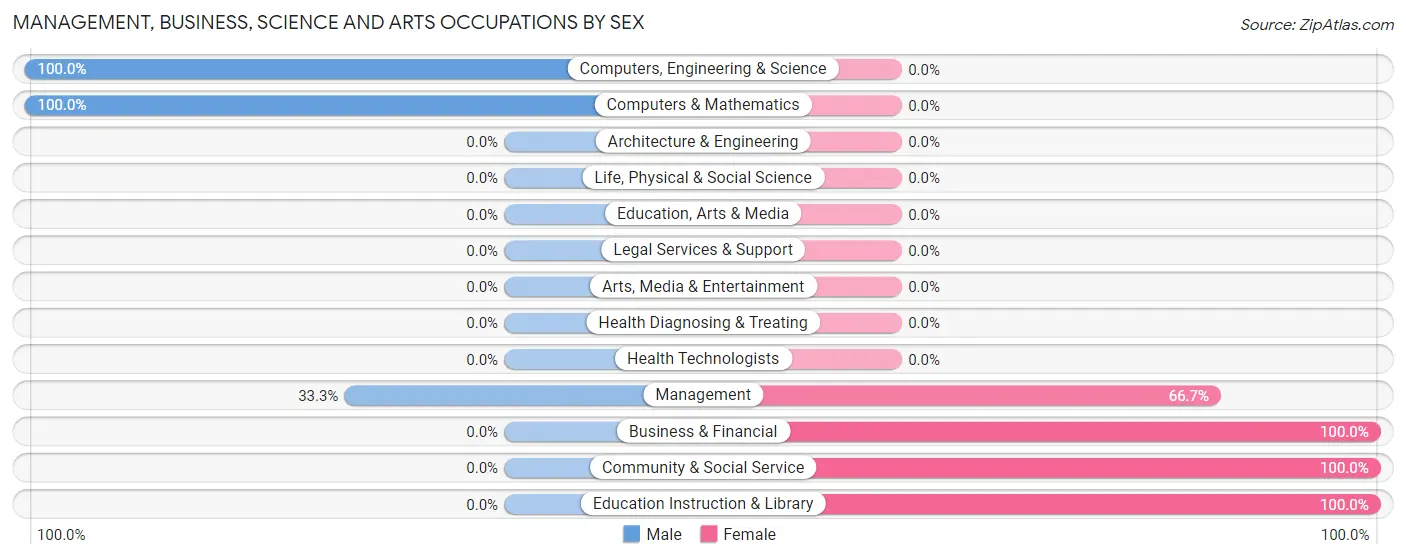
| Occupation | Male | Female |
| Management | 1 (33.3%) | 2 (66.7%) |
| Business & Financial | 0 (0.0%) | 3 (100.0%) |
| Computers, Engineering & Science | 4 (100.0%) | 0 (0.0%) |
| Computers & Mathematics | 4 (100.0%) | 0 (0.0%) |
| Architecture & Engineering | 0 (0.0%) | 0 (0.0%) |
| Life, Physical & Social Science | 0 (0.0%) | 0 (0.0%) |
| Community & Social Service | 0 (0.0%) | 4 (100.0%) |
| Education, Arts & Media | 0 (0.0%) | 0 (0.0%) |
| Legal Services & Support | 0 (0.0%) | 0 (0.0%) |
| Education Instruction & Library | 0 (0.0%) | 4 (100.0%) |
| Arts, Media & Entertainment | 0 (0.0%) | 0 (0.0%) |
| Health Diagnosing & Treating | 0 (0.0%) | 0 (0.0%) |
| Health Technologists | 0 (0.0%) | 0 (0.0%) |
| Total (Category) | 5 (35.7%) | 9 (64.3%) |
| Total (Overall) | 46 (50.0%) | 46 (50.0%) |
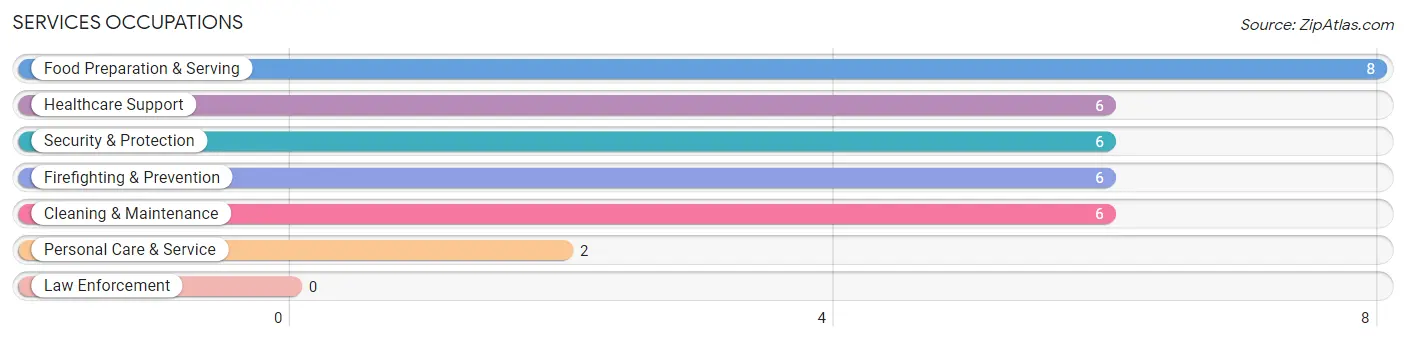
Services Occupations
The most common Services occupations in Avant are Food Preparation & Serving (8 | 8.7%), Healthcare Support (6 | 6.5%), Security & Protection (6 | 6.5%), Firefighting & Prevention (6 | 6.5%), and Cleaning & Maintenance (6 | 6.5%).
Services Occupations by Sex
Within the Services occupations in Avant, the most male-oriented occupations are Security & Protection (66.7%), Firefighting & Prevention (66.7%), and Cleaning & Maintenance (50.0%), while the most female-oriented occupations are Food Preparation & Serving (100.0%), Personal Care & Service (100.0%), and Healthcare Support (66.7%).
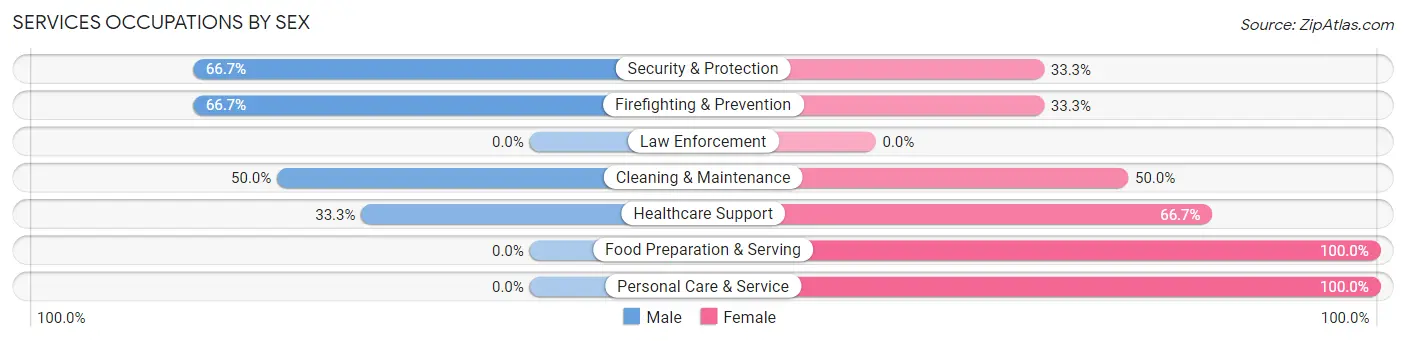
| Occupation | Male | Female |
| Healthcare Support | 2 (33.3%) | 4 (66.7%) |
| Security & Protection | 4 (66.7%) | 2 (33.3%) |
| Firefighting & Prevention | 4 (66.7%) | 2 (33.3%) |
| Law Enforcement | 0 (0.0%) | 0 (0.0%) |
| Food Preparation & Serving | 0 (0.0%) | 8 (100.0%) |
| Cleaning & Maintenance | 3 (50.0%) | 3 (50.0%) |
| Personal Care & Service | 0 (0.0%) | 2 (100.0%) |
| Total (Category) | 9 (32.1%) | 19 (67.9%) |
| Total (Overall) | 46 (50.0%) | 46 (50.0%) |
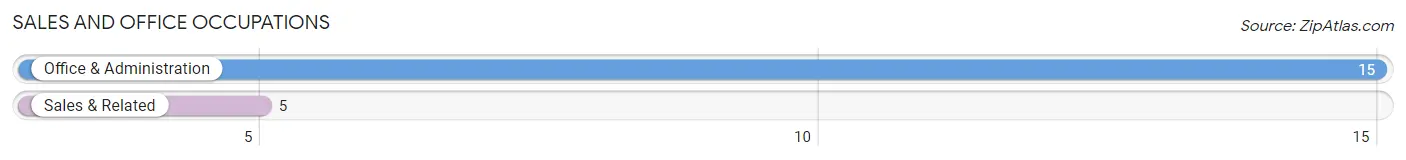
Sales and Office Occupations
The most common Sales and Office occupations in Avant are Office & Administration (15 | 16.3%), and Sales & Related (5 | 5.4%).
Sales and Office Occupations by Sex
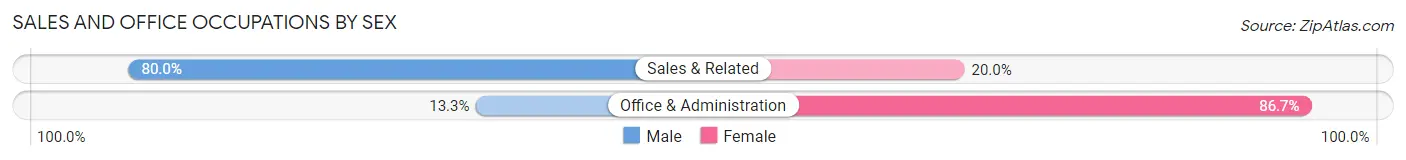
| Occupation | Male | Female |
| Sales & Related | 4 (80.0%) | 1 (20.0%) |
| Office & Administration | 2 (13.3%) | 13 (86.7%) |
| Total (Category) | 6 (30.0%) | 14 (70.0%) |
| Total (Overall) | 46 (50.0%) | 46 (50.0%) |
Natural Resources, Construction and Maintenance Occupations
The most common Natural Resources, Construction and Maintenance occupations in Avant are , and Construction & Extraction (6 | 6.5%).
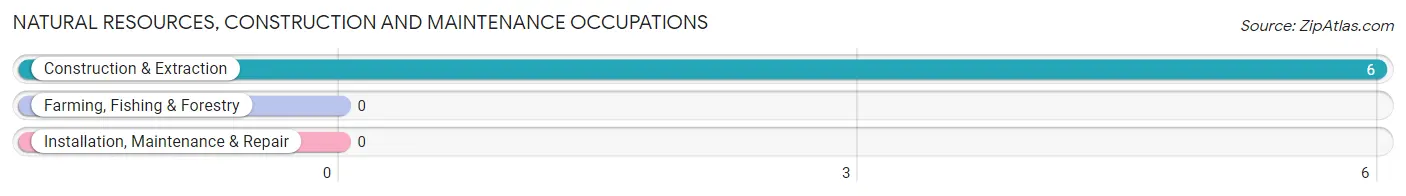
Natural Resources, Construction and Maintenance Occupations by Sex
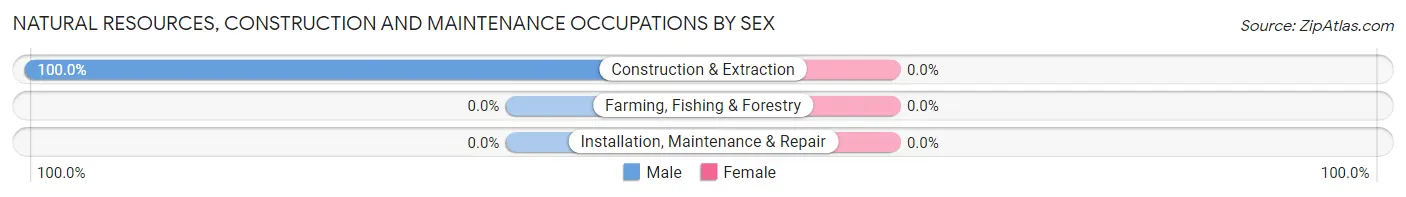
| Occupation | Male | Female |
| Farming, Fishing & Forestry | 0 (0.0%) | 0 (0.0%) |
| Construction & Extraction | 6 (100.0%) | 0 (0.0%) |
| Installation, Maintenance & Repair | 0 (0.0%) | 0 (0.0%) |
| Total (Category) | 6 (100.0%) | 0 (0.0%) |
| Total (Overall) | 46 (50.0%) | 46 (50.0%) |
Production, Transportation and Moving Occupations
The most common Production, Transportation and Moving occupations in Avant are Production (15 | 16.3%), Transportation (5 | 5.4%), and Material Moving (4 | 4.3%).
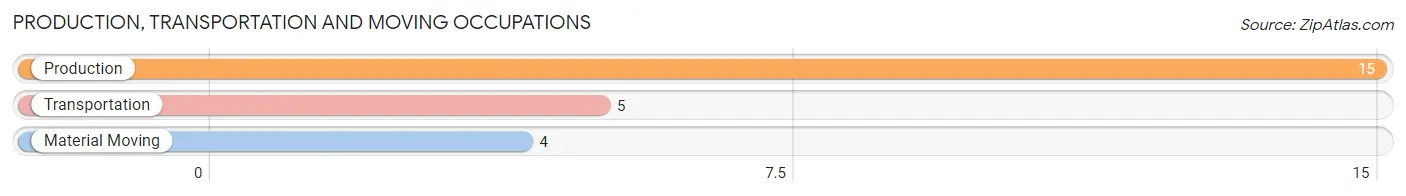
Production, Transportation and Moving Occupations by Sex
| Occupation | Male | Female |
| Production | 11 (73.3%) | 4 (26.7%) |
| Transportation | 5 (100.0%) | 0 (0.0%) |
| Material Moving | 4 (100.0%) | 0 (0.0%) |
| Total (Category) | 20 (83.3%) | 4 (16.7%) |
| Total (Overall) | 46 (50.0%) | 46 (50.0%) |
Employment Industries by Sex in Avant
Employment Industries in Avant
The major employment industries in Avant include Manufacturing (10 | 10.9%), Retail Trade (10 | 10.9%), Health Care & Social Assistance (9 | 9.8%), Construction (7 | 7.6%), and Professional & Scientific (7 | 7.6%).
Employment Industries by Sex in Avant
The Avant industries that see more men than women are Mining, Quarrying, & Extraction (100.0%), Construction (100.0%), and Utilities (100.0%), whereas the industries that tend to have a higher number of women are Finance & Insurance (100.0%), Educational Services (100.0%), and Accommodation & Food Services (100.0%).
| Industry | Male | Female |
| Agriculture, Fishing & Hunting | 0 (0.0%) | 0 (0.0%) |
| Mining, Quarrying, & Extraction | 2 (100.0%) | 0 (0.0%) |
| Construction | 7 (100.0%) | 0 (0.0%) |
| Manufacturing | 6 (60.0%) | 4 (40.0%) |
| Wholesale Trade | 0 (0.0%) | 0 (0.0%) |
| Retail Trade | 2 (20.0%) | 8 (80.0%) |
| Transportation & Warehousing | 4 (80.0%) | 1 (20.0%) |
| Utilities | 6 (100.0%) | 0 (0.0%) |
| Information | 0 (0.0%) | 0 (0.0%) |
| Finance & Insurance | 0 (0.0%) | 2 (100.0%) |
| Real Estate, Rental & Leasing | 2 (66.7%) | 1 (33.3%) |
| Professional & Scientific | 4 (57.1%) | 3 (42.9%) |
| Enterprise Management | 0 (0.0%) | 0 (0.0%) |
| Administrative & Support | 4 (57.1%) | 3 (42.9%) |
| Educational Services | 0 (0.0%) | 7 (100.0%) |
| Health Care & Social Assistance | 3 (33.3%) | 6 (66.7%) |
| Arts, Entertainment & Recreation | 4 (66.7%) | 2 (33.3%) |
| Accommodation & Food Services | 0 (0.0%) | 5 (100.0%) |
| Public Administration | 0 (0.0%) | 2 (100.0%) |
| Total | 46 (50.0%) | 46 (50.0%) |
Education in Avant
School Enrollment in Avant
The most common levels of schooling among the 55 students in Avant are elementary school (16 | 29.1%), high school (15 | 27.3%), and middle school (14 | 25.5%).
| School Level | # Students | % Students |
| Nursery / Preschool | 4 | 7.3% |
| Kindergarten | 4 | 7.3% |
| Elementary School | 16 | 29.1% |
| Middle School | 14 | 25.5% |
| High School | 15 | 27.3% |
| College / Undergraduate | 2 | 3.6% |
| Graduate / Professional | 0 | 0.0% |
| Total | 55 | 100.0% |
School Enrollment by Age by Funding Source in Avant
Out of a total of 55 students who are enrolled in schools in Avant, 4 (7.3%) attend a private institution, while the remaining 51 (92.7%) are enrolled in public schools. The age group of 3 to 4 year olds has the highest likelihood of being enrolled in private schools, with 2 (50.0% in the age bracket) enrolled. Conversely, the age group of 10 to 14 year olds has the lowest likelihood of being enrolled in a private school, with 23 (100.0% in the age bracket) attending a public institution.
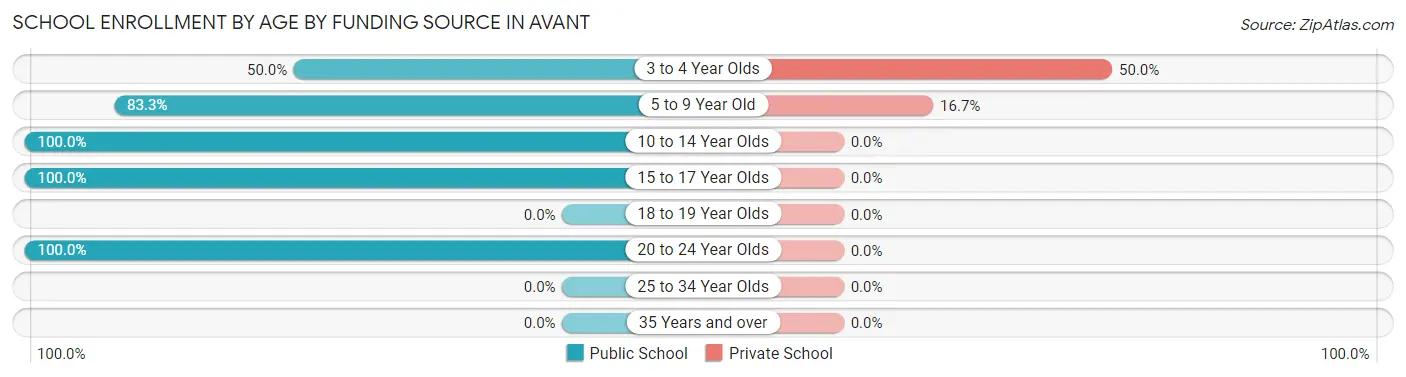
| Age Bracket | Public School | Private School |
| 3 to 4 Year Olds | 2 (50.0%) | 2 (50.0%) |
| 5 to 9 Year Old | 10 (83.3%) | 2 (16.7%) |
| 10 to 14 Year Olds | 23 (100.0%) | 0 (0.0%) |
| 15 to 17 Year Olds | 14 (100.0%) | 0 (0.0%) |
| 18 to 19 Year Olds | 0 (0.0%) | 0 (0.0%) |
| 20 to 24 Year Olds | 2 (100.0%) | 0 (0.0%) |
| 25 to 34 Year Olds | 0 (0.0%) | 0 (0.0%) |
| 35 Years and over | 0 (0.0%) | 0 (0.0%) |
| Total | 51 (92.7%) | 4 (7.3%) |
Educational Attainment by Field of Study in Avant
Business (5 | 50.0%), arts & humanities (3 | 30.0%), psychology (1 | 10.0%), and communications (1 | 10.0%) are the most common fields of study among 10 individuals in Avant who have obtained a bachelor's degree or higher.
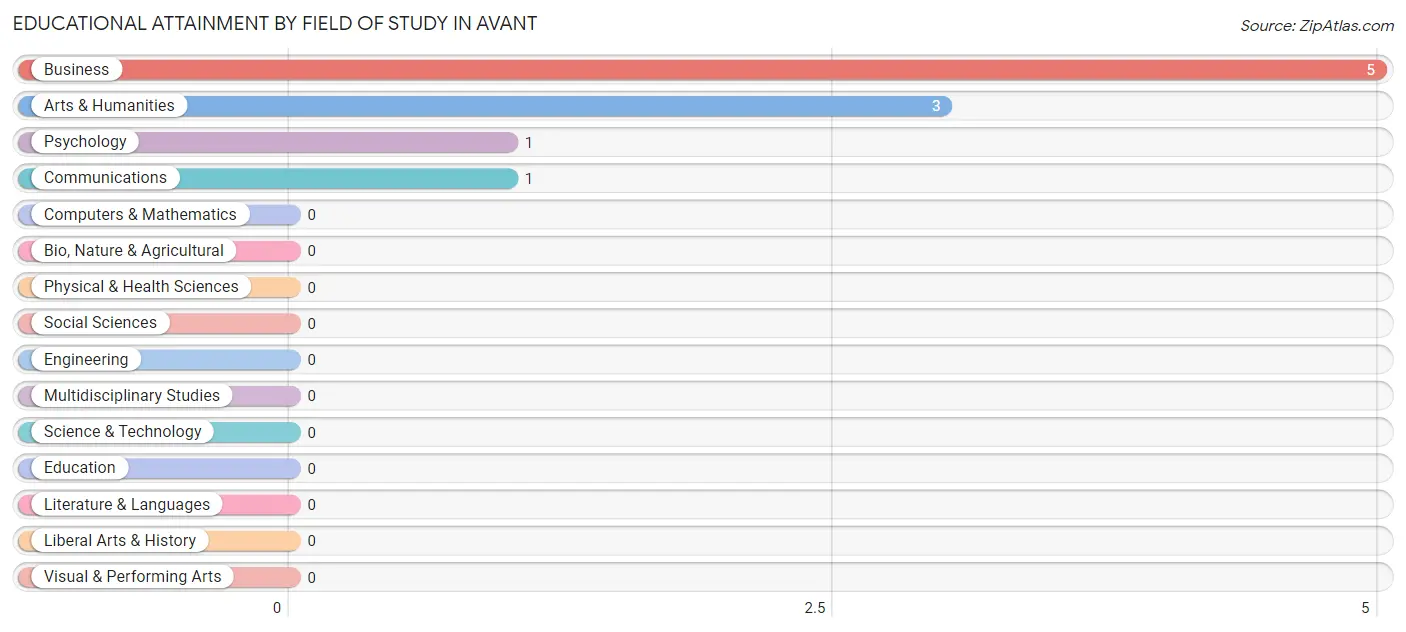
| Field of Study | # Graduates | % Graduates |
| Computers & Mathematics | 0 | 0.0% |
| Bio, Nature & Agricultural | 0 | 0.0% |
| Physical & Health Sciences | 0 | 0.0% |
| Psychology | 1 | 10.0% |
| Social Sciences | 0 | 0.0% |
| Engineering | 0 | 0.0% |
| Multidisciplinary Studies | 0 | 0.0% |
| Science & Technology | 0 | 0.0% |
| Business | 5 | 50.0% |
| Education | 0 | 0.0% |
| Literature & Languages | 0 | 0.0% |
| Liberal Arts & History | 0 | 0.0% |
| Visual & Performing Arts | 0 | 0.0% |
| Communications | 1 | 10.0% |
| Arts & Humanities | 3 | 30.0% |
| Total | 10 | 100.0% |
Transportation & Commute in Avant
Vehicle Availability by Sex in Avant
The most prevalent vehicle ownership categories in Avant are males with 2 vehicles (24, accounting for 52.2%) and females with 2 vehicles (34, making up 52.2%).
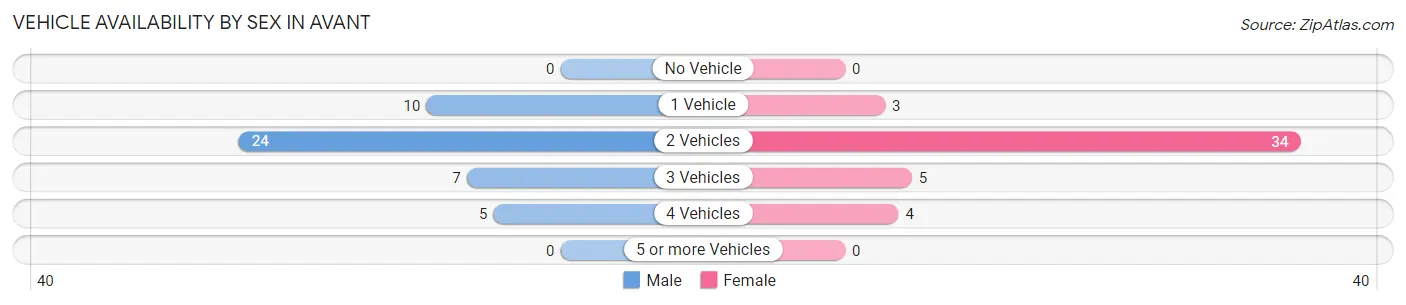
| Vehicles Available | Male | Female |
| No Vehicle | 0 (0.0%) | 0 (0.0%) |
| 1 Vehicle | 10 (21.7%) | 3 (6.5%) |
| 2 Vehicles | 24 (52.2%) | 34 (73.9%) |
| 3 Vehicles | 7 (15.2%) | 5 (10.9%) |
| 4 Vehicles | 5 (10.9%) | 4 (8.7%) |
| 5 or more Vehicles | 0 (0.0%) | 0 (0.0%) |
| Total | 46 (100.0%) | 46 (100.0%) |
Commute Time in Avant
The most frequently occuring commute durations in Avant are 15 to 19 minutes (20 commuters, 22.2%), 45 to 59 minutes (20 commuters, 22.2%), and 60 to 89 minutes (13 commuters, 14.4%).
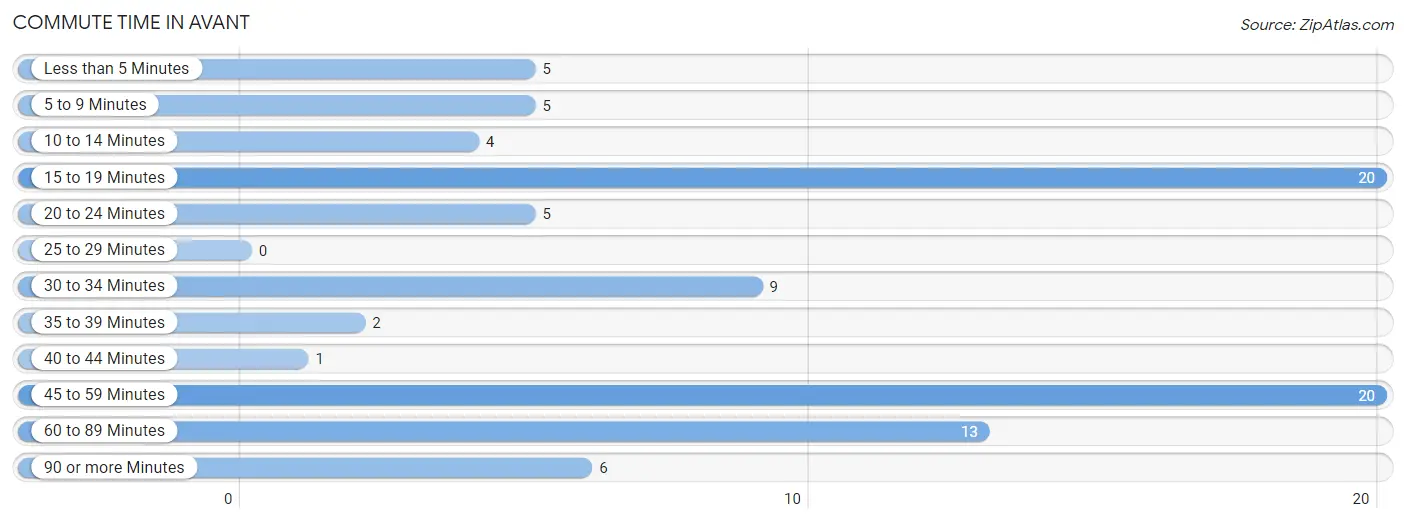
| Commute Time | # Commuters | % Commuters |
| Less than 5 Minutes | 5 | 5.6% |
| 5 to 9 Minutes | 5 | 5.6% |
| 10 to 14 Minutes | 4 | 4.4% |
| 15 to 19 Minutes | 20 | 22.2% |
| 20 to 24 Minutes | 5 | 5.6% |
| 25 to 29 Minutes | 0 | 0.0% |
| 30 to 34 Minutes | 9 | 10.0% |
| 35 to 39 Minutes | 2 | 2.2% |
| 40 to 44 Minutes | 1 | 1.1% |
| 45 to 59 Minutes | 20 | 22.2% |
| 60 to 89 Minutes | 13 | 14.4% |
| 90 or more Minutes | 6 | 6.7% |
Commute Time by Sex in Avant
The most common commute times in Avant are 45 to 59 minutes (17 commuters, 37.0%) for males and 60 to 89 minutes (11 commuters, 25.0%) for females.
| Commute Time | Male | Female |
| Less than 5 Minutes | 0 (0.0%) | 5 (11.4%) |
| 5 to 9 Minutes | 2 (4.3%) | 3 (6.8%) |
| 10 to 14 Minutes | 2 (4.3%) | 2 (4.5%) |
| 15 to 19 Minutes | 12 (26.1%) | 8 (18.2%) |
| 20 to 24 Minutes | 2 (4.3%) | 3 (6.8%) |
| 25 to 29 Minutes | 0 (0.0%) | 0 (0.0%) |
| 30 to 34 Minutes | 4 (8.7%) | 5 (11.4%) |
| 35 to 39 Minutes | 0 (0.0%) | 2 (4.5%) |
| 40 to 44 Minutes | 1 (2.2%) | 0 (0.0%) |
| 45 to 59 Minutes | 17 (37.0%) | 3 (6.8%) |
| 60 to 89 Minutes | 2 (4.3%) | 11 (25.0%) |
| 90 or more Minutes | 4 (8.7%) | 2 (4.5%) |
Time of Departure to Work by Sex in Avant
The most frequent times of departure to work in Avant are 7:00 AM to 7:29 AM (11, 23.9%) for males and 12:00 AM to 4:59 AM (11, 25.0%) for females.
| Time of Departure | Male | Female |
| 12:00 AM to 4:59 AM | 3 (6.5%) | 11 (25.0%) |
| 5:00 AM to 5:29 AM | 2 (4.3%) | 2 (4.5%) |
| 5:30 AM to 5:59 AM | 1 (2.2%) | 0 (0.0%) |
| 6:00 AM to 6:29 AM | 8 (17.4%) | 5 (11.4%) |
| 6:30 AM to 6:59 AM | 8 (17.4%) | 3 (6.8%) |
| 7:00 AM to 7:29 AM | 11 (23.9%) | 9 (20.4%) |
| 7:30 AM to 7:59 AM | 1 (2.2%) | 0 (0.0%) |
| 8:00 AM to 8:29 AM | 2 (4.3%) | 2 (4.5%) |
| 8:30 AM to 8:59 AM | 4 (8.7%) | 2 (4.5%) |
| 9:00 AM to 9:59 AM | 0 (0.0%) | 5 (11.4%) |
| 10:00 AM to 10:59 AM | 0 (0.0%) | 1 (2.3%) |
| 11:00 AM to 11:59 AM | 0 (0.0%) | 0 (0.0%) |
| 12:00 PM to 3:59 PM | 1 (2.2%) | 4 (9.1%) |
| 4:00 PM to 11:59 PM | 5 (10.9%) | 0 (0.0%) |
| Total | 46 (100.0%) | 44 (100.0%) |
Housing Occupancy in Avant
Occupancy by Ownership in Avant
Of the total 89 dwellings in Avant, owner-occupied units account for 78 (87.6%), while renter-occupied units make up 11 (12.4%).
| Occupancy | # Housing Units | % Housing Units |
| Owner Occupied Housing Units | 78 | 87.6% |
| Renter-Occupied Housing Units | 11 | 12.4% |
| Total Occupied Housing Units | 89 | 100.0% |
Occupancy by Household Size in Avant
| Household Size | # Housing Units | % Housing Units |
| 1-Person Household | 27 | 30.3% |
| 2-Person Household | 25 | 28.1% |
| 3-Person Household | 20 | 22.5% |
| 4+ Person Household | 17 | 19.1% |
| Total Housing Units | 89 | 100.0% |
Occupancy by Ownership by Household Size in Avant
| Household Size | Owner-occupied | Renter-occupied |
| 1-Person Household | 25 (92.6%) | 2 (7.4%) |
| 2-Person Household | 23 (92.0%) | 2 (8.0%) |
| 3-Person Household | 16 (80.0%) | 4 (20.0%) |
| 4+ Person Household | 14 (82.4%) | 3 (17.6%) |
| Total Housing Units | 78 (87.6%) | 11 (12.4%) |
Occupancy by Educational Attainment in Avant
| Household Size | Owner-occupied | Renter-occupied |
| Less than High School | 11 (73.3%) | 4 (26.7%) |
| High School Diploma | 46 (90.2%) | 5 (9.8%) |
| College/Associate Degree | 15 (88.2%) | 2 (11.8%) |
| Bachelor's Degree or higher | 6 (100.0%) | 0 (0.0%) |
Occupancy by Age of Householder in Avant
| Age Bracket | # Households | % Households |
| Under 35 Years | 15 | 16.9% |
| 35 to 44 Years | 16 | 18.0% |
| 45 to 54 Years | 15 | 16.9% |
| 55 to 64 Years | 17 | 19.1% |
| 65 to 74 Years | 6 | 6.7% |
| 75 to 84 Years | 14 | 15.7% |
| 85 Years and Over | 6 | 6.7% |
| Total | 89 | 100.0% |
Housing Finances in Avant
Median Income by Occupancy in Avant
| Occupancy Type | # Households | Median Income |
| Owner-Occupied | 78 (87.6%) | $49,167 |
| Renter-Occupied | 11 (12.4%) | $0 |
| Average | 89 (100.0%) | $48,250 |
Occupancy by Householder Income Bracket in Avant
| Income Bracket | Owner-occupied | Renter-occupied |
| Less than $5,000 | 0 (0.0%) | 2 (18.2%) |
| $5,000 to $9,999 | 2 (2.6%) | 0 (0.0%) |
| $10,000 to $14,999 | 5 (6.4%) | 2 (18.2%) |
| $15,000 to $19,999 | 0 (0.0%) | 0 (0.0%) |
| $20,000 to $24,999 | 6 (7.7%) | 0 (0.0%) |
| $25,000 to $34,999 | 11 (14.1%) | 2 (18.2%) |
| $35,000 to $49,999 | 16 (20.5%) | 2 (18.2%) |
| $50,000 to $74,999 | 26 (33.3%) | 0 (0.0%) |
| $75,000 to $99,999 | 7 (9.0%) | 3 (27.3%) |
| $100,000 to $149,999 | 5 (6.4%) | 0 (0.0%) |
| $150,000 or more | 0 (0.0%) | 0 (0.0%) |
| Total | 78 (100.0%) | 11 (100.0%) |
Monthly Housing Cost Tiers in Avant
| Monthly Cost | Owner-occupied | Renter-occupied |
| Less than $300 | 18 (23.1%) | 0 (0.0%) |
| $300 to $499 | 19 (24.4%) | 0 (0.0%) |
| $500 to $799 | 25 (32.1%) | 5 (45.5%) |
| $800 to $999 | 6 (7.7%) | 2 (18.2%) |
| $1,000 to $1,499 | 8 (10.3%) | 0 (0.0%) |
| $1,500 to $1,999 | 2 (2.6%) | 0 (0.0%) |
| $2,000 to $2,499 | 0 (0.0%) | 0 (0.0%) |
| $2,500 to $2,999 | 0 (0.0%) | 0 (0.0%) |
| $3,000 or more | 0 (0.0%) | 0 (0.0%) |
| Total | 78 (100.0%) | 11 (100.0%) |
Physical Housing Characteristics in Avant
Housing Structures in Avant
| Structure Type | # Housing Units | % Housing Units |
| Single Unit, Detached | 47 | 52.8% |
| Single Unit, Attached | 2 | 2.2% |
| 2 Unit Apartments | 0 | 0.0% |
| 3 or 4 Unit Apartments | 0 | 0.0% |
| 5 to 9 Unit Apartments | 0 | 0.0% |
| 10 or more Apartments | 0 | 0.0% |
| Mobile Home / Other | 40 | 44.9% |
| Total | 89 | 100.0% |
Housing Structures by Occupancy in Avant
| Structure Type | Owner-occupied | Renter-occupied |
| Single Unit, Detached | 44 (93.6%) | 3 (6.4%) |
| Single Unit, Attached | 2 (100.0%) | 0 (0.0%) |
| 2 Unit Apartments | 0 (0.0%) | 0 (0.0%) |
| 3 or 4 Unit Apartments | 0 (0.0%) | 0 (0.0%) |
| 5 to 9 Unit Apartments | 0 (0.0%) | 0 (0.0%) |
| 10 or more Apartments | 0 (0.0%) | 0 (0.0%) |
| Mobile Home / Other | 32 (80.0%) | 8 (20.0%) |
| Total | 78 (87.6%) | 11 (12.4%) |
Housing Structures by Number of Rooms in Avant
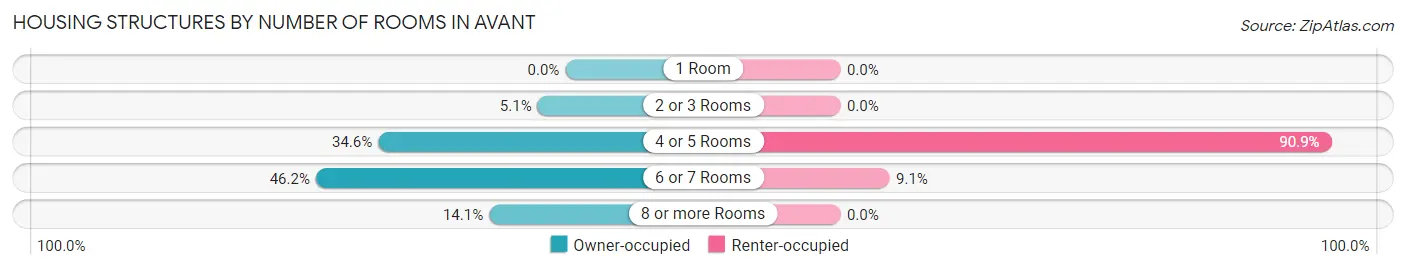
| Number of Rooms | Owner-occupied | Renter-occupied |
| 1 Room | 0 (0.0%) | 0 (0.0%) |
| 2 or 3 Rooms | 4 (5.1%) | 0 (0.0%) |
| 4 or 5 Rooms | 27 (34.6%) | 10 (90.9%) |
| 6 or 7 Rooms | 36 (46.2%) | 1 (9.1%) |
| 8 or more Rooms | 11 (14.1%) | 0 (0.0%) |
| Total | 78 (100.0%) | 11 (100.0%) |
Housing Structure by Heating Type in Avant
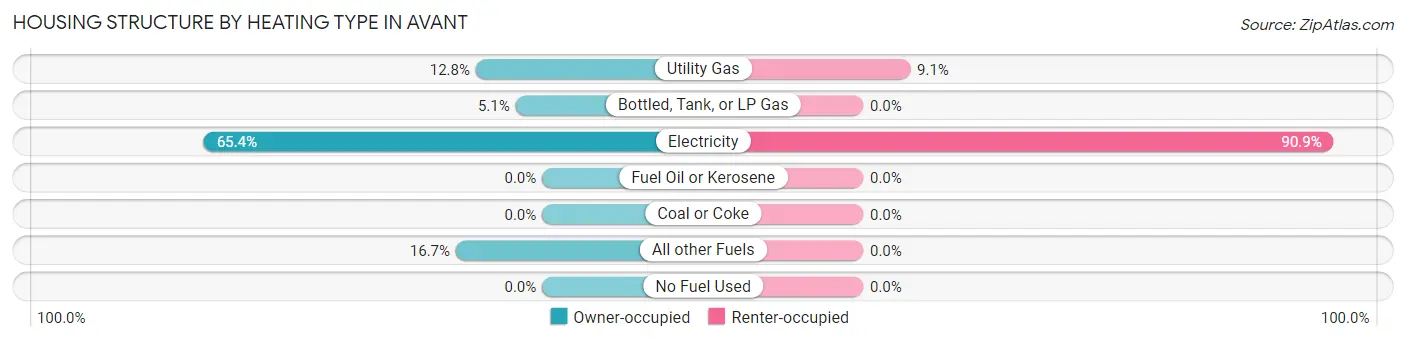
| Heating Type | Owner-occupied | Renter-occupied |
| Utility Gas | 10 (12.8%) | 1 (9.1%) |
| Bottled, Tank, or LP Gas | 4 (5.1%) | 0 (0.0%) |
| Electricity | 51 (65.4%) | 10 (90.9%) |
| Fuel Oil or Kerosene | 0 (0.0%) | 0 (0.0%) |
| Coal or Coke | 0 (0.0%) | 0 (0.0%) |
| All other Fuels | 13 (16.7%) | 0 (0.0%) |
| No Fuel Used | 0 (0.0%) | 0 (0.0%) |
| Total | 78 (100.0%) | 11 (100.0%) |
Household Vehicle Usage in Avant
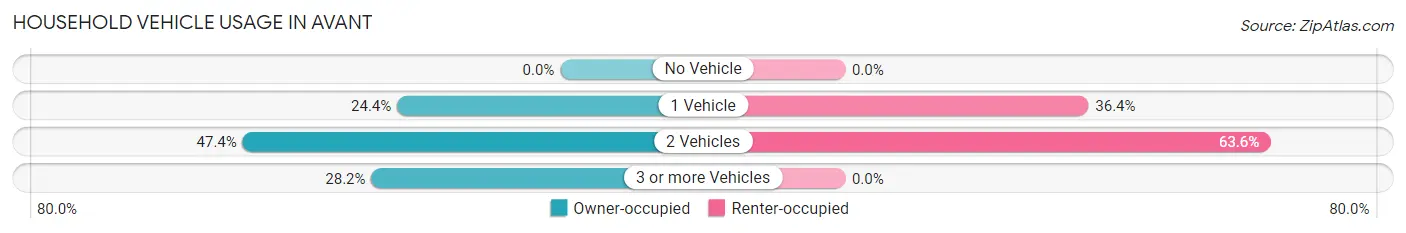
| Vehicles per Household | Owner-occupied | Renter-occupied |
| No Vehicle | 0 (0.0%) | 0 (0.0%) |
| 1 Vehicle | 19 (24.4%) | 4 (36.4%) |
| 2 Vehicles | 37 (47.4%) | 7 (63.6%) |
| 3 or more Vehicles | 22 (28.2%) | 0 (0.0%) |
| Total | 78 (100.0%) | 11 (100.0%) |
Real Estate & Mortgages in Avant
Real Estate and Mortgage Overview in Avant
| Characteristic | Without Mortgage | With Mortgage |
| Housing Units | 53 | 25 |
| Median Property Value | $55,000 | $68,300 |
| Median Household Income | $43,125 | $0 |
| Monthly Housing Costs | $382 | $0 |
| Real Estate Taxes | $275 | $0 |
Property Value by Mortgage Status in Avant
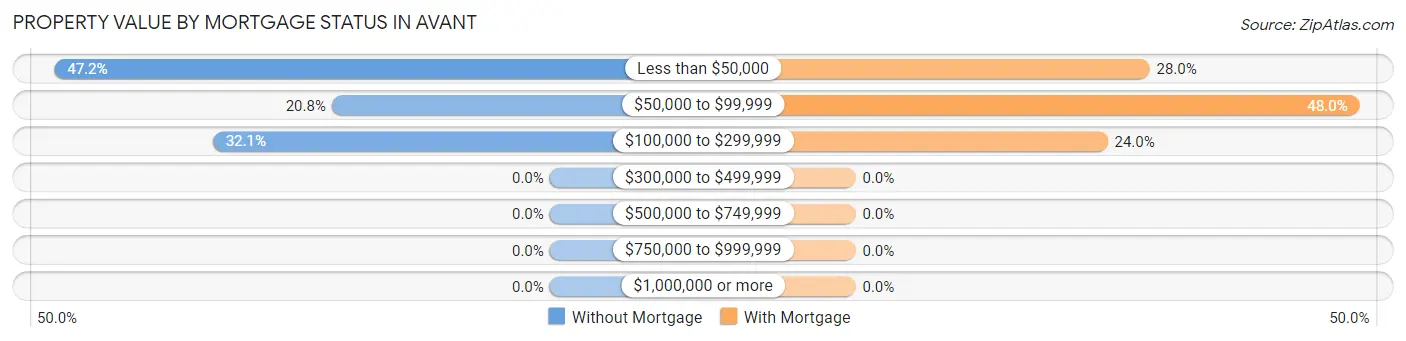
| Property Value | Without Mortgage | With Mortgage |
| Less than $50,000 | 25 (47.2%) | 7 (28.0%) |
| $50,000 to $99,999 | 11 (20.7%) | 12 (48.0%) |
| $100,000 to $299,999 | 17 (32.1%) | 6 (24.0%) |
| $300,000 to $499,999 | 0 (0.0%) | 0 (0.0%) |
| $500,000 to $749,999 | 0 (0.0%) | 0 (0.0%) |
| $750,000 to $999,999 | 0 (0.0%) | 0 (0.0%) |
| $1,000,000 or more | 0 (0.0%) | 0 (0.0%) |
| Total | 53 (100.0%) | 25 (100.0%) |
Household Income by Mortgage Status in Avant
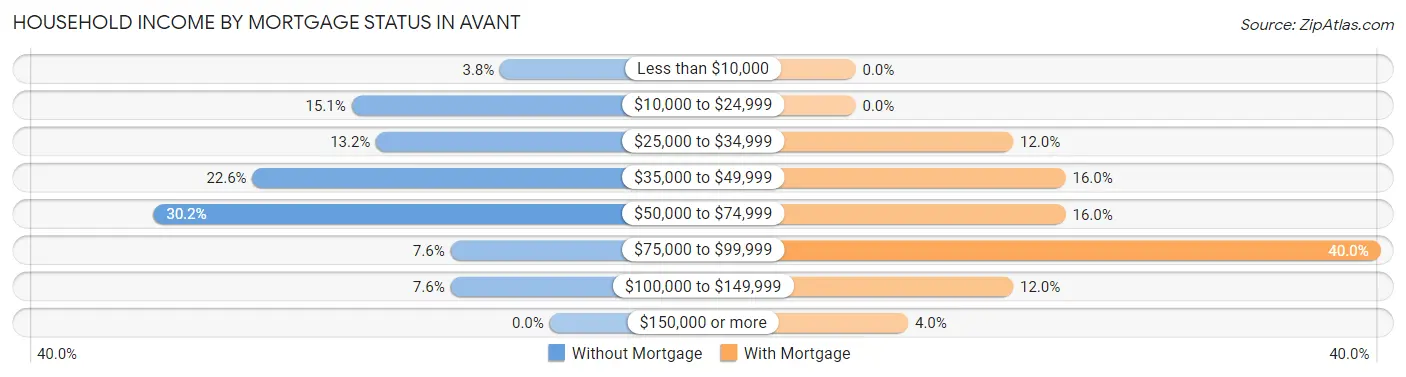
| Household Income | Without Mortgage | With Mortgage |
| Less than $10,000 | 2 (3.8%) | 0 (0.0%) |
| $10,000 to $24,999 | 8 (15.1%) | 0 (0.0%) |
| $25,000 to $34,999 | 7 (13.2%) | 3 (12.0%) |
| $35,000 to $49,999 | 12 (22.6%) | 4 (16.0%) |
| $50,000 to $74,999 | 16 (30.2%) | 4 (16.0%) |
| $75,000 to $99,999 | 4 (7.5%) | 10 (40.0%) |
| $100,000 to $149,999 | 4 (7.5%) | 3 (12.0%) |
| $150,000 or more | 0 (0.0%) | 1 (4.0%) |
| Total | 53 (100.0%) | 25 (100.0%) |
Property Value to Household Income Ratio in Avant
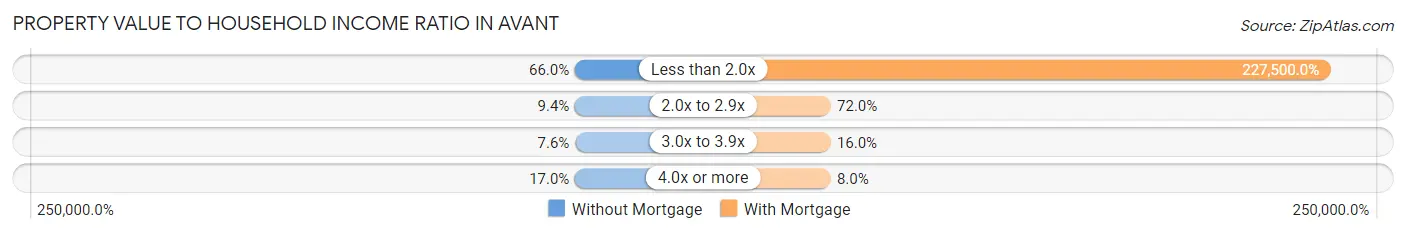
| Value-to-Income Ratio | Without Mortgage | With Mortgage |
| Less than 2.0x | 35 (66.0%) | 56,875 (227,500.0%) |
| 2.0x to 2.9x | 5 (9.4%) | 18 (72.0%) |
| 3.0x to 3.9x | 4 (7.5%) | 4 (16.0%) |
| 4.0x or more | 9 (17.0%) | 2 (8.0%) |
| Total | 53 (100.0%) | 25 (100.0%) |
Real Estate Taxes by Mortgage Status in Avant
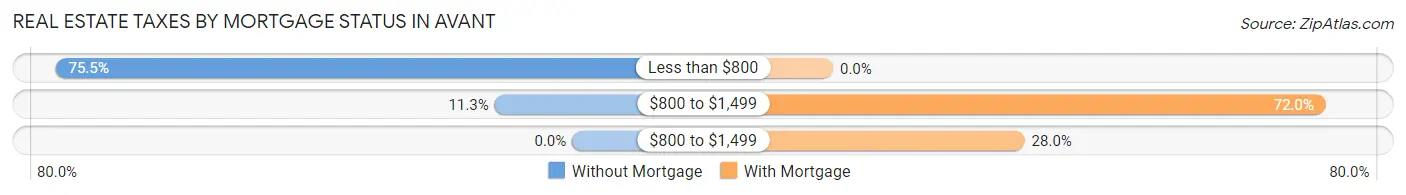
| Property Taxes | Without Mortgage | With Mortgage |
| Less than $800 | 40 (75.5%) | 0 (0.0%) |
| $800 to $1,499 | 6 (11.3%) | 18 (72.0%) |
| $800 to $1,499 | 0 (0.0%) | 7 (28.0%) |
| Total | 53 (100.0%) | 25 (100.0%) |
Health & Disability in Avant
Health Insurance Coverage by Age in Avant
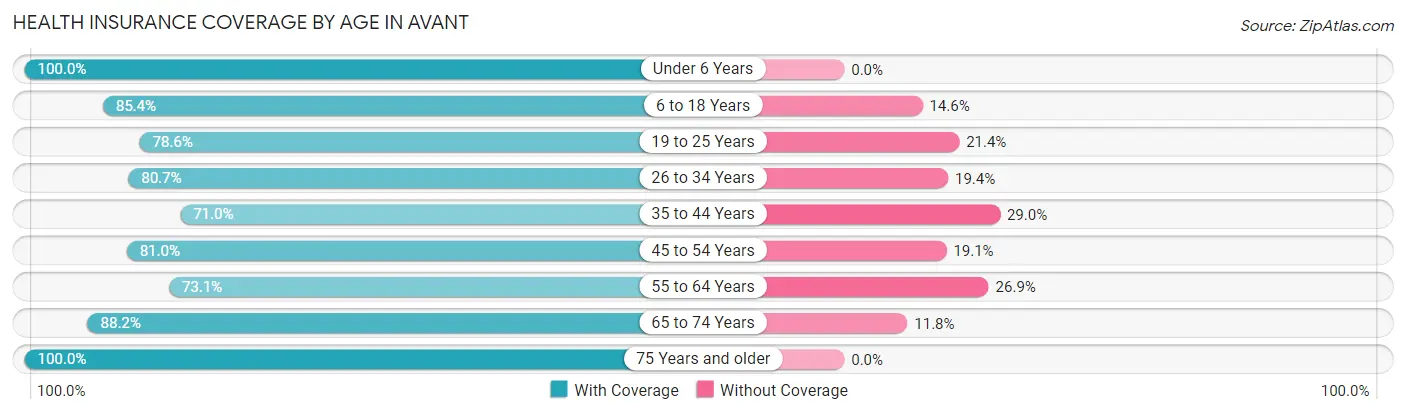
| Age Bracket | With Coverage | Without Coverage |
| Under 6 Years | 22 (100.0%) | 0 (0.0%) |
| 6 to 18 Years | 41 (85.4%) | 7 (14.6%) |
| 19 to 25 Years | 11 (78.6%) | 3 (21.4%) |
| 26 to 34 Years | 25 (80.6%) | 6 (19.4%) |
| 35 to 44 Years | 22 (71.0%) | 9 (29.0%) |
| 45 to 54 Years | 17 (80.9%) | 4 (19.1%) |
| 55 to 64 Years | 19 (73.1%) | 7 (26.9%) |
| 65 to 74 Years | 15 (88.2%) | 2 (11.8%) |
| 75 Years and older | 29 (100.0%) | 0 (0.0%) |
| Total | 201 (84.1%) | 38 (15.9%) |
Health Insurance Coverage by Citizenship Status in Avant
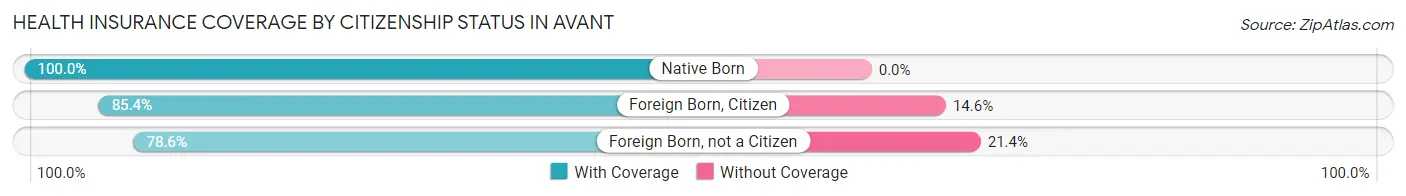
| Citizenship Status | With Coverage | Without Coverage |
| Native Born | 22 (100.0%) | 0 (0.0%) |
| Foreign Born, Citizen | 41 (85.4%) | 7 (14.6%) |
| Foreign Born, not a Citizen | 11 (78.6%) | 3 (21.4%) |
Health Insurance Coverage by Household Income in Avant
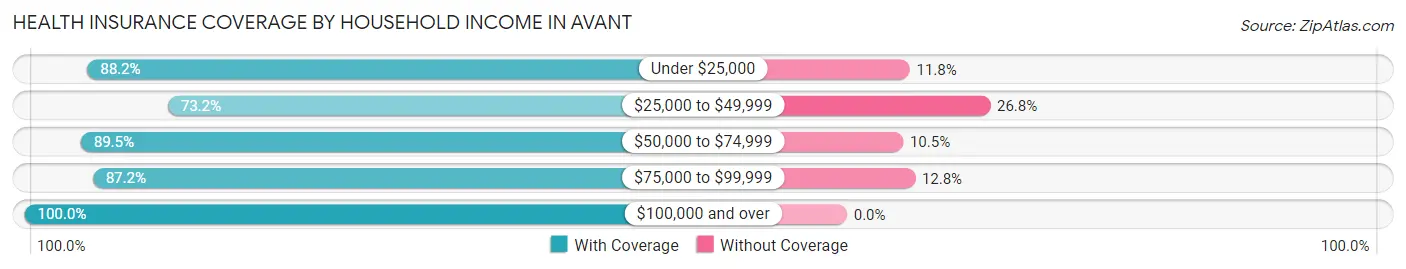
| Household Income | With Coverage | Without Coverage |
| Under $25,000 | 30 (88.2%) | 4 (11.8%) |
| $25,000 to $49,999 | 60 (73.2%) | 22 (26.8%) |
| $50,000 to $74,999 | 51 (89.5%) | 6 (10.5%) |
| $75,000 to $99,999 | 41 (87.2%) | 6 (12.8%) |
| $100,000 and over | 19 (100.0%) | 0 (0.0%) |
Public vs Private Health Insurance Coverage by Age in Avant
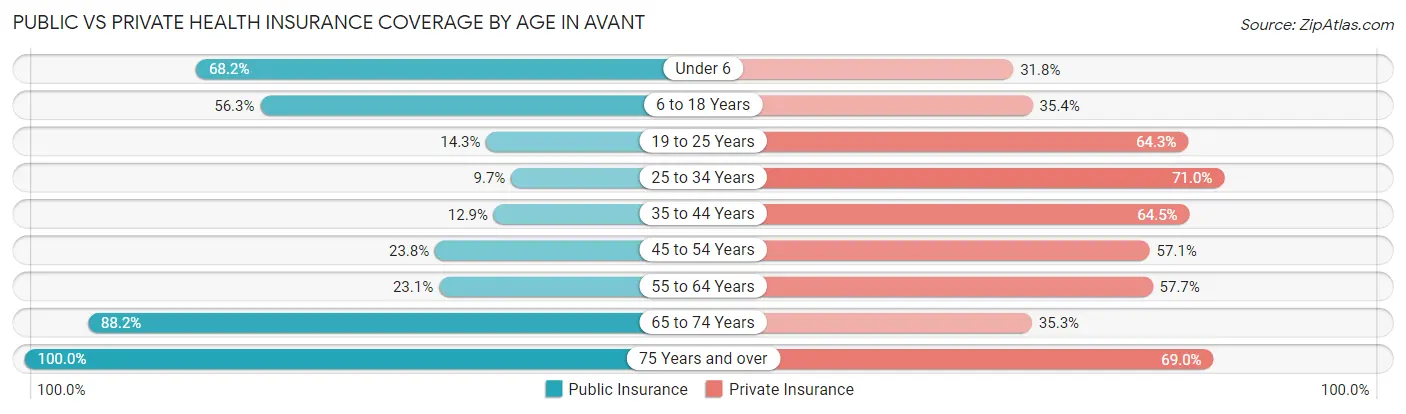
| Age Bracket | Public Insurance | Private Insurance |
| Under 6 | 15 (68.2%) | 7 (31.8%) |
| 6 to 18 Years | 27 (56.2%) | 17 (35.4%) |
| 19 to 25 Years | 2 (14.3%) | 9 (64.3%) |
| 25 to 34 Years | 3 (9.7%) | 22 (71.0%) |
| 35 to 44 Years | 4 (12.9%) | 20 (64.5%) |
| 45 to 54 Years | 5 (23.8%) | 12 (57.1%) |
| 55 to 64 Years | 6 (23.1%) | 15 (57.7%) |
| 65 to 74 Years | 15 (88.2%) | 6 (35.3%) |
| 75 Years and over | 29 (100.0%) | 20 (69.0%) |
| Total | 106 (44.4%) | 128 (53.6%) |
Disability Status by Sex by Age in Avant
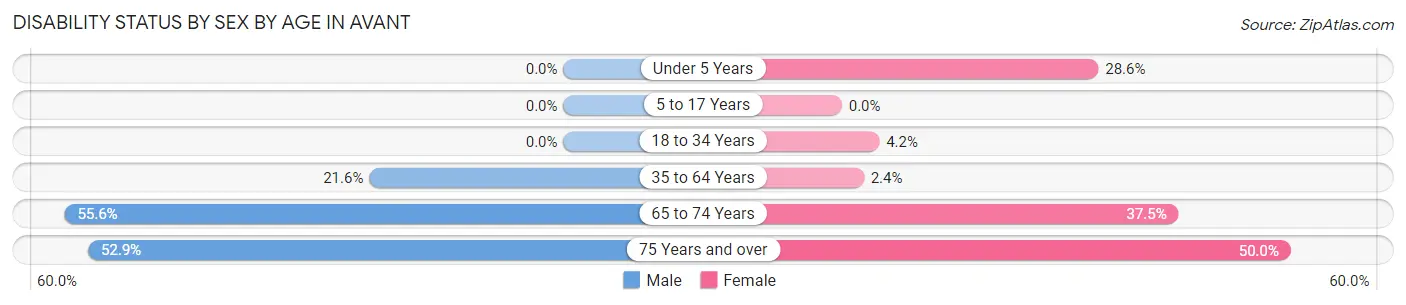
| Age Bracket | Male | Female |
| Under 5 Years | 0 (0.0%) | 4 (28.6%) |
| 5 to 17 Years | 0 (0.0%) | 0 (0.0%) |
| 18 to 34 Years | 0 (0.0%) | 1 (4.2%) |
| 35 to 64 Years | 8 (21.6%) | 1 (2.4%) |
| 65 to 74 Years | 5 (55.6%) | 3 (37.5%) |
| 75 Years and over | 9 (52.9%) | 6 (50.0%) |
Disability Class by Sex by Age in Avant
Disability Class: Hearing Difficulty
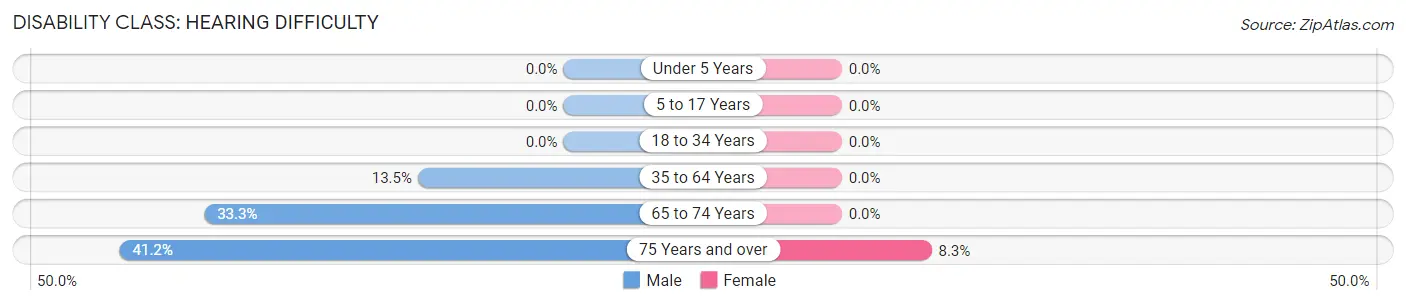
| Age Bracket | Male | Female |
| Under 5 Years | 0 (0.0%) | 0 (0.0%) |
| 5 to 17 Years | 0 (0.0%) | 0 (0.0%) |
| 18 to 34 Years | 0 (0.0%) | 0 (0.0%) |
| 35 to 64 Years | 5 (13.5%) | 0 (0.0%) |
| 65 to 74 Years | 3 (33.3%) | 0 (0.0%) |
| 75 Years and over | 7 (41.2%) | 1 (8.3%) |
Disability Class: Vision Difficulty
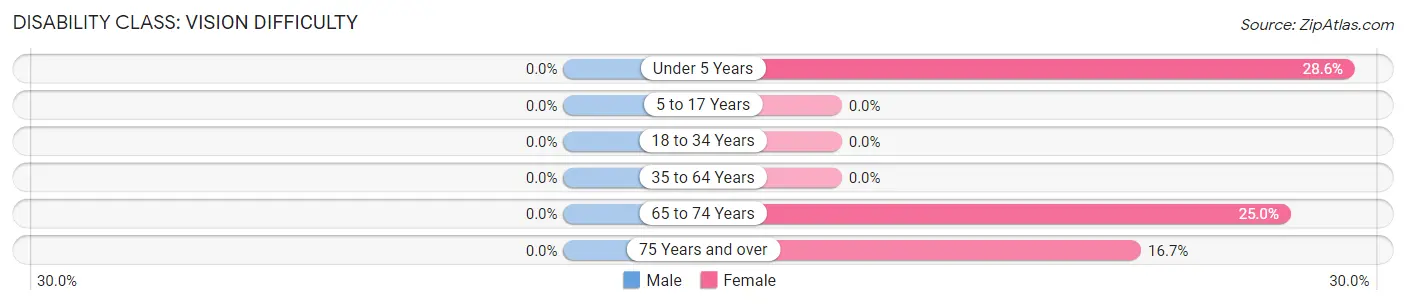
| Age Bracket | Male | Female |
| Under 5 Years | 0 (0.0%) | 4 (28.6%) |
| 5 to 17 Years | 0 (0.0%) | 0 (0.0%) |
| 18 to 34 Years | 0 (0.0%) | 0 (0.0%) |
| 35 to 64 Years | 0 (0.0%) | 0 (0.0%) |
| 65 to 74 Years | 0 (0.0%) | 2 (25.0%) |
| 75 Years and over | 0 (0.0%) | 2 (16.7%) |
Disability Class: Cognitive Difficulty
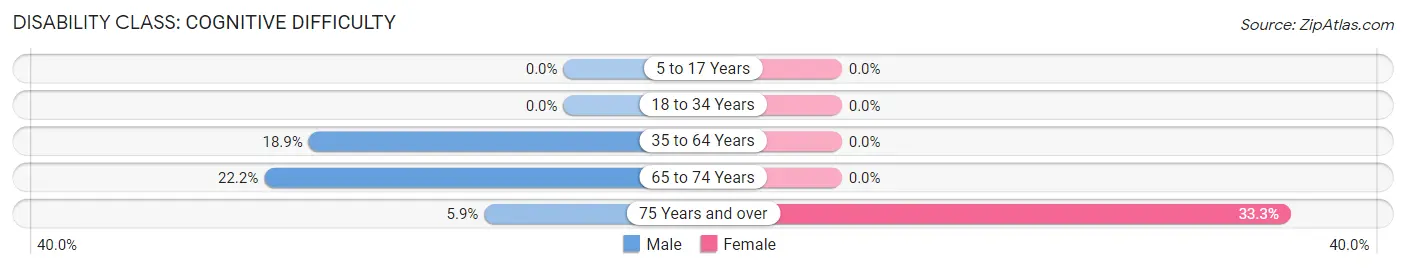
| Age Bracket | Male | Female |
| 5 to 17 Years | 0 (0.0%) | 0 (0.0%) |
| 18 to 34 Years | 0 (0.0%) | 0 (0.0%) |
| 35 to 64 Years | 7 (18.9%) | 0 (0.0%) |
| 65 to 74 Years | 2 (22.2%) | 0 (0.0%) |
| 75 Years and over | 1 (5.9%) | 4 (33.3%) |
Disability Class: Ambulatory Difficulty
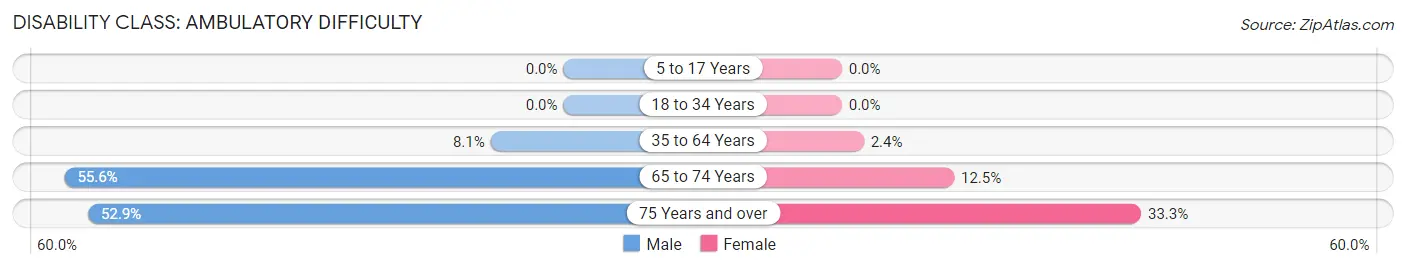
| Age Bracket | Male | Female |
| 5 to 17 Years | 0 (0.0%) | 0 (0.0%) |
| 18 to 34 Years | 0 (0.0%) | 0 (0.0%) |
| 35 to 64 Years | 3 (8.1%) | 1 (2.4%) |
| 65 to 74 Years | 5 (55.6%) | 1 (12.5%) |
| 75 Years and over | 9 (52.9%) | 4 (33.3%) |
Disability Class: Self-Care Difficulty
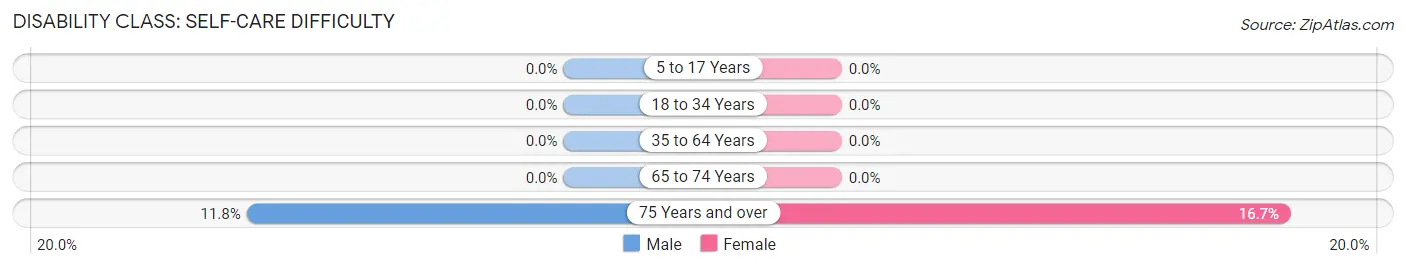
| Age Bracket | Male | Female |
| 5 to 17 Years | 0 (0.0%) | 0 (0.0%) |
| 18 to 34 Years | 0 (0.0%) | 0 (0.0%) |
| 35 to 64 Years | 0 (0.0%) | 0 (0.0%) |
| 65 to 74 Years | 0 (0.0%) | 0 (0.0%) |
| 75 Years and over | 2 (11.8%) | 2 (16.7%) |
Technology Access in Avant
Computing Device Access in Avant
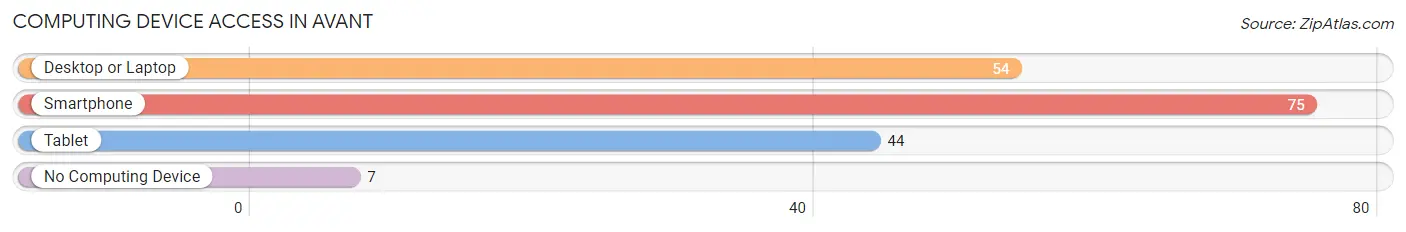
| Device Type | # Households | % Households |
| Desktop or Laptop | 54 | 60.7% |
| Smartphone | 75 | 84.3% |
| Tablet | 44 | 49.4% |
| No Computing Device | 7 | 7.9% |
| Total | 89 | 100.0% |
Internet Access in Avant
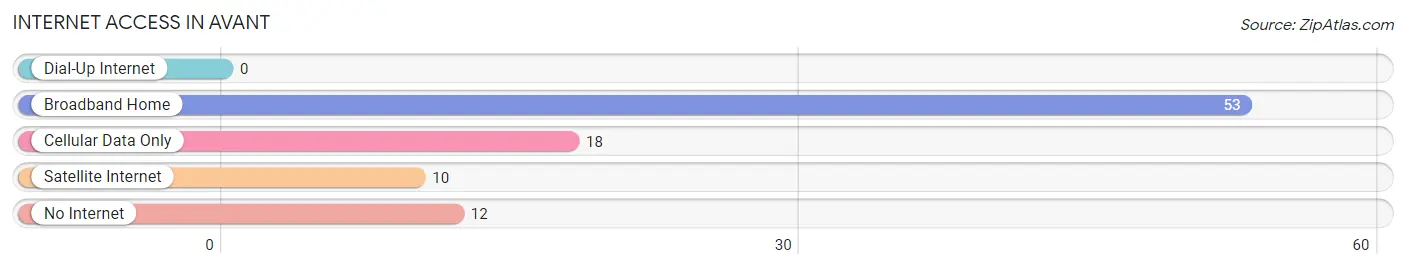
| Internet Type | # Households | % Households |
| Dial-Up Internet | 0 | 0.0% |
| Broadband Home | 53 | 59.6% |
| Cellular Data Only | 18 | 20.2% |
| Satellite Internet | 10 | 11.2% |
| No Internet | 12 | 13.5% |
| Total | 89 | 100.0% |
Avant Summary
Oklahoma is a state located in the South Central region of the United States. It is bordered by Texas to the south, Arkansas to the east, Kansas to the north, and Colorado and New Mexico to the west. Oklahoma is the 20th most populous state in the United States, with an estimated population of 3.9 million in 2019. It is the 28th largest state in terms of land area, covering an area of 69,899 square miles. Oklahoma is known for its diverse geography, ranging from the Great Plains in the west to the Ozark Mountains in the east.
History
The area that is now Oklahoma was originally inhabited by Native American tribes, including the Caddo, Comanche, Osage, and Quapaw. The region was part of the Louisiana Purchase in 1803, and was later organized as part of the Indian Territory in 1834. In 1889, the Oklahoma Territory was created, and in 1907, Oklahoma became the 46th state to join the Union.
During the early 20th century, Oklahoma experienced a period of rapid growth and development, fueled by the discovery of oil in the state. This period of growth was accompanied by a period of racial tension, as African Americans were denied access to many of the state’s economic opportunities. In the 1950s and 1960s, Oklahoma experienced a period of economic decline, as the state’s oil industry began to decline.
Geography
Oklahoma is located in the South Central region of the United States. It is bordered by Texas to the south, Arkansas to the east, Kansas to the north, and Colorado and New Mexico to the west. Oklahoma is the 28th largest state in terms of land area, covering an area of 69,899 square miles.
Oklahoma is known for its diverse geography, ranging from the Great Plains in the west to the Ozark Mountains in the east. The state is home to several major rivers, including the Arkansas, Canadian, and Red Rivers. Oklahoma is also home to several large lakes, including Lake Eufaula, Lake Texoma, and Lake Oologah.
Economy
Oklahoma’s economy is largely driven by the energy sector, with oil and natural gas production accounting for a significant portion of the state’s economic output. Other major industries in the state include agriculture, manufacturing, and tourism.
The state’s agricultural sector is largely focused on livestock production, with cattle, hogs, and poultry being the primary products. The state’s manufacturing sector is largely focused on the production of food products, machinery, and transportation equipment.
Demographics
As of 2019, Oklahoma had an estimated population of 3.9 million. The state’s population is largely concentrated in the Oklahoma City metropolitan area, which is home to over 1.3 million people.
The state’s population is largely composed of white (68.3%) and Native American (10.9%) residents. Other major racial groups in the state include African American (7.9%), Hispanic or Latino (7.7%), and Asian (2.2%) residents.
The state’s population is largely Christian (78.2%), with Protestant (50.2%) and Catholic (25.2%) being the two largest denominations. Other major religious groups in the state include Judaism (1.2%), Islam (0.7%), and Buddhism (0.3%).
Common Questions
What is Per Capita Income in Avant?
Per Capita income in Avant is $19,437.
What is the Median Family Income in Avant?
Median Family Income in Avant is $49,000.
What is the Median Household income in Avant?
Median Household Income in Avant is $48,250.
What is Income or Wage Gap in Avant?
Income or Wage Gap in Avant is 48.4%.
Women in Avant earn 51.6 cents for every dollar earned by a man.
What is Inequality or Gini Index in Avant?
Inequality or Gini Index in Avant is 0.32.
What is the Total Population of Avant?
Total Population of Avant is 239.
What is the Total Male Population of Avant?
Total Male Population of Avant is 126.
What is the Total Female Population of Avant?
Total Female Population of Avant is 113.
What is the Ratio of Males per 100 Females in Avant?
There are 111.50 Males per 100 Females in Avant.
What is the Ratio of Females per 100 Males in Avant?
There are 89.68 Females per 100 Males in Avant.
What is the Median Population Age in Avant?
Median Population Age in Avant is 35.8 Years.
What is the Average Family Size in Avant
Average Family Size in Avant is 3.3 People.
What is the Average Household Size in Avant
Average Household Size in Avant is 2.7 People.
How Large is the Labor Force in Avant?
There are 94 People in the Labor Forcein in Avant.
What is the Percentage of People in the Labor Force in Avant?
52.2% of People are in the Labor Force in Avant.
What is the Unemployment Rate in Avant?
Unemployment Rate in Avant is 2.1%.