Zip Codes with the Highest Percentage of Population Employed in Computer & Mathematics in Oklahoma
RELATED REPORTS & OPTIONS
Computer & Mathematics
Oklahoma
Compare Zip Codes
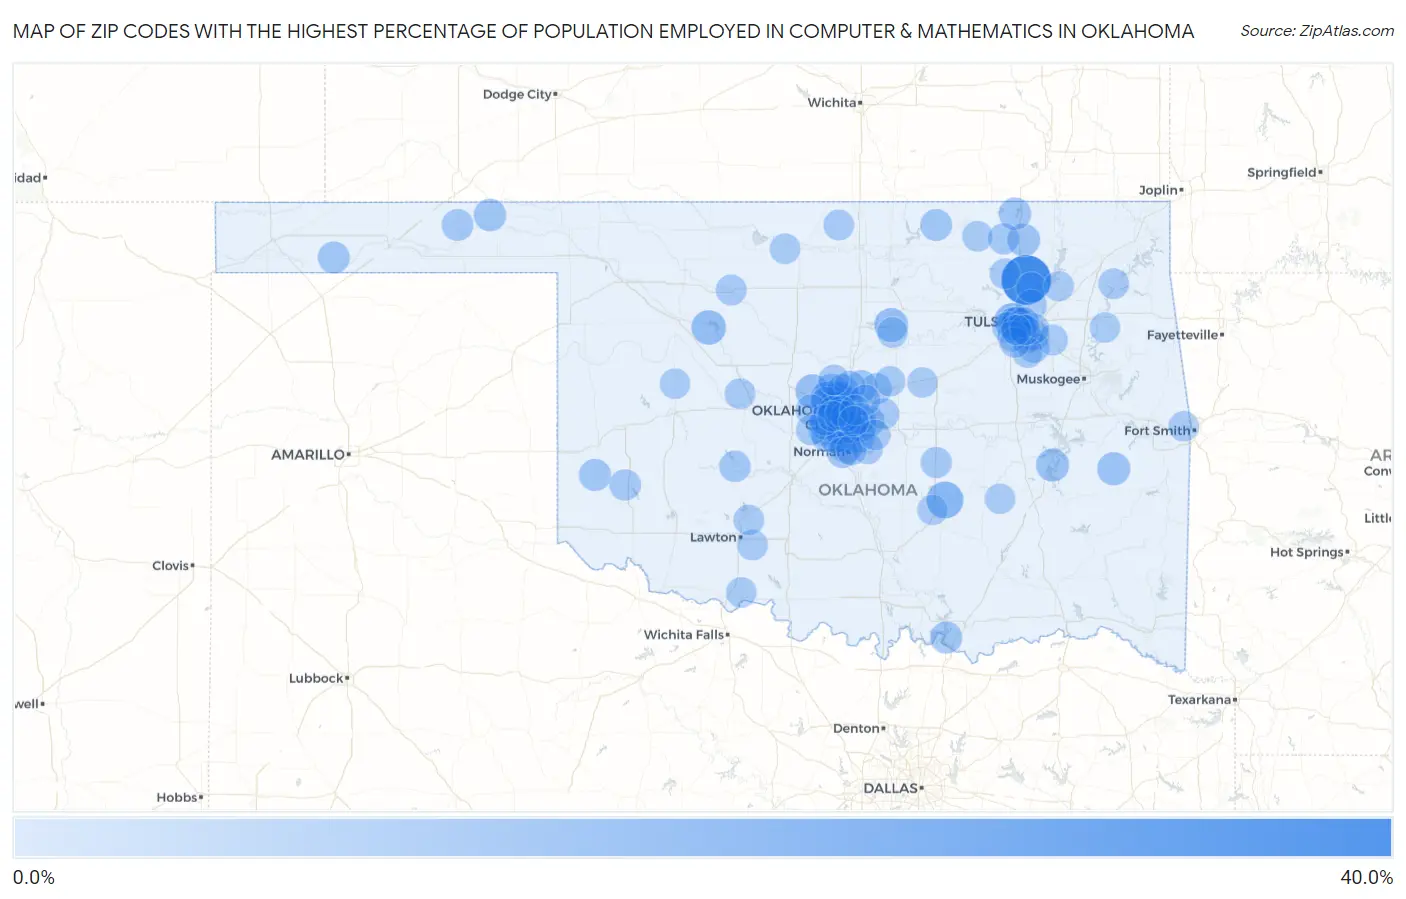
Map of Zip Codes with the Highest Percentage of Population Employed in Computer & Mathematics in Oklahoma
0.0%
40.0%
Zip Codes with the Highest Percentage of Population Employed in Computer & Mathematics in Oklahoma
| Zip Code | % Employed | vs State | vs National | |
| 1. | 74082 | 32.4% | 2.3%(+30.1)#1 | 3.5%(+28.9)#40 |
| 2. | 74844 | 12.2% | 2.3%(+9.90)#2 | 3.5%(+8.71)#419 |
| 3. | 73145 | 11.7% | 2.3%(+9.33)#3 | 3.5%(+8.13)#476 |
| 4. | 74103 | 11.5% | 2.3%(+9.15)#4 | 3.5%(+7.95)#496 |
| 5. | 73755 | 8.8% | 2.3%(+6.45)#5 | 3.5%(+5.25)#962 |
| 6. | 73078 | 8.0% | 2.3%(+5.63)#6 | 3.5%(+4.44)#1,220 |
| 7. | 74077 | 7.6% | 2.3%(+5.32)#7 | 3.5%(+4.12)#1,334 |
| 8. | 73131 | 7.1% | 2.3%(+4.74)#8 | 3.5%(+3.54)#1,587 |
| 9. | 73134 | 6.9% | 2.3%(+4.53)#9 | 3.5%(+3.33)#1,710 |
| 10. | 74943 | 6.7% | 2.3%(+4.34)#10 | 3.5%(+3.14)#1,824 |
| 11. | 74430 | 6.6% | 2.3%(+4.24)#11 | 3.5%(+3.04)#1,875 |
| 12. | 74119 | 6.5% | 2.3%(+4.13)#12 | 3.5%(+2.93)#1,967 |
| 13. | 73160 | 6.0% | 2.3%(+3.65)#13 | 3.5%(+2.45)#2,333 |
| 14. | 74006 | 6.0% | 2.3%(+3.63)#14 | 3.5%(+2.43)#2,349 |
| 15. | 73104 | 5.8% | 2.3%(+3.52)#15 | 3.5%(+2.32)#2,452 |
| 16. | 73169 | 5.7% | 2.3%(+3.38)#16 | 3.5%(+2.18)#2,576 |
| 17. | 73938 | 5.6% | 2.3%(+3.26)#17 | 3.5%(+2.06)#2,688 |
| 18. | 73165 | 5.5% | 2.3%(+3.16)#18 | 3.5%(+1.96)#2,804 |
| 19. | 74022 | 5.5% | 2.3%(+3.13)#19 | 3.5%(+1.93)#2,831 |
| 20. | 73012 | 5.4% | 2.3%(+3.12)#20 | 3.5%(+1.92)#2,848 |
| 21. | 73007 | 5.2% | 2.3%(+2.89)#21 | 3.5%(+1.69)#3,107 |
| 22. | 73673 | 5.0% | 2.3%(+2.67)#22 | 3.5%(+1.48)#3,351 |
| 23. | 73173 | 5.0% | 2.3%(+2.66)#23 | 3.5%(+1.46)#3,377 |
| 24. | 74120 | 5.0% | 2.3%(+2.64)#24 | 3.5%(+1.44)#3,399 |
| 25. | 74731 | 4.9% | 2.3%(+2.60)#25 | 3.5%(+1.40)#3,458 |
| 26. | 73013 | 4.9% | 2.3%(+2.59)#26 | 3.5%(+1.39)#3,475 |
| 27. | 73949 | 4.8% | 2.3%(+2.44)#27 | 3.5%(+1.24)#3,695 |
| 28. | 74652 | 4.7% | 2.3%(+2.41)#28 | 3.5%(+1.21)#3,740 |
| 29. | 73179 | 4.5% | 2.3%(+2.22)#29 | 3.5%(+1.02)#4,012 |
| 30. | 73069 | 4.5% | 2.3%(+2.14)#30 | 3.5%(+0.939)#4,150 |
| 31. | 73120 | 4.4% | 2.3%(+2.10)#31 | 3.5%(+0.900)#4,232 |
| 32. | 73950 | 4.4% | 2.3%(+2.06)#32 | 3.5%(+0.861)#4,287 |
| 33. | 73142 | 4.4% | 2.3%(+2.04)#33 | 3.5%(+0.845)#4,319 |
| 34. | 73116 | 4.3% | 2.3%(+2.00)#34 | 3.5%(+0.798)#4,388 |
| 35. | 73162 | 4.3% | 2.3%(+1.93)#35 | 3.5%(+0.734)#4,497 |
| 36. | 74133 | 4.2% | 2.3%(+1.88)#36 | 3.5%(+0.681)#4,599 |
| 37. | 73003 | 4.0% | 2.3%(+1.71)#37 | 3.5%(+0.509)#4,960 |
| 38. | 73020 | 4.0% | 2.3%(+1.71)#38 | 3.5%(+0.508)#4,966 |
| 39. | 73038 | 4.0% | 2.3%(+1.70)#39 | 3.5%(+0.499)#4,985 |
| 40. | 73547 | 4.0% | 2.3%(+1.67)#40 | 3.5%(+0.475)#5,042 |
| 41. | 74104 | 3.9% | 2.3%(+1.59)#41 | 3.5%(+0.390)#5,225 |
| 42. | 73099 | 3.8% | 2.3%(+1.46)#42 | 3.5%(+0.262)#5,520 |
| 43. | 74003 | 3.8% | 2.3%(+1.43)#43 | 3.5%(+0.233)#5,576 |
| 44. | 73054 | 3.7% | 2.3%(+1.42)#44 | 3.5%(+0.224)#5,600 |
| 45. | 73150 | 3.7% | 2.3%(+1.39)#45 | 3.5%(+0.192)#5,682 |
| 46. | 73139 | 3.7% | 2.3%(+1.38)#46 | 3.5%(+0.182)#5,705 |
| 47. | 74830 | 3.6% | 2.3%(+1.31)#47 | 3.5%(+0.112)#5,878 |
| 48. | 73130 | 3.6% | 2.3%(+1.30)#48 | 3.5%(+0.100)#5,906 |
| 49. | 73034 | 3.6% | 2.3%(+1.27)#49 | 3.5%(+0.072)#5,963 |
| 50. | 74055 | 3.5% | 2.3%(+1.22)#50 | 3.5%(+0.024)#6,074 |
| 51. | 74012 | 3.5% | 2.3%(+1.20)#51 | 3.5%(-0.003)#6,153 |
| 52. | 73170 | 3.5% | 2.3%(+1.19)#52 | 3.5%(-0.004)#6,157 |
| 53. | 73135 | 3.5% | 2.3%(+1.15)#53 | 3.5%(-0.050)#6,269 |
| 54. | 74011 | 3.4% | 2.3%(+1.12)#54 | 3.5%(-0.078)#6,354 |
| 55. | 73112 | 3.4% | 2.3%(+1.12)#55 | 3.5%(-0.080)#6,357 |
| 56. | 73072 | 3.4% | 2.3%(+1.12)#56 | 3.5%(-0.081)#6,362 |
| 57. | 73128 | 3.4% | 2.3%(+1.10)#57 | 3.5%(-0.098)#6,402 |
| 58. | 73045 | 3.4% | 2.3%(+1.07)#58 | 3.5%(-0.133)#6,504 |
| 59. | 73049 | 3.3% | 2.3%(+0.974)#59 | 3.5%(-0.225)#6,782 |
| 60. | 73103 | 3.3% | 2.3%(+0.967)#60 | 3.5%(-0.232)#6,805 |
| 61. | 73026 | 3.3% | 2.3%(+0.926)#61 | 3.5%(-0.273)#6,931 |
| 62. | 74014 | 3.2% | 2.3%(+0.860)#62 | 3.5%(-0.339)#7,140 |
| 63. | 74135 | 3.2% | 2.3%(+0.858)#63 | 3.5%(-0.341)#7,143 |
| 64. | 74636 | 3.1% | 2.3%(+0.767)#64 | 3.5%(-0.432)#7,429 |
| 65. | 73501 | 3.1% | 2.3%(+0.747)#65 | 3.5%(-0.452)#7,492 |
| 66. | 73025 | 3.1% | 2.3%(+0.736)#66 | 3.5%(-0.463)#7,519 |
| 67. | 74134 | 3.0% | 2.3%(+0.719)#67 | 3.5%(-0.479)#7,577 |
| 68. | 73071 | 3.0% | 2.3%(+0.719)#68 | 3.5%(-0.480)#7,580 |
| 69. | 73729 | 3.0% | 2.3%(+0.718)#69 | 3.5%(-0.481)#7,585 |
| 70. | 74107 | 3.0% | 2.3%(+0.664)#70 | 3.5%(-0.535)#7,779 |
| 71. | 73117 | 3.0% | 2.3%(+0.658)#71 | 3.5%(-0.541)#7,806 |
| 72. | 73538 | 3.0% | 2.3%(+0.653)#72 | 3.5%(-0.545)#7,816 |
| 73. | 74112 | 3.0% | 2.3%(+0.650)#73 | 3.5%(-0.548)#7,824 |
| 74. | 74367 | 3.0% | 2.3%(+0.628)#74 | 3.5%(-0.571)#7,922 |
| 75. | 74008 | 2.9% | 2.3%(+0.591)#75 | 3.5%(-0.608)#8,049 |
| 76. | 74857 | 2.9% | 2.3%(+0.583)#76 | 3.5%(-0.616)#8,072 |
| 77. | 73040 | 2.9% | 2.3%(+0.567)#77 | 3.5%(-0.631)#8,128 |
| 78. | 74056 | 2.8% | 2.3%(+0.504)#78 | 3.5%(-0.695)#8,350 |
| 79. | 73064 | 2.8% | 2.3%(+0.495)#79 | 3.5%(-0.704)#8,375 |
| 80. | 74001 | 2.8% | 2.3%(+0.491)#80 | 3.5%(-0.708)#8,387 |
| 81. | 73105 | 2.8% | 2.3%(+0.482)#81 | 3.5%(-0.717)#8,418 |
| 82. | 73107 | 2.8% | 2.3%(+0.462)#82 | 3.5%(-0.736)#8,497 |
| 83. | 74132 | 2.8% | 2.3%(+0.462)#83 | 3.5%(-0.737)#8,500 |
| 84. | 74074 | 2.8% | 2.3%(+0.451)#84 | 3.5%(-0.748)#8,540 |
| 85. | 73761 | 2.7% | 2.3%(+0.401)#85 | 3.5%(-0.797)#8,723 |
| 86. | 74021 | 2.7% | 2.3%(+0.393)#86 | 3.5%(-0.806)#8,754 |
| 87. | 74570 | 2.7% | 2.3%(+0.370)#87 | 3.5%(-0.829)#8,836 |
| 88. | 73639 | 2.7% | 2.3%(+0.370)#88 | 3.5%(-0.829)#8,838 |
| 89. | 74037 | 2.7% | 2.3%(+0.340)#89 | 3.5%(-0.858)#8,964 |
| 90. | 74352 | 2.6% | 2.3%(+0.317)#90 | 3.5%(-0.881)#9,049 |
| 91. | 73141 | 2.6% | 2.3%(+0.313)#91 | 3.5%(-0.886)#9,069 |
| 92. | 73562 | 2.6% | 2.3%(+0.297)#92 | 3.5%(-0.902)#9,135 |
| 93. | 74881 | 2.6% | 2.3%(+0.290)#93 | 3.5%(-0.909)#9,155 |
| 94. | 73110 | 2.6% | 2.3%(+0.285)#94 | 3.5%(-0.914)#9,164 |
| 95. | 74145 | 2.6% | 2.3%(+0.279)#95 | 3.5%(-0.919)#9,192 |
| 96. | 74820 | 2.6% | 2.3%(+0.243)#96 | 3.5%(-0.955)#9,329 |
| 97. | 74105 | 2.6% | 2.3%(+0.229)#97 | 3.5%(-0.969)#9,404 |
| 98. | 74017 | 2.6% | 2.3%(+0.227)#98 | 3.5%(-0.971)#9,410 |
| 99. | 74954 | 2.5% | 2.3%(+0.214)#99 | 3.5%(-0.984)#9,462 |
| 100. | 74026 | 2.5% | 2.3%(+0.188)#100 | 3.5%(-1.01)#9,585 |
Common Questions
What are the Top 10 Zip Codes with the Highest Percentage of Population Employed in Computer & Mathematics in Oklahoma?
Top 10 Zip Codes with the Highest Percentage of Population Employed in Computer & Mathematics in Oklahoma are:
What zip code has the Highest Percentage of Population Employed in Computer & Mathematics in Oklahoma?
74082 has the Highest Percentage of Population Employed in Computer & Mathematics in Oklahoma with 32.4%.
What is the Percentage of Population Employed in Computer & Mathematics in the State of Oklahoma?
Percentage of Population Employed in Computer & Mathematics in Oklahoma is 2.3%.
What is the Percentage of Population Employed in Computer & Mathematics in the United States?
Percentage of Population Employed in Computer & Mathematics in the United States is 3.5%.