Wayne, OK Map & Demographics
Wayne Map
Wayne Overview
$24,487
PER CAPITA INCOME
$78,819
AVG FAMILY INCOME
$60,865
AVG HOUSEHOLD INCOME
0.6%
WAGE / INCOME GAP [ % ]
99.4¢/ $1
WAGE / INCOME GAP [ $ ]
0.40
INEQUALITY / GINI INDEX
811
TOTAL POPULATION
407
MALE POPULATION
404
FEMALE POPULATION
100.74
MALES / 100 FEMALES
99.26
FEMALES / 100 MALES
26.8
MEDIAN AGE
2.8
AVG FAMILY SIZE
2.7
AVG HOUSEHOLD SIZE
363
LABOR FORCE [ PEOPLE ]
58.6%
PERCENT IN LABOR FORCE
0.6%
UNEMPLOYMENT RATE
Wayne Zip Codes
Wayne Area Codes
Income in Wayne
Income Overview in Wayne
Per Capita Income in Wayne is $24,487, while median incomes of families and households are $78,819 and $60,865 respectively.
| Characteristic | Number | Measure |
| Per Capita Income | 811 | $24,487 |
| Median Family Income | 229 | $78,819 |
| Mean Family Income | 229 | $84,762 |
| Median Household Income | 305 | $60,865 |
| Mean Household Income | 305 | $74,816 |
| Income Deficit | 229 | $0 |
| Wage / Income Gap (%) | 811 | 0.61% |
| Wage / Income Gap ($) | 811 | 99.39¢ per $1 |
| Gini / Inequality Index | 811 | 0.40 |
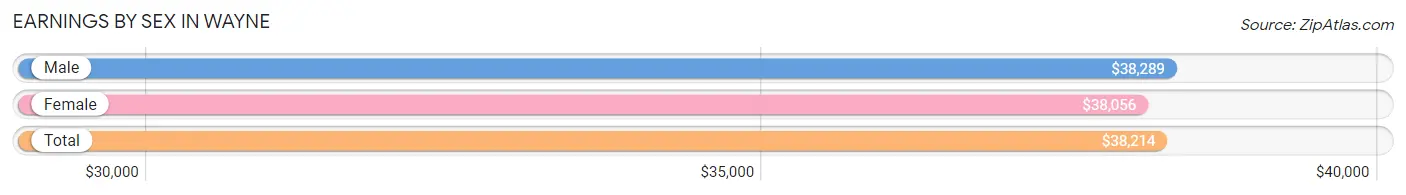
Earnings by Sex in Wayne
Average Earnings in Wayne are $38,214, $38,289 for men and $38,056 for women, a difference of 0.6%.
| Sex | Number | Average Earnings |
| Male | 218 (58.9%) | $38,289 |
| Female | 152 (41.1%) | $38,056 |
| Total | 370 (100.0%) | $38,214 |
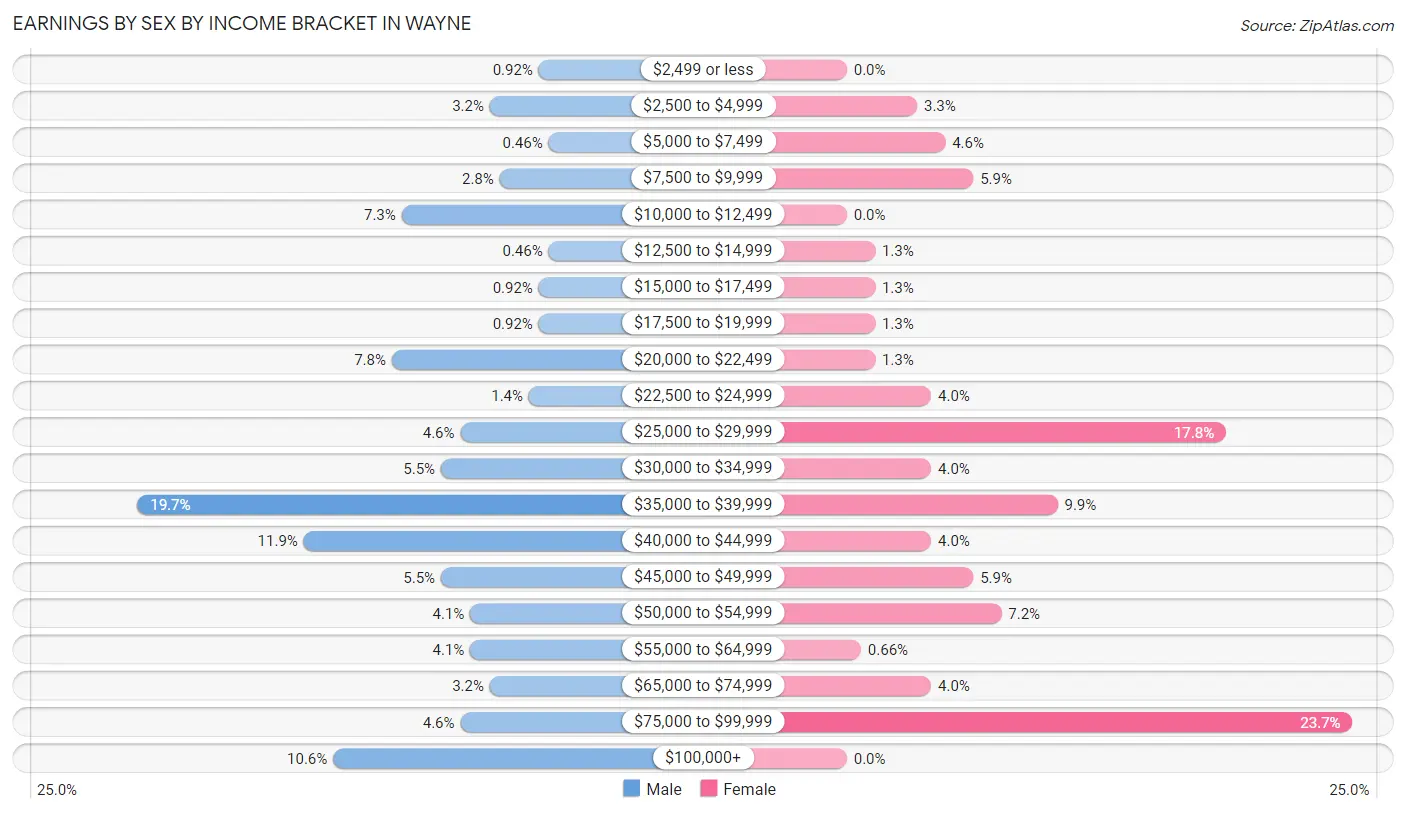
Earnings by Sex by Income Bracket in Wayne
The most common earnings brackets in Wayne are $35,000 to $39,999 for men (43 | 19.7%) and $75,000 to $99,999 for women (36 | 23.7%).
| Income | Male | Female |
| $2,499 or less | 2 (0.9%) | 0 (0.0%) |
| $2,500 to $4,999 | 7 (3.2%) | 5 (3.3%) |
| $5,000 to $7,499 | 1 (0.5%) | 7 (4.6%) |
| $7,500 to $9,999 | 6 (2.8%) | 9 (5.9%) |
| $10,000 to $12,499 | 16 (7.3%) | 0 (0.0%) |
| $12,500 to $14,999 | 1 (0.5%) | 2 (1.3%) |
| $15,000 to $17,499 | 2 (0.9%) | 2 (1.3%) |
| $17,500 to $19,999 | 2 (0.9%) | 2 (1.3%) |
| $20,000 to $22,499 | 17 (7.8%) | 2 (1.3%) |
| $22,500 to $24,999 | 3 (1.4%) | 6 (4.0%) |
| $25,000 to $29,999 | 10 (4.6%) | 27 (17.8%) |
| $30,000 to $34,999 | 12 (5.5%) | 6 (4.0%) |
| $35,000 to $39,999 | 43 (19.7%) | 15 (9.9%) |
| $40,000 to $44,999 | 26 (11.9%) | 6 (4.0%) |
| $45,000 to $49,999 | 12 (5.5%) | 9 (5.9%) |
| $50,000 to $54,999 | 9 (4.1%) | 11 (7.2%) |
| $55,000 to $64,999 | 9 (4.1%) | 1 (0.7%) |
| $65,000 to $74,999 | 7 (3.2%) | 6 (4.0%) |
| $75,000 to $99,999 | 10 (4.6%) | 36 (23.7%) |
| $100,000+ | 23 (10.5%) | 0 (0.0%) |
| Total | 218 (100.0%) | 152 (100.0%) |
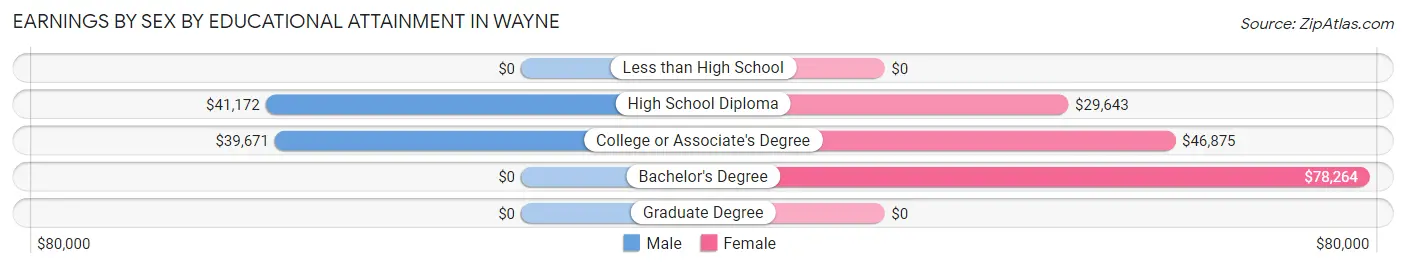
Earnings by Sex by Educational Attainment in Wayne
Average earnings in Wayne are $41,875 for men and $45,625 for women, a difference of 8.2%. Men with an educational attainment of high school diploma enjoy the highest average annual earnings of $41,172, while those with college or associate's degree education earn the least with $39,671. Women with an educational attainment of bachelor's degree earn the most with the average annual earnings of $78,264, while those with high school diploma education have the smallest earnings of $29,643.
| Educational Attainment | Male Income | Female Income |
| Less than High School | - | - |
| High School Diploma | $41,172 | $29,643 |
| College or Associate's Degree | $39,671 | $46,875 |
| Bachelor's Degree | - | - |
| Graduate Degree | - | - |
| Total | $41,875 | $45,625 |
Family Income in Wayne
Family Income Brackets in Wayne
According to the Wayne family income data, there are 55 families falling into the $100,000 to $149,999 income range, which is the most common income bracket and makes up 24.0% of all families. Conversely, the $200,000+ income bracket is the least frequent group with only 4 families (1.8%) belonging to this category.
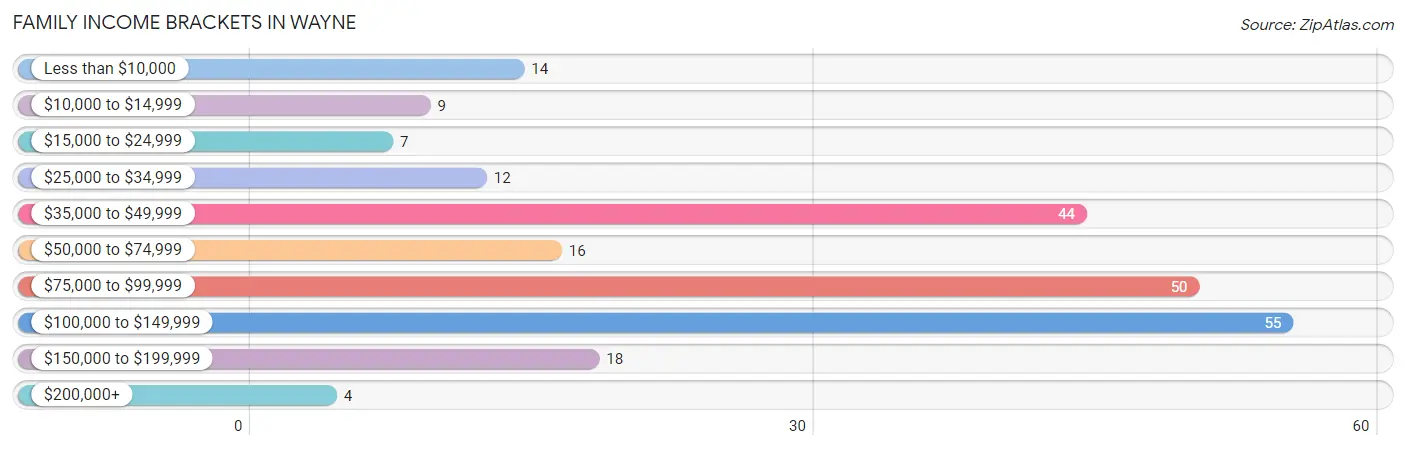
| Income Bracket | # Families | % Families |
| Less than $10,000 | 14 | 6.1% |
| $10,000 to $14,999 | 9 | 3.9% |
| $15,000 to $24,999 | 7 | 3.1% |
| $25,000 to $34,999 | 12 | 5.2% |
| $35,000 to $49,999 | 44 | 19.2% |
| $50,000 to $74,999 | 16 | 7.0% |
| $75,000 to $99,999 | 50 | 21.8% |
| $100,000 to $149,999 | 55 | 24.0% |
| $150,000 to $199,999 | 18 | 7.9% |
| $200,000+ | 4 | 1.7% |
Family Income by Famaliy Size in Wayne
2-person families (72 | 31.4%) account for the highest median family income in Wayne with $88,214 per family, while 2-person families (72 | 31.4%) have the highest median income of $44,107 per family member.
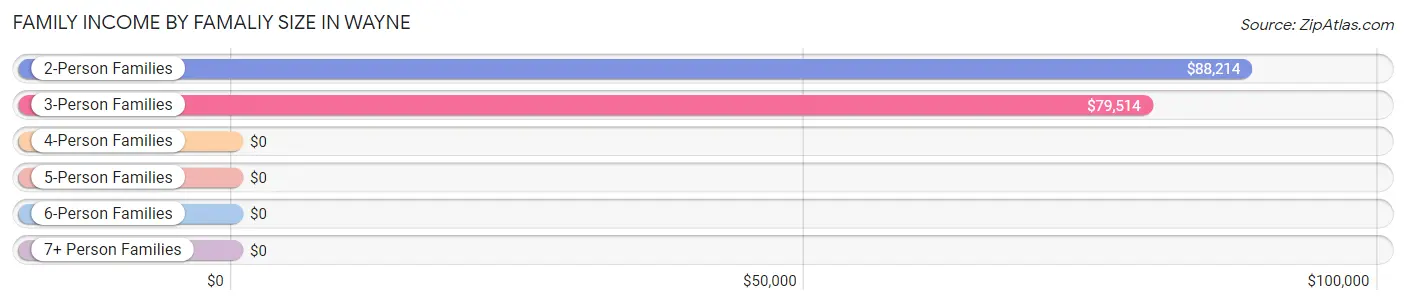
| Income Bracket | # Families | Median Income |
| 2-Person Families | 72 (31.4%) | $88,214 |
| 3-Person Families | 93 (40.6%) | $79,514 |
| 4-Person Families | 52 (22.7%) | $0 |
| 5-Person Families | 11 (4.8%) | $0 |
| 6-Person Families | 0 (0.0%) | $0 |
| 7+ Person Families | 1 (0.4%) | $0 |
| Total | 229 (100.0%) | $78,819 |
Family Income by Number of Earners in Wayne
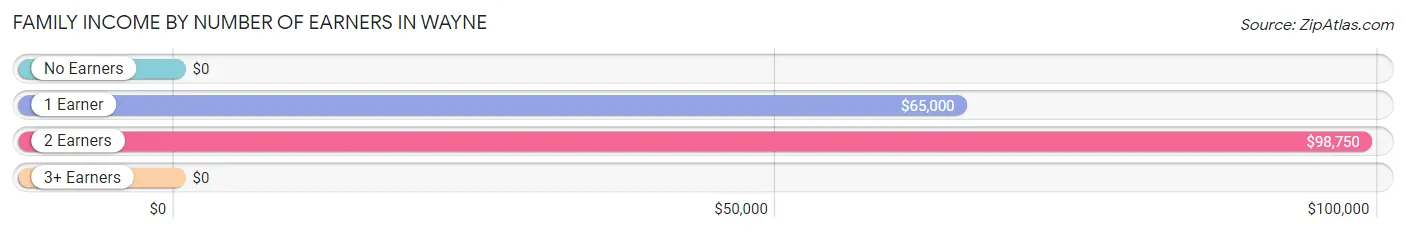
| Number of Earners | # Families | Median Income |
| No Earners | 17 (7.4%) | $0 |
| 1 Earner | 122 (53.3%) | $65,000 |
| 2 Earners | 83 (36.2%) | $98,750 |
| 3+ Earners | 7 (3.1%) | $0 |
| Total | 229 (100.0%) | $78,819 |
Household Income in Wayne
Household Income Brackets in Wayne
With 57 households falling in the category, the $75,000 to $99,999 income range is the most frequent in Wayne, accounting for 18.7% of all households. In contrast, only 4 households (1.3%) fall into the $200,000+ income bracket, making it the least populous group.
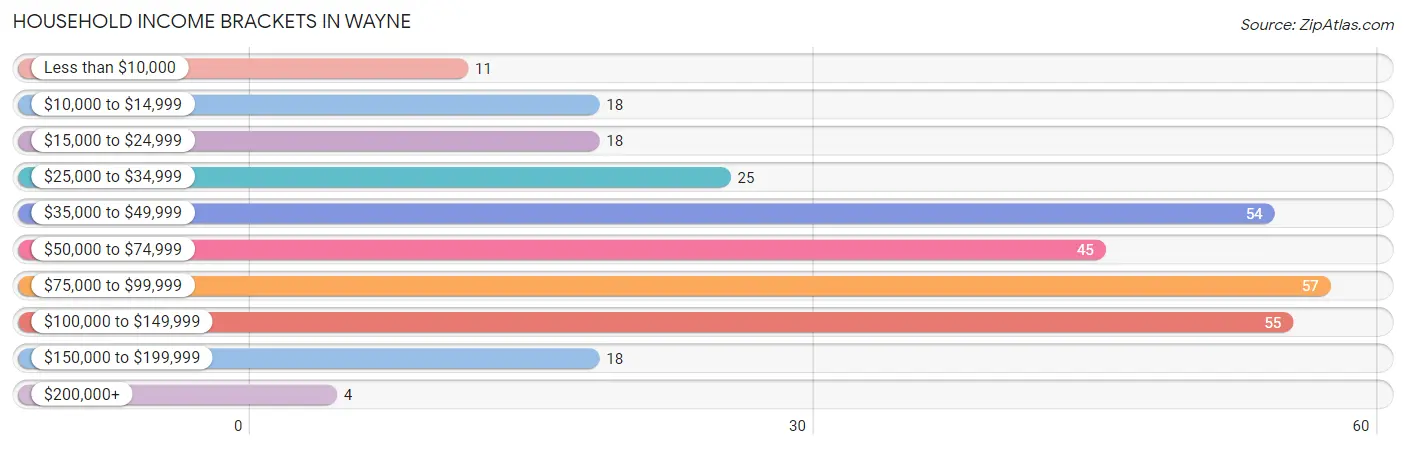
| Income Bracket | # Households | % Households |
| Less than $10,000 | 11 | 3.6% |
| $10,000 to $14,999 | 18 | 5.9% |
| $15,000 to $24,999 | 18 | 5.9% |
| $25,000 to $34,999 | 25 | 8.2% |
| $35,000 to $49,999 | 54 | 17.7% |
| $50,000 to $74,999 | 45 | 14.8% |
| $75,000 to $99,999 | 57 | 18.7% |
| $100,000 to $149,999 | 55 | 18.0% |
| $150,000 to $199,999 | 18 | 5.9% |
| $200,000+ | 4 | 1.3% |
Household Income by Householder Age in Wayne
The median household income in Wayne is $60,865, with the highest median household income of $88,214 found in the 45 to 64 years age bracket for the primary householder. A total of 88 households (28.8%) fall into this category. Meanwhile, the 15 to 24 years age bracket for the primary householder has the lowest median household income of $0, with 67 households (22.0%) in this group.
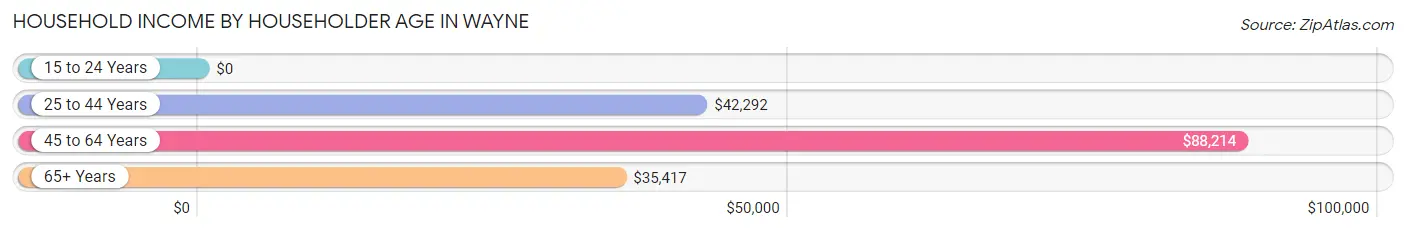
| Income Bracket | # Households | Median Income |
| 15 to 24 Years | 67 (22.0%) | $0 |
| 25 to 44 Years | 107 (35.1%) | $42,292 |
| 45 to 64 Years | 88 (28.8%) | $88,214 |
| 65+ Years | 43 (14.1%) | $35,417 |
| Total | 305 (100.0%) | $60,865 |
Poverty in Wayne
Income Below Poverty by Sex and Age in Wayne
With 19.4% poverty level for males and 25.8% for females among the residents of Wayne, 5 year old males and 16 and 17 year old females are the most vulnerable to poverty, with 8 males (100.0%) and 6 females (60.0%) in their respective age groups living below the poverty level.
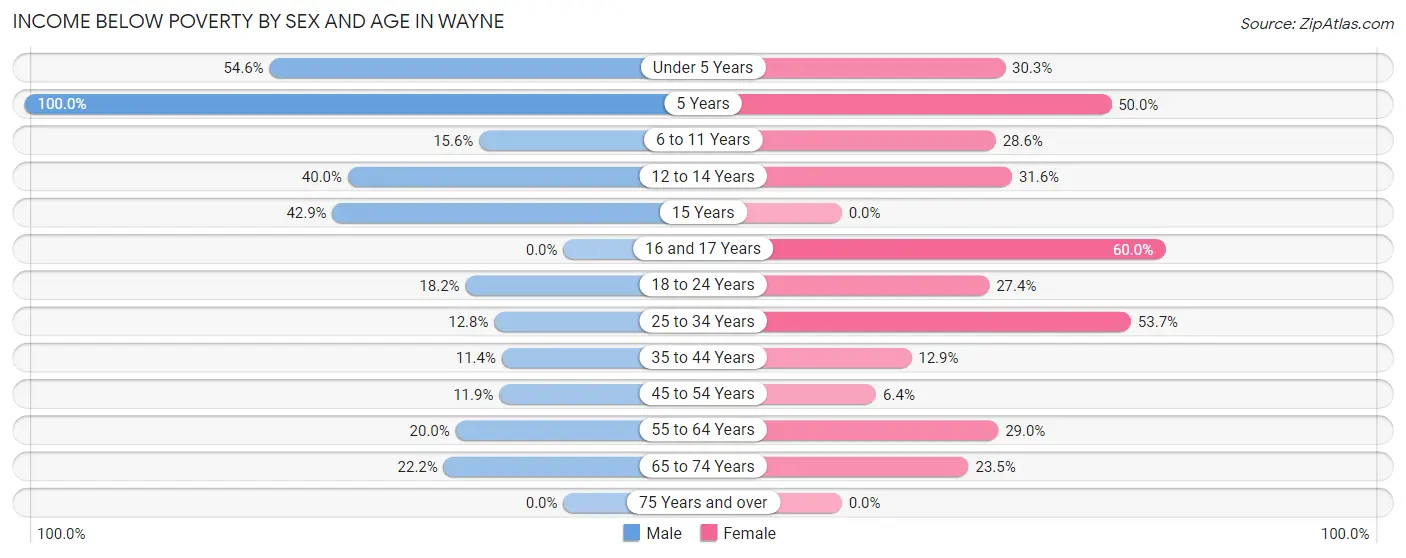
| Age Bracket | Male | Female |
| Under 5 Years | 12 (54.5%) | 10 (30.3%) |
| 5 Years | 8 (100.0%) | 5 (50.0%) |
| 6 to 11 Years | 10 (15.6%) | 4 (28.6%) |
| 12 to 14 Years | 4 (40.0%) | 6 (31.6%) |
| 15 Years | 3 (42.9%) | 0 (0.0%) |
| 16 and 17 Years | 0 (0.0%) | 6 (60.0%) |
| 18 to 24 Years | 14 (18.2%) | 26 (27.4%) |
| 25 to 34 Years | 5 (12.8%) | 22 (53.7%) |
| 35 to 44 Years | 8 (11.4%) | 8 (12.9%) |
| 45 to 54 Years | 5 (11.9%) | 3 (6.4%) |
| 55 to 64 Years | 6 (20.0%) | 9 (29.0%) |
| 65 to 74 Years | 4 (22.2%) | 4 (23.5%) |
| 75 Years and over | 0 (0.0%) | 0 (0.0%) |
| Total | 79 (19.4%) | 103 (25.8%) |
Income Above Poverty by Sex and Age in Wayne
According to the poverty statistics in Wayne, males aged 16 and 17 years and females aged 75 years and over are the age groups that are most secure financially, with 100.0% of males and 100.0% of females in these age groups living above the poverty line.
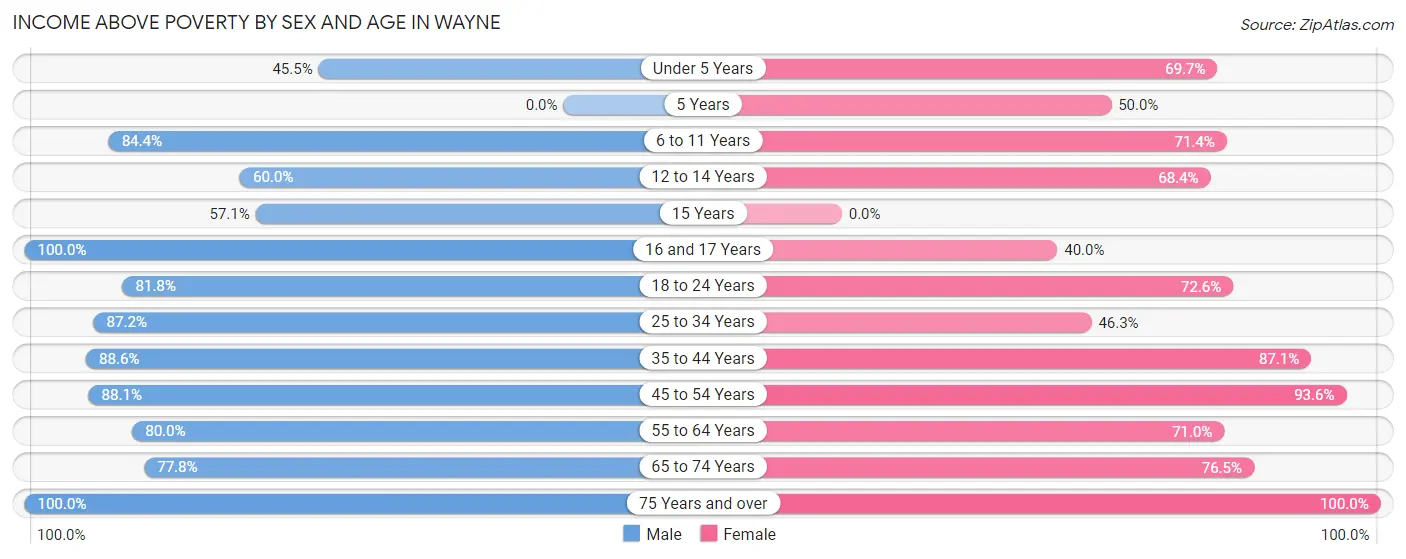
| Age Bracket | Male | Female |
| Under 5 Years | 10 (45.5%) | 23 (69.7%) |
| 5 Years | 0 (0.0%) | 5 (50.0%) |
| 6 to 11 Years | 54 (84.4%) | 10 (71.4%) |
| 12 to 14 Years | 6 (60.0%) | 13 (68.4%) |
| 15 Years | 4 (57.1%) | 0 (0.0%) |
| 16 and 17 Years | 9 (100.0%) | 4 (40.0%) |
| 18 to 24 Years | 63 (81.8%) | 69 (72.6%) |
| 25 to 34 Years | 34 (87.2%) | 19 (46.3%) |
| 35 to 44 Years | 62 (88.6%) | 54 (87.1%) |
| 45 to 54 Years | 37 (88.1%) | 44 (93.6%) |
| 55 to 64 Years | 24 (80.0%) | 22 (71.0%) |
| 65 to 74 Years | 14 (77.8%) | 13 (76.5%) |
| 75 Years and over | 11 (100.0%) | 20 (100.0%) |
| Total | 328 (80.6%) | 296 (74.2%) |
Income Below Poverty Among Married-Couple Families in Wayne
The poverty statistics for married-couple families in Wayne show that 5.3% or 8 of the total 150 families live below the poverty line. Families with 1 or 2 children have the highest poverty rate of 9.3%, comprising of 8 families. On the other hand, families with no children have the lowest poverty rate of 0.0%, which includes 0 families.
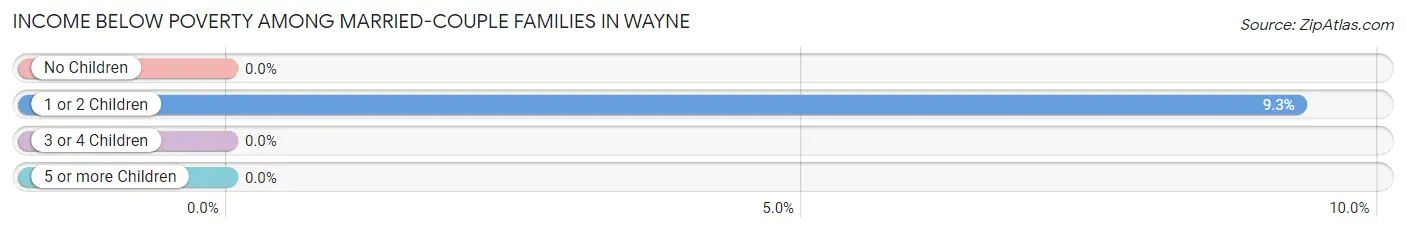
| Children | Above Poverty | Below Poverty |
| No Children | 64 (100.0%) | 0 (0.0%) |
| 1 or 2 Children | 78 (90.7%) | 8 (9.3%) |
| 3 or 4 Children | 0 (0.0%) | 0 (0.0%) |
| 5 or more Children | 0 (0.0%) | 0 (0.0%) |
| Total | 142 (94.7%) | 8 (5.3%) |
Income Below Poverty Among Single-Parent Households in Wayne
According to the poverty data in Wayne, 66.7% or 8 single-father households and 26.9% or 18 single-mother households are living below the poverty line. Among single-father households, those with 3 or 4 children have the highest poverty rate, with 8 households (100.0%) experiencing poverty. Likewise, among single-mother households, those with 5 or more children have the highest poverty rate, with 1 households (100.0%) falling below the poverty line.
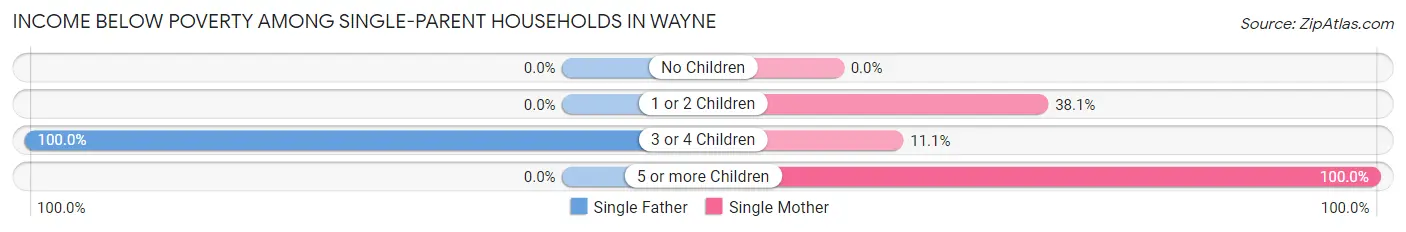
| Children | Single Father | Single Mother |
| No Children | 0 (0.0%) | 0 (0.0%) |
| 1 or 2 Children | 0 (0.0%) | 16 (38.1%) |
| 3 or 4 Children | 8 (100.0%) | 1 (11.1%) |
| 5 or more Children | 0 (0.0%) | 1 (100.0%) |
| Total | 8 (66.7%) | 18 (26.9%) |
Income Below Poverty Among Married-Couple vs Single-Parent Households in Wayne
The poverty data for Wayne shows that 8 of the married-couple family households (5.3%) and 26 of the single-parent households (32.9%) are living below the poverty level. Within the married-couple family households, those with 1 or 2 children have the highest poverty rate, with 8 households (9.3%) falling below the poverty line. Among the single-parent households, those with 5 or more children have the highest poverty rate, with 1 household (100.0%) living below poverty.
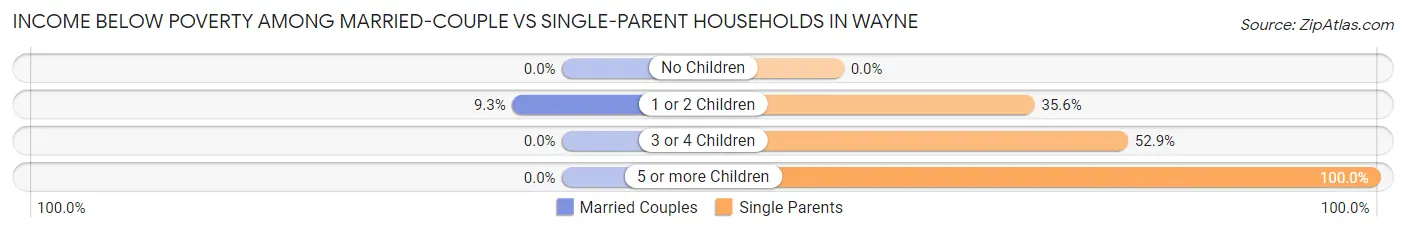
| Children | Married-Couple Families | Single-Parent Households |
| No Children | 0 (0.0%) | 0 (0.0%) |
| 1 or 2 Children | 8 (9.3%) | 16 (35.6%) |
| 3 or 4 Children | 0 (0.0%) | 9 (52.9%) |
| 5 or more Children | 0 (0.0%) | 1 (100.0%) |
| Total | 8 (5.3%) | 26 (32.9%) |
Race in Wayne
The most populous races in Wayne are White / Caucasian (615 | 75.8%), Native / Alaskan (95 | 11.7%), and Two or more Races (79 | 9.7%).
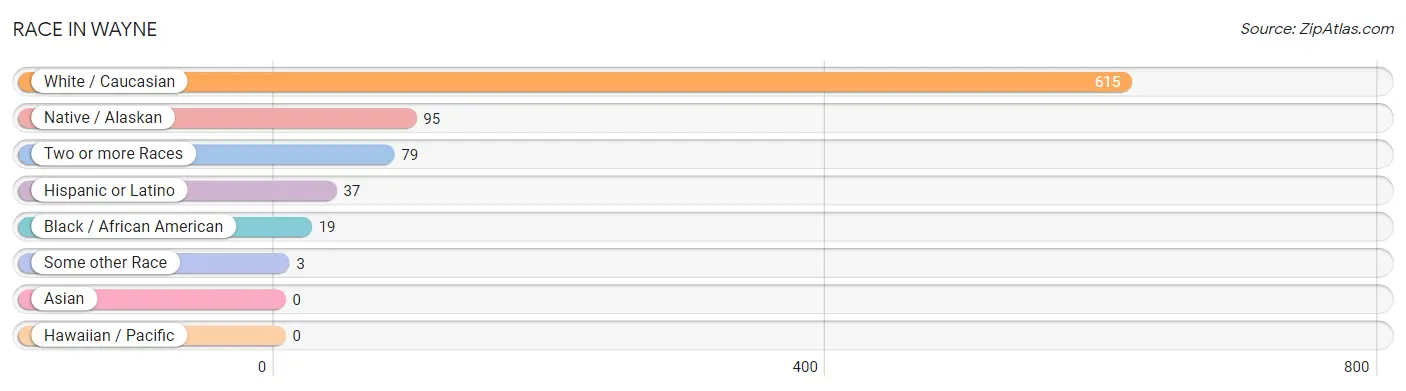
| Race | # Population | % Population |
| Asian | 0 | 0.0% |
| Black / African American | 19 | 2.3% |
| Hawaiian / Pacific | 0 | 0.0% |
| Hispanic or Latino | 37 | 4.6% |
| Native / Alaskan | 95 | 11.7% |
| White / Caucasian | 615 | 75.8% |
| Two or more Races | 79 | 9.7% |
| Some other Race | 3 | 0.4% |
| Total | 811 | 100.0% |
Ancestry in Wayne
The most populous ancestries reported in Wayne are Chickasaw (81 | 10.0%), German (77 | 9.5%), Irish (68 | 8.4%), Cherokee (42 | 5.2%), and Mexican (37 | 4.6%), together accounting for 37.6% of all Wayne residents.
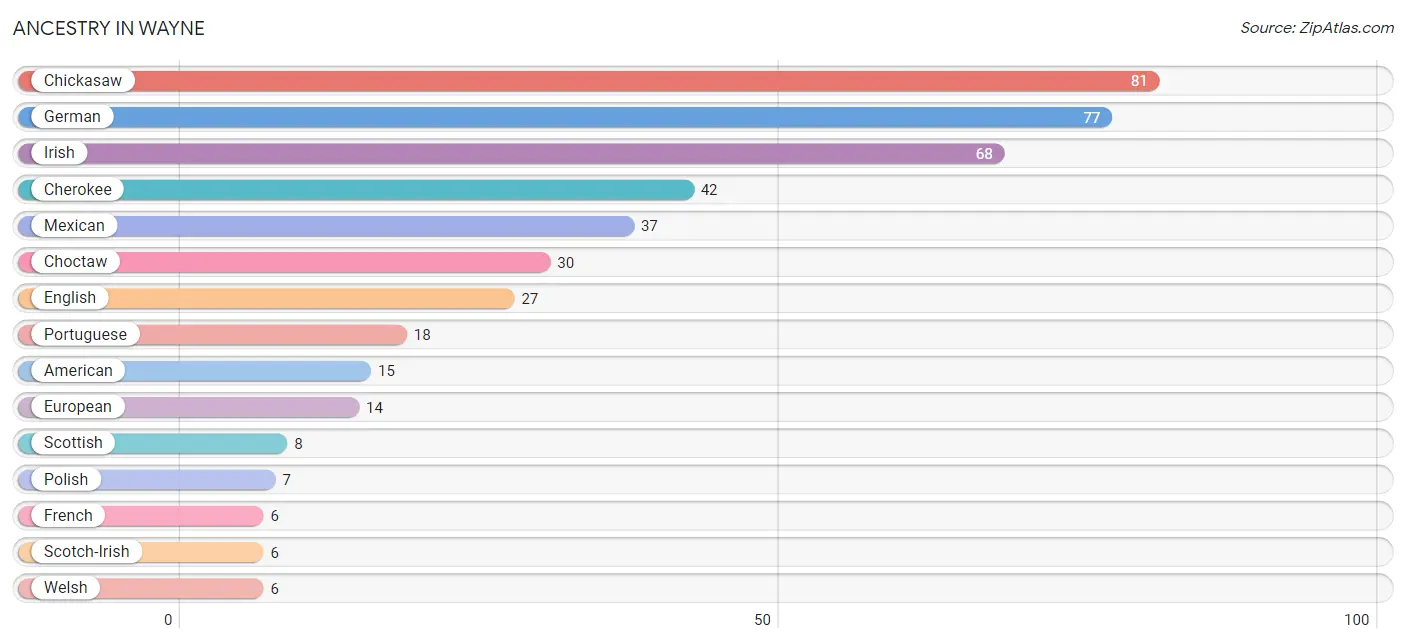
| Ancestry | # Population | % Population |
| African | 1 | 0.1% |
| American | 15 | 1.8% |
| Cherokee | 42 | 5.2% |
| Chickasaw | 81 | 10.0% |
| Choctaw | 30 | 3.7% |
| Dutch | 4 | 0.5% |
| English | 27 | 3.3% |
| European | 14 | 1.7% |
| French | 6 | 0.7% |
| French Canadian | 2 | 0.3% |
| German | 77 | 9.5% |
| Irish | 68 | 8.4% |
| Italian | 1 | 0.1% |
| Mexican | 37 | 4.6% |
| Navajo | 1 | 0.1% |
| Norwegian | 2 | 0.3% |
| Polish | 7 | 0.9% |
| Portuguese | 18 | 2.2% |
| Scotch-Irish | 6 | 0.7% |
| Scottish | 8 | 1.0% |
| Subsaharan African | 1 | 0.1% |
| Welsh | 6 | 0.7% | View All 22 Rows |
Immigrants in Wayne
The most numerous immigrant groups reported in Wayne came from Central America (13 | 1.6%), Latin America (13 | 1.6%), and Mexico (13 | 1.6%), together accounting for 4.8% of all Wayne residents.
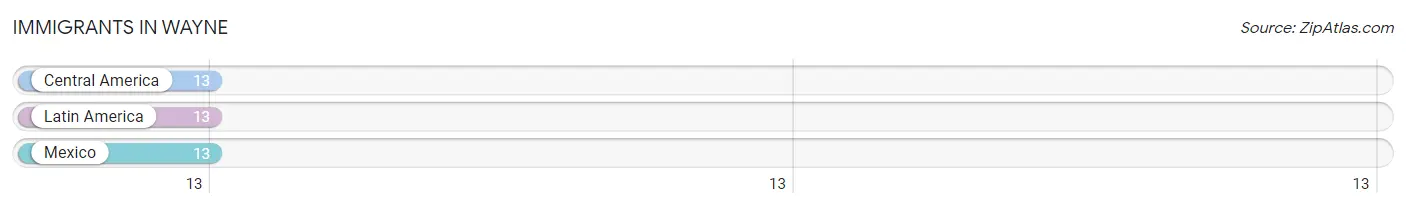
| Immigration Origin | # Population | % Population |
| Central America | 13 | 1.6% |
| Latin America | 13 | 1.6% |
| Mexico | 13 | 1.6% | View All 3 Rows |
Sex and Age in Wayne
Sex and Age in Wayne
The most populous age groups in Wayne are 5 to 9 Years (64 | 15.7%) for men and 20 to 24 Years (86 | 21.3%) for women.
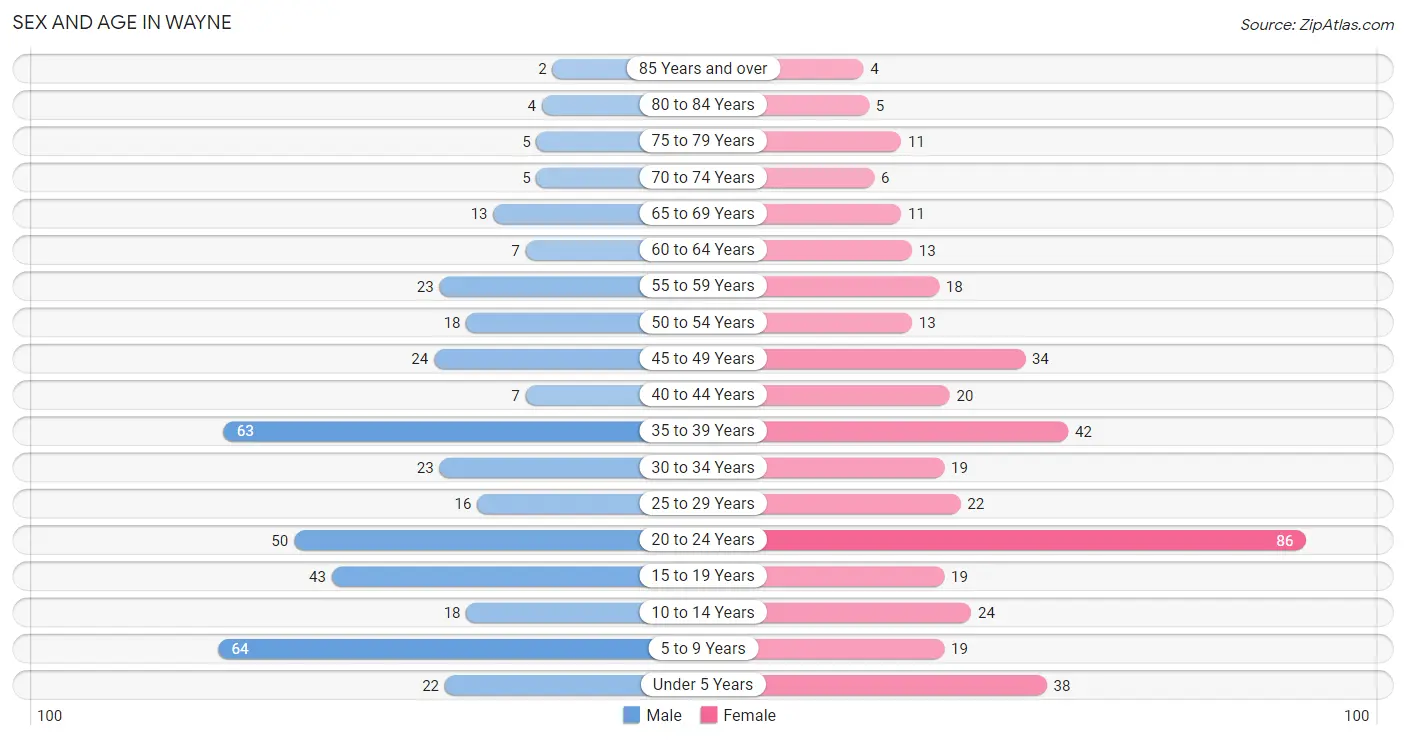
| Age Bracket | Male | Female |
| Under 5 Years | 22 (5.4%) | 38 (9.4%) |
| 5 to 9 Years | 64 (15.7%) | 19 (4.7%) |
| 10 to 14 Years | 18 (4.4%) | 24 (5.9%) |
| 15 to 19 Years | 43 (10.6%) | 19 (4.7%) |
| 20 to 24 Years | 50 (12.3%) | 86 (21.3%) |
| 25 to 29 Years | 16 (3.9%) | 22 (5.4%) |
| 30 to 34 Years | 23 (5.7%) | 19 (4.7%) |
| 35 to 39 Years | 63 (15.5%) | 42 (10.4%) |
| 40 to 44 Years | 7 (1.7%) | 20 (5.0%) |
| 45 to 49 Years | 24 (5.9%) | 34 (8.4%) |
| 50 to 54 Years | 18 (4.4%) | 13 (3.2%) |
| 55 to 59 Years | 23 (5.7%) | 18 (4.5%) |
| 60 to 64 Years | 7 (1.7%) | 13 (3.2%) |
| 65 to 69 Years | 13 (3.2%) | 11 (2.7%) |
| 70 to 74 Years | 5 (1.2%) | 6 (1.5%) |
| 75 to 79 Years | 5 (1.2%) | 11 (2.7%) |
| 80 to 84 Years | 4 (1.0%) | 5 (1.2%) |
| 85 Years and over | 2 (0.5%) | 4 (1.0%) |
| Total | 407 (100.0%) | 404 (100.0%) |
Families and Households in Wayne
Median Family Size in Wayne
The median family size in Wayne is 2.83 persons per family, with single female/mother families (67 | 29.3%) accounting for the largest median family size of 2.87 persons per family. On the other hand, single male/father families (12 | 5.2%) represent the smallest median family size with 2.75 persons per family.
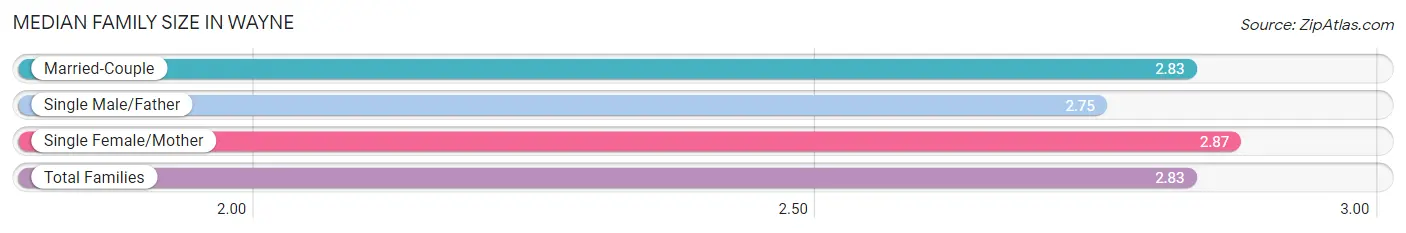
| Family Type | # Families | Family Size |
| Married-Couple | 150 (65.5%) | 2.83 |
| Single Male/Father | 12 (5.2%) | 2.75 |
| Single Female/Mother | 67 (29.3%) | 2.87 |
| Total Families | 229 (100.0%) | 2.83 |
Median Household Size in Wayne
The median household size in Wayne is 2.66 persons per household, with single female/mother households (67 | 22.0%) accounting for the largest median household size of 3.28 persons per household. non-family households (76 | 24.9%) represent the smallest median household size with 1.71 persons per household.
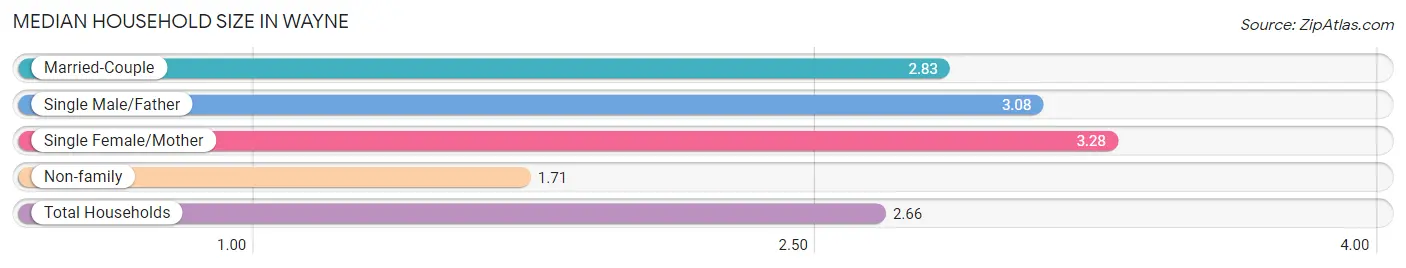
| Household Type | # Households | Household Size |
| Married-Couple | 150 (49.2%) | 2.83 |
| Single Male/Father | 12 (3.9%) | 3.08 |
| Single Female/Mother | 67 (22.0%) | 3.28 |
| Non-family | 76 (24.9%) | 1.71 |
| Total Households | 305 (100.0%) | 2.66 |
Household Size by Marriage Status in Wayne
Out of a total of 305 households in Wayne, 229 (75.1%) are family households, while 76 (24.9%) are nonfamily households. The most numerous type of family households are 3-person households, comprising 93, and the most common type of nonfamily households are 1-person households, comprising 54.
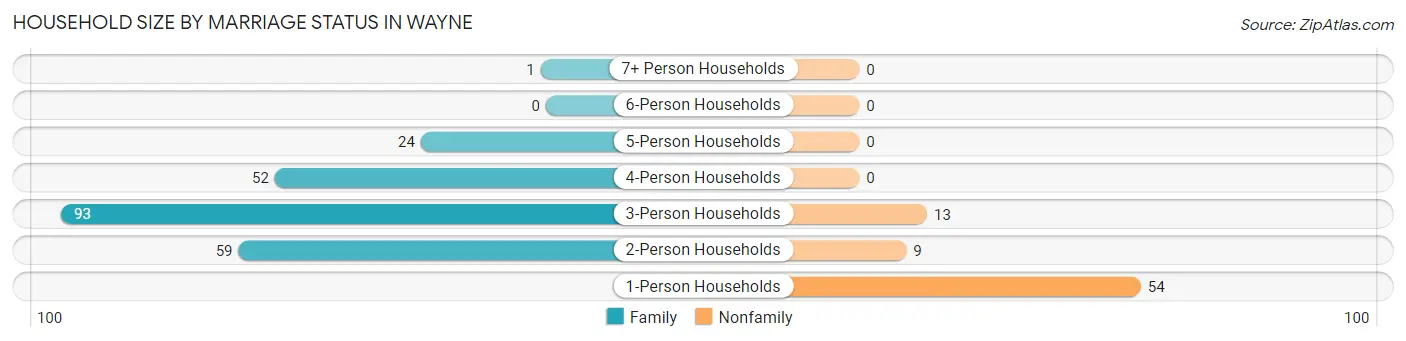
| Household Size | Family Households | Nonfamily Households |
| 1-Person Households | - | 54 (17.7%) |
| 2-Person Households | 59 (19.3%) | 9 (2.9%) |
| 3-Person Households | 93 (30.5%) | 13 (4.3%) |
| 4-Person Households | 52 (17.1%) | 0 (0.0%) |
| 5-Person Households | 24 (7.9%) | 0 (0.0%) |
| 6-Person Households | 0 (0.0%) | 0 (0.0%) |
| 7+ Person Households | 1 (0.3%) | 0 (0.0%) |
| Total | 229 (75.1%) | 76 (24.9%) |
Female Fertility in Wayne
Fertility by Age in Wayne
Average fertility rate in Wayne is 91.0 births per 1,000 women. Women in the age bracket of 20 to 34 years have the highest fertility rate with 134.0 births per 1,000 women. Women in the age bracket of 20 to 34 years acount for 77.3% of all women with births.
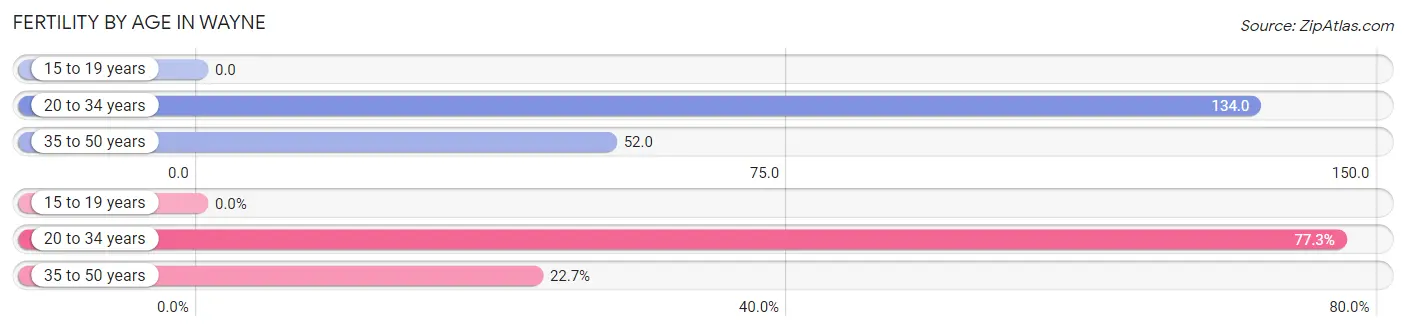
| Age Bracket | Women with Births | Births / 1,000 Women |
| 15 to 19 years | 0 (0.0%) | 0.0 |
| 20 to 34 years | 17 (77.3%) | 134.0 |
| 35 to 50 years | 5 (22.7%) | 52.0 |
| Total | 22 (100.0%) | 91.0 |
Fertility by Age by Marriage Status in Wayne
68.2% of women with births (22) in Wayne are married. The highest percentage of unmarried women with births falls into 20 to 34 years age bracket with 41.2% of them unmarried at the time of birth, while the lowest percentage of unmarried women with births belong to 35 to 50 years age bracket with 0.0% of them unmarried.
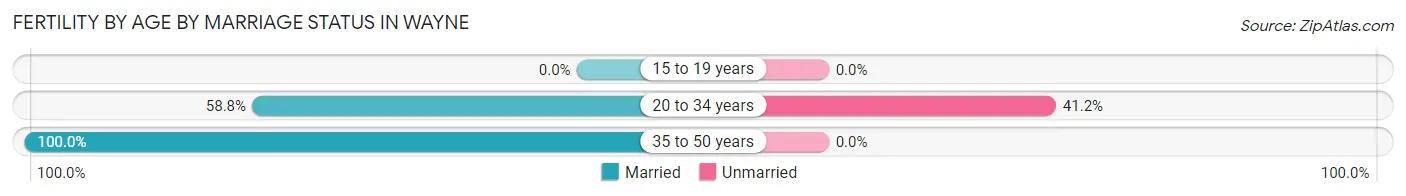
| Age Bracket | Married | Unmarried |
| 15 to 19 years | 0 (0.0%) | 0 (0.0%) |
| 20 to 34 years | 10 (58.8%) | 7 (41.2%) |
| 35 to 50 years | 5 (100.0%) | 0 (0.0%) |
| Total | 15 (68.2%) | 7 (31.8%) |
Fertility by Education in Wayne
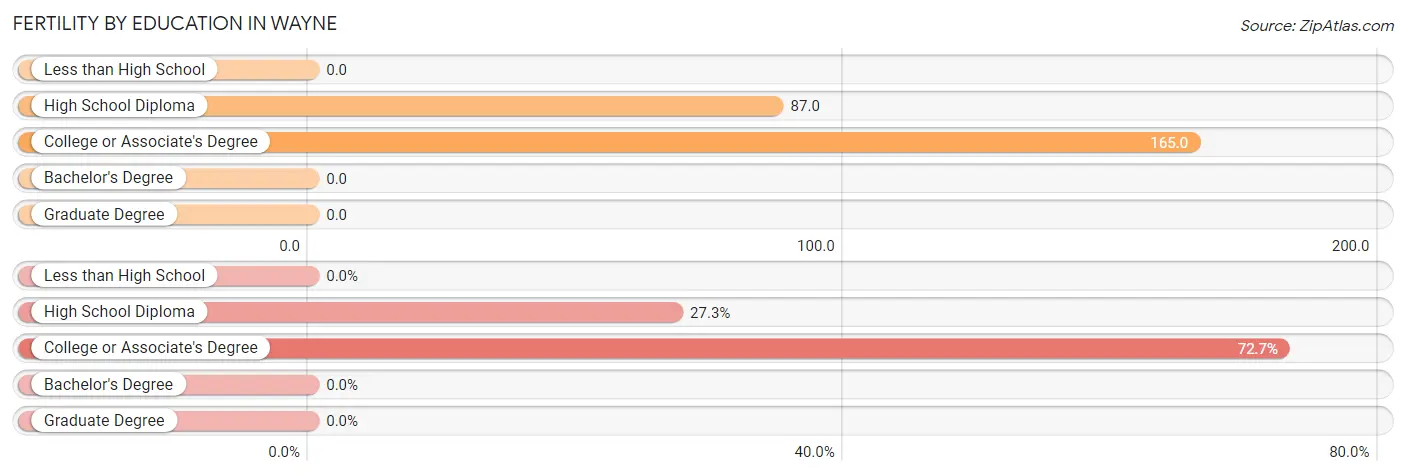
| Educational Attainment | Women with Births | Births / 1,000 Women |
| Less than High School | 0 (0.0%) | 0.0 |
| High School Diploma | 6 (27.3%) | 87.0 |
| College or Associate's Degree | 16 (72.7%) | 165.0 |
| Bachelor's Degree | 0 (0.0%) | 0.0 |
| Graduate Degree | 0 (0.0%) | 0.0 |
| Total | 22 (100.0%) | 91.0 |
Fertility by Education by Marriage Status in Wayne
31.8% of women with births in Wayne are unmarried. Women with the educational attainment of college or associate's degree are most likely to be married with 68.8% of them married at childbirth, while women with the educational attainment of high school diploma are least likely to be married with 33.3% of them unmarried at childbirth.
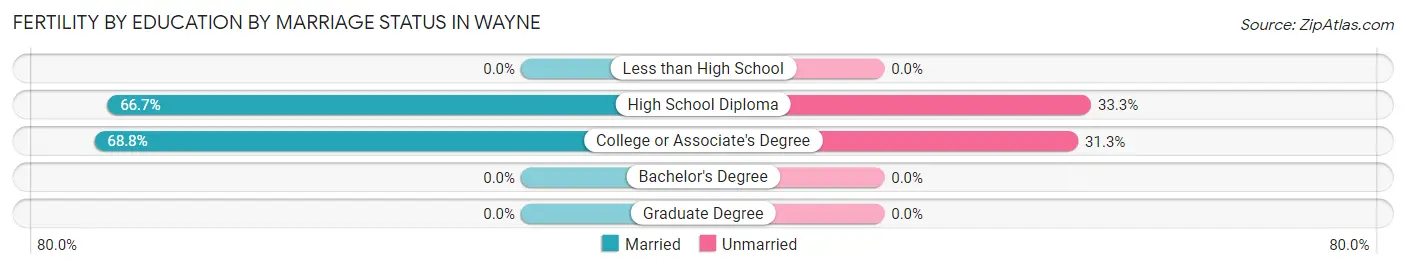
| Educational Attainment | Married | Unmarried |
| Less than High School | 0 (0.0%) | 0 (0.0%) |
| High School Diploma | 4 (66.7%) | 2 (33.3%) |
| College or Associate's Degree | 11 (68.8%) | 5 (31.2%) |
| Bachelor's Degree | 0 (0.0%) | 0 (0.0%) |
| Graduate Degree | 0 (0.0%) | 0 (0.0%) |
| Total | 15 (68.2%) | 7 (31.8%) |
Employment Characteristics in Wayne
Employment by Class of Employer in Wayne
Among the 359 employed individuals in Wayne, private company employees (240 | 66.8%), not-for-profit organizations (44 | 12.3%), and state government employees (30 | 8.4%) make up the most common classes of employment.
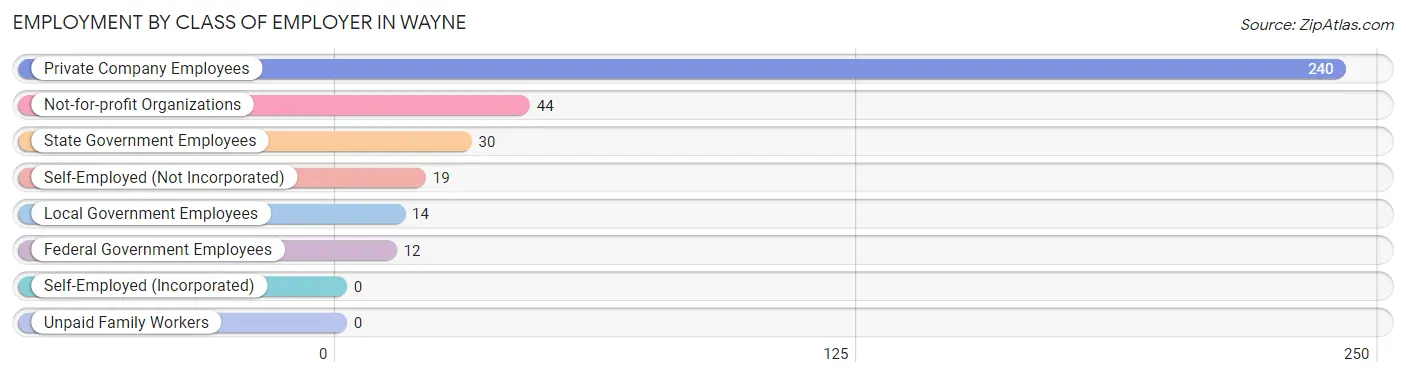
| Employer Class | # Employees | % Employees |
| Private Company Employees | 240 | 66.8% |
| Self-Employed (Incorporated) | 0 | 0.0% |
| Self-Employed (Not Incorporated) | 19 | 5.3% |
| Not-for-profit Organizations | 44 | 12.3% |
| Local Government Employees | 14 | 3.9% |
| State Government Employees | 30 | 8.4% |
| Federal Government Employees | 12 | 3.3% |
| Unpaid Family Workers | 0 | 0.0% |
| Total | 359 | 100.0% |
Employment Status by Age in Wayne
According to the labor force statistics for Wayne, out of the total population over 16 years of age (619), 58.6% or 363 individuals are in the labor force, with 0.6% or 2 of them unemployed. The age group with the highest labor force participation rate is 55 to 59 years, with 85.4% or 35 individuals in the labor force. Within the labor force, the 45 to 54 years age range has the highest percentage of unemployed individuals, with 2.7% or 2 of them being unemployed.
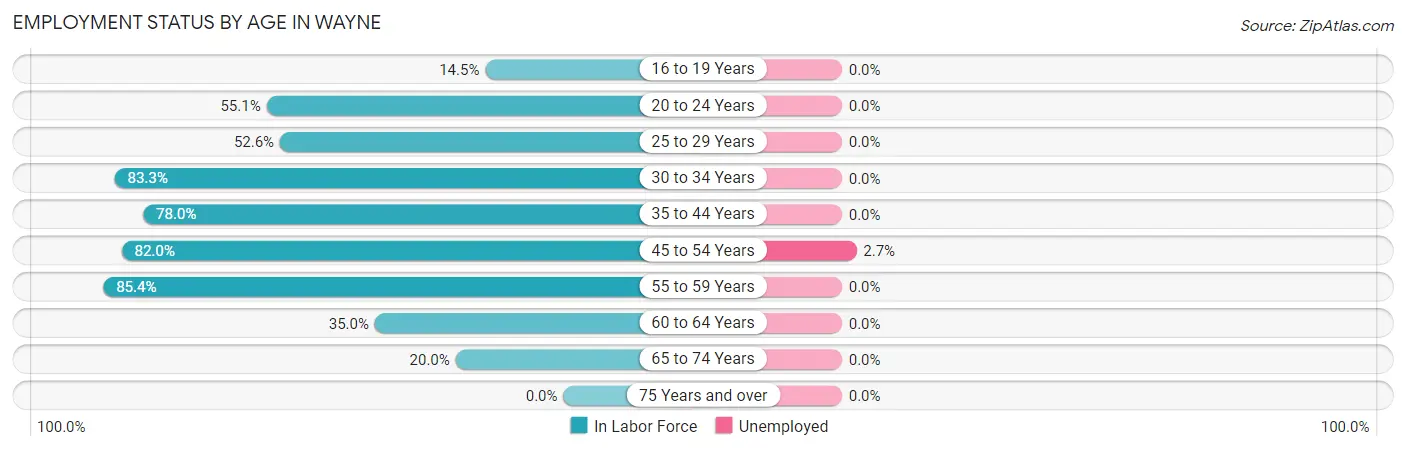
| Age Bracket | In Labor Force | Unemployed |
| 16 to 19 Years | 8 (14.5%) | 0 (0.0%) |
| 20 to 24 Years | 75 (55.1%) | 0 (0.0%) |
| 25 to 29 Years | 20 (52.6%) | 0 (0.0%) |
| 30 to 34 Years | 35 (83.3%) | 0 (0.0%) |
| 35 to 44 Years | 103 (78.0%) | 0 (0.0%) |
| 45 to 54 Years | 73 (82.0%) | 2 (2.7%) |
| 55 to 59 Years | 35 (85.4%) | 0 (0.0%) |
| 60 to 64 Years | 7 (35.0%) | 0 (0.0%) |
| 65 to 74 Years | 7 (20.0%) | 0 (0.0%) |
| 75 Years and over | 0 (0.0%) | 0 (0.0%) |
| Total | 363 (58.6%) | 2 (0.6%) |
Employment Status by Educational Attainment in Wayne
According to labor force statistics for Wayne, 75.4% of individuals (273) out of the total population between 25 and 64 years of age (362) are in the labor force, with 0.7% or 2 of them being unemployed. The group with the highest labor force participation rate are those with the educational attainment of bachelor's degree or higher, with 96.5% or 55 individuals in the labor force. Within the labor force, individuals with college / associate degree education have the highest percentage of unemployment, with 2.2% or 2 of them being unemployed.
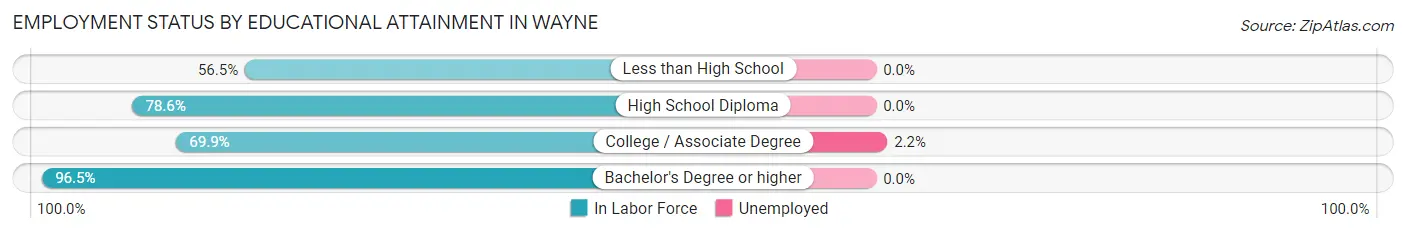
| Educational Attainment | In Labor Force | Unemployed |
| Less than High School | 26 (56.5%) | 0 (0.0%) |
| High School Diploma | 99 (78.6%) | 0 (0.0%) |
| College / Associate Degree | 93 (69.9%) | 3 (2.2%) |
| Bachelor's Degree or higher | 55 (96.5%) | 0 (0.0%) |
| Total | 273 (75.4%) | 3 (0.7%) |
Employment Occupations by Sex in Wayne
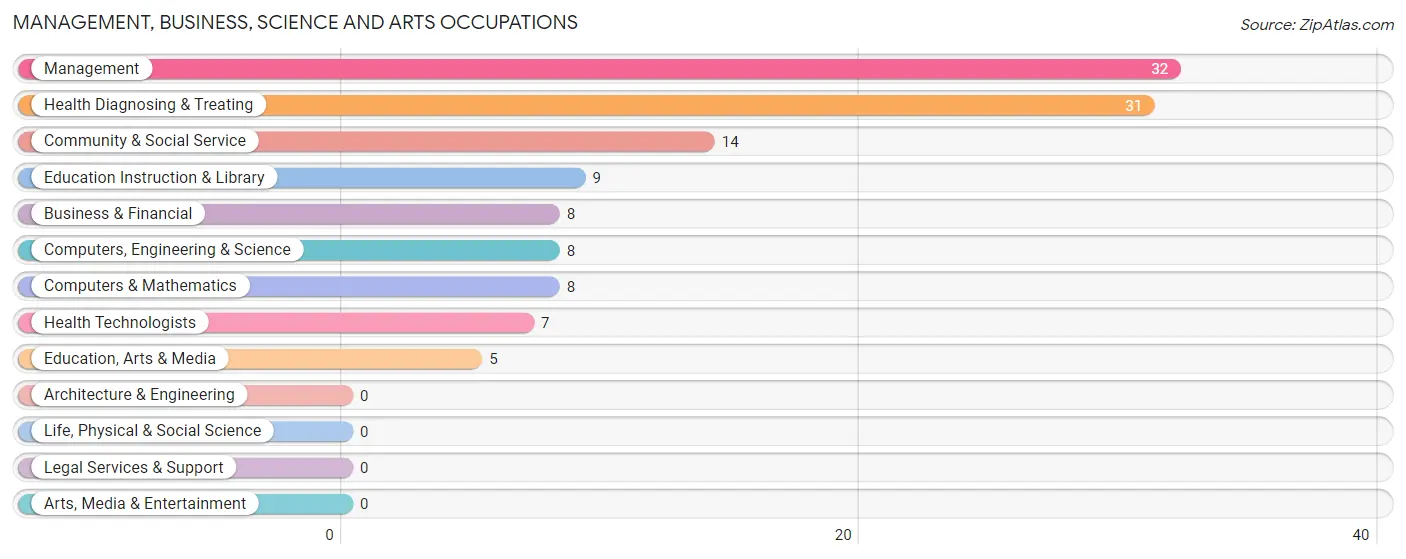
Management, Business, Science and Arts Occupations
The most common Management, Business, Science and Arts occupations in Wayne are Management (32 | 8.9%), Health Diagnosing & Treating (31 | 8.6%), Community & Social Service (14 | 3.9%), Education Instruction & Library (9 | 2.5%), and Business & Financial (8 | 2.2%).
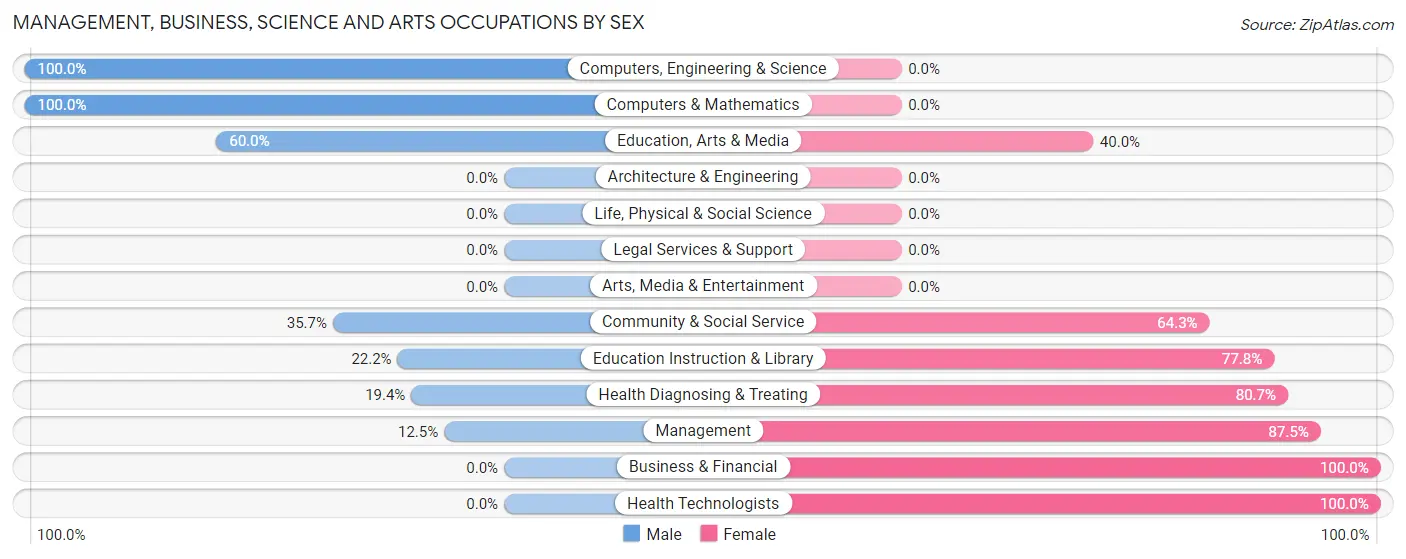
Management, Business, Science and Arts Occupations by Sex
Within the Management, Business, Science and Arts occupations in Wayne, the most male-oriented occupations are Computers, Engineering & Science (100.0%), Computers & Mathematics (100.0%), and Education, Arts & Media (60.0%), while the most female-oriented occupations are Business & Financial (100.0%), Health Technologists (100.0%), and Management (87.5%).
| Occupation | Male | Female |
| Management | 4 (12.5%) | 28 (87.5%) |
| Business & Financial | 0 (0.0%) | 8 (100.0%) |
| Computers, Engineering & Science | 8 (100.0%) | 0 (0.0%) |
| Computers & Mathematics | 8 (100.0%) | 0 (0.0%) |
| Architecture & Engineering | 0 (0.0%) | 0 (0.0%) |
| Life, Physical & Social Science | 0 (0.0%) | 0 (0.0%) |
| Community & Social Service | 5 (35.7%) | 9 (64.3%) |
| Education, Arts & Media | 3 (60.0%) | 2 (40.0%) |
| Legal Services & Support | 0 (0.0%) | 0 (0.0%) |
| Education Instruction & Library | 2 (22.2%) | 7 (77.8%) |
| Arts, Media & Entertainment | 0 (0.0%) | 0 (0.0%) |
| Health Diagnosing & Treating | 6 (19.4%) | 25 (80.6%) |
| Health Technologists | 0 (0.0%) | 7 (100.0%) |
| Total (Category) | 23 (24.7%) | 70 (75.3%) |
| Total (Overall) | 211 (58.5%) | 150 (41.5%) |
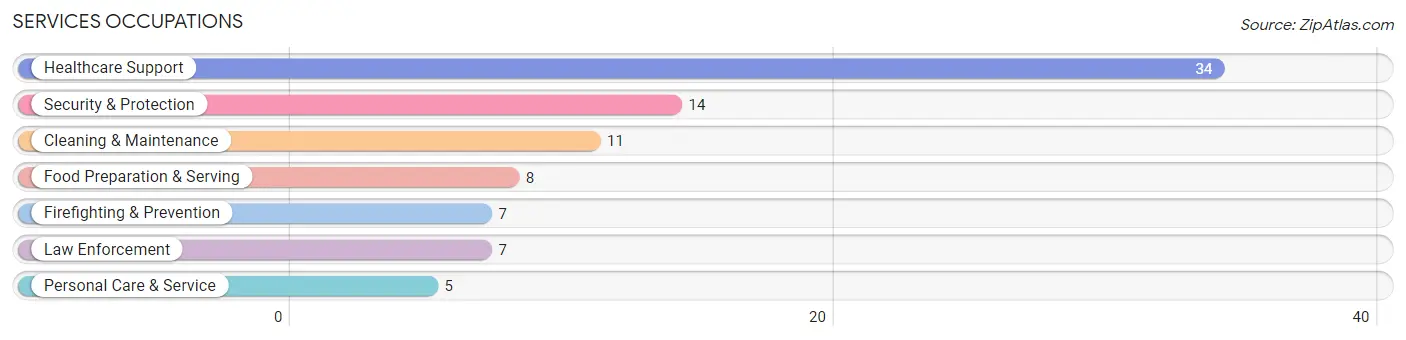
Services Occupations
The most common Services occupations in Wayne are Healthcare Support (34 | 9.4%), Security & Protection (14 | 3.9%), Cleaning & Maintenance (11 | 3.0%), Food Preparation & Serving (8 | 2.2%), and Firefighting & Prevention (7 | 1.9%).
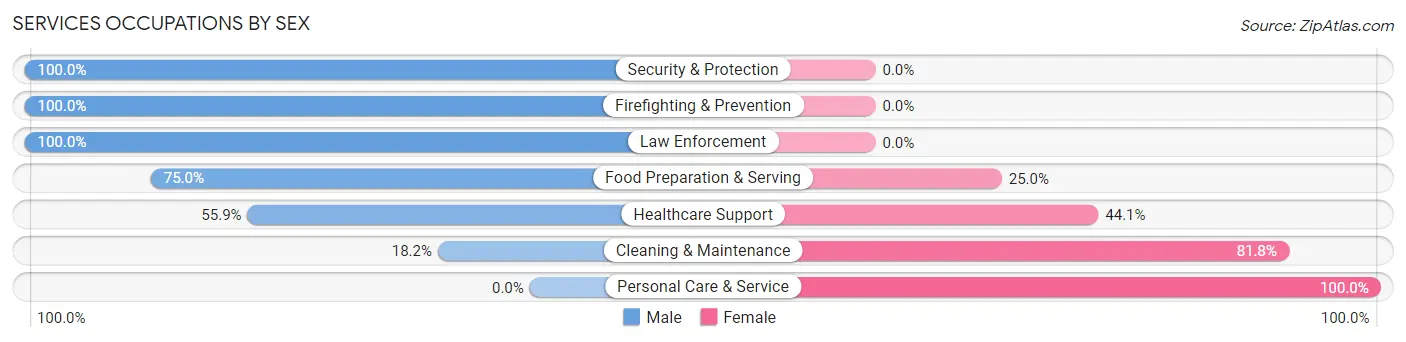
Services Occupations by Sex
Within the Services occupations in Wayne, the most male-oriented occupations are Security & Protection (100.0%), Firefighting & Prevention (100.0%), and Law Enforcement (100.0%), while the most female-oriented occupations are Personal Care & Service (100.0%), Cleaning & Maintenance (81.8%), and Healthcare Support (44.1%).
| Occupation | Male | Female |
| Healthcare Support | 19 (55.9%) | 15 (44.1%) |
| Security & Protection | 14 (100.0%) | 0 (0.0%) |
| Firefighting & Prevention | 7 (100.0%) | 0 (0.0%) |
| Law Enforcement | 7 (100.0%) | 0 (0.0%) |
| Food Preparation & Serving | 6 (75.0%) | 2 (25.0%) |
| Cleaning & Maintenance | 2 (18.2%) | 9 (81.8%) |
| Personal Care & Service | 0 (0.0%) | 5 (100.0%) |
| Total (Category) | 41 (56.9%) | 31 (43.1%) |
| Total (Overall) | 211 (58.5%) | 150 (41.5%) |
Sales and Office Occupations
The most common Sales and Office occupations in Wayne are Office & Administration (60 | 16.6%), and Sales & Related (25 | 6.9%).

Sales and Office Occupations by Sex

| Occupation | Male | Female |
| Sales & Related | 21 (84.0%) | 4 (16.0%) |
| Office & Administration | 19 (31.7%) | 41 (68.3%) |
| Total (Category) | 40 (47.1%) | 45 (52.9%) |
| Total (Overall) | 211 (58.5%) | 150 (41.5%) |
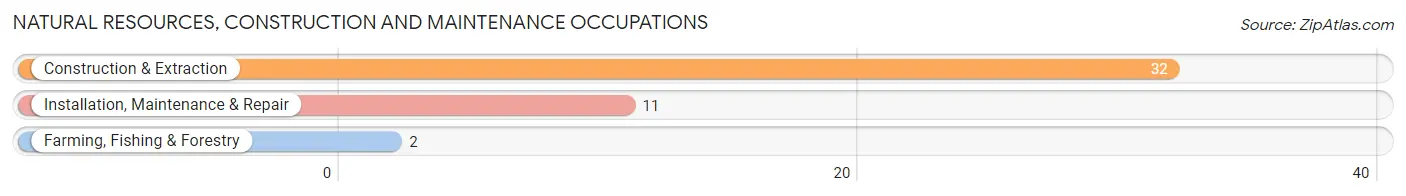
Natural Resources, Construction and Maintenance Occupations
The most common Natural Resources, Construction and Maintenance occupations in Wayne are Construction & Extraction (32 | 8.9%), Installation, Maintenance & Repair (11 | 3.0%), and Farming, Fishing & Forestry (2 | 0.5%).
Natural Resources, Construction and Maintenance Occupations by Sex
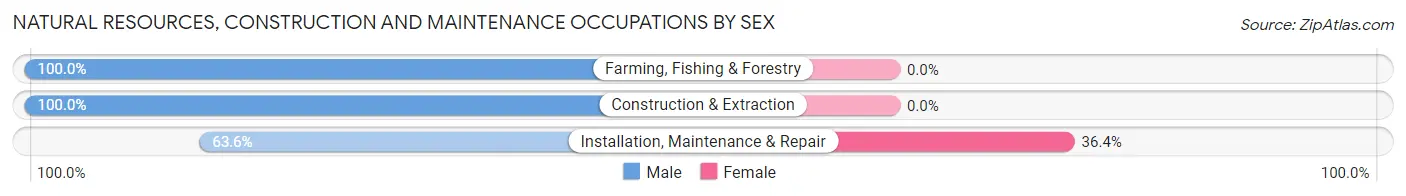
| Occupation | Male | Female |
| Farming, Fishing & Forestry | 2 (100.0%) | 0 (0.0%) |
| Construction & Extraction | 32 (100.0%) | 0 (0.0%) |
| Installation, Maintenance & Repair | 7 (63.6%) | 4 (36.4%) |
| Total (Category) | 41 (91.1%) | 4 (8.9%) |
| Total (Overall) | 211 (58.5%) | 150 (41.5%) |
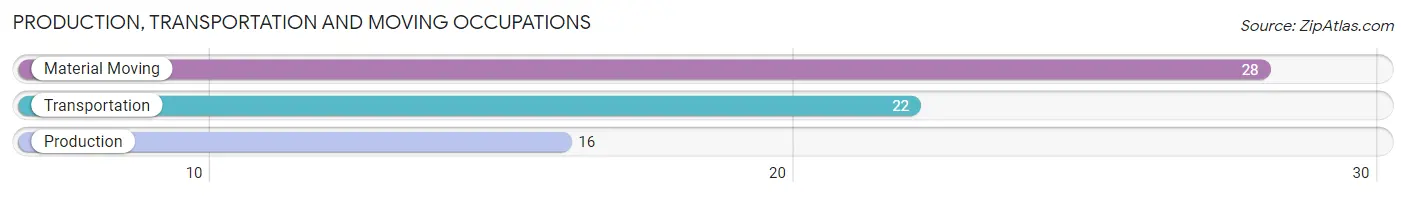
Production, Transportation and Moving Occupations
The most common Production, Transportation and Moving occupations in Wayne are Material Moving (28 | 7.8%), Transportation (22 | 6.1%), and Production (16 | 4.4%).
Production, Transportation and Moving Occupations by Sex
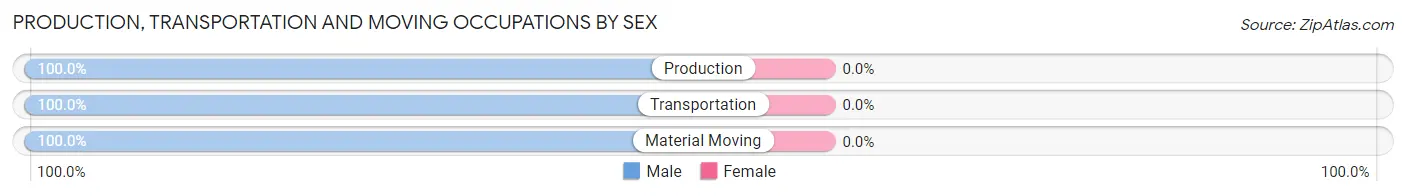
| Occupation | Male | Female |
| Production | 16 (100.0%) | 0 (0.0%) |
| Transportation | 22 (100.0%) | 0 (0.0%) |
| Material Moving | 28 (100.0%) | 0 (0.0%) |
| Total (Category) | 66 (100.0%) | 0 (0.0%) |
| Total (Overall) | 211 (58.5%) | 150 (41.5%) |
Employment Industries by Sex in Wayne
Employment Industries in Wayne
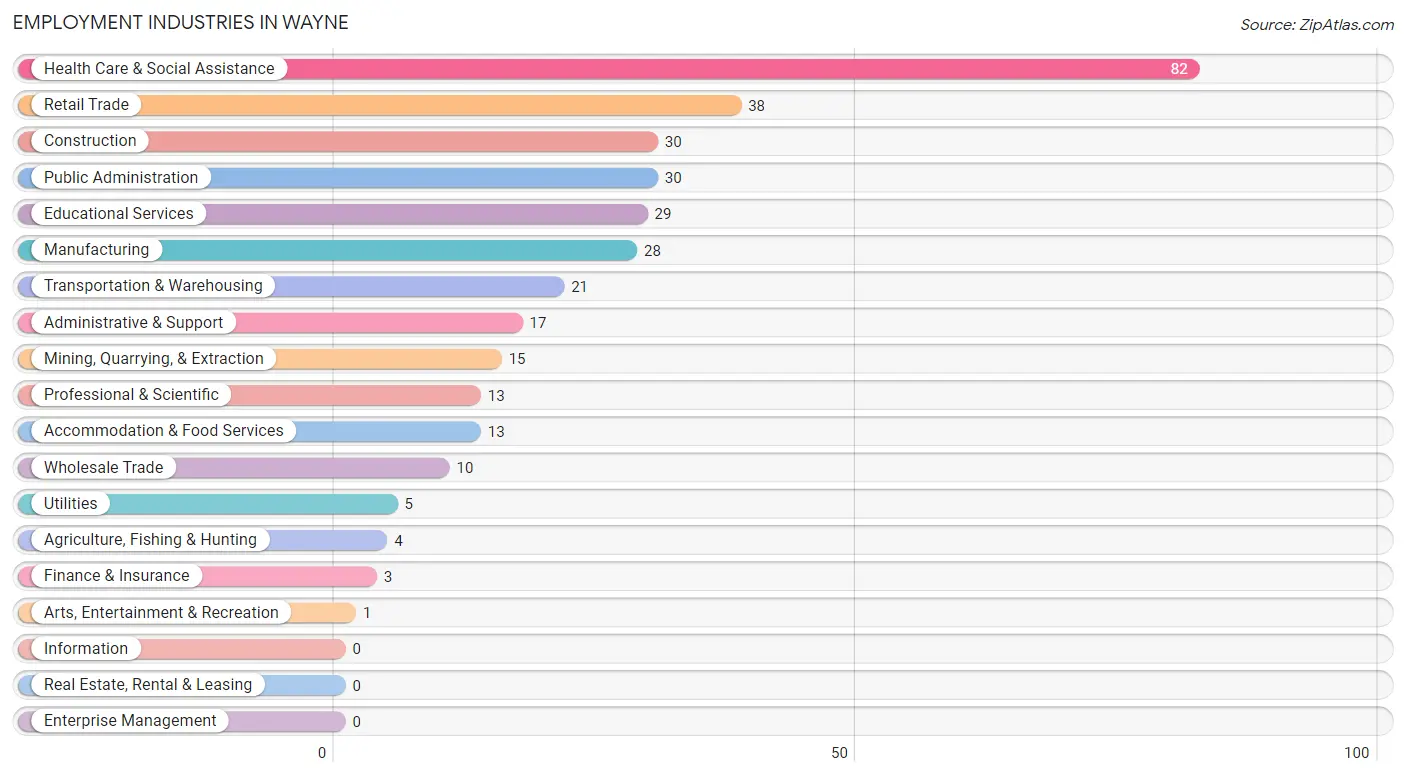
The major employment industries in Wayne include Health Care & Social Assistance (82 | 22.7%), Retail Trade (38 | 10.5%), Construction (30 | 8.3%), Public Administration (30 | 8.3%), and Educational Services (29 | 8.0%).
Employment Industries by Sex in Wayne
The Wayne industries that see more men than women are Mining, Quarrying, & Extraction (100.0%), Manufacturing (100.0%), and Wholesale Trade (100.0%), whereas the industries that tend to have a higher number of women are Utilities (100.0%), Finance & Insurance (100.0%), and Educational Services (93.1%).
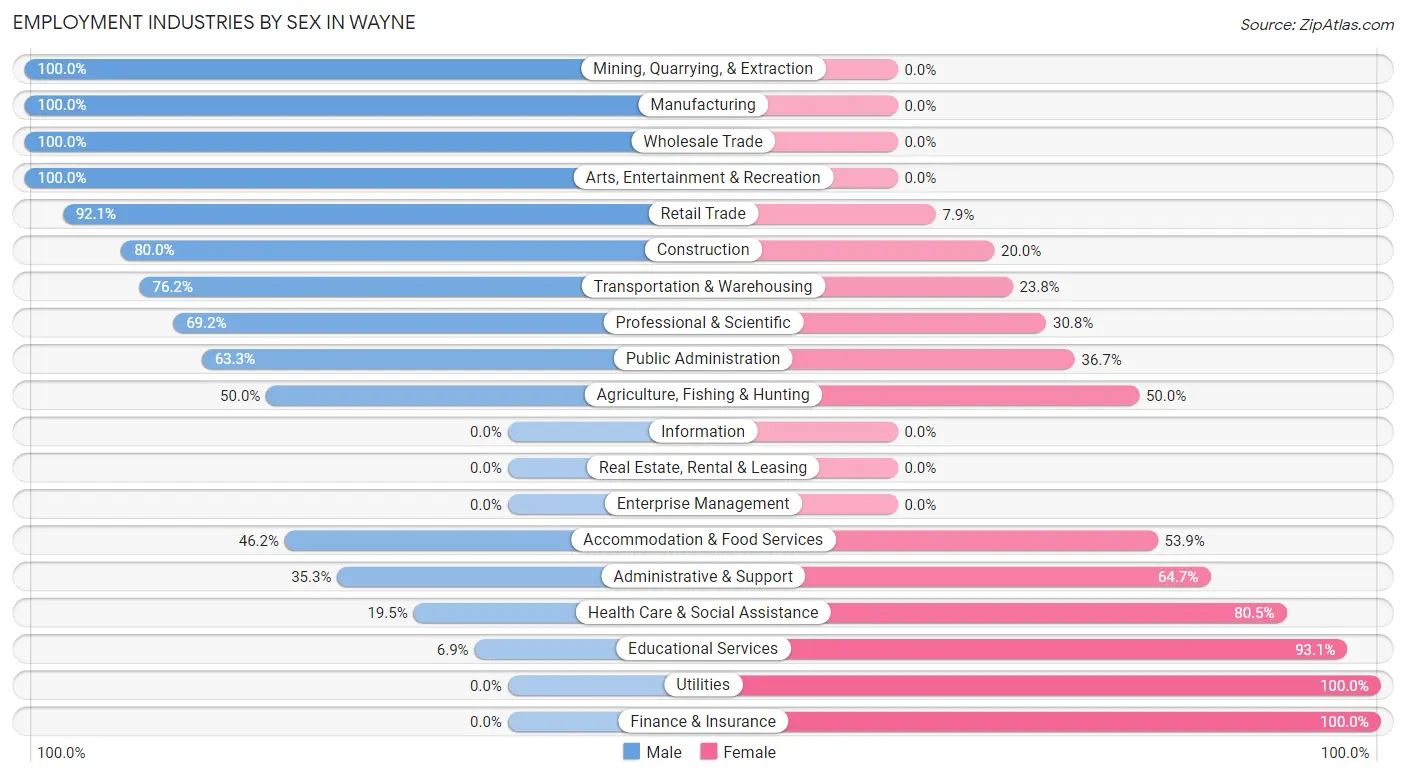
| Industry | Male | Female |
| Agriculture, Fishing & Hunting | 2 (50.0%) | 2 (50.0%) |
| Mining, Quarrying, & Extraction | 15 (100.0%) | 0 (0.0%) |
| Construction | 24 (80.0%) | 6 (20.0%) |
| Manufacturing | 28 (100.0%) | 0 (0.0%) |
| Wholesale Trade | 10 (100.0%) | 0 (0.0%) |
| Retail Trade | 35 (92.1%) | 3 (7.9%) |
| Transportation & Warehousing | 16 (76.2%) | 5 (23.8%) |
| Utilities | 0 (0.0%) | 5 (100.0%) |
| Information | 0 (0.0%) | 0 (0.0%) |
| Finance & Insurance | 0 (0.0%) | 3 (100.0%) |
| Real Estate, Rental & Leasing | 0 (0.0%) | 0 (0.0%) |
| Professional & Scientific | 9 (69.2%) | 4 (30.8%) |
| Enterprise Management | 0 (0.0%) | 0 (0.0%) |
| Administrative & Support | 6 (35.3%) | 11 (64.7%) |
| Educational Services | 2 (6.9%) | 27 (93.1%) |
| Health Care & Social Assistance | 16 (19.5%) | 66 (80.5%) |
| Arts, Entertainment & Recreation | 1 (100.0%) | 0 (0.0%) |
| Accommodation & Food Services | 6 (46.2%) | 7 (53.8%) |
| Public Administration | 19 (63.3%) | 11 (36.7%) |
| Total | 211 (58.5%) | 150 (41.5%) |
Education in Wayne
School Enrollment in Wayne
The most common levels of schooling among the 228 students in Wayne are college / undergraduate (57 | 25.0%), elementary school (49 | 21.5%), and high school (42 | 18.4%).
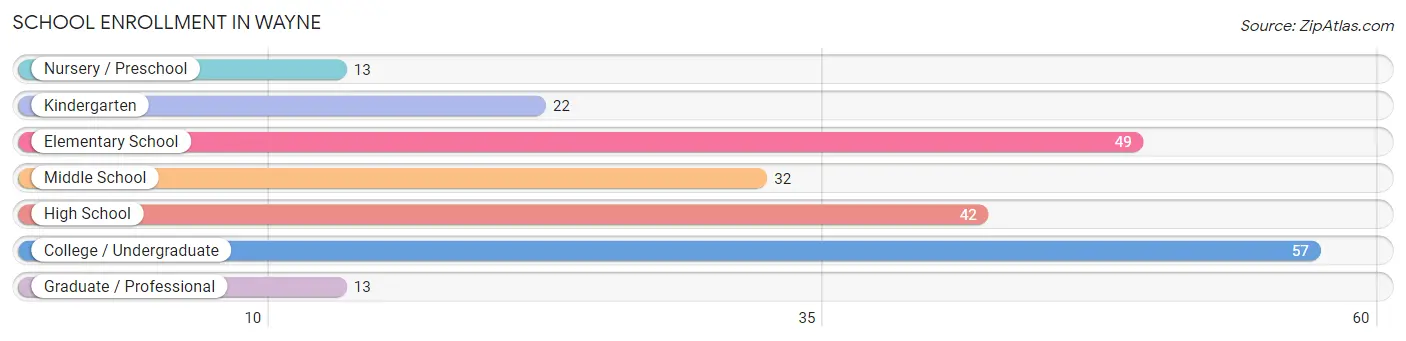
| School Level | # Students | % Students |
| Nursery / Preschool | 13 | 5.7% |
| Kindergarten | 22 | 9.7% |
| Elementary School | 49 | 21.5% |
| Middle School | 32 | 14.0% |
| High School | 42 | 18.4% |
| College / Undergraduate | 57 | 25.0% |
| Graduate / Professional | 13 | 5.7% |
| Total | 228 | 100.0% |
School Enrollment by Age by Funding Source in Wayne
Out of a total of 228 students who are enrolled in schools in Wayne, 19 (8.3%) attend a private institution, while the remaining 209 (91.7%) are enrolled in public schools. The age group of 35 years and over has the highest likelihood of being enrolled in private schools, with 8 (66.7% in the age bracket) enrolled. Conversely, the age group of 3 to 4 year olds has the lowest likelihood of being enrolled in a private school, with 8 (100.0% in the age bracket) attending a public institution.
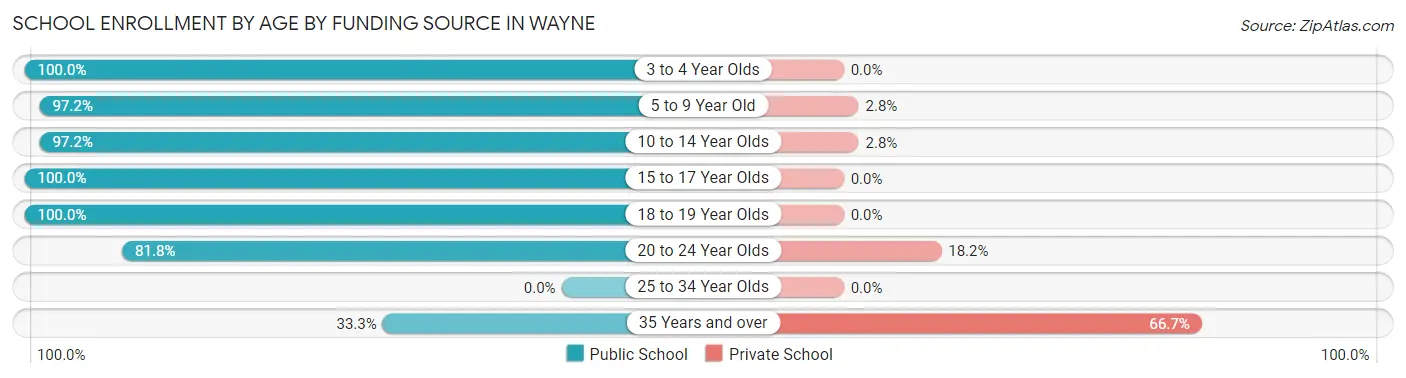
| Age Bracket | Public School | Private School |
| 3 to 4 Year Olds | 8 (100.0%) | 0 (0.0%) |
| 5 to 9 Year Old | 70 (97.2%) | 2 (2.8%) |
| 10 to 14 Year Olds | 35 (97.2%) | 1 (2.8%) |
| 15 to 17 Year Olds | 26 (100.0%) | 0 (0.0%) |
| 18 to 19 Year Olds | 30 (100.0%) | 0 (0.0%) |
| 20 to 24 Year Olds | 36 (81.8%) | 8 (18.2%) |
| 25 to 34 Year Olds | 0 (0.0%) | 0 (0.0%) |
| 35 Years and over | 4 (33.3%) | 8 (66.7%) |
| Total | 209 (91.7%) | 19 (8.3%) |
Educational Attainment by Field of Study in Wayne
Science & technology (25 | 36.8%), education (25 | 36.8%), business (13 | 19.1%), arts & humanities (4 | 5.9%), and liberal arts & history (1 | 1.5%) are the most common fields of study among 68 individuals in Wayne who have obtained a bachelor's degree or higher.
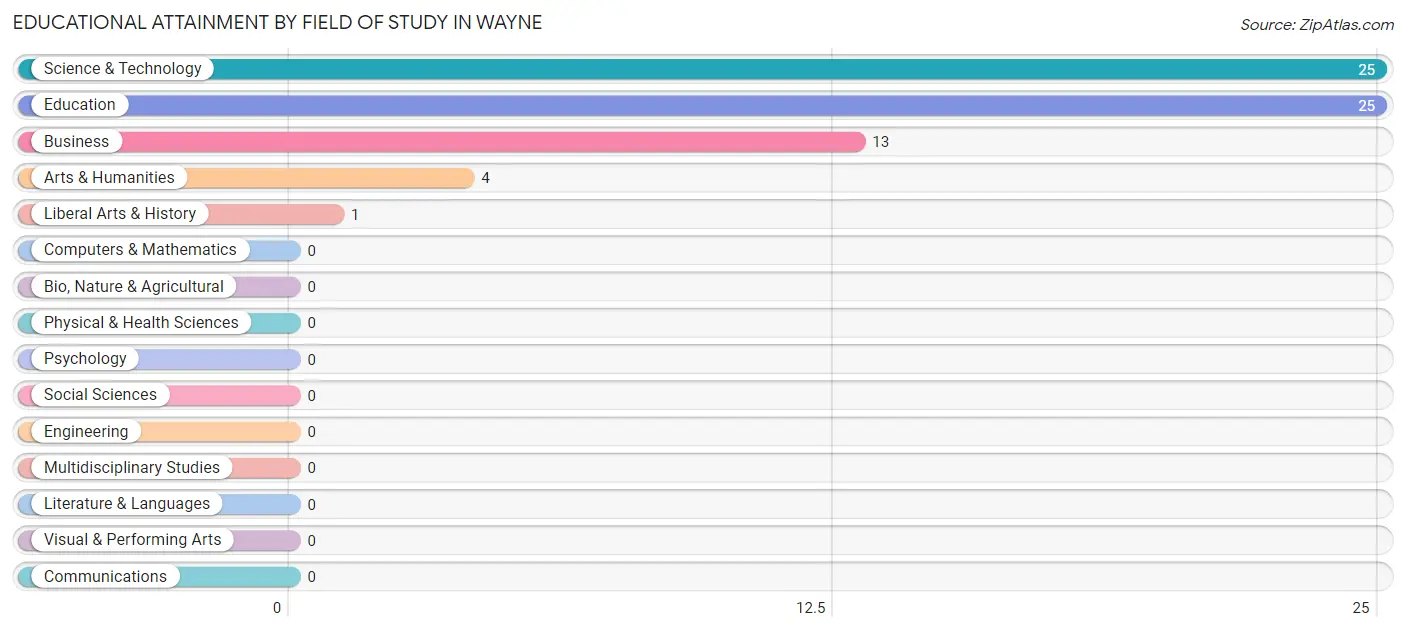
| Field of Study | # Graduates | % Graduates |
| Computers & Mathematics | 0 | 0.0% |
| Bio, Nature & Agricultural | 0 | 0.0% |
| Physical & Health Sciences | 0 | 0.0% |
| Psychology | 0 | 0.0% |
| Social Sciences | 0 | 0.0% |
| Engineering | 0 | 0.0% |
| Multidisciplinary Studies | 0 | 0.0% |
| Science & Technology | 25 | 36.8% |
| Business | 13 | 19.1% |
| Education | 25 | 36.8% |
| Literature & Languages | 0 | 0.0% |
| Liberal Arts & History | 1 | 1.5% |
| Visual & Performing Arts | 0 | 0.0% |
| Communications | 0 | 0.0% |
| Arts & Humanities | 4 | 5.9% |
| Total | 68 | 100.0% |
Transportation & Commute in Wayne
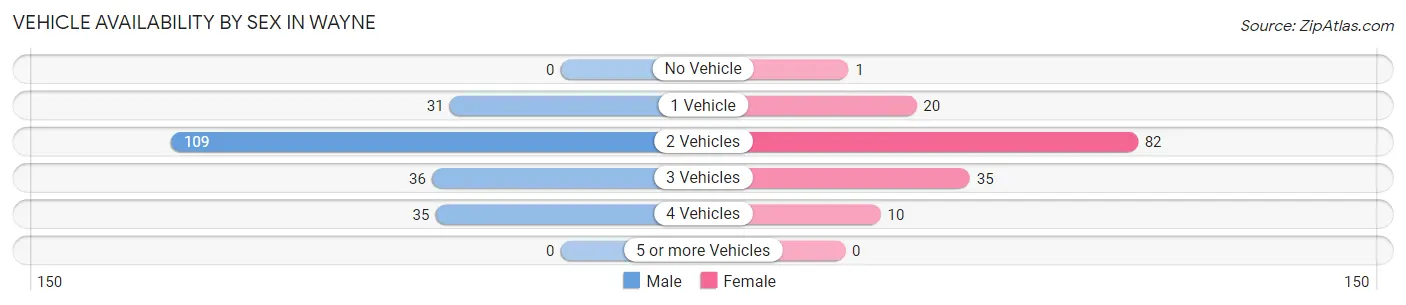
Vehicle Availability by Sex in Wayne
The most prevalent vehicle ownership categories in Wayne are males with 2 vehicles (109, accounting for 51.7%) and females with 2 vehicles (82, making up 73.7%).
| Vehicles Available | Male | Female |
| No Vehicle | 0 (0.0%) | 1 (0.7%) |
| 1 Vehicle | 31 (14.7%) | 20 (13.5%) |
| 2 Vehicles | 109 (51.7%) | 82 (55.4%) |
| 3 Vehicles | 36 (17.1%) | 35 (23.6%) |
| 4 Vehicles | 35 (16.6%) | 10 (6.8%) |
| 5 or more Vehicles | 0 (0.0%) | 0 (0.0%) |
| Total | 211 (100.0%) | 148 (100.0%) |
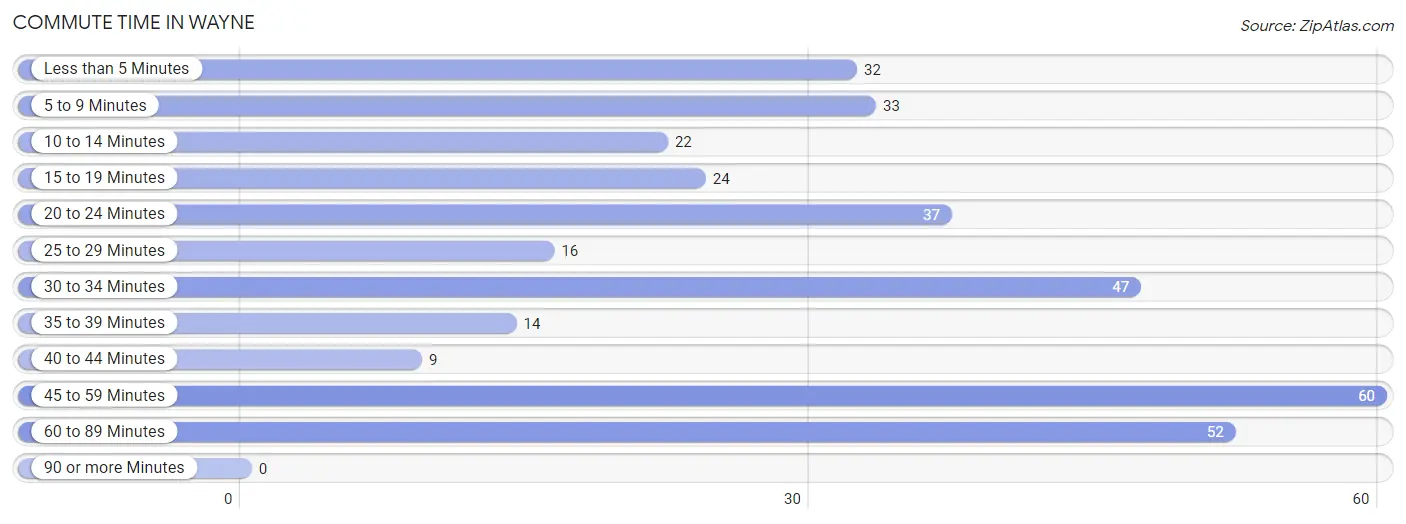
Commute Time in Wayne
The most frequently occuring commute durations in Wayne are 45 to 59 minutes (60 commuters, 17.3%), 60 to 89 minutes (52 commuters, 15.0%), and 30 to 34 minutes (47 commuters, 13.6%).
| Commute Time | # Commuters | % Commuters |
| Less than 5 Minutes | 32 | 9.2% |
| 5 to 9 Minutes | 33 | 9.5% |
| 10 to 14 Minutes | 22 | 6.4% |
| 15 to 19 Minutes | 24 | 6.9% |
| 20 to 24 Minutes | 37 | 10.7% |
| 25 to 29 Minutes | 16 | 4.6% |
| 30 to 34 Minutes | 47 | 13.6% |
| 35 to 39 Minutes | 14 | 4.1% |
| 40 to 44 Minutes | 9 | 2.6% |
| 45 to 59 Minutes | 60 | 17.3% |
| 60 to 89 Minutes | 52 | 15.0% |
| 90 or more Minutes | 0 | 0.0% |
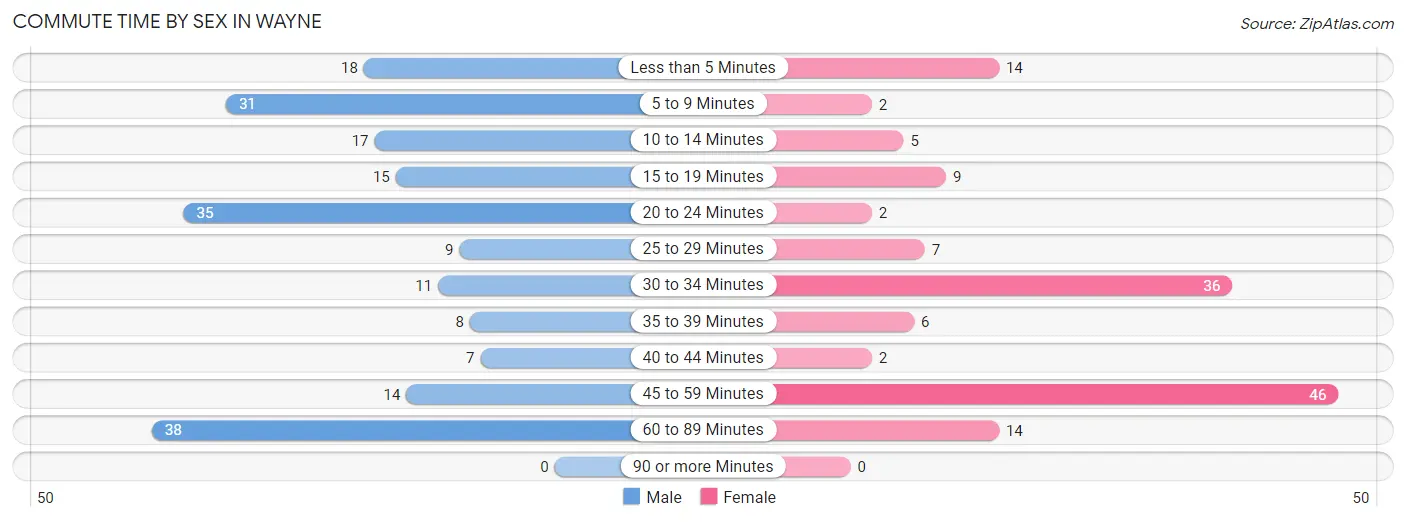
Commute Time by Sex in Wayne
The most common commute times in Wayne are 60 to 89 minutes (38 commuters, 18.7%) for males and 45 to 59 minutes (46 commuters, 32.2%) for females.
| Commute Time | Male | Female |
| Less than 5 Minutes | 18 (8.9%) | 14 (9.8%) |
| 5 to 9 Minutes | 31 (15.3%) | 2 (1.4%) |
| 10 to 14 Minutes | 17 (8.4%) | 5 (3.5%) |
| 15 to 19 Minutes | 15 (7.4%) | 9 (6.3%) |
| 20 to 24 Minutes | 35 (17.2%) | 2 (1.4%) |
| 25 to 29 Minutes | 9 (4.4%) | 7 (4.9%) |
| 30 to 34 Minutes | 11 (5.4%) | 36 (25.2%) |
| 35 to 39 Minutes | 8 (3.9%) | 6 (4.2%) |
| 40 to 44 Minutes | 7 (3.5%) | 2 (1.4%) |
| 45 to 59 Minutes | 14 (6.9%) | 46 (32.2%) |
| 60 to 89 Minutes | 38 (18.7%) | 14 (9.8%) |
| 90 or more Minutes | 0 (0.0%) | 0 (0.0%) |
Time of Departure to Work by Sex in Wayne
The most frequent times of departure to work in Wayne are 6:00 AM to 6:29 AM (31, 15.3%) for males and 6:30 AM to 6:59 AM (34, 23.8%) for females.
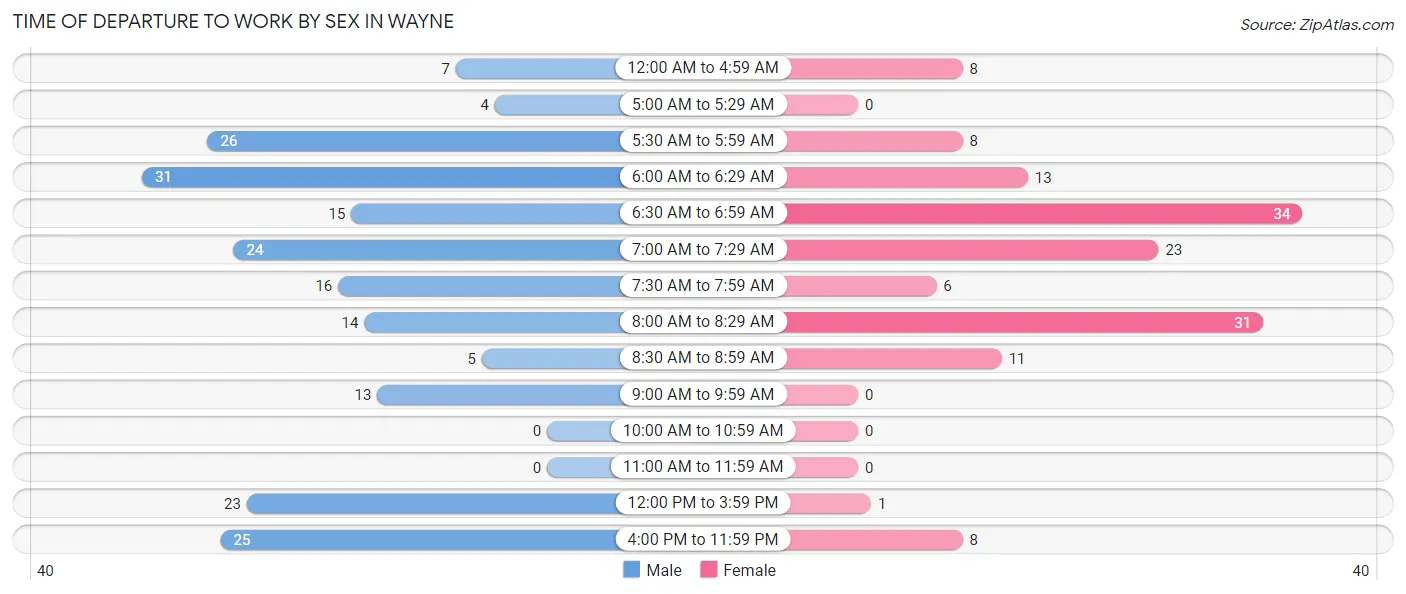
| Time of Departure | Male | Female |
| 12:00 AM to 4:59 AM | 7 (3.5%) | 8 (5.6%) |
| 5:00 AM to 5:29 AM | 4 (2.0%) | 0 (0.0%) |
| 5:30 AM to 5:59 AM | 26 (12.8%) | 8 (5.6%) |
| 6:00 AM to 6:29 AM | 31 (15.3%) | 13 (9.1%) |
| 6:30 AM to 6:59 AM | 15 (7.4%) | 34 (23.8%) |
| 7:00 AM to 7:29 AM | 24 (11.8%) | 23 (16.1%) |
| 7:30 AM to 7:59 AM | 16 (7.9%) | 6 (4.2%) |
| 8:00 AM to 8:29 AM | 14 (6.9%) | 31 (21.7%) |
| 8:30 AM to 8:59 AM | 5 (2.5%) | 11 (7.7%) |
| 9:00 AM to 9:59 AM | 13 (6.4%) | 0 (0.0%) |
| 10:00 AM to 10:59 AM | 0 (0.0%) | 0 (0.0%) |
| 11:00 AM to 11:59 AM | 0 (0.0%) | 0 (0.0%) |
| 12:00 PM to 3:59 PM | 23 (11.3%) | 1 (0.7%) |
| 4:00 PM to 11:59 PM | 25 (12.3%) | 8 (5.6%) |
| Total | 203 (100.0%) | 143 (100.0%) |
Housing Occupancy in Wayne
Occupancy by Ownership in Wayne
Of the total 305 dwellings in Wayne, owner-occupied units account for 194 (63.6%), while renter-occupied units make up 111 (36.4%).
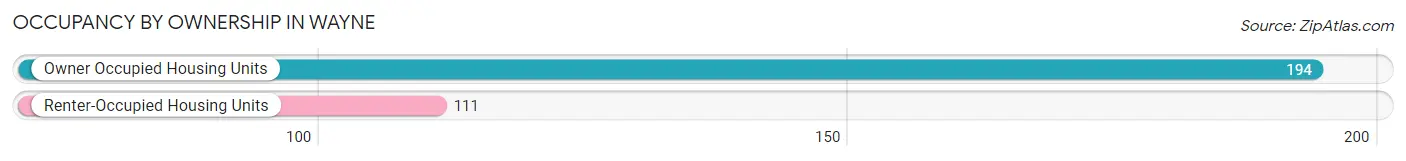
| Occupancy | # Housing Units | % Housing Units |
| Owner Occupied Housing Units | 194 | 63.6% |
| Renter-Occupied Housing Units | 111 | 36.4% |
| Total Occupied Housing Units | 305 | 100.0% |
Occupancy by Household Size in Wayne
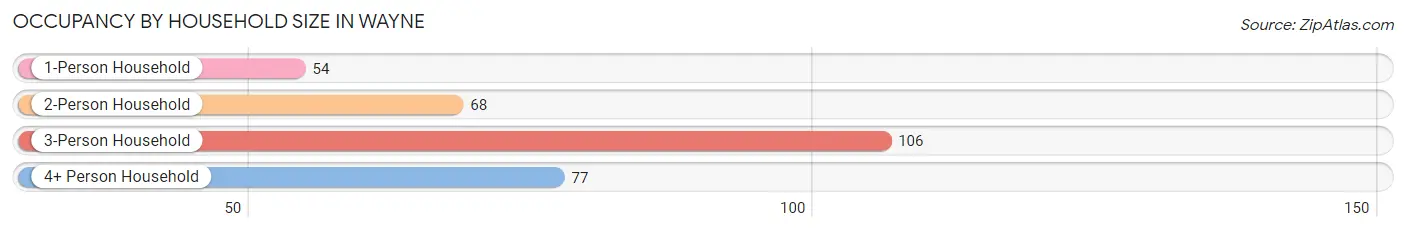
| Household Size | # Housing Units | % Housing Units |
| 1-Person Household | 54 | 17.7% |
| 2-Person Household | 68 | 22.3% |
| 3-Person Household | 106 | 34.7% |
| 4+ Person Household | 77 | 25.3% |
| Total Housing Units | 305 | 100.0% |
Occupancy by Ownership by Household Size in Wayne
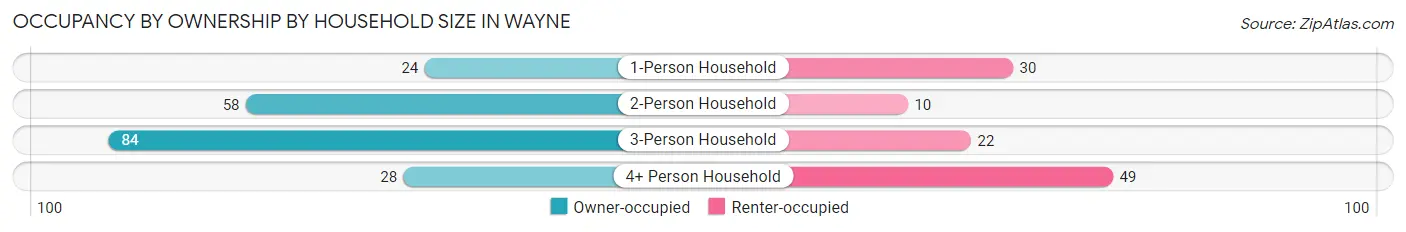
| Household Size | Owner-occupied | Renter-occupied |
| 1-Person Household | 24 (44.4%) | 30 (55.6%) |
| 2-Person Household | 58 (85.3%) | 10 (14.7%) |
| 3-Person Household | 84 (79.2%) | 22 (20.7%) |
| 4+ Person Household | 28 (36.4%) | 49 (63.6%) |
| Total Housing Units | 194 (63.6%) | 111 (36.4%) |
Occupancy by Educational Attainment in Wayne
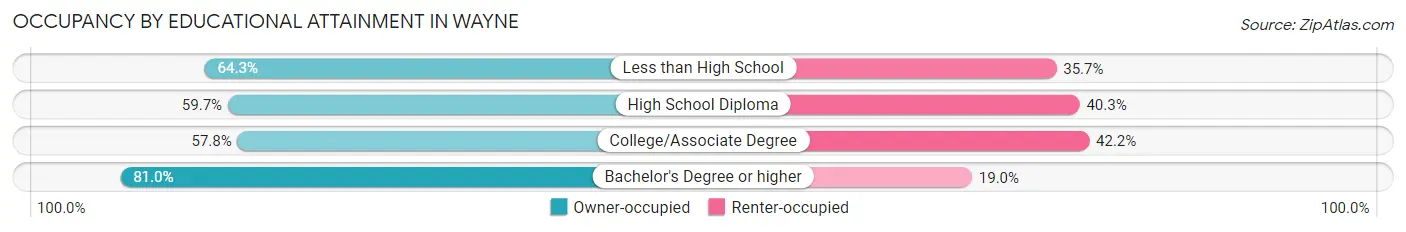
| Household Size | Owner-occupied | Renter-occupied |
| Less than High School | 18 (64.3%) | 10 (35.7%) |
| High School Diploma | 77 (59.7%) | 52 (40.3%) |
| College/Associate Degree | 52 (57.8%) | 38 (42.2%) |
| Bachelor's Degree or higher | 47 (81.0%) | 11 (19.0%) |
Occupancy by Age of Householder in Wayne
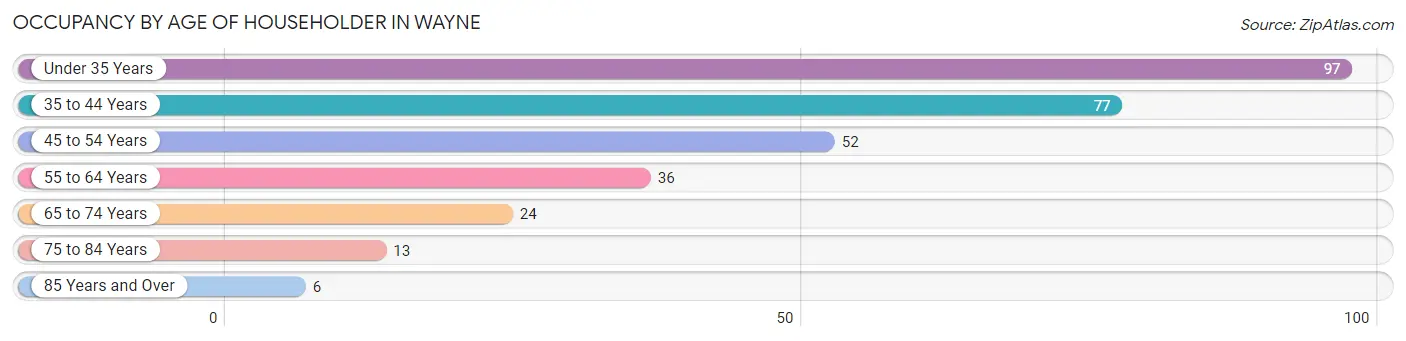
| Age Bracket | # Households | % Households |
| Under 35 Years | 97 | 31.8% |
| 35 to 44 Years | 77 | 25.3% |
| 45 to 54 Years | 52 | 17.1% |
| 55 to 64 Years | 36 | 11.8% |
| 65 to 74 Years | 24 | 7.9% |
| 75 to 84 Years | 13 | 4.3% |
| 85 Years and Over | 6 | 2.0% |
| Total | 305 | 100.0% |
Housing Finances in Wayne
Median Income by Occupancy in Wayne
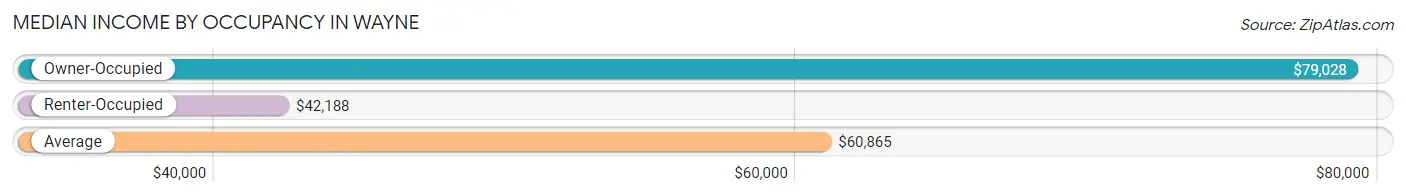
| Occupancy Type | # Households | Median Income |
| Owner-Occupied | 194 (63.6%) | $79,028 |
| Renter-Occupied | 111 (36.4%) | $42,188 |
| Average | 305 (100.0%) | $60,865 |
Occupancy by Householder Income Bracket in Wayne
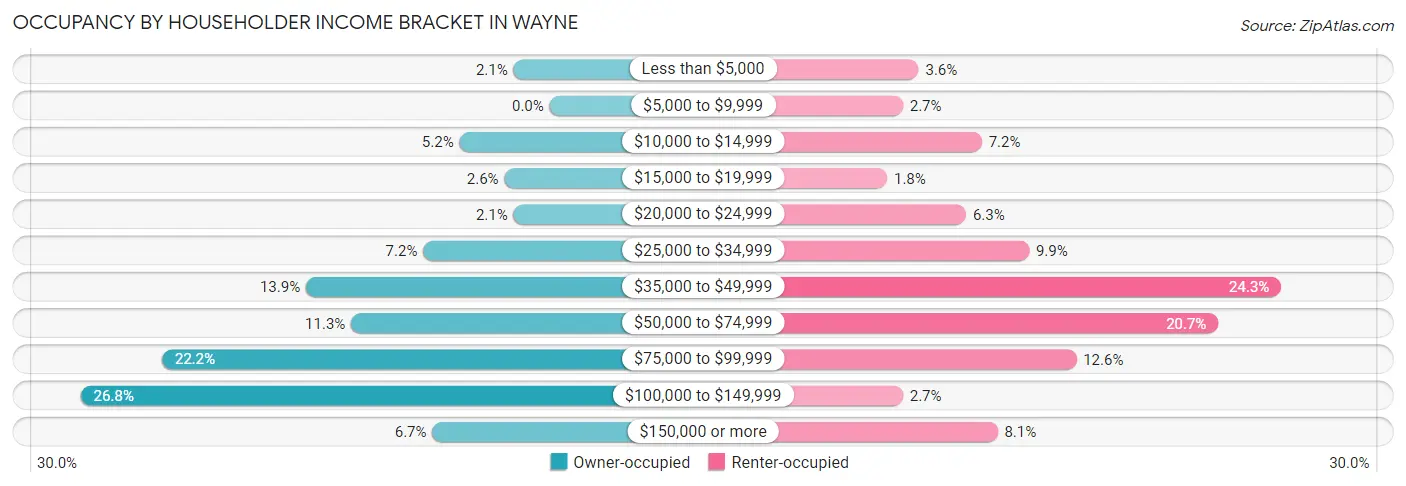
| Income Bracket | Owner-occupied | Renter-occupied |
| Less than $5,000 | 4 (2.1%) | 4 (3.6%) |
| $5,000 to $9,999 | 0 (0.0%) | 3 (2.7%) |
| $10,000 to $14,999 | 10 (5.1%) | 8 (7.2%) |
| $15,000 to $19,999 | 5 (2.6%) | 2 (1.8%) |
| $20,000 to $24,999 | 4 (2.1%) | 7 (6.3%) |
| $25,000 to $34,999 | 14 (7.2%) | 11 (9.9%) |
| $35,000 to $49,999 | 27 (13.9%) | 27 (24.3%) |
| $50,000 to $74,999 | 22 (11.3%) | 23 (20.7%) |
| $75,000 to $99,999 | 43 (22.2%) | 14 (12.6%) |
| $100,000 to $149,999 | 52 (26.8%) | 3 (2.7%) |
| $150,000 or more | 13 (6.7%) | 9 (8.1%) |
| Total | 194 (100.0%) | 111 (100.0%) |
Monthly Housing Cost Tiers in Wayne
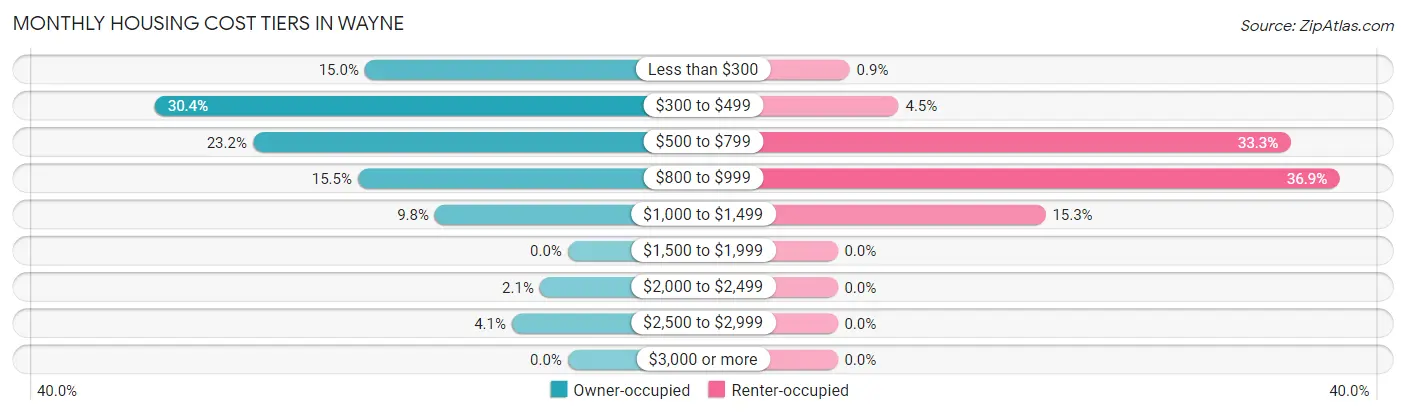
| Monthly Cost | Owner-occupied | Renter-occupied |
| Less than $300 | 29 (14.9%) | 1 (0.9%) |
| $300 to $499 | 59 (30.4%) | 5 (4.5%) |
| $500 to $799 | 45 (23.2%) | 37 (33.3%) |
| $800 to $999 | 30 (15.5%) | 41 (36.9%) |
| $1,000 to $1,499 | 19 (9.8%) | 17 (15.3%) |
| $1,500 to $1,999 | 0 (0.0%) | 0 (0.0%) |
| $2,000 to $2,499 | 4 (2.1%) | 0 (0.0%) |
| $2,500 to $2,999 | 8 (4.1%) | 0 (0.0%) |
| $3,000 or more | 0 (0.0%) | 0 (0.0%) |
| Total | 194 (100.0%) | 111 (100.0%) |
Physical Housing Characteristics in Wayne
Housing Structures in Wayne
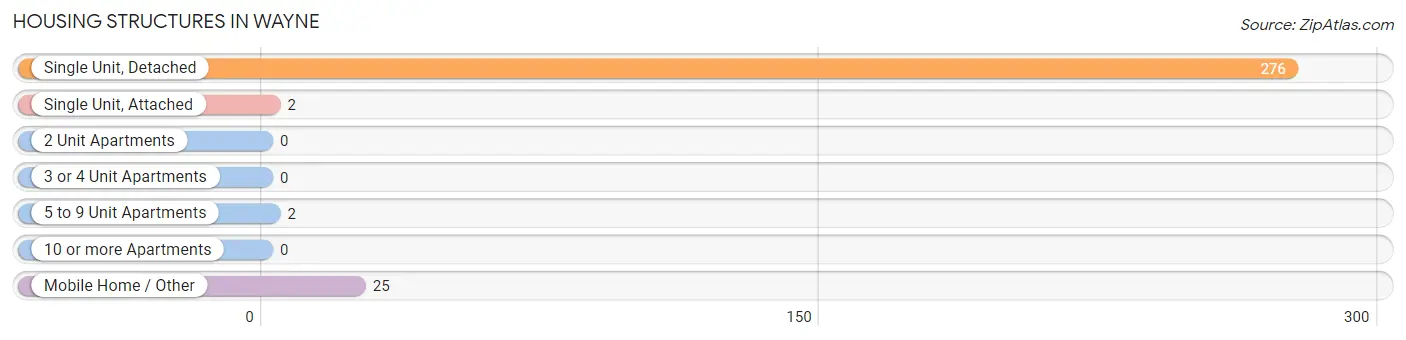
| Structure Type | # Housing Units | % Housing Units |
| Single Unit, Detached | 276 | 90.5% |
| Single Unit, Attached | 2 | 0.7% |
| 2 Unit Apartments | 0 | 0.0% |
| 3 or 4 Unit Apartments | 0 | 0.0% |
| 5 to 9 Unit Apartments | 2 | 0.7% |
| 10 or more Apartments | 0 | 0.0% |
| Mobile Home / Other | 25 | 8.2% |
| Total | 305 | 100.0% |
Housing Structures by Occupancy in Wayne
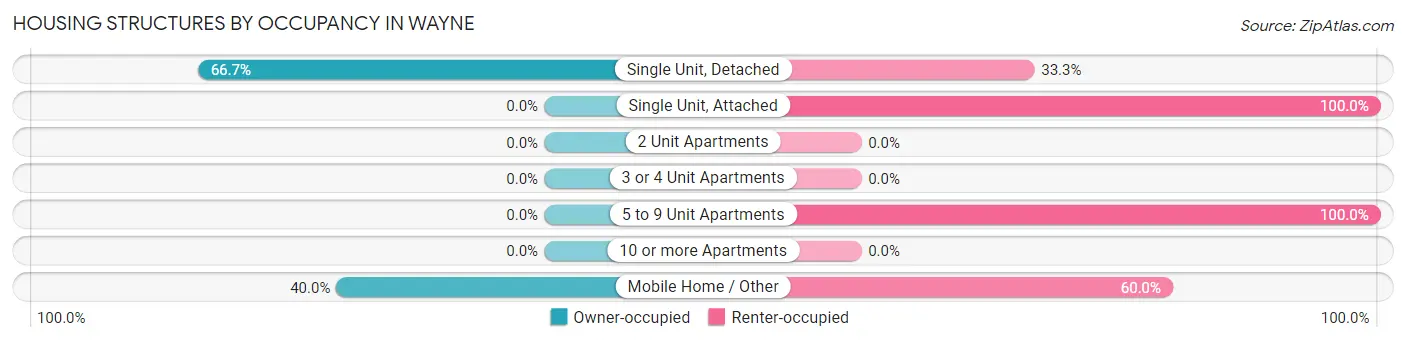
| Structure Type | Owner-occupied | Renter-occupied |
| Single Unit, Detached | 184 (66.7%) | 92 (33.3%) |
| Single Unit, Attached | 0 (0.0%) | 2 (100.0%) |
| 2 Unit Apartments | 0 (0.0%) | 0 (0.0%) |
| 3 or 4 Unit Apartments | 0 (0.0%) | 0 (0.0%) |
| 5 to 9 Unit Apartments | 0 (0.0%) | 2 (100.0%) |
| 10 or more Apartments | 0 (0.0%) | 0 (0.0%) |
| Mobile Home / Other | 10 (40.0%) | 15 (60.0%) |
| Total | 194 (63.6%) | 111 (36.4%) |
Housing Structures by Number of Rooms in Wayne
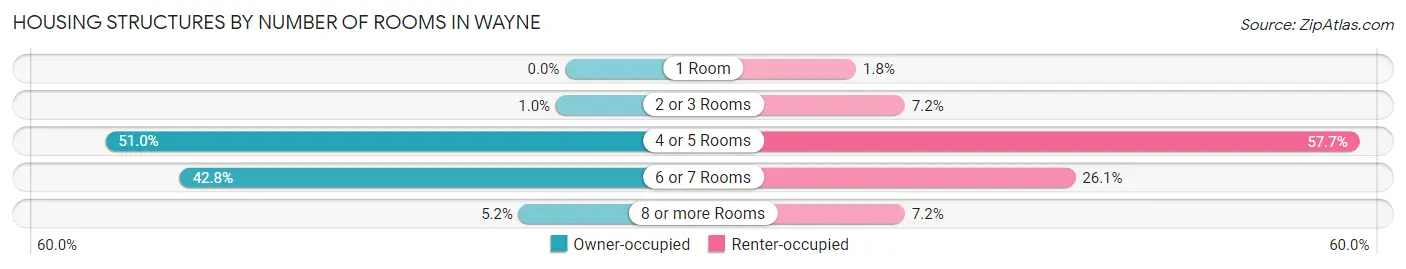
| Number of Rooms | Owner-occupied | Renter-occupied |
| 1 Room | 0 (0.0%) | 2 (1.8%) |
| 2 or 3 Rooms | 2 (1.0%) | 8 (7.2%) |
| 4 or 5 Rooms | 99 (51.0%) | 64 (57.7%) |
| 6 or 7 Rooms | 83 (42.8%) | 29 (26.1%) |
| 8 or more Rooms | 10 (5.1%) | 8 (7.2%) |
| Total | 194 (100.0%) | 111 (100.0%) |
Housing Structure by Heating Type in Wayne
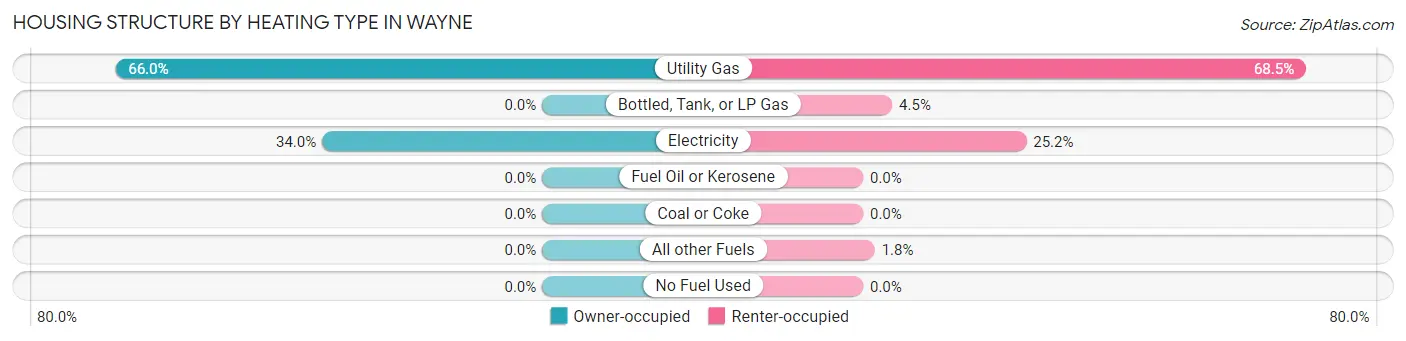
| Heating Type | Owner-occupied | Renter-occupied |
| Utility Gas | 128 (66.0%) | 76 (68.5%) |
| Bottled, Tank, or LP Gas | 0 (0.0%) | 5 (4.5%) |
| Electricity | 66 (34.0%) | 28 (25.2%) |
| Fuel Oil or Kerosene | 0 (0.0%) | 0 (0.0%) |
| Coal or Coke | 0 (0.0%) | 0 (0.0%) |
| All other Fuels | 0 (0.0%) | 2 (1.8%) |
| No Fuel Used | 0 (0.0%) | 0 (0.0%) |
| Total | 194 (100.0%) | 111 (100.0%) |
Household Vehicle Usage in Wayne
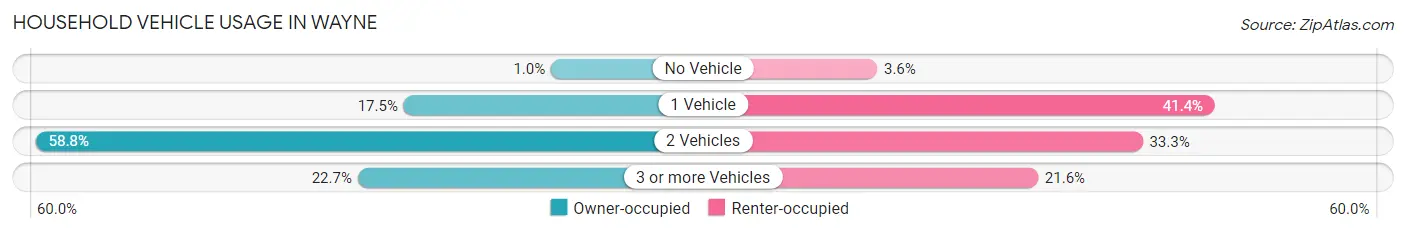
| Vehicles per Household | Owner-occupied | Renter-occupied |
| No Vehicle | 2 (1.0%) | 4 (3.6%) |
| 1 Vehicle | 34 (17.5%) | 46 (41.4%) |
| 2 Vehicles | 114 (58.8%) | 37 (33.3%) |
| 3 or more Vehicles | 44 (22.7%) | 24 (21.6%) |
| Total | 194 (100.0%) | 111 (100.0%) |
Real Estate & Mortgages in Wayne
Real Estate and Mortgage Overview in Wayne
| Characteristic | Without Mortgage | With Mortgage |
| Housing Units | 92 | 102 |
| Median Property Value | $87,500 | $152,200 |
| Median Household Income | $59,375 | $13 |
| Monthly Housing Costs | $321 | $0 |
| Real Estate Taxes | $553 | $4 |
Property Value by Mortgage Status in Wayne
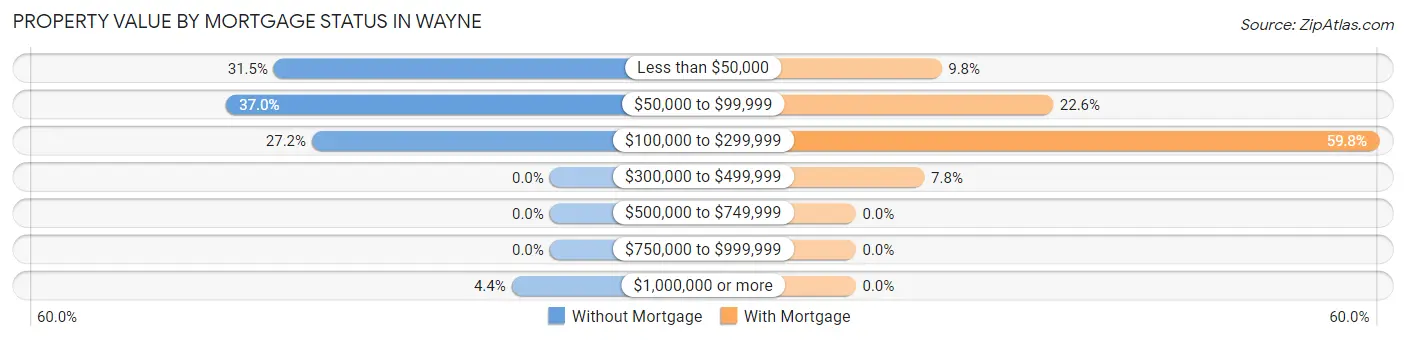
| Property Value | Without Mortgage | With Mortgage |
| Less than $50,000 | 29 (31.5%) | 10 (9.8%) |
| $50,000 to $99,999 | 34 (37.0%) | 23 (22.6%) |
| $100,000 to $299,999 | 25 (27.2%) | 61 (59.8%) |
| $300,000 to $499,999 | 0 (0.0%) | 8 (7.8%) |
| $500,000 to $749,999 | 0 (0.0%) | 0 (0.0%) |
| $750,000 to $999,999 | 0 (0.0%) | 0 (0.0%) |
| $1,000,000 or more | 4 (4.3%) | 0 (0.0%) |
| Total | 92 (100.0%) | 102 (100.0%) |
Household Income by Mortgage Status in Wayne
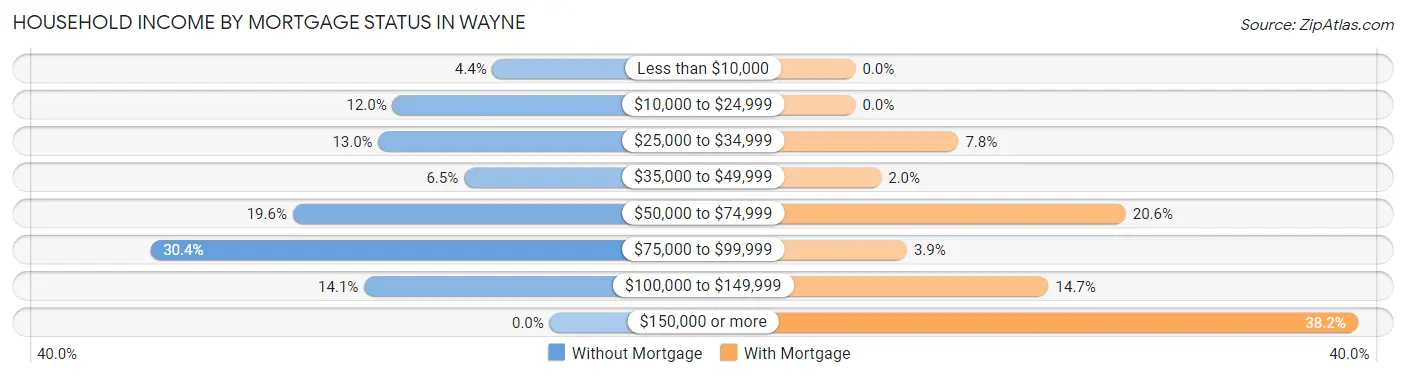
| Household Income | Without Mortgage | With Mortgage |
| Less than $10,000 | 4 (4.3%) | 0 (0.0%) |
| $10,000 to $24,999 | 11 (12.0%) | 0 (0.0%) |
| $25,000 to $34,999 | 12 (13.0%) | 8 (7.8%) |
| $35,000 to $49,999 | 6 (6.5%) | 2 (2.0%) |
| $50,000 to $74,999 | 18 (19.6%) | 21 (20.6%) |
| $75,000 to $99,999 | 28 (30.4%) | 4 (3.9%) |
| $100,000 to $149,999 | 13 (14.1%) | 15 (14.7%) |
| $150,000 or more | 0 (0.0%) | 39 (38.2%) |
| Total | 92 (100.0%) | 102 (100.0%) |
Property Value to Household Income Ratio in Wayne
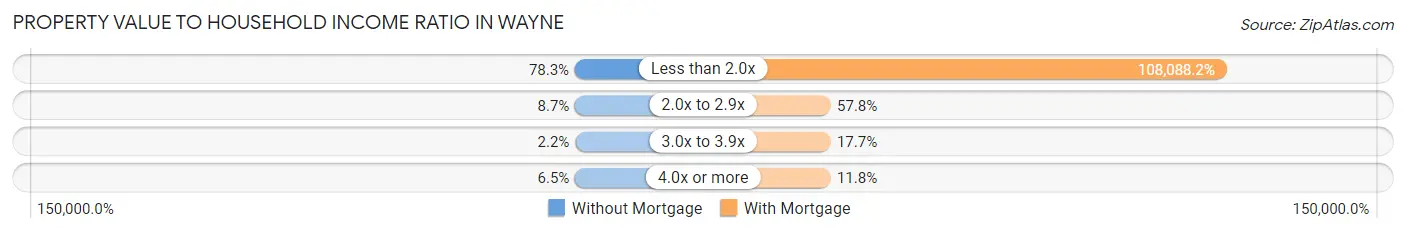
| Value-to-Income Ratio | Without Mortgage | With Mortgage |
| Less than 2.0x | 72 (78.3%) | 110,250 (108,088.2%) |
| 2.0x to 2.9x | 8 (8.7%) | 59 (57.8%) |
| 3.0x to 3.9x | 2 (2.2%) | 18 (17.6%) |
| 4.0x or more | 6 (6.5%) | 12 (11.8%) |
| Total | 92 (100.0%) | 102 (100.0%) |
Real Estate Taxes by Mortgage Status in Wayne
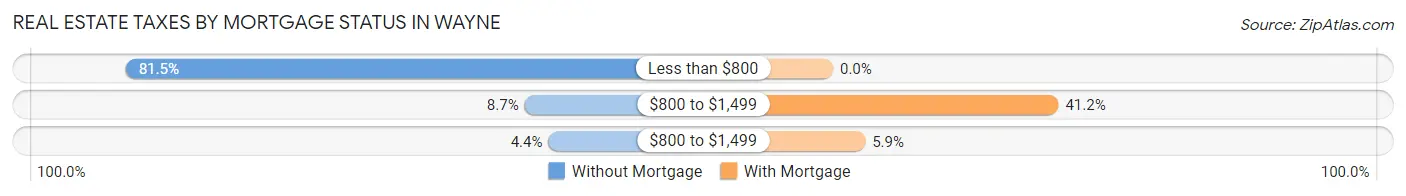
| Property Taxes | Without Mortgage | With Mortgage |
| Less than $800 | 75 (81.5%) | 0 (0.0%) |
| $800 to $1,499 | 8 (8.7%) | 42 (41.2%) |
| $800 to $1,499 | 4 (4.3%) | 6 (5.9%) |
| Total | 92 (100.0%) | 102 (100.0%) |
Health & Disability in Wayne
Health Insurance Coverage by Age in Wayne
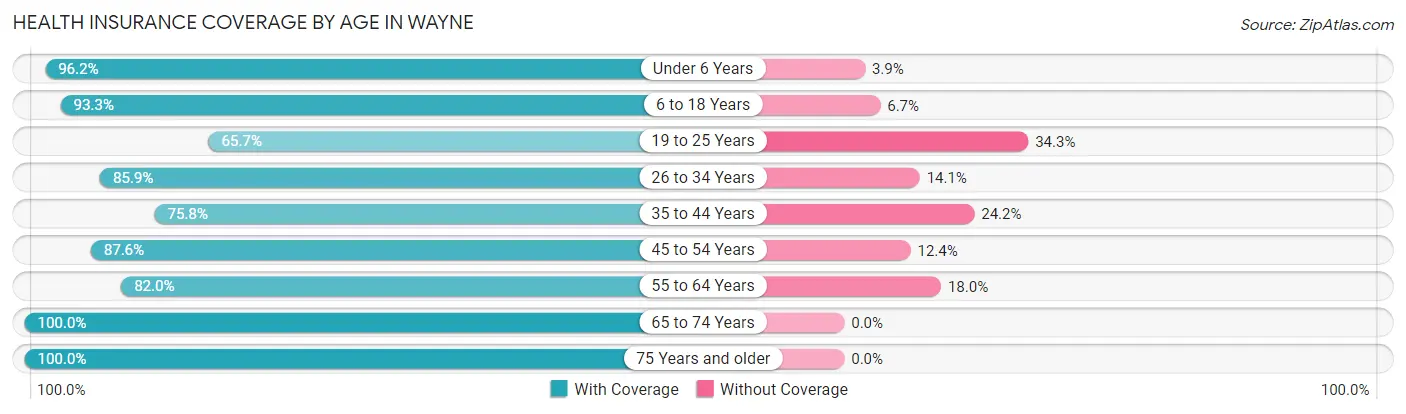
| Age Bracket | With Coverage | Without Coverage |
| Under 6 Years | 75 (96.2%) | 3 (3.8%) |
| 6 to 18 Years | 139 (93.3%) | 10 (6.7%) |
| 19 to 25 Years | 113 (65.7%) | 59 (34.3%) |
| 26 to 34 Years | 55 (85.9%) | 9 (14.1%) |
| 35 to 44 Years | 100 (75.8%) | 32 (24.2%) |
| 45 to 54 Years | 78 (87.6%) | 11 (12.4%) |
| 55 to 64 Years | 50 (82.0%) | 11 (18.0%) |
| 65 to 74 Years | 35 (100.0%) | 0 (0.0%) |
| 75 Years and older | 31 (100.0%) | 0 (0.0%) |
| Total | 676 (83.4%) | 135 (16.7%) |
Health Insurance Coverage by Citizenship Status in Wayne
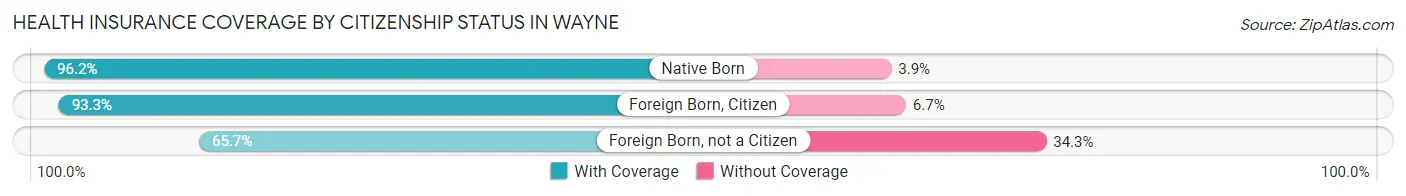
| Citizenship Status | With Coverage | Without Coverage |
| Native Born | 75 (96.2%) | 3 (3.8%) |
| Foreign Born, Citizen | 139 (93.3%) | 10 (6.7%) |
| Foreign Born, not a Citizen | 113 (65.7%) | 59 (34.3%) |
Health Insurance Coverage by Household Income in Wayne
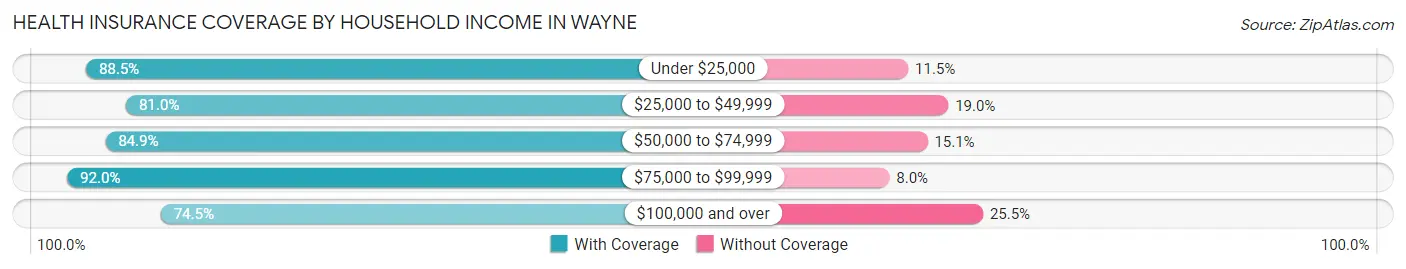
| Household Income | With Coverage | Without Coverage |
| Under $25,000 | 100 (88.5%) | 13 (11.5%) |
| $25,000 to $49,999 | 162 (81.0%) | 38 (19.0%) |
| $50,000 to $74,999 | 118 (84.9%) | 21 (15.1%) |
| $75,000 to $99,999 | 150 (92.0%) | 13 (8.0%) |
| $100,000 and over | 146 (74.5%) | 50 (25.5%) |
Public vs Private Health Insurance Coverage by Age in Wayne
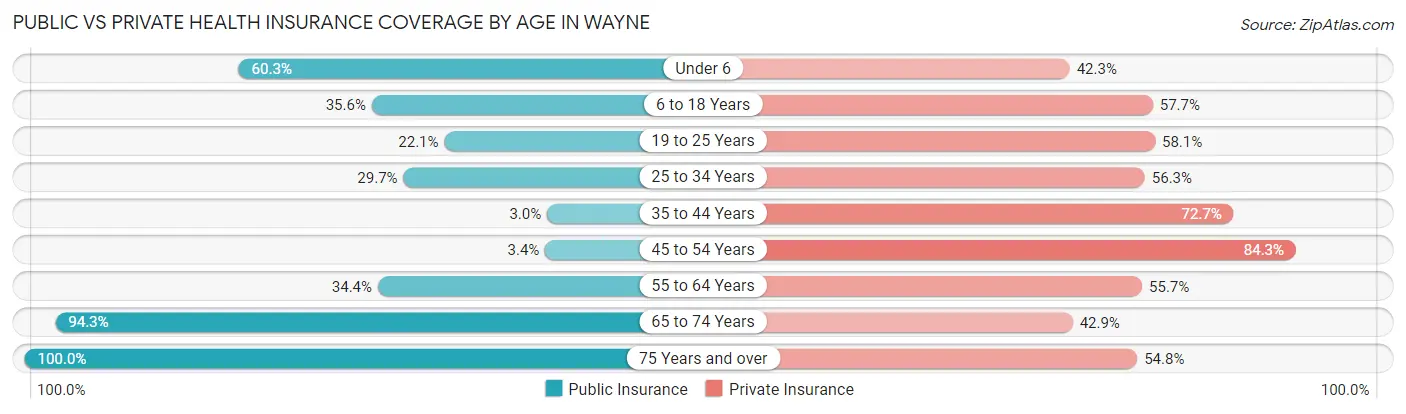
| Age Bracket | Public Insurance | Private Insurance |
| Under 6 | 47 (60.3%) | 33 (42.3%) |
| 6 to 18 Years | 53 (35.6%) | 86 (57.7%) |
| 19 to 25 Years | 38 (22.1%) | 100 (58.1%) |
| 25 to 34 Years | 19 (29.7%) | 36 (56.2%) |
| 35 to 44 Years | 4 (3.0%) | 96 (72.7%) |
| 45 to 54 Years | 3 (3.4%) | 75 (84.3%) |
| 55 to 64 Years | 21 (34.4%) | 34 (55.7%) |
| 65 to 74 Years | 33 (94.3%) | 15 (42.9%) |
| 75 Years and over | 31 (100.0%) | 17 (54.8%) |
| Total | 249 (30.7%) | 492 (60.7%) |
Disability Status by Sex by Age in Wayne
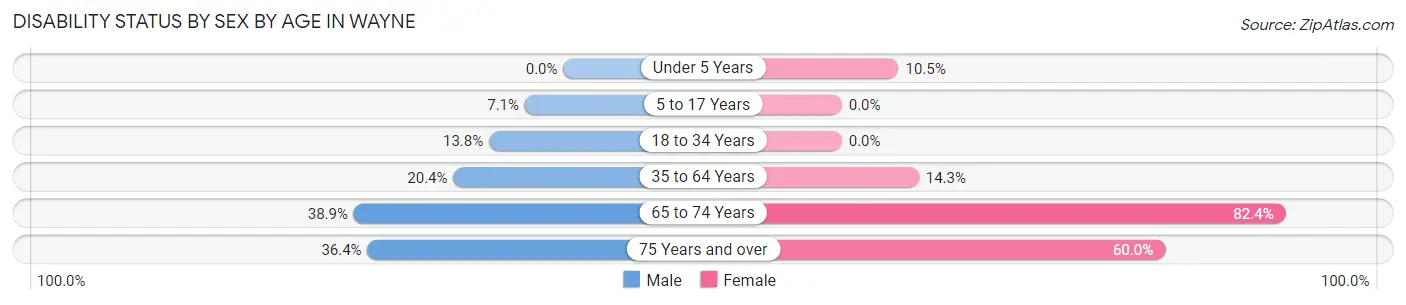
| Age Bracket | Male | Female |
| Under 5 Years | 0 (0.0%) | 4 (10.5%) |
| 5 to 17 Years | 7 (7.1%) | 0 (0.0%) |
| 18 to 34 Years | 16 (13.8%) | 0 (0.0%) |
| 35 to 64 Years | 29 (20.4%) | 20 (14.3%) |
| 65 to 74 Years | 7 (38.9%) | 14 (82.4%) |
| 75 Years and over | 4 (36.4%) | 12 (60.0%) |
Disability Class by Sex by Age in Wayne
Disability Class: Hearing Difficulty
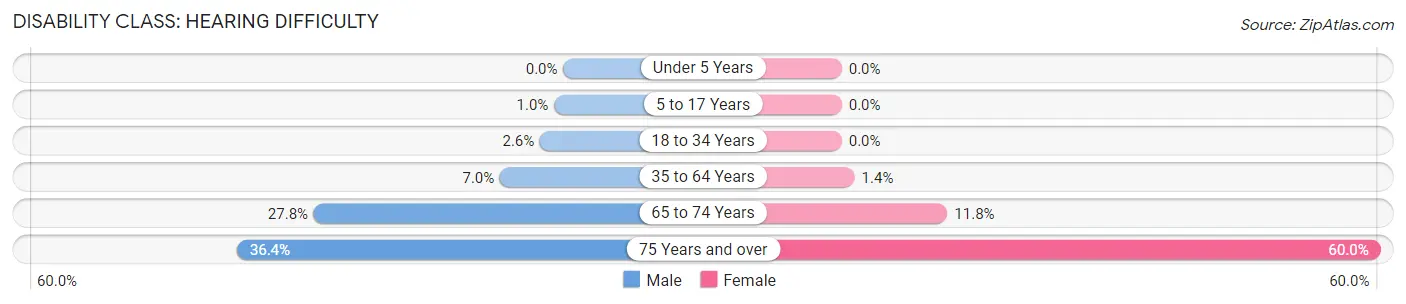
| Age Bracket | Male | Female |
| Under 5 Years | 0 (0.0%) | 0 (0.0%) |
| 5 to 17 Years | 1 (1.0%) | 0 (0.0%) |
| 18 to 34 Years | 3 (2.6%) | 0 (0.0%) |
| 35 to 64 Years | 10 (7.0%) | 2 (1.4%) |
| 65 to 74 Years | 5 (27.8%) | 2 (11.8%) |
| 75 Years and over | 4 (36.4%) | 12 (60.0%) |
Disability Class: Vision Difficulty
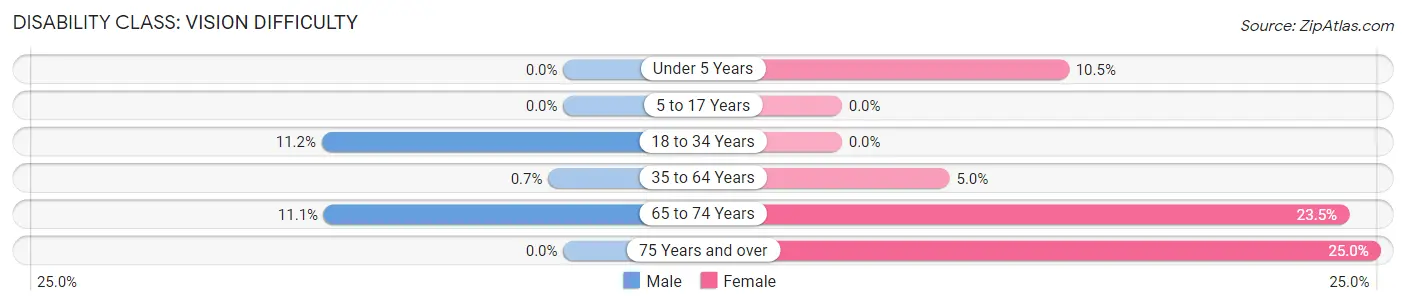
| Age Bracket | Male | Female |
| Under 5 Years | 0 (0.0%) | 4 (10.5%) |
| 5 to 17 Years | 0 (0.0%) | 0 (0.0%) |
| 18 to 34 Years | 13 (11.2%) | 0 (0.0%) |
| 35 to 64 Years | 1 (0.7%) | 7 (5.0%) |
| 65 to 74 Years | 2 (11.1%) | 4 (23.5%) |
| 75 Years and over | 0 (0.0%) | 5 (25.0%) |
Disability Class: Cognitive Difficulty
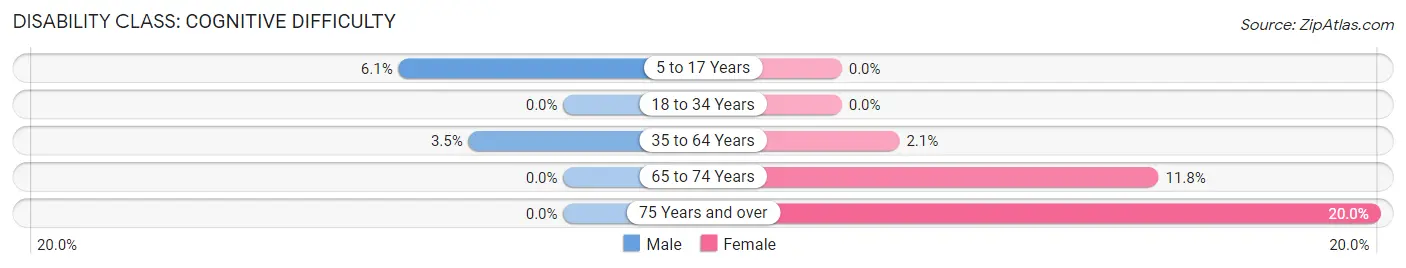
| Age Bracket | Male | Female |
| 5 to 17 Years | 6 (6.1%) | 0 (0.0%) |
| 18 to 34 Years | 0 (0.0%) | 0 (0.0%) |
| 35 to 64 Years | 5 (3.5%) | 3 (2.1%) |
| 65 to 74 Years | 0 (0.0%) | 2 (11.8%) |
| 75 Years and over | 0 (0.0%) | 4 (20.0%) |
Disability Class: Ambulatory Difficulty
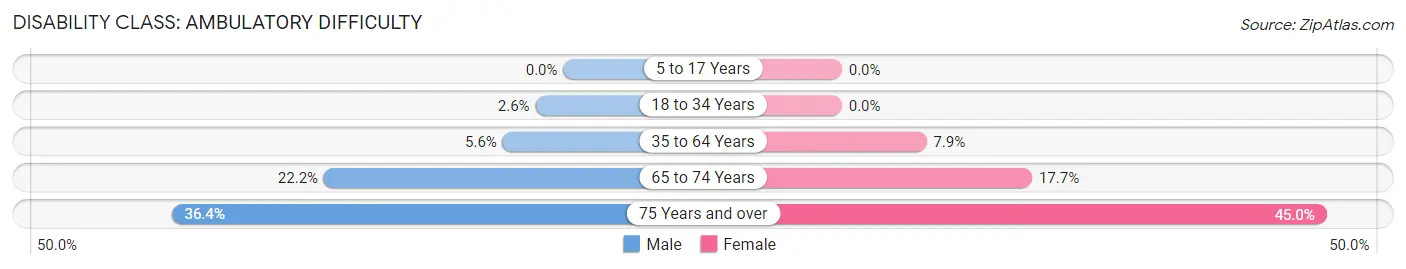
| Age Bracket | Male | Female |
| 5 to 17 Years | 0 (0.0%) | 0 (0.0%) |
| 18 to 34 Years | 3 (2.6%) | 0 (0.0%) |
| 35 to 64 Years | 8 (5.6%) | 11 (7.9%) |
| 65 to 74 Years | 4 (22.2%) | 3 (17.6%) |
| 75 Years and over | 4 (36.4%) | 9 (45.0%) |
Disability Class: Self-Care Difficulty
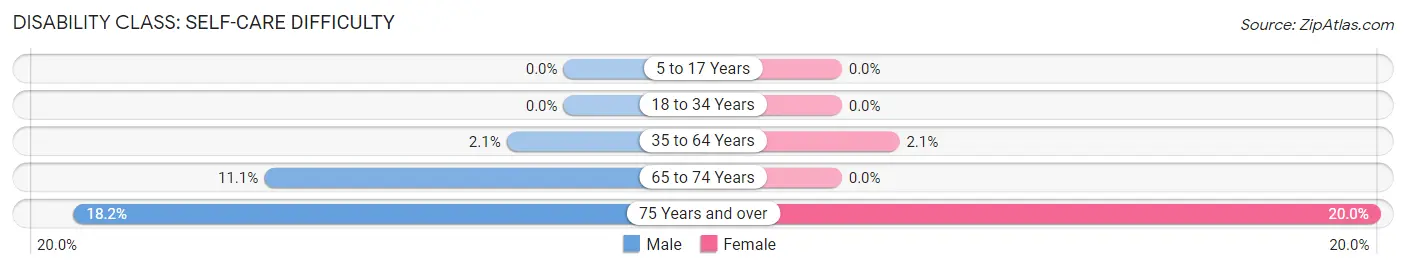
| Age Bracket | Male | Female |
| 5 to 17 Years | 0 (0.0%) | 0 (0.0%) |
| 18 to 34 Years | 0 (0.0%) | 0 (0.0%) |
| 35 to 64 Years | 3 (2.1%) | 3 (2.1%) |
| 65 to 74 Years | 2 (11.1%) | 0 (0.0%) |
| 75 Years and over | 2 (18.2%) | 4 (20.0%) |
Technology Access in Wayne
Computing Device Access in Wayne
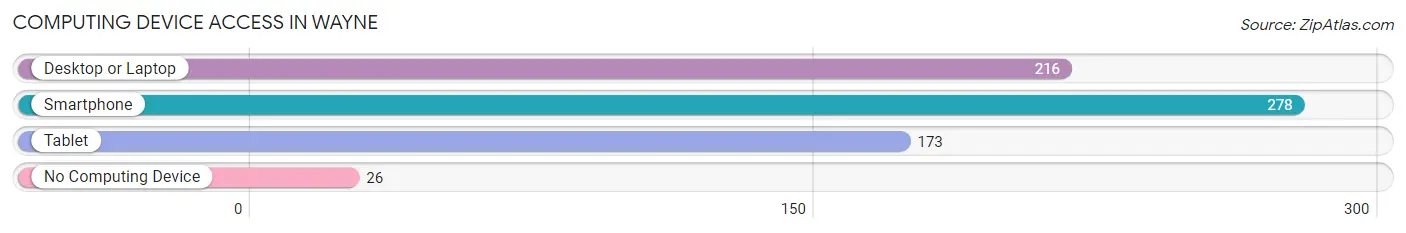
| Device Type | # Households | % Households |
| Desktop or Laptop | 216 | 70.8% |
| Smartphone | 278 | 91.1% |
| Tablet | 173 | 56.7% |
| No Computing Device | 26 | 8.5% |
| Total | 305 | 100.0% |
Internet Access in Wayne
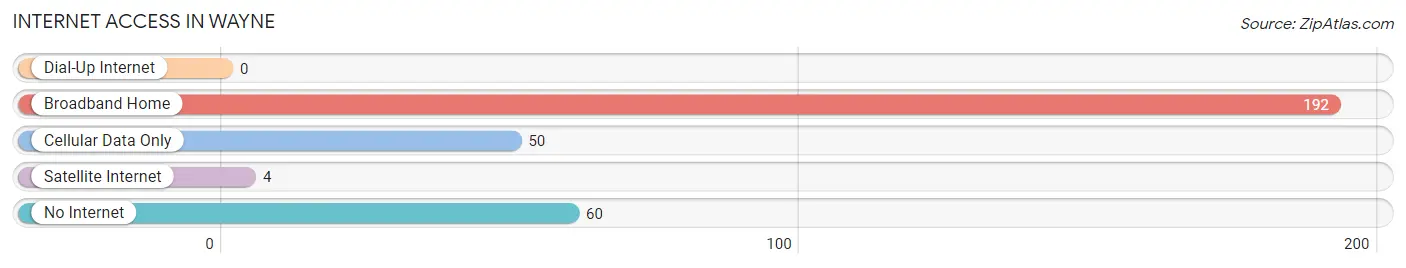
| Internet Type | # Households | % Households |
| Dial-Up Internet | 0 | 0.0% |
| Broadband Home | 192 | 62.9% |
| Cellular Data Only | 50 | 16.4% |
| Satellite Internet | 4 | 1.3% |
| No Internet | 60 | 19.7% |
| Total | 305 | 100.0% |
Wayne Summary
Wayne, Oklahoma is a small town located in the southwestern corner of the state, near the Texas border. It is part of Caddo County and is situated on the banks of the Red River. The town was founded in 1891 and was named after the nearby Fort Wayne, which was established in 1837. The town has a population of approximately 1,000 people and is known for its rural charm and friendly atmosphere.
Geography
Wayne is located in the southwestern corner of Oklahoma, near the Texas border. It is situated on the banks of the Red River, which forms the border between Oklahoma and Texas. The town is located in the Red River Valley, which is a flat, fertile region of the state. The area is known for its rolling hills and lush vegetation. The town is surrounded by farmland and is home to several small lakes and ponds.
The climate in Wayne is generally mild, with hot summers and cold winters. The average temperature in the summer is around 90 degrees Fahrenheit, while the average temperature in the winter is around 40 degrees Fahrenheit. The town receives an average of 40 inches of precipitation each year, with most of it falling in the spring and summer months.
Economy
The economy of Wayne is largely based on agriculture. The town is home to several farms and ranches, which produce a variety of crops and livestock. The town is also home to several small businesses, including a grocery store, a hardware store, and a few restaurants.
The town is also home to a few manufacturing companies, which produce a variety of products, including furniture, clothing, and automotive parts. The town is also home to a few oil and gas companies, which are involved in the exploration and production of oil and gas in the area.
Demographics
As of the 2010 census, the population of Wayne was 1,000 people. The racial makeup of the town was 95.2% White, 0.7% African American, 0.7% Native American, 0.3% Asian, 0.1% Pacific Islander, and 2.1% from other races. The median household income in the town was $31,250, and the median family income was $37,500.
The town is home to a variety of religious denominations, including Baptist, Methodist, and Catholic. The town is also home to a few churches, including the First Baptist Church of Wayne and the Wayne United Methodist Church.
Conclusion
Wayne, Oklahoma is a small town located in the southwestern corner of the state, near the Texas border. It is part of Caddo County and is situated on the banks of the Red River. The town was founded in 1891 and is known for its rural charm and friendly atmosphere. The economy of Wayne is largely based on agriculture, with several farms and ranches in the area. The town is also home to several small businesses and manufacturing companies. The population of Wayne is approximately 1,000 people, with a median household income of $31,250. The town is home to a variety of religious denominations and is known for its friendly atmosphere.
Common Questions
What is Per Capita Income in Wayne?
Per Capita income in Wayne is $24,487.
What is the Median Family Income in Wayne?
Median Family Income in Wayne is $78,819.
What is the Median Household income in Wayne?
Median Household Income in Wayne is $60,865.
What is Income or Wage Gap in Wayne?
Income or Wage Gap in Wayne is 0.6%.
Women in Wayne earn 99.4 cents for every dollar earned by a man.
What is Inequality or Gini Index in Wayne?
Inequality or Gini Index in Wayne is 0.40.
What is the Total Population of Wayne?
Total Population of Wayne is 811.
What is the Total Male Population of Wayne?
Total Male Population of Wayne is 407.
What is the Total Female Population of Wayne?
Total Female Population of Wayne is 404.
What is the Ratio of Males per 100 Females in Wayne?
There are 100.74 Males per 100 Females in Wayne.
What is the Ratio of Females per 100 Males in Wayne?
There are 99.26 Females per 100 Males in Wayne.
What is the Median Population Age in Wayne?
Median Population Age in Wayne is 26.8 Years.
What is the Average Family Size in Wayne
Average Family Size in Wayne is 2.8 People.
What is the Average Household Size in Wayne
Average Household Size in Wayne is 2.7 People.
How Large is the Labor Force in Wayne?
There are 363 People in the Labor Forcein in Wayne.
What is the Percentage of People in the Labor Force in Wayne?
58.6% of People are in the Labor Force in Wayne.
What is the Unemployment Rate in Wayne?
Unemployment Rate in Wayne is 0.6%.