Zip Codes with the Highest Percentage of Population Employed in Computer & Mathematics in Oklahoma City, OK

RELATED REPORTS & OPTIONS

Computer & Mathematics
Population
Families and Households
Female Fertility
Female Fertility (Unmarried)
Race (Community Size)
Race (Percentage)
Ancestry (Community Size)
AfricanAlaska NativeAlbanianAmericanApacheArabArapahoArgentineanArmenianAustralianAustrianBahamianBangladeshiBarbadianBasqueBelgianBhutaneseBlackfeetBolivianBrazilianBritishBritish West IndianBulgarianBurmeseCajunCambodianCanadianCelticCentral AmericanCentral American IndianCherokeeCheyenneChickasawChileanChippewaChoctawColombianComancheCreeCreekCroatianCubanCzechCzechoslovakianDanishDelawareDominicanDutchDutch West IndianEastern EuropeanEcuadorianEgyptianEnglishEstonianEthiopianEuropeanFijianFilipinoFinnishFrenchFrench American IndianFrench CanadianGermanGerman RussianGhanaianGreekGuamanian / ChamorroGuatemalanGuyaneseHaitianHonduranHopiHungarianIcelanderIndian (Asian)IndonesianInupiatIranianIraqiIrishIroquoisIsraeliItalianJamaicanJapaneseJordanianKenyanKiowaKoreanLaotianLatvianLebaneseLiberianLithuanianLuxembourgerMalaysianMexicanMexican American IndianMongolianMoroccanNative HawaiianNavajoNew ZealanderNicaraguanNigerianNorthern EuropeanNorwegianOkinawanOsagePakistaniPalestinianPanamanianPennsylvania GermanPeruvianPimaPolishPortuguesePotawatomiPuebloPuerto RicanRomanianRussianSalvadoranSamoanScandinavianScotch-IrishScottishSeminoleSerbianSiouxSlavicSlovakSloveneSouth AfricanSouth AmericanSouth American IndianSpaniardSpanishSpanish American IndianSri LankanSubsaharan AfricanSudaneseSwedishSwissSyrianThaiTlingit-HaidaTonganTrinidadian and TobagonianTurkishU.S. Virgin IslanderUkrainianUruguayanVenezuelanVietnameseWelshWest IndianYugoslavianZimbabwean
Ancestry (Percentage)
AfricanAlaska NativeAlbanianAmericanApacheArabArapahoArgentineanArmenianAustralianAustrianBahamianBangladeshiBarbadianBasqueBelgianBhutaneseBlackfeetBolivianBrazilianBritishBritish West IndianBulgarianBurmeseCajunCambodianCanadianCelticCentral AmericanCentral American IndianCherokeeCheyenneChickasawChileanChippewaChoctawColombianComancheCreeCreekCroatianCubanCzechCzechoslovakianDanishDelawareDominicanDutchDutch West IndianEastern EuropeanEcuadorianEgyptianEnglishEstonianEthiopianEuropeanFijianFilipinoFinnishFrenchFrench American IndianFrench CanadianGermanGerman RussianGhanaianGreekGuamanian / ChamorroGuatemalanGuyaneseHaitianHonduranHopiHungarianIcelanderIndian (Asian)IndonesianInupiatIranianIraqiIrishIroquoisIsraeliItalianJamaicanJapaneseJordanianKenyanKiowaKoreanLaotianLatvianLebaneseLiberianLithuanianLuxembourgerMalaysianMexicanMexican American IndianMongolianMoroccanNative HawaiianNavajoNew ZealanderNicaraguanNigerianNorthern EuropeanNorwegianOkinawanOsagePakistaniPalestinianPanamanianPennsylvania GermanPeruvianPimaPolishPortuguesePotawatomiPuebloPuerto RicanRomanianRussianSalvadoranSamoanScandinavianScotch-IrishScottishSeminoleSerbianSiouxSlavicSlovakSloveneSouth AfricanSouth AmericanSouth American IndianSpaniardSpanishSpanish American IndianSri LankanSubsaharan AfricanSudaneseSwedishSwissSyrianThaiTlingit-HaidaTonganTrinidadian and TobagonianTurkishU.S. Virgin IslanderUkrainianUruguayanVenezuelanVietnameseWelshWest IndianYugoslavianZimbabwean
Immigrant Origin (Total)
AfricaArgentinaAsiaAustraliaAustriaBahamasBangladeshBosnia and HerzegovinaBrazilBulgariaBurma / MyanmarCambodiaCameroonCanadaCaribbeanCentral AmericaChileChinaColombiaCubaDominican RepublicEastern AfricaEastern AsiaEastern EuropeEcuadorEgyptEl SalvadorEnglandEritreaEthiopiaEuropeFranceGermanyGhanaGreeceGuatemalaHondurasHong KongIndiaIndonesiaIranIraqIrelandItalyJamaicaJapanJordanKazakhstanKenyaKoreaKuwaitLaosLatin AmericaLebanonLiberiaMalaysiaMexicoMiddle AfricaMoroccoNepalNetherlandsNicaraguaNigeriaNorthern AfricaNorthern EuropeNorwayOceaniaPakistanPanamaPeruPhilippinesPolandPortugalRussiaSaudi ArabiaScotlandSingaporeSouth AfricaSouth AmericaSouth Central AsiaSouth Eastern AsiaSouthern EuropeSpainSudanSyriaTaiwanThailandTrinidad and TobagoTurkeyUkraineVenezuelaVietnamWestern AfricaWestern AsiaWestern EuropeZaireZimbabwe
Immigrant Origin (Percentage)
AfricaArgentinaAsiaAustraliaAustriaBahamasBangladeshBosnia and HerzegovinaBrazilBulgariaBurma / MyanmarCambodiaCameroonCanadaCaribbeanCentral AmericaChileChinaColombiaCubaDominican RepublicEastern AfricaEastern AsiaEastern EuropeEcuadorEgyptEl SalvadorEnglandEritreaEthiopiaEuropeFranceGermanyGhanaGreeceGuatemalaHondurasHong KongIndiaIndonesiaIranIraqIrelandItalyJamaicaJapanJordanKazakhstanKenyaKoreaKuwaitLaosLatin AmericaLebanonLiberiaMalaysiaMexicoMiddle AfricaMoroccoNepalNetherlandsNicaraguaNigeriaNorthern AfricaNorthern EuropeNorwayOceaniaPakistanPanamaPeruPhilippinesPolandPortugalRussiaSaudi ArabiaScotlandSingaporeSouth AfricaSouth AmericaSouth Central AsiaSouth Eastern AsiaSouthern EuropeSpainSudanSyriaTaiwanThailandTrinidad and TobagoTurkeyUkraineVenezuelaVietnamWestern AfricaWestern AsiaWestern EuropeZaireZimbabwe
Income
Income (Families)
Income (Households)
Poverty
Poverty (Families)
Unemployment
Employment Occupations
Employment Industries
Employer Class
Commute Time
Commute Means
School Enrollment
Education by Degree Field
Occupancy
Finances
Physical Characteristics
Oklahoma City
Compare Zip Codes
Comparison Subject

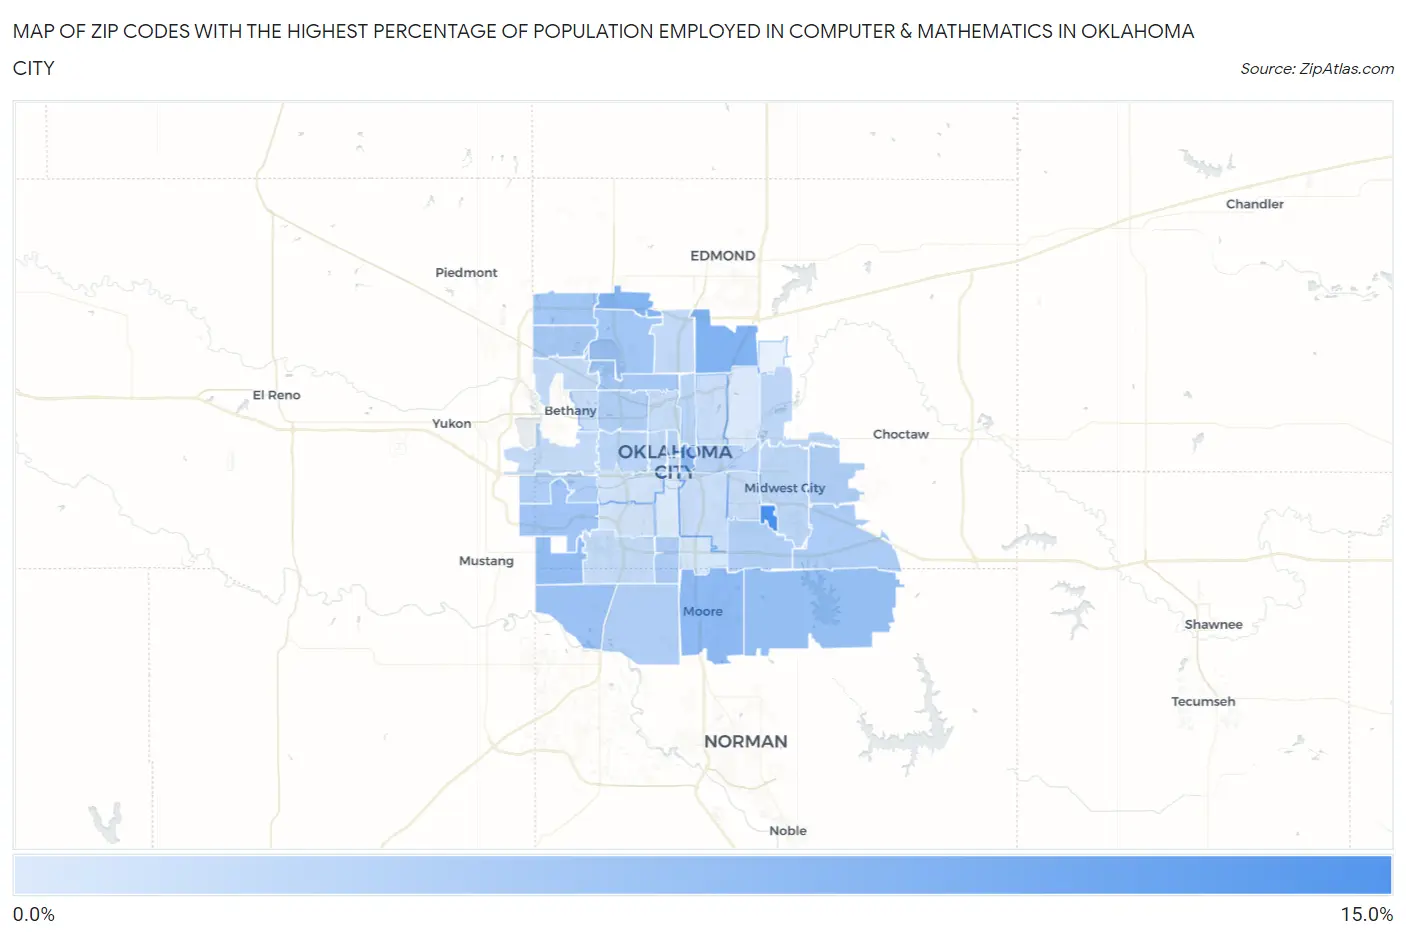
Map of Zip Codes with the Highest Percentage of Population Employed in Computer & Mathematics in Oklahoma City

0.0%
15.0%
Zip Codes with the Highest Percentage of Population Employed in Computer & Mathematics in Oklahoma City Map

Zip Codes with the Highest Percentage of Population Employed in Computer & Mathematics in Oklahoma City, OK

Zip Code % Employed vs State vs National
1.7314511.7%2.3%(+9.33)#33.5%(+8.13)#476
2.731317.1%2.3%(+4.74)#83.5%(+3.54)#1,587
3.731346.9%2.3%(+4.53)#93.5%(+3.33)#1,710
4.731606.0%2.3%(+3.65)#133.5%(+2.45)#2,333
5.731045.8%2.3%(+3.52)#153.5%(+2.32)#2,452
6.731695.7%2.3%(+3.38)#163.5%(+2.18)#2,576
7.731655.5%2.3%(+3.16)#183.5%(+1.96)#2,804
8.731735.0%2.3%(+2.66)#233.5%(+1.46)#3,377
9.731794.5%2.3%(+2.22)#293.5%(+1.02)#4,012
10.731204.4%2.3%(+2.10)#313.5%(+0.900)#4,232
11.731424.4%2.3%(+2.04)#333.5%(+0.845)#4,319
12.731164.3%2.3%(+2.00)#343.5%(+0.798)#4,388
13.731624.3%2.3%(+1.93)#353.5%(+0.734)#4,497
14.731503.7%2.3%(+1.39)#453.5%(+0.192)#5,682
15.731393.7%2.3%(+1.38)#463.5%(+0.182)#5,705
16.731303.6%2.3%(+1.30)#483.5%(+0.100)#5,906
17.731703.5%2.3%(+1.19)#523.5%(-0.004)#6,157
18.731353.5%2.3%(+1.15)#533.5%(-0.050)#6,269
19.731123.4%2.3%(+1.12)#553.5%(-0.080)#6,357
20.731283.4%2.3%(+1.10)#573.5%(-0.098)#6,402
21.731033.3%2.3%(+0.967)#603.5%(-0.232)#6,805
22.731173.0%2.3%(+0.658)#713.5%(-0.541)#7,806
23.731052.8%2.3%(+0.482)#813.5%(-0.717)#8,418
24.731072.8%2.3%(+0.462)#823.5%(-0.736)#8,497
25.731412.6%2.3%(+0.313)#913.5%(-0.886)#9,069
26.731102.6%2.3%(+0.285)#943.5%(-0.914)#9,164
27.731022.4%2.3%(+0.091)#1073.5%(-1.11)#9,968
28.731062.4%2.3%(+0.036)#1093.5%(-1.16)#10,186
29.731142.2%2.3%(-0.168)#1233.5%(-1.37)#11,082
30.731592.1%2.3%(-0.243)#1273.5%(-1.44)#11,420
31.731322.1%2.3%(-0.244)#1283.5%(-1.44)#11,425
32.731272.0%2.3%(-0.345)#1343.5%(-1.54)#11,892
33.731181.9%2.3%(-0.462)#1443.5%(-1.66)#12,467
34.731151.8%2.3%(-0.560)#1543.5%(-1.76)#12,898
35.731221.8%2.3%(-0.575)#1563.5%(-1.77)#12,971
36.731291.7%2.3%(-0.585)#1583.5%(-1.78)#13,020
37.731111.7%2.3%(-0.645)#1653.5%(-1.84)#13,349
38.731190.97%2.3%(-1.36)#2713.5%(-2.56)#17,576
39.731080.95%2.3%(-1.37)#2753.5%(-2.57)#17,693
40.731490.76%2.3%(-1.57)#3033.5%(-2.77)#18,895
41.731210.40%2.3%(-1.93)#3683.5%(-3.13)#21,077
42.731090.20%2.3%(-2.13)#3973.5%(-3.33)#22,083

Common Questions

What are the Top 10 Zip Codes with the Highest Percentage of Population Employed in Computer & Mathematics in Oklahoma City, OK?
Top 10 Zip Codes with the Highest Percentage of Population Employed in Computer & Mathematics in Oklahoma City, OK are:
#1
11.7%
#2
7.1%
#3
6.9%
#4
6.0%
#5
5.8%
#6
5.7%
#7
5.5%
#8
5.0%
#9
4.5%
#10
4.4%
What zip code has the Highest Percentage of Population Employed in Computer & Mathematics in Oklahoma City, OK?
73145 has the Highest Percentage of Population Employed in Computer & Mathematics in Oklahoma City, OK with 11.7%.
What is the Percentage of Population Employed in Computer & Mathematics in Oklahoma City, OK?
Percentage of Population Employed in Computer & Mathematics in Oklahoma City is 3.5%.
What is the Percentage of Population Employed in Computer & Mathematics in Oklahoma?
Percentage of Population Employed in Computer & Mathematics in Oklahoma is 2.3%.
What is the Percentage of Population Employed in Computer & Mathematics in the United States?
Percentage of Population Employed in Computer & Mathematics in the United States is 3.5%.