Bernice, OK Map & Demographics
Bernice Map
Bernice Overview
$27,965
PER CAPITA INCOME
$57,083
AVG FAMILY INCOME
$43,333
AVG HOUSEHOLD INCOME
42.9%
WAGE / INCOME GAP [ % ]
57.1¢/ $1
WAGE / INCOME GAP [ $ ]
0.43
INEQUALITY / GINI INDEX
370
TOTAL POPULATION
168
MALE POPULATION
202
FEMALE POPULATION
83.17
MALES / 100 FEMALES
120.24
FEMALES / 100 MALES
52.8
MEDIAN AGE
2.7
AVG FAMILY SIZE
2.2
AVG HOUSEHOLD SIZE
136
LABOR FORCE [ PEOPLE ]
44.4%
PERCENT IN LABOR FORCE
4.4%
UNEMPLOYMENT RATE
Bernice Area Codes
Income in Bernice
Income Overview in Bernice
Per Capita Income in Bernice is $27,965, while median incomes of families and households are $57,083 and $43,333 respectively.
| Characteristic | Number | Measure |
| Per Capita Income | 370 | $27,965 |
| Median Family Income | 95 | $57,083 |
| Mean Family Income | 95 | $75,106 |
| Median Household Income | 168 | $43,333 |
| Mean Household Income | 168 | $57,876 |
| Income Deficit | 95 | $0 |
| Wage / Income Gap (%) | 370 | 42.86% |
| Wage / Income Gap ($) | 370 | 57.14¢ per $1 |
| Gini / Inequality Index | 370 | 0.43 |
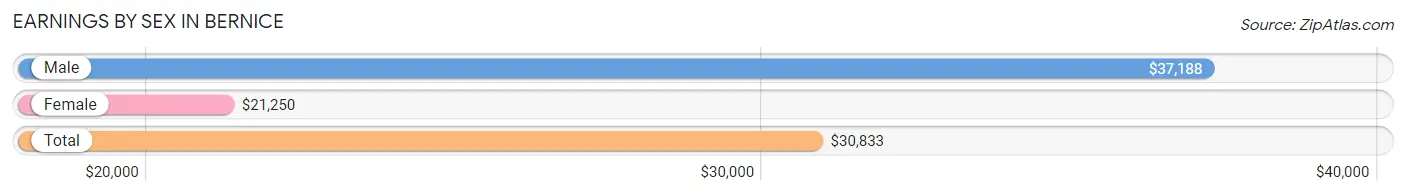
Earnings by Sex in Bernice
Average Earnings in Bernice are $30,833, $37,188 for men and $21,250 for women, a difference of 42.9%.
| Sex | Number | Average Earnings |
| Male | 69 (47.3%) | $37,188 |
| Female | 77 (52.7%) | $21,250 |
| Total | 146 (100.0%) | $30,833 |
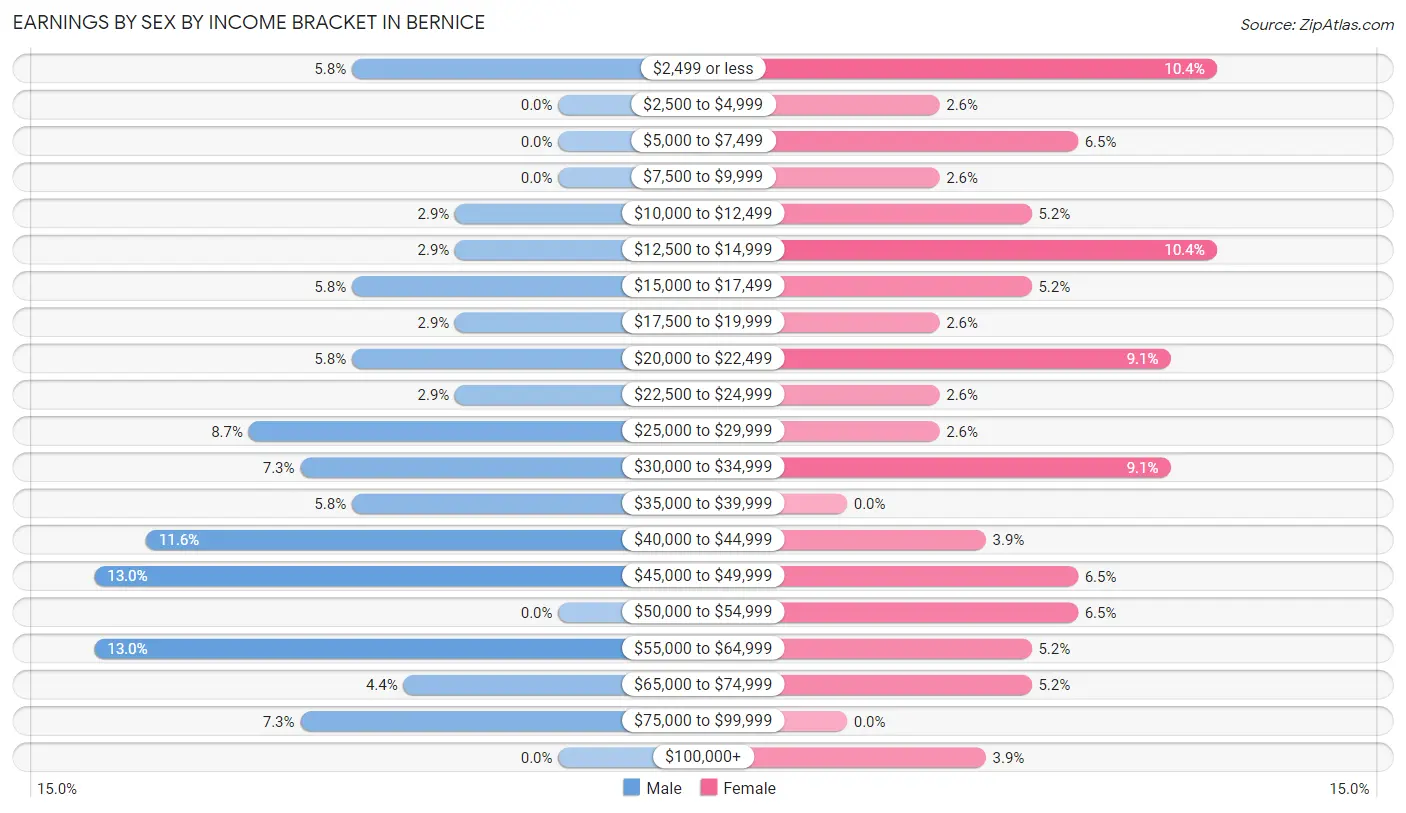
Earnings by Sex by Income Bracket in Bernice
The most common earnings brackets in Bernice are $45,000 to $49,999 for men (9 | 13.0%) and $2,499 or less for women (8 | 10.4%).
| Income | Male | Female |
| $2,499 or less | 4 (5.8%) | 8 (10.4%) |
| $2,500 to $4,999 | 0 (0.0%) | 2 (2.6%) |
| $5,000 to $7,499 | 0 (0.0%) | 5 (6.5%) |
| $7,500 to $9,999 | 0 (0.0%) | 2 (2.6%) |
| $10,000 to $12,499 | 2 (2.9%) | 4 (5.2%) |
| $12,500 to $14,999 | 2 (2.9%) | 8 (10.4%) |
| $15,000 to $17,499 | 4 (5.8%) | 4 (5.2%) |
| $17,500 to $19,999 | 2 (2.9%) | 2 (2.6%) |
| $20,000 to $22,499 | 4 (5.8%) | 7 (9.1%) |
| $22,500 to $24,999 | 2 (2.9%) | 2 (2.6%) |
| $25,000 to $29,999 | 6 (8.7%) | 2 (2.6%) |
| $30,000 to $34,999 | 5 (7.2%) | 7 (9.1%) |
| $35,000 to $39,999 | 4 (5.8%) | 0 (0.0%) |
| $40,000 to $44,999 | 8 (11.6%) | 3 (3.9%) |
| $45,000 to $49,999 | 9 (13.0%) | 5 (6.5%) |
| $50,000 to $54,999 | 0 (0.0%) | 5 (6.5%) |
| $55,000 to $64,999 | 9 (13.0%) | 4 (5.2%) |
| $65,000 to $74,999 | 3 (4.3%) | 4 (5.2%) |
| $75,000 to $99,999 | 5 (7.2%) | 0 (0.0%) |
| $100,000+ | 0 (0.0%) | 3 (3.9%) |
| Total | 69 (100.0%) | 77 (100.0%) |
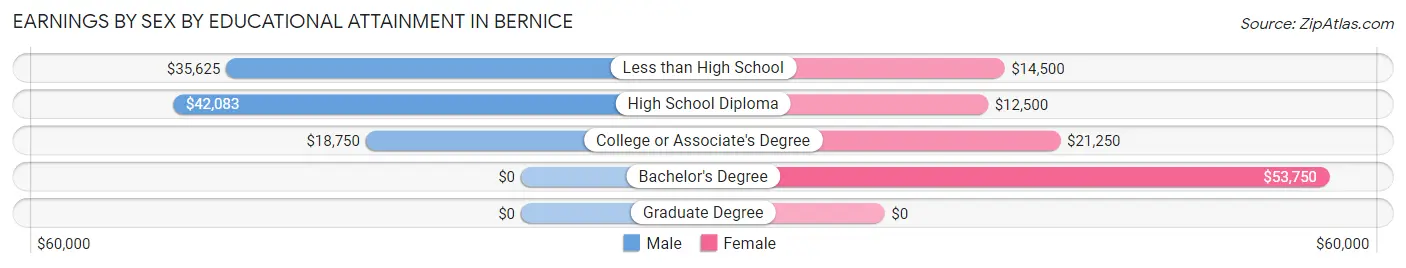
Earnings by Sex by Educational Attainment in Bernice
Average earnings in Bernice are $41,250 for men and $21,429 for women, a difference of 48.0%. Men with an educational attainment of high school diploma enjoy the highest average annual earnings of $42,083, while those with college or associate's degree education earn the least with $18,750. Women with an educational attainment of bachelor's degree earn the most with the average annual earnings of $53,750, while those with high school diploma education have the smallest earnings of $12,500.
| Educational Attainment | Male Income | Female Income |
| Less than High School | $35,625 | $14,500 |
| High School Diploma | $42,083 | $12,500 |
| College or Associate's Degree | $18,750 | $21,250 |
| Bachelor's Degree | - | - |
| Graduate Degree | - | - |
| Total | $41,250 | $21,429 |
Family Income in Bernice
Family Income Brackets in Bernice
According to the Bernice family income data, there are 19 families falling into the $35,000 to $49,999 income range, which is the most common income bracket and makes up 20.0% of all families. Conversely, the $15,000 to $24,999 income bracket is the least frequent group with only 2 families (2.1%) belonging to this category.
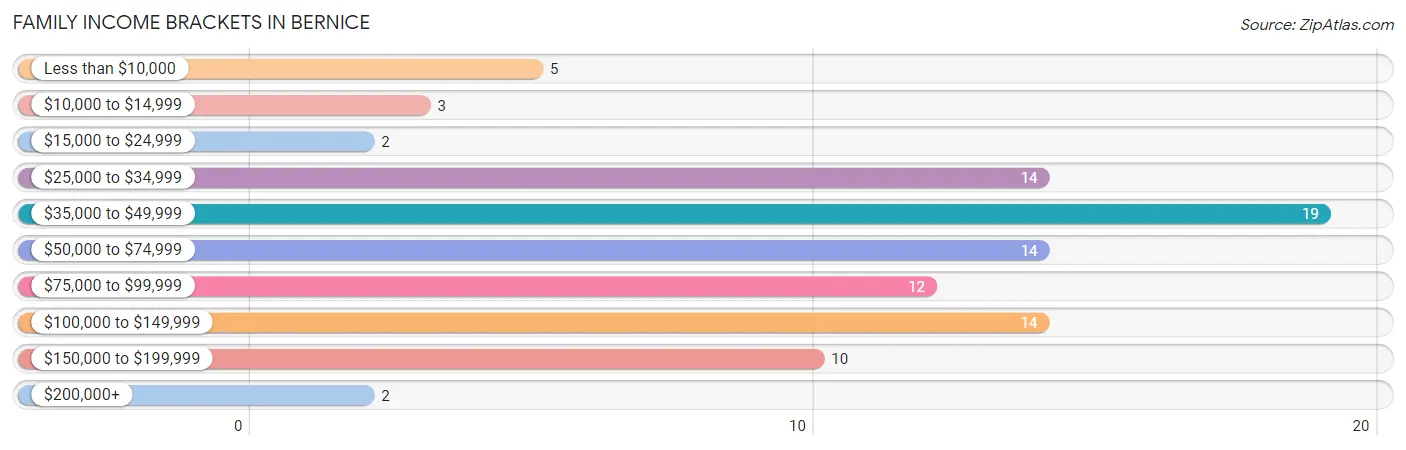
| Income Bracket | # Families | % Families |
| Less than $10,000 | 5 | 5.3% |
| $10,000 to $14,999 | 3 | 3.2% |
| $15,000 to $24,999 | 2 | 2.1% |
| $25,000 to $34,999 | 14 | 14.7% |
| $35,000 to $49,999 | 19 | 20.0% |
| $50,000 to $74,999 | 14 | 14.7% |
| $75,000 to $99,999 | 12 | 12.6% |
| $100,000 to $149,999 | 14 | 14.7% |
| $150,000 to $199,999 | 10 | 10.5% |
| $200,000+ | 2 | 2.1% |
Family Income by Famaliy Size in Bernice
2-person families (71 | 74.7%) account for the highest median family income in Bernice with $71,250 per family, while 2-person families (71 | 74.7%) have the highest median income of $35,625 per family member.
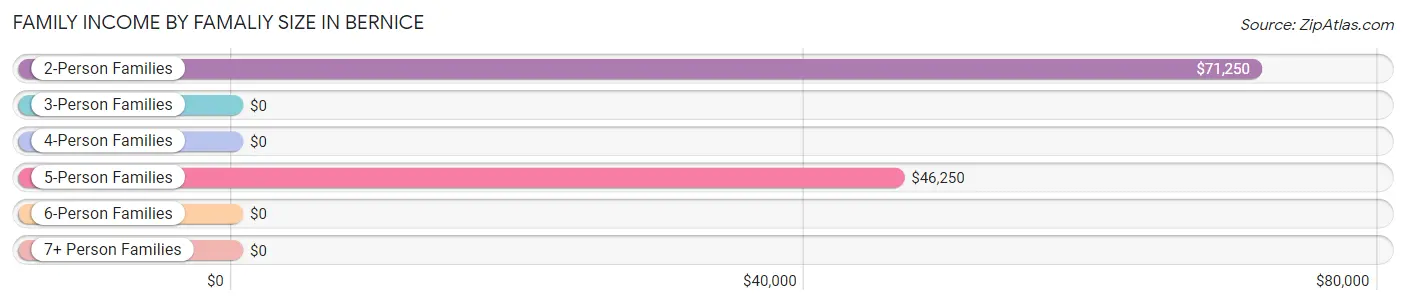
| Income Bracket | # Families | Median Income |
| 2-Person Families | 71 (74.7%) | $71,250 |
| 3-Person Families | 13 (13.7%) | $0 |
| 4-Person Families | 5 (5.3%) | $0 |
| 5-Person Families | 6 (6.3%) | $46,250 |
| 6-Person Families | 0 (0.0%) | $0 |
| 7+ Person Families | 0 (0.0%) | $0 |
| Total | 95 (100.0%) | $57,083 |
Family Income by Number of Earners in Bernice
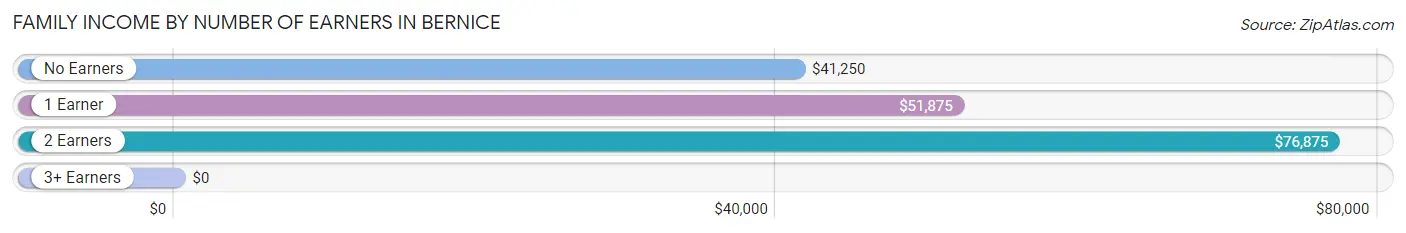
| Number of Earners | # Families | Median Income |
| No Earners | 24 (25.3%) | $41,250 |
| 1 Earner | 51 (53.7%) | $51,875 |
| 2 Earners | 20 (21.0%) | $76,875 |
| 3+ Earners | 0 (0.0%) | $0 |
| Total | 95 (100.0%) | $57,083 |
Household Income in Bernice
Household Income Brackets in Bernice
With 37 households falling in the category, the $35,000 to $49,999 income range is the most frequent in Bernice, accounting for 22.0% of all households. In contrast, only 2 households (1.2%) fall into the $200,000+ income bracket, making it the least populous group.
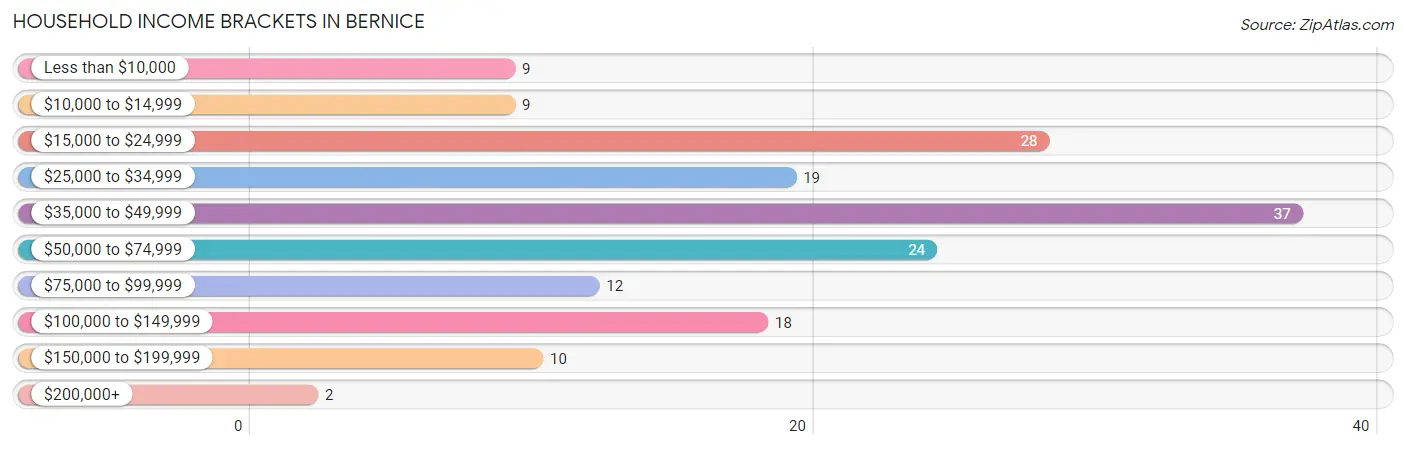
| Income Bracket | # Households | % Households |
| Less than $10,000 | 9 | 5.4% |
| $10,000 to $14,999 | 9 | 5.4% |
| $15,000 to $24,999 | 28 | 16.7% |
| $25,000 to $34,999 | 19 | 11.3% |
| $35,000 to $49,999 | 37 | 22.0% |
| $50,000 to $74,999 | 24 | 14.3% |
| $75,000 to $99,999 | 12 | 7.1% |
| $100,000 to $149,999 | 18 | 10.7% |
| $150,000 to $199,999 | 10 | 6.0% |
| $200,000+ | 2 | 1.2% |
Household Income by Householder Age in Bernice
The median household income in Bernice is $43,333, with the highest median household income of $45,833 found in the 65+ years age bracket for the primary householder. A total of 76 households (45.2%) fall into this category. Meanwhile, the 15 to 24 years age bracket for the primary householder has the lowest median household income of $0, with 3 households (1.8%) in this group.
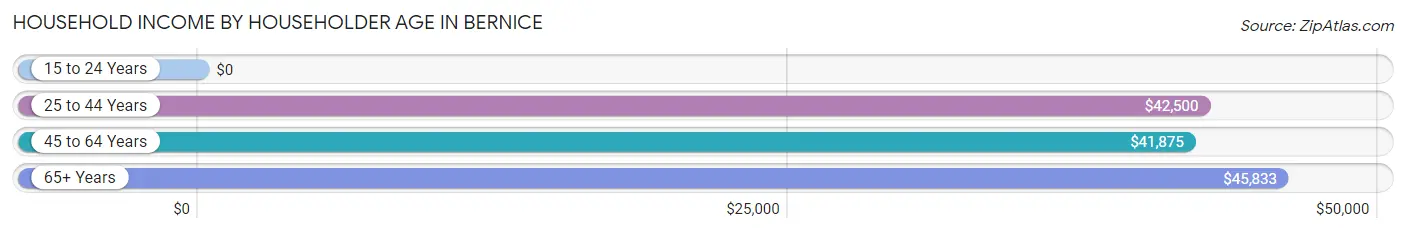
| Income Bracket | # Households | Median Income |
| 15 to 24 Years | 3 (1.8%) | $0 |
| 25 to 44 Years | 24 (14.3%) | $42,500 |
| 45 to 64 Years | 65 (38.7%) | $41,875 |
| 65+ Years | 76 (45.2%) | $45,833 |
| Total | 168 (100.0%) | $43,333 |
Poverty in Bernice
Income Below Poverty by Sex and Age in Bernice
With 14.0% poverty level for males and 24.9% for females among the residents of Bernice, 18 to 24 year old males and 16 and 17 year old females are the most vulnerable to poverty, with 7 males (63.6%) and 7 females (100.0%) in their respective age groups living below the poverty level.
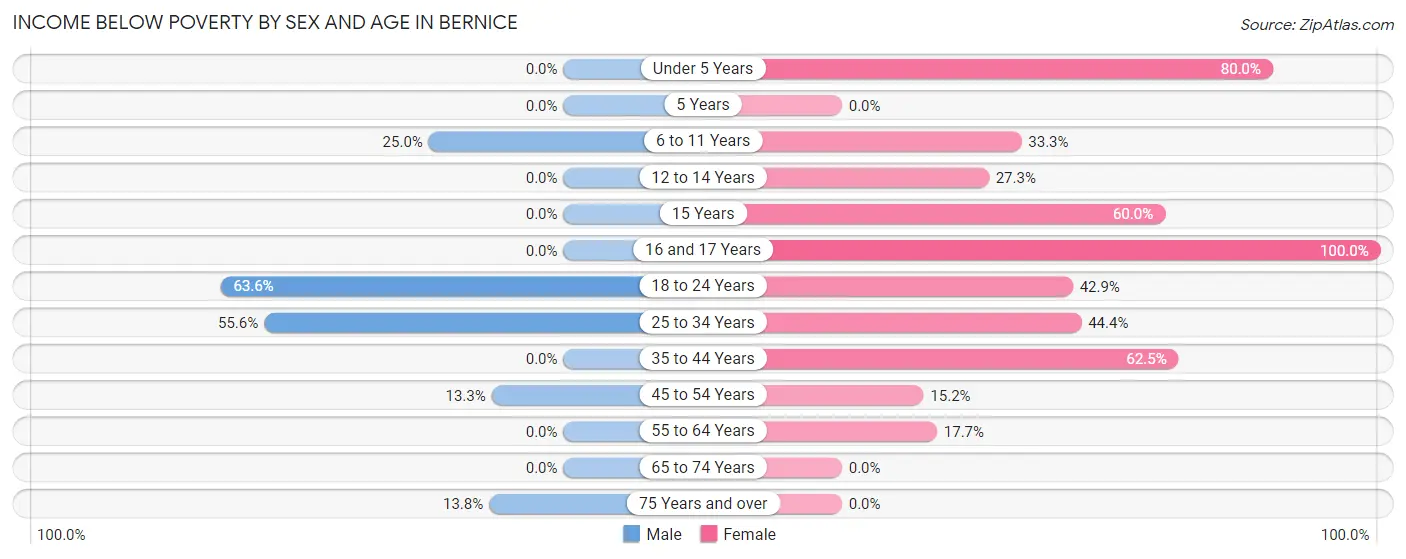
| Age Bracket | Male | Female |
| Under 5 Years | 0 (0.0%) | 4 (80.0%) |
| 5 Years | 0 (0.0%) | 0 (0.0%) |
| 6 to 11 Years | 3 (25.0%) | 4 (33.3%) |
| 12 to 14 Years | 0 (0.0%) | 3 (27.3%) |
| 15 Years | 0 (0.0%) | 3 (60.0%) |
| 16 and 17 Years | 0 (0.0%) | 7 (100.0%) |
| 18 to 24 Years | 7 (63.6%) | 3 (42.9%) |
| 25 to 34 Years | 5 (55.6%) | 4 (44.4%) |
| 35 to 44 Years | 0 (0.0%) | 10 (62.5%) |
| 45 to 54 Years | 4 (13.3%) | 5 (15.1%) |
| 55 to 64 Years | 0 (0.0%) | 6 (17.6%) |
| 65 to 74 Years | 0 (0.0%) | 0 (0.0%) |
| 75 Years and over | 4 (13.8%) | 0 (0.0%) |
| Total | 23 (14.0%) | 49 (24.9%) |
Income Above Poverty by Sex and Age in Bernice
According to the poverty statistics in Bernice, males aged 12 to 14 years and females aged 5 years are the age groups that are most secure financially, with 100.0% of males and 100.0% of females in these age groups living above the poverty line.
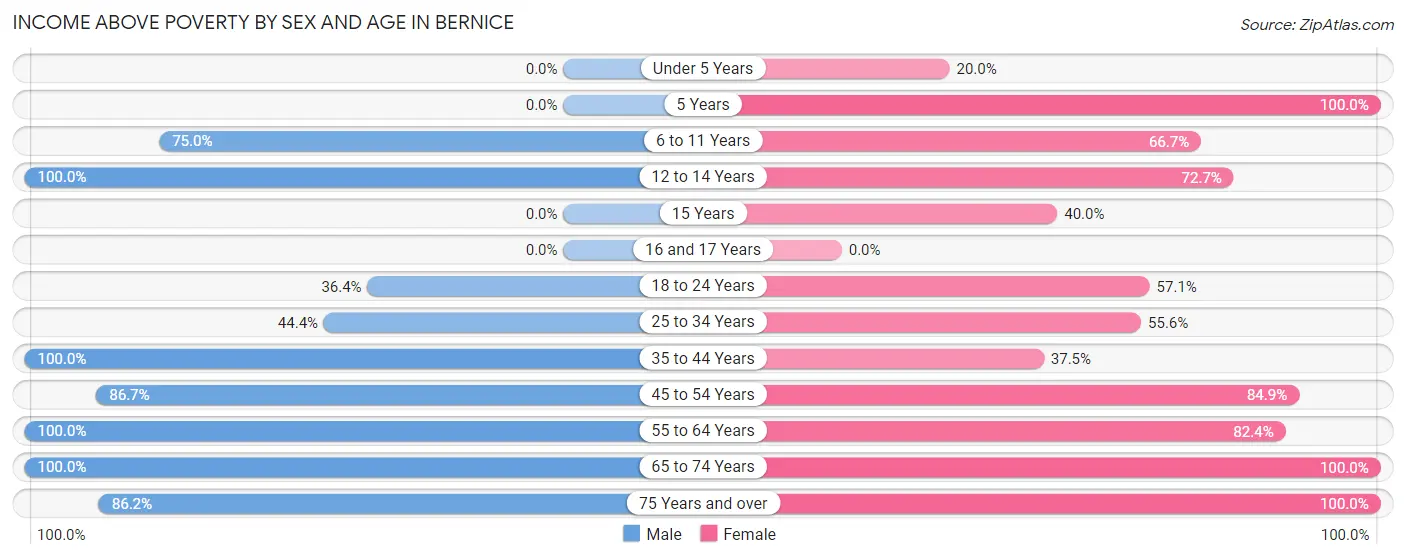
| Age Bracket | Male | Female |
| Under 5 Years | 0 (0.0%) | 1 (20.0%) |
| 5 Years | 0 (0.0%) | 4 (100.0%) |
| 6 to 11 Years | 9 (75.0%) | 8 (66.7%) |
| 12 to 14 Years | 6 (100.0%) | 8 (72.7%) |
| 15 Years | 0 (0.0%) | 2 (40.0%) |
| 16 and 17 Years | 0 (0.0%) | 0 (0.0%) |
| 18 to 24 Years | 4 (36.4%) | 4 (57.1%) |
| 25 to 34 Years | 4 (44.4%) | 5 (55.6%) |
| 35 to 44 Years | 8 (100.0%) | 6 (37.5%) |
| 45 to 54 Years | 26 (86.7%) | 28 (84.9%) |
| 55 to 64 Years | 27 (100.0%) | 28 (82.4%) |
| 65 to 74 Years | 32 (100.0%) | 29 (100.0%) |
| 75 Years and over | 25 (86.2%) | 25 (100.0%) |
| Total | 141 (86.0%) | 148 (75.1%) |
Income Below Poverty Among Married-Couple Families in Bernice
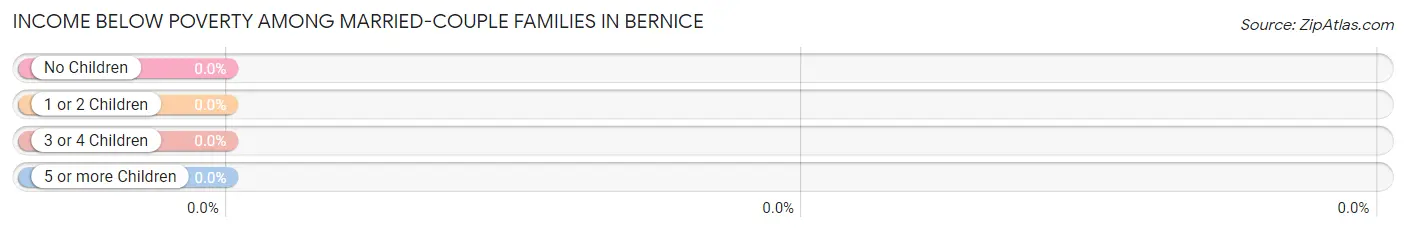
| Children | Above Poverty | Below Poverty |
| No Children | 62 (100.0%) | 0 (0.0%) |
| 1 or 2 Children | 2 (100.0%) | 0 (0.0%) |
| 3 or 4 Children | 5 (100.0%) | 0 (0.0%) |
| 5 or more Children | 0 (0.0%) | 0 (0.0%) |
| Total | 69 (100.0%) | 0 (0.0%) |
Income Below Poverty Among Single-Parent Households in Bernice
According to the poverty data in Bernice, 33.3% or 2 single-father households and 40.0% or 8 single-mother households are living below the poverty line. Among single-father households, those with 1 or 2 children have the highest poverty rate, with 2 households (33.3%) experiencing poverty. Likewise, among single-mother households, those with 1 or 2 children have the highest poverty rate, with 8 households (57.1%) falling below the poverty line.
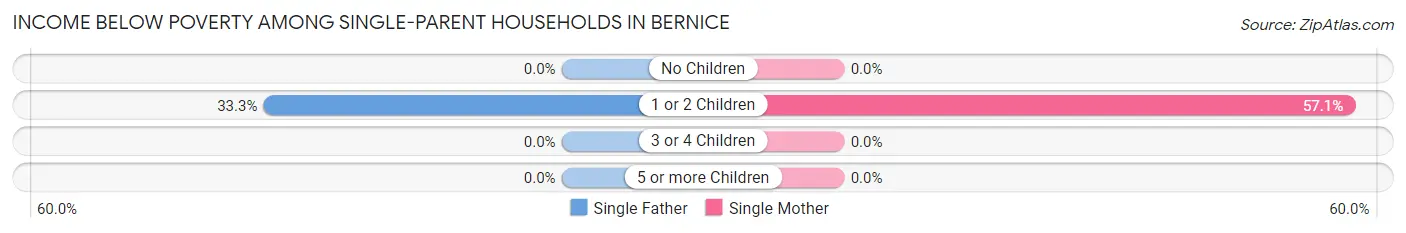
| Children | Single Father | Single Mother |
| No Children | 0 (0.0%) | 0 (0.0%) |
| 1 or 2 Children | 2 (33.3%) | 8 (57.1%) |
| 3 or 4 Children | 0 (0.0%) | 0 (0.0%) |
| 5 or more Children | 0 (0.0%) | 0 (0.0%) |
| Total | 2 (33.3%) | 8 (40.0%) |
Income Below Poverty Among Married-Couple vs Single-Parent Households in Bernice
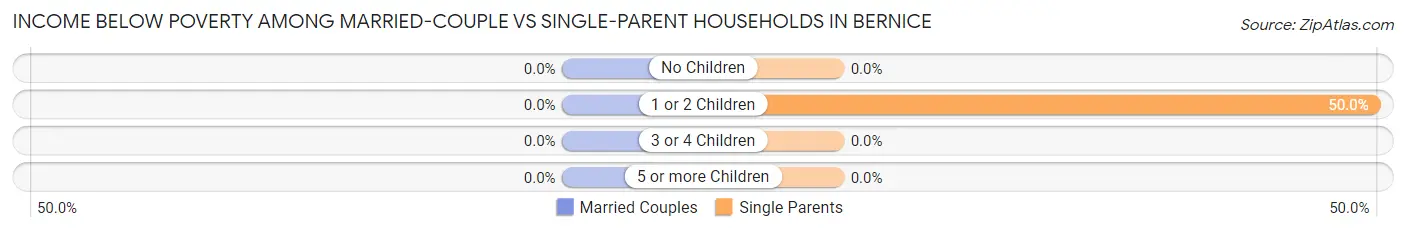
| Children | Married-Couple Families | Single-Parent Households |
| No Children | 0 (0.0%) | 0 (0.0%) |
| 1 or 2 Children | 0 (0.0%) | 10 (50.0%) |
| 3 or 4 Children | 0 (0.0%) | 0 (0.0%) |
| 5 or more Children | 0 (0.0%) | 0 (0.0%) |
| Total | 0 (0.0%) | 10 (38.5%) |
Race in Bernice
The most populous races in Bernice are White / Caucasian (276 | 74.6%), Native / Alaskan (56 | 15.1%), and Two or more Races (37 | 10.0%).
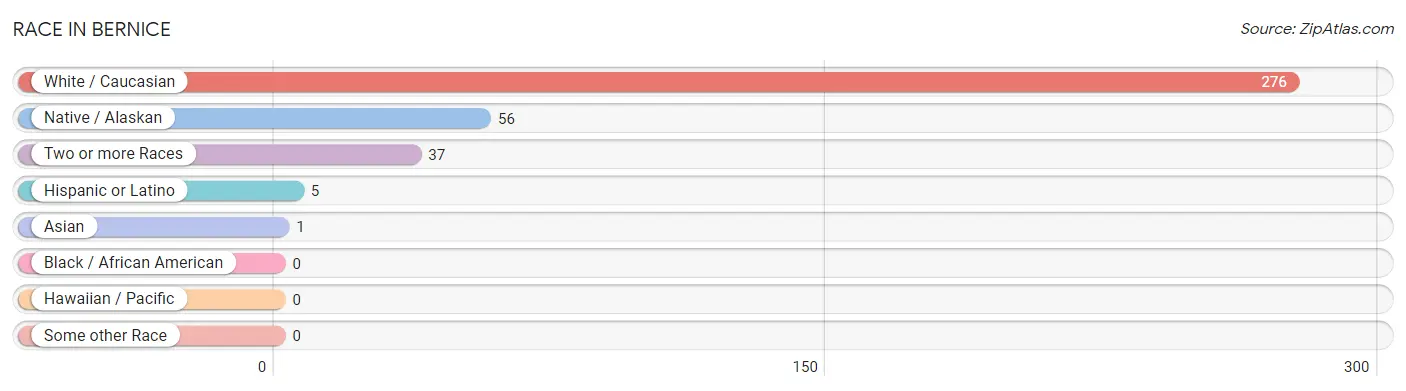
| Race | # Population | % Population |
| Asian | 1 | 0.3% |
| Black / African American | 0 | 0.0% |
| Hawaiian / Pacific | 0 | 0.0% |
| Hispanic or Latino | 5 | 1.3% |
| Native / Alaskan | 56 | 15.1% |
| White / Caucasian | 276 | 74.6% |
| Two or more Races | 37 | 10.0% |
| Some other Race | 0 | 0.0% |
| Total | 370 | 100.0% |
Ancestry in Bernice
The most populous ancestries reported in Bernice are Cherokee (57 | 15.4%), Irish (56 | 15.1%), German (51 | 13.8%), English (28 | 7.6%), and French (11 | 3.0%), together accounting for 54.9% of all Bernice residents.
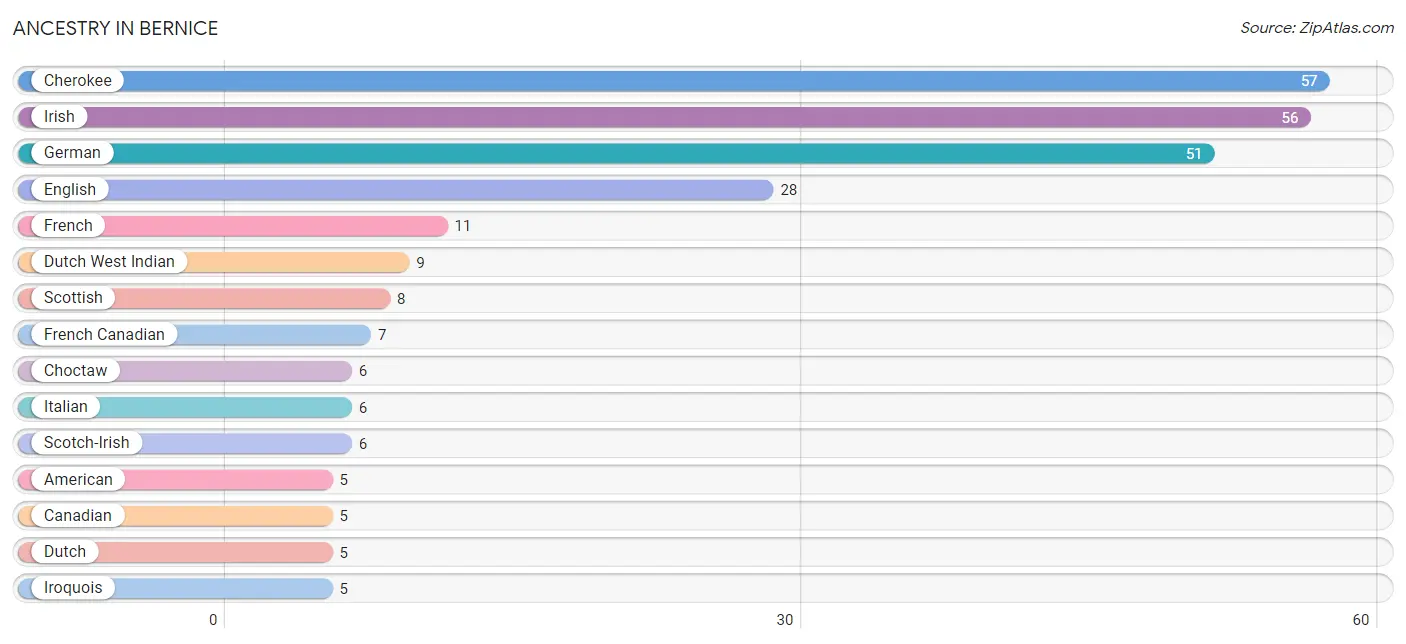
| Ancestry | # Population | % Population |
| American | 5 | 1.3% |
| Bhutanese | 2 | 0.5% |
| British | 3 | 0.8% |
| Canadian | 5 | 1.3% |
| Cherokee | 57 | 15.4% |
| Choctaw | 6 | 1.6% |
| Creek | 2 | 0.5% |
| Dutch | 5 | 1.3% |
| Dutch West Indian | 9 | 2.4% |
| English | 28 | 7.6% |
| French | 11 | 3.0% |
| French Canadian | 7 | 1.9% |
| German | 51 | 13.8% |
| Irish | 56 | 15.1% |
| Iroquois | 5 | 1.3% |
| Italian | 6 | 1.6% |
| Korean | 4 | 1.1% |
| Mexican | 3 | 0.8% |
| Peruvian | 2 | 0.5% |
| Polish | 4 | 1.1% |
| Scandinavian | 2 | 0.5% |
| Scotch-Irish | 6 | 1.6% |
| Scottish | 8 | 2.2% |
| South American | 2 | 0.5% |
| Swedish | 2 | 0.5% | View All 25 Rows |
Immigrants in Bernice
The most numerous immigrant groups reported in Bernice came from Canada (2 | 0.5%), Latin America (2 | 0.5%), Peru (2 | 0.5%), South America (2 | 0.5%), and Asia (1 | 0.3%), together accounting for 2.4% of all Bernice residents.
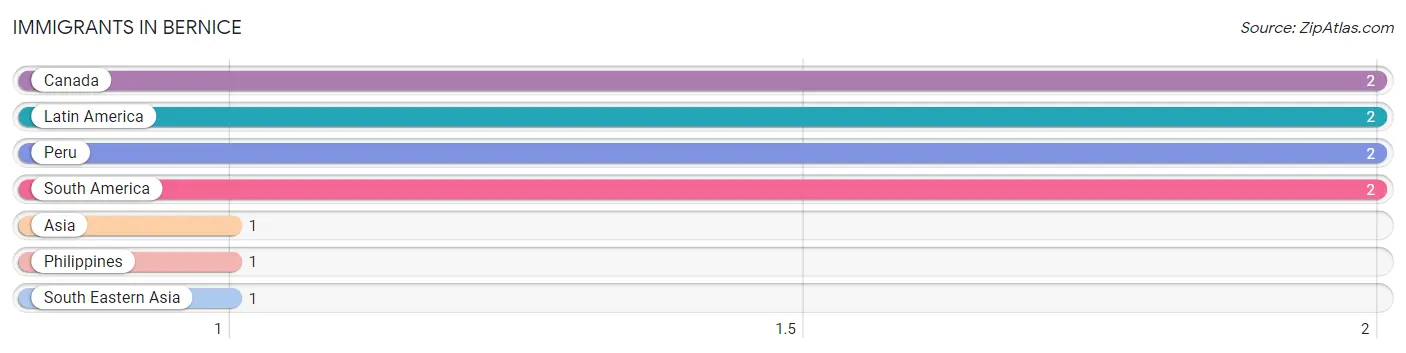
| Immigration Origin | # Population | % Population |
| Asia | 1 | 0.3% |
| Canada | 2 | 0.5% |
| Latin America | 2 | 0.5% |
| Peru | 2 | 0.5% |
| Philippines | 1 | 0.3% |
| South America | 2 | 0.5% |
| South Eastern Asia | 1 | 0.3% | View All 7 Rows |
Sex and Age in Bernice
Sex and Age in Bernice
The most populous age groups in Bernice are 50 to 54 Years (19 | 11.3%) for men and 60 to 64 Years (26 | 12.9%) for women.
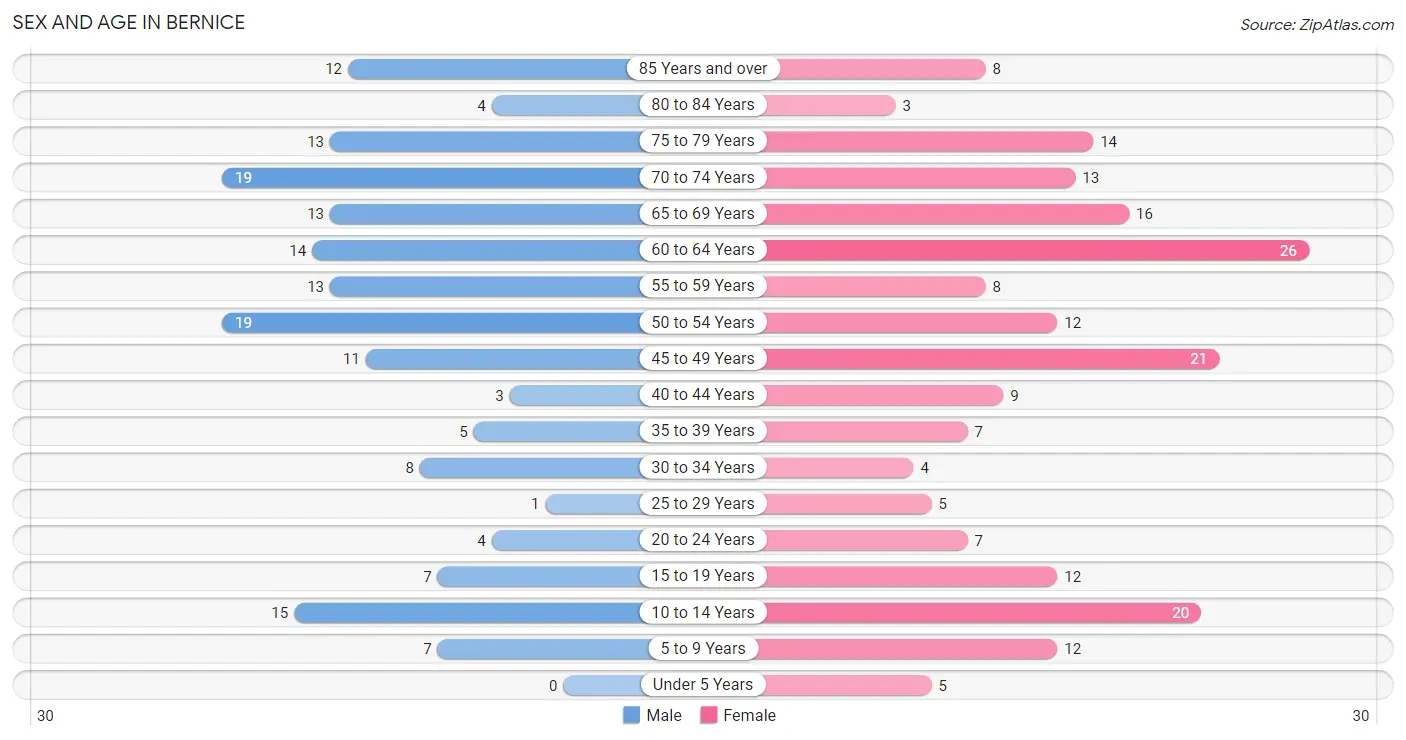
| Age Bracket | Male | Female |
| Under 5 Years | 0 (0.0%) | 5 (2.5%) |
| 5 to 9 Years | 7 (4.2%) | 12 (5.9%) |
| 10 to 14 Years | 15 (8.9%) | 20 (9.9%) |
| 15 to 19 Years | 7 (4.2%) | 12 (5.9%) |
| 20 to 24 Years | 4 (2.4%) | 7 (3.5%) |
| 25 to 29 Years | 1 (0.6%) | 5 (2.5%) |
| 30 to 34 Years | 8 (4.8%) | 4 (2.0%) |
| 35 to 39 Years | 5 (3.0%) | 7 (3.5%) |
| 40 to 44 Years | 3 (1.8%) | 9 (4.5%) |
| 45 to 49 Years | 11 (6.6%) | 21 (10.4%) |
| 50 to 54 Years | 19 (11.3%) | 12 (5.9%) |
| 55 to 59 Years | 13 (7.7%) | 8 (4.0%) |
| 60 to 64 Years | 14 (8.3%) | 26 (12.9%) |
| 65 to 69 Years | 13 (7.7%) | 16 (7.9%) |
| 70 to 74 Years | 19 (11.3%) | 13 (6.4%) |
| 75 to 79 Years | 13 (7.7%) | 14 (6.9%) |
| 80 to 84 Years | 4 (2.4%) | 3 (1.5%) |
| 85 Years and over | 12 (7.1%) | 8 (4.0%) |
| Total | 168 (100.0%) | 202 (100.0%) |
Families and Households in Bernice
Median Family Size in Bernice
The median family size in Bernice is 2.69 persons per family, with single female/mother families (20 | 21.0%) accounting for the largest median family size of 3.65 persons per family. On the other hand, married-couple families (69 | 72.6%) represent the smallest median family size with 2.43 persons per family.
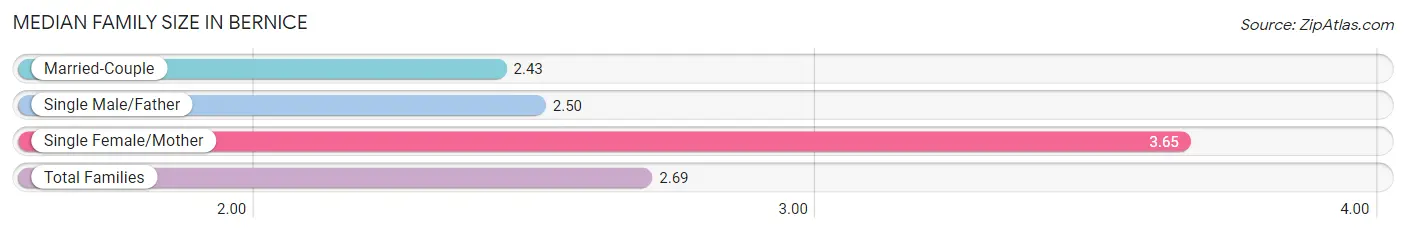
| Family Type | # Families | Family Size |
| Married-Couple | 69 (72.6%) | 2.43 |
| Single Male/Father | 6 (6.3%) | 2.50 |
| Single Female/Mother | 20 (21.0%) | 3.65 |
| Total Families | 95 (100.0%) | 2.69 |
Median Household Size in Bernice
The median household size in Bernice is 2.20 persons per household, with single male/father households (6 | 3.6%) accounting for the largest median household size of 4.17 persons per household. non-family households (73 | 43.4%) represent the smallest median household size with 1.30 persons per household.
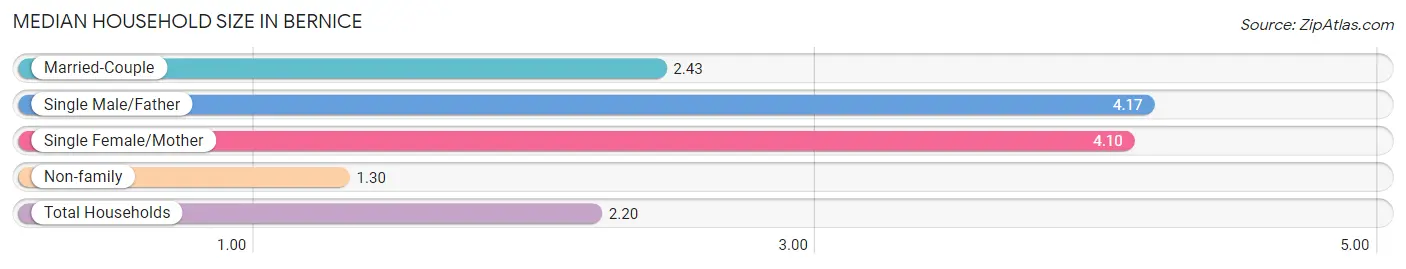
| Household Type | # Households | Household Size |
| Married-Couple | 69 (41.1%) | 2.43 |
| Single Male/Father | 6 (3.6%) | 4.17 |
| Single Female/Mother | 20 (11.9%) | 4.10 |
| Non-family | 73 (43.4%) | 1.30 |
| Total Households | 168 (100.0%) | 2.20 |
Household Size by Marriage Status in Bernice
Out of a total of 168 households in Bernice, 95 (56.6%) are family households, while 73 (43.4%) are nonfamily households. The most numerous type of family households are 2-person households, comprising 64, and the most common type of nonfamily households are 1-person households, comprising 62.
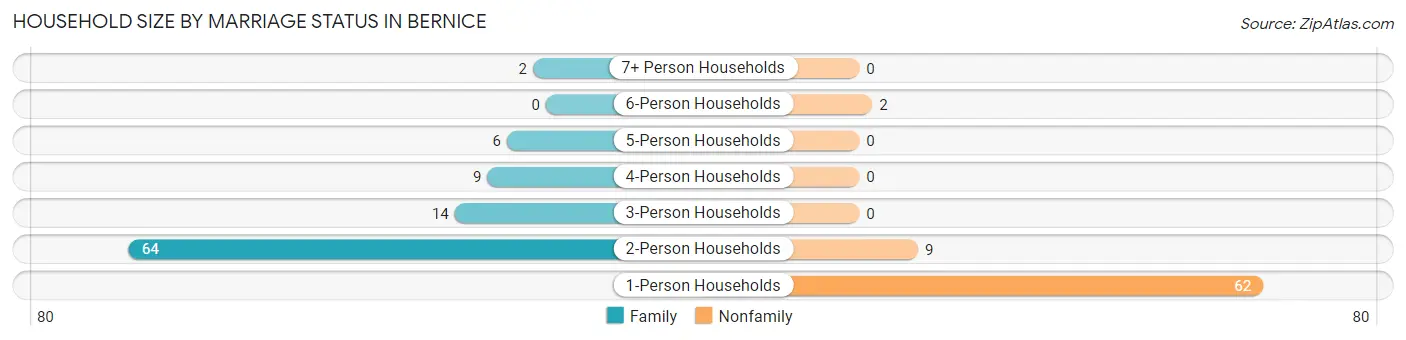
| Household Size | Family Households | Nonfamily Households |
| 1-Person Households | - | 62 (36.9%) |
| 2-Person Households | 64 (38.1%) | 9 (5.4%) |
| 3-Person Households | 14 (8.3%) | 0 (0.0%) |
| 4-Person Households | 9 (5.4%) | 0 (0.0%) |
| 5-Person Households | 6 (3.6%) | 0 (0.0%) |
| 6-Person Households | 0 (0.0%) | 2 (1.2%) |
| 7+ Person Households | 2 (1.2%) | 0 (0.0%) |
| Total | 95 (56.6%) | 73 (43.4%) |
Female Fertility in Bernice
Fertility by Age in Bernice
Average fertility rate in Bernice is 14.0 births per 1,000 women. Women in the age bracket of 20 to 34 years have the highest fertility rate with 63.0 births per 1,000 women. Women in the age bracket of 20 to 34 years acount for 100.0% of all women with births.
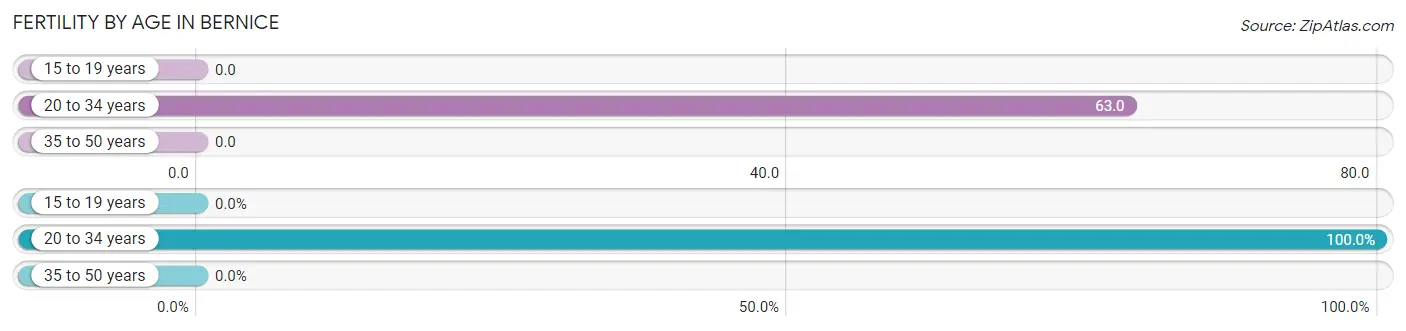
| Age Bracket | Women with Births | Births / 1,000 Women |
| 15 to 19 years | 0 (0.0%) | 0.0 |
| 20 to 34 years | 1 (100.0%) | 63.0 |
| 35 to 50 years | 0 (0.0%) | 0.0 |
| Total | 1 (100.0%) | 14.0 |
Fertility by Age by Marriage Status in Bernice
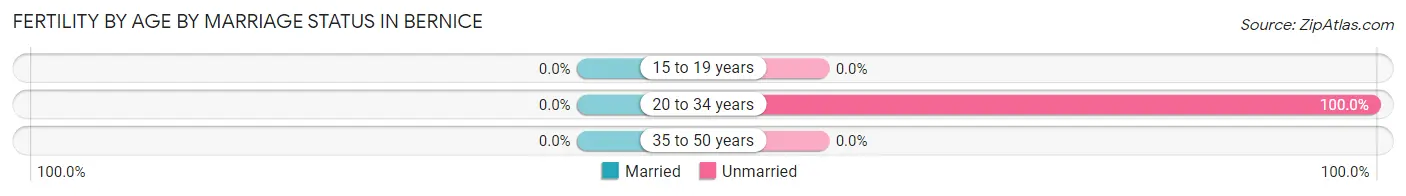
| Age Bracket | Married | Unmarried |
| 15 to 19 years | 0 (0.0%) | 0 (0.0%) |
| 20 to 34 years | 0 (0.0%) | 1 (100.0%) |
| 35 to 50 years | 0 (0.0%) | 0 (0.0%) |
| Total | 0 (0.0%) | 1 (100.0%) |
Fertility by Education in Bernice
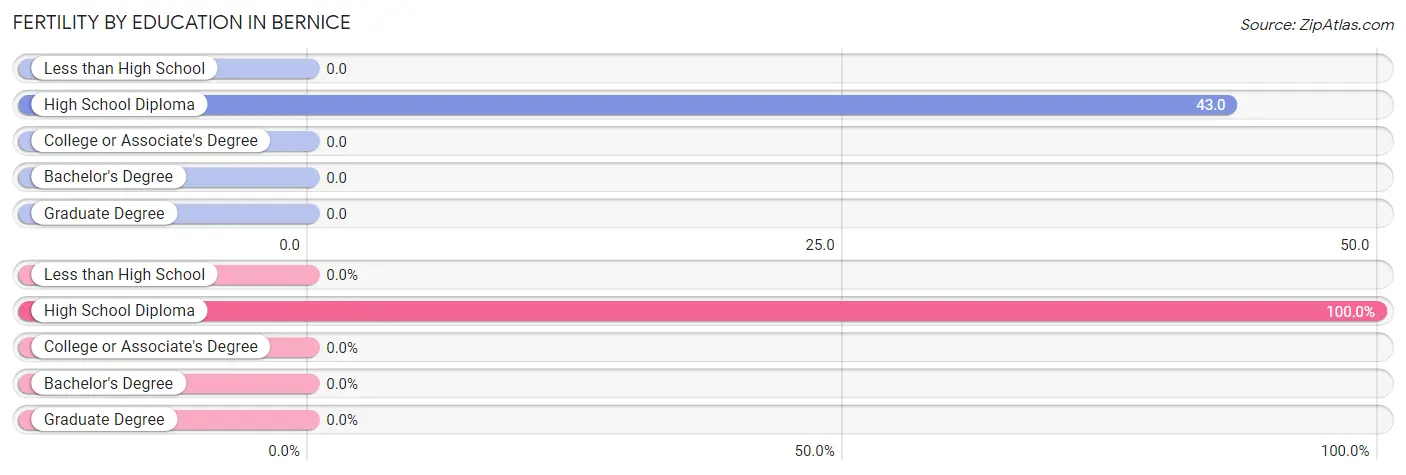
| Educational Attainment | Women with Births | Births / 1,000 Women |
| Less than High School | 0 (0.0%) | 0.0 |
| High School Diploma | 1 (100.0%) | 43.0 |
| College or Associate's Degree | 0 (0.0%) | 0.0 |
| Bachelor's Degree | 0 (0.0%) | 0.0 |
| Graduate Degree | 0 (0.0%) | 0.0 |
| Total | 1 (100.0%) | 14.0 |
Fertility by Education by Marriage Status in Bernice
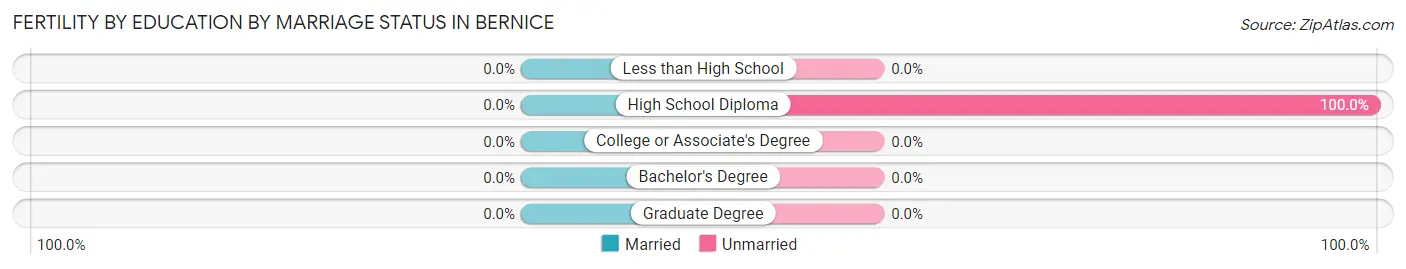
| Educational Attainment | Married | Unmarried |
| Less than High School | 0 (0.0%) | 0 (0.0%) |
| High School Diploma | 0 (0.0%) | 1 (100.0%) |
| College or Associate's Degree | 0 (0.0%) | 0 (0.0%) |
| Bachelor's Degree | 0 (0.0%) | 0 (0.0%) |
| Graduate Degree | 0 (0.0%) | 0 (0.0%) |
| Total | 0 (0.0%) | 1 (100.0%) |
Employment Characteristics in Bernice
Employment by Class of Employer in Bernice
Among the 130 employed individuals in Bernice, private company employees (77 | 59.2%), self-employed (not incorporated) (18 | 13.9%), and not-for-profit organizations (12 | 9.2%) make up the most common classes of employment.
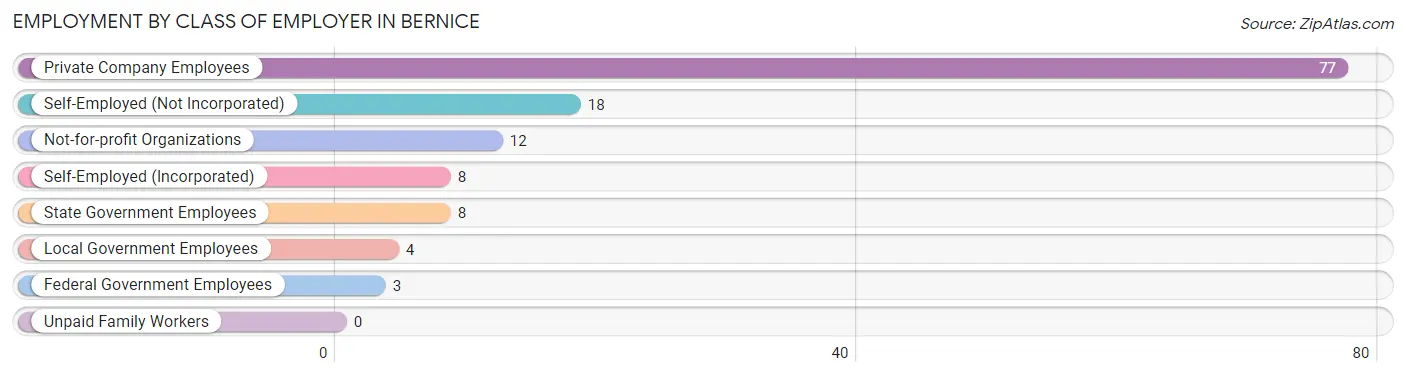
| Employer Class | # Employees | % Employees |
| Private Company Employees | 77 | 59.2% |
| Self-Employed (Incorporated) | 8 | 6.1% |
| Self-Employed (Not Incorporated) | 18 | 13.9% |
| Not-for-profit Organizations | 12 | 9.2% |
| Local Government Employees | 4 | 3.1% |
| State Government Employees | 8 | 6.1% |
| Federal Government Employees | 3 | 2.3% |
| Unpaid Family Workers | 0 | 0.0% |
| Total | 130 | 100.0% |
Employment Status by Age in Bernice
According to the labor force statistics for Bernice, out of the total population over 16 years of age (306), 44.4% or 136 individuals are in the labor force, with 4.4% or 6 of them unemployed. The age group with the highest labor force participation rate is 45 to 54 years, with 74.6% or 47 individuals in the labor force. Within the labor force, the 55 to 59 years age range has the highest percentage of unemployed individuals, with 14.3% or 2 of them being unemployed.
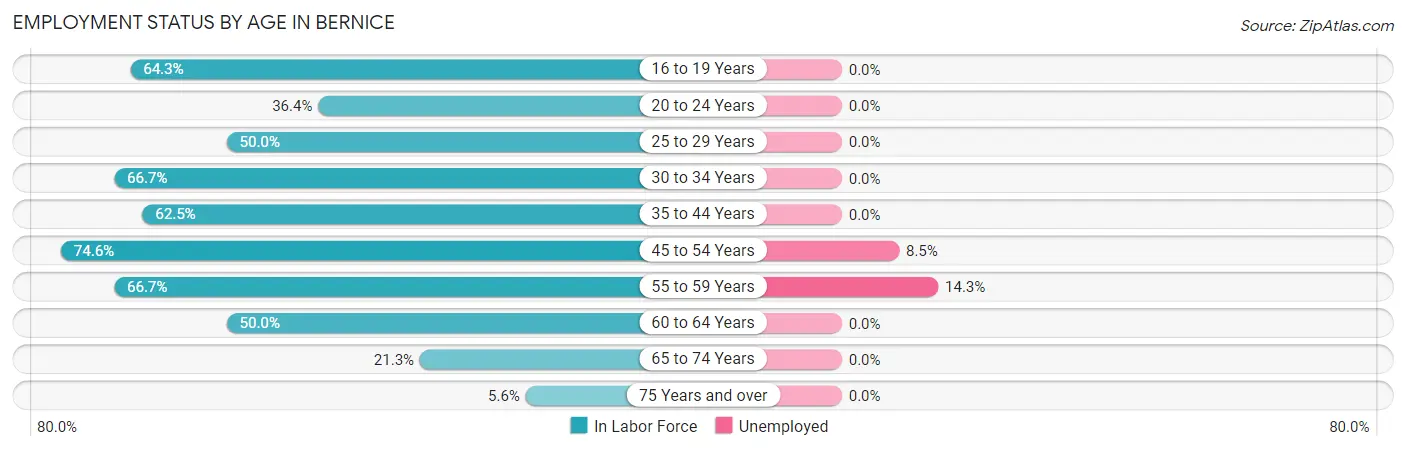
| Age Bracket | In Labor Force | Unemployed |
| 16 to 19 Years | 9 (64.3%) | 0 (0.0%) |
| 20 to 24 Years | 4 (36.4%) | 0 (0.0%) |
| 25 to 29 Years | 3 (50.0%) | 0 (0.0%) |
| 30 to 34 Years | 8 (66.7%) | 0 (0.0%) |
| 35 to 44 Years | 15 (62.5%) | 0 (0.0%) |
| 45 to 54 Years | 47 (74.6%) | 4 (8.5%) |
| 55 to 59 Years | 14 (66.7%) | 2 (14.3%) |
| 60 to 64 Years | 20 (50.0%) | 0 (0.0%) |
| 65 to 74 Years | 13 (21.3%) | 0 (0.0%) |
| 75 Years and over | 3 (5.6%) | 0 (0.0%) |
| Total | 136 (44.4%) | 6 (4.4%) |
Employment Status by Educational Attainment in Bernice
According to labor force statistics for Bernice, 64.5% of individuals (107) out of the total population between 25 and 64 years of age (166) are in the labor force, with 5.6% or 6 of them being unemployed. The group with the highest labor force participation rate are those with the educational attainment of bachelor's degree or higher, with 77.8% or 14 individuals in the labor force. Within the labor force, individuals with bachelor's degree or higher education have the highest percentage of unemployment, with 14.3% or 2 of them being unemployed.
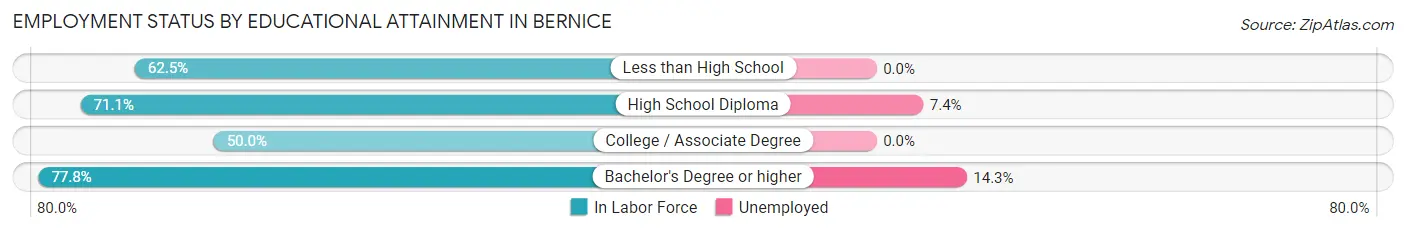
| Educational Attainment | In Labor Force | Unemployed |
| Less than High School | 15 (62.5%) | 0 (0.0%) |
| High School Diploma | 54 (71.1%) | 6 (7.4%) |
| College / Associate Degree | 24 (50.0%) | 0 (0.0%) |
| Bachelor's Degree or higher | 14 (77.8%) | 3 (14.3%) |
| Total | 107 (64.5%) | 9 (5.6%) |
Employment Occupations by Sex in Bernice
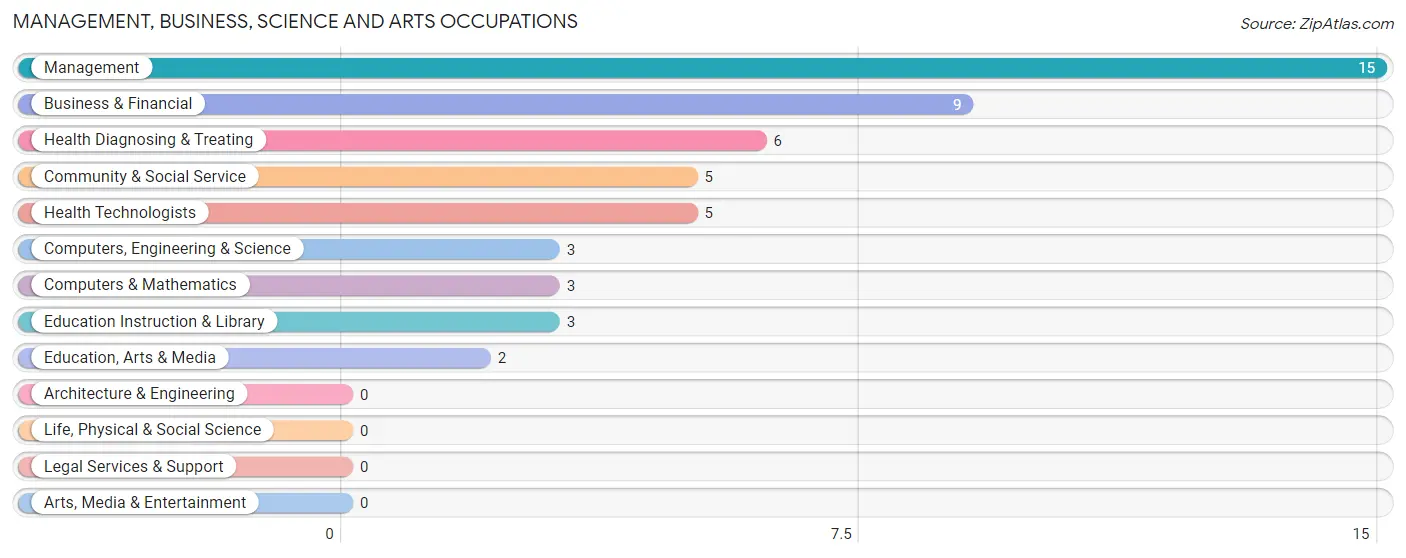
Management, Business, Science and Arts Occupations
The most common Management, Business, Science and Arts occupations in Bernice are Management (15 | 11.5%), Business & Financial (9 | 6.9%), Health Diagnosing & Treating (6 | 4.6%), Community & Social Service (5 | 3.8%), and Health Technologists (5 | 3.8%).
Management, Business, Science and Arts Occupations by Sex
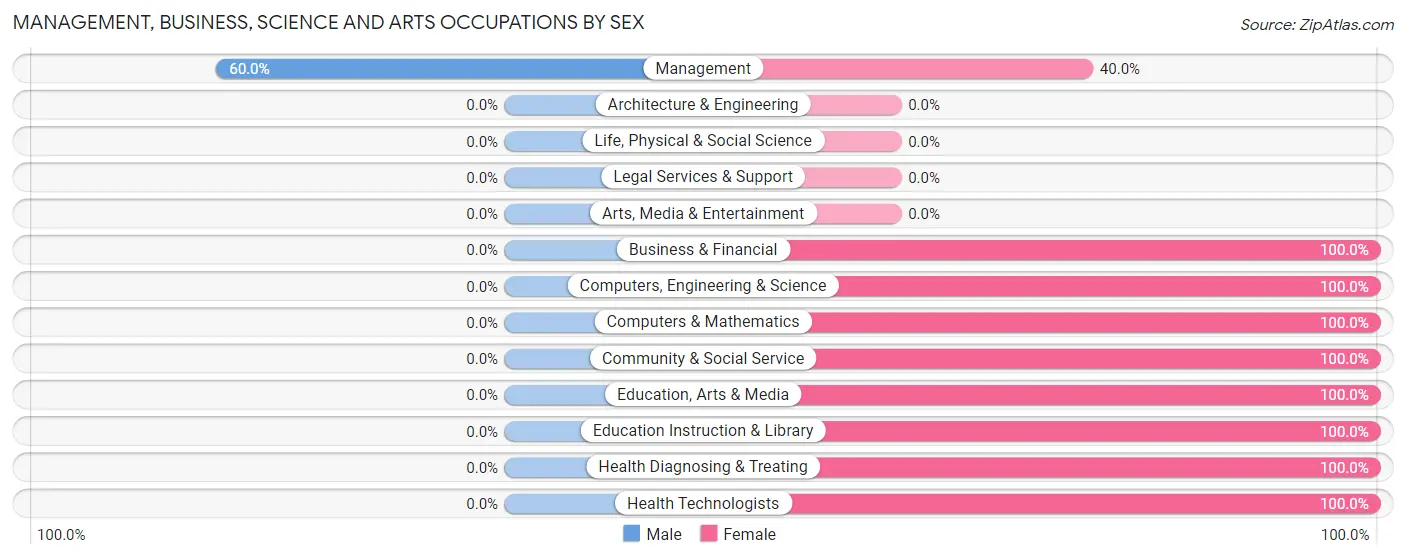
| Occupation | Male | Female |
| Management | 9 (60.0%) | 6 (40.0%) |
| Business & Financial | 0 (0.0%) | 9 (100.0%) |
| Computers, Engineering & Science | 0 (0.0%) | 3 (100.0%) |
| Computers & Mathematics | 0 (0.0%) | 3 (100.0%) |
| Architecture & Engineering | 0 (0.0%) | 0 (0.0%) |
| Life, Physical & Social Science | 0 (0.0%) | 0 (0.0%) |
| Community & Social Service | 0 (0.0%) | 5 (100.0%) |
| Education, Arts & Media | 0 (0.0%) | 2 (100.0%) |
| Legal Services & Support | 0 (0.0%) | 0 (0.0%) |
| Education Instruction & Library | 0 (0.0%) | 3 (100.0%) |
| Arts, Media & Entertainment | 0 (0.0%) | 0 (0.0%) |
| Health Diagnosing & Treating | 0 (0.0%) | 6 (100.0%) |
| Health Technologists | 0 (0.0%) | 5 (100.0%) |
| Total (Category) | 9 (23.7%) | 29 (76.3%) |
| Total (Overall) | 59 (45.4%) | 71 (54.6%) |
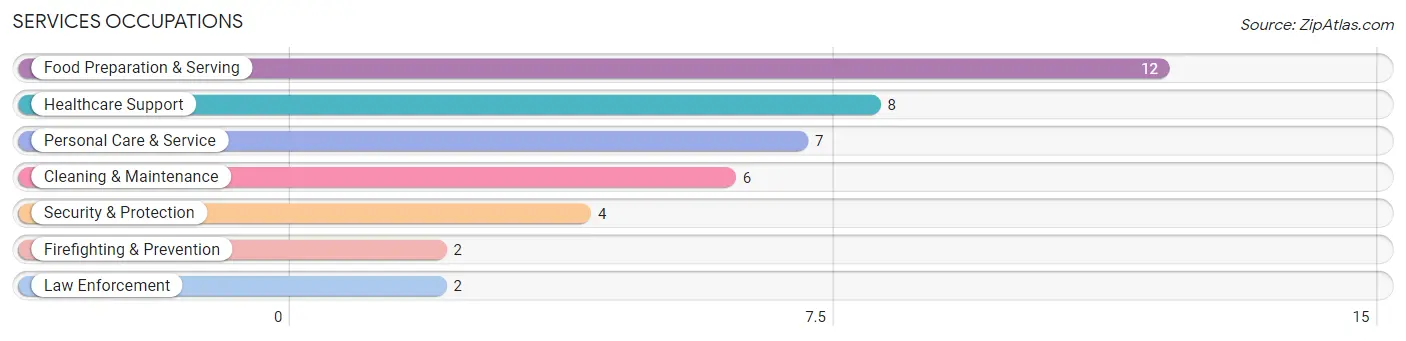
Services Occupations
The most common Services occupations in Bernice are Food Preparation & Serving (12 | 9.2%), Healthcare Support (8 | 6.1%), Personal Care & Service (7 | 5.4%), Cleaning & Maintenance (6 | 4.6%), and Security & Protection (4 | 3.1%).
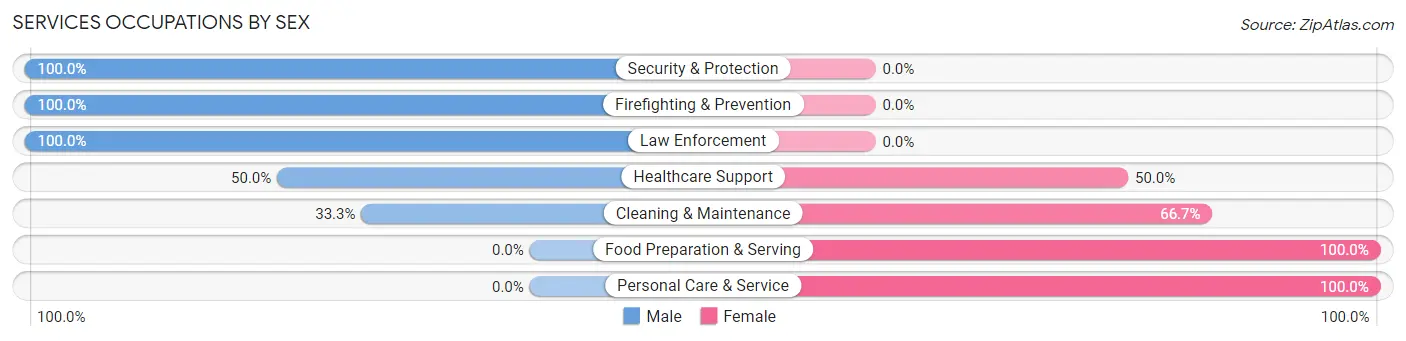
Services Occupations by Sex
Within the Services occupations in Bernice, the most male-oriented occupations are Security & Protection (100.0%), Firefighting & Prevention (100.0%), and Law Enforcement (100.0%), while the most female-oriented occupations are Food Preparation & Serving (100.0%), Personal Care & Service (100.0%), and Cleaning & Maintenance (66.7%).
| Occupation | Male | Female |
| Healthcare Support | 4 (50.0%) | 4 (50.0%) |
| Security & Protection | 4 (100.0%) | 0 (0.0%) |
| Firefighting & Prevention | 2 (100.0%) | 0 (0.0%) |
| Law Enforcement | 2 (100.0%) | 0 (0.0%) |
| Food Preparation & Serving | 0 (0.0%) | 12 (100.0%) |
| Cleaning & Maintenance | 2 (33.3%) | 4 (66.7%) |
| Personal Care & Service | 0 (0.0%) | 7 (100.0%) |
| Total (Category) | 10 (27.0%) | 27 (73.0%) |
| Total (Overall) | 59 (45.4%) | 71 (54.6%) |
Sales and Office Occupations
The most common Sales and Office occupations in Bernice are , and Office & Administration (14 | 10.8%).
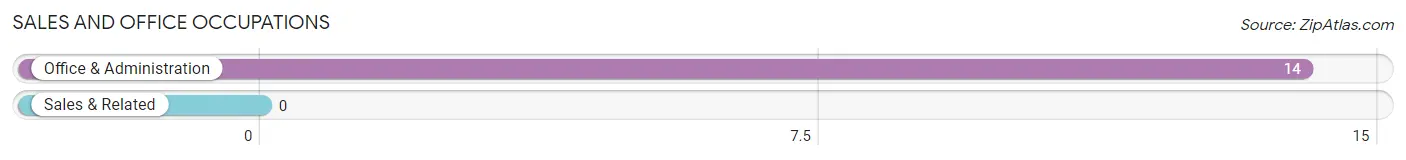
Sales and Office Occupations by Sex
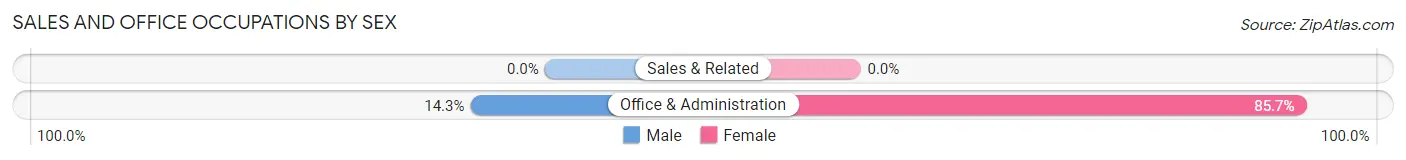
| Occupation | Male | Female |
| Sales & Related | 0 (0.0%) | 0 (0.0%) |
| Office & Administration | 2 (14.3%) | 12 (85.7%) |
| Total (Category) | 2 (14.3%) | 12 (85.7%) |
| Total (Overall) | 59 (45.4%) | 71 (54.6%) |
Natural Resources, Construction and Maintenance Occupations
The most common Natural Resources, Construction and Maintenance occupations in Bernice are Construction & Extraction (14 | 10.8%), Installation, Maintenance & Repair (5 | 3.8%), and Farming, Fishing & Forestry (2 | 1.5%).
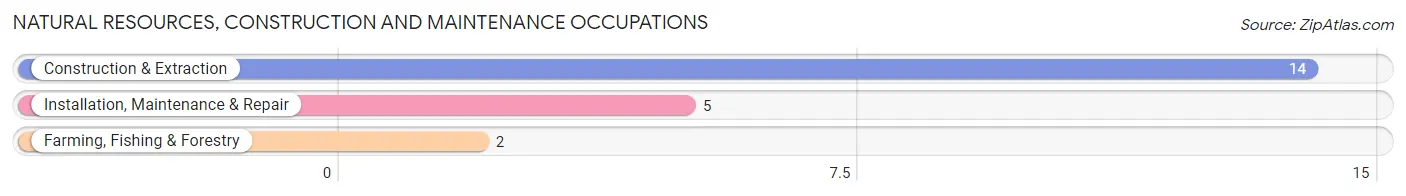
Natural Resources, Construction and Maintenance Occupations by Sex
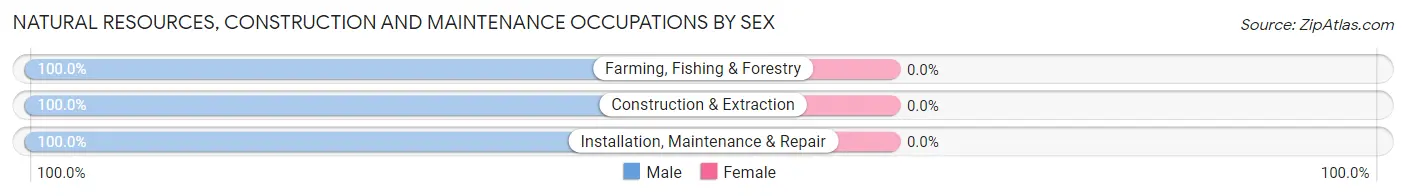
| Occupation | Male | Female |
| Farming, Fishing & Forestry | 2 (100.0%) | 0 (0.0%) |
| Construction & Extraction | 14 (100.0%) | 0 (0.0%) |
| Installation, Maintenance & Repair | 5 (100.0%) | 0 (0.0%) |
| Total (Category) | 21 (100.0%) | 0 (0.0%) |
| Total (Overall) | 59 (45.4%) | 71 (54.6%) |
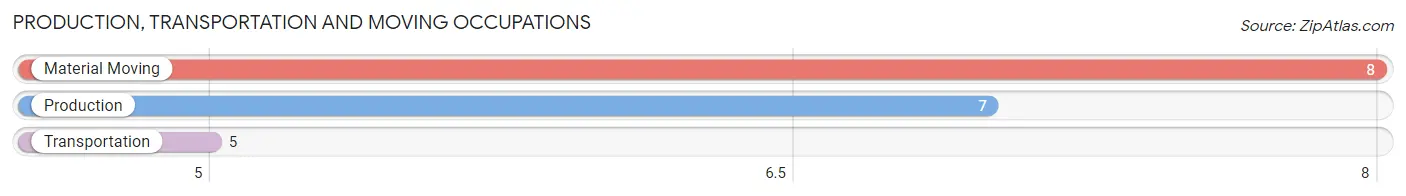
Production, Transportation and Moving Occupations
The most common Production, Transportation and Moving occupations in Bernice are Material Moving (8 | 6.1%), Production (7 | 5.4%), and Transportation (5 | 3.8%).
Production, Transportation and Moving Occupations by Sex
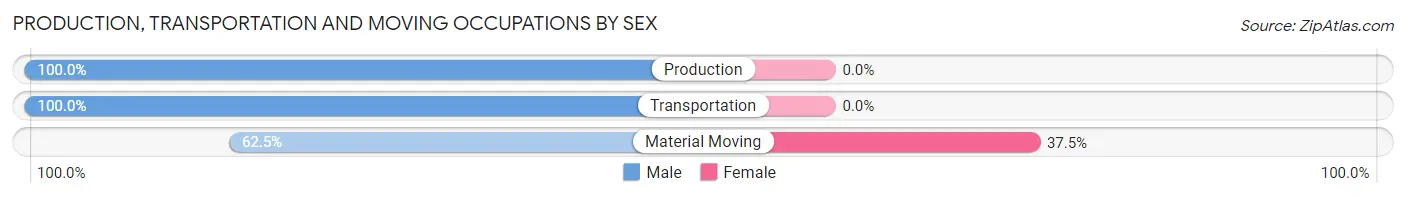
| Occupation | Male | Female |
| Production | 7 (100.0%) | 0 (0.0%) |
| Transportation | 5 (100.0%) | 0 (0.0%) |
| Material Moving | 5 (62.5%) | 3 (37.5%) |
| Total (Category) | 17 (85.0%) | 3 (15.0%) |
| Total (Overall) | 59 (45.4%) | 71 (54.6%) |
Employment Industries by Sex in Bernice
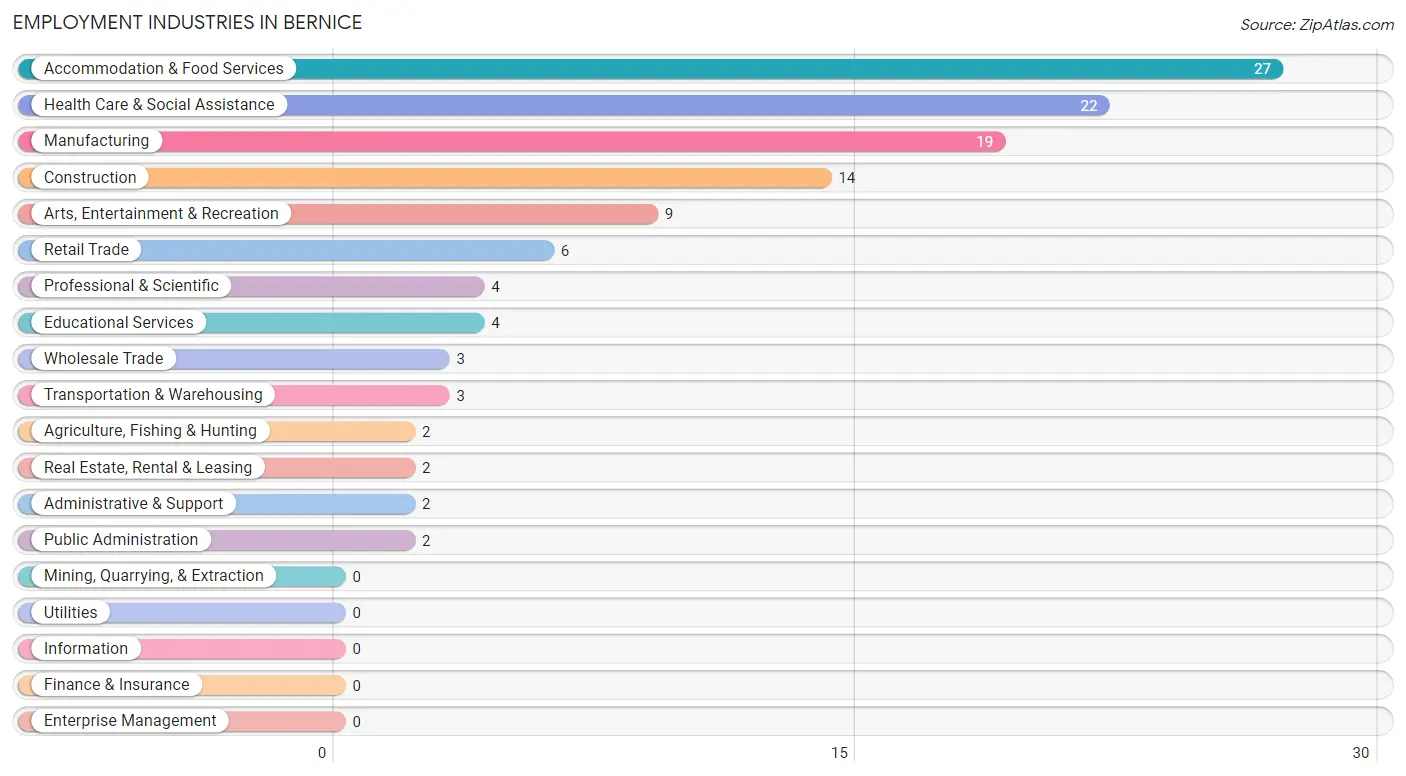
Employment Industries in Bernice
The major employment industries in Bernice include Accommodation & Food Services (27 | 20.8%), Health Care & Social Assistance (22 | 16.9%), Manufacturing (19 | 14.6%), Construction (14 | 10.8%), and Arts, Entertainment & Recreation (9 | 6.9%).
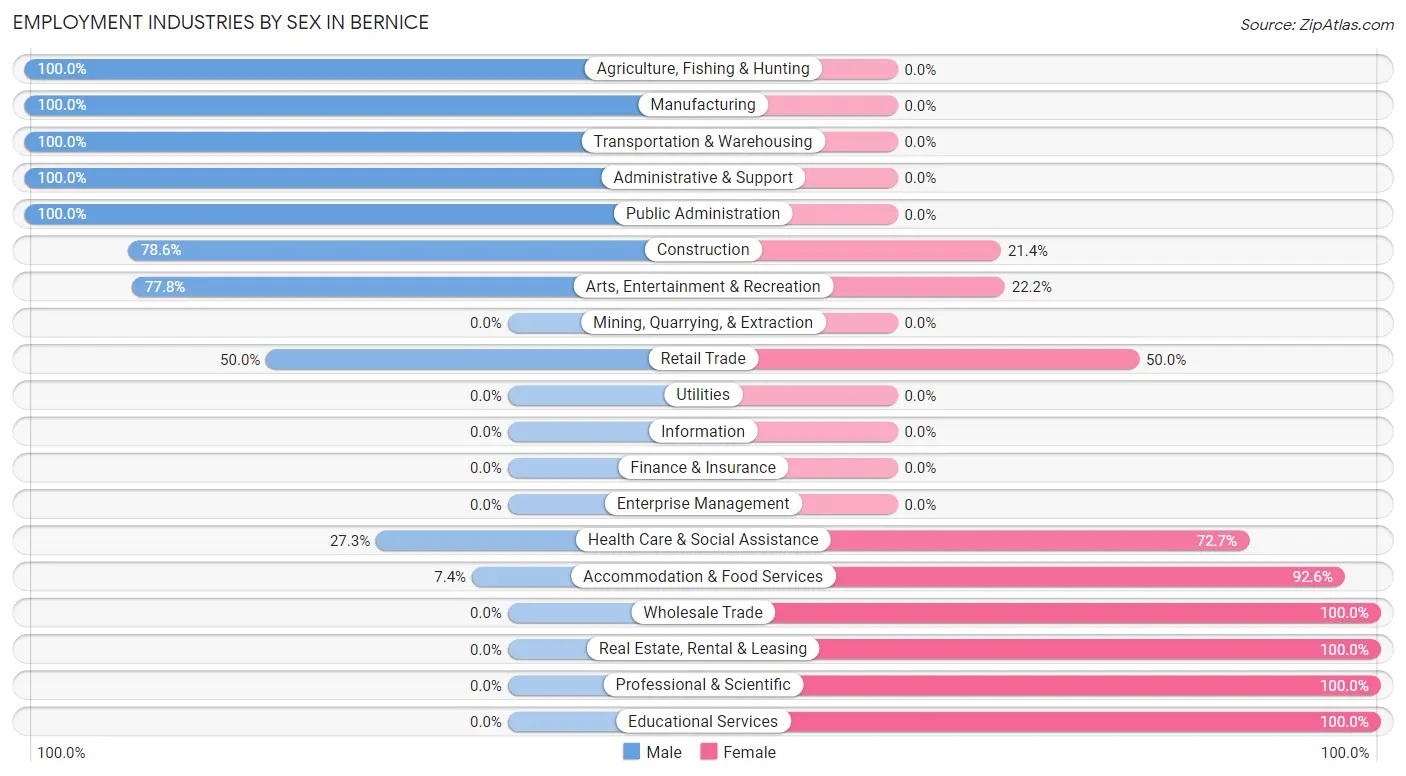
Employment Industries by Sex in Bernice
The Bernice industries that see more men than women are Agriculture, Fishing & Hunting (100.0%), Manufacturing (100.0%), and Transportation & Warehousing (100.0%), whereas the industries that tend to have a higher number of women are Wholesale Trade (100.0%), Real Estate, Rental & Leasing (100.0%), and Professional & Scientific (100.0%).
| Industry | Male | Female |
| Agriculture, Fishing & Hunting | 2 (100.0%) | 0 (0.0%) |
| Mining, Quarrying, & Extraction | 0 (0.0%) | 0 (0.0%) |
| Construction | 11 (78.6%) | 3 (21.4%) |
| Manufacturing | 19 (100.0%) | 0 (0.0%) |
| Wholesale Trade | 0 (0.0%) | 3 (100.0%) |
| Retail Trade | 3 (50.0%) | 3 (50.0%) |
| Transportation & Warehousing | 3 (100.0%) | 0 (0.0%) |
| Utilities | 0 (0.0%) | 0 (0.0%) |
| Information | 0 (0.0%) | 0 (0.0%) |
| Finance & Insurance | 0 (0.0%) | 0 (0.0%) |
| Real Estate, Rental & Leasing | 0 (0.0%) | 2 (100.0%) |
| Professional & Scientific | 0 (0.0%) | 4 (100.0%) |
| Enterprise Management | 0 (0.0%) | 0 (0.0%) |
| Administrative & Support | 2 (100.0%) | 0 (0.0%) |
| Educational Services | 0 (0.0%) | 4 (100.0%) |
| Health Care & Social Assistance | 6 (27.3%) | 16 (72.7%) |
| Arts, Entertainment & Recreation | 7 (77.8%) | 2 (22.2%) |
| Accommodation & Food Services | 2 (7.4%) | 25 (92.6%) |
| Public Administration | 2 (100.0%) | 0 (0.0%) |
| Total | 59 (45.4%) | 71 (54.6%) |
Education in Bernice
School Enrollment in Bernice
The most common levels of schooling among the 72 students in Bernice are middle school (28 | 38.9%), high school (18 | 25.0%), and elementary school (15 | 20.8%).
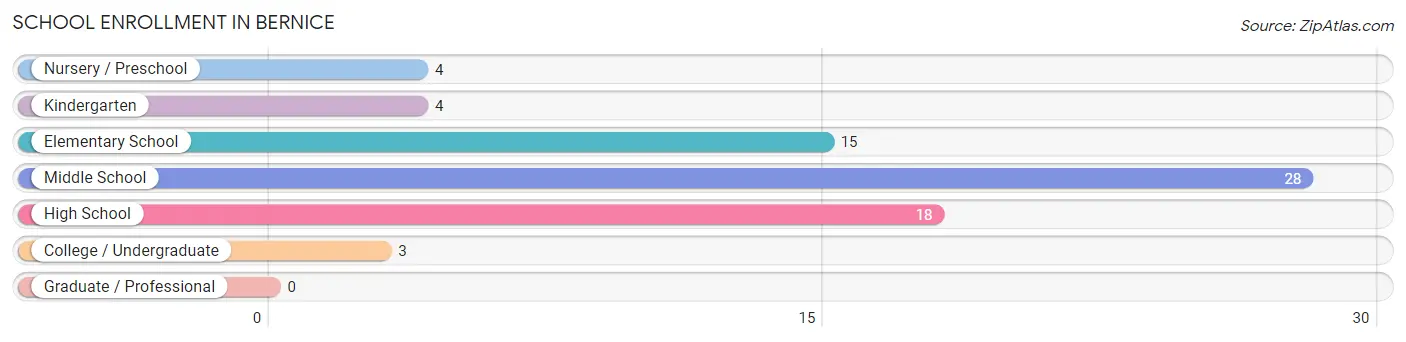
| School Level | # Students | % Students |
| Nursery / Preschool | 4 | 5.6% |
| Kindergarten | 4 | 5.6% |
| Elementary School | 15 | 20.8% |
| Middle School | 28 | 38.9% |
| High School | 18 | 25.0% |
| College / Undergraduate | 3 | 4.2% |
| Graduate / Professional | 0 | 0.0% |
| Total | 72 | 100.0% |
School Enrollment by Age by Funding Source in Bernice
Out of a total of 72 students who are enrolled in schools in Bernice, 15 (20.8%) attend a private institution, while the remaining 57 (79.2%) are enrolled in public schools. The age group of 18 to 19 year olds has the highest likelihood of being enrolled in private schools, with 2 (66.7% in the age bracket) enrolled. Conversely, the age group of 5 to 9 year old has the lowest likelihood of being enrolled in a private school, with 19 (100.0% in the age bracket) attending a public institution.

| Age Bracket | Public School | Private School |
| 3 to 4 Year Olds | 0 (0.0%) | 0 (0.0%) |
| 5 to 9 Year Old | 19 (100.0%) | 0 (0.0%) |
| 10 to 14 Year Olds | 27 (77.1%) | 8 (22.9%) |
| 15 to 17 Year Olds | 7 (58.3%) | 5 (41.7%) |
| 18 to 19 Year Olds | 1 (33.3%) | 2 (66.7%) |
| 20 to 24 Year Olds | 0 (0.0%) | 0 (0.0%) |
| 25 to 34 Year Olds | 0 (0.0%) | 0 (0.0%) |
| 35 Years and over | 3 (100.0%) | 0 (0.0%) |
| Total | 57 (79.2%) | 15 (20.8%) |
Educational Attainment by Field of Study in Bernice
Education (14 | 34.2%), business (7 | 17.1%), visual & performing arts (5 | 12.2%), arts & humanities (5 | 12.2%), and engineering (3 | 7.3%) are the most common fields of study among 41 individuals in Bernice who have obtained a bachelor's degree or higher.
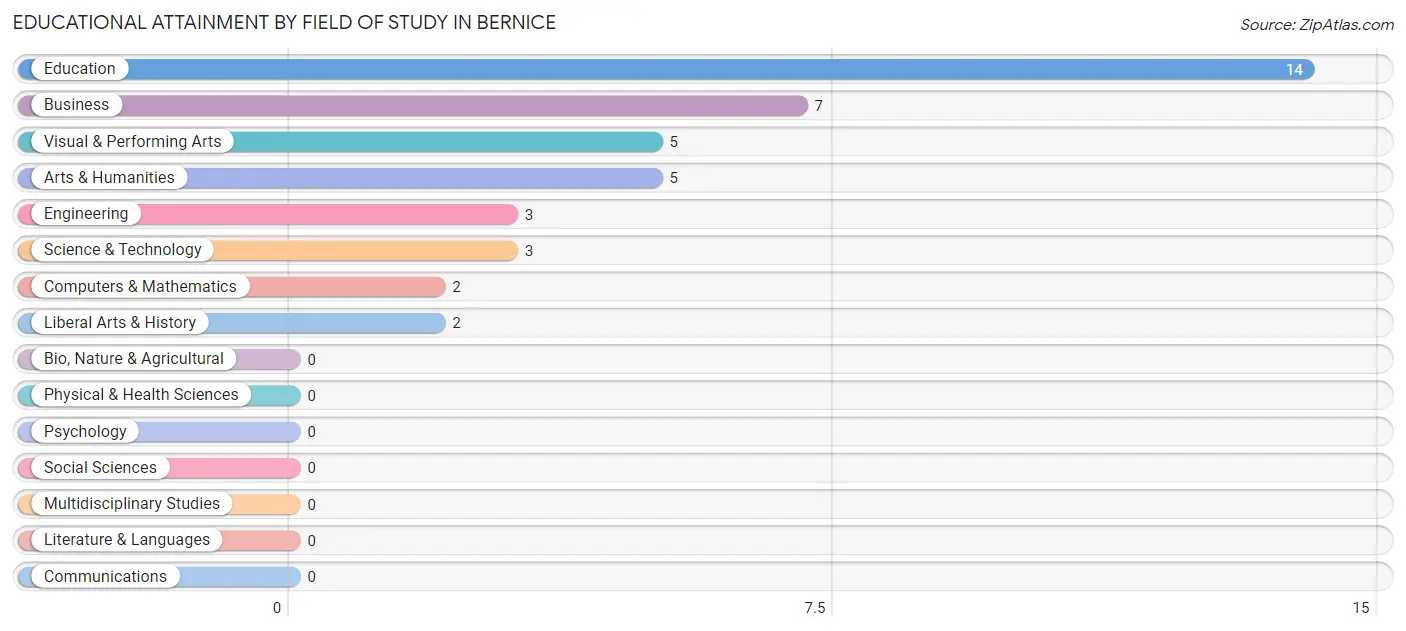
| Field of Study | # Graduates | % Graduates |
| Computers & Mathematics | 2 | 4.9% |
| Bio, Nature & Agricultural | 0 | 0.0% |
| Physical & Health Sciences | 0 | 0.0% |
| Psychology | 0 | 0.0% |
| Social Sciences | 0 | 0.0% |
| Engineering | 3 | 7.3% |
| Multidisciplinary Studies | 0 | 0.0% |
| Science & Technology | 3 | 7.3% |
| Business | 7 | 17.1% |
| Education | 14 | 34.2% |
| Literature & Languages | 0 | 0.0% |
| Liberal Arts & History | 2 | 4.9% |
| Visual & Performing Arts | 5 | 12.2% |
| Communications | 0 | 0.0% |
| Arts & Humanities | 5 | 12.2% |
| Total | 41 | 100.0% |
Transportation & Commute in Bernice
Vehicle Availability by Sex in Bernice
The most prevalent vehicle ownership categories in Bernice are males with 2 vehicles (26, accounting for 44.1%) and females with 2 vehicles (26, making up 36.6%).
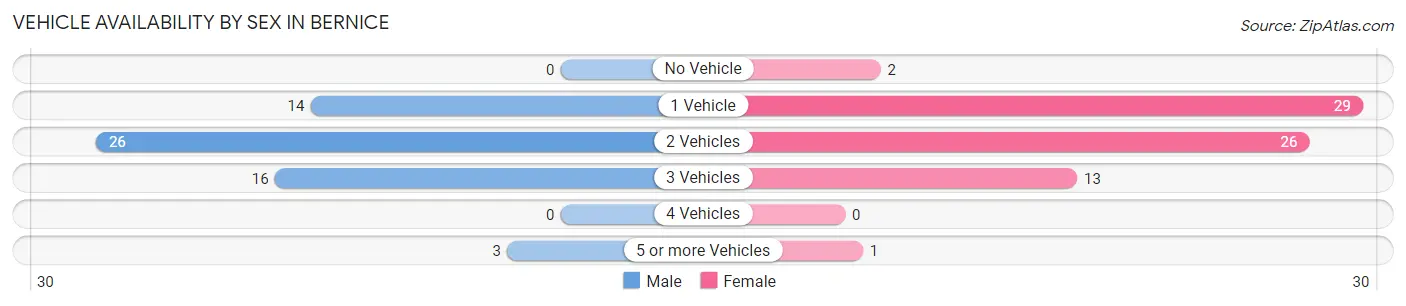
| Vehicles Available | Male | Female |
| No Vehicle | 0 (0.0%) | 2 (2.8%) |
| 1 Vehicle | 14 (23.7%) | 29 (40.8%) |
| 2 Vehicles | 26 (44.1%) | 26 (36.6%) |
| 3 Vehicles | 16 (27.1%) | 13 (18.3%) |
| 4 Vehicles | 0 (0.0%) | 0 (0.0%) |
| 5 or more Vehicles | 3 (5.1%) | 1 (1.4%) |
| Total | 59 (100.0%) | 71 (100.0%) |
Commute Time in Bernice
The most frequently occuring commute durations in Bernice are 15 to 19 minutes (28 commuters, 24.1%), 30 to 34 minutes (24 commuters, 20.7%), and 20 to 24 minutes (20 commuters, 17.2%).
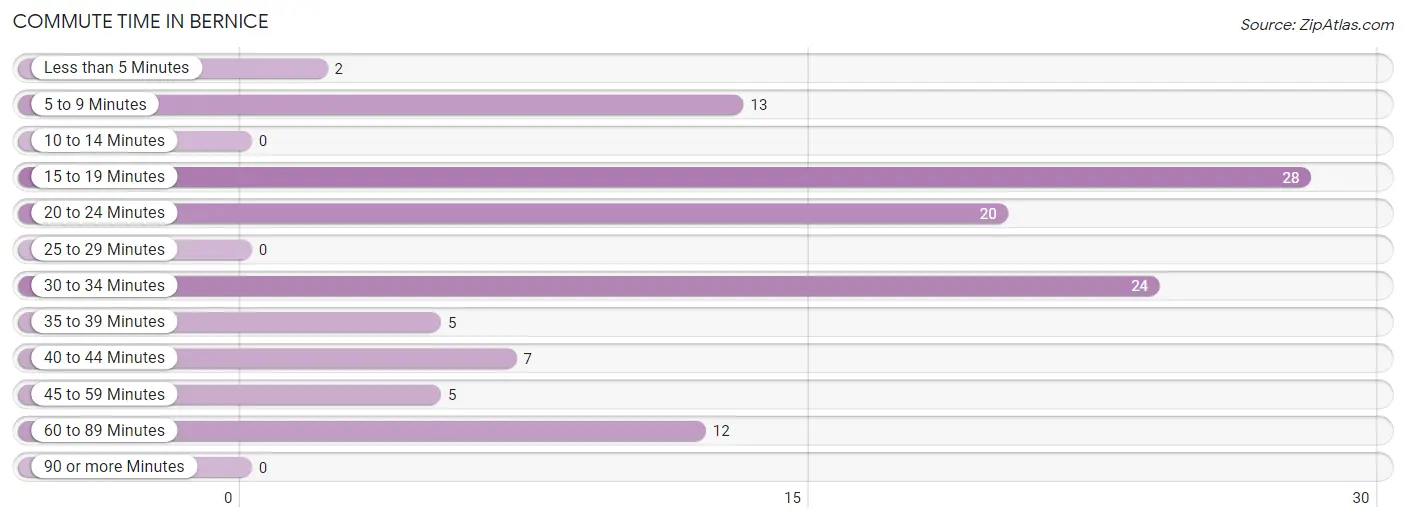
| Commute Time | # Commuters | % Commuters |
| Less than 5 Minutes | 2 | 1.7% |
| 5 to 9 Minutes | 13 | 11.2% |
| 10 to 14 Minutes | 0 | 0.0% |
| 15 to 19 Minutes | 28 | 24.1% |
| 20 to 24 Minutes | 20 | 17.2% |
| 25 to 29 Minutes | 0 | 0.0% |
| 30 to 34 Minutes | 24 | 20.7% |
| 35 to 39 Minutes | 5 | 4.3% |
| 40 to 44 Minutes | 7 | 6.0% |
| 45 to 59 Minutes | 5 | 4.3% |
| 60 to 89 Minutes | 12 | 10.3% |
| 90 or more Minutes | 0 | 0.0% |
Commute Time by Sex in Bernice
The most common commute times in Bernice are 30 to 34 minutes (20 commuters, 40.8%) for males and 20 to 24 minutes (17 commuters, 25.4%) for females.
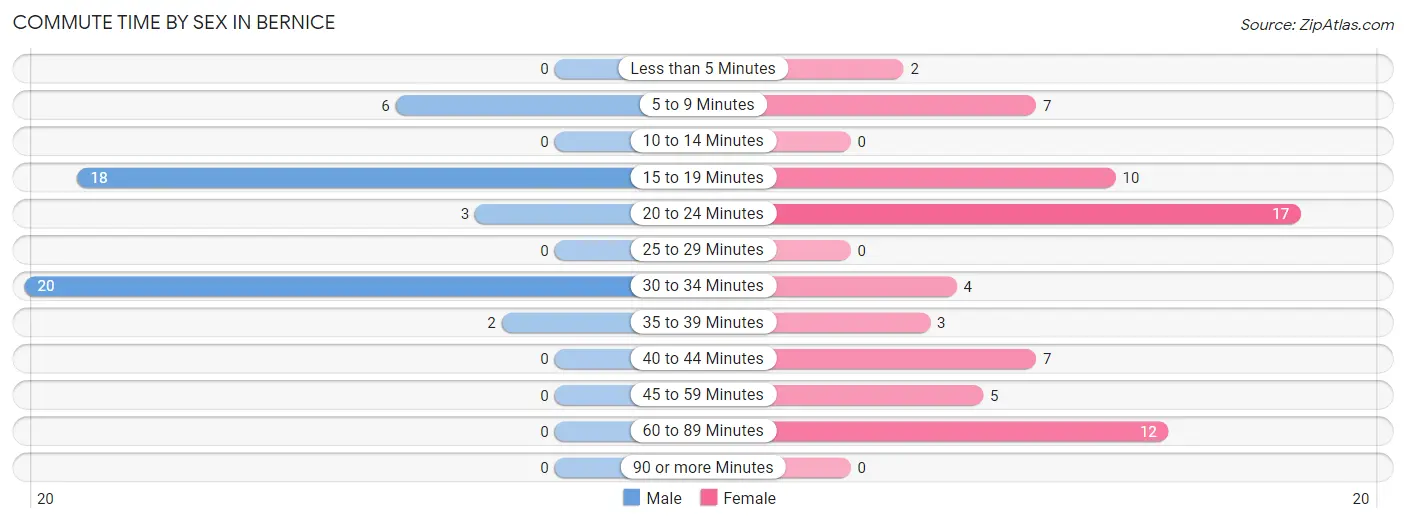
| Commute Time | Male | Female |
| Less than 5 Minutes | 0 (0.0%) | 2 (3.0%) |
| 5 to 9 Minutes | 6 (12.2%) | 7 (10.4%) |
| 10 to 14 Minutes | 0 (0.0%) | 0 (0.0%) |
| 15 to 19 Minutes | 18 (36.7%) | 10 (14.9%) |
| 20 to 24 Minutes | 3 (6.1%) | 17 (25.4%) |
| 25 to 29 Minutes | 0 (0.0%) | 0 (0.0%) |
| 30 to 34 Minutes | 20 (40.8%) | 4 (6.0%) |
| 35 to 39 Minutes | 2 (4.1%) | 3 (4.5%) |
| 40 to 44 Minutes | 0 (0.0%) | 7 (10.4%) |
| 45 to 59 Minutes | 0 (0.0%) | 5 (7.5%) |
| 60 to 89 Minutes | 0 (0.0%) | 12 (17.9%) |
| 90 or more Minutes | 0 (0.0%) | 0 (0.0%) |
Time of Departure to Work by Sex in Bernice
The most frequent times of departure to work in Bernice are 12:00 PM to 3:59 PM (12, 24.5%) for males and 7:00 AM to 7:29 AM (12, 17.9%) for females.
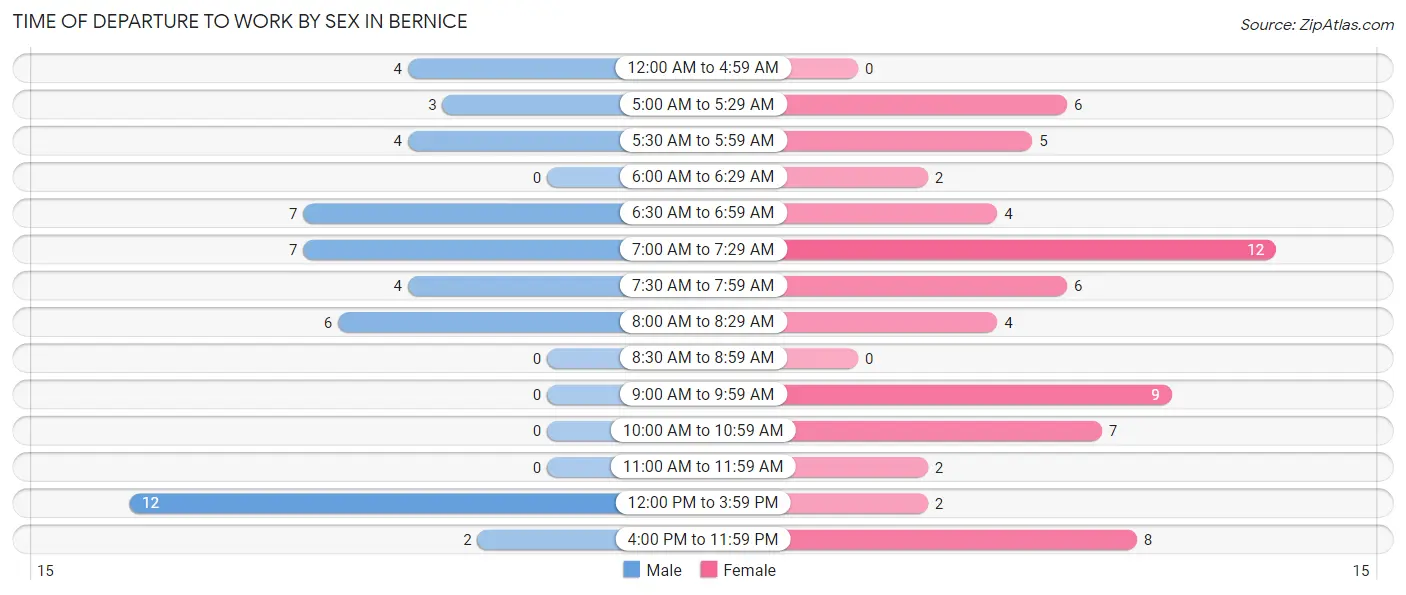
| Time of Departure | Male | Female |
| 12:00 AM to 4:59 AM | 4 (8.2%) | 0 (0.0%) |
| 5:00 AM to 5:29 AM | 3 (6.1%) | 6 (9.0%) |
| 5:30 AM to 5:59 AM | 4 (8.2%) | 5 (7.5%) |
| 6:00 AM to 6:29 AM | 0 (0.0%) | 2 (3.0%) |
| 6:30 AM to 6:59 AM | 7 (14.3%) | 4 (6.0%) |
| 7:00 AM to 7:29 AM | 7 (14.3%) | 12 (17.9%) |
| 7:30 AM to 7:59 AM | 4 (8.2%) | 6 (9.0%) |
| 8:00 AM to 8:29 AM | 6 (12.2%) | 4 (6.0%) |
| 8:30 AM to 8:59 AM | 0 (0.0%) | 0 (0.0%) |
| 9:00 AM to 9:59 AM | 0 (0.0%) | 9 (13.4%) |
| 10:00 AM to 10:59 AM | 0 (0.0%) | 7 (10.4%) |
| 11:00 AM to 11:59 AM | 0 (0.0%) | 2 (3.0%) |
| 12:00 PM to 3:59 PM | 12 (24.5%) | 2 (3.0%) |
| 4:00 PM to 11:59 PM | 2 (4.1%) | 8 (11.9%) |
| Total | 49 (100.0%) | 67 (100.0%) |
Housing Occupancy in Bernice
Occupancy by Ownership in Bernice
Of the total 168 dwellings in Bernice, owner-occupied units account for 140 (83.3%), while renter-occupied units make up 28 (16.7%).
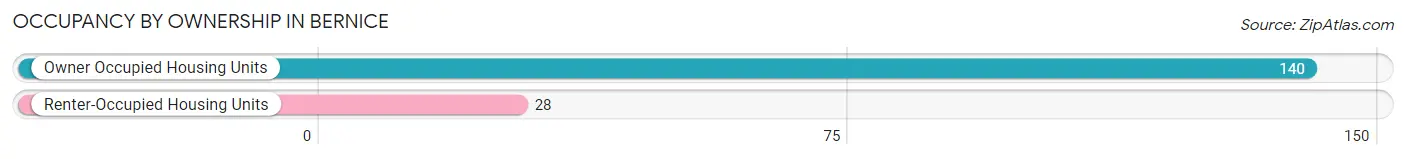
| Occupancy | # Housing Units | % Housing Units |
| Owner Occupied Housing Units | 140 | 83.3% |
| Renter-Occupied Housing Units | 28 | 16.7% |
| Total Occupied Housing Units | 168 | 100.0% |
Occupancy by Household Size in Bernice
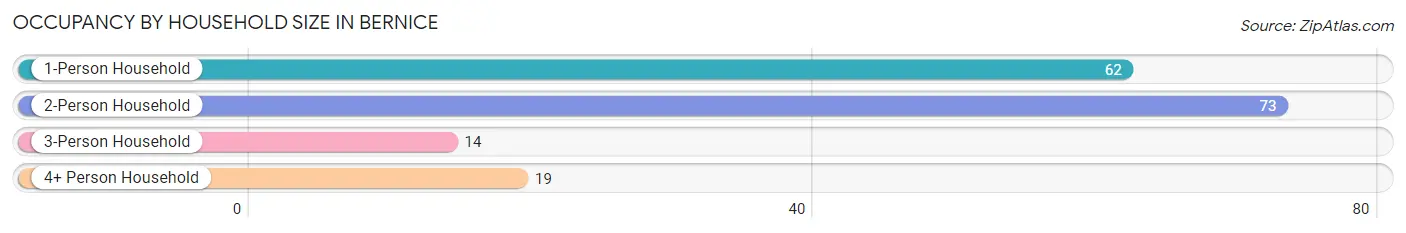
| Household Size | # Housing Units | % Housing Units |
| 1-Person Household | 62 | 36.9% |
| 2-Person Household | 73 | 43.4% |
| 3-Person Household | 14 | 8.3% |
| 4+ Person Household | 19 | 11.3% |
| Total Housing Units | 168 | 100.0% |
Occupancy by Ownership by Household Size in Bernice
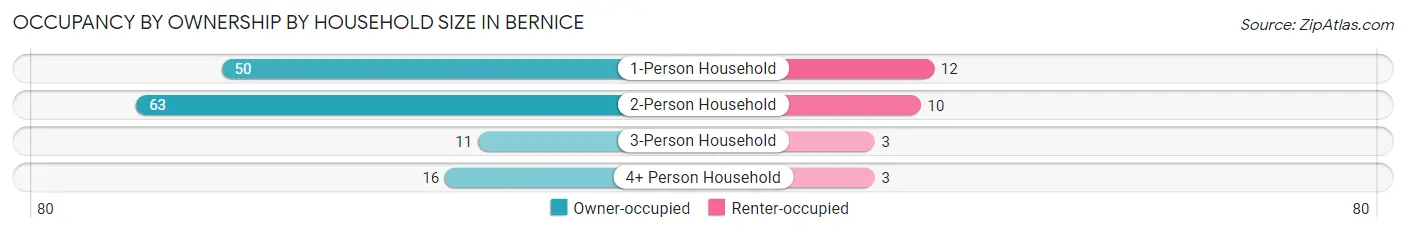
| Household Size | Owner-occupied | Renter-occupied |
| 1-Person Household | 50 (80.6%) | 12 (19.4%) |
| 2-Person Household | 63 (86.3%) | 10 (13.7%) |
| 3-Person Household | 11 (78.6%) | 3 (21.4%) |
| 4+ Person Household | 16 (84.2%) | 3 (15.8%) |
| Total Housing Units | 140 (83.3%) | 28 (16.7%) |
Occupancy by Educational Attainment in Bernice
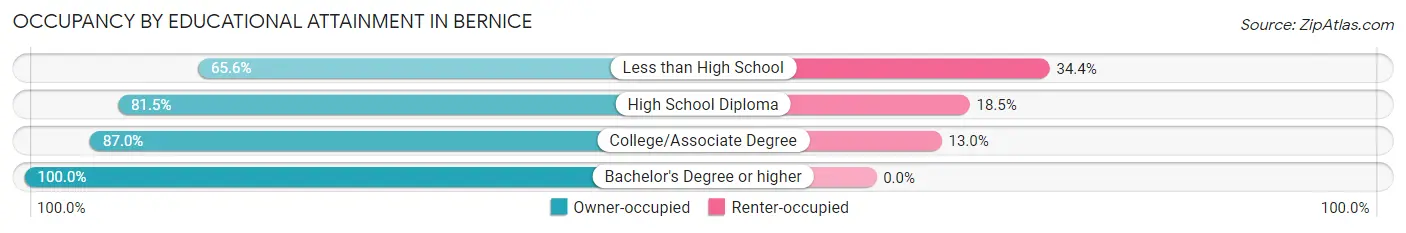
| Household Size | Owner-occupied | Renter-occupied |
| Less than High School | 21 (65.6%) | 11 (34.4%) |
| High School Diploma | 44 (81.5%) | 10 (18.5%) |
| College/Associate Degree | 47 (87.0%) | 7 (13.0%) |
| Bachelor's Degree or higher | 28 (100.0%) | 0 (0.0%) |
Occupancy by Age of Householder in Bernice
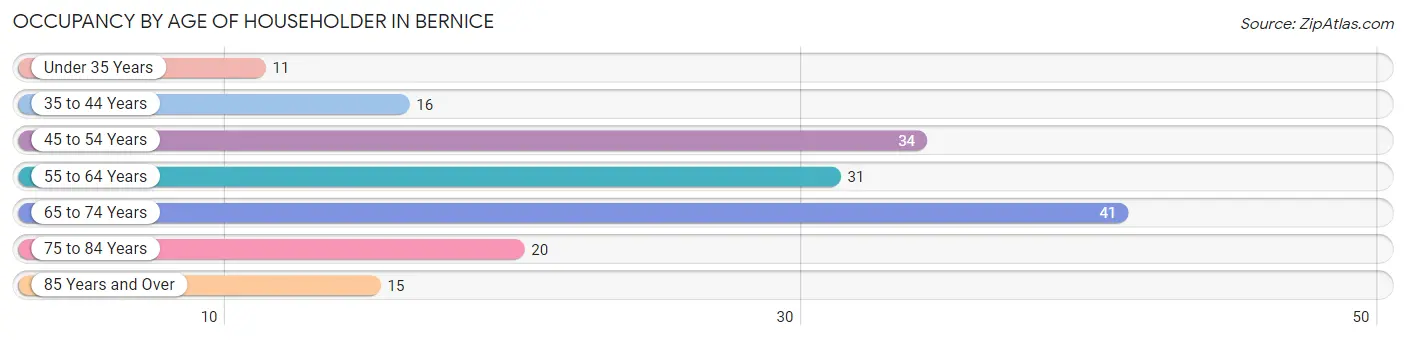
| Age Bracket | # Households | % Households |
| Under 35 Years | 11 | 6.6% |
| 35 to 44 Years | 16 | 9.5% |
| 45 to 54 Years | 34 | 20.2% |
| 55 to 64 Years | 31 | 18.4% |
| 65 to 74 Years | 41 | 24.4% |
| 75 to 84 Years | 20 | 11.9% |
| 85 Years and Over | 15 | 8.9% |
| Total | 168 | 100.0% |
Housing Finances in Bernice
Median Income by Occupancy in Bernice
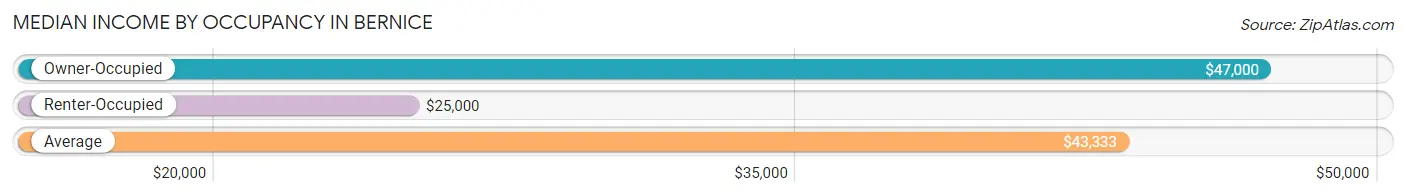
| Occupancy Type | # Households | Median Income |
| Owner-Occupied | 140 (83.3%) | $47,000 |
| Renter-Occupied | 28 (16.7%) | $25,000 |
| Average | 168 (100.0%) | $43,333 |
Occupancy by Householder Income Bracket in Bernice
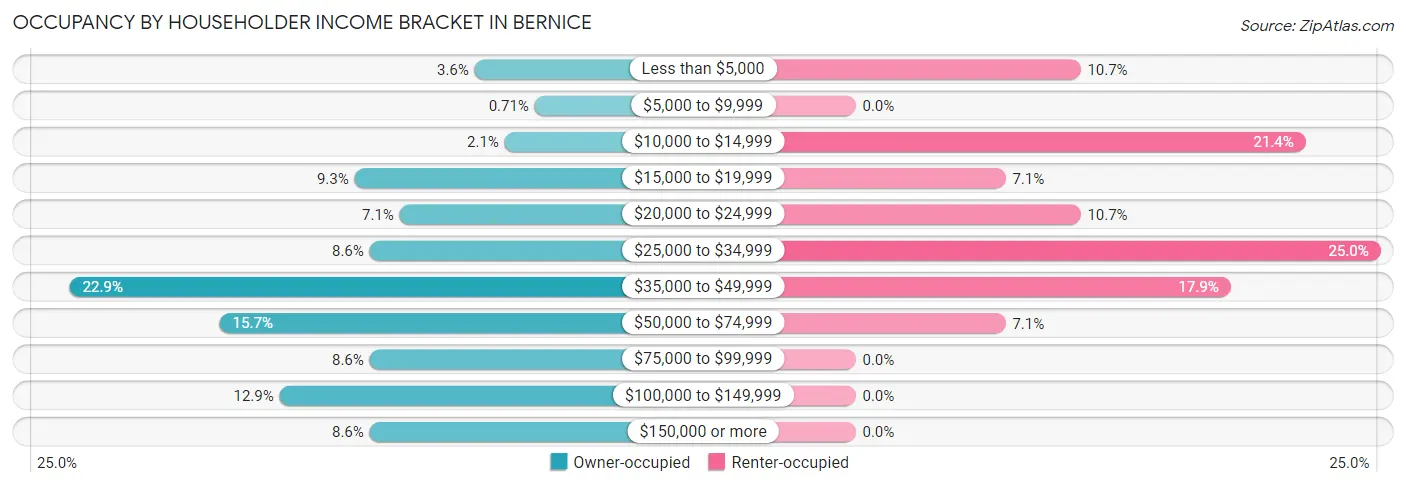
| Income Bracket | Owner-occupied | Renter-occupied |
| Less than $5,000 | 5 (3.6%) | 3 (10.7%) |
| $5,000 to $9,999 | 1 (0.7%) | 0 (0.0%) |
| $10,000 to $14,999 | 3 (2.1%) | 6 (21.4%) |
| $15,000 to $19,999 | 13 (9.3%) | 2 (7.1%) |
| $20,000 to $24,999 | 10 (7.1%) | 3 (10.7%) |
| $25,000 to $34,999 | 12 (8.6%) | 7 (25.0%) |
| $35,000 to $49,999 | 32 (22.9%) | 5 (17.9%) |
| $50,000 to $74,999 | 22 (15.7%) | 2 (7.1%) |
| $75,000 to $99,999 | 12 (8.6%) | 0 (0.0%) |
| $100,000 to $149,999 | 18 (12.9%) | 0 (0.0%) |
| $150,000 or more | 12 (8.6%) | 0 (0.0%) |
| Total | 140 (100.0%) | 28 (100.0%) |
Monthly Housing Cost Tiers in Bernice
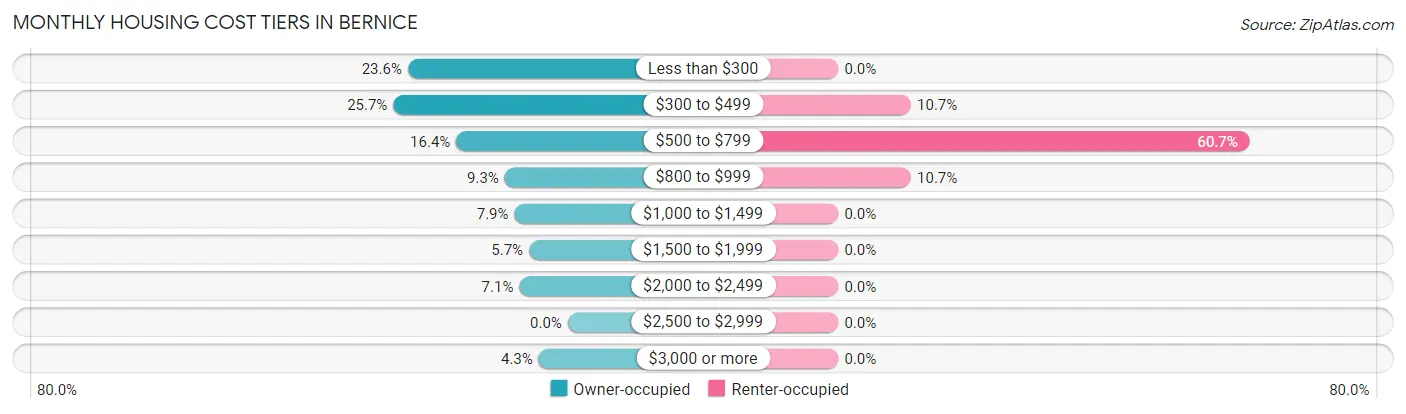
| Monthly Cost | Owner-occupied | Renter-occupied |
| Less than $300 | 33 (23.6%) | 0 (0.0%) |
| $300 to $499 | 36 (25.7%) | 3 (10.7%) |
| $500 to $799 | 23 (16.4%) | 17 (60.7%) |
| $800 to $999 | 13 (9.3%) | 3 (10.7%) |
| $1,000 to $1,499 | 11 (7.9%) | 0 (0.0%) |
| $1,500 to $1,999 | 8 (5.7%) | 0 (0.0%) |
| $2,000 to $2,499 | 10 (7.1%) | 0 (0.0%) |
| $2,500 to $2,999 | 0 (0.0%) | 0 (0.0%) |
| $3,000 or more | 6 (4.3%) | 0 (0.0%) |
| Total | 140 (100.0%) | 28 (100.0%) |
Physical Housing Characteristics in Bernice
Housing Structures in Bernice
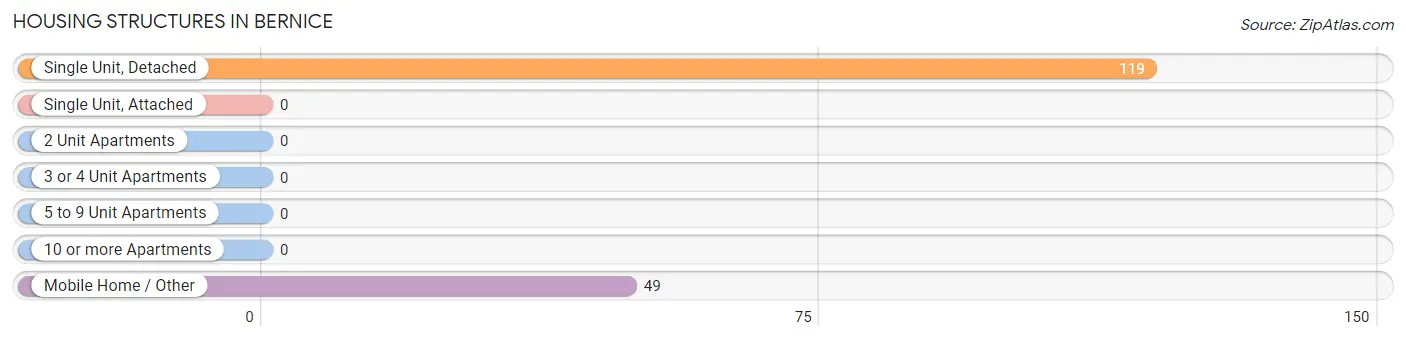
| Structure Type | # Housing Units | % Housing Units |
| Single Unit, Detached | 119 | 70.8% |
| Single Unit, Attached | 0 | 0.0% |
| 2 Unit Apartments | 0 | 0.0% |
| 3 or 4 Unit Apartments | 0 | 0.0% |
| 5 to 9 Unit Apartments | 0 | 0.0% |
| 10 or more Apartments | 0 | 0.0% |
| Mobile Home / Other | 49 | 29.2% |
| Total | 168 | 100.0% |
Housing Structures by Occupancy in Bernice
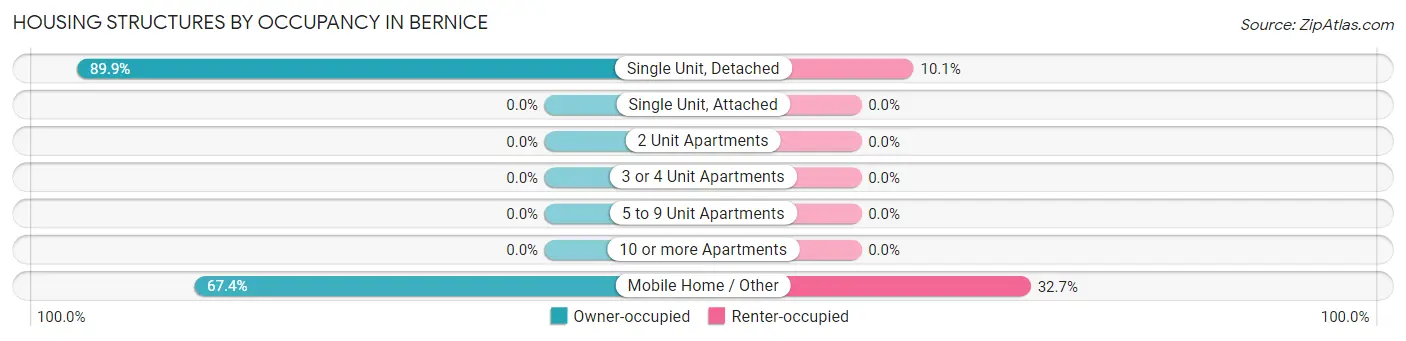
| Structure Type | Owner-occupied | Renter-occupied |
| Single Unit, Detached | 107 (89.9%) | 12 (10.1%) |
| Single Unit, Attached | 0 (0.0%) | 0 (0.0%) |
| 2 Unit Apartments | 0 (0.0%) | 0 (0.0%) |
| 3 or 4 Unit Apartments | 0 (0.0%) | 0 (0.0%) |
| 5 to 9 Unit Apartments | 0 (0.0%) | 0 (0.0%) |
| 10 or more Apartments | 0 (0.0%) | 0 (0.0%) |
| Mobile Home / Other | 33 (67.3%) | 16 (32.7%) |
| Total | 140 (83.3%) | 28 (16.7%) |
Housing Structures by Number of Rooms in Bernice
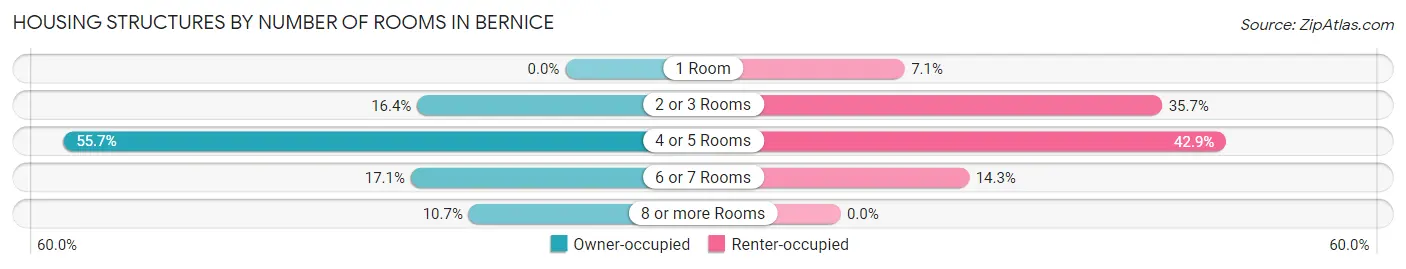
| Number of Rooms | Owner-occupied | Renter-occupied |
| 1 Room | 0 (0.0%) | 2 (7.1%) |
| 2 or 3 Rooms | 23 (16.4%) | 10 (35.7%) |
| 4 or 5 Rooms | 78 (55.7%) | 12 (42.9%) |
| 6 or 7 Rooms | 24 (17.1%) | 4 (14.3%) |
| 8 or more Rooms | 15 (10.7%) | 0 (0.0%) |
| Total | 140 (100.0%) | 28 (100.0%) |
Housing Structure by Heating Type in Bernice
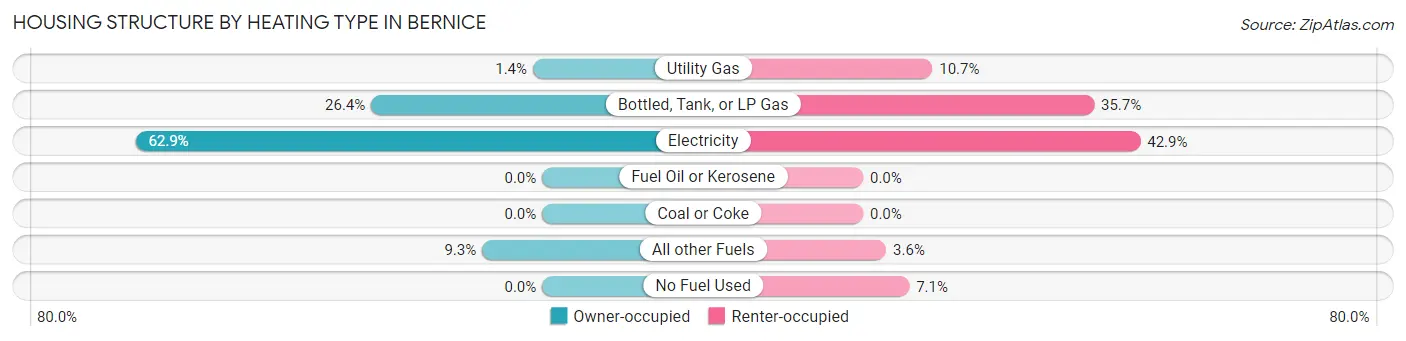
| Heating Type | Owner-occupied | Renter-occupied |
| Utility Gas | 2 (1.4%) | 3 (10.7%) |
| Bottled, Tank, or LP Gas | 37 (26.4%) | 10 (35.7%) |
| Electricity | 88 (62.9%) | 12 (42.9%) |
| Fuel Oil or Kerosene | 0 (0.0%) | 0 (0.0%) |
| Coal or Coke | 0 (0.0%) | 0 (0.0%) |
| All other Fuels | 13 (9.3%) | 1 (3.6%) |
| No Fuel Used | 0 (0.0%) | 2 (7.1%) |
| Total | 140 (100.0%) | 28 (100.0%) |
Household Vehicle Usage in Bernice
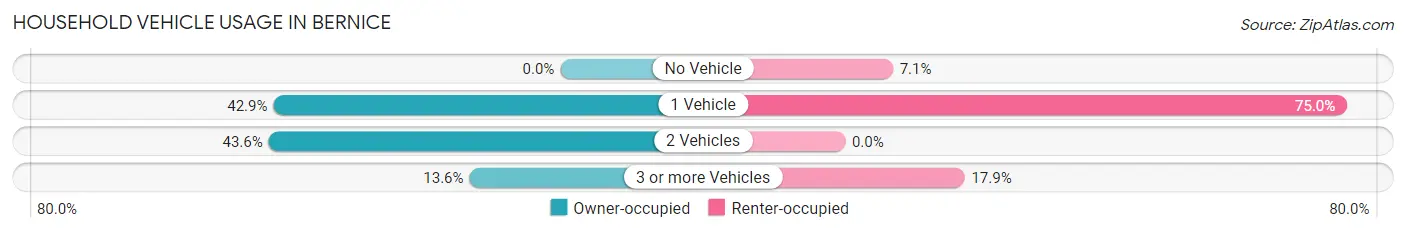
| Vehicles per Household | Owner-occupied | Renter-occupied |
| No Vehicle | 0 (0.0%) | 2 (7.1%) |
| 1 Vehicle | 60 (42.9%) | 21 (75.0%) |
| 2 Vehicles | 61 (43.6%) | 0 (0.0%) |
| 3 or more Vehicles | 19 (13.6%) | 5 (17.9%) |
| Total | 140 (100.0%) | 28 (100.0%) |
Real Estate & Mortgages in Bernice
Real Estate and Mortgage Overview in Bernice
| Characteristic | Without Mortgage | With Mortgage |
| Housing Units | 89 | 51 |
| Median Property Value | $97,900 | $190,600 |
| Median Household Income | $45,250 | $12 |
| Monthly Housing Costs | $348 | $6 |
| Real Estate Taxes | $428 | $0 |
Property Value by Mortgage Status in Bernice
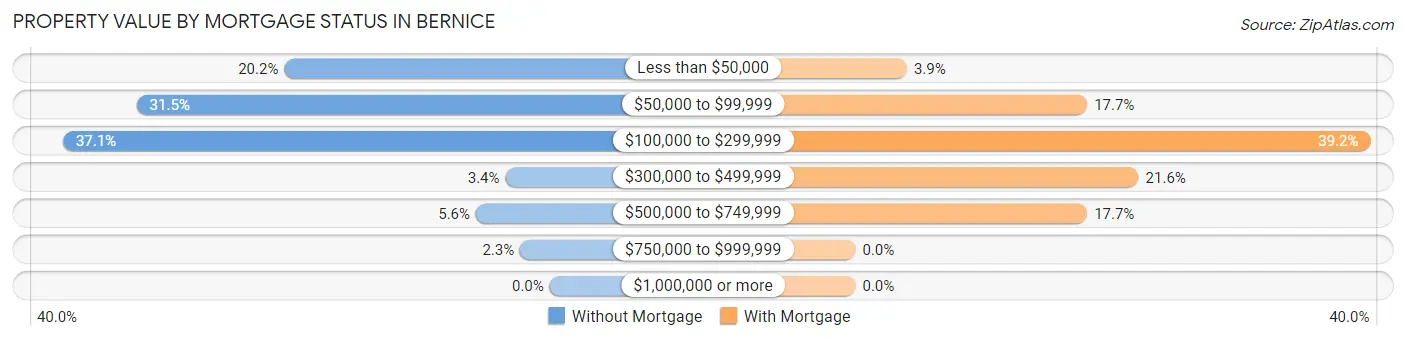
| Property Value | Without Mortgage | With Mortgage |
| Less than $50,000 | 18 (20.2%) | 2 (3.9%) |
| $50,000 to $99,999 | 28 (31.5%) | 9 (17.6%) |
| $100,000 to $299,999 | 33 (37.1%) | 20 (39.2%) |
| $300,000 to $499,999 | 3 (3.4%) | 11 (21.6%) |
| $500,000 to $749,999 | 5 (5.6%) | 9 (17.6%) |
| $750,000 to $999,999 | 2 (2.2%) | 0 (0.0%) |
| $1,000,000 or more | 0 (0.0%) | 0 (0.0%) |
| Total | 89 (100.0%) | 51 (100.0%) |
Household Income by Mortgage Status in Bernice
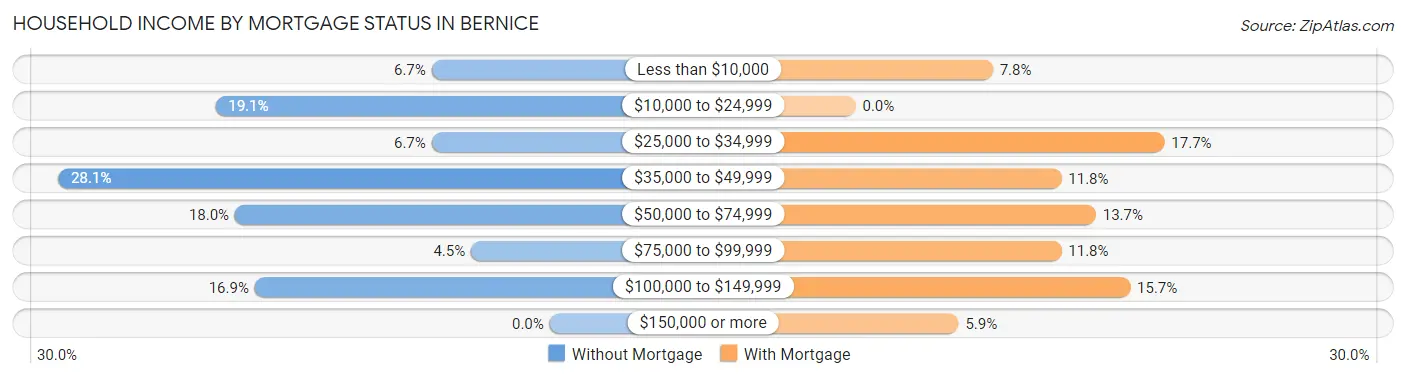
| Household Income | Without Mortgage | With Mortgage |
| Less than $10,000 | 6 (6.7%) | 4 (7.8%) |
| $10,000 to $24,999 | 17 (19.1%) | 0 (0.0%) |
| $25,000 to $34,999 | 6 (6.7%) | 9 (17.6%) |
| $35,000 to $49,999 | 25 (28.1%) | 6 (11.8%) |
| $50,000 to $74,999 | 16 (18.0%) | 7 (13.7%) |
| $75,000 to $99,999 | 4 (4.5%) | 6 (11.8%) |
| $100,000 to $149,999 | 15 (16.9%) | 8 (15.7%) |
| $150,000 or more | 0 (0.0%) | 3 (5.9%) |
| Total | 89 (100.0%) | 51 (100.0%) |
Property Value to Household Income Ratio in Bernice
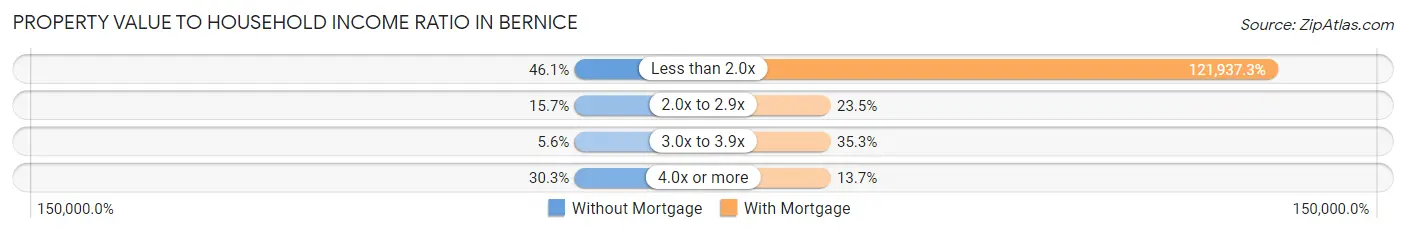
| Value-to-Income Ratio | Without Mortgage | With Mortgage |
| Less than 2.0x | 41 (46.1%) | 62,188 (121,937.2%) |
| 2.0x to 2.9x | 14 (15.7%) | 12 (23.5%) |
| 3.0x to 3.9x | 5 (5.6%) | 18 (35.3%) |
| 4.0x or more | 27 (30.3%) | 7 (13.7%) |
| Total | 89 (100.0%) | 51 (100.0%) |
Real Estate Taxes by Mortgage Status in Bernice
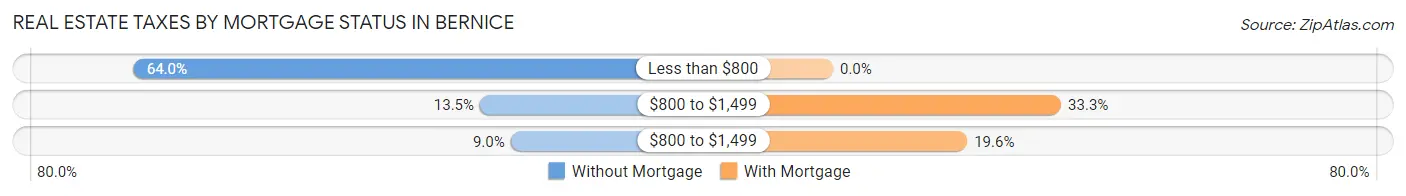
| Property Taxes | Without Mortgage | With Mortgage |
| Less than $800 | 57 (64.0%) | 0 (0.0%) |
| $800 to $1,499 | 12 (13.5%) | 17 (33.3%) |
| $800 to $1,499 | 8 (9.0%) | 10 (19.6%) |
| Total | 89 (100.0%) | 51 (100.0%) |
Health & Disability in Bernice
Health Insurance Coverage by Age in Bernice
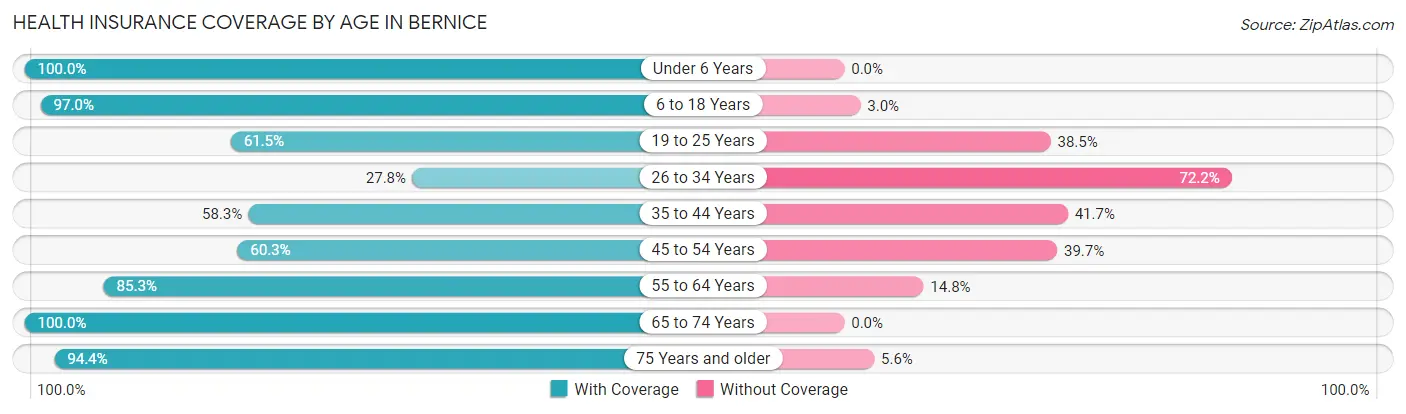
| Age Bracket | With Coverage | Without Coverage |
| Under 6 Years | 9 (100.0%) | 0 (0.0%) |
| 6 to 18 Years | 65 (97.0%) | 2 (3.0%) |
| 19 to 25 Years | 8 (61.5%) | 5 (38.5%) |
| 26 to 34 Years | 5 (27.8%) | 13 (72.2%) |
| 35 to 44 Years | 14 (58.3%) | 10 (41.7%) |
| 45 to 54 Years | 38 (60.3%) | 25 (39.7%) |
| 55 to 64 Years | 52 (85.3%) | 9 (14.7%) |
| 65 to 74 Years | 61 (100.0%) | 0 (0.0%) |
| 75 Years and older | 51 (94.4%) | 3 (5.6%) |
| Total | 303 (81.9%) | 67 (18.1%) |
Health Insurance Coverage by Citizenship Status in Bernice
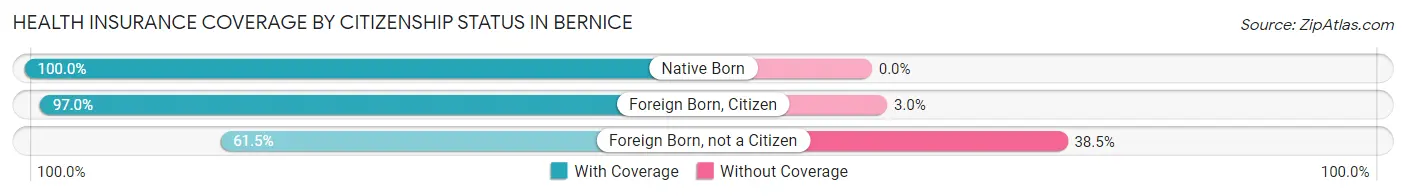
| Citizenship Status | With Coverage | Without Coverage |
| Native Born | 9 (100.0%) | 0 (0.0%) |
| Foreign Born, Citizen | 65 (97.0%) | 2 (3.0%) |
| Foreign Born, not a Citizen | 8 (61.5%) | 5 (38.5%) |
Health Insurance Coverage by Household Income in Bernice
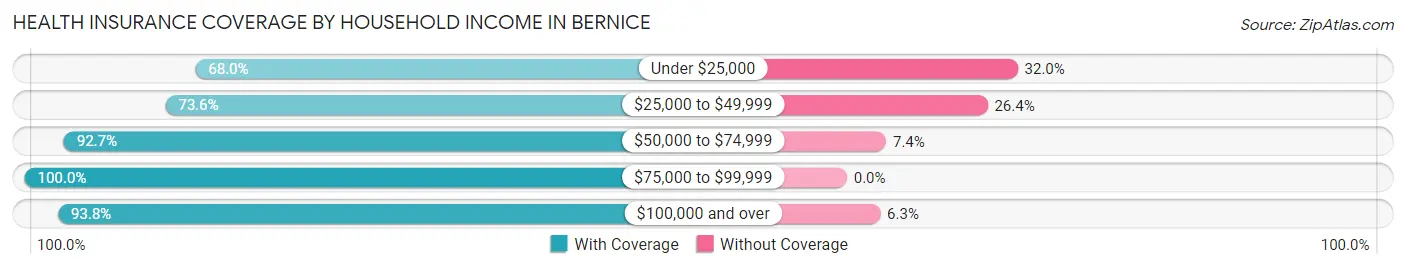
| Household Income | With Coverage | Without Coverage |
| Under $25,000 | 51 (68.0%) | 24 (32.0%) |
| $25,000 to $49,999 | 95 (73.6%) | 34 (26.4%) |
| $50,000 to $74,999 | 63 (92.6%) | 5 (7.3%) |
| $75,000 to $99,999 | 34 (100.0%) | 0 (0.0%) |
| $100,000 and over | 60 (93.8%) | 4 (6.2%) |
Public vs Private Health Insurance Coverage by Age in Bernice
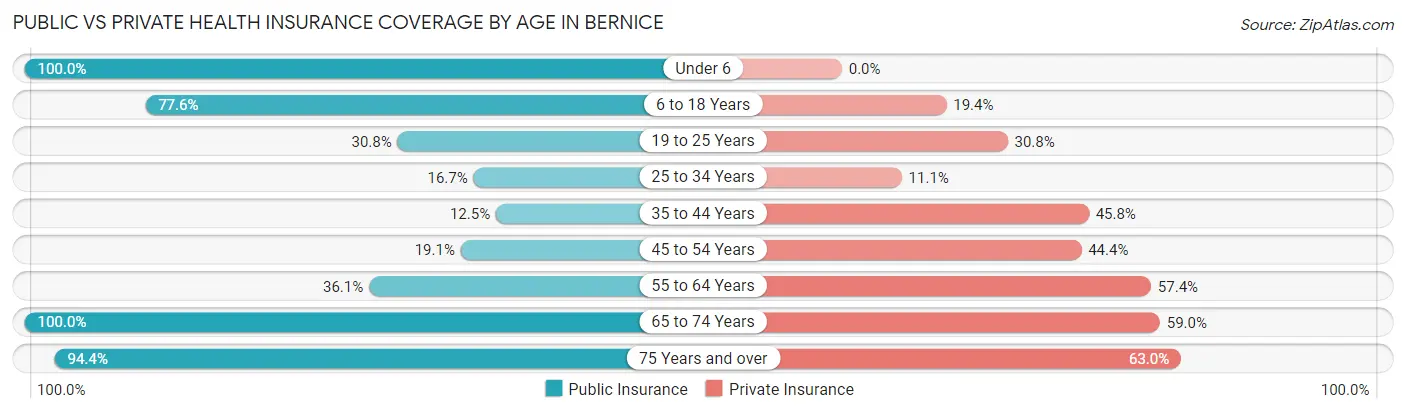
| Age Bracket | Public Insurance | Private Insurance |
| Under 6 | 9 (100.0%) | 0 (0.0%) |
| 6 to 18 Years | 52 (77.6%) | 13 (19.4%) |
| 19 to 25 Years | 4 (30.8%) | 4 (30.8%) |
| 25 to 34 Years | 3 (16.7%) | 2 (11.1%) |
| 35 to 44 Years | 3 (12.5%) | 11 (45.8%) |
| 45 to 54 Years | 12 (19.1%) | 28 (44.4%) |
| 55 to 64 Years | 22 (36.1%) | 35 (57.4%) |
| 65 to 74 Years | 61 (100.0%) | 36 (59.0%) |
| 75 Years and over | 51 (94.4%) | 34 (63.0%) |
| Total | 217 (58.7%) | 163 (44.1%) |
Disability Status by Sex by Age in Bernice
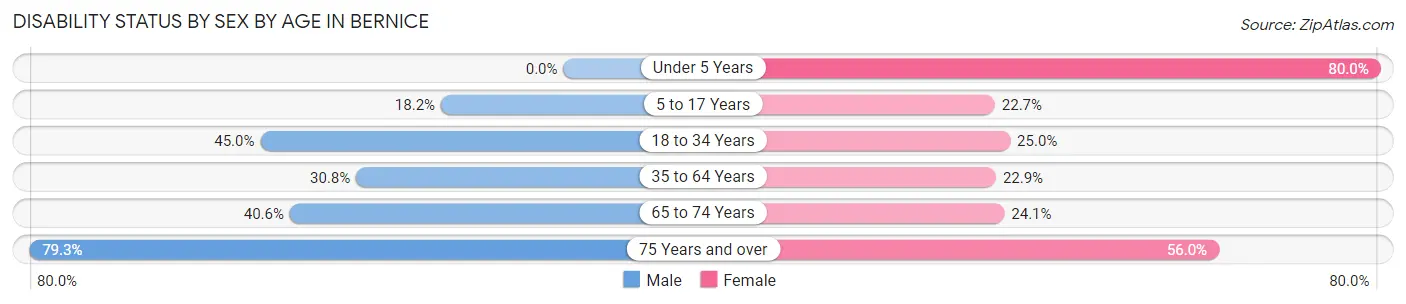
| Age Bracket | Male | Female |
| Under 5 Years | 0 (0.0%) | 4 (80.0%) |
| 5 to 17 Years | 4 (18.2%) | 10 (22.7%) |
| 18 to 34 Years | 9 (45.0%) | 4 (25.0%) |
| 35 to 64 Years | 20 (30.8%) | 19 (22.9%) |
| 65 to 74 Years | 13 (40.6%) | 7 (24.1%) |
| 75 Years and over | 23 (79.3%) | 14 (56.0%) |
Disability Class by Sex by Age in Bernice
Disability Class: Hearing Difficulty
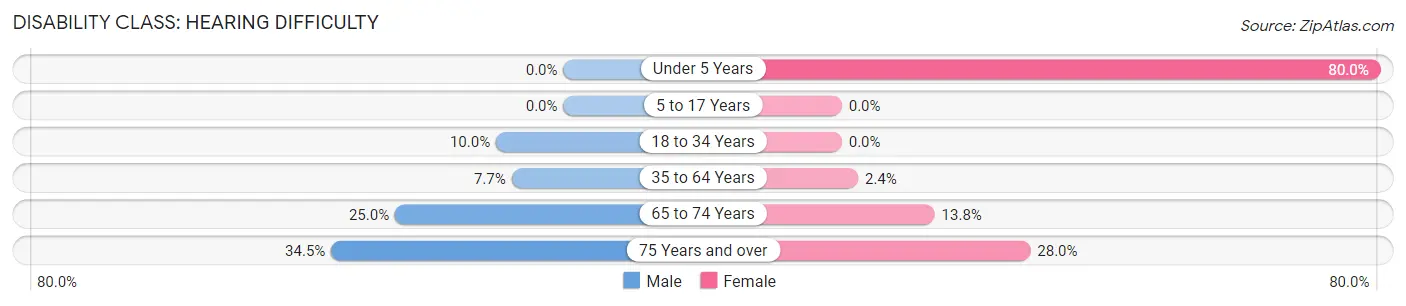
| Age Bracket | Male | Female |
| Under 5 Years | 0 (0.0%) | 4 (80.0%) |
| 5 to 17 Years | 0 (0.0%) | 0 (0.0%) |
| 18 to 34 Years | 2 (10.0%) | 0 (0.0%) |
| 35 to 64 Years | 5 (7.7%) | 2 (2.4%) |
| 65 to 74 Years | 8 (25.0%) | 4 (13.8%) |
| 75 Years and over | 10 (34.5%) | 7 (28.0%) |
Disability Class: Vision Difficulty
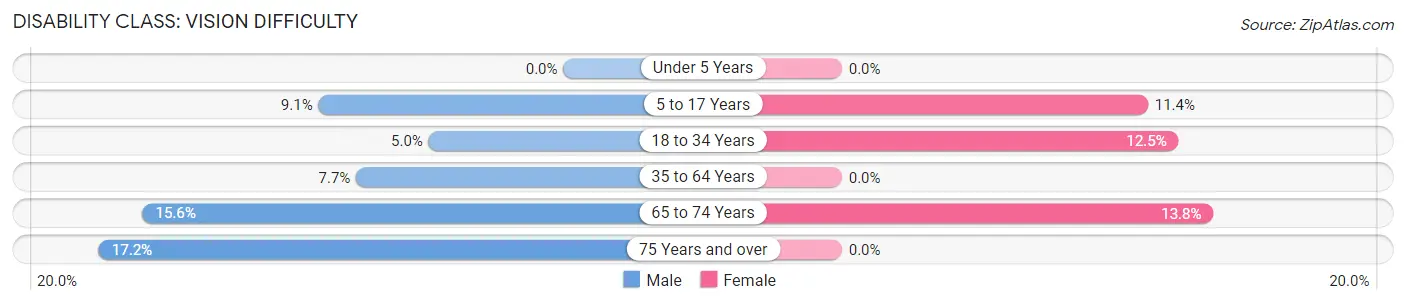
| Age Bracket | Male | Female |
| Under 5 Years | 0 (0.0%) | 0 (0.0%) |
| 5 to 17 Years | 2 (9.1%) | 5 (11.4%) |
| 18 to 34 Years | 1 (5.0%) | 2 (12.5%) |
| 35 to 64 Years | 5 (7.7%) | 0 (0.0%) |
| 65 to 74 Years | 5 (15.6%) | 4 (13.8%) |
| 75 Years and over | 5 (17.2%) | 0 (0.0%) |
Disability Class: Cognitive Difficulty
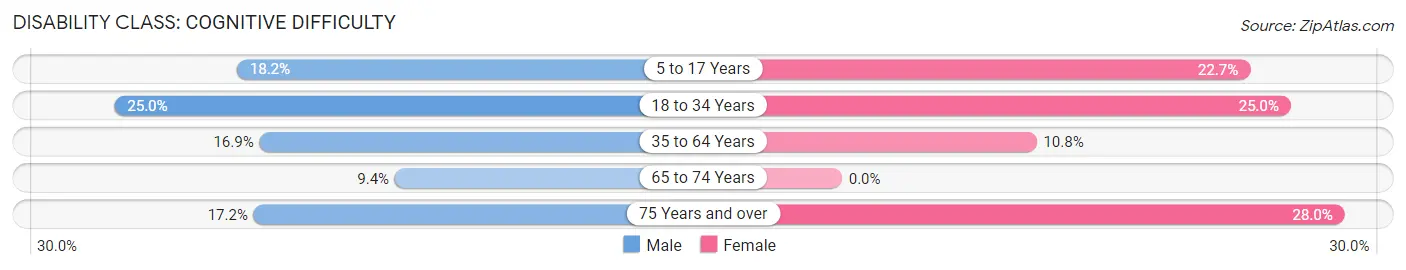
| Age Bracket | Male | Female |
| 5 to 17 Years | 4 (18.2%) | 10 (22.7%) |
| 18 to 34 Years | 5 (25.0%) | 4 (25.0%) |
| 35 to 64 Years | 11 (16.9%) | 9 (10.8%) |
| 65 to 74 Years | 3 (9.4%) | 0 (0.0%) |
| 75 Years and over | 5 (17.2%) | 7 (28.0%) |
Disability Class: Ambulatory Difficulty
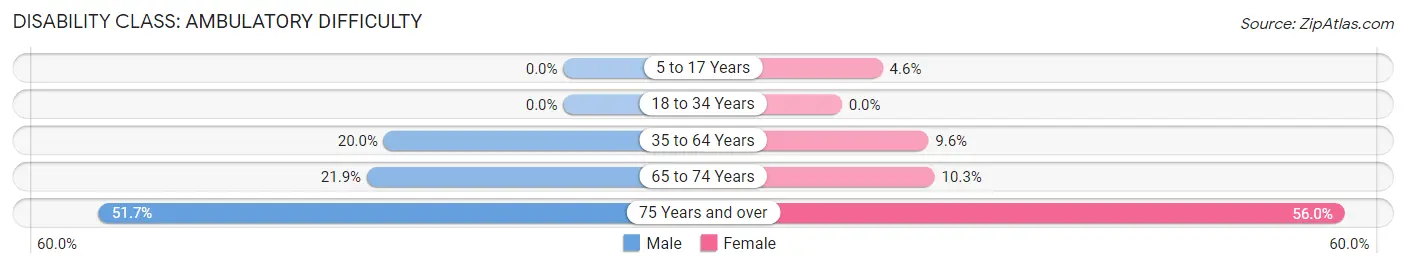
| Age Bracket | Male | Female |
| 5 to 17 Years | 0 (0.0%) | 2 (4.5%) |
| 18 to 34 Years | 0 (0.0%) | 0 (0.0%) |
| 35 to 64 Years | 13 (20.0%) | 8 (9.6%) |
| 65 to 74 Years | 7 (21.9%) | 3 (10.3%) |
| 75 Years and over | 15 (51.7%) | 14 (56.0%) |
Disability Class: Self-Care Difficulty
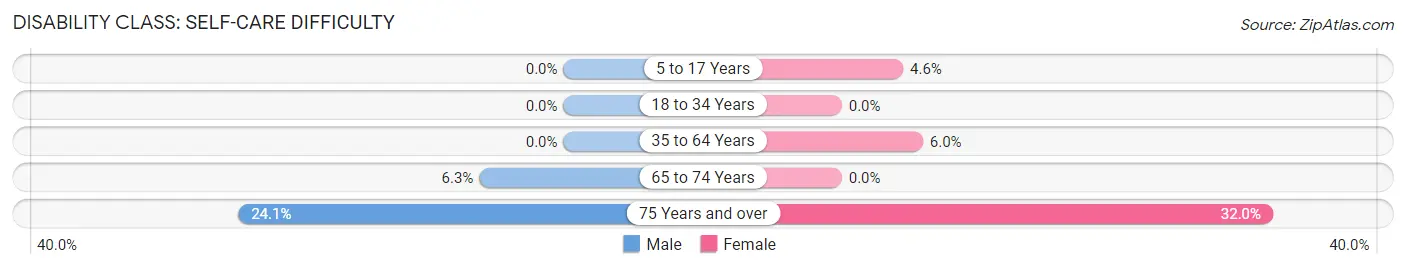
| Age Bracket | Male | Female |
| 5 to 17 Years | 0 (0.0%) | 2 (4.5%) |
| 18 to 34 Years | 0 (0.0%) | 0 (0.0%) |
| 35 to 64 Years | 0 (0.0%) | 5 (6.0%) |
| 65 to 74 Years | 2 (6.2%) | 0 (0.0%) |
| 75 Years and over | 7 (24.1%) | 8 (32.0%) |
Technology Access in Bernice
Computing Device Access in Bernice
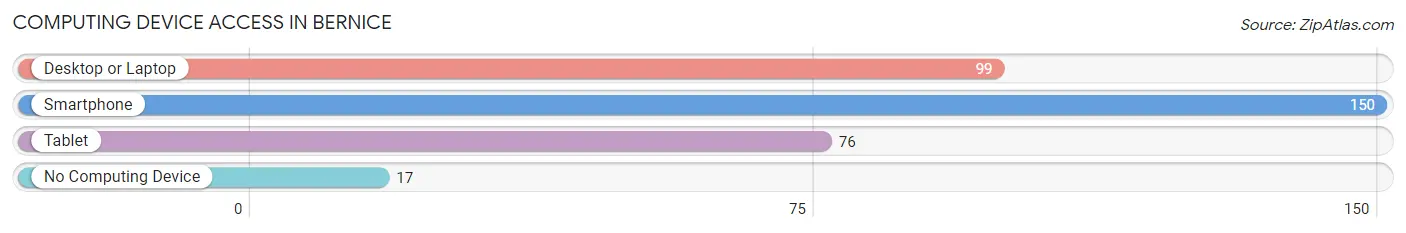
| Device Type | # Households | % Households |
| Desktop or Laptop | 99 | 58.9% |
| Smartphone | 150 | 89.3% |
| Tablet | 76 | 45.2% |
| No Computing Device | 17 | 10.1% |
| Total | 168 | 100.0% |
Internet Access in Bernice
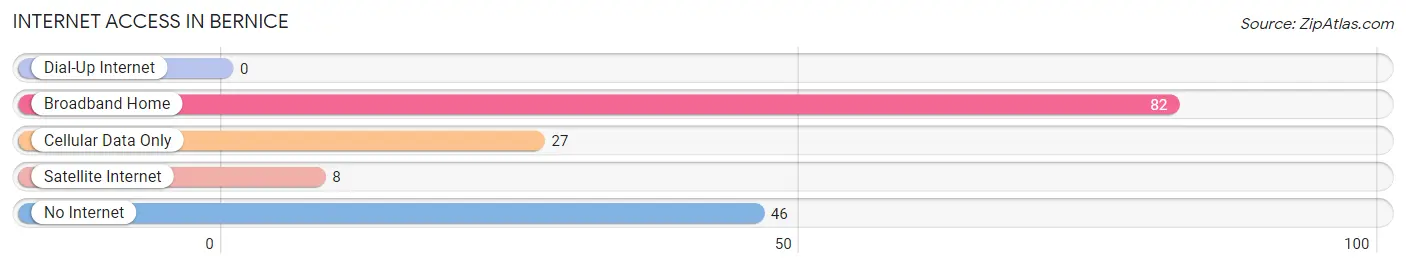
| Internet Type | # Households | % Households |
| Dial-Up Internet | 0 | 0.0% |
| Broadband Home | 82 | 48.8% |
| Cellular Data Only | 27 | 16.1% |
| Satellite Internet | 8 | 4.8% |
| No Internet | 46 | 27.4% |
| Total | 168 | 100.0% |
Bernice Summary
Bernice is a small town located in the southeastern corner of Oklahoma, in the United States. It is situated in the foothills of the Ozark Mountains, and is part of the larger Pittsburg County. The town was founded in 1894 and was named after the daughter of the first postmaster, who was also the first mayor of the town.
Geography
Bernice is located at the intersection of U.S. Highway 69 and State Highway 2, about 20 miles south of McAlester and about 40 miles north of the Arkansas border. The town is situated in a hilly area, with the highest point being the summit of nearby Mount Sherman, which is about 1,000 feet above sea level. The town is surrounded by forests and is home to several small lakes, including Lake Eufaula, which is the largest lake in Oklahoma.
The climate in Bernice is humid subtropical, with hot summers and mild winters. The average annual temperature is around 64°F, with the average high in July being around 90°F and the average low in January being around 28°F. The average annual precipitation is around 44 inches, with the wettest month being May and the driest month being October.
Economy
The economy of Bernice is largely based on agriculture and tourism. The town is home to several farms, which produce a variety of crops, including cotton, soybeans, corn, and wheat. The town is also home to several small businesses, including restaurants, shops, and a few manufacturing plants.
Tourism is an important part of the economy of Bernice. The town is home to several attractions, including the Bernice State Park, which offers camping, fishing, and hiking opportunities. The town is also home to several historic sites, including the old Bernice Depot, which was built in the late 1800s.
Demographics
As of the 2010 census, the population of Bernice was 1,845. The racial makeup of the town was 94.3% White, 0.7% African American, 0.7% Native American, 0.2% Asian, 0.1% Pacific Islander, and 3.1% from other races. The median household income was $30,938, and the median family income was $37,813. The per capita income was $15,945.
Conclusion
Bernice is a small town located in the southeastern corner of Oklahoma. It is situated in the foothills of the Ozark Mountains and is home to several farms, businesses, and attractions. The economy of the town is largely based on agriculture and tourism, and the population is mostly White. The town is a great place to visit, with its historic sites, natural beauty, and friendly people.
Common Questions
What is Per Capita Income in Bernice?
Per Capita income in Bernice is $27,965.
What is the Median Family Income in Bernice?
Median Family Income in Bernice is $57,083.
What is the Median Household income in Bernice?
Median Household Income in Bernice is $43,333.
What is Income or Wage Gap in Bernice?
Income or Wage Gap in Bernice is 42.9%.
Women in Bernice earn 57.1 cents for every dollar earned by a man.
What is Inequality or Gini Index in Bernice?
Inequality or Gini Index in Bernice is 0.43.
What is the Total Population of Bernice?
Total Population of Bernice is 370.
What is the Total Male Population of Bernice?
Total Male Population of Bernice is 168.
What is the Total Female Population of Bernice?
Total Female Population of Bernice is 202.
What is the Ratio of Males per 100 Females in Bernice?
There are 83.17 Males per 100 Females in Bernice.
What is the Ratio of Females per 100 Males in Bernice?
There are 120.24 Females per 100 Males in Bernice.
What is the Median Population Age in Bernice?
Median Population Age in Bernice is 52.8 Years.
What is the Average Family Size in Bernice
Average Family Size in Bernice is 2.7 People.
What is the Average Household Size in Bernice
Average Household Size in Bernice is 2.2 People.
How Large is the Labor Force in Bernice?
There are 136 People in the Labor Forcein in Bernice.
What is the Percentage of People in the Labor Force in Bernice?
44.4% of People are in the Labor Force in Bernice.
What is the Unemployment Rate in Bernice?
Unemployment Rate in Bernice is 4.4%.